Embed Size (px)
Citation preview
Donor-derived infectious disease risk through solid organ transplantation and surveillance in
the United StatesQuebec Biovigilance Committee Public Forum
on Vigilance for human-derived products
November 16, 2016Sridhar V. Basavaraju, M.D.
Centers for Disease Control and PreventionNational Center for Emerging and Zoonotic Infectious
DiseasesDivision of Healthcare Quality Promotion
Office of Blood, Organ, and Other Tissue Safety
National Center for Emerging and Zoonotic Infectious DiseasesDivision of Healthcare Quality Promotion
Objectives
Background and setting the contextDescription of current efforts in U.S. to identify cases of donor-derived disease transmissionQuantifying donor-derived disease infection risk
BACKGROUND
The current state of transplantation in the U.S.: technological advances and challenges
30,000 solid organs transplanted annually“Composite” allografts are now possible
entire face, hand, or footnerve, vessel complexes
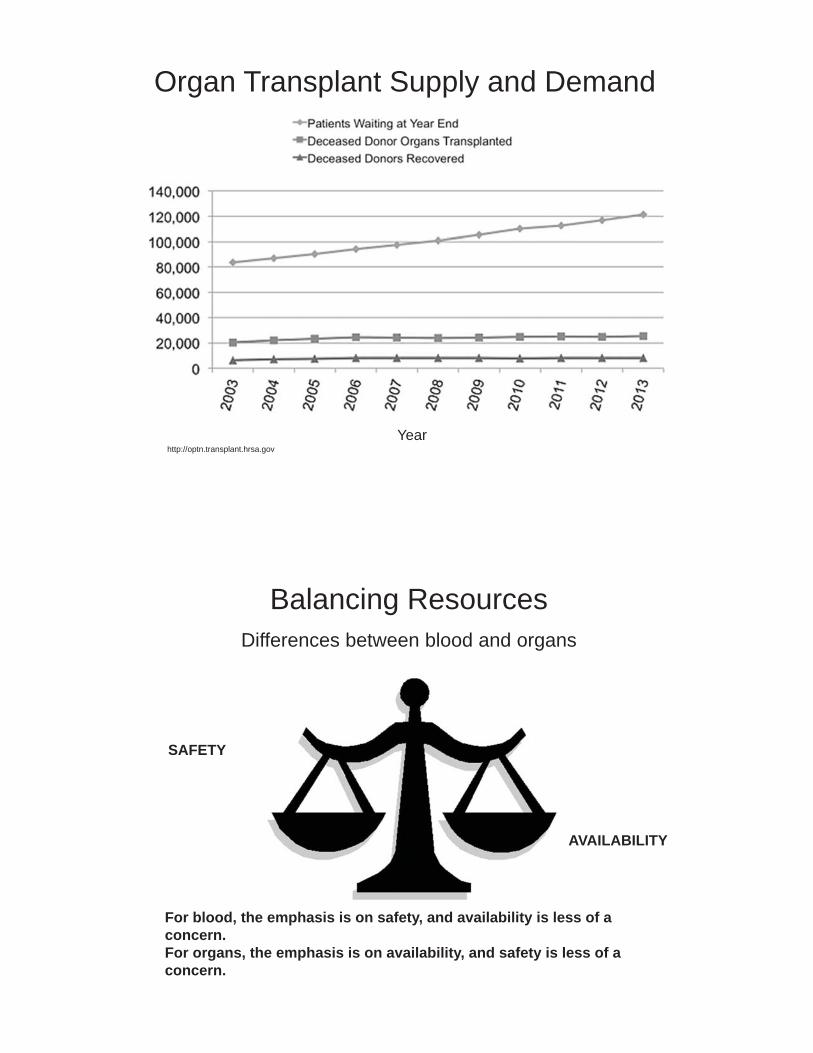
http://optn.transplant.hrsa.gov
Organ Transplant Supply and Demand
Year
SAFETY
AVAILABILITY
Balancing ResourcesDifferences between blood and organs
For blood, the emphasis is on safety, and availability is less of a concern.For organs, the emphasis is on availability, and safety is less of a concern.
Organ Safety in the U.S.: Who’s in charge?Food & Drug Administration (FDA) –Regulatory authority for blood and tissues, not organs (except for test approval)Health Resources & Services Administration (HRSA) –Regulatory oversight for organs
Oversight through contract with United Network for Organ Sharing (UNOS), which operates the Organ Procurement and Transplantation Network (OPTN)Transplant centers and Organ Procurement Organizations (OPO) must be part of OPTNPotential donor-derived disease transmissions, including infections and malignancies, to be reported to OPTN
Ad Hoc Disease Transmission Advisory Committee (DTAC)
Part of OPTN patient safety programExamine and classify potential donor-derived transmission through transplantation of infection or malignancyEducate transplant communityHelp change policy and improve processesMembership includes CDC, FDA, transplant centers, transplant infectious disease, lab testing, organ procurement organizations
What role does CDC play?Public Health Service (PHS) agency with primary responsibility for surveillance and detection of public health risks
not a regulatornot authorized to investigate events on own, but only by assisting local and state authoritiesCreates recommendations in concert with other PHS agencies (we cannot enforce them)
Through an agreement with HRSA, has representation on DTAC and investigates possible infectious disease transmission of nationally notifiable diseases or other infections of public health importance
Nationally Notifiable disease in donor or recipientMultiple ill recipientsEncephalitis in donor or recipient(s)Unknown syndrome
Goal is it determine whether infection was donor-derived~ 50 case investigations annually are referred to CDC
SURVEILLANCE FOR DONOR-DERIVED DISEASE TRANSMISSION IN THE UNITED STATES
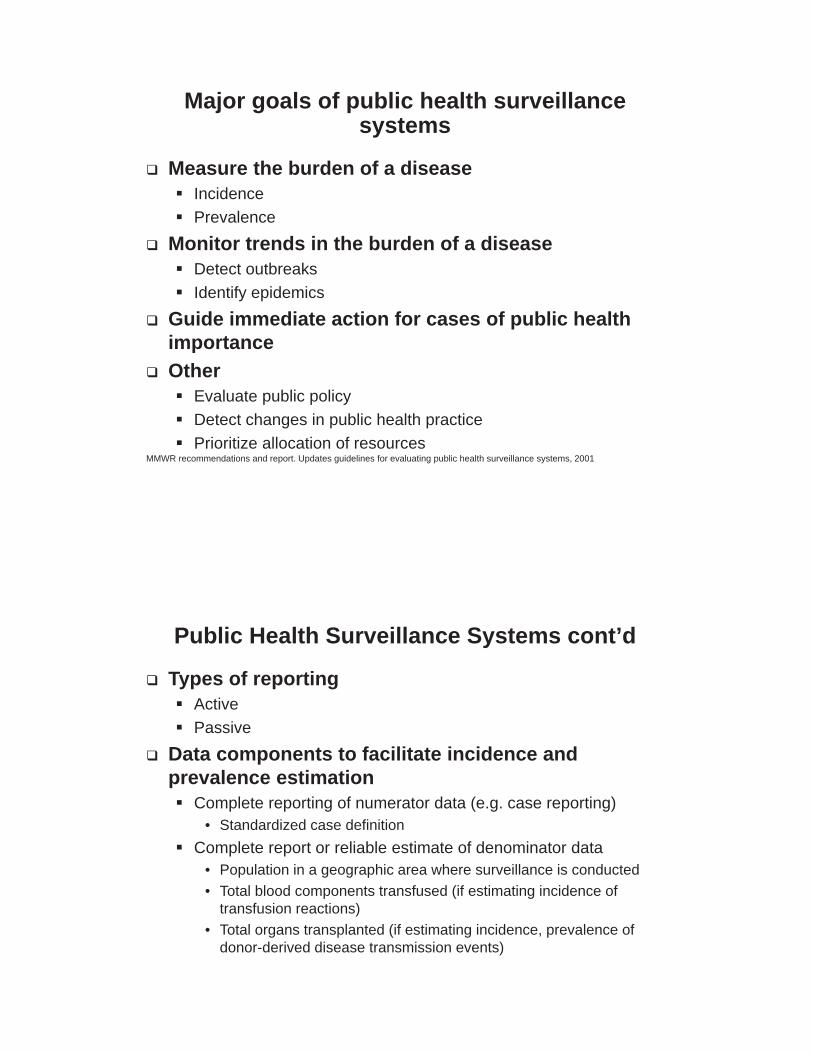
Major goals of public health surveillance systems
Measure the burden of a disease IncidencePrevalence
Monitor trends in the burden of a disease Detect outbreaks Identify epidemics
Guide immediate action for cases of public health importanceOther
Evaluate public policyDetect changes in public health practicePrioritize allocation of resources
MMWR recommendations and report. Updates guidelines for evaluating public health surveillance systems, 2001
Public Health Surveillance Systems cont’d
Types of reportingActivePassive
Data components to facilitate incidence and prevalence estimation
Complete reporting of numerator data (e.g. case reporting)• Standardized case definition
Complete report or reliable estimate of denominator data • Population in a geographic area where surveillance is conducted• Total blood components transfused (if estimating incidence of
transfusion reactions)• Total organs transplanted (if estimating incidence, prevalence of
donor-derived disease transmission events)
Reporting of donor-derived disease transmission events in the United States:
Surveillance?Passive reporting by facilities to OPTN/UNOS (referred to DTAC for review)
Transplant centers Organ procurement organizations
Numerator reportingNo standardized criteria for what is reported
• Any infectious disease or malignancy suspected to be transmitted to an organ recipient from the organ donor (at discretion of clinical team or OPO)
• May include recipient illness or in some cases, if donor is suspected to have a disease (at time of organ recovery or retrospectively)
Goal is to determine whether disease is donor-derivedDenominator data
Not routinely reportedMore of a case reporting system than surveillance
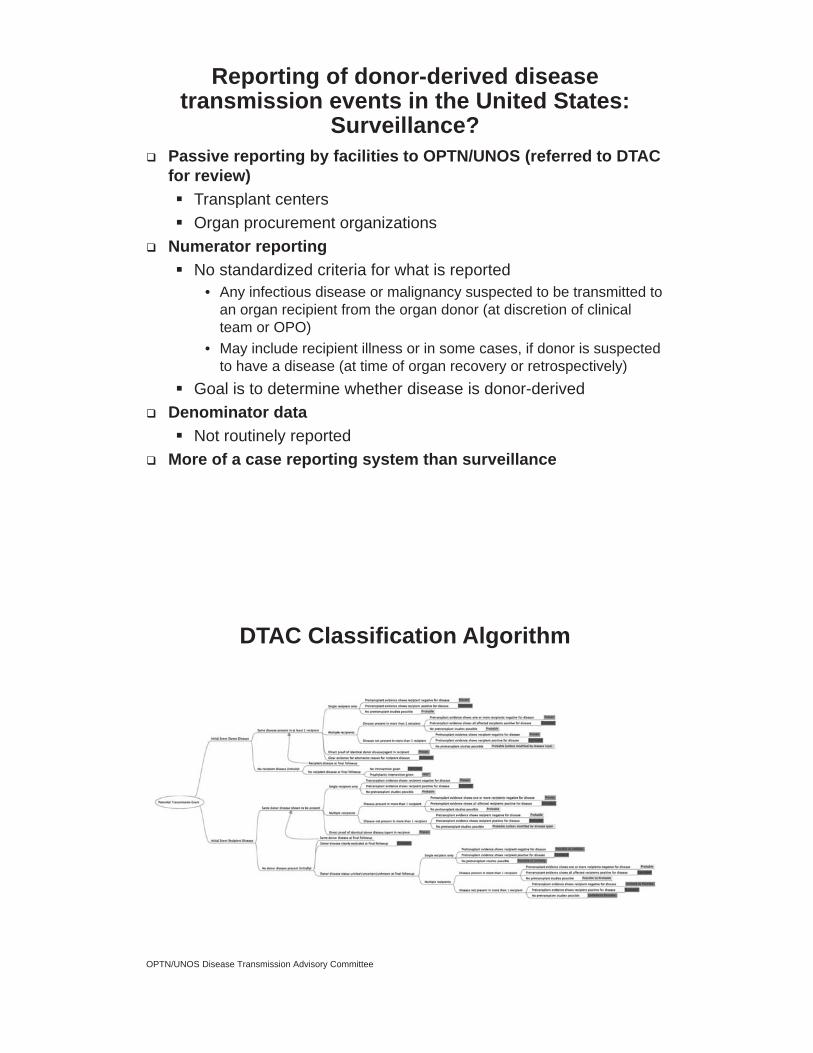
DTAC Classification Algorithm
OPTN/UNOS Disease Transmission Advisory Committee
Disease reporting by transplant centers and OPOs
Variable by centerBronchoscopy, blood, urine culture reported though organisms may be routinely encountered, treated by standard antimicrobial prophylaxis, and not associated with significant morbidity/mortality
Donor infection may be unrecognized Some diseases are rare and infrequently encounteredSome donors have no evidence of infectious cause of death
Difficulty in linking donor and recipient infectionsOnus on transplant centers/OPO to suspect donor-derived diseaseSome infections difficult to recognize and diagnose in recipientGeographic distance Timeliness of information
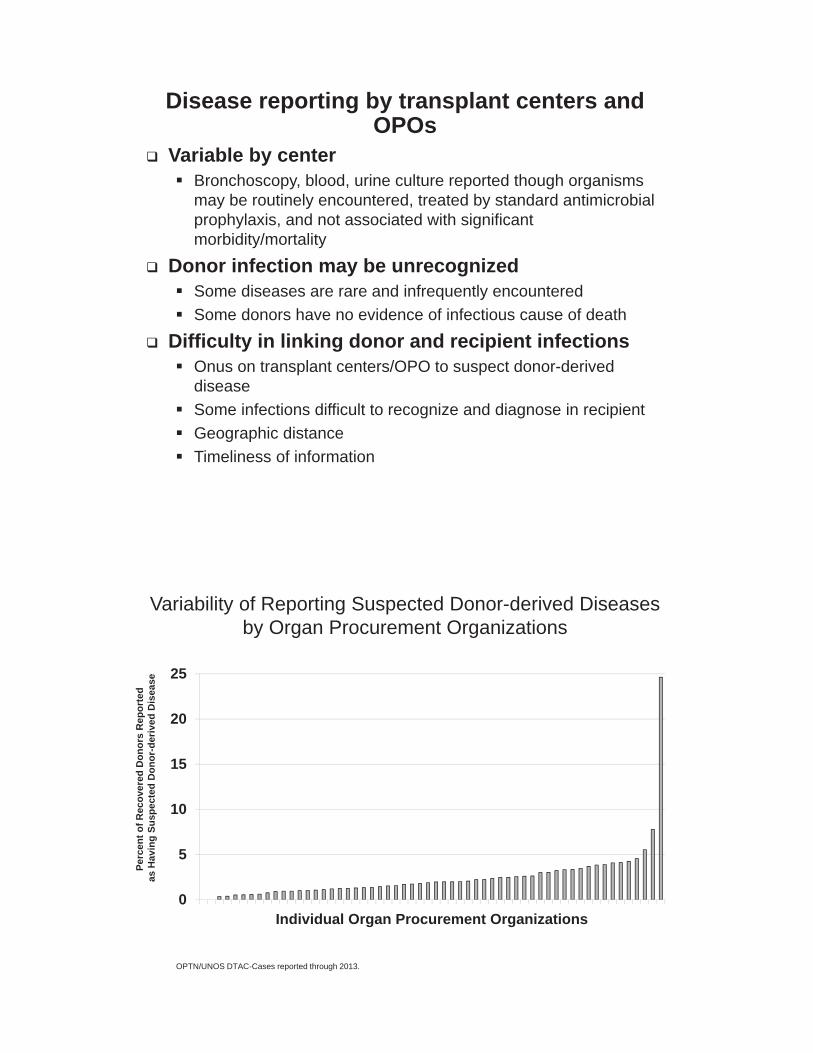
Variability of Reporting Suspected Donor-derived Diseases by Organ Procurement Organizations
0
5
10
15
20
25
Individual Organ Procurement Organizations
Perc
ent o
f Rec
over
ed D
onor
s R
epor
ted
as H
avin
g Su
spec
ted
Don
or-d
eriv
ed D
isea
se
OPTN/UNOS DTAC-Cases reported through 2013.
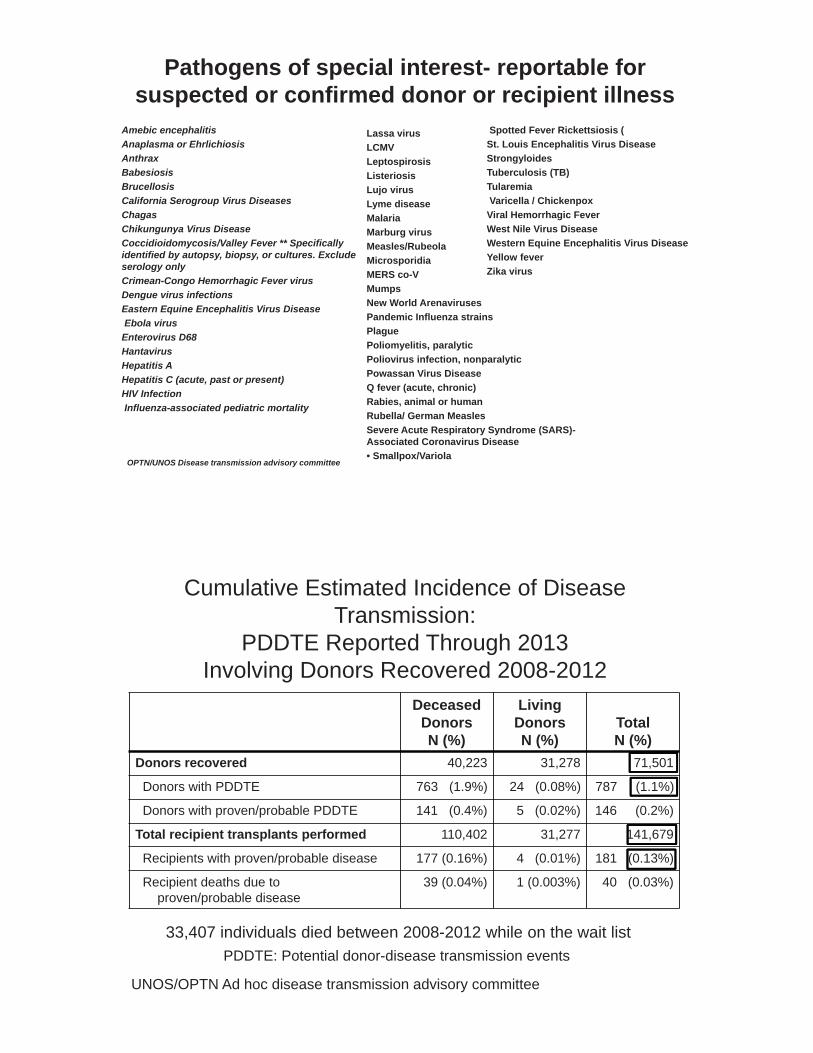
Pathogens of special interest- reportable for suspected or confirmed donor or recipient illness
Amebic encephalitis Anaplasma or EhrlichiosisAnthraxBabesiosisBrucellosisCalifornia Serogroup Virus Diseases ChagasChikungunya Virus Disease Coccidioidomycosis/Valley Fever ** Specifically identified by autopsy, biopsy, or cultures. Exclude serology only Crimean-Congo Hemorrhagic Fever virus Dengue virus infections Eastern Equine Encephalitis Virus Disease Ebola virus
Enterovirus D68 HantavirusHepatitis A Hepatitis C (acute, past or present) HIV Infection Influenza-associated pediatric mortality
OPTN/UNOS Disease transmission advisory committee
Lassa virus LCMVLeptospirosisListeriosisLujo virus Lyme disease MalariaMarburg virus Measles/RubeolaMicrosporidiaMERS co-V MumpsNew World ArenavirusesPandemic Influenza strains PlaguePoliomyelitis, paralytic Poliovirus infection, nonparalyticPowassan Virus Disease Q fever (acute, chronic) Rabies, animal or human Rubella/ German Measles Severe Acute Respiratory Syndrome (SARS)-Associated Coronavirus Disease • Smallpox/Variola
Spotted Fever Rickettsiosis (St. Louis Encephalitis Virus Disease StrongyloidesTuberculosis (TB)Tularemia Varicella / Chickenpox
Viral Hemorrhagic Fever West Nile Virus Disease Western Equine Encephalitis Virus Disease Yellow fever Zika virus
DeceasedDonorsN (%)
LivingDonorsN (%)
TotalN (%)
Donors recovered 40,223 31,278 71,501
Donors with PDDTE 763 (1.9%) 24 (0.08%) 787 (1.1%)
Donors with proven/probable PDDTE 141 (0.4%) 5 (0.02%) 146 (0.2%)
Total recipient transplants performed 110,402 31,277 141,679
Recipients with proven/probable disease 177 (0.16%) 4 (0.01%) 181 (0.13%)
Recipient deaths due to proven/probable disease
39 (0.04%) 1 (0.003%) 40 (0.03%)
Cumulative Estimated Incidence of Disease Transmission:
PDDTE Reported Through 2013Involving Donors Recovered 2008-2012
33,407 individuals died between 2008-2012 while on the wait list PDDTE: Potential donor-disease transmission events
UNOS/OPTN Ad hoc disease transmission advisory committee
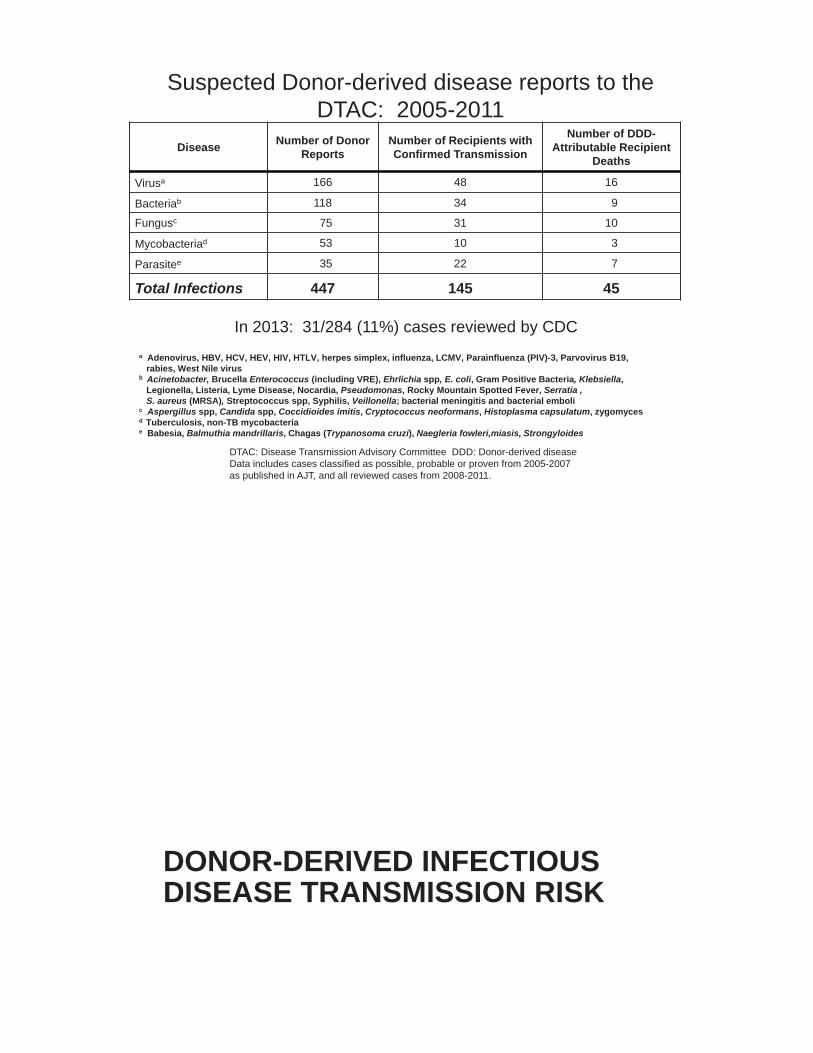
Disease Number of Donor Reports
Number of Recipients with Confirmed Transmission
Number of DDD-Attributable Recipient
Deaths
Virusa 166 48 16
Bacteriab 118 34 9
Fungusc 75 31 10
Mycobacteriad 53 10 3
Parasitee 35 22 7
Total Infections 447 145 45
Suspected Donor-derived disease reports to the DTAC: 2005-2011
a Adenovirus, HBV, HCV, HEV, HIV, HTLV, herpes simplex, influenza, LCMV, Parainfluenza (PIV)-3, Parvovirus B19, rabies, West Nile virus
b Acinetobacter, Brucella Enterococcus (including VRE), Ehrlichia spp, E. coli, Gram Positive Bacteria, Klebsiella,Legionella, Listeria, Lyme Disease, Nocardia, Pseudomonas, Rocky Mountain Spotted Fever, Serratia , S. aureus (MRSA), Streptococcus spp, Syphilis, Veillonella; bacterial meningitis and bacterial emboli
c Aspergillus spp, Candida spp, Coccidioides imitis, Cryptococcus neoformans, Histoplasma capsulatum, zygomycesd Tuberculosis, non-TB mycobacteriae Babesia, Balmuthia mandrillaris, Chagas (Trypanosoma cruzi), Naegleria fowleri,miasis, Strongyloides
DTAC: Disease Transmission Advisory Committee DDD: Donor-derived diseaseData includes cases classified as possible, probable or proven from 2005-2007 as published in AJT, and all reviewed cases from 2008-2011.
In 2013: 31/284 (11%) cases reviewed by CDC
DONOR-DERIVED INFECTIOUS DISEASE TRANSMISSION RISK
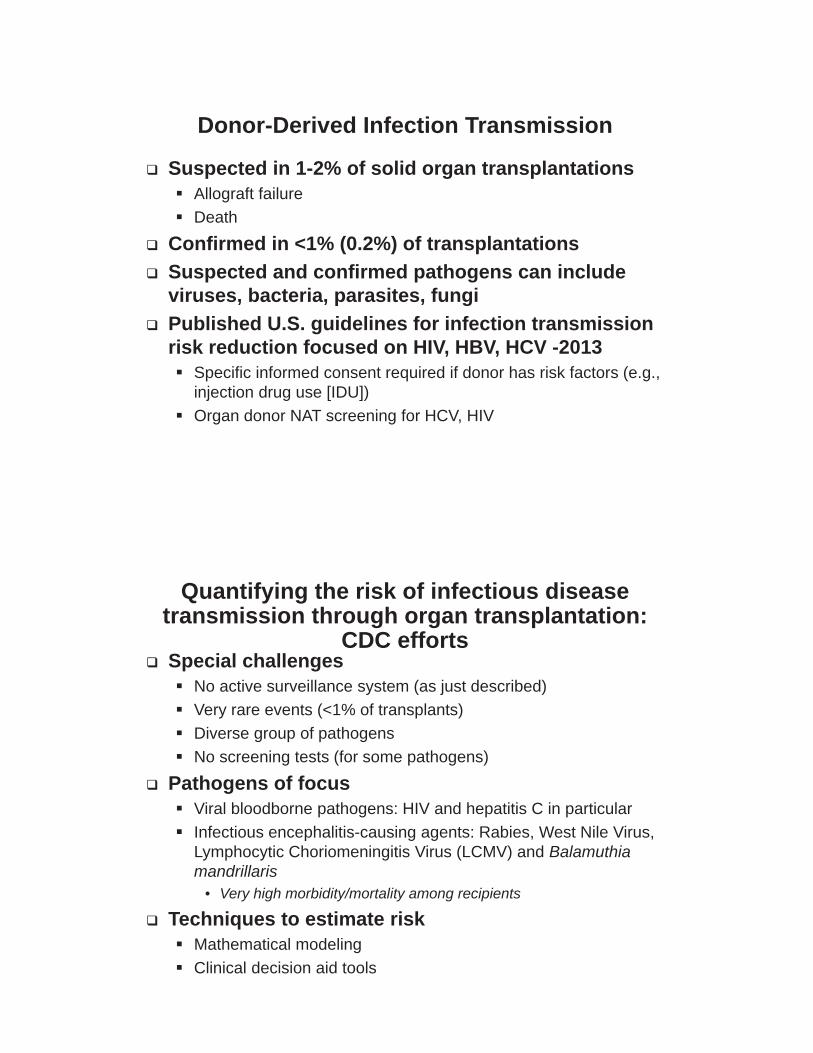
Donor-Derived Infection Transmission
Suspected in 1-2% of solid organ transplantationsAllograft failureDeath
Confirmed in <1% (0.2%) of transplantationsSuspected and confirmed pathogens can include viruses, bacteria, parasites, fungiPublished U.S. guidelines for infection transmission risk reduction focused on HIV, HBV, HCV -2013
Specific informed consent required if donor has risk factors (e.g., injection drug use [IDU])Organ donor NAT screening for HCV, HIV
Quantifying the risk of infectious disease transmission through organ transplantation:
CDC effortsSpecial challenges
No active surveillance system (as just described)Very rare events (<1% of transplants)Diverse group of pathogensNo screening tests (for some pathogens)
Pathogens of focusViral bloodborne pathogens: HIV and hepatitis C in particular Infectious encephalitis-causing agents: Rabies, West Nile Virus, Lymphocytic Choriomeningitis Virus (LCMV) and Balamuthiamandrillaris
• Very high morbidity/mortality among recipients
Techniques to estimate riskMathematical modelingClinical decision aid tools
Methods: Determine Per-Act Transmission Risk for HIV and HCV
PubMed search terms for HIV: HIV, HIV infection, human immunodeficiency virus, AIDS and disease transmission, per-contact, per-act
Resulting in > 7000 abstracts and four cohort studies were selected and original datasets were obtained.
o MSM seroconversion study- California, Colorado and Illinois (1998); IVDU cohort-Thailand (2002); Serodiscordant couple study- Uganda (2005); Female sex worker cohort-Kenya (2008)
PubMed search terms for HCV: HCV, HCV infection, per-contact, and needle sharing
Resulting in > 2000 abstracts and one described per-act HCV transmission risk -- quantified for IVDU
o Per-Event Probability of Hepatitis C Infection during Sharing of Injecting Equipment (2014)
Methods: Determine HIV/HCV NAT Screening Assay Characteristics
PubMed Search terms: HIV screening, HCV screening, NAT assay, mathematical models Variables for selection
• Window period of detection• Sensitivity• Specificity• Lower limit of detection
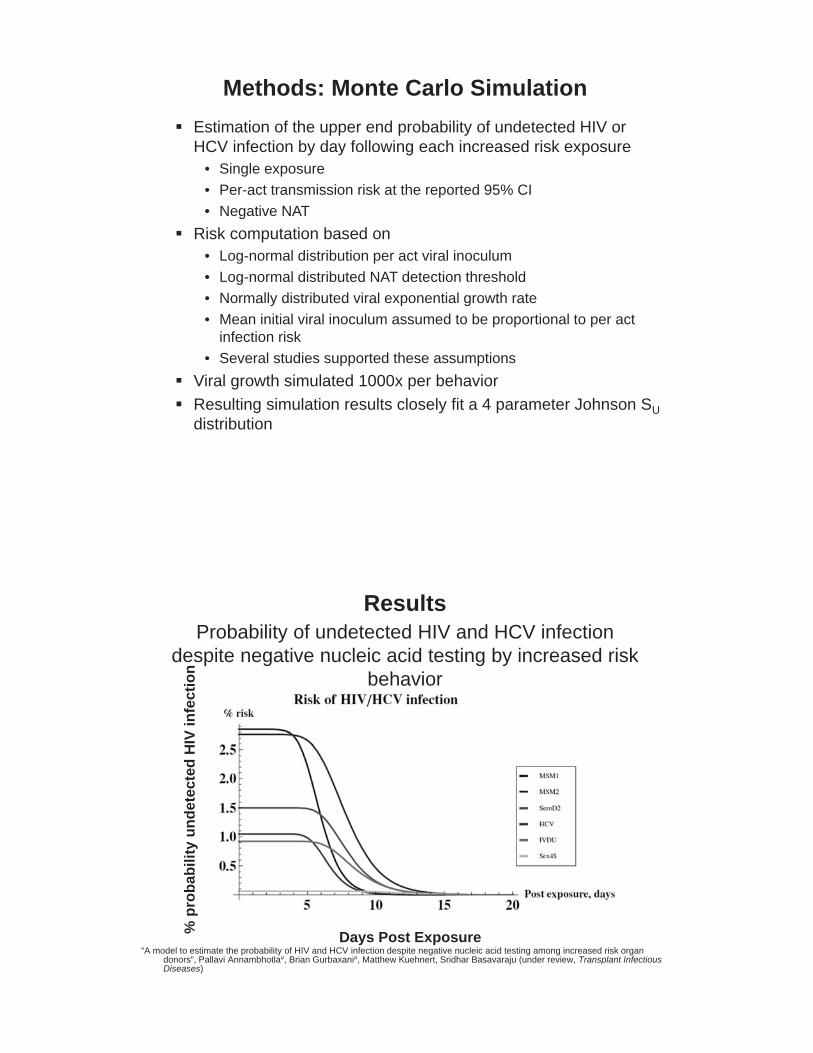
Methods: Monte Carlo SimulationEstimation of the upper end probability of undetected HIV or HCV infection by day following each increased risk exposure
• Single exposure• Per-act transmission risk at the reported 95% CI• Negative NAT
Risk computation based on• Log-normal distribution per act viral inoculum• Log-normal distributed NAT detection threshold• Normally distributed viral exponential growth rate• Mean initial viral inoculum assumed to be proportional to per act
infection risk• Several studies supported these assumptions
Viral growth simulated 1000x per behaviorResulting simulation results closely fit a 4 parameter Johnson SUdistribution
ResultsProbability of undetected HIV and HCV infection
despite negative nucleic acid testing by increased risk behavior
% p
roba
bilit
y un
dete
cted
HIV
infe
ctio
n
Days Post Exposure“A model to estimate the probability of HIV and HCV infection despite negative nucleic acid testing among increased risk organ
donors”, Pallavi Annambhotla#, Brian Gurbaxani#, Matthew Kuehnert, Sridhar Basavaraju (under review, Transplant Infectious Diseases)
Results
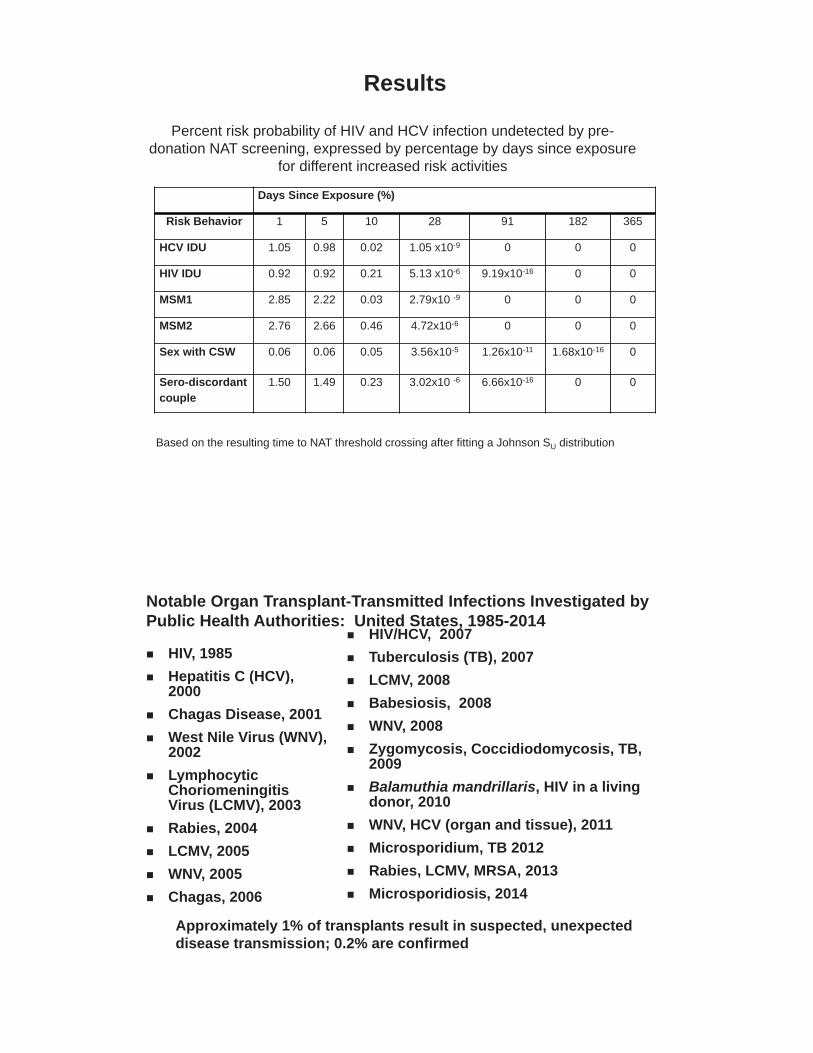
Percent risk probability of HIV and HCV infection undetected by pre-donation NAT screening, expressed by percentage by days since exposure
for different increased risk activities
Based on the resulting time to NAT threshold crossing after fitting a Johnson SU distribution
Days Since Exposure (%)
Risk Behavior 1 5 10 28 91 182 365
HCV IDU 1.05 0.98 0.02 1.05 x10⁻⁹ 0 0 0
HIV IDU 0.92 0.92 0.21 5.13 x10⁻⁶ 9.19x10⁻¹⁶ 0 0
MSM1 2.85 2.22 0.03 2.79x10 -9 0 0 0
MSM2 2.76 2.66 0.46 4.72x10⁻⁶ 0 0 0
Sex with CSW 0.06 0.06 0.05 3.56x10⁻⁵ 1.26x10⁻¹¹ 1.68x10⁻¹⁶ 0
Sero-discordant couple
1.50 1.49 0.23 3.02x10 -6 6.66x10⁻¹⁶ 0 0
Notable Organ Transplant-Transmitted Infections Investigated by Public Health Authorities: United States, 1985-2014
HIV/HCV, 2007Tuberculosis (TB), 2007LCMV, 2008Babesiosis, 2008WNV, 2008Zygomycosis, Coccidiodomycosis, TB, 2009Balamuthia mandrillaris, HIV in a living donor, 2010WNV, HCV (organ and tissue), 2011Microsporidium, TB 2012Rabies, LCMV, MRSA, 2013Microsporidiosis, 2014
HIV, 1985Hepatitis C (HCV), 2000Chagas Disease, 2001West Nile Virus (WNV), 2002Lymphocytic ChoriomeningitisVirus (LCMV), 2003Rabies, 2004LCMV, 2005WNV, 2005Chagas, 2006
Approximately 1% of transplants result in suspected, unexpected disease transmission; 0.2% are confirmed
2929
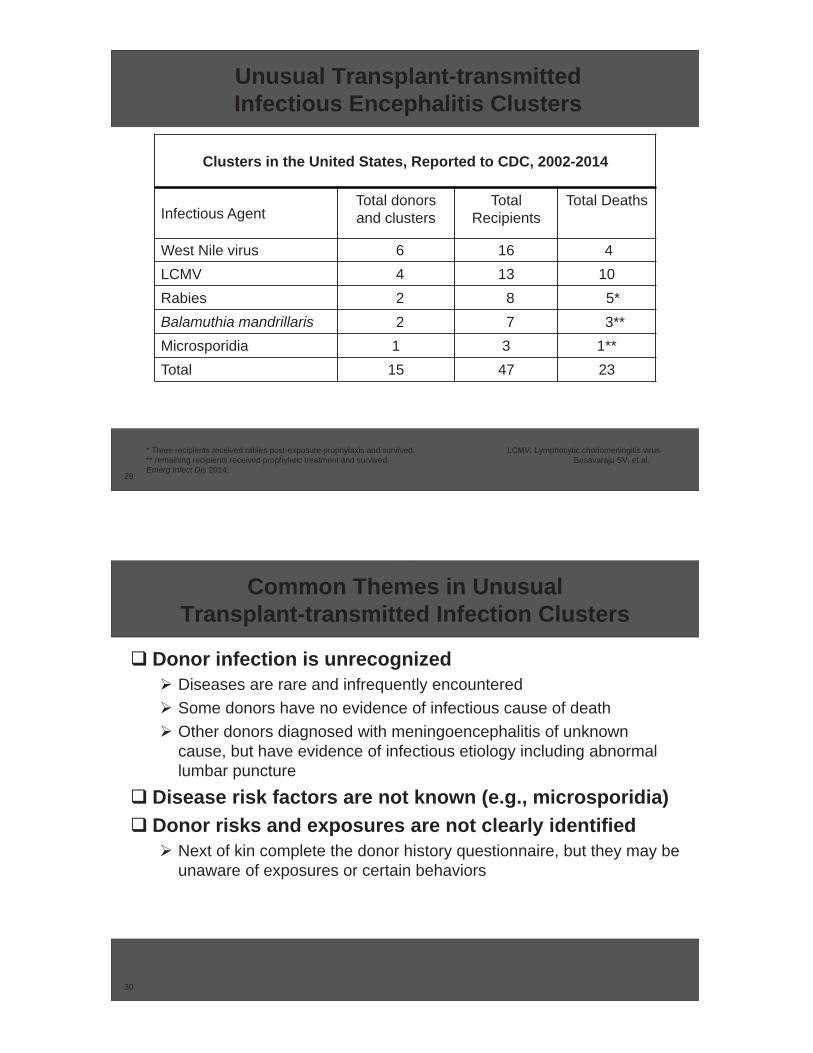
Unusual Transplant-transmitted Infectious Encephalitis Clusters
Clusters in the United States, Reported to CDC, 2002-2014
Infectious AgentTotal donorsand clusters
Total Recipients
Total Deaths
West Nile virus 6 16 4LCMV 4 13 10Rabies 2 8 5*Balamuthia mandrillaris 2 7 3**Microsporidia 1 3 1**Total 15 47 23
* Three recipients received rabies post-exposure prophylaxis and survived. LCMV: Lymphocytic choriomeningitis virus** remaining recipients received prophylatic treatment and survived. Basavaraju SV, et al. Emerg Infect Dis 2014.
3030
Common Themes in Unusual Transplant-transmitted Infection Clusters
Donor infection is unrecognizedDiseases are rare and infrequently encounteredSome donors have no evidence of infectious cause of deathOther donors diagnosed with meningoencephalitis of unknown cause, but have evidence of infectious etiology including abnormal lumbar puncture
Disease risk factors are not known (e.g., microsporidia)Donor risks and exposures are not clearly identified
Next of kin complete the donor history questionnaire, but they may be unaware of exposures or certain behaviors
3131
What is CDC working on? Development of Risk Stratification Model Identifying
Donors with Infectious Encephalitis
1. Clinical tool to identify donors with infectious encephalitis
Must distinguish infectious from non-infectious encephalitisUse available clinical data including
Fever and other symptomsCerebrospinal fluid analysisImaging results (e.g., CT, MRI and x-rays)
Incorporate donor history questionnaire
2. Properly allocate organs from donors with infectious encephalitis
Maximize survival benefit for recipients
32
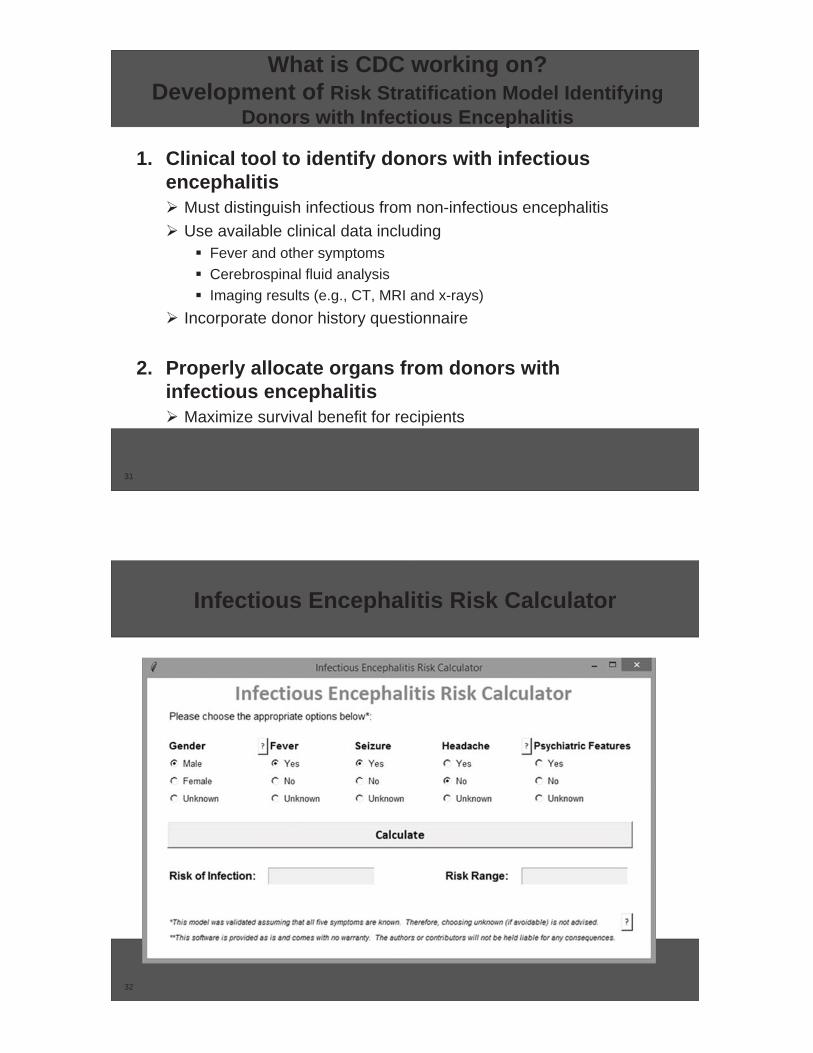
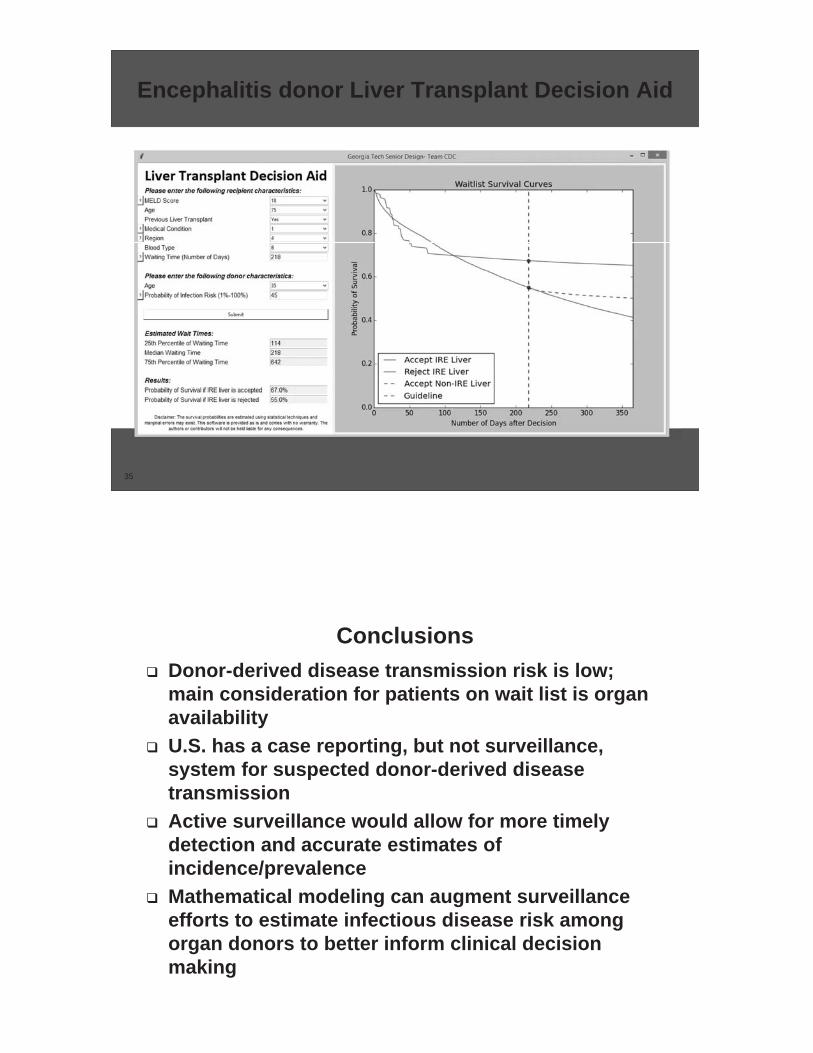
Infectious Encephalitis Risk Calculator
33
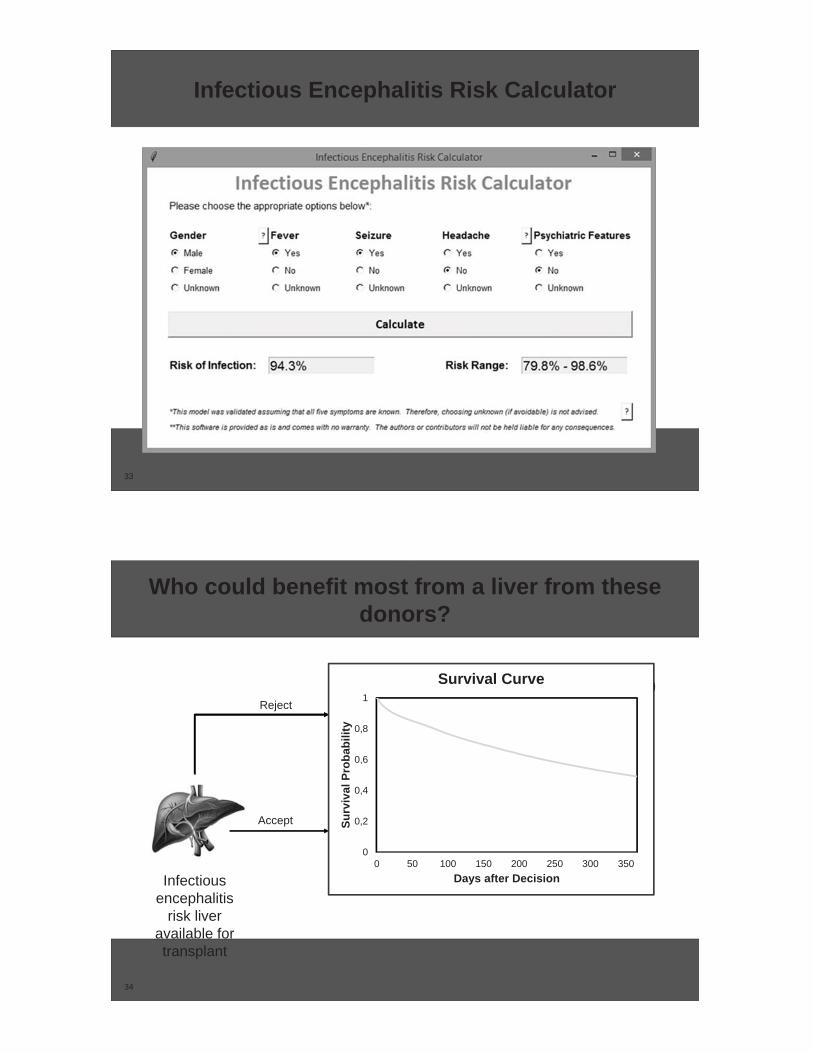
Infectious Encephalitis Risk Calculator
34
Who could benefit most from a liver from these donors?
Infectiousencephalitis
risk liver available for transplant
Reject
IRE LiverSurvival
Non-IRE Liver Survival
Waitlist Survival
Accept
Wait TimeEstimate
0
0,2
0,4
0,6
0,8
1
0 50 100 150 200 250 300 350
Surv
ival
Pro
babi
lity
Days after Decision
Survival Curve
35
Encephalitis donor Liver Transplant Decision Aid
ConclusionsDonor-derived disease transmission risk is low; main consideration for patients on wait list is organ availabilityU.S. has a case reporting, but not surveillance, system for suspected donor-derived disease transmissionActive surveillance would allow for more timely detection and accurate estimates of incidence/prevalenceMathematical modeling can augment surveillance efforts to estimate infectious disease risk among organ donors to better inform clinical decision making
Acknowledgements
OPTN/UNOS: Susan Tlusty, Marissa ClarkOPTN Disease Transmission Advisory Committee: Dan Kaul, Cameron Wolfe, Marian MichaelsHRSA: Melissa Greenwald, James BowmanCDC: Matthew Kuehnert, Pallavi Annambhotla, Brian Gurbaxani
Thank you
For more information please contact Centers for Disease Control and Prevention
1600 Clifton Road NE, Atlanta, GA 30333Telephone: 1-800-CDC-INFO (232-4636)/TTY: 1-888-232-6348E-mail: [email protected] Web: http://www.cdc.gov
The findings and conclusions in this report are those of the authors and do not necessarily represent the official position of the Centers for Disease Control and Prevention.
National Center for Emerging and Zoonotic Infectious DiseasesDivision of Healthcare Quality Promotion
ADDITIONAL SLIDES
40
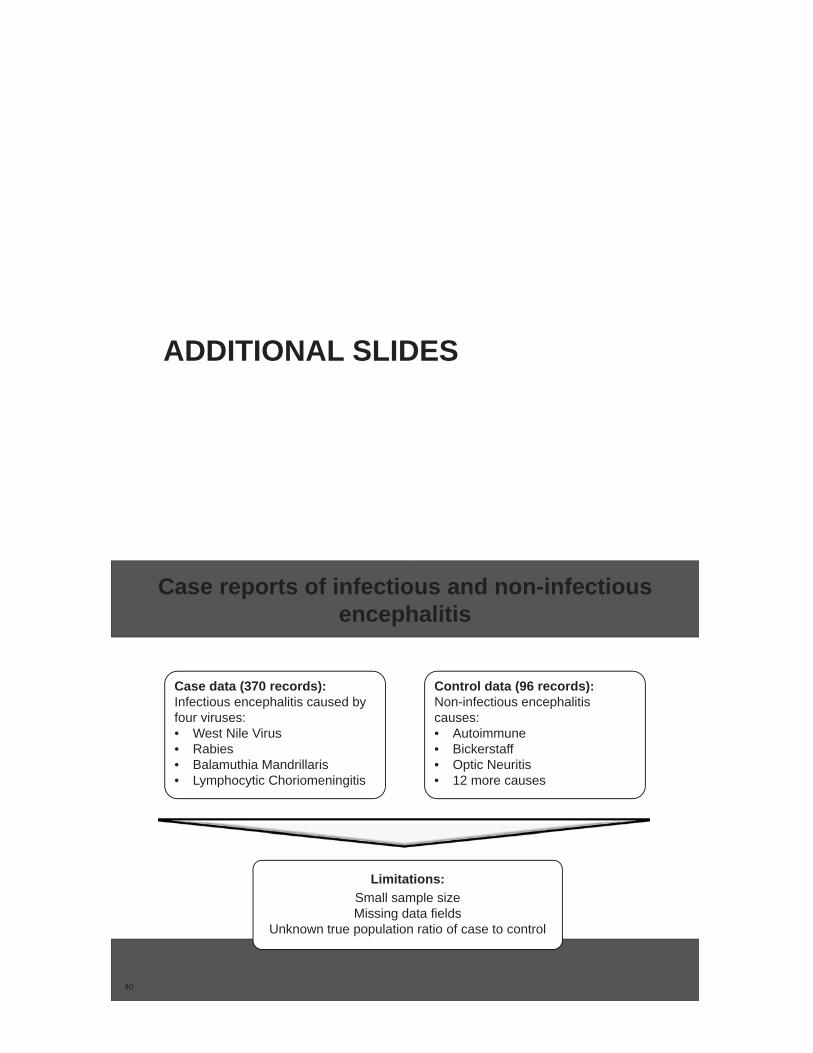
Case data (370 records):Infectious encephalitis caused by four viruses:• West Nile Virus• Rabies• Balamuthia Mandrillaris• Lymphocytic Choriomeningitis
Control data (96 records): Non-infectious encephalitis causes:• Autoimmune• Bickerstaff• Optic Neuritis• 12 more causes
Limitations:Small sample sizeMissing data fields
Unknown true population ratio of case to control
Case reports of infectious and non-infectious encephalitis
41
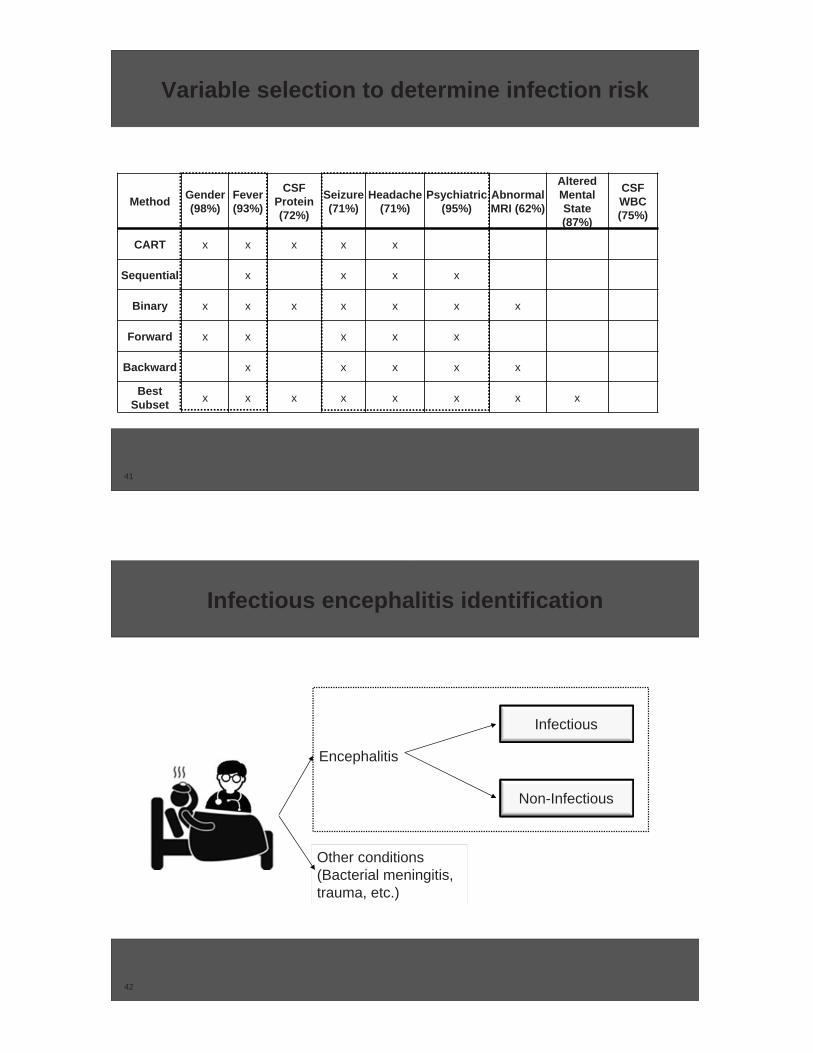
Variable selection to determine infection risk
Method Gender(98%)
Fever(93%)
CSFProtein(72%)
Seizure(71%)
Headache(71%)
Psychiatric(95%)
AbnormalMRI (62%)
AlteredMentalState(87%)
CSFWBC(75%)
CART x x x x x
Sequential x x x x
Binary x x x x x x x
Forward x x x x x
Backward x x x x x
BestSubset x x x x x x x x
42
Infectious encephalitis identification
Encephalitis
Other conditions (Bacterial meningitis, trauma, etc.)
Non-Infectious
Infectious