Embed Size (px)
Citation preview

Public
0
DONG ENERGY – LEADING THE ENERGY TRANSFORMATION
INTRODUCTION
January, 2017

Public
Wind Power
DONG Energy today
1
Danish utility Oil & Gas
Global leader in attractive offshore wind market
Solid track-record in delivering large scale projects
Cost-of-electricity being systematically reduced
Robust and highly visible build-out plan
Differentiated partnership model
Attractive pipeline options post-2020
#1 power distribution network in Denmark
#1 residential and industrial energy sales
position in Denmark
#1 in Danish heat and power generation with a
strong and increasing biomass position
REnescience: Innovative bioenergy technology
for waste treatment
Focused position with activities in Denmark,
Norway and UK
Low-cost, low-risk core assets
Managed for cash to support renewable growth
Strong hedging position
75% 16% 9%
% share of capital employed as of 31 December 2015
Key figures 2015:
DKK 70.8 Bn revenue
DKK 18.5 Bn EBITDA
~6,700 employees

Public
613
334
2007 2015
2
Significant transformation of DONG Energy over the past decade
Business transformedShare of capital employed1
%
Operating profit
(EBITDA) doubledDKK Bn
International expansionShare of operating profit (EBITDA)
%
18.5
20152007
9.3 88%
2007
63%
37%
12%
20152015
75%
60%
16%
16%
24%
2007
9%
1. Excluding unallocated capital employed on DONG Energy group level
(46%) 2.0xInternational
share >5x
CO2 emissions halvedg/kWh
Public
Wind Power
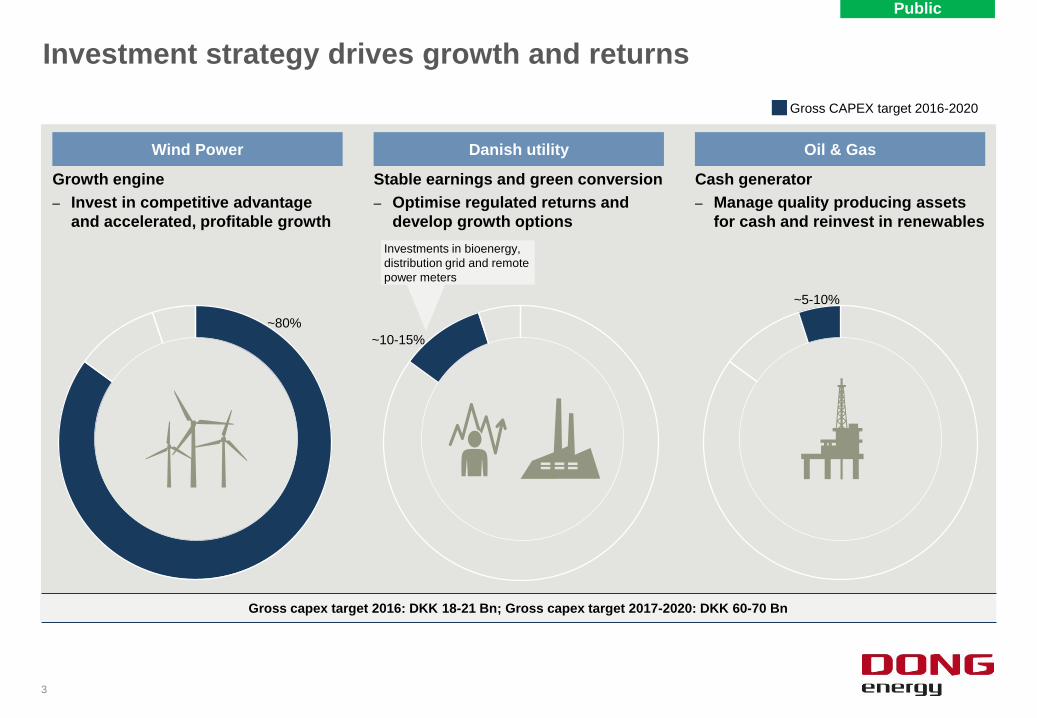
Growth engine
– Invest in competitive advantage
and accelerated, profitable growth
Investment strategy drives growth and returns
3
Stable earnings and green conversion
– Optimise regulated returns and
develop growth options
Danish utility Oil & Gas
Cash generator
– Manage quality producing assets
for cash and reinvest in renewables
~80%
~10-15%
~5-10%
Investments in bioenergy,
distribution grid and remote
power meters
Gross CAPEX target 2016-2020
Gross capex target 2016: DKK 18-21 Bn; Gross capex target 2017-2020: DKK 60-70 Bn

Public
4
Offshore wind power is a large scale renewable technology with
growth rates exceeding other renewables
Source: Bloomberg New Energy Finance (BNEF)
1. Sum of utility-scale PV and small-scale PV
2. Capacity factor is a performance indicator measuring to what degree a wind farm has produced according to the farms capacity (actual production / (capacity x hours in period))
3. According to BNEF, long-term offtake price required to achieve a required equity hurdle rate for the project
0%
7%
14%
25%
Hydro
Onshore wind
Solar PV
Offshore wind
Fastest growing renewable technology in OECDInstalled capacity CAGR, 2014-2020
%
1
Offshore wind power offers multiple advantages
Offers +45% capacity factors2
Significantly higher than onshore wind and solar PV
Limited visual impact on landscapeWind farms are built far from shore
Utility size power generation 659 MW Walney Extension will power more than 460,000 UK homes
Rapidly declining costIndustry maturity, volume and technological development reduce LCoE3

Public
5
Unparalleled experience and track record
Under construction
In operation
Under development
Walney Extension
Walney 1 & 2
Westermost
Rough
Isle of Man
West of Duddon Sands
Barrow
Burbo Bank Ext.
Burbo Bank
Gunfleet Sands 3
Gunfleet Sands 1 & 2
Lincs
London Array
Race Bank
Horns Rev 1 & 2
Hornsea 1
Anholt
Middelgrunden
Vindeby
Nysted
German Cluster
Borkum Riffgrund 2
Borkum Riffgrund 1
Gode Wind 1
Gode Wind 3 & 4
Gode Wind 2
Bay State Wind
21 offshore wind farms
in operation
7 offshore wind farms
under construction
14
Partnerships
26 years of experience and track
record in the offshore wind sector1991 2017
3.8 GW
under
construction
2,000
Dedicated
employees
3.6 GW Constructed
capacity
7.5 million
Europeans
with clean
electricity
3.6 GW
World's
leading
operator
Hornsea 2 & 3 & 4
Ocean Wind
Avedøre
DONG Energy Wind Power geographical footprint
APAC
Taipei office
Borssele 1&2
DONG Energy Wind Power overview

Public
6
Develop Build Operate Own
Full-time employees2~2,000DONG Energy Wind Power core competencies
1. Front-end engineering design
2. Excluding CT Offshore and A2SEA as of January 2017
~110 ~1,150 ~640 ~100
Ability to design and optimise projects with a 'total life-cycle cost of wind farm' mindset
Experience and expertise along the entire value chain allow for better understanding and
management of risks
End-to-end model reduces LCoE through fast feedback and learning across the entire
organisation
~2,000
~650
~250~250~160~100~75~40
2Full-time employees
Northland
PowerStatoil SSE WPD Innogy EOn Vattenfall
Identify and mature
projects
Manage
construction,
sourcing and supply
Conduct life-cycle
maintenance
Attract capital
through partnerships
DONG Energy Wind Power has built a strong integrated end-to-
end business model

Public
3.591
997 1.225 1.273
270 161 288 159
3.840
1.137 785 668
588311 111 121
7.431
2.1342.010 1.941
1.064858
600472 399 336 280
Largest offshore wind player globally todayGlobal offshore wind capacity
MW
Wind Power’s scale enables cluster synergies
7
29% 8% 10% 10% 2% 3% 1%
Source: Bloomberg New Energy Finance, January 2017, DONG Energy analysis
0%
% share of global installed capacityInstalled2 Under construction
0% 1% 2%
Operational offshore wind farms
Offshore wind farms under constructionCluster
1
4
5
3
2
Synergies
Lower logistics costs
Fewer technician hours
Fewer facilities needed
Lower inventory levels
• UK West coast (East Irish Sea): Barrow, Burbo Bank,
Burbo Bank Extension, West of Duddon Sands, Walney
Extension, Walney 1 & 2
• East UK North: Westermost Rough, Race Bank,
Hornsea 1
• East UK South: Gunfleet Sands 1 & 2, Gunfleet Sands
Demo, London Array
• Germany: Borkum Riffgrund 1, Borkum Riffgrund 2,
Gode Wind 1&2
• Danish waters: Middelgrunden, Nysted,
Horns Rev 2, Anholt, Vindeby
Dutch waters: Borssele 1 & 2
1
2
4
5
3
E.ON
InnogyVattenfall
IberdrolaNorthland
Power
Statoil
WPD
EnBW
Statkraft1
SSE
1. Statkraft has decided to scale down their activities in offshore wind. Current assets will be built and development projects will be brought forward to allow divestment before FID
2. If a project is executed on behalf of a lead developer managing the construction, then 100% of capacity is allocated to the lead developer. If construction is executed by an integrated joint
venture, capacity is allocated in proportion to the JV share
6
6
DONG Energy pioneered the offshore wind industry and is today
the global leader

Public
Country Asset FID
Gross capacity
(MW)
Westermost Rough 2013 210
Borkum Riffgrund 1 2011 312
West of
Duddon Sands2011 389
Anholt 2010 400
London Array 2009 630
Walney 1&2 2009 367
Horns Rev 2 2007 209
Strong construction track-record due to full EPC1 control
8
1. Engineering, procurement and construction
Leader in operating offshore wind farms# of operated turbines January 2017
~1000
443
354
263
143
129
90
2x
Source: Bloomberg New Energy Finance January 2017
Vattenfall
E.On
Innogy
SSE
Centrica
Statoil
Proven construction track-record and leading operating
capabilities
Public
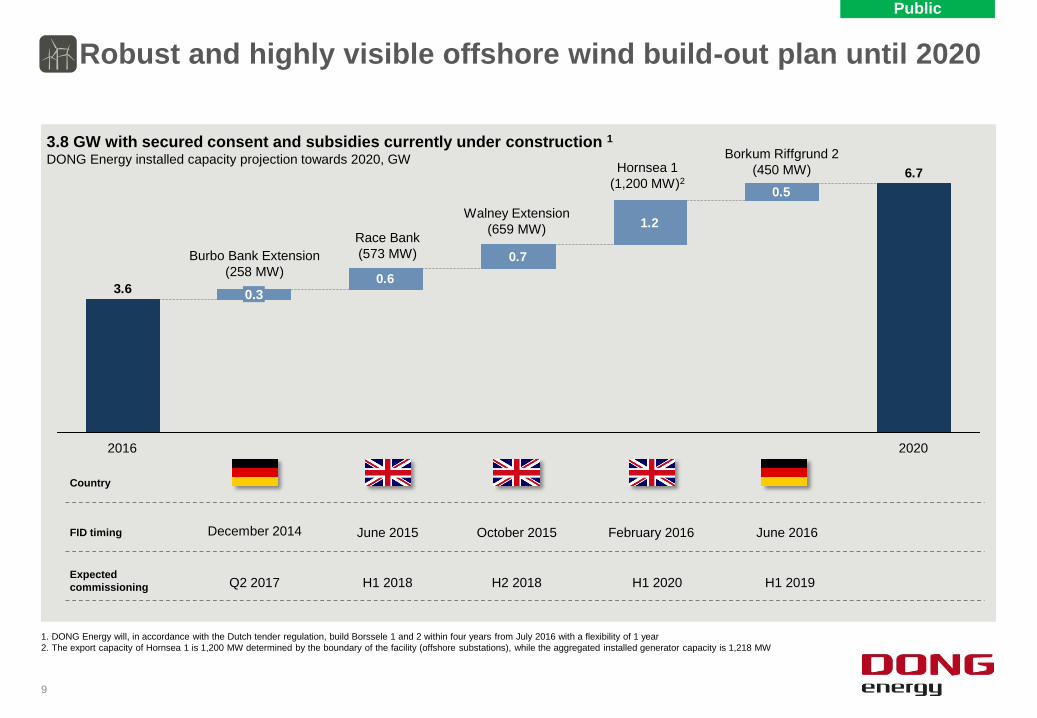
Robust and highly visible offshore wind build-out plan until 2020
9
1. DONG Energy will, in accordance with the Dutch tender regulation, build Borssele 1 and 2 within four years from July 2016 with a flexibility of 1 year
2. The export capacity of Hornsea 1 is 1,200 MW determined by the boundary of the facility (offshore substations), while the aggregated installed generator capacity is 1,218 MW
3.8 GW with secured consent and subsidies currently under construction 1
DONG Energy installed capacity projection towards 2020, GW
Country
FID timing December 2014 June 2016February 2016October 2015June 2015
Expected
commissioning Q2 2017 H1 2019H1 2020H2 2018H1 2018
0.7
1.2
0.6
6.7
3.6
0.5
2016 2020
0.3
Burbo Bank Extension
(258 MW)
Walney Extension
(659 MW)
Borkum Riffgrund 2
(450 MW)Hornsea 1
(1,200 MW)2
Race Bank
(573 MW)
Public
10
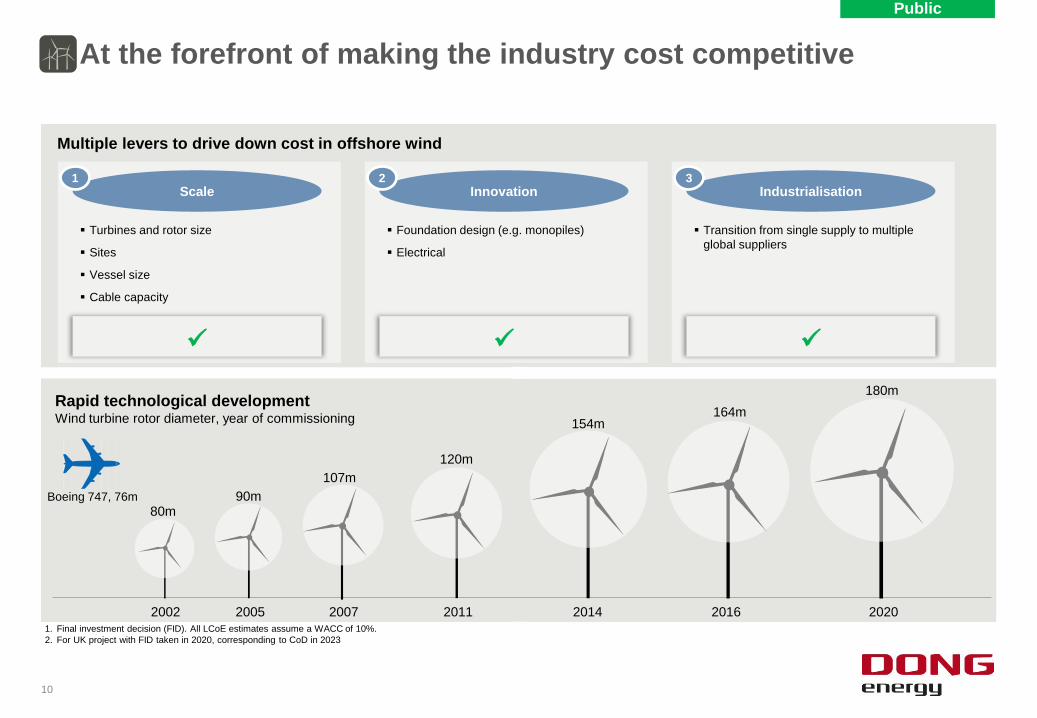
At the forefront of making the industry cost competitive
Rapid technological developmentWind turbine rotor diameter, year of commissioning
Multiple levers to drive down cost in offshore wind
1. Final investment decision (FID). All LCoE estimates assume a WACC of 10%.
2. For UK project with FID taken in 2020, corresponding to CoD in 2023
2002 2005 2007 2011 2014 2016 2020
80m90m
107m
120m
154m164m
180m
Boeing 747, 76m
Scale
1
Turbines and rotor size
Sites
Vessel size
Cable capacity
Innovation
2
Foundation design (e.g. monopiles)
Electrical
Industrialisation
3
Transition from single supply to multiple
global suppliers

Public
11
Major institutional investors are partners in DONG Energy's offshore wind projects
Walney I & II (50.1%)
367 MW (2009 / 2010)
(KIRKBI)
West of Duddon Sands (50%)
389 MW (2010)
Burbo Bank Extension (50%)
258 MW (2016)
Lincs (25%)
270 MW (2017)*
Gunfleet Sands (50.1%)
173 MW (2011)
Anholt (50%)
400 MW (2011)
Horns Rev 1 (40%)
160 MW (2006)
Nysted (42.7%)
166 MW (2010)
Gode Wind 2 (50%)
252 MW (2014)
Gode Wind 1 (50%)
330 MW (2015)
Westermost Rough (50%)
210 MW (2014)
London Array (25%)
630 MW (2009 / 2014)
Borkum Riffgrund 1 (50%)
312 MW (2012)
(KIRKBI)
( ) represents DONG Energy ownership interest
* The transaction is subject to approval by the competition authorities. The transaction is expected to be completed in February 2017
Race Bank (50%)
573 MW (2016)
Proven track record in developing long-term partnerships

Public
By 2025 offshore wind power will be truly global…
12
Strong growth in established and new offshore wind markets
Installed Capacity, GW
11.0
27.2
45.5
33.4
12.5
+6 GW
+1 GW
+8 GW
78.9
2015 20252020
39.7
11.9
0.9
2005
0.7
%#EuropeNew markets GW addition/year CAGR
33%
27%
14%
Source: Bloomberg New Energy Finance (BNEF), H2 2016 offshore wind market outlook
Public
Thank You