Embed Size (px)
Citation preview

A Comparison between the DONG Energy Reserves/
Resource Classification System and the UNFC-2009 System
UNFC, London, 7th February 2011(Previously given at IQPC, London, 7th October 2010)
Prepared by J. Christensen & J. Reffstrup, DONG Energy

2
Introduction – DONG Energy
Classification Systems/Procedures
Example
Close out

3
Exploration & Production
Exploration & Production explores
for and produces oil and gas. The
activities are focused in the waters
around Denmark, Norway, the UK
(West of Shetland area), the Faroe
Islands and Greenland
OIL AND GAS PRODUCTION
24 mio. boe
OIL AND GAS RESERVES (2P)
364mio. boe
EBITDADKK
3.4billion
40%
End 2009

4
Generation
Generation produces power and
heat from efficient, flexible power
stations and renewable energy
sources
Generation is a market leader in
the construction and operation of
offshore wind farms and clean coal
technology
POWER GENERATION
18,074GWh
HEAT GENERATION
46,686 TJ
EBITDADKK
0.9billion
10%
End 2009

5
Energy Markets
Energy Markets optimises DONG
Energy’s energy portfolio, forming
the link between the Group’s
procurement and sale of energy.
Energy Markets sells gas and
power to wholesale customers and
trades on energy exchanges
GAS SALES
102,436 GWh
POWER SALES
10,723 GWh
EBITDADKK
2.0billion
24%
End 2009

6
Sales & Distribution
Sales & Distribution sells gas,
power and related products to
private customers, companies and
public institutions in Denmark,
Sweden and the Netherlands.
Sales & Distribution operates the
gas distribution network and power
grids, gas storage facility and oil
pipeline owned by DONG Energy
in Denmark.
GAS SALES
21,756 GWh
POWER SALES
8,529 GWh
EBITDADKK
2.2billion
26%
End 2009
GAS DISTRIBUTION
9,966 GWh
POWER DISTRIBUTION
9,156 GWh

Exploration & Production – Facts
The activities of this business area focus on
oil and gas exploration and extraction in
Denmark, Norway, the UK (West of
Shetland area), the Faroe Islands and
Greenland
This business area includes a stake in
Gassled, which comprises the entire gas
pipeline network from the Norwegian fields
to continental Europe and the UK
At the end of 2008, DONG Energy was
participating in 62 exploration and appraisal
licences and 13 production licences
The growth strategy for this business area
is based on continuous oil and gas
exploration. DONG Energy therefore
participates actively in licensing rounds
within this area of activity
7

")
")
")
")
Projection: Mercator (world) [not to scale]
Gas Pipeline
Oil Pipeline
Multi Phase Pipeline
Gas
Gas Condensate
Oil
Oil & Gas
DONG Energy fields in production – Denmark and Norway
8
Lulita
Dutchshelf
56o
2o
4o
Britishshelf
Norwegianshelf
DanishshelfGorm
Tyra
Ekofisk
to Teesside
Harald
to Nybro 260 km
to Fredericia 330 km
to Nybro 235 km
58o
Dan
to Den Helder 360 km
Ula Gyda
Tambar
Siri NiniCecilie
Syd Arne
Germanshelf
Stine Segment-2Stine Segment-1
Ormen Lange
Fields in Production
Name Operator
Siri / Stine: DONG E&P (50%)
Nini: DONG E&P (40%)
Nini East: DONG E&P (40%)
Cecilie: DONG E&P (22%)
Syd Arne: Hess (34.4%)
Lulita: Maersk (43.6%)
Ula: BP (15%)
Gyda: Talisman (34%)
Tambar: BP (43.2%)
Alve: Statoil (15%)
Ormen Lange:Norske Shell (10.3%)
Alve
Nini East

9
Introduction – DONG Energy
Classification Systems/Procedures
Example
Close out

DONG Energy Project ModelProject Categorisation
Most E&P projects are Category A
project according to the DONG E&P
Project Model i.e. Capex > 500 mill
DKK
It is mandatory that 'A' projects pass
through all decision gates
For each phase/gate a list of
mandatory deliverables are defined by
the Project Model
10
A
B
C
Bu
dg
et,
Ris
k,
Str
ate
gic
im
po
rta
nt e
tc.
CAPEX
Investment in mill dkk
5005010

The CVP is DONG E&P's decision-making process for investment projects
Project Work Processes are aligned with the requirements of the CVP process
11
DONG Energy Project ModelDONG E&P Capital Value Process (CVP)
Capital Value Process (CVP)
ExecutionConcept
selectionFeasibility
study
Preparation for
ExecutionBusiness planning
I P E Cl I P E Cl I P E CIE I P E Cl
Controlling Controlling Controlling Controlling
Initiating Planning Executing Closing
DG1 DG2 DG3 DG4 DG5
Operation
Technology Implementation
Project Controls
Procurement
Enabling Processes
Well Delivery
2
3
4
5
6
AppraisalExploration DevelopmentLicense
CaptureDevelopment AbandonmentProductionDevelopment
E&P Business model
E&P
Project Model
Support Processes
1
Handover to Operations

Class 5
Technical Contingent
Resources
Class 4
Commercial Contingent
Resources
Class 3
Reserves
Class 6
Prospective
Resources
Discovery
Well
Preliminary
Evaluation
NPV > 0 for base
case
Development < 8
years
Full Evaluation
NPV > 0 for 2P
Reserves
and
NPV => 0 for 1 P
Reserves
Development < 5
Years
Increasing Maturity
DONG Decision Gates for Approving Resources/Reserves
DG2
After DG3
before DG4
12

The E&P Field Development Model
13
NPV > 0 for base case
Dev. < 8 years
NPV > 0 for 2P
NPV => 0 for 1 P
Dev. < 5 Years
Budget
Approval
Wells on
Production
Discovery
wellPDO started
PDO agreed
with
partners
Project Model FeasibilityBusiness
Planning
Concept
Selection
Preparation for
ExecutionExecution Operation
DG1 DG3DG2 DG4 DG5
Resource Classes
Class 5 (5a, 5b)
Technical Contingent
Resources
Class 4
Commercial Contingent
Resources
Class 3
Reserves
Class 6
Prospective
Resources
Class 2
Reserves
Class 0+1
Reserves
Value Chain
ExploreAppraisal
DevelopmentDevelop Produce
AppraisalExploration
Gatekeeper TOP TOP TOP TOP Country
Project Responsible
Exploration Country CountryTOP/PS&E

DONG Energy Procedure of Resources and Reserves ClassificationWe apply SPE PRMS
14
L
DG4
DG5
DG1
P1
P3,A
1
2
3
4
5
Gate Class
6+
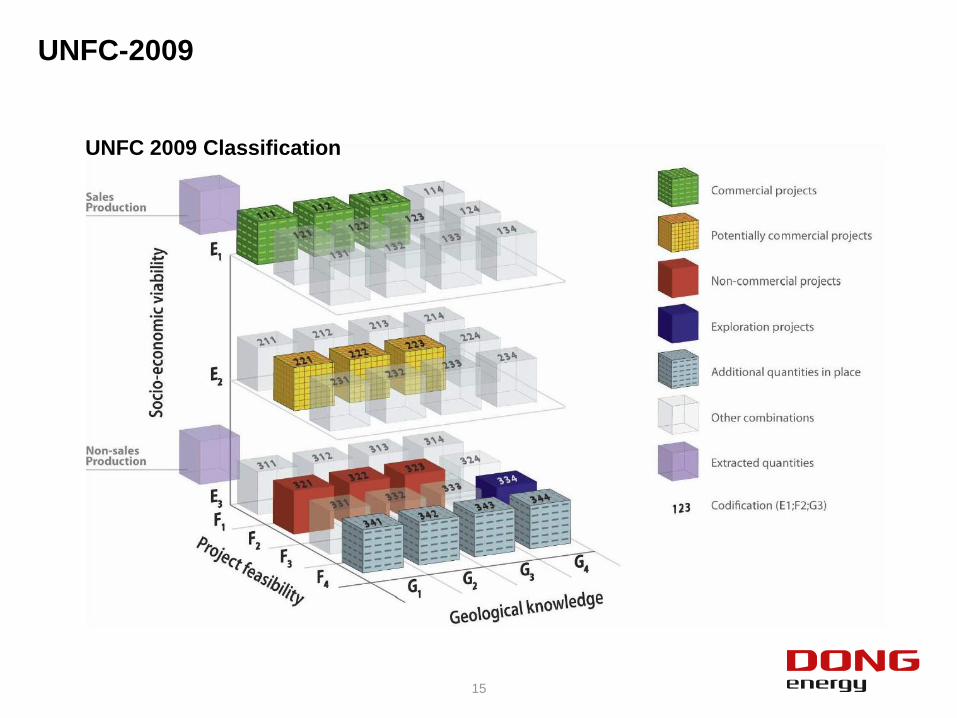
UNFC-2009
15
UNFC 2009 Classification

Mapping of UNFC-2009 upon the DONG Classification System
16
Business Planning
Feasibility ConceptPreparation
for ExecutionExecution Operation
DG1 DG2 DG3 DG4 DG5
Capital Value Process (CVP)
Business domain Project domain Operations domain
Initiate ClosingExecutingPlanningInputs Outputs
Controlling
Project Integration Process
Technology Implementation
Project Controls
Procurement
Enabling Processes
Well Delivery
Support Processes
2
3
4
2
5
2
6
1
DONG Energy System
Decision Gates : L-P1,P3 DG
Reserve/Resource Class : 6 5 4 3 2 1
UNFC-2009 System
Classes : E 3 3 3 2 1 1
F 4,3 3,2 2 2 1 1
G 4,3-1 3-1 3-1 3-1 3-1 3-1
G 4,3 3 2 2 1 1
Possible further definition of G-axis would benefit Exploration
(low, high cases not easily mapped clearly)
DONG Energy class 6+ 6 5
UNFC F-axis 4 3 3 3,2
G-axis 4 4 4 3-1
Exploration
Development

Examples of Final Calculations
17
Business Planning
Feasibility ConceptPreparation
for ExecutionExecution Operation
DG1 DG2 DG3 DG4 DG5
Capital Value Process (CVP)
Business domain Project domain Operations domain
Initiate ClosingExecutingPlanningInputs Outputs
Controlling
Project Integration Process
Technology Implementation
Project Controls
Procurement
Enabling Processes
Well Delivery
Support Processes
2
3
4
2
5
2
6
1
TIME
RA
TE
0
10
20
30
40
50
60
70
80
90
100 hyperbolic
decline
enveloped by:
harmonic
exponential
Supported by other tools !
EUR=RF*HIIP
HIIP=Volume*Porosity*Sh*FVFEUR=Estimated Ultimate Recovery
HIIP=Hydrocarbon Initially In Place
RF=Recovery Factor
Sh=Hydrocarbon saturation
FVF=Formation Volume Factor
Based on
Production data
DCA
Static & Dynamic Modelling
(large models)
Small models

18
Introduction – DONG Energy
Classification Systems/Procedures
Example
Close out

General – Concept Technical Screening
19
Many WOS discoveries/prospects are deeper than 300 m

002206
205
210
209
208214
003
218217
001
219
61076106 6105 6104
0034
62026207
6206 6205 62046203
6007
211
204
6201
00306006
213
207
6005
164 009008165 166 007202
6202
203 005
216
6208
006
176
6103
6004
0025
6108
0033
175
222
6203
6008
630263036304
174
6305 221
220
6306
6200
63016307 223 63006302
63016308
0029
163
6201
0024
0035
010
004
6303
212
173
215
The Shetland Islands
The Faroe Islands
DONG E&P acreage in the UK and Faroese shelf (WoS)
20

West of Shetlands (WOS)
Key Characteristics
Hostile environment
Deep water, wind, waves, current, cold
water temperatures
Distant from gas market
High development cost
No direct gas pipeline access to NTS
Diverse partnerships
2 Tcf discovered gas
Up to 2 Tcf upside on discovered
resources
Up to 4 Tcf of undiscovered potential
21

West of Shetlands (WOS)
Key Characteristics
Hostile environment
Deep water, wind, waves, current, cold
water temperatures
Distant from gas market
High development cost
No direct gas pipeline access to NTS
Diverse partnerships
2 Tcf discovered gas
Up to 2 Tcf upside on discovered
resources
Up to 4 Tcf of undiscovered potential
22

23

Example – Field
24
Dong Energy UNFC-2009
Class 5 low 221
Class 5 mid +122 (& 222)
Class 5 high +123 (& 223,233)
Classification
depending on
commercial
status
low case define classification
status in DONG System for mid/high cases
('112' not possible without '111')
Business Planning
Feasibility ConceptPreparation
for ExecutionExecution Operation
DG1 DG2 DG3 DG4 DG5
Capital Value Process (CVP)
Business domain Project domain Operations domain
Initiate ClosingExecutingPlanningInputs Outputs
Controlling
Project Integration Process
Technology Implementation
Project Controls
Procurement
Enabling Processes
Well Delivery
Support Processes
2
3
4
2
5
2
6
1

Example – Field – Exploration
25
Dong Energy UNFC-2009
Class 6 low 334
Class 6 mid 334
Class 6 high 334 (or 234)
Classification
very similar for
DONG
Exploration
projects
Geological definition less well defined,
making ranges (high & low) difficult to show clearly
This is currently being looked at via the UNFC Task Force specification work
N

Example – Field – Discovery
26
Dong Energy UNFC-2009
Class 5 low 331
Class 5 mid +332
Class 5 high +333 (or +233)
Classification
options suiting
well for DONG
development
projects
N

DONG Energy Volume booking process is closely linked the Company Project
Model
The company system can be mapped onto the UNFC 2009 system with no major
modifications
No major differences in booking numbers within major categories between the
system for the examples used
Some differences between the DONG System and UNFC-2009 with respect to
Exploration
The 3 dimensional (UNFC) system is generally considered more difficult within
the company.
UNFC 2009 is well suited for better comparing volumes between different
systems (companies or national) - although not shown in this presentation
27
Close out

Thank you for your attention