Embed Size (px)
Citation preview
73
Xu Cheng1, Yu Bo1 , Zhang Zhengwei2, Zhang Jinjun1, Wei Jinjia3 and Sun Shuyu4
1 Beijing Key Laboratory of Urban Oil and Gas Distribution Technology, China University of Petroleum, Beijing 102249, China2 Zhejiang Department Preparatory Team, PetroChina West East Gas Pipeline Company, Hangzhou, Zhejiang 310000, China3 State Key Laboratory of Multiphase Flow in Power Engineering, Xi’an Jiaotong University, Xi’an, Shaanxi 710049, China4 Department of Mathematical Sciences, Clemson University, Clemson, SC 29634-0975, USA
© China University of Petroleum (Beijing) and Springer-Verlag Berlin Heidelberg 2010
Abstract: In this paper a mathematical model is built for a buried hot crude oil pipeline during shutdown, and an unstructured grid and polar coordinate grid are respectively applied to generating grids for the soil region and the three layers in the pipe (wax layer, pipe wall, and corrosion-inhibiting coating). The governing equations are discretized using the fi nite volume method. The variations in temperatures of static oil and soil were investigated during pipeline shutdown in both summer and winter, in which some important parameters of the soil and crude oils of a Northeast pipeline are employed.
Key words: Moving boundary, stagnation point, equivalent thermal conductivity, thermal influence region, unstructured grid
Numerical simulation of a buried hot crude oil pipeline during shutdown
*Corresponding author. email: [email protected], [email protected] March 9, 2009
DOI 10.1007/s12182-010-0008-xPet.Sci.(2010)7:73-82
1 Introduction Most crude oil produced in China is heated before pipeline
transportation due to its high pour point and high viscosity. Heated oil transportation is a technology in which the crude oil is heated before pipeline transfer to reduce oil viscosity and pressure consumption. Because the oil temperature decreases all the way along the pipeline, heating furnaces at the pumping stations are used to keep the oil temperature above its gel point. However, it is quite possible that pipeline shutdowns can occur as sudden events. During shutdown complex cooling takes place between oil and soil driven by the temperature difference. With a decrease in oil temperature, wax precipitates from crude oil and forms a network which degrades the fl ow behavior of crude oil. Moreover, pipeline accidents may happen and result in great economic loss when the strength of the network of wax crystals formed in the crude oil is stronger than the pump starting pressure or greater than the restart pressure the pipeline can withstand. Therefore, it is worthwhile to study how oil temperature changes during pipeline shutdown for the interest of safety and economy. This study provides a scientifi c basis for accurate calculation of allowed shutdown time and intermittent transportation. Generally speaking, the process of pipeline shutdown can be
studied in two ways: numerical simulation and experimental study, while numerical simulation is regarded as an appropriate method because of its low cost, short study cycle, and capability to offer the analysis and optimization of major factors. However, analytical methods were more widely used in the early research on buried hot crude oil pipelines (Агапкин, 1986). These usually introduced signifi cant errors due to simplifi cations. In numerical simulation, a semi-infi nite region needs to be converted into a fi nite region for the study of pipeline heat transfer. By now two approaches are popular for this work. Bipolar coordinate conformal transformation (Haim, 1982) is one way by which a semi-infinite region can be converted into a rectangular or circular shape. But complicated mathematical transformation and simplifi cation are required for its solution. In an alternative approach, a thermal infl uence region of a pipeline (Cui and Zhang, 2004; Ling et al, 2008; Zhang et al, 2008) is introduced for its modeling. It is known that the thermal behavior of a pipeline has an effect on the temperature of soil around it; however, the soil region far away from it is hardly infl uenced. Thus a semi-infinite region is truncated into a finite region. In this way, it is convenient to obtain the solution and overcome the shortage of bipolar coordinate conformal transformation. In fact, thermal influence region is related not only to the physical parameters of soil but also the depth, the diameter of pipeline, and the oil temperature. In this paper, we employ a thermal infl uence region and propose a fi nite volume method for the study of buried hot crude oil pipelines.
74
2 Analysis of temperature drop of hot crude oil in a buried pipeline during shutdown
The temperature drop of waxy crude oil during pipeline shutdown is a process of three-dimensional unsteady heat transfer with phase transition, natural convection, and moving boundary (Xu and Zhang, 2005). During pipeline shutdown, crude oil loses heat to soil around the pipeline. As a result, pipeline, soil, and air form a thermal system, while a subsystem is made up of crude oil and layers of media. During pipeline shutdown, heat transfer in crude oil can be also divided into three stages: 1) natural-convection-dominated stage, 2) joint control of natural convection and heat conduction, and 3) pure heat conduction (Li and Zhang, 2004). In the first stage heat energy is transferred from oil to surroundings driven by a temperature difference; and the waxy crude oil temperature falls evenly and rapidly all along the pipeline. It is the fastest process of temperature drop in the three stages. The second stage is controlled jointly by both natural convection and heat conduction. When the temperature of crude oil drops to the wax precipitation point, the paraffi n in oil gradually appears at the pipe section with the release of latent heat of crystallization. The latent heat of crystallization slows down the rate of fall in temperature; the precipitation of wax crystals degrades the fl owability of crude oil and weakens the natural convection. In the third stage, when the temperature of crude oil in the center of pipeline drops to the stagnation point below which the crude oil is essentially static, hence at this stage the crude oil transfers heat by conduction.
3 Mathematical model for a buried hot crude oil pipeline during shutdown
The entire thermal system is made up of oil, soil, and air. As a result, the study of the buried hot crude oil pipeline can be divided into two parts, the heat transfer of oil inside the pipeline and the heat conduction of soil outside the pipeline. We apply equivalent thermal conductivity to treat the natural convection heat transfer. An equivalent coupling relationship can be established between crude oil and soil. Due to the large number of complex processes involved, the mathematical modeling of heat transfer in a buried hot crude oil pipeline requires reasonable simplification to make the calculation computationally feasible. The main simplifications used in this research are given as follows:
(1) The soil surrounding the pipelines is assumed to be homogeneous and isotropic.
(2) Three-dimensional unsteady heat conduction is described by a two-dimensional model (Zhang, 2004; Zhao et al, 2008), neglecting the axial temperature drop.
(3) The layer of deposited wax on the pipeline wall is assumed uniformly distributed along the entire pipeline.
(4) Stagnation point (Li, 2007) is introduced in the second stage of temperature drop, which is an unsteady process with phase change, moving boundaries, and natural convection. The concept of stagnation point introduced by Li (2007) indicates that the pipeline can be divided into two
regions, a liquid region and a solid one. Heat is transferred by convection in the liquid region and by conduction in the other. The stagnation point is usually higher than the gel point; for example, for the Puyang crude oil, the stagnation point is 7.4 degrees Celsius higher than the gel point. Another example from the Shengli crude oil suggests that the difference between stagnation point and the gel point is as large as 10.4 degrees Celsius (Губин, 1987).
(5) Natural convection can be solved in the same way as conduction after equivalent thermal conductivity is applied (Ling, 2008). By this means, we can convert the calculation of natural convection into conductive heat transfer. The equivalent thermal conductivity is dependent on the natural convection coefficient, the temperature of oil, and the temperature gradient on the interface. The equivalent thermal conductivity is expressed by the following equation.
(1)o lo w
elo
w
( )T TTr
where λe is the equivalent thermal conductivity of the liquid crude oil, W/(m·ºC); αo is the coefficient of heat transfer during natural convection; Tlo is the temperature of the crude oil at the interface of liquid oil and coagulated oil layer, ºC;
Tw is the temperature of the interface of liquid oil and wax
deposit, ºC; and lo
w
Tr is the temperature gradient on the
interface (Yang, 2006).Actually, the equivalent thermal conductivity is not a real
heat coefficient, but instead it is artificially introduced here for the convenience of calculation with the law of energy conservation. The introduction of this parameter greatly simplifi ed the calculation. We remark that this approximation still reasonably represents natural convection during pipeline shutdown, and practically it is regarded as a feasible method for natural convection.
(6) The latent heat of wax crystallization (Lu et al, 2005) slows down the temperature drop during pipeline shutdown, which has an impact on the heat capacity variation of the crude oil.
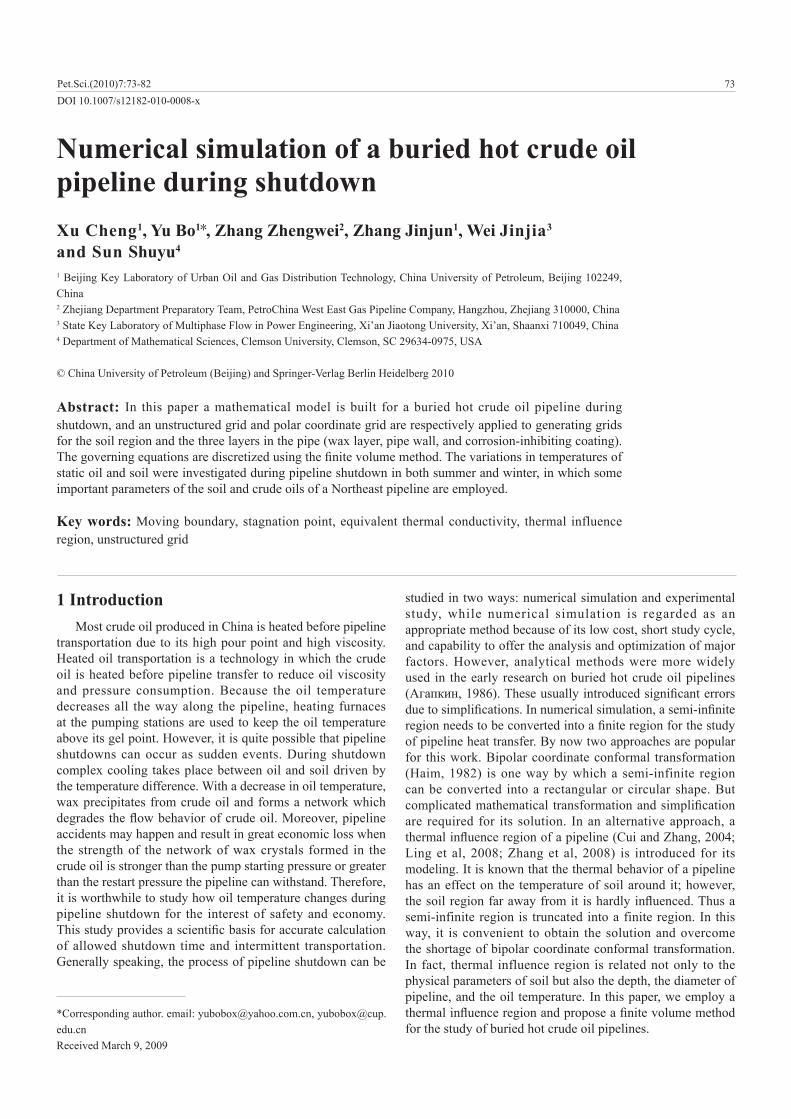
(7) The thermal influence region of the pipeline can be determined by data measured in the field or by theoretical calculation. Previous studies (Wu et al, 2001; 2003; Yang, 2006) have shown that 10 m is a reasonable depth of the thermal influence region of a hot oil pipeline, which is adopted by our computation in this paper (Fig. 1, xd≤10, yd≤10).
With the simplification and hypothesis mentioned above and as Fig. 1 shows, we established a heat transfer mathematical model for a buried hot crude oil pipeline, incorporating crude oil, wax deposit, pipeline wall, corrosion-inhibiting coating, air, soil, and their interactions.
(1) Heat transfer equation of the oil:
(2)o o oo o o o2
1 1( ) ( )T T T
C rr r r r
Pet.Sci.(2010)7:73-82
75Pet.Sci.(2010)7:73-82
76
4.2 Software verifi cation
Verification of the software developed by our research team was carried out with a fi eld test of a crude oil pipeline shutdown in the northwest China. The oil temperatures at
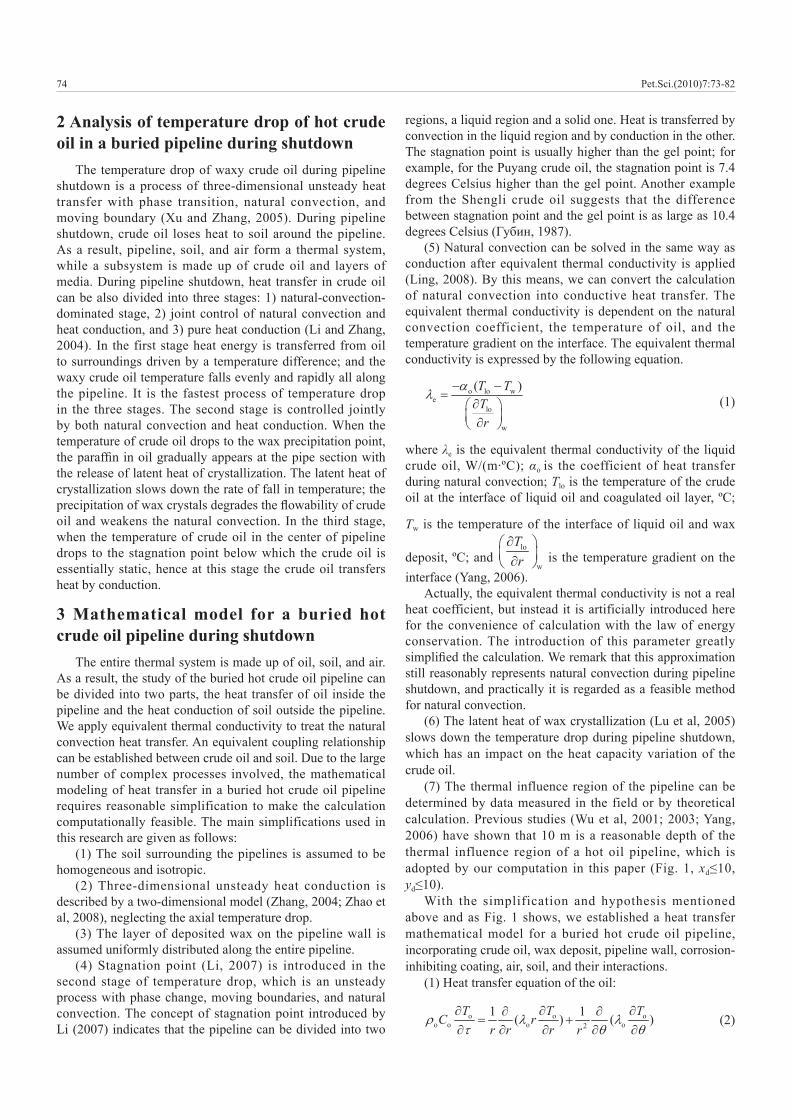
Fig. 2 Grid generation for the soil domain
x, m
y, m
0
-1
-2
-3
-4
-5
-6
-7
-8
-9
-100 5 10
-1.1
-1.2
-1.3
-1.4
-1.5
-1.6
-1.7
-1.8
-1.9
-2.0
-2.10 0.5 1.0
x, m
y, m
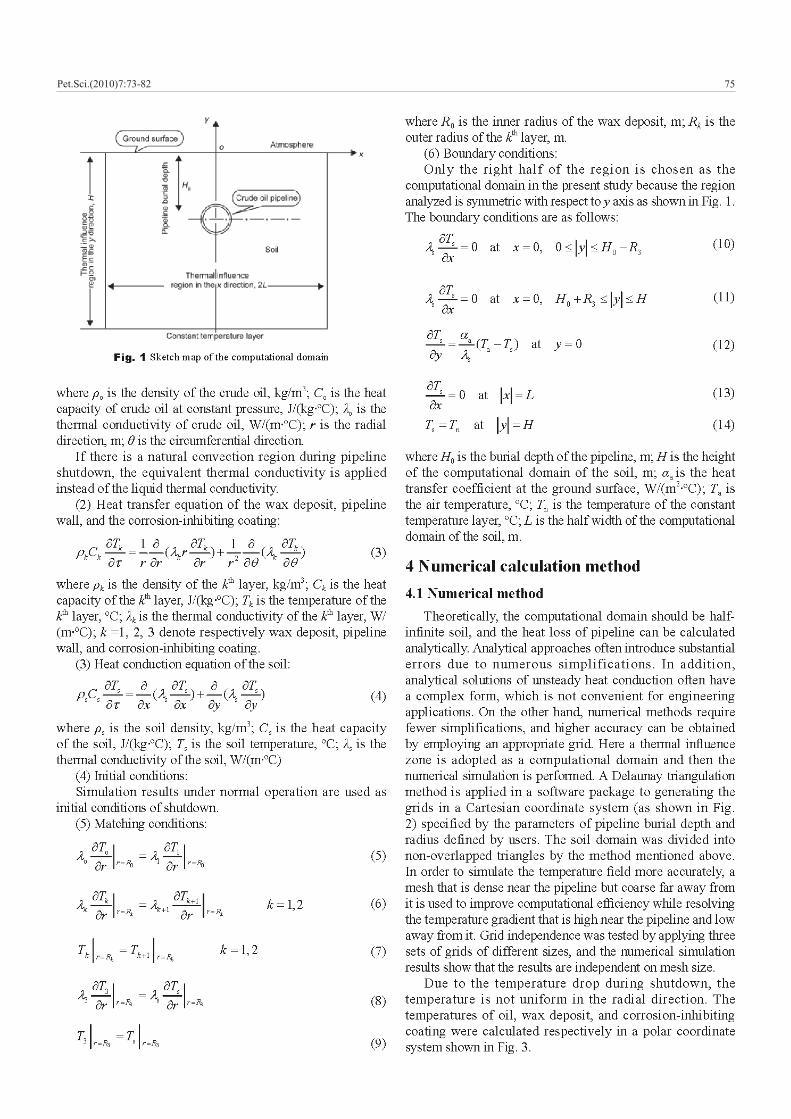
Fig. 3 The structural grids for oil, wax deposit, and corrosion-inhibiting coating
5 Simulation and analysis of the process of temperature drop
In this paper, we investigated the pipeline segment between the Huludao station and the Suizhong station of the Tieling-Qinhuangdao Pipeline of Northeast Pipeline Company, in which Daqing crude oil with a stagnation point of 40 ºC is transported. The pipeline length is 71.47 km; the pipe outer diameter is 720 mm and the pipe wall thickness is 8 mm. The average buried depth of the pipeline is 1.6 m; the elevation of the latter station is 4.57 m higher than that of the former; the thermal conductivity coeffi cients of the pipe wall, the wax deposition, the corrosion inhibiting coating, and the soil are 62.5, 0.2, 0.2, and 1.4 W/(m·ºC), respectively; the thickness of the corrosion inhibiting-coating is 8 mm; the convective heat transfer coeffi cient on the ground surface is 25.6 W/(m2·ºC); the heat capacity of the soil is 1,041 J/(kg·ºC) and the soil density is 1,600 kg/m3.
Duration ofShutdown, h
Temperature before shutdown, ºC Temperature after shutdown, ºC Temperature drop, ºC
Measured Calculated Measured Calculated Measured Calculated Deviation
24 21.1 21.0 19.6 19.1 1.5 1.9 0.4
36 21.3 21.2 19.3 19.2 2.0 2.0 0.0
48 21.7 21.3 18.6 18.8 3.1 2.5 −0.6
Table 1 Oil temperatures at the inlet of a pumping station before and after shutdown
5.1 Numerical simulation and analysis of temperature drop during pipeline shutdown in summer
We discussed below one example of a pipeline shutdown that occurred on August 2nd, 2005, with a fl ow rate of 16,669 tons per day, an outlet temperature of 49.1 ºC, and an outlet pressure of 2.11 MPa. Pipeline shutdown time was 96 hours.5.1.1 Simulation results under normal operation
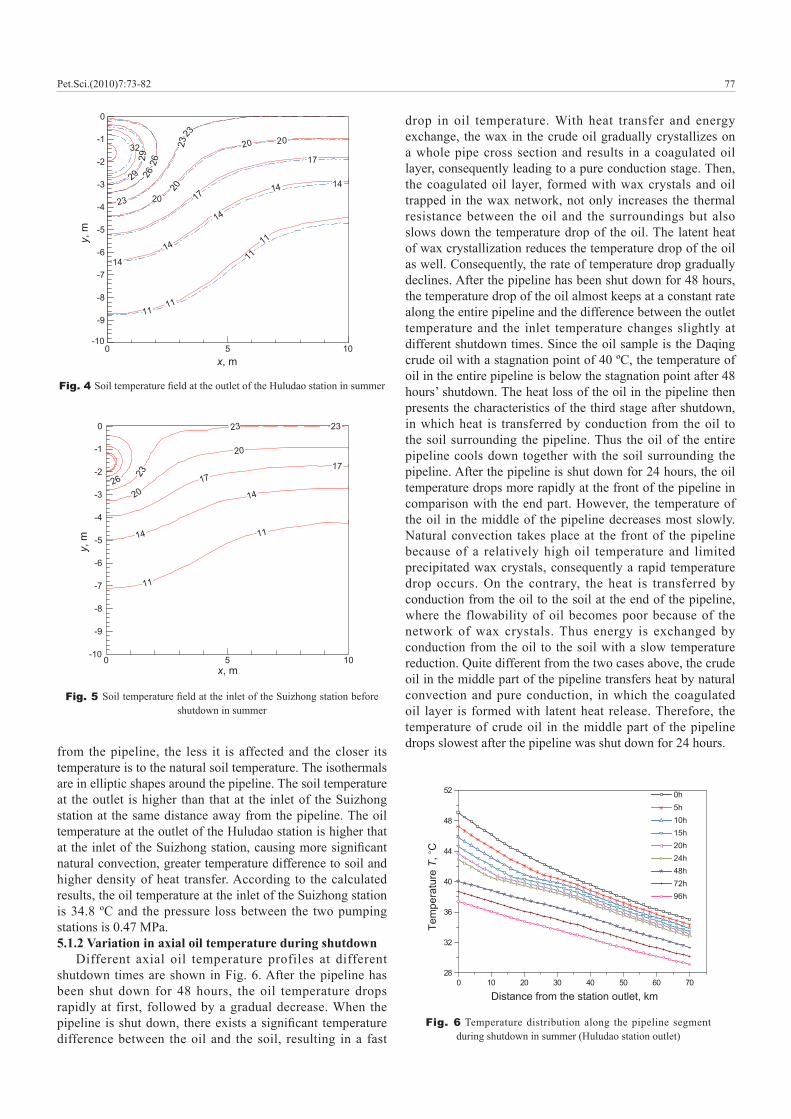
Mathematical simulation of the soil temperature field on August 2nd, 2005 was performed. Two-dimensional temperature profiles were plotted with the Tecplot software according to the calculated results. The soil temperature fi eld outside the pipeline at the outlet of the Huludao station is shown in Fig. 4 while that at the inlet of the Suizhong station is shown in Fig. 5 (the continuous lines (solid line) represent the temperature before pipeline shutdown).
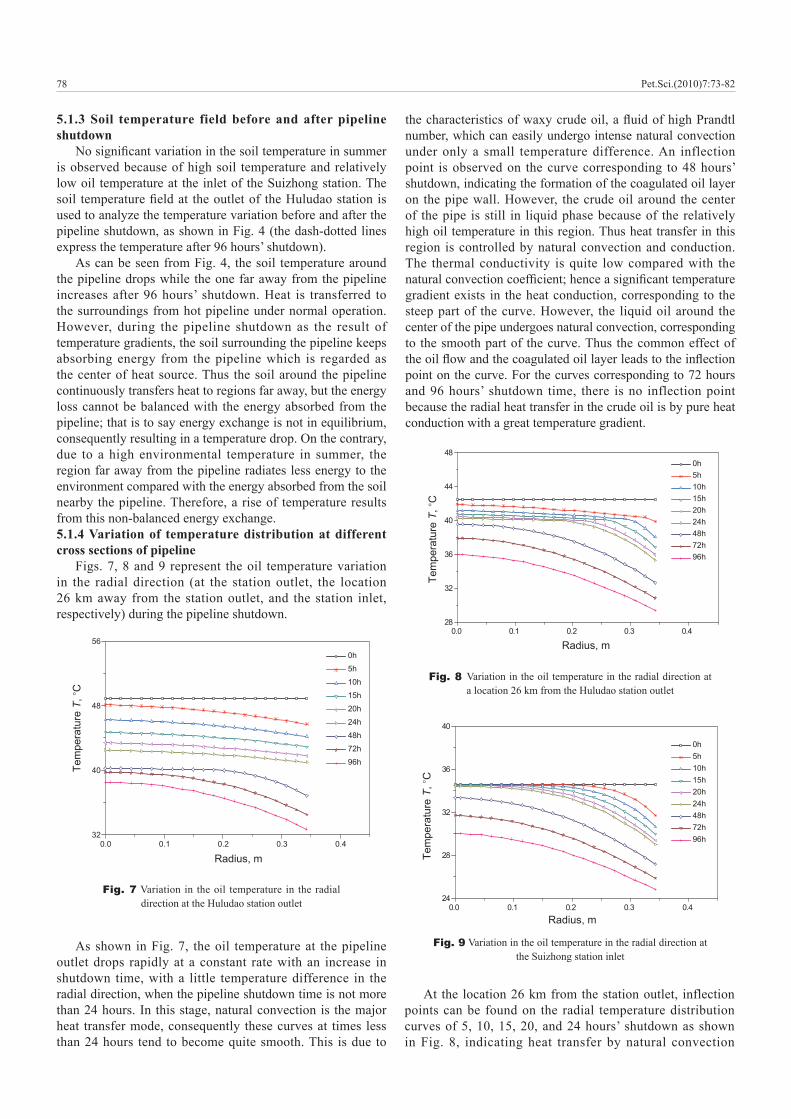
As can be seen from Figs. 4 and 5, the closer the soil is to the pipeline, the more it is affected by the oil and the higher the soil temperature will be. The further the soil is away
Pet.Sci.(2010)7:73-82
the inlet of a pumping station before and after the shutdown were calculated by the software and then compared with the measured parameters, as listed in Table 1. The deviation between the calculated and measured results was within 1 ºC, which proved the reliability of the software.
77
from the pipeline, the less it is affected and the closer its temperature is to the natural soil temperature. The isothermals are in elliptic shapes around the pipeline. The soil temperature at the outlet is higher than that at the inlet of the Suizhong station at the same distance away from the pipeline. The oil temperature at the outlet of the Huludao station is higher that at the inlet of the Suizhong station, causing more signifi cant natural convection, greater temperature difference to soil and higher density of heat transfer. According to the calculated results, the oil temperature at the inlet of the Suizhong station is 34.8 ºC and the pressure loss between the two pumping stations is 0.47 MPa.5.1.2 Variation in axial oil temperature during shutdown
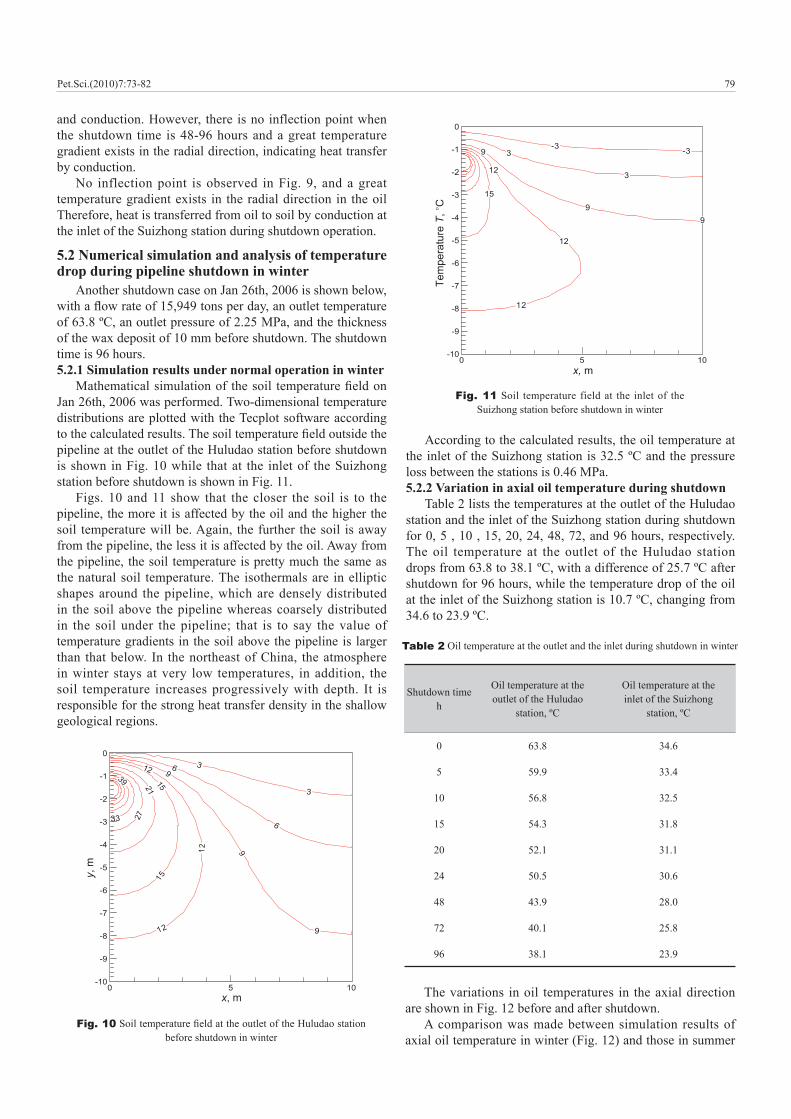
Different axial oil temperature profiles at different shutdown times are shown in Fig. 6. After the pipeline has been shut down for 48 hours, the oil temperature drops rapidly at first, followed by a gradual decrease. When the pipeline is shut down, there exists a signifi cant temperature difference between the oil and the soil, resulting in a fast
drop in oil temperature. With heat transfer and energy exchange, the wax in the crude oil gradually crystallizes on a whole pipe cross section and results in a coagulated oil layer, consequently leading to a pure conduction stage. Then, the coagulated oil layer, formed with wax crystals and oil trapped in the wax network, not only increases the thermal resistance between the oil and the surroundings but also slows down the temperature drop of the oil. The latent heat of wax crystallization reduces the temperature drop of the oil as well. Consequently, the rate of temperature drop gradually declines. After the pipeline has been shut down for 48 hours, the temperature drop of the oil almost keeps at a constant rate along the entire pipeline and the difference between the outlet temperature and the inlet temperature changes slightly at different shutdown times. Since the oil sample is the Daqing crude oil with a stagnation point of 40 ºC, the temperature of oil in the entire pipeline is below the stagnation point after 48 hours’ shutdown. The heat loss of the oil in the pipeline then presents the characteristics of the third stage after shutdown, in which heat is transferred by conduction from the oil to the soil surrounding the pipeline. Thus the oil of the entire pipeline cools down together with the soil surrounding the pipeline. After the pipeline is shut down for 24 hours, the oil temperature drops more rapidly at the front of the pipeline in comparison with the end part. However, the temperature of the oil in the middle of the pipeline decreases most slowly. Natural convection takes place at the front of the pipeline because of a relatively high oil temperature and limited precipitated wax crystals, consequently a rapid temperature drop occurs. On the contrary, the heat is transferred by conduction from the oil to the soil at the end of the pipeline, where the flowability of oil becomes poor because of the network of wax crystals. Thus energy is exchanged by conduction from the oil to the soil with a slow temperature reduction. Quite different from the two cases above, the crude oil in the middle part of the pipeline transfers heat by natural convection and pure conduction, in which the coagulated oil layer is formed with latent heat release. Therefore, the temperature of crude oil in the middle part of the pipeline drops slowest after the pipeline was shut down for 24 hours.
Fig. 5 Soil temperature fi eld at the inlet of the Suizhong station before shutdown in summer
11
11
14
14
1717
20
20
23
26
0 5 10-10
-9
-8
-7
-6
-5
-4
-3
-2
-1
0
x, m
y, m
2323
11
11
14
14
20
20
23
23
26
29
32
11
11
14
14
14
17
17
20
2023
2629
0 5 10-10
-9
-8
-7
-6
-5
-4
-3
-2
-1
0
x, m
y, m
Fig. 4 Soil temperature fi eld at the outlet of the Huludao station in summer
Fig. 6 Temperature distribution along the pipeline segment during shutdown in summer (Huludao station outlet)
0 10 20 30 40 50 60 7028
32
36
40
44
48
52
Tem
pera
ture
T, ◦
C
Distance from the station outlet, km
0h
5h
10h15h20h
24h
48h72h96h
Pet.Sci.(2010)7:73-82
78
5.1.3 Soil temperature field before and after pipeline shutdown
No signifi cant variation in the soil temperature in summer is observed because of high soil temperature and relatively low oil temperature at the inlet of the Suizhong station. The soil temperature fi eld at the outlet of the Huludao station is used to analyze the temperature variation before and after the pipeline shutdown, as shown in Fig. 4 (the dash-dotted lines express the temperature after 96 hours’ shutdown).
As can be seen from Fig. 4, the soil temperature around the pipeline drops while the one far away from the pipeline increases after 96 hours’ shutdown. Heat is transferred to the surroundings from hot pipeline under normal operation. However, during the pipeline shutdown as the result of temperature gradients, the soil surrounding the pipeline keeps absorbing energy from the pipeline which is regarded as the center of heat source. Thus the soil around the pipeline continuously transfers heat to regions far away, but the energy loss cannot be balanced with the energy absorbed from the pipeline; that is to say energy exchange is not in equilibrium, consequently resulting in a temperature drop. On the contrary, due to a high environmental temperature in summer, the region far away from the pipeline radiates less energy to the environment compared with the energy absorbed from the soil nearby the pipeline. Therefore, a rise of temperature results from this non-balanced energy exchange. 5.1.4 Variation of temperature distribution at different cross sections of pipeline
Figs. 7, 8 and 9 represent the oil temperature variation in the radial direction (at the station outlet, the location 26 km away from the station outlet, and the station inlet, respectively) during the pipeline shutdown.
the characteristics of waxy crude oil, a fl uid of high Prandtl number, which can easily undergo intense natural convection under only a small temperature difference. An inflection point is observed on the curve corresponding to 48 hours’ shutdown, indicating the formation of the coagulated oil layer on the pipe wall. However, the crude oil around the center of the pipe is still in liquid phase because of the relatively high oil temperature in this region. Thus heat transfer in this region is controlled by natural convection and conduction. The thermal conductivity is quite low compared with the natural convection coeffi cient; hence a signifi cant temperature gradient exists in the heat conduction, corresponding to the steep part of the curve. However, the liquid oil around the center of the pipe undergoes natural convection, corresponding to the smooth part of the curve. Thus the common effect of the oil fl ow and the coagulated oil layer leads to the infl ection point on the curve. For the curves corresponding to 72 hours and 96 hours’ shutdown time, there is no inflection point because the radial heat transfer in the crude oil is by pure heat conduction with a great temperature gradient.
Fig. 7 Variation in the oil temperature in the radial direction at the Huludao station outlet
0.0 0.1 0.2 0.3 0.432
40
48
56
Radius, m
0h
5h
10h
15h
20h
24h
48h
72h
96h
Tem
pera
ture
T, ◦
C
Fig. 8 Variation in the oil temperature in the radial direction at a location 26 km from the Huludao station outlet
0.0 0.1 0.2 0.3 0.428
32
36
40
44
48
Radius, m
0h
5h10h15h20h24h48h72h96h
Tem
pera
ture
T, ◦
C
Fig. 9 Variation in the oil temperature in the radial direction at the Suizhong station inlet
0.0 0.1 0.2 0.3 0.424
28
32
36
40
0h5h10h
15h
20h24h48h72h96h
Radius, m
Tem
pera
ture
T, ◦
C
As shown in Fig. 7, the oil temperature at the pipeline outlet drops rapidly at a constant rate with an increase in shutdown time, with a little temperature difference in the radial direction, when the pipeline shutdown time is not more than 24 hours. In this stage, natural convection is the major heat transfer mode, consequently these curves at times less than 24 hours tend to become quite smooth. This is due to
At the location 26 km from the station outlet, inflection points can be found on the radial temperature distribution curves of 5, 10, 15, 20, and 24 hours’ shutdown as shown in Fig. 8, indicating heat transfer by natural convection
Pet.Sci.(2010)7:73-82
79
and conduction. However, there is no inflection point when the shutdown time is 48-96 hours and a great temperature gradient exists in the radial direction, indicating heat transfer by conduction.
No inflection point is observed in Fig. 9, and a great temperature gradient exists in the radial direction in the oil Therefore, heat is transferred from oil to soil by conduction at the inlet of the Suizhong station during shutdown operation.
5.2 Numerical simulation and analysis of temperature drop during pipeline shutdown in winter
Another shutdown case on Jan 26th, 2006 is shown below, with a fl ow rate of 15,949 tons per day, an outlet temperature of 63.8 ºC, an outlet pressure of 2.25 MPa, and the thickness of the wax deposit of 10 mm before shutdown. The shutdown time is 96 hours.5.2.1 Simulation results under normal operation in winter
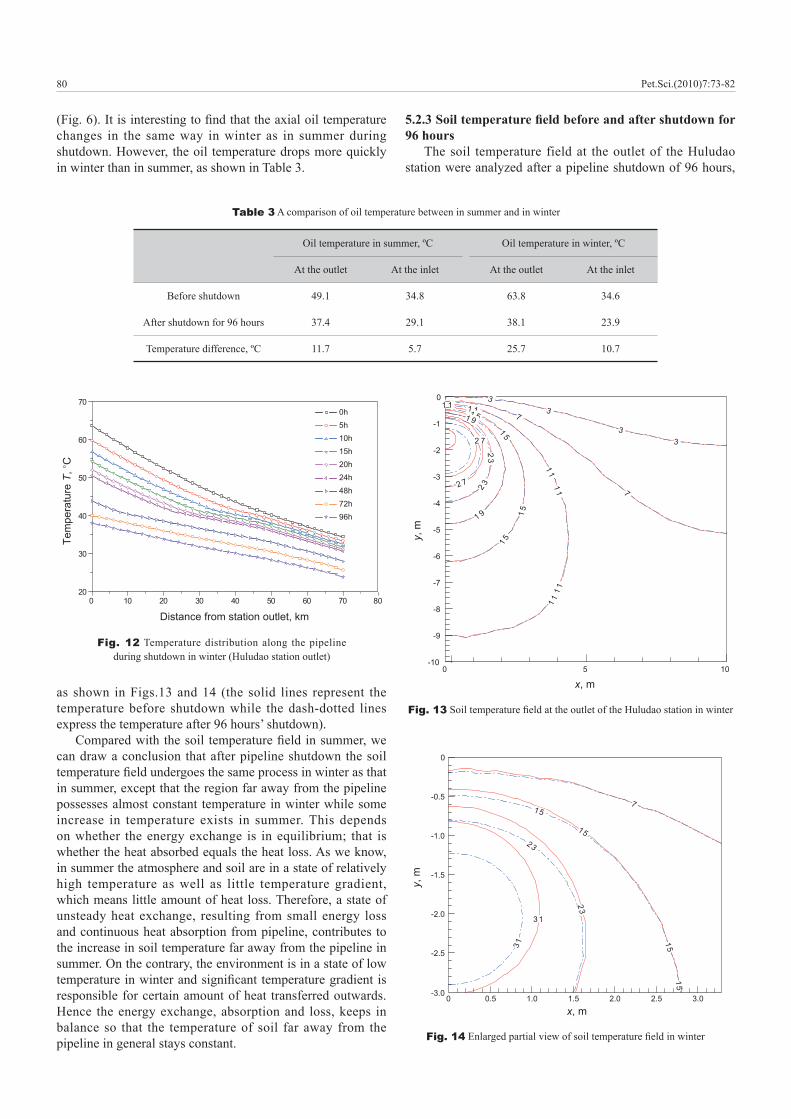
Mathematical simulation of the soil temperature fi eld on Jan 26th, 2006 was performed. Two-dimensional temperature distributions are plotted with the Tecplot software according to the calculated results. The soil temperature fi eld outside the pipeline at the outlet of the Huludao station before shutdown is shown in Fig. 10 while that at the inlet of the Suizhong station before shutdown is shown in Fig. 11.
Figs. 10 and 11 show that the closer the soil is to the pipeline, the more it is affected by the oil and the higher the soil temperature will be. Again, the further the soil is away from the pipeline, the less it is affected by the oil. Away from the pipeline, the soil temperature is pretty much the same as the natural soil temperature. The isothermals are in elliptic shapes around the pipeline, which are densely distributed in the soil above the pipeline whereas coarsely distributed in the soil under the pipeline; that is to say the value of temperature gradients in the soil above the pipeline is larger than that below. In the northeast of China, the atmosphere in winter stays at very low temperatures, in addition, the soil temperature increases progressively with depth. It is responsible for the strong heat transfer density in the shallow geological regions.
Fig. 11 Soil temperature field at the inlet of the Suizhong station before shutdown in winter
-3-3
3
3
99
9
12
12
12
15
0 5 10-10
-9
-8
-7
-6
-5
-4
-3
-2
-1
0
Tem
pera
ture
T, ◦
C
x, m
x, m
y, m
3
3
6
6
9
9
9
12
12
12
15
1521
2733
39
0 5 10-10
-9
-8
-7
-6
-5
-4
-3
-2
-1
0
Fig. 10 Soil temperature fi eld at the outlet of the Huludao station before shutdown in winter
Shutdown timeh
Oil temperature at the outlet of the Huludao
station, ºC
Oil temperature at the inlet of the Suizhong
station, ºC
0 63.8 34.6
5 59.9 33.4
10 56.8 32.5
15 54.3 31.8
20 52.1 31.1
24 50.5 30.6
48 43.9 28.0
72 40.1 25.8
96 38.1 23.9
Table 2 Oil temperature at the outlet and the inlet during shutdown in winter
According to the calculated results, the oil temperature at the inlet of the Suizhong station is 32.5 ºC and the pressure loss between the stations is 0.46 MPa.5.2.2 Variation in axial oil temperature during shutdown
Table 2 lists the temperatures at the outlet of the Huludao station and the inlet of the Suizhong station during shutdown for 0, 5 , 10 , 15, 20, 24, 48, 72, and 96 hours, respectively. The oil temperature at the outlet of the Huludao station drops from 63.8 to 38.1 ºC, with a difference of 25.7 ºC after shutdown for 96 hours, while the temperature drop of the oil at the inlet of the Suizhong station is 10.7 ºC, changing from 34.6 to 23.9 ºC.
Pet.Sci.(2010)7:73-82
The variations in oil temperatures in the axial direction are shown in Fig. 12 before and after shutdown.
A comparison was made between simulation results of axial oil temperature in winter (Fig. 12) and those in summer
80
(Fig. 6). It is interesting to fi nd that the axial oil temperature changes in the same way in winter as in summer during shutdown. However, the oil temperature drops more quickly in winter than in summer, as shown in Table 3.
Oil temperature in summer, ºC Oil temperature in winter, ºC
At the outlet At the inlet At the outlet At the inlet
Before shutdown 49.1 34.8 63.8 34.6
After shutdown for 96 hours 37.4 29.1 38.1 23.9
Temperature difference, ºC 11.7 5.7 25.7 10.7
Table 3 A comparison of oil temperature between in summer and in winter
Fig. 12 Temperature distribution along the pipeline during shutdown in winter (Huludao station outlet)
0 10 20 30 40 50 60 7020
30
40
50
60
70
Distance from station outlet, km
0h
5h
10h
15h
20h
24h
48h
72h96h
Tem
pera
ture
T, ◦
C
80
Fig. 13 Soil temperature fi eld at the outlet of the Huludao station in winter
3
3
7
7
11
1 1
1 1
1 5
1 5
1 9
1 5
23
2 7
3
3
7
7
11
11
1 1
15
1 5
1 9
1 9
2 32 7
0 5 10-10
-9
-8
-7
-6
-5
-4
-3
-2
-1
0
x, m
y, m
5.2.3 Soil temperature fi eld before and after shutdown for 96 hours
The soil temperature field at the outlet of the Huludao station were analyzed after a pipeline shutdown of 96 hours,
as shown in Figs.13 and 14 (the solid lines represent the temperature before shutdown while the dash-dotted lines express the temperature after 96 hours’ shutdown).
Compared with the soil temperature fi eld in summer, we can draw a conclusion that after pipeline shutdown the soil temperature fi eld undergoes the same process in winter as that in summer, except that the region far away from the pipeline possesses almost constant temperature in winter while some increase in temperature exists in summer. This depends on whether the energy exchange is in equilibrium; that is whether the heat absorbed equals the heat loss. As we know, in summer the atmosphere and soil are in a state of relatively high temperature as well as little temperature gradient, which means little amount of heat loss. Therefore, a state of unsteady heat exchange, resulting from small energy loss and continuous heat absorption from pipeline, contributes to the increase in soil temperature far away from the pipeline in summer. On the contrary, the environment is in a state of low temperature in winter and signifi cant temperature gradient is responsible for certain amount of heat transferred outwards. Hence the energy exchange, absorption and loss, keeps in balance so that the temperature of soil far away from the pipeline in general stays constant. Fig. 14 Enlarged partial view of soil temperature fi eld in winter
7
15
15
23
31
7
15
15
23
31
0 0.5 1.0 1.5 2.0 2.5 3.0-3.0
-2.5
-2.0
-1.5
-1.0
-0.5
0
x, m
y, m
Pet.Sci.(2010)7:73-82

81
0.0 0.1 0.2 0.3 0.432
40
48
56
64
Radius, m
0h
5h10h15h20h24h48h72h96h
Tem
pera
ture
T, ◦
C
Fig. 15 Variation in oil temperature in the radial direction at the outlet of Huludao station
Fig. 16 Variation in oil temperature in the radial direction at a location 26 km from the outlet of Huludao station
0.0 0.1 0.2 0.3 0.424
32
40
48
56
0h
5h
10h
15h
20h
24h
48h
72h
96h
Radius, m
Tem
pera
ture
T, ◦
C
0.0 0.1 0.2 0.3 0.416
24
32
400h5h10h15h20h24h48h72h96h
Radius, m
Tem
pera
ture
T, ◦
C
Fig. 17 Variation in oil temperature in the radial direction at the inlet of Suizhong station
5.2.4 Variation of temperature distribution at different cross sections of pipeline
Figs.15, 16, and 17 display oil temperature variation in the radical direction at different locations of the pipeline during pipeline shutdown (the station outlet, the location 26 km from the station outlet, and the station inlet, respectively).
Compared Figs.15-17 with Figs.7-11, it can be concluded that the oil temperature in the radial direction varies in the
same way in winter as in summer at these three locations above, except for a higher rate of temperature drop in winter than that in summer.
6 ConclusionsIn this paper, a physical model is used to simulate the
temperature drop of a buried pipeline transferring hot crude oil when it undergoes a shutdown operation. The governing equations are discretized by a finite volume method. Simulation results show that the present method is feasible to simulate the temperature drop of the crude oil during shutdown and the temperature profiles along both the radial and axial directions can be obtained. The study provides a scientifi c basis for accurate calculation of allowed shutdown time and intermittent transportation. In addition, we performed a series of detailed analyses with our simulation tools and could draw a conclusion that different seasons exert different effects on the temperature drop. However, a longer safety period is expected in summer.
AcknowledgementsThe paper is supported by National High-tech R&D
Program of China (No. 2006AA09Z357), the National Science Foundation of China (No. 50876114, No. 10602043), and the Program for New Century Excellent Talents in University (NCET-07-0843) and SRF for ROCS, SEM. This work is also financially supported by the State Key Laboratory of Multiphase Flow in Power Engineering (Xi’an Jiaotong University).
ReferencesCui X G and Zhang J J. Determination of the thermal infl uence zone of
buried hot oil pipeline on steady operation. Journal of the University of Petroleum, China. 2004. 28(2): 75-78 (in Chinese)
Hai m H B. Heat losses from a fluid flowing in a buried pipe. International Journal of Heat and Mass Transfer. 1982. 25(11): 1621-1629
Li W. Numerical Simulation of Transient Hydraulic and Thermal Operation of Buried Hot Oil Pipelines and its Applications. Ph.D Thesis. Beijing: China University of Petroleum. 2007 (in Chinese)
Li W and Zhang J J. Studies of temperature drop of buried waxy crude pipelines in shutdown. Oil & Gas Storage and Transportation. 2004. 23(1): 4-8 (in Chinese)
Lin g X, Wang Y, Yu B, et al. Thermal analysis of the new technology of crude oil pipeline and products pipeline laid in one ditch. Engineering Sciences. 2008. 10(11): 30-36 (in Chinese)
Lin g X. Advances in numerical simulation research on unsteady flow and heat transfer of hot crude oil pipelines. Oil & Gas Storage and Transportation. 2008. 27(5): 12-15 (in Chinese)
Lu T, Sun J S and Jiang P X. Temperature decrease and solidification interface advancement of overhead crude pipeline during shutdown. Journal of Petrochemical Universities. 2005. 18(4): 54-57 (in Chinese)
Wu G Z, Cui X L and Li G R. Study of the influence of unstable environment to earth temperature field. Oil-Gasfield Surface Engineering. 2003. 22(3): 9-10 (in Chinese)
Wu G Z, Qu H Q, Pang L P, et al. Numerical solution for unstable thermal calculation of buried oil transferring pipeline. Oil-Gasfi eld Surface Engineering. 2001. 20(6): 6-7 (in Chinese)
Pet.Sci.(2010)7:73-82

82
Xu K and Zhang J J. Temperature drop calculation of waxy crude in a buried pipeline after shutdown using enthalpy formulation. Journal of the University of Petroleum, China. 2005. 29(1): 84-88 (in Chinese)
Yan g X H. Design and Management of Oil Pipelines. Dongying, Shandong: China University of Petroleum Press. 2006. 97-99 (in Chinese)
Zha ng G Z. Study of shut down and temperature drop processes for a buried hot oil pipeline. Oil & Gas Storage and Transportation. 2004. 23(12): 33-37 (in Chinese)
Zha ng Z W, Ling X, Yu B, et al. Numerical simulation of a buried hot crude oil pipeline under normal operation. Journal of Engineering
Thermophysics. 2008. 29(8): 1389-1392 (in Chinese)Zha o H J, Zhang Q S, Zhang G Z, et al. Numerical study of the soil
temperature field after shutdown of a hot oil pipeline. Oil & Gas Storage and Transportation. 2008. 27(1): 14-17 (in Chinese)
Ага пкин В М. Thermodynamic and Hydrodynamic Calculations on Pipelines of Crude Oil and Product Oil. Translated by Luo T H. Beijing: Petroleum Industry Press. 1986 (in Chinese)
Губ ин В Е. Pipeline Transportation for High Pour Point and Viscous Crude Oil and Oil Products. Translated by Chen Z Z. Beijing: Petroleum Industry Press. 1987 (in Chinese)
(Edited by Sun Yanhua)
Pet.Sci.(2010)7:73-82