Embed Size (px)
Citation preview

195DOI 10.1007/s12182-013-0267-4
Liu Zhiwei1, 2 and Wang Yanchun1, 2
1 School of Geophysics and Information Technology, China University of Geosciences, Beijing 100083, China2
© China University of Petroleum (Beijing) and Springer-Verlag Berlin Heidelberg 2013
Abstract: Seismic processing characterizing thickness and borders of thin inter-beds has gradually evolved from post-stack migration to pre-stack migration, and the latter considers both vertical and lateral resolutions. As the key processing methods for improving vertical and lateral resolution, conventional
compression of the wavelet because of its instability. Therefore, considering the variations of wavelet
and imaging profiles of thin inter-beds. Based on the frequency characteristics of the wavelet before,
paper, including inverse Q
characterized by mudstone beds in the Oriente Basin proved that the joint high-resolution processing method is effective for determining the thickness and borders of thin inter-beds and is favorable for subsequent reservoir prediction and seismic inversions.
Key words: Thin inter-bed, seismic wavelet, inverse Qdeconvolution
A joint high-resolution processing method and its application for thin inter-beds
*Corresponding author. email: [email protected] September 18, 2012
Seismic vertical resolution refers to the ability to identify reflected interfaces from wavelets. Rayleigh studied Fraunhofer optical diffraction and proposed that two neighboring peaks can be visually distinguished if the time interval of the wavelet is not less than the peak-trough interval R , and the resolution limit is a quarter of the wavelength, commonly called the Rayleigh criterion (Fig.
convolving a zero-phase wavelet with two pulses of equal amplitude and polarity, and showed that the composite
interval of the two pulses is 2 r , which is defined as the vertical resolution limit, i.e., 1/4.6 of wavelength, now called
composite waveform by convolving a zero-phase wavelet with two pulses of equal amplitude and opposite polarity. He concluded that the composite waveform converges to the derivative of the wavelet with a decreasing interval between the two pulses and indicated that the resolution limit is 1/8 of the wavelength if the amplitude of the composite wave is considered. Kallweit and Wood (1982) made a summary of vertical resolution and showed that the Ricker criterion can be applied to both equal and opposite polarity situations of one doublet. Van Riel and Berkhout (1985) pointed the disadvantages of the above criteria: 1) only the interference
Pet.Sci.(2013)10:195-204
1 IntroductionGenerally, thin inter-beds refer to a geologic body which is
composed of two or more thin layers intermingled with beds of more normal thickness. The lithology difference results in different wave velocities in neighboring layers, so the bottom and top interfaces of one layer have opposite reflection
inter-beds is a result of superposition and interference of seismic wavelets (Widess, 1973). Vertically, the superposition and interference weaken the reflectivity coefficients of interfaces, and decrease the resolution of thin inter-beds. A seismic interpreter cannot properly distinguish the boundaries of a single layer (Knapp, 1990). Laterally, some wedges exist in the positions with lithologic changes in the seismic
discontinuous because the diffracted amplitudes of two sides of the diffracted point cannot be weakened after migration for different velocities (Robertson and Nogami, 1984). Therefore, thin inter-beds imaging is complex and requires high vertical and lateral resolution.

196
of the central peak with the first trough is considered, but the influence of side lobes of the wavelet on resolution is ignored. 2) Rayleigh and Ricker criteria are both based on an isolated doublet, but the multi-layer case is more important in practice. 3) A good result is obtained in the equal polarity situation, but in the opposite polarity situation, which is more important in practice, the result is not analyzed in detail. As a result, Berkhout introduced the wavelet length criterion for the vertical resolution. He proved that the dominant frequency is a key parameter in the Rayleigh and Ricker criteria. Knapp (1991) proposed the absolute resolution and concluded that the vertical resolution is related with the frequency of the wavelet, that is, the higher the frequency, the higher the resolution. The vertical resolution of seismic data can be improved in two ways, deconvolution and parameter
the formation is composed of a number of strong reflectors
beds are considered as band-limited noise and are even ignored, so the method is not suitable for improving thin
is a convolution of the zero-phase wavelet with reflectivity coefficients. Deconvolution can obtain a series of smooth reflectivity coefficients and the key is wavelet compression and reshaping. As a result, the frequency bandwidth and the frequency of seismic wavelet play an important role in improving the vertical resolution of thin inter-beds.
investigated seismic imaging resolution using geophysical models. Generally, the lateral resolution is evaluated by the
order Fresnel zones cancel each other, that is, the contribution
response, as shown in Fig. 2. According to the Rayleigh criterion, the dominant frequency of a seismic wavelet determines the lateral resolution. In migration imaging, with the downward continuation of the source and receiver, the seismic wavefield increasingly approximates the actual
migration is an essential approach to improve seismic lateral resolution. Pre-stack migration gradually replaced post-stack migration given the advantage of enhancing velocity analysis accuracy and preserving relative amplitudes. Accordingly, the improvement of lateral resolution of thin inter-beds relies on the dominant frequency of the seismic wavelet and pre-stack migration method.
Fig. 1 Resolution limit of the zero-phase Ricker wavelet
Basic waveletAmplitude1.5
1
0.5
0
-0.5
-1
1 3 5 7 9 11 13 15 17 19 21 23 25 27 29 31 33 35 37 39 41 43 45 47 49
r
R
ms
S R
Fig. 2
Therefore, the imaging processing of thin inter-beds should consider the frequency variation of wavelet before, during and after migration. Conventional surface consistent deconvolution (SCDC) and Kirchhoff pre-stack time
for structural processing. However, for thin inter-beds, some new problems appear such as wavelet instability, amplitude-
relative amplitude-preserved frequency expansion. We present a joint high-resolution processing method for thin inter-beds, emphasizing analyzing the frequency variations of wavelet
techniques to improve vertical and lateral resolution, which
2 Model & method
2.1 Inverse QWhen a seismic wavefield propagates in thin inter-beds,
high frequencies are lost because of spherical dispersion and
Pet.Sci.(2013)10:195-204
The lateral resolution has been discussed by many authors on post-stack and pre-stack migration and diffraction
the limiting factors to the lateral resolution by Kirchhoff migration and concluded that seismic lateral resolution is controlled not only by the migration aperture and frequency but also by the weighting function, velocity accuracy and spatial sampling. Von Seggern (1994) proposed visible
Fresnel zone for lateral resolution study based on the relation of the Fresnel zone and wavelet length. Brühl and Vermeer
situation cannot converge to the classical Fresnel zone and
affecting seismic lateral resolution, including the velocity
(2005) and Di and Gu (2005) qualitatively and quantitatively

197
wavelet retains the frequency characteristics of a vibrating
source in homogeneous media, whereas the wavelet’s
a thin layer medium with linearly varying velocity, as shown in Fig. 3(b).
Fig. 3 High-frequency absorption of a seismic wavelet(a) Homogenous medium, (b) Layer medium with linear velocities, (c) Spectra of (a) and (b)
Amplitude0
2.5
2.7
2.9
3.1
3.3
3.5
Tim
e, s
Tim
e, s
Amplitude0
2.5
2.7
2.9
3.1
3.3
3.5
×10-7
5
00
Am
plitu
de
10 20 30 40
(a)
(b)
(a) (b) (c)
Deconvolution, spectral whitening and frequency compensation based on wavelet transform are widely used in seismic processing (Gao et al, 2003). Constructing a time-
treatments for both early and late time seismic records, so the present deconvolution methods mainly have a window-dependent design. However, the design leads to destruction of seismic wavelets in the overlapping segments. Spectral whitening flattens the amplitude spectra as a kind of zero-phase deconvolution, and when the reflection coefficient is
transform decomposes seismic data into different scales and then operates gain processing. Because the wavelet function and scale function at any time are orthogonal, the modeled processing is disadvantageous for the orthogonality. Wavelet stability and white reflection coefficients play a key role in the compensation of high frequency.
A seismic signal’s instability results from inelasticity and inhomogeneity of subsurface media, and inverse spherical divergence and inelastic attenuation correction before deconvolution are performed. The high frequency attenuation can be described as a function of the quality factor Q and be compensated by inverse Q2002). During propagating, the seismic signal suffers phase distortion related to the frequency f and quality factor Q, and the seismic signal can be written as
(1)/ ( )( , , ) { ( , , )e }Q f iH fQW t z IFT W f z
Assuming that Q does not vary with frequency, then �� � ��� � � � � � � � � fz Qv f
QW t z IFT W f z � (2)
where, c c( ) ( ){1 1 / ln / }v f v f Q f f and f c is a cut frequency, and the phase velocity is determined by the wavelet frequency. Frequency attenuation increases with an increase in frequency and propagation time. For the solution of the Q matrix, the most stable methods are discrete Q in vertical seismic profile (VSP) and scanning Q analysis in seismic data. Inverse Qfrequency-dependent seismic energy attenuation and phase distortion, and to improve the stability of the seismic signal (Kjartansson, 1979). We simulated inverse Q filtering with the following results. Assuming that the constant Q equals to 150, the wavelet is trace 1 in Fig. 4. The results of applying inverse Q Q values are traces 2, 3, and 4 in Fig. 4, showing that when the Q value is close to 150, the result is the best.
-100 0 200
1
2
3
4
-100 ms 200
Q = 150
Q = 300
Q = 150
Q = 50
Fig. 4 Simulation of inverse Q Q values
Pet.Sci.(2013)10:195-204

198
2.2 Optimum weighting Kirchhoff PSTM
solution of the wave equation, and its migration operator response is better than that of frequency–wavenumber (FK) and finite difference (FD) migrations (Wu and Toksöz, 1987). We used the inter-beds model as shown in Fig. 5(a) to simulate the seismic data with an FD acoustic wave equation. The width of the mudstone bed is 40 m, and the wavelet is a Ricker wavelet with a dominant frequency of 35 Hz. Then,
performed, and the results were shown in Fig. 5(b), (c), and (d). We can see that the Kirchhoff migration has a great advantage in improving the vertical and lateral resolution.
accuracy of inter-beds, the problems of migration noise and amplitude preservation still exist which can affect the lateral resolution of thin inter-beds (Chen and Schuster, 1999). The
about the weighting factor.
Fig. 5 Comparison of different migration methods for a thin inter-beds model
(a) Time model of thin inter-beds, (b) FK migration, (c) FD migration, (d) Kirchhoff migration
1760
1780
1796
1811
1825
1837(ms)
Vrms=2500 m/s
Vrms=2500 m/s
Vrms=2518 m/s
Vrms=2536 m/sVrms=2540 m/sVrms=2545 m/sVrms=2552 m/s
Vrms=2565 m/s
1 181 361 541 721
1.8
1.9
2.0
1 181 361 541 721
1.8
1.9
2.0
1 181 361 541 721
1.8
1.9
2.0
(a)(b)
(c) (d)
The Kirchhoff integral solution of the wave equation can be expressed as,
(3)�
��� ���� � � � � � � �� A
P PP x y z P Az r vr t
where [P] is the integral of the seismic wavefield in the range A at /t r v /P z depends on the vertical variation of the seismic wavefield, and the second term is generally called the near-field source and mainly varies with 1/r2. The two terms in computation are often
and constitutes the basis of Kirchhoff migration. So Eq. (3) can be discretized as follows:
(4)out out out
in in in
( , , , 2 / )cos ( , , 0, / )
4
P x y z z vx y P x y z t r v
vr t
x y are horizontal and vertical trace intervals, and cos is the dip factor or direction factor, and 1/vr is the spherical spreading factor used for the corrections of amplitudes and phases. Eq. (4) implies that a reflector can be imaged at the positions with maximum amplitudes derived from the summations of seismic wavelets across the propagating path from source to receiver. However, the summations lead to a high-frequency reduction in Kirchhoff pre-stack migration (Tygel et al, 1994). Theoretically, the amplitude of any imaging point in the bin should equal to the stacked value of different offset tracks in the bin. The final imaging point lies in the point of tangency with the maximum amplitude and the amplitudes of other points are weakened. Practically, the high-frequency attenuation causes an increase of seismic wavelet duration and a decrease of vertical and lateral resolution. The diffraction stack principle is shown in Fig. 6.
Pet.Sci.(2013)10:195-204

199
The influence of Kirchhoff pre-stack migration on wavelet frequency mainly focuses on the weighting factors which include the wavefront spreading factor, dip factor (direction factor) and wavelet shaping factor (Bancroft, 2007). The wavefront spreading factor represents the amplitude attenuation when the wavelet propagates, and conventional preprocessing usually performs spherical spreading compensation. Therefore, this factor does not need to be applied in Kirchhoff migration. The dip factor (direction factor) has a maximum value at the apex of diffraction and has the largest contribution to integral summation. However, most cases proved that the aperture in Kirchhoff migration
imaging and diffraction convergence rely on diffraction
wave is identical to the left side of the diffracted wave in phase, whereas it has a 180° phase difference from the right side of the diffracted wave. Then, whether or not to use a
contrast between the migrated trace and corresponding well-
inter-beds imaging should eliminate the effect of spherical spreading factor, enhancing migration aperture, and determining the wavelet shaping factor from well-log curves.
2.3 Wavelet harmonizer deconvolutionDeconvolution is one of the standard processing steps.
The basic assumptions of deconvolution is minimum phase, invariance of seismic wavelet and white reflection coefficients, and the optimum Wiener filter based on minimum square norm can be designed for improving seismic
verified that a single-trace deconvolution algorithm cannot adapt to relative amplitude-preserved lithologic processing of inter-beds, and multi-trace processing should be used. For example, surface consistent deconvolution (SCDC) and multi-trace predictive deconvolution can basically achieve a vertical and lateral wavelet consistency and improve seismic
the optimal weighting factor, diffraction convergence in
and spatial inconsistency of wavelet in preprocessing will
beds imaging to a certain degree.Therefore, wavelet consistent processing is necessary
in CRP gathers are consistent, so single-trace predictive deconvolution is used for further improving resolution. Conventional single-trace deconvolution based on the assumption of a minimum-phase wavelet generally obtains the deconvolution operator from different time windows and leads to amplitude distortion in the boundaries of time
Fig. 8. In harmonizer deconvolution, the operator length and predictive distance are determined first, and then the deconvolution operator is calculated for every sampling point of the seismic trace, as shown in Fig. 8. The calculated deconvolution operators may vary in time and space, which
Fig. 6 Diffraction stack in Kirchhoff migration
1
2
1
2
s sc o
A
B
r
Summation
Tim
e (d
epth
)
Amp. X
To
T
t
Amp.
tt
(a) (b) (c)
Fig. 7 The effect of Kirchhoff migration on a seismic wavelet (a) Wavelet before migration, (b) Kirchhoff diffraction stack path, (c) Wavelet after migration
Pet.Sci.(2013)10:195-204

200
Fig. 8 Time windows of conventional (left) and harmonizer (right) deconvolution
Window1
Window2
Window3
Windows
can be regarded as a correction of wavelet inconsistency.
3 ApplicationThe Oriente Basin in Ecuador, South America, is a
foreland basin, with low-relief traps and sets of thin inter-
bed, whose origin is structural and sedimentary. The
conditions of seismic survey are plain, swamp and jungle, and a stable and horizontal refraction surface (refraction velocity is 2,000 m/s) exists. Apart from strong ground-roll waves, seismic noise mainly consists of low and high frequency abnormal noise distributed irregularly. The valid frequency ranges from 8 Hz to 45 Hz in the Y layer, and the
m/s. The processing task is to investigate contacting relations of thin inter-beds and identifying the lateral boundaries of the mudstone bed.
In preprocessing, a zone filter is used for eliminating ground-roll waves and suppressing low-frequency abnormal amplitudes. Based on spherical spreading compensation, surface-consistent amplitude processing including surface-consistent amplitude compensation (SCAC), zone amplitude
(SCDC) are applied for globally preserving horizontal changes of amplitudes. Along the Y layer, negative maximum amplitudes are extracted from the stacked volume after
appears unclear in Fig. 9(a). From Fig. 9(a), the horizontal boundary of the mudstone bed is not clear, abnormal amplitudes exist and the whole attribute is not balanced. We use inverse Q filtering before SCDC, a similar amplitude attribute extracted from the new migration volume shows that the abnormal amplitudes are suppressed and the sand blocks and mudstone bed become clear in Fig. 9(b). Fig. 10 shows the results of corresponding stack section and time-frequency spectra. We can see that inverse Q filtering can efficiently compensate high frequency information and improve the vertical and lateral resolution of thin inter-beds.
In Fig. 9(b), there are some abnormal sand blocks and the lateral resolution near the mudstone bed is low. According to
Fig. 9 (Grid unit: 25m×50m). (a) Before applying inverse Q filter, (b) After applying inverse Q
1 51 101 151 201 251 301
201
151
101
51
1
(b)
Pet.Sci.(2013)10:195-204
1 51 101 151 201 251 301
201
151
101
51
1
(a)
the above analysis of the Kirchhoff migration, we correct the
the spherical spreading compensation factor, decreasing the dip factor and adjusting the shaping factor with reference
to Fig. 9 is extracted along layer Y as shown in Fig. 11 and the waveform of the Y layer is compared with the well-
thin inter-beds does not have to correct the shaping factor, while the spherical spreading and dip factor play a key role in preserving amplitude attribute and improving the vertical resolution. Additionally, Fig. 12 also shows that the optimal weighting Kirchhoff migration protects the high-frequency and low-frequency reduction introduced by migration.
Although SCDC can be used to obtain lateral consistency
on the wavelets, Fig. 14(a) shows that the vertical resolution of the inter-beds is not high enough to separate thin layers and the amplitude spectra is still flat. In order to separate

201
1 51 101 151 201 251 301
201
151
101
51
1
Fig. 11(a) Conventional Kirchhoff migration, (b) Optimal weighting Kirchhoff migration
(a)
1 51 101 151 201 251 301
201
151
101
51
1
(b)
Pet.Sci.(2013)10:195-204
Fig. 10 Time-frequency spectra and sections of Inline No.50. (a) Before applying inverse Q Q
(a) (b)
0 25 50 75 100125
0.5
1.0
1.5
2.0
0 25 50 75 100125
0.5
1.0
1.5
2.0
21 41 61 81 101 121
1.2
1.4
1.6
1.8
161
2.0
21 41 61 81 101 121
1.2
1.4
1.6
1.8
161
2.0
Fig. 12
(a) (b) (c)
202
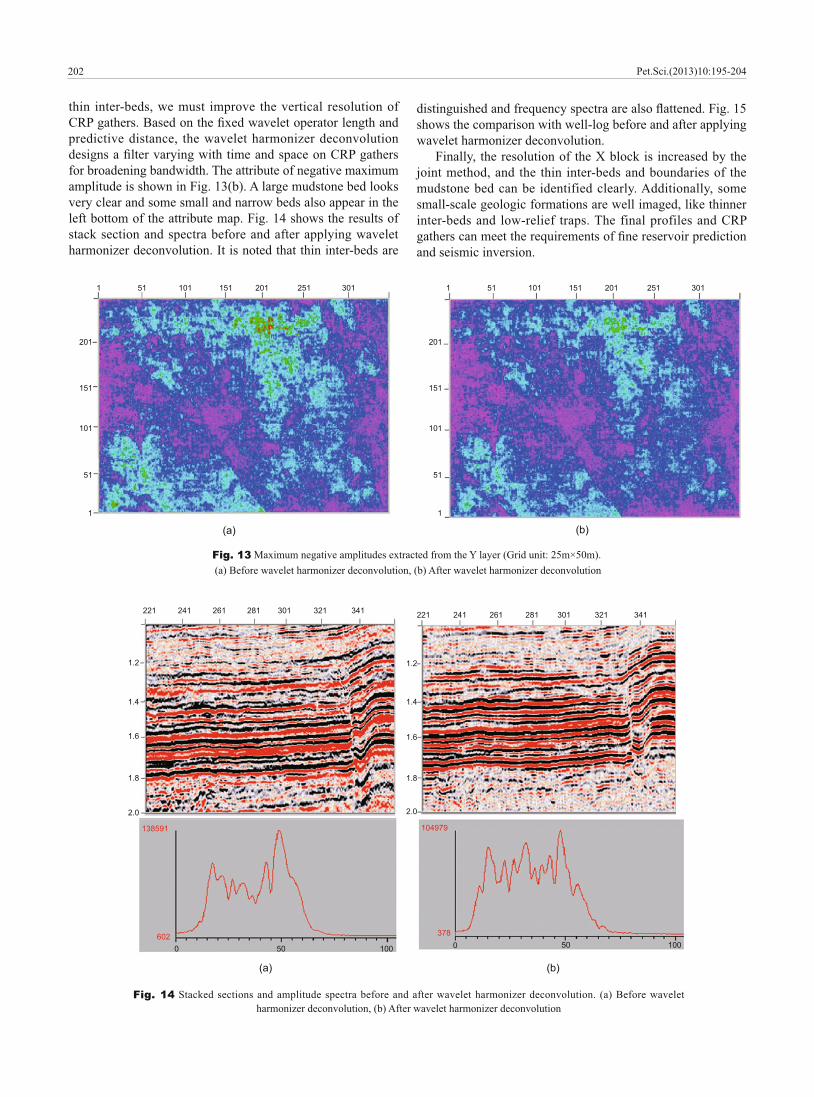
thin inter-beds, we must improve the vertical resolution of
predictive distance, the wavelet harmonizer deconvolution
for broadening bandwidth. The attribute of negative maximum amplitude is shown in Fig. 13(b). A large mudstone bed looks very clear and some small and narrow beds also appear in the left bottom of the attribute map. Fig. 14 shows the results of stack section and spectra before and after applying wavelet harmonizer deconvolution. It is noted that thin inter-beds are
Fig. 13 (a) Before wavelet harmonizer deconvolution, (b) After wavelet harmonizer deconvolution
(a)
1 51 101 151 201 251 301
201
151
101
51
1
1 51 101 151 201 251 301
201
151
101
51
1
(b)
Fig. 14 Stacked sections and amplitude spectra before and after wavelet harmonizer deconvolution. (a) Before wavelet harmonizer deconvolution, (b) After wavelet harmonizer deconvolution
221 241 261 281 301 321 341
1.2
1.4
1.6
1.8
2.0
(a) (b)
221 241 261 281 301 321 341
1.2
1.4
1.6
1.8
2.0
138591
6020 50 100
104979
3780 50 100
Pet.Sci.(2013)10:195-204
shows the comparison with well-log before and after applying wavelet harmonizer deconvolution.
joint method, and the thin inter-beds and boundaries of the mudstone bed can be identified clearly. Additionally, some small-scale geologic formations are well imaged, like thinner inter-beds and low-relief traps. The final profiles and CRP
and seismic inversion.

203
4 ConclusionsThin inter-bed imaging is a completely high-resolution
lithologic processing method and only joint high-resolution processing can accurately identify the thickness and borders of thin inter-beds. In addition, imaging of thin inter-beds is directly related to other steps of seismic processing and will fail if a wrong geometry definition, inaccurate
frequency broadening methods are used. In this paper, the joint high-resolution processing method based on amplitude preservation can effectively increase the resolution of thin inter-beds. The key of joint high-resolution method for imaging thin inter-beds lies in the following aspects:
1) Applying inverse Q filtering before SCDC can compensate for high-frequency loss and the amplitudes can reflect the lateral and vertical variations of subsurface lithology.
amplitude compensation, dip, and well-log data can retain the structural and lithologic characteristics of thin inter-beds and reduce frequency mixing.
3) Using wavelet harmonizer deconvolution on CRP gathers can globally unify the seismic wavelets and further enhance the vertical and lateral resolution of thin inter-beds.
Acknowledgements
senior engineer Duan Wensheng and senior engineer Liu
study.
References
Fig. 15 (a) Well No.2’s log, (b) Traces without wavelet harmonizer deconvolution, (c) Traces after wavelet harmonizer deconvolution
(a)
(b) (c)
data. Geophysics. 1996. 61(2): 600-604
Geophysics. 1999. 64(8): 1046-1053Cla rke G K C. Time-varying deconvolution filters. Geophysics. 1968.
33(6): 936-944Den g H L. Seismic wave propagation in thinly-layered media with steep
Di B R and Gu P C. Quantitative analysis of resolution of seismic
29(5): 23-32 (in Chinese)
2003. 46(4): 526-532 (in Chinese)Gou pillaud P L. An approach to inverse filtering of near-surface layer
effects from seismic records. Geophysics. 1961. 26(4): 754-760
111-117Kal lweit R S and Wood L C. The limits of resolution of zero-phase
wavelets. Geophysics. 1982. 47(7): 1035-1046
Geophysical Research. 1979. 82(1): 4737-4748Kna pp R W. Fresnel zones in the light of broadband data. Geophysics.
1991. 56(3): 354-359Kna pp R W. Vertical resolution of thick beds, thin beds, and thin-bed
cyclothems. Geophysics. 1990. 55(9): 1183-1190
broad frequency band seismic. Applied Geophysics. 2007. 4(2): 118-126
tuning. Geophysics. 2001. 66(4): 1274-1283
absorption estimation and seismic deconvolution. Ph.D. Thesis.
1153 (in Chinese)Oka ya D A. Spectral properties of the earth’s contribution to seismic
resolution. Geophysics. 1995. 50(1): 241-251
Pet.Sci.(2013)10:195-204

204
Pea cock K L and Treitel S. Predictive deconvolution: Theory and practice. Geophysics. 1969. 34(1): 155-169
Analysis. Beijing: Petroleum Industry Press. 2008 (in Chinese)
true wavelet inputs. Geophysics. 1945. 10(4): 207-220Ric ker N. Wavelet contraction, wavelet expansion and the control of
seismic resolution. Geophysics. 1953. 18(4): 769-792
beds. Geophysics. 1984. 49(4): 344-352Rob inson E A. Predictive decomposition of time series with application
to seismic exploration. Geophysics. 1967. 32(3): 418-484
Geophysics. 1985. 50(8): 1091-1099
phase signals. Geophysics. 1974. 39(6): 826-833
Geophysics. 1994. 59(10): 1561-1569
parameter estimation. Geophysics. 1985. 50(9): 1440-1455
dispersion. Geophysics. 1993. 58(8): 1167-1173
1998. 17(8): 1025-1030Von Seggern D. Depth-imaging resolution of 3-D seismic recording
patterns. Geophysics. 1994. 59(4): 564-576Wan g Y H. A stable and efficient approach of inverse Q filtering.
Geophysics. 2002. 67(2): 657-663
1180
Geophysics. 1982. 47(8): 1160-1173
holography applied to seismic imaging. Geophysics. 1987. 52(1): 11-25
(Edited by Hao Jie)
Pet.Sci.(2013)10:195-204