Embed Size (px)
Citation preview

Economic Insights – Trends and Challenges Vol.V(LXVIII) No. 1/2016 15 - 38
Does Financial Sector Development Drive Economic Growth in a Post-Communist Economy?
Evidence from Ethiopia
Dejene Mamo Bekana
Assistant professor at Ethiopian Civil Service University, CMC Road; P.O.Box:5648 Addis Ababa, Ethiopia e-mail: [email protected]
Abstract
This empirical investigation using VAR approach and Johnson co integration found that financial development indictors are with negative coefficient and insignificant in the long run. In the long run degree of openness and government spending are the most important forces behind economic growth in Ethiopia. In the short run model, however, there exists strong evidence that domestic credit to the private sector, degree of openness, broad money or monetization, inflation rate and government spending are the prime sources of economic growth. The study concludes that financial sector development has a growth-stimulating effect on Ethiopian economy. However, the financial sector development in Ethiopia did not reach the minimum level needed to support long run economic growth. Hence, the paper recommends that encouraging saving culture should be pursued while facilitating the intermediation function of banking institutions to channel saving to its productive uses through financing growth enhancing investment projects. It also suggests that the regulatory and supervisory framework for the financial sector should be strengthened to ensure public confidence and improve the contribution of the financial sector to economic growth.
Keywords: Financial sector development; Economic Growth; Ethiopia; Unit Root Test; Co-integration test; Error Correction Mechanism (ECM)
JEL Classification: F10; F20; F21; F23
Introduction
Financial sector development is considered one of the basic ingredients needed for economic growth and development. That is because, the development of financial sector of the economy determines the level of local saving channelled to productive investments in local business. The ability of the financial sector of the economy to provide capital for investment is essential determinant of economic growth and transformation. For a developing economy like Ethiopia the national saving is very low and insufficient to finance the development need necessitating financial sector development and attraction of foreign direct investment. The growth models of Harrod (1939) and Domar (1946) explain that capital formation raises the standard of living, which in turn results in higher growth. Criticizing the growth models proposed by Harrod and Domar on the ground of the fixed proportion of factors of production and substitutability between labour and capital, Solow (1956) argued that capital formation increases labour

16 Dejene Mamo Bekana productivity in a dynamic process of investment growth. Different growth theories such as Lucas (1988) and Rebelo (1991) broaden the definition of capital to include human capital and the accumulation of knowledge. Similarly, Romer (1986; 1990) and Helpman and Grossman (1991) incorporate knowledge capital gained through research and development to explain growth along with other variables.
Saving mobilized in an economy is one of the many indicators of financial sector development. In transition economies financial sector development demands institutional and economic reforms to improve the performance of formal institutions and thereby enhance economic growth. Theoretically, financial development is linked to growth as a result of the enormous functions it provides including intermediation, reduction of transaction costs, and possibility for diversification. The overall outcome of these functions are improved accumulation of capital, efficient allocation of economic resources and improvement in technological capability which are essential for economic growth (Bagehot, 1873; Schumpeter, 1912; Levine and Zervos, 1998; King and Levine, 1993. Foreign direct investment in modern development finance theory is considered an alternative source of capital to bridge the gap between savings and the required investment level (Aryeetey and Udry, 2000). Foreign direct investment has been widely recognized as a growth-enhancing factor in the developing countries (Enisan Alinlo, 2004). Advocators of foreign direct investment argue that it fills savings deficiency, foreign exchange and local revenue gaps of developing economies. Empirical literature with this regarded (OECD 2003, Douglas etal 2003) proved that foreign direct investment enhances factor productivity, the efficiency of resources use and national income of the host country. Inward-looking development strategy discouraged trade as well as foreign direct investment and had deleterious effects on economic growth and living conditions (Rodrik, 1998). Because of these reasons (Asiedu 2003; Adeolu Ayanwale 2007), many developing countries are now actively seeking foreign investment by taking measures that include economic and political reforms designed to improve their investment environment.
However, in transition economies the institutional and legal frameworks are too weak to serve and support the improvement of the financial sector through supervision, regulation and enhancing competition. Government imposed restrictions adversely affect the financial development. Susan Creane and etal. (2004), in developing countries there are various government imposed restrictions that undermine financial development including inflation taxation, high required reserves ratios, subsidized or directed credit, collusive contracts between public enterprises and banks, credit rationing, and ceilings on deposit and loan interest rates. The ultimate effect of such restrictions is retarded economic growth (see: Roubini and Sala-i-Martin ,1992; Khan and Senhadji, 2000; Favara, 2003).
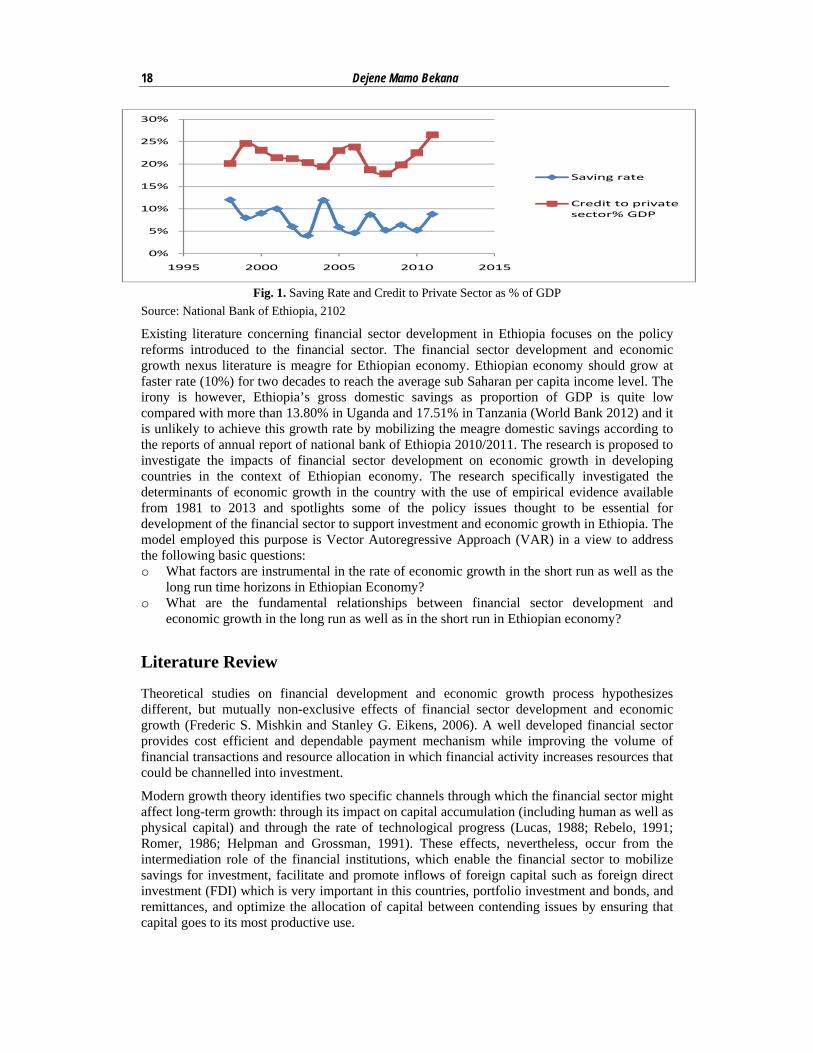
Ethiopia as a post-communist economy started transition to market economy in 1991 with landmark reforms introduced in 1991. Since then, (Solomon Woldemeskel, 2008), the government has made a broad range of policy reforms, including liberalization of foreign trade regime, decentralization of economic & political power, deregulation of the financial sector and deregulation of domestic price and devaluation of the national currency. The Ethiopian government has realized the inadequacy of domestic saving (see: Figure-1) for financing the required investment to achieve the desired economic growth and has considered encouraging the development of the financial sector and opening the economy to foreign investors.
Overview of the Ethiopian Financial System
The financial system connotes the conglomeration of institutions, markets, instruments, and operators that interact within an economy (Frederic S. Mishkin and Stanley G. Eikens, 2006). It is saddled with the responsibility of managing the payments system, capital formation and enhancing the effectiveness of the monetary policy. The paramount responsibility of the

Does Financial Sector Development Drive Economic Growth in a Post-Communist Economy? … 17 financial system is, however, financial intermediation between surplus and deficit units. Over the years since 1991, the Ethiopian financial system has experienced significant change in terms of ownership, structure, the depth and breadth of available instruments, the number of institutions established, and the regulatory framework within which the system operates.
The financial system in Ethiopia has also improved following rapid growth in the number of participating institutions including the scope and services rendered. Essentially, the system comprises the regulatory authorities, banks, non-bank financial institutions with non-existent financial markets. The non-existence of financial markets means the monetary policy relies more or less on the banking system. The regulatory authorities, whose role is crucial for the functioning and orderly development of the financial sector includes the Federal Ministry of Finance and economic development and the national bank of Ethiopia. Except for the banking industry, the majority of operators in the nation’s financial system are considerably small in size. There is a dearth of long-term funds in the industry. While banks seem to be well-capitalized, the insurance industry until very recently was plagued by under-capitalization. Although competition has been minimal across all the sub-sectors in the financial sector, it is becoming more intense in the banking sub-sector during the recent years because of new entry. Entering barriers are high for banking sector but relatively moderate and low for insurance industry in Ethiopia.
Regarding financial sector development, the Ethiopian banking system continued to perform well. Consequently, the number of banks operating in the country reached 17 as of 2011. Of the total banks, 14 were privately owned. The number of bank branches reached 970. About 23 percent of the public banks and 49 percent of private bank branches were concentrated in the capital city; Addis Ababa. Ethiopia is still one of the most under banked countries in the world with one bank branch serving 82,474 people in 2011. This is a record declined from 17,474 people to bank branch ratio in 2010 as a result of increase in banks branch network. However, it is very low in comparison with one bank branch serving about 19,330 people in Kenya and 15,539 people in Nigeria in 2011(World Bank, 2012). Banks operating in the country has registered high profit, enhanced their resource mobilization, expanded their capital base, disbursed significant amount of credit and reduced their non-performing loans to a minimum level. Accordingly, deposit mobilized by the banking system surged 42.5 percent and their outstanding loans rose by 24.7 percent in 2011. During same fiscal period new loans disbursed amounted to Birr 42.2 billion, about 46.0 percent higher than the preceding year. Excess reserves scaled up by 16.1 percent to reach at Birr 7.3 billion compared to 6.3 billion a year earlier as a result of enhanced deposit mobilization and loan collection by banks. Total capital of the banks reached Birr 15.9 billion. The share of private banks in total capital was Birr 7.23 billion accounting for 44 percent.
The number of insurance companies increased to 14 as two more private insurance companies were opened in 2011. Their branch network reached 221 following the opening of 11 additional branches during the same period. Except 1, all the other insurance companies with a branch network of 81.4 percent were privately owned. The total capital of insurance companies reached Birr 955.7 million of which private insurance companies accounted for about 70 percent. About 51 percent of the insurance companies were located in the capital, Addis Ababa.
As for microfinance institutions, their number increased to about 31. Their total capital and assets reached Birr 2.9 billion and Birr 10.2 billion, registering 24 and 27.6 percent annual growth, respectively. Their credit extension at Birr 7 billion in 2011 going to finance poverty reduction programs. They mobilized deposits to the tune of Birr 3.8 billion the same year which rose 42 percent over previous period performance. These developments clearly witness the growing role of Micro Finance Institutions.
18 Dejene Mamo Bekana
0%
5%
10%
15%
20%
25%
30%
1995 2000 2005 2010 2015
Saving rate
Credit to private sector% GDP
Fig. 1. Saving Rate and Credit to Private Sector as % of GDP Source: National Bank of Ethiopia, 2102
Existing literature concerning financial sector development in Ethiopia focuses on the policy reforms introduced to the financial sector. The financial sector development and economic growth nexus literature is meagre for Ethiopian economy. Ethiopian economy should grow at faster rate (10%) for two decades to reach the average sub Saharan per capita income level. The irony is however, Ethiopia’s gross domestic savings as proportion of GDP is quite low compared with more than 13.80% in Uganda and 17.51% in Tanzania (World Bank 2012) and it is unlikely to achieve this growth rate by mobilizing the meagre domestic savings according to the reports of annual report of national bank of Ethiopia 2010/2011. The research is proposed to investigate the impacts of financial sector development on economic growth in developing countries in the context of Ethiopian economy. The research specifically investigated the determinants of economic growth in the country with the use of empirical evidence available from 1981 to 2013 and spotlights some of the policy issues thought to be essential for development of the financial sector to support investment and economic growth in Ethiopia. The model employed this purpose is Vector Autoregressive Approach (VAR) in a view to address the following basic questions: o What factors are instrumental in the rate of economic growth in the short run as well as the
long run time horizons in Ethiopian Economy? o What are the fundamental relationships between financial sector development and
economic growth in the long run as well as in the short run in Ethiopian economy?
Literature Review
Theoretical studies on financial development and economic growth process hypothesizes different, but mutually non-exclusive effects of financial sector development and economic growth (Frederic S. Mishkin and Stanley G. Eikens, 2006). A well developed financial sector provides cost efficient and dependable payment mechanism while improving the volume of financial transactions and resource allocation in which financial activity increases resources that could be channelled into investment.
Modern growth theory identifies two specific channels through which the financial sector might affect long-term growth: through its impact on capital accumulation (including human as well as physical capital) and through the rate of technological progress (Lucas, 1988; Rebelo, 1991; Romer, 1986; Helpman and Grossman, 1991). These effects, nevertheless, occur from the intermediation role of the financial institutions, which enable the financial sector to mobilize savings for investment, facilitate and promote inflows of foreign capital such as foreign direct investment (FDI) which is very important in this countries, portfolio investment and bonds, and remittances, and optimize the allocation of capital between contending issues by ensuring that capital goes to its most productive use.

Does Financial Sector Development Drive Economic Growth in a Post-Communist Economy? … 19 Schumpeter (1934) stressed the role of the banking sector as a financier of productive investments and thus as an accelerator of economic growth. Greenwood and Jovanovic (1990), Levine (1997 & 1991), and Smith (1991) have all constructed theoretical models wherein efficient financial markets improve the quality of investments and enhance economic growth. Specifically, Bencivenga & Smith (1991), and King and Levine (1993) hold the view that financial intermediaries help increase the rate of technological progress by identifying and thus allocating capital towards those innovations with the best chances of succeeding.
Since 1991 restriction were removed by the Ethiopian policy makers at least partially if not totally and currently the government in Ethiopia has put policies congenial for attraction of foreign direct investment. However, the financial sector, the commercial sector and services businesses are protected and reserved only for Ethiopian citizens and the Ethiopian government amounting to restriction of capital inflows in the form of foreign direct investment. Empirical investigations suggest three different forms of causal direction between growth and financial development. First, the Harrod-Domar growth model would lead to a hypothesis of one-way association running from financial development to growth. This has been confirmed by Sylla (1999) with investigation of the historical role of finance in the U.S from 1790-1850 which culminated to conclusive evidence for finance led growth. Rousseau (1999) also proved similar result by investigating the Meiji era of Japan (1868-1884). Shan, et al (2001) conclusion that economic growth causes China’s financial development confirms this relationship. There has also been evidence of bidirectional causality between economic growth and financial development (Bencivenga and Smith, 1991; Gurley and Shaw 1960).
There are many alternative indicators that were used in various studies related to financial development. All the indicators for this research are selected from the banking sector because the financial sector in Ethiopia is solely composed of financial institutions (i.e. Depository and non-depository institutions) and financial markets are non-existent. Many researchers in economic literature (Asterio, 2003; Shan, 2002; Masih, 2008) used Ratio of broad money base (M2) to nominal GDP as an indicator of banking sector development. However, there has been controversy over this measure for its extensive uses of currency outside the banking system rather than an increase in bank deposits. Recent research in banking sector development (Abu-bader et al., 2005; khan et al., 2005) shifted its focus to exclusion of currency in circulation from this measure. Hence, this research uses the ratio of broad money base (M2) less currency in circulation to Nominal GDP as one of the indicators for financial sector development. The other indicator of banking sector development is the Ratio of Domestic Credit to Private Sector businesses to the Nominal GDP. Because it is measure of the quantity and quality of the investment financed by the banking sector previous studies used it as a proxy indicator of financial sector development (Levine, 1999; Abu-Bader and Abu-Qarn, 2005; Beck, et al., 2000; Shan, 2002; Erdal and Hyougsoo, 2007). The asset with the central bank is also essential indicator of the importance of overall financial services and the strength of financial system of a country. However, the ratio of assets with the central bank to nominal GDP is excluded from this study due to lack of complete data for the study period.
Empirical literature shows that trade openness or liberalization affects output growth. Most of the studies have concluded that the openness of the trade regime has positive relation with GDP growth (Ahmed Yusuf and Anoruo Emmanuel, 2000; Edwards, S., 1998; Harrison, A., 1996; Iscan, Talan, 1998; Santos Paulino, 2002; Wacziarg R., 2001; Yanikkaya Halit, 2003). High and stable output growth and low inflation are the two main goals of macroeconomic policy. Empirical studies, including Christoffersen and Doyle (1998), Sarrel (1995) and Fisher, 1993), explored this issue and found different results. In particular, medium and high inflation hampers economic growth due to the adverse impact on efficient distribution of resources by changing relative prices (Fisher, 1993). However, low inflation levels promote economic growth by making prices and wages more flexible (Lucas, 1973).

20 Dejene Mamo Bekana
Research Methodology and the Model
The model employed is based on prime considerations of incorporation of all essential variables explained in the conceptual framework and literature section of the paper and keep it straight and effective in explaining the impact of financial sector development on economic growth in Ethiopia. Under these considerations, the following variables are used to develop Real economic growth model: inflation, broad money Relative to GDP, domestic credit to the private sector
Relative to GDP, government Spending Relative to GDP )(GS and degree of openness (i.e. export less import) Relative to GDP. Even though foreign direct investment has been instrumental in economic growth and development in Ethiopia pursuant to the 1992 partial economic liberalization (see: Figures 2 and 3 in the appendix), it is excluded from the model built for this study because of lack of data for pre 1992 periods of the series covered. Accordingly, the basic VAR model developed and estimated is as follows:
[ ] [ ]
[ ] [ ] [ ] t
k
jjjt
k
jjjt
k
jj
jt
k
jjjt
k
jjt
jtTRADEINFLGS
BMBDCPSGDPG
11
61
51
4
13
1202
)ln()ln()ln(
)ln()ln()ln(
εμμμ
μμμ
+++
+++=
−∑∑∑
∑∑
=−
=−
=
−=
−=
(1)
In the equation, inflation ( INFL ), broad money Relative to GDP )(BMB , domestic credit to the
private sector Relative to GDP )(DCPS , gross domestic product growth rate with one period
lag ( 1−GDPG ), government Spending Relative to GDP )(GS and trade (i.e. export less import) Relative to GDP are used to explain gross domestic product growth rate. k is, is the appropriate lag length in the system determined by lag length criteria, mainly Akaike and Schwarz
information criteria and t1ε is a white noise error.
The variables in the model are determined to be co integrated of order I(1)(see: Tables-1a and 1b in the appendix) and hence, the appropriate modelling strategy is vector error correction model (VECM). The VECM is estimated once the number of cointegrating relationships in the VAR model is determined. The resulting error correction model (ECM) can be specified as follows:
( )[ ] [ ] [ ]
[ ] [ ] (
)2........())ln()ln()ln()ln(
)ln()ln()ln()ln(
)ln()ln(ln)ln(
115141312
111201
61
5
14
13
1202
ttttt
tt
k
jjjt
k
jj
jt
k
jjjt
k
jjjt
k
jjt
TRADEINFLGSBMB
DCPSGDPGTRADEdINFLd
GSdBMBdDCPSdGDPGd
jt
εββββ
ββαμμ
μμμμ
+−−−
−−++
++++=
−−−−
−−=
−=
−=
−=
−=
−∑∑
∑∑∑
Where α is the error correction parameter and measures the speed by which economic growth
adjusts for last period’s disequilibria, d indicates the variable in regular first differences and iβ are coefficients of the long run relationship in the system.

Does Financial Sector Development Drive Economic Growth in a Post-Communist Economy? … 21
Empirical Analysis
The data consist of annual series of all the variables in the model. The variable series cover the annual period of 1981 to 2013. These data will be from the IMF’s International Financial Statistics and the National Bank of Ethiopia Bulletin. Data for all variables were taken in logarithmic form. In order to identify the problem of serial correlation, the Breusch-Godfrey Serial Correlation LM test was applied. Further, residual series were examined by using Augmented Dickey Fuller Test. The VAR and single equation error correction methods of estimation were used for this analysis.
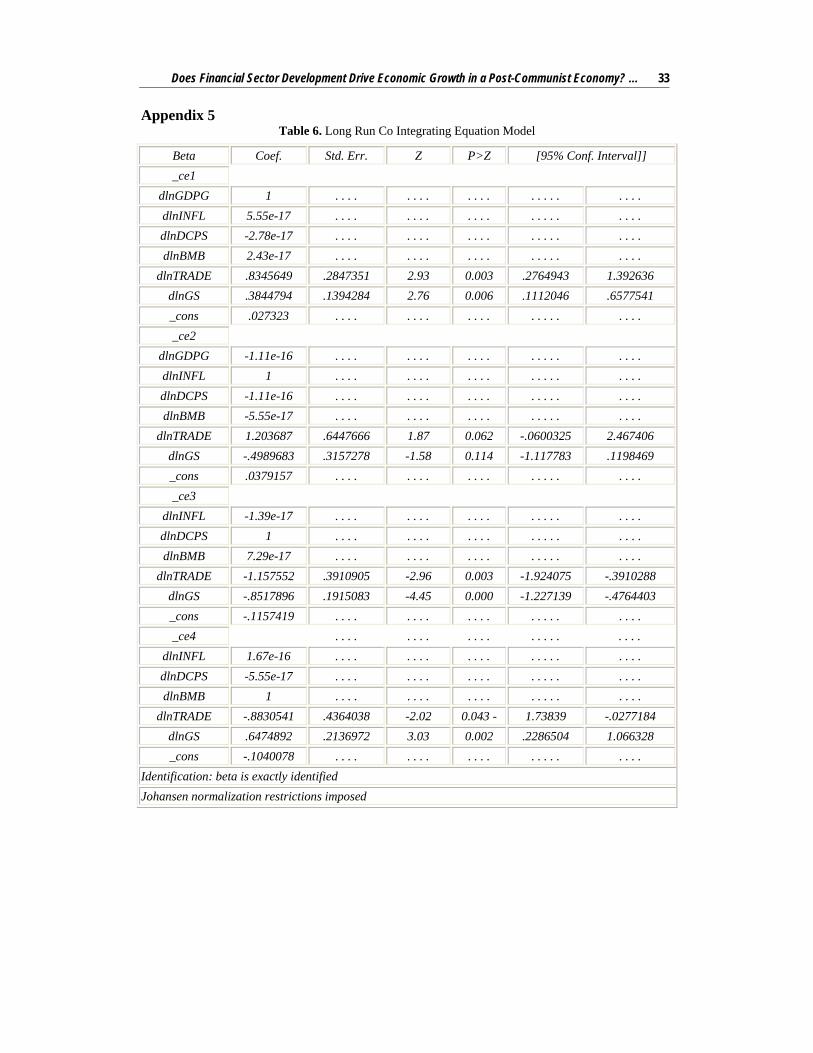
The Johansen procedure test results1 for cointegration with two lags2 in the system indicates strong evidence for existence of at most two co integrating relationships. Both trace and maximum eigenvalue tests fail to reject the null of at most two co integrating equations in the system. The trace and maximum eigenvalue test statistics are given in Appendix 4. The result implies that long-run relationship exists among GDP growth rate (GDP), inflation rate (INFL), broad money (BM), government Spending (GS), domestic credit to the private sector (DCPS) and trade (TRADE). This is because the critical value at 5% is less than the likelihood ratio. Therefore, the hypothesis of no co-integration has been rejected at 5% significance level. The Johansen procedure test results for Cointegration with two lags in the system indicates that there are four cointegrating relationships.
Table 4. Long Run Co Integrating Equation Model
Beta Coef. Std. Err. Z P>Z [95% Conf. Interval]] _ce1
dlnGDPG 1 . . . . . . . . . . . . . . . . . . . . . dlnINFL 5.55e-17 . . . . . . . . . . . . . . . . . . . . . dlnDCPS -2.78e-17 . . . . . . . . . . . . . . . . . . . . . dlnBMB 2.43e-17 . . . . . . . . . . . . . . . . . . . . .
dlnTRADE .8345649 .2847351 2.93 0.003 .2764943 1.392636 dlnGS .3844794 .1394284 2.76 0.006 .1112046 .6577541 _cons .027323 . . . . . . . . . . . . . . . . . . . . . _ce2
dlnGDPG -1.11e-16 . . . . . . . . . . . . . . . . . . . . .
1 The unit root tests conducted revealed that all variables have unit root in their level, except inflation and GDP Growth Rate and hence they are not stationary. As a result, the variables have to be differenced to achieve stationary so that the regression does not suffer from mixed order of integration. The researcher then conducted the Augmented Dickey-Fuller (ADF) and Phillip Perron tests on the first difference of the time series data. From the test results on the first difference given in Tables 1a and 1b in the appendix, the null hypothesis has been rejected because of the fact that all variables become stationary at their first difference. The result is confirmed using Augmented Dikey-Fuller (ADF) and Phillip Peron tests. As the Unit root tests revealed that all variables used in this study are stationary at their first difference. Thus, the determination of co integrating relationships doesn’t suffer from mixed order of integration. The existence of co integrating vectors in the model was tested using the residual based Dickey-Fuller approach (Engel and Granger, 1987). 2 In determining the number of cointegrating relationships the lag length used is 2 as determined using various information criteria. Appendix 3 shows the results from various VAR lag length selection criteria used in determining the lag length of the model. As can be seen from the table below LR, FPE, HQ, AIC and SC criteria indicate that the appropriate lag length is two. To complement the information criteria above model reduction tests were conducted and the appropriate lag length is identified to be two.

22 Dejene Mamo Bekana
Table 4 (cont.)dlnINFL 1 . . . . . . . . . . . . . . . . . . . . . dlnDCPS -1.11e-16 . . . . . . . . . . . . . . . . . . . . . dlnBMB -5.55e-17 . . . . . . . . . . . . . . . . . . . . .
dlnTRADE 1.203687 .6447666 1.87 0.062 -.0600325 2.467406 dlnGS -.4989683 .3157278 -1.58 0.114 -1.117783 .1198469 _cons .0379157 . . . . . . . . . . . . . . . . . . . . . _ce3
dlnINFL -1.39e-17 . . . . . . . . . . . . . . . . . . . . . dlnDCPS 1 . . . . . . . . . . . . . . . . . . . . . dlnBMB 7.29e-17 . . . . . . . . . . . . . . . . . . . . .
dlnTRADE -1.157552 .3910905 -2.96 0.003 -1.924075 -.3910288 dlnGS -.8517896 .1915083 -4.45 0.000 -1.227139 -.4764403 _cons -.1157419 . . . . . . . . . . . . . . . . . . . . . _ce4 . . . . . . . . . . . . . . . . . . . . .
dlnINFL 1.67e-16 . . . . . . . . . . . . . . . . . . . . . dlnDCPS -5.55e-17 . . . . . . . . . . . . . . . . . . . . . dlnBMB 1 . . . . . . . . . . . . . . . . . . . . .
dlnTRADE -.8830541 .4364038 -2.02 0.043 1.73839 -.0277184 dlnGS .6474892 .2136972 3.03 0.002 .2286504 1.066328 _cons -.1040078 . . . . . . . . . . . . . . . . . . . . .
Identification: beta is exactly identified Johansen normalization restrictions imposed
Source: authors’ computation using Eviews 7
Weak stationary tests are conducted for identifying the cointegrating equations. The tests conducted for the purpose are VEC Granger Causality/Block Exogeneity Wald Test and VEC coefficient restrictions. The former revealed that dlnDCPS, dlnTRADE, and dlnGS are weakly exogenous in the estimated model. The results of VEC Granger Causality/Block Exogeneity Wald Test are given in Table 5.
Table 5. VEC Granger Causality/Block Exogeneity Wald Test
Equation Chi2 Df Prob > chi2 Conclusions dlnGDPG 41.759 5 0.000 Endogenous dlnDCPS 9.153 5 0.103 Weakly Stationary dlnBMB 32.646 5 0.000 Endogenous
dlnTRADE 1.4127 5 0.923 Weakly Stationary dlnGS 2.5016 5 0.776 Weakly Stationary
dlnINFL 13.771 5 0.017 Endogenous
Source: authors’ computation using Eviews 7
From Table 5 it can be understood that the last two potential cointegrating equations (ce3 and ce4) are long run equations of weakly exogenous variables and, thus, should not enter the short run model as error correction terms. Zero restrictions on the long run adjustment coefficients of

Does Financial Sector Development Drive Economic Growth in a Post-Communist Economy? … 23 ce3 and ce4 after normalizing for dlnGDPG are found to be binding, confirming that there are only two cointegrating relationships in the long run model.
Diagnostic tests were conducted to test the adequacy of the model. The model satisfies all diagnostic tests. Autocorrelation tests indicate that there is no problem of autocorrelation. The null of no serial correlation at lag order of 8 cannot be rejected using LM test. On top of that, the residuals of the model are homoskedastic as the null of homoskedastic residuals cannot be rejected using White Heteroskedasticy (no cross terms) test. Jarque-Bera test of residual normality cannot reject the null of multivariate normal residuals implying that the residuals of the model are also normally distributed.
Implications of the Model
As can be seen from the cointegration equation-1 and 2, domestic credit to the private sector and monetization are negatively associated to economic growth. The positive coefficient for monetization in co integration equation-1 is not acceptable as credit growth is just the counterpart of money growth. The coefficients of the domestic credit to the private sector and monetization are found to be insignificant in contrary to the priori expectations. The reaction of economic growth to one percent change in domestic credit to the private sector induces over 2.78e-17 percent of GDP growth rate. The unexpected negative insignificant coefficient for domestic credit to the private sector and monetization can be explained by the low development of the intermediation function of financial institutions in particular and low development of the financial sector in general. The 26% domestic credit to the private sector in Ethiopia is lower as a comparator to 37.5% in Nigeria 28% in Ghana in 2011 in lieu of the World Bank world development indicators report of the 2012. Certain minimal level of financial sector development should be reached so that it can support long term economic growth. In Ethiopia, this result implies that the minimal level of financial sector development needed to support long term economic growth is yet to emerge. Domestic credit to the private sector leads to economic growth and development through financing investment. To the extent to which entrepreneurs and industrialists can have easy access to capital for financing their projects, investment is enhanced leading to economic growth and development. The insignificant coefficient of monetization implies that increase in monetization does not necessarily results in economic growth. This means the intermediation function of the financial sector is essential to channel available funds for financing investment and economic growth. Generally, the result revealed that monetization without efficient and effective intermediation process may not bring the desired outcome in terms of investment and economic growth.
Inflation, trade and government spending all have the expected signs and the coefficients are significant except for inflation. For one percent inflation rise, economic growth increases by over 5.55e-17 percent. The insignificance of inflation indicates the importance of optimal inflation in Ethiopian economic growth. Inflation is generally considered to be detrimental to economic growth because of macroeconomic instability which emerges as a result of inflationary pressure. However, if it does not result in overall macroeconomic instability inflation is important as investment pull factor leading to economic growth. Inflation is an indicator of demand for goods and services. Investors want to prove that there is demand deficiency in their investment decisions and optimum inflation that does not lead the macro economy to turmoil tells them that there is market for their produces.
Trade openness is by far the most determinant factor of economic growth in Ethiopia in the estimated equation. For one percent growth in trade, economic growth increases by over .835 percent. This result implies that outward looking growth and development strategy is viable to support Ethiopian economic growth. From the statistical evidence above, government spending is also found to be essential determining factor of economic growth. A one percent rise in

24 Dejene Mamo Bekana government spending results in the GDP growth responding by over .3845 percent. The finding suggests government spending has to be increased to achieve economic growth and development although the role of the state in the economy has been controversial for centuries. This result could be just because “public spending” is a direct component of GDP. But, a close look at the size and main features of the State in Ethiopia shows that most of public budget is allocated to finance growth enhancing capital projects than being consumed as recurrent expenditure (MOFED, 2011). Moreover, the sectoral allocations of resources indicate that social sector development (i.e. education and health care) and economic development spending receives major shares of the budget (ibid). This observation is consistent with empirical investigations by (Muritala T. and Taiwo A., 2011; Louis N. Sevitenyi, 2012; Alfonso A. and Alessandro T., 2005; Emmanuel C. Musaba, Pius Chilonda & Greenwell Matchaya, 2013) which proved positive association between government spending and economic growth. Muritala T. and Taiwo A.( 2011) using time series data from 1970 to 2008 for Nigerian economy found a long run association between public expenditure(i.e. capital as well as recurrent) and economic growth. Louis N. Sevitenyi (2012) confirmed this result for Nigerian economy using annual data from 1961-2009. Alfonso A. and Alessandro T., (2009) for a sample comprising 15 European Union countries over the 1970-2003 periods, proved a common long-term elasticity between cyclically-adjusted primary expenditure and potential output close to unity. Emmanuel C. Musaba, Pius Chilonda & Greenwell Matchaya (2013) analyzed the impact of sect oral government spending on Malawi’s economic performance using time series data from 1980 to 2007 and found positive and significant result for expenditure on agriculture and education. In Ethiopia evidence (see: figure-5) shows that private investment capital as a percent of public spending fluctuates between minimum of 35.05% in 1999 and maximum of 362.6% in 2008 with significant decline afterwards reaching 112.9% in 2011 as a result of explosion in public spending and fall in private investment capital. The government finances major portion of its expenditure with revenues mobilized from tax and non-tax sources. The fiscal deficit has never exceeded 1% of the GDP over the last decade with grants from international development partners accounted for as revenue (MOFED, 2011). For Ethiopia the evolution of free market supporting state institutions is a recent phenomenon. Since 1991 with the shift of the Ethiopian state from centrally planned to free market economic system, State provision of basic (stable) market institutions has been evolving and hence it can be argued that an increase in the size of the State may foster economic growth in the country. The size of the state in Ethiopia (Figure-3 in Appendix) is found to be 30% of the GDP in 2011 while the minimum ratio is found to be 10% over the study period. To summarize, the most important determinants of economic growth in Ethiopia are trade (i.e. export less import), government spending, inflation and domestic credit to the private sector in a descending order.
Error Correction Model
The error correction model (ECM) includes the present and lagged values of trade (i.e. export less import), government spending, inflation, monetization and domestic credit to the private sector. The general error correction model is specified as:
[ ] [ ] [ ]
[ ] [ ] )2.........()ln()ln(
)ln()ln()ln()ln(
50
4
03
02
01
t
m
ojjjt
m
jj
jt
m
jjjt
m
jjjt
m
jjt
ECMTRADEdINFLd
GSdBMBdDCPSdGDPGd
jtεδαα
αααθ
+++
++++=
−∑∑
∑∑∑
=−
=
−=
−=
−=
The estimated error correction model passes all diagnostic tests. Breusch-Godfrey Serial Correlation LM test indicates that the residuals of the estimated error correction model do not suffer from autocorrelation. This can also be confirmed by looking at the model’s
(3)

Does Financial Sector Development Drive Economic Growth in a Post-Communist Economy? … 25 autocorrelation function given in Appendix 7. Due to limited number of observations, the maximum lag length that can be used in the error correction model is two. In estimating the error correction model general to specific approach is adopted. Starting with three lags for all variables, the Current and lagged observations on variables are excluded from the final parsimonious model based on tests of coefficient significance. The parsimonious error correction model is given in Table 8 below:
Table 8. Co-integration in {I(1)} variables: Parsimonious Error Correction Model (ECM)
Source SS Df MS Number of obs =30 F( 20, 6) = 13.19
Model .583137293 20 .029156865 Prob > F = 0.0021 Residual .013264313 6 .002210719 R-squared = 0.9778
Total .596401606 26 .022938523 Adj R-squared = 0.9036 Root MSE = .04702
dlnGDPG Coef. Std. Err. T P>t [95% Conf. Interval] dlnDCPS .5157942 .0941727 5.48 0.002 .2853619 .7462265
dlnGS .2134273 .0591623 3.61 0.011 .0686623 .3581923 dlnINFL .1467349 .0413608 3.55 0.012 .0455286 .2479411
dlnBMBlag .7637712 .2927514 2.61 0.040 .0474342 1.480108 dlnTRADElag -.3984994 .1867172 -2.13 0.077 -.8553799 .0583812
ECM 1.00 .2079386 5.22 0.002 .5769411 1.594556 ECMlag .846353 .3961303 2.14 0.077 -.1229428 1.815649
_cons -.1843173 .0779016 -2.37 0.056 -.3749356 .006301
Source: authors’ computation using Eviews 7
The results in Table 8 appear to suggest that the entire explanatory variables except trade play significant roles in short run dynamics of economic growth in Ethiopia. The most important short run determinants of economic growth in Ethiopia are found to be inflation rate (INFL), government Spending (GS) and domestic credit to the private sector (DCPS). However, Trade (TRADE) and broad money (BM) doesn’t have a strong direct positive effect on short run economic growth. They affect short run economic growth through one period lagged values. This result is consistent with the view that in the absence of a well developed financial sector monetary transmission might take longer than would be with well developed financial sector as the intermediation process is only through banking institutions in Ethiopia. There is no well developed secondary financial market in Ethiopian economy to facilitate the intermediation process. Thus, the effect of monetary expansion may not be reflected in the short run economic growth. A one percent rise in broad money with one period lag results in economic growth responding by 0.764% with its coefficient significant at 5%. Gain from trade also demands longer period of transmission because the goods produced should be sold and transported to buyers in international markets to clear the transactions and realize the benefit.
The results of the short run model seem to suggest that for one percent increase in domestic credit to the private sector economic growth responds by above 0.516% with strong evidence of being significant at 5%. This implies that there is fast transmission of credit to the private sector to investment through financing entrepreneurial and industrial projects which are essential for economic growth.
Inflation positively impacts economic growth in the short run. For a one percent rise in inflation, economic growth reacts by nearly 0.147% increases. This implies that so long inflation does not cause macro economic instability it serves as growth enhancing factor. This is because there is
26 Dejene Mamo Bekana incentive for investors and producers to invest or produce more once they realized that there is no demand deficiency in the economy. More production and investment could generate new jobs contributing to economic growth for the country.
Government spending is found to be one of the key determining factors of economic growth in the short run model. The reaction of economic growth to one percent increase in government spending is above 0.21343% rise with strong evidence of significant coefficient at 5%. This result implies that government spending in Ethiopia is growth enhancing contrary to the controversy over impact of the size of the government on economic growth. The size of the State in Ethiopia: the ratio of public spending to GDP(Figure-4 in Appendix) and the time series structure of GDP and public spending(Figure-3 in Appendix) implies that state provision of basic market institution services has been important for economic growth. The size of the state varies between as minimum as 10% to a maximum as 30% of the GDP over the study period. In the case of this country therefore, the establishment of a modern and stable State (and market institutions) is usually taken as a pre-condition to achieve economic growth. Liberal policy advocates consider government size as detrimental to economic growth while Keynesians and Developmentalists argue for size of the government as important to drive economic growth. The finding is consistent with the latter because the stable state and market institutions are evolving since 1991 in Ethiopia.
The coefficients of the error correction terms are interpreted as speed of adjustment to long run equilibrium or the disequilibrium periodically transmitted to economic growth from the explanatory variables. The coefficient of the error correction term of the model is positive and exactly one. This means the speed of adjustment of the error to its own long run equilibrium is shown by the adjustment coefficient of unity implying that every year 100 percent of the disequilibrium in economic growth is adjusted. The positive adjustment coefficient implies that any disequilibrium in economic growth continuously grows making convergence difficult.
Conclusions and Policy Implications of Findings
The hub of the study is to determine the impact of financial sector development on economic growth in Ethiopian economy. A vivid observation of the results shows that the determinants of growth are: broad money supply, domestic credit to the private sector, government spending, trade openness and inflation rate in the short run while only trade openness and government spending are found to be significant in the long run
The implication of the positivity of broad money which is in consonance with the a priori expectation means that broad money supply is one of the sources of economic growth in the short run. In conformity with the a priori expectation, credit to the private sector is having a direct relationship with growth. This implies that financial sector development is an essential economic growth driver in Ethiopian economy in the short run. But the financial sector development did not reach the minimal level needed to support long run economic growth. This study therefore concludes that financial sector development has a growth-stimulating effect on Ethiopian economy. As a result, encouraging saving culture should be pursued while facilitating the intermediation function of financial institutions to channel saving to its productive uses through financing growth enhancing investment projects. It also suggests that the regulatory and supervisory framework for the financial sector should be strengthened to improve the contribution of the financial sector to economic growth and development.
The significant and positive coefficient of government spending implies that fiscal policy pursued is among important sources of growth that has been witnessed by the Ethiopian economy in recent years of more than a decade. This fact pinpoints that it is essential to align the government spending and fiscal policy to the economic growth objectives. The policy implication of this fact is that sound fiscal policy which enables the government to finance its

Does Financial Sector Development Drive Economic Growth in a Post-Communist Economy? … 27 spending in to growth enhancing investments while controlling the misuse of public resources has to be pursued. Control of corruption in the operation of public budget by public authorities is important while channelling government investment to pro poor sectors.
Trade openness is found to be the most important factor for economic growth in Ethiopia in the long run as well as the short run models. It is with the expected positive sign and significant at 5%. That is, export orientation is important determinant of economic growth in Ethiopia. The implication of this result is that it is essential to facilitate and support exporting to the international market.
Inflation is found to be an important variable that induces short run economic growth in Ethiopia. This means the inflationary experience in Ethiopian economy never brought general economic instability but served as an investment pool factor for it signifies to investors the demand for goods and services. It has been well documented in finance literature that inflation is detrimental to economic growth to the extent of the macro economic instability which arises as a result of general price instability. Hence, government intervention with policies and publicities that can effectively control over inflationary pressure with potential macroeconomic instability is essential to avoid the challenge that could be posed on economic growth and development. Therefore, in order to be able to curb the price instability challenges, it is essential to adopt conservative monetary growth. This may, however, restrict the government on fiscal front and engender problem of slower growth. Hence, finding the appropriate balance would be very important and the policy makers need to properly discharge their responsibility with this regard.
Acknowledgement
The author is grateful to Yidnekachew Wondimu, Professor Dr.Len Shackleton, Professor Dr.Juan Castaneda and the reviewers of the journal for their constructive comments on the earlier version of the paper. The usual caveats apply.
References
1. Afangideh, U. J., 2009. Financial Development and Agricultural Investment in Nigeria: Historical Simulation Approach, West African Journal of Economic and Monetary Integration, Vol. 9, June.
2. Ahmed, Y. and Anoruo, E., 1999-2000. Openness and Economic Growth: Evidence from Selected Asian Countries. The Indian Economic Journal 47, No. 3, pp. 110-117.
3. Alfonso, A. and Alessandro, T., 2009. Government expenditure and economic growth in the EU: long-run tendencies and short-term adjustment: European Union.
4. Arestis, P., 2007. Financial liberalization and the relationship between finance and growth, University of Cambridge.
5. Arestis, P. and Demetriades, P., 1996. inance and Growth: Institutional Aspects and Causality. University of East London Economic Working Papers, No.5.
6. Beck, T., Ross, L. and Loayza,, N., 2000, Finance and the Sources of Growth, Journal of Financial Economics, Vol. 58, pp. 261–300.
7. Bencivenga, V.R. and Smith, B.D., 1991. Financial Intermediation and Endogenous Growth. Review of Economic Studies, 582:403-44.
8. Besci, Z. and Wang, P., 1997. Financial Development and Growth, Economic Review 4th Quarter pp. 46-62.
9. Boyreau-Debray, G., 2003. Financial Intermediation and Growth: Chinese style. Policy Research Working paper No. 3027, World Bank.
10. Calderon, C., and Lin, L., 2003. The Direction of Causality between Financial Development and Economic Growth, Journal of Development Economics, Vol. 72,No. 1 October, pp. 321–334.
11. Christoffersen, P. and Doyle, P. From Inflation to Growth. Eight Years of Transition, IMF Working Paper No. WP/98/100, 1998.

28 Dejene Mamo Bekana 12. Christopoulus, D. and Tsionas, E., 2004. Financial Development and EconomicGrowth: Evidence
from Panel Unit Root and Cointegration tests. Journal of Development Economics 512:55-74. 13. De Gregorio, J. and Guidotti, P.E, 1995. Financial development and economic growth. World
Development, 233: 433-48. 14. Demetriades, P.O. and Hussein, K.A., 1996. Does Financial Development Cause Economic Growth?
Time-Series Evidence from 16 Countries. Journal of Development Economics, December, 387-411. 15. Domar, E.D., 1946. Capital Expansion, Rate of Growth and Employment, Econometrica, Vol. 14, pp
137-147. 16. Dunning, J.H., 1993. Multinational Enterprises and the Global Economy. Wokingham, England:
Addison-Wesley. 17. Edwards, S., 1998. Openness, productivity and growth: what do we really know? Economic Journal
108, pp. 383– 398. 18. Emmanuel, C. M., Pius, C. & Matchaya, G., 2013. Impact of Government Sectoral Expenditure on
Economic Growth in Malawi, 1980-2007: Journal of Economics and Sustainable Development Vol.4, No.2.
19. Favara, G., 2003. An Empirical Reassessment of the Relationship between Finance and Growth, IMF Working Paper 03/123 Washington: International Monetary Fund.
20. Fernandez, D. and Galetovic, A., 1994. Schumpeter Might Be Right – But Why? Explaining the Relation between Finance, Development and Growth. Johns Hopkins University Working Paper in International Economics No. 96-01.
21. Fisher, S., 1993. The Role of Macroeconomic Factors in Growth. Journal of Monetary Economics 323, pp.485-11.
22. Frederic, S. M. and Eikens, S.G., 2006. Financial markets and institutions, 5th edition Pearson international edition.
23. Fry, M. J., 1995. Money, Interest, and Banking in Economic Development Baltimore: Johns Hopkins, 2d. ed..
24. Goldsmith, R.W., 1969. Financial Structure and Development. New Haven: National Bureau of Economic Research.
25. Grosjan, P. and Senik, C., 2007. Should market liberalization precede democracy? Casual relations between political preference and development, Institute of labor study.
26. Grosjan, P and Senik, C., 2008. Democracy, Market Liberalization and Political Preferences, Paris School of Economics.
27. Groves, R.M., and McGonagle, K., 2001. A Theory-Guided Interviewer Training Protocol Regarding Survey Participation. Journal of Official Statistics, 17: 249-266.
28. Harrison, A., 1996. Openness and growth: a time series, cross-country analysis for developing countries. Journal of Development Economics 48, 419– 447.
29. Helpman, E. and Grossman, G.M., 1991. Innovation and Growth in the Global Economy, Cambridge MA, MIT Press.
30. Hicks, J., 1969. A Theory of Economic History. Oxford; Clarendon Press. 31. Hwee, K.C., Kriz, P.N. et al., 2007. Financial Liberalization and Monetary Policy Cooperation in
East Asia, School of Economics, Singapore Management University. 32. Iscan, T., 1998. Trade Liberalization and Productivity: A Panel Study of the Mexican Manufacturing
Industry. Journal of Development Studies, Vol. 34, No. 5, pp.123-148. 33. Ivo, B., Glogorov, V. and Krastev, I., 2003. State Public Sector and Development. Conference Paper
presented at the Understanding Reforms Workshop, January 16-17, 2003. 34. Josse Maria, F. and Popov, V., 2003. On the Philosophical, Political and Methodological
Underpinnings of Reforms. Conference Paper Presented at the Understanding Reforms Workshop, Cairo January 16-17, 2003.
35. Jung, W.S., 1986. Financial Development and Economic Growth: International Evidence. Economic Development and Cultural Change 34:333-46.
36. King, R. G., and Levine, R., 1993a. Finance, Entrepreneurship, and Growth: Theory and Evidence, Journal of Monetary Economics, Vol. 32, pp. 513–542.
37. King, R. G., and Levine, R., 1993b, Finance and Growth: Schumpeter Might be Right, Quarterly Journal of Economics, Vol. 108, pp. 717–738.
38. Khan, M. S., and Senhadji, A.S., 2000. Financial Development and Economic Growth: An Overview, IMF Working Paper 00/209 Washington: International Monetary Fund.
39. Levine, R., 1997. Financial Development and Economic Growth: Views and Agenda, Journal of Economic Literature, Vol. 35, No. 2, pp. 688–726.

Does Financial Sector Development Drive Economic Growth in a Post-Communist Economy? … 29 40. Levine, R., 2004. Finance and growth: theory and evidence: NBER Working Paper Series n.10766. 41. Likwelile, S., 1998. Private Investment, Macroeconomic Environment and Economic Growth in
Tanzania 1967-1995, Nairobi: African Economic Research Consortium, mimeo. 42. Louis, N. S., 2012. Government expenditure and economic growth in Nigeria: an empirical
investigation 1961-2009 The Journal of Economic Analysis Volume III, Issue I, Pages 38-51. 43. Lucas, R.E.J.,1988. On the Mechanics of Economic Development, Journal of monetary Economics,
22, pp.3-42. 44. Lucas, R. 1973. Some International evidence on Output-Inflation Tradeoffs. American Economic
Review, v.63, pp. 326334. 45. Lucas, R. E., 1988. On the Mechanics of Economic Development. Journal of Monetary Economics.
22. 3-42. 46. Mavrotas and Sang-Ik Son, 2004, Financial Sector Development and Growth: Re-examining the
Nexus Paper prepared for presentation at the XIII TorVergata International Conference on Banking and Finance, Rome, and December 2004.
47. Mtatifikolo, F., The Content and Challenges of Reform Programmes in Africa - the Case of Tanzania. University of Bremen.
48. Ministry of Finance and Economic Development MoFED, 2011. Annual Report, Addis Ababa, Ethiopia.
49. Muritala, T. and Taiwo, A. 2011. Government expenditure and economic development; empirical evidence from Nigeria: Munich personal archive MPRA NO.37293.
50. National Bank of Ethiopia (NBE), 2012. Annual Report. 51. Norman V. L. and Sotto, R., 2003. On the measurement of Market oriented Reforms, Paper
Presented at the Workshop on Understanding Reforms, Cairo January 16-17, 2003. 52. Nzotta, S.M and Okereke, E. J., 2009. Financial deepening and economic development of Nigeria:
An Empirical Investigation African Journal of Accounting, Economics, Finance and Banking Research Vol. 5.
53. O'Muircheartaigh. C., and Campanelli, P., 1998. The Relative Impact of Interviewer Effects and Sample Design Effects on Survey Precision. Journal of the Royal Statistical Society Series A, 161 1: 63-77.
54. Rebelo, S., 1991. Long-run Policy Analysis and Long-run Growth, Journal of Political Economy, 99, pp.500-521.
55. Rhodes, R.A.W., Binder, S.A. and Rockman, B.A. (Eds.), 2006. The Oxford Handbook of Political Institutions. New York: Oxford.
56. Romer, P.. 1986. Increasing Returns and Long-term Growth, Journal of Political Economy,Vol-94, pp 1002-1037.
57. Romer, P.. 1990. Endogenous Technological Change, Journal of Political Economy, Vol-98,pp. S71-S102.
58. Rosenbaum, P. R. and Rubin, D.B., 1983. The Central Role of the Propensity Score. Observational Studies for Causal E_ects. Biometrika 701: 41{55.
59. Rousseau, P. L and Sylla, R., 1999. Emerging Financial Markets and Early U.S Growth, NBER Working Papers 7448.
60. Rousseau, P.L. and Sylla, R., 2001. Financial Systems, Economic Growth, and Stabilization, NBER Working Paper No.8323, June.
61. Sarel, M., 1995. Nonlinear Effects of Inflation on Economic Growth. IMF Staff Papers, 43, pp.199-215.
62. Santos, P., 2002. Trade Liberalisation and Export Performance in Selected Developing Countries Journal of Developing Economics.
63. Schumpeter, J., 1912. The Theory of Economic Development, Cambridge, Mass,: Harvard University Press.
64. Shan, J.Z., Sun, F. and Jianhong, L, 2006. Does Financial Development Lead to Economic Growth? The case of China. Annals of Economics and Finance 1, 231-250.
65. Shan, J.Z., Sun, F. and Morris, A., 2001. Financial Development and Economic Growth. Review of International Economics 9, 443-54.
66. Shaw, E.S., 1973. Financial Deepening in Economic Development. New York; Oxford University Press.
67. Solow, R., 1956. A Contribution to the Theory of Economic Growth, Quarterly Journal of Economics, Vol. 701, pp. 65-94.
68. Xu, Z., 2000. Financial Development, Investment, and Growth. Economic Inquiry, 38:331-344.

30 Dejene Mamo Bekana 69. Wachtel, P. and Rousseau, P., 1998. Financial Intermediation and Economic Performance: Historical
Evidence from Five Industrialized Countries, Journal of Money credit and Banking Volume 30, Number 4.
70. Wacziarg R., 2001. Measuring the Dynamic Gains from Trade World Bank Economic Review Vol. 15, No. 3 2001.
71. Weingast, B.R. and Wittman, D. (Eds.), 2006. The Oxford Handbook of Political Economy, New York: Oxford.
72. World Bank, 2012. World Development Indicators Report 2011. 73. Yanikkaya, H., 2003. Trade Openness and Economic Growth: a cross country empirical
investigation, Journal of Development Economics 72, pp. 57-89.
Appendix
‐10
‐5
0
5
10
15
20
25
30
35
40
1992 1994 1996 1998 2000 2002 2004 2006 2008 2010 2012
FDI AS % GDP
GDP Growth rate
Fig. 2. Recent performance FDI as % GDP and GDP growth (National Bank of Ethiopia 2102)
0.00E+00
5.00E‐02
1.00E‐01
1.50E‐01
2.00E‐01
2.50E‐01
3.00E‐01
3.50E‐01
1975 1980 1985 1990 1995 2000 2005 2010 2015
Government spending as % GDP
Government spending as % GDP
Fig. 3. Recent performance of GDP and government spending (Ministry of Finance and Economic Development, 2011)

Does Financial Sector Development Drive Economic Growth in a Post-Communist Economy? … 31
0
5E+10
1E+11
1.5E+11
2E+11
2.5E+11
3E+11
3.5E+11
4E+11
1975 1980 1985 1990 1995 2000 2005 2010 2015
Government spending
GDP
Fig. 4. Recent performance of GDP and government spending (Ministry of Finance and Economic Development, 2011)
0.00%
50.00%
100.00%
150.00%
200.00%
250.00%
300.00%
350.00%
400.00%
1990 1995 2000 2005 2010 2015
Private investment capital as % of public spending
Fig. 5. Private investment as % of government spending (National Bank of Ethiopia, 2011)
Fig. 6. Private investment and government spending (National Bank of Ethiopia, 2011)

32 Dejene Mamo Bekana Appendix 1
Table 1a. Unit-Root Tests on Variables (Phillip Perron Tests)
At levels First differences
variable Without trend With trend Without trend With trend Order of
Cointegration
lnGDPG -4.158(-2.989) -5.073(-3.584) -8.461(-2.992) -8.275(-3.588) I(I) lnINFL -4.322(-2.989) -4.458(-3.584) -9.100(-2.992) -8.914(-3.588) I(I) lnDCPS -1.325(-2.989) -2.381(-3.584) -4.603 (-2.992) -4.514(-3.588) I(I) lnBMB -0.985 (-2.989) -1.186(-3.584) -3.277(-2.992) -3.266(-3.588) I(I)
lnTRADE -0.564(-2.989) -2.517(-3.584) -6.671(-2.992) -6.672(-3.588) I(I) lnGS -1.959 (-2.989) -2.415(-3.584) -4.115(-2.992) -3.961(-3.588) I(I)
Appendix 2
Table 1b. Unit-Root Tests on Variables (Augmented Ducky Fuller Tests)
At levels First differences
variable Without trend With trend Without trend With trend Order of
Cointegration
lnGDPG -4.216(-2.989) -4.958 (-3.584) -6.681(-2.992) -6.557(-3.588) I(I) lnINFL -4.336(-2.989) -4.491(-3.584) -7.273(-2.992) -7.134 (-3.588) I(I) lnDCPS -1.210 (-2.989) -2.146(-3.584) -4.621(-2.992) -4.533(-3.588) I(I) lnBMB -1.014(-2.989) -0.776 (-3.584) -3.390 (-2.992) -3.409(-3.588) I(I)
lnTRADE -0.805(-2.989) -2.549(-3.584) -6.524(-2.992) -6.497(-3.588) I(I) lnGS -1.804 (-2.989) -2.267(-3.584) -4.193(-2.992) -4.082(-3.588) I(I)
Appendix 3
Table 2. VAR Lag Order Selection Criteria
Lag LogL LR FPE AIC SC HQ
0 -11.308 NA 0.217018 -1.93324 -1.93324 -1.93324 1 -11.2401 0.13578 0.234777 -1.85867 -1.84515 -1.80991 2 -6.73766 9.0049* 0.178441* -2.13886* -2.11182* -2.04135* 3 -6.45203 0.57127 0.19044 -2.08171 -2.04115 -1.93545 4 -6.42641 0.05123 0.208047 -2.00376 -1.94967 -1.80874
Appendix 4
Table 3. Johnson Tests Results for Co Integration
Rank parms LL Eigenvalue trace statistic 5% critical value
0 42 4.649143 . 151.2373 94.15 1 53 37.743882 0.91383 85.0478 68.52 2 62 53.036744 0.67787 54.4621 47.21 3 69 65.416258 0.60028 29.7031 29.68 4 74 74.432307 0.48719 11.6710 * 15.41 5 77 79.044777 0.28941 2.4460 3.76 6 78 80.267788 0.08661
Indicates rejection of the null at 5% level of significance level Trace statistic or lowest likelihood Ratio test indicates 3 co-integrating equation(s) at 5% significance level
Does Financial Sector Development Drive Economic Growth in a Post-Communist Economy? … 33 Appendix 5
Table 6. Long Run Co Integrating Equation Model
Beta Coef. Std. Err. Z P>Z [95% Conf. Interval]] _ce1
dlnGDPG 1 . . . . . . . . . . . . . . . . . . . . . dlnINFL 5.55e-17 . . . . . . . . . . . . . . . . . . . . . dlnDCPS -2.78e-17 . . . . . . . . . . . . . . . . . . . . . dlnBMB 2.43e-17 . . . . . . . . . . . . . . . . . . . . .
dlnTRADE .8345649 .2847351 2.93 0.003 .2764943 1.392636 dlnGS .3844794 .1394284 2.76 0.006 .1112046 .6577541 _cons .027323 . . . . . . . . . . . . . . . . . . . . . _ce2
dlnGDPG -1.11e-16 . . . . . . . . . . . . . . . . . . . . . dlnINFL 1 . . . . . . . . . . . . . . . . . . . . . dlnDCPS -1.11e-16 . . . . . . . . . . . . . . . . . . . . . dlnBMB -5.55e-17 . . . . . . . . . . . . . . . . . . . . .
dlnTRADE 1.203687 .6447666 1.87 0.062 -.0600325 2.467406 dlnGS -.4989683 .3157278 -1.58 0.114 -1.117783 .1198469 _cons .0379157 . . . . . . . . . . . . . . . . . . . . . _ce3
dlnINFL -1.39e-17 . . . . . . . . . . . . . . . . . . . . . dlnDCPS 1 . . . . . . . . . . . . . . . . . . . . . dlnBMB 7.29e-17 . . . . . . . . . . . . . . . . . . . . .
dlnTRADE -1.157552 .3910905 -2.96 0.003 -1.924075 -.3910288 dlnGS -.8517896 .1915083 -4.45 0.000 -1.227139 -.4764403 _cons -.1157419 . . . . . . . . . . . . . . . . . . . . . _ce4 . . . . . . . . . . . . . . . . . . . . .
dlnINFL 1.67e-16 . . . . . . . . . . . . . . . . . . . . . dlnDCPS -5.55e-17 . . . . . . . . . . . . . . . . . . . . . dlnBMB 1 . . . . . . . . . . . . . . . . . . . . .
dlnTRADE -.8830541 .4364038 -2.02 0.043 - 1.73839 -.0277184 dlnGS .6474892 .2136972 3.03 0.002 .2286504 1.066328 _cons -.1040078 . . . . . . . . . . . . . . . . . . . . .
Identification: beta is exactly identified Johansen normalization restrictions imposed

34 Dejene Mamo Bekana Appendix 6
Table 7. VEC Granger Causality/Block Exogeneity Wald Test
Equation chi2 Df Prob > chi2 Conclusions dlnGDPG 41.759 5 0.000 Endogenous dlnDCPS 9.153 5 0.103 Weakly Stationary dlnBMB 32.646 5 0.000 Endogenous
dlnTRADE 1.4127 5 0.923 Weakly Stationary dlnGS 2.5016 5 0.776 Weakly Stationary
dlnINFL 13.771 5 0.017 Endogenous Diagnostic Tests for the Long Run Model Appendix 7 Lagrange-Multiplier Test
lag chi2 Df Prob > chi2 1 23.5409 36 0.94542 2 37.2459 36 0.41153 3 28.2281 36 0.81897 4 26.5434 36 0.87491 5 41.1455 36 0.25544 6 41.7755 36 0.23423 7 33.4947 36 0.58833 8 45.6156 36 0.13079
H0: no autocorrelation at lag order

Does Financial Sector Development Drive Economic Growth in a Post-Communist Economy? … 35 Appendix 8
.
dfk estimator used in computations ALL 26.311 6 0.00019 D_dlnGS .89352 4.992 1 0.02547 D_dlnTRADE 1.1773 3.737 1 0.05320 D_dlnBMB 1.3845 2.936 1 0.08662 D_dlnDCPS 1.0465 4.293 1 0.03826 D_dlnINFL .87752 5.068 1 0.02437 D_dlnGDPG .83274 5.284 1 0.02152 Equation Kurtosis chi2 df Prob > chi2 Kurtosis test
ALL 0.335 6 0.99931 D_dlnGS .01669 0.001 1 0.97175 D_dlnTRADE -.00298 0.000 1 0.99495 D_dlnBMB .05366 0.013 1 0.90937 D_dlnDCPS -.19989 0.180 1 0.67155 D_dlnINFL .06446 0.019 1 0.89124 D_dlnGDPG .16459 0.122 1 0.72698 Equation Skewness chi2 df Prob > chi2 Skewness test
ALL 26.646 12 0.00869 D_dlnGS 4.993 2 0.08237 D_dlnTRADE 3.738 2 0.15431 D_dlnBMB 2.949 2 0.22890 D_dlnDCPS 4.473 2 0.10683 D_dlnINFL 5.087 2 0.07860 D_dlnGDPG 5.406 2 0.06700 Equation chi2 df Prob > chi2 Jarque-Bera test
. vecnorm, jbera skewness kurtosis dfk
Appendix 9
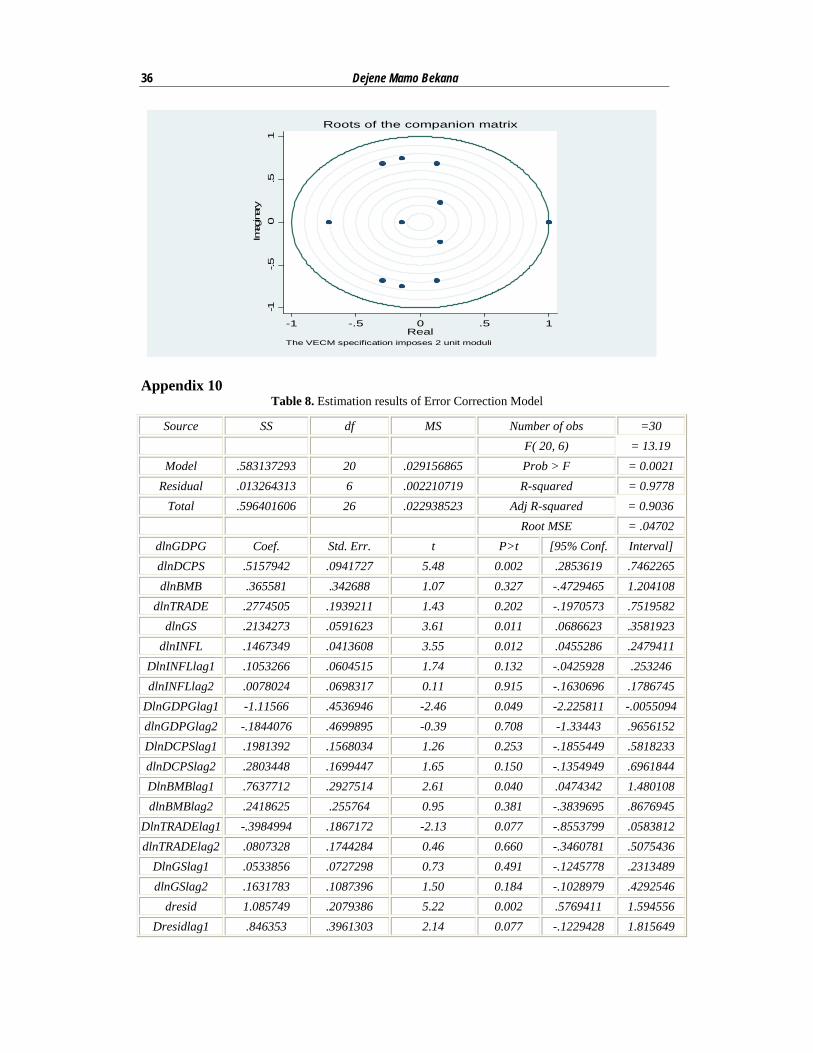
The VECM specification imposes 2 unit moduli. -.1447574 .144757 .1568948 - .2320702i .28013 .1568948 + .2320702i .28013 .1290529 - .6819271i .694031 .1290529 + .6819271i .694031 -.7088112 .708811 -.2931146 - .6816695i .742017 -.2931146 + .6816695i .742017 -.1413813 - .74694i .760203 -.1413813 + .74694i .760203 1 1 1 1 Eigenvalue Modulus Eigenvalue stability condition
. vecstable, graph modlabel
36 Dejene Mamo Bekana
-1-.5
0.5
1Im
aginar
y
-1 -.5 0 .5 1Real
The VECM specification imposes 2 unit moduli
Roots of the companion matrix
Appendix 10
Table 8. Estimation results of Error Correction Model
Source SS df MS Number of obs =30 F( 20, 6) = 13.19
Model .583137293 20 .029156865 Prob > F = 0.0021 Residual .013264313 6 .002210719 R-squared = 0.9778
Total .596401606 26 .022938523 Adj R-squared = 0.9036 Root MSE = .04702
dlnGDPG Coef. Std. Err. t P>t [95% Conf. Interval] dlnDCPS .5157942 .0941727 5.48 0.002 .2853619 .7462265 dlnBMB .365581 .342688 1.07 0.327 -.4729465 1.204108
dlnTRADE .2774505 .1939211 1.43 0.202 -.1970573 .7519582 dlnGS .2134273 .0591623 3.61 0.011 .0686623 .3581923
dlnINFL .1467349 .0413608 3.55 0.012 .0455286 .2479411 DlnINFLlag1 .1053266 .0604515 1.74 0.132 -.0425928 .253246 dlnINFLlag2 .0078024 .0698317 0.11 0.915 -.1630696 .1786745
DlnGDPGlag1 -1.11566 .4536946 -2.46 0.049 -2.225811 -.0055094 dlnGDPGlag2 -.1844076 .4699895 -0.39 0.708 -1.33443 .9656152 DlnDCPSlag1 .1981392 .1568034 1.26 0.253 -.1855449 .5818233 dlnDCPSlag2 .2803448 .1699447 1.65 0.150 -.1354949 .6961844 DlnBMBlag1 .7637712 .2927514 2.61 0.040 .0474342 1.480108 dlnBMBlag2 .2418625 .255764 0.95 0.381 -.3839695 .8676945
DlnTRADElag1 -.3984994 .1867172 -2.13 0.077 -.8553799 .0583812 dlnTRADElag2 .0807328 .1744284 0.46 0.660 -.3460781 .5075436
DlnGSlag1 .0533856 .0727298 0.73 0.491 -.1245778 .2313489 dlnGSlag2 .1631783 .1087396 1.50 0.184 -.1028979 .4292546
dresid 1.085749 .2079386 5.22 0.002 .5769411 1.594556 Dresidlag1 .846353 .3961303 2.14 0.077 -.1229428 1.815649

Does Financial Sector Development Drive Economic Growth in a Post-Communist Economy? … 37
Table 8 (cont.)dresidlag2 .1076774 .4344908 0.25 0.813 -.9554831 1.170838
_cons -.1843173 .0779016 -2.37 0.056 -.3749356 .006301 Diagnostic Tests for the Error Correction Model Appendix 11
Breusch-Pagan / Cook-Weisberg test for Heteroskedasticity Ho: Constant variance Variables: fitted values of dlnGDPG chi2(1) = 1.05 Prob > chi2 = 0.3059
Appendix 12
estat vif Variable VIF 1/VIF dlnGDPGlag2 59.69 0.016753 dlnGDPGlag 55.84 0.017908 dresidlag2 54.83 0.018238 dresidlag 46.16 0.021665 dlnDCPSlag2 25.10 0.039848 dlnINFLlag2 23.96 0.041739 dlnDCPSlag 21.56 0.046390 dlnINFLlag 19.44 0.051431 dlnGSlag 17.76 0.056296 dlnGS 14.92 0.067042 dresid 13.73 0.072844 dlnINFL 8.99 0.111286 dlnGSlag2 8.70 0.115002 dlnDCPS 7.71 0.129674 dlnTRADE 7.07 0.141527 dlnTRADElag 6.54 0.152795 dlnTRADElag2 5.71 0.175179 dlnBMB 3.62 0.276046 dlnBMBlag 2.64 0.379235 dlnBMBlag2 2.00 0.500041 Mean VIF 20.30

38 Dejene Mamo Bekana Appendix 13
H0: no serial correlation 3 7.276 3 0.0636 2 6.112 2 0.0471 1 0.318 1 0.5730 lags(p) chi2 df Prob > chi2 Breusch-Godfrey LM test for autocorrelation
. estat bgodfrey, lags(1 2 3)
H0: no serial correlation 2 6.112 2 0.0471 1 0.318 1 0.5730 lags(p) chi2 df Prob > chi2 Breusch-Godfrey LM test for autocorrelation
. estat bgodfrey, lags(1 2)