Embed Size (px)
Citation preview

DOE F 241.3 (2-01) p.1 of 2 UNITED STATES DEPARTMENT OF ENERGY (DOE) OMB CONTROL NO.
Announcement of Scientific and Technical Information (STI) 1910-1400
(For Use By Financial Assistance Recipients and Non-M&O/M&I Contractors) PART I: STI PRODUCT DESCRIPTION
(To be completed by Recipient/Contractor)
A. STI Product Identifiers 1. REPORT/PRODUCT NUMBER(s) None 2. DOE AWARD/CONTRACT NUMBER(s) DE-FC36-97ID13554 3. OTHER IDENTIFYING NUMBER(s) None B. Recipient/Contractor Carnegie Mellon University, Dept. of Materials Science and Engineering, 5000 Forbes Ave., Pittsburgh, PA 15213 C. STI Product Title Elimination or Minimization of Oscillation Marks: A Path To Improved Cast Surface Quality D. Author(s) Alan W. Cramb E-mail Address(es): [email protected] E. STI Product Issue Date/Date of Publication
F. STI Product Type (Select only one) X 1. TECHNICAL REPORT X Final Other (specify)
2. CONFERENCE PAPER/PROCEEDINGS Conference Information (title, location, dates)
3. JOURNAL ARTICLE
a. TYPE: Announcement Citation Only Preprint Postprint b. JOURNAL NAME c. VOLUME d. ISSUE e. SERIAL IDENTIFIER (e.g. ISSN or CODEN)
4. OTHER, SPECIFY G. STI Product Reporting Period Thru
H. Sponsoring DOE Program Office Office of Industrial Technologies (OIT)(EE20) I. Subject Categories (list primary one first) 32 Energy Conservation, Consumption and Utilization Keywords: Steel Casting, Oscillation Marks, Surface Quality J. Description/Abstract Oscillation marks are the most recognizable feature of continuous casting and can be related to the subsurface defects that can be found on product rolled from continuous cast slabs. The purpose of this work was to develop strategies that can be used on industrial continuous casters to reduce oscillation mark depth, and, in particular, to minimize the formation of hook type defects that are prevalent on ultra low carbon grades. The major focus of the work was on developing a technique to allow heat transfer in the meniscus region of the continuous caster to be measured and the effect of mold slag chemistry and crystallization to be documented. A new experimental technique was developed that allowed the effect of mold flux chemistry and crystallization on the radiation heat transfer rate to be measured dynamically. K. Intellectual Property/Distribution Limitations (must select at least one; if uncertain contact your Contracting Officer (CO)) X 1. UNLIMITED ANNOUNCEMENT (available to U.S. and non-U.S. public; the Government assumes no liability for disclosure of such data)
2. COPYRIGHTED MATERIAL: Are there any restrictions based on copyright? Yes No. If yes, list the restrictions as contained in your award document
3. PATENTABLE MATERIAL: THERE IS PATENTABLE
MATERIAL IN THE DOCUMENT. INENTION DISCLOSURE SUBMITTED TO DOE: DOE Docket Number: S- (Sections are marked as restricted distribution pursuant to 35 USC 205)
4. PROTECTED DATA: CRADA Other, specify Release date (required) no more than 5 years from date listed in Part I.E. above
5. SMALL BUSINESS INNOVATION RESEARCH (SBIR) DATA Release date (required) no more than 4 years from date listed in Part I.E. above
6. SMALL BUSINESS TECHNOLOGY TRANSFER RESEARCH (STTR) DATA Release date (required) no more than 4 years from date listed in Part I.E. above
7. OFFICE OF NUCLEAR ENERGY APPLICED TECHNOLOGY L. Recipient/Contract Point of Contact Contact for additional information (contact or organization name To be included in published citations and who would Receive any external questions about the content of the STI Product or the research contained herein) Dr. Alan Cramb, Dean, School of Engineering Name and/or Position [email protected] (518) 276-6298 E-mail Phone School of Engineering, Rensselaer Polytechnic Institute, Troy, NY
M M D D Y Y Y Y
M M D D Y Y Y Y
M M D D Y Y Y Y
12 17 2007 M M D D Y Y Y Y
11 11 2004 M M D D Y Y Y Y
12 17 2007 M M D D Y Y Y Y

DOE F 241.3 (2-01) p.2 of 2 UNITED STATES DEPARTMENT OF ENERGY (DOE) OMB CONTROL NO.
Announcement of Scientific and Technical Information (STI) 1910-1400
(For Use By Financial Assistance Recipients and Non-M&O/M&I Contractors)
PART II: STI PRODUCT MEDIA/FORMAT and LOCATION/TRANSMISSION
(To be completed by Recipient/Contractor)
A. Media/Format Information: 1. MEDIUM OF STI PRODUCT IS: X Electronic Document Computer Medium Audiovisual Material Paper No Full-text 2. SIZE OF STI PRODUCT 467 Pages, 6420 KB 3. SPECIFY FILE FORMAT OF ELECTRONIC DOCUMENT BEING TRANSMITTED, INDICATE: SGML HTML XML XPDF Normal PDF Image TIFFG4 WP-indicate Version (5.0 or greater) Platform/operation system MS-indicate Version (5.0 or greater) Platform/operation system Postscript 4. IF COMPUTER MEDIUM OR AUDIOVISUAL MATERIAL: a. Quantity/type (specify) b. Machine compatibility (specify) c. Other information about product format a user needs to know: B. Transmission Information: 1. STI PRODUCT IS BEING TRANSMITTED: X a. Electronically via E-Link b. Via mail or shipment to address indicated in award document (Paper product, CD-ROM, diskettes, video cassettes, etc.) 2. INFORMATION PRODUCT FILE NAME X (of transmitted electronic format) TRP9943NonPropFinalReport.
PART III: STI PRODUCT REVIEW/RELEASE INFORMATION
(To be completed by DOE)
A. STI Product Reporting Requirements Review. 1. THIS DELIVERABLE COMPLETES ALL REQUIRED DELIVERABLES FOR THIS AWARD 2. THIS DELIVERABLE FULFILLS A TECHNICAL INFORMATION REPORTING REQUIREMENT, BUT SHOULD NOT BE DISSEMINATED BEYOND DOE. B. Award Office Is the Source of STI Product Availability THE STI PRODUCT IS NOT AVAILABLE IN AN ELECTRONIC MEDIUM. THE AWARDING OFFICE WILL SERVE AS THE INTERIM SOURCE OF AVAILABILITY. C. DOE Releasing Official 1. I VERIFY THAT ALL NECESSARY REVIEWS HAVE BEEN COMPLETED AS DESCRIBED IN DOE G 241.1-1A, PART II, SECTION 3.0 AND THAT THE STI PRODUCT SHOULD BE RELEASED IN ACCORDANCE WITH THE INTELLECTUAL PROPERTY/DISTRIBUTION LIMITATION ABOVE. Release by (name) Date E-Mail Phone
M M D D Y Y Y Y

REPORT DOCUMENTATION PAGE
Title and Subtitle: AISI/DOE Technology Roadmap Program for the Steel Industry TRP 9943: Elimination or Minimization of Oscillation Marks - A Path to Improved Surface Quality Authors: Dr. Alan W. Cramb Performing Organization Carnegie Mellon University Department of Materials Science and Engineering 5000 Forbes Avenue Pittsbirgh, PA 15213 Abstract The major findings of this project were that: (1) A new experimental technique was developed that allowed the effect of mold flux chemistry and crystallization on the radiation heat transfer rate to be measured dynamically. (2) Mold flux crystallization can result in a significant decrease in the rate of radiation heat transfer in continuous casting. Crystallization of a mold flux can lead to a 20% decrease in the radiation heat transfer rate. (3) Most mold coatings increase the radiation heat transfer rate by decreasing reflectivity and would lead to an increased oscillation mark depth. Only an alumina coating was found to be a potential in reducing the heat transfer rate in the meniscus area; however, as alumina is easily dissolved in mold fluxes this may not be an appropriate method to follow. (4) In the casting of high aluminum containing grades, the mold flux chemistry that is attained in the mold can be significantly different from that of the original flux chemistry. Recent developments, aimed at developing an in-mold flux chemistry that is compatible with sequence casting for high aluminum steels, have lead to the development of fluxes with quite different properties than normally used in continuous casting. These fluxes (i) partially crystallize on cooling; (ii) do not form glasses; (iii) have a primary solidification phase that is calcium fluoride; (iv) further crystallize with holding time, and (v)

successfully block radiation heat transfer. This work suggests that fluxes can be developed that are fully crystallized and block radiation heat transfer always by precipitation of second phases against the mold wall. This gives a potential solution which could lead to reduced heat transfer rates and thus reduced oscillation mark formation in a continuous caster. (5) The addition of the transition metal oxides, MnO and FeO, reduces the radiation heat transfer rate by up to 25%. The addition of these transition metal oxides leads to fully glassy mold flux samples that lose their transparency but remain as a glass. The addition of MnO and Fe2O3 to the initial flux also leads to an increase in both the absorption coefficient (from 400 to 1800 m-1) and the refractive index (from 1.6 to 1.7) of these fluxes. Thus additions of 5% FeO and 10%MnO can be effective in reducing the radiation heat transfer rate in the meniscus area of a continuous caster. (6) Experiments were conducted that allowed real casting conditions in the mold flux to be simulated where the following conditions could be achieved: a liquid at the top, a solid glassy layer close to the copper substrate and a crystalline layer developed in between. All layer thicknesses could be varied. The effect of mold flux melting and of crystal fraction dissolution on radiation heat transfer rates were also measured. It was found that the melting of the solid crystalline flux enhanced the incident radiation transfer and resulted in a higher overall heat transfer rate in the system due to the minimization of the crystal volume which in turn reduced the solid flux thermal resistance. Thus, radiation heat transfer rates will be highest in the meniscus area due to this effect. (7) Insulation or heat input in the meniscus area should be effective in reducing oscillation marks if carried out simultaneously. (8) Meniscus movement should also be possible and techniques that move the meniscus further away from the mold will allow decreased mark formation.

DOCUMENT AVAILABILITY
Reports are available free via the U.S. Department of Energy (DOE) Information Bridge: Website: http://www.osti.gov/bridge Reports are available to DOE employees, DOE contractors, Energy Technology Data Exchange (ETDE) representatives, and Informational Nuclear Information System (INIS) representatives from the following source: Office of Scientific and Technical Information
P.O. Box 62 Oak Ridge, TN 37831 Tel: (865) 576-8401 Fax: (865) 576-5728 E-mail: [email protected] Website: http://www.osti.gov/contract.html
Acknowledgement: "This report is based upon work supported by the U.S. Department of Energy under Cooperative Agreement No. DE-FC36-97ID13554." Disclaimer: "Any findings, opinions, and conclusions or recommendations expressed in this report are those of the author(s) and do not necessarily reflect the views of the Department of Energy."

1
AISI/DOE Technology Roadmap Program
Final Report
TRP 9943 - Elimination or Minimization of Oscillation Marks:
A Path to Improved Cast Surface Quality
By
Alan W. Cramb
1/3/2008
Work Performed under Cooperative Agreement No. DE-FC36-97ID13554
Prepared for U.S. Department of Energy
Prepared by
American Iron and Steel Institute Technology Roadmap Program Office
Pittsburgh, PA 15222

TABLE OF CONTENTS
ITEM PAGE
Table of Contents i
List of Figures iii
List of Tables vi
Title 1
Abstract 2
1. Background 5
2. Literature Review 10
2. 1 Continuous casting technologies 10
2. 2 Heat transfer and solidification during continuous casting 13
2. 2. 1 General heat transfer considerations on the mold 13
2. 2. 2 Heat withdraw in the mold 15
2. 2. 3 Effect of carbon content of cast steel on heat transfer rate 20
2. 2. 4 Effect of casting speed on heat transfer rate 24
2. 3 Understanding of casting powders in continuous casting 29
2. 3. 1 General understanding of casting powders 29
2. 3. 2 Mold flux solidification, slag powder infiltration and consumption 29
2. 3. 3 Mold flux friction 33
2. 3. 4 Mold flux thermal and physical properties 34
2. 4 Heat transfer across mold flux in continuous casting 36
2. 4. 1 The mechanism of heat transfer across the mold flux 36
2. 4. 2 The effect of mold flux properties and thickness on heat flux 38
2. 4. 3 The development of heat simulator 46
2. 5 Relation to current work 49

TABLE OF CONTENTS
ITEM PAGE
4. A study of solid mold flux and its effect on radiative heat transfer 59
4. 1 The radiative properties of a mold flux 59
4. 2 Effect of the crystalline phase on radiative heat transfer rate 61
4. 3 Effect of a glass disk on the radiative heat transfer rate 67
4. 4 Effect of top surface on radiative heat transfer 73
4. 5 Modeling of radiative heat transfer in solid mold flux 75
4. 6 The effect of a mixture of phases on the radiative heat transfer rate 80
4. 7 Kinetics of slag disc crystallization 81
4. 8 Quantification of the effect of crystallization on radiative heat transfer 85
5. Further results from the mold simulator 88
6. Simulation of the meniscus area in a continuous caster 90
7. Conclusions 112
8. References 113
Appendix 1: A Study of the Crystallization Behavior of a New 118
Mold Flux Used in the Casting of TRIP SteelsAppendix 2: A Study of a Mold Flux and Its Effect of Radiative Heat 141
Transfer in Continuous CastingAppendix 3: The Effect of the Transition Metal Oxide Content of a 159
Mold flux on the Radiative Heat Transfer RatesAppendix 4: The Effect of In-situ Dynamic Mold Flux 196
Crystallization on Radiative Heat TransferAppendix 5: The Study of the Effect of Mold Flux Melting and 216
Crystal Fraction Dissolution on Radiative Heat TransferAppendix 6: Final Thesis of Wanlin Wang (220 pages) 239
ii

LIST OF FIGURES
FIGURE TITLE PAGE1.1 Experimental apparatus showing infrared emitter 9
2.1 Global share of continuous casting steel over the years 11
2.2 General view of a continuous slab caster 12
2.3 The schematic figure of the top of the mold 14
2.4 Schematic temperature profile and heat transfer resistances across shell to mold 15
2.5 Model of solidifying steel shell domain showing heat flux conditions 17
2.6 Heat transfer through gap filled with nitrogen-hydrogen gas 19
2.7 Calculated interfacial thermal resistance for differnet mold flux 20
2.8 Thickness of the shell in the mold below meniscus 21
2.9 Effect of carbon content on mold heat transfer rate during continuous casting 22
2.10 Influence of carbon content of steel cast on overall mold heat flux 22
2.11 Heat flux on the mold surface vs time from the start of casting 23
2.12 The effect of carbon content on the heat flux 24
2.13 Effect of casting speed on the mold heat transfer rate for 0.1% carbon steels 25
2.14 Normalized local mold heat flux for low carbon strip grade 26
2.15 Effect of casting speed on heat flux profile 27
2.16 Effects of casting speed on mold temperature 27
2.17 Effect of casting speed on shell thickness 28
2.18 Effectof casting speed on shell surface temperature 28
2.19 General figure of the mold flux in continuous casting 30
2.20 A example TTT diagram from Kashiwaya 31
2.21 Sample of slag layer and its microstructure 31
2.22 Absorption coefficient versus wavelength at room temperature 35
2.23 Change of absorption and extinction coefficient with temperature 35
2.24 Heat capacity of mold flux as a function of temperature 36
2.25 The calculated effective thermal conductivity and flux thickness 38
2.26 Relation between heat transfer and crystallization and viscosity 39
2.27 Relation between the percentage of area of pores and the mean heat transfer rate 40
2.28 The change of observed heat flux and thermal resistances with the thickness of mold flux 41
2.29 The change of interfacial and flux thermal resistance with thickness of mold flux 42
2.30 Heat flux as a function of flux film thickness 43
2.31 Comparison of calculated threshold interfacial thermal resistance with observed 43
iii

LIST OF FIGURES
FIGURE TITLE PAGE2.32 Effect of mold temperature on heat flux near meniscus 44
2.33 Effect of casting speed on heat flux near meniscus 45
2.34 Effect of absorption coefficient on heat flux near meniscus 45
2.35 Effect of crystallizing temperature on heat flux near meniscus 46
2.36 The temperature response to a sinusoidal flux 47
2.37 Temperature response amplitudes for different subsurface thermocouples 47
2.38 Responding temperature 2mm below the hot surface 48
2.39 The measured heat flux for bare copper and crystalline disk 49
3.1 Experimental apparatus of the infrared emitter 50
3.2 Scematic figure of copper substrate used as the radiation target 51
3.3 The responding temperature history for the copper mold coated with graphite 52
3.4 Calculated heat flux with time at steady state 53
3.5 Induction furnace used to melt mold flux into cylinder 54
3.6 The flowchart for mold flux disks preparation 54
3.7 The picture of glass and crystalline disks 55
3.8 The in-mold responding temperatures under a 0.91mm glassy disk 56
3.9 Apparatus used to melt mold flux 57
3.10 The glassy disks prepared by direct casting 57
3.11 Schematic figure of DHTT 58
3.12 Photos of glass mold flux crystallization 59
4.1 Schematic of splitting irradiation into absorption, reflection and transmission 60
4.2 The responding temperatures versus time for 0.625mm slag disc 62
4.3 X-ray pattern of slag disc heated by radiation 63
4.4 The responding temperatures versus applied heat fluxes for the system with crystalline slag disc on top of the copper mold 64
4.5 Measured heat fluxes through the copper mold 65
4.6 The fraction of measured heat flux versus applied heat flux 67
4.7 The X-ray pattern of glassy slag disk 67
4.8 The responding temperature versus time for glassy slag disc 68
4.9 Responding temperatures versus applied heat fluxes for different systems 69
4.10 The measured heat fluxes for different systems 70
4.11 The calculated heat flux histories for glass and crystalline phases 70
iv

LIST OF FIGURES
FIGURE TITLE PAGE4.12 The measured heat flux histories for five different thickness glassy discs 71
4.13 The effect of thickness on heat fluxes 72
4.14 Two typical glass disks picture 72
4.15 The responding temperature history for the copper mold coated with graphite 73
4.16(a) Responding temperatures versus applied heat fluxes for varied top surface 74
4.16(b) Measured heat flux going through copper mold for varied top surface 74
4.17 The fraction of measured heat flux versus applied heat fluxes 75
4.18 The first cycle of light tracing of the semitransparent sheet 76
4.19 The second cycle of light tracing of the semitransparent sheet 77
4.20 The flowchart for modeling heat transfer phenomena through solid mold flux 79
4.21 The measured heat flux histories for partially crystallized slag discs 80
4.22 Two SEM figures for samples 1(a) and 5(b) 81
4.23 Thermal cycle of experiment 82
4.24 Crystallization behavior of mold slag at 900 C 83
4.25 The relation of crystals volume fraction evolution with function of time 84
4.26 Comparison of crystal fraction versus time between calculation and observation 85
4.27 The relation bewteen crystalline fraction and measured heat flux 86
4.28 The relationship between annealing time and measured heat flux 87
6.1 No figure 90
6.2 Description of phenomena to simulate and location of boundaries 92
6.3 Graphic representation of the discretization of the heat capacity method 96
6.4 Part of the caster that is modeled 98
6.5 Mesh used 99
6.6 Velocity field for simulating steel removal 100
v

LIST OF TABLES
TABLE TITLE PAGE
3.1 Composition of mold flux 55
4.1 The responding temperature, T1, for different thickness crystalline slag disks 63
vi

2
Title and Subtitle: AISI/DOE Technology Roadmap Research Program for the Steel Industry TRP 9943 Elimination or Minimization of Oscillation Marks: A Path to Improved Cast Surface Quality Author: Alan W. Cramb Performing Organization Carnegie Mellon University Department of Materials Science and Engineering 5000 Forbes Avenue Pittsburgh Pa 15213 Abstract The major findings of this project were that: (1) A new experimental technique was developed that allowed the effect of mold flux chemistry and crystallization on the radiation heat transfer rate to be measured dynamically. (2) Mold flux crystallization can result in a significant decrease in the rate of radiation heat transfer in continuous casting. Crystallization of a mold flux can lead to a 20% decrease in the radiation heat transfer rate.
(3) Most mold coatings increase the radiation heat transfer rate by decreasing reflectivity and this fact would lead to an increased oscillation mark depth. Only an alumina coating was found to exhibit potential in reducing the heat transfer rate in the meniscus area, however, as alumina is easily dissolved in mold fluxes this may not be an appropriate method to follow.
(4) In the casting of high aluminum containing grades, the mold flux chemistry that is attained in the mold can be significantly different from that of the original flux chemistry. Recent attempts at developing an in-mold flux chemistry that is compatible with sequence casting for high aluminum steels, have lead to the development of fluxes with quite different properties than normally used in continuous casting. These fluxes (i) partially crystallize on cooling; (ii) do not form glasses; (iii) have a primary solidification

3
phase that is calcium fluoride; (iv) further crystallize with holding time and (v) successfully block radiation heat transfer. This work suggests that fluxes can be developed that are fully crystallized and block radiation heat transfer continuously by precipitation of second phases at the mold wall. This solution which could lead to reduced heat transfer rates and thus reduced oscillation mark formation in a continuous caster.
(5) The addition of the transition metal oxides, MnO and FeO, reduces the radiation heat transfer rate by up to 25%. The addition of these transition metal oxides leads to fully glassy mold flux samples that lose their transparency but remain as a glass. The addition of MnO and Fe2O3 to the initial flux also leads to an increase in both the absorption coefficient (from 400 to 1800 m-1) and the refractive index (from 1.6 to 1.7) of these fluxes. Thus additions of 5% FeO and 10% MnO can be effective in reducing the radiation heat transfer rate in the meniscus area of a continuous caster.
(6) Experiments were conducted that allowed real casting conditions in the mold flux to be simulated where the following scenarios could be achieved: a liquid at the top, a solid glassy layer close to the copper substrate and a crystalline layer developed in between. The thickness of all the layers could be varied. The effect of mold flux melting and of crystal fraction dissolution on radiation heat transfer rates were also measured. It was found that the melting of the solid crystalline flux enhanced the incident radiation transfer and resulted in a higher overall heat transfer rate in the system due to the minimization of the crystal volume which in turn reduced the solid flux thermal resistance. Therefore, radiation heat transfer rates will be highest in the meniscus area due to this effect.
(7) Insulation or heat input in the meniscus area should be effective in reducing oscillation marks if carried out simultaneously.
(8) Meniscus movement should also be possible and techniques that move the meniscus further away from the mold will allow decreased mark formation.

4
Elimination or Minimization of Oscillation Marks: A Path to Improved Cast Surface Quality
By
Wanlin Wang, Aymeric Moinet and Alan W. Cramb
Oscillation marks are the most recognizable feature of continuous casting and can be related to the subsurface defects that can be found on product rolled from continuous cast slabs. The physical surface defect of the oscillation marks themselves does not necessarily pose a significant problem in many grades. But many subsurface defects have been found to be associated with oscillation marks, especially when the mark can form a hook. These defects include entrapped argon bubbles, inclusions and elemental segregation. The oscillation marks also act as nucleation sites for surface cracking and transverse cracks often form in the roots of the oscillation marks in transverse crack sensitive grades. The presence of oscillation marks and the related defects found on the surfaces of product rolled from cast slabs requires extra slab surface treatment, from spot scarfing to complete surface removal, before the slabs can be hot rolled. Thus, if the defects related to oscillation mark formation can be eliminated, increased hot charging ratios would be possible, leading to a significant energy decrease during processing.
The successful development of these new practices has the potential to significantly reduce defects in cast product and to increase the productivity and yield of a continuous casting machine. For example, this technology will aid in minimizing head and tail crop and increase the quality of transition slabs where meniscus defects can be severe. The technology will lead to improved caster sequence length and efficiency and the potential for significant improvements in hot charging efficiency and better linkage between the caster and the rolling mills. This will lead to significant energy (30 x 106 GJ/year) and environmental savings (1857 x 106 kg of CO2 per year) in steel production due to increased efficiency of the casting process and decreased energy consumption during reheating and rolling.
Recent work has shown that in low carbon steels, especially in ultra low carbon steels, the formation mechanism of the oscillation mark is the increased solidification rate in the meniscus area of the mold due to movement of the meniscus towards the mold wall during the negative strip time of the mold. This study indicates that it is possible to affect meniscus mark formation by either changing the heat transfer rate in the meniscus area of the caster or by changing the position of the liquid steel meniscus, or by affecting both issues. This leads to the potential for some completely novel approaches to either eliminating or minimizing the oscillation marks that are found on cast slab surfaces. Thus this project was focused upon further developing this new understanding of oscillation mark formation with the view to developing new approaches to the operation of a continuous caster that will lead to the elimination or minimization of the defects that are associated with oscillation marks.

5
The purpose of this work was to develop strategies that can be used on industrial continuous casters to reduce oscillation mark depth, and, in particular, to minimize the formation of hook type defects that are prevalent on ultra low carbon grades. The major focus of the work was on developing a technique to allow heat transfer in the meniscus region of the continuous caster to be measured and the effect of mold slag chemistry and crystallization to be documented.
1. Background
The major issue in solving the oscillation mark problem was in developing techniques to determine which hypothesis of mark formation was correct. Fortunately recent work has allowed our understanding of oscillation marks to be clarified and thus new methods of solving the problem can be determined. It is the purpose of this project to explore potential solutions to the problem of oscillation mark formation.
The current hypotheses regarding the mechanism of formation of oscillation marks can be grouped into two main categories: (i) those which ascribe the formation of the marks to the bending of the shell due to mold oscillation [1-8] and (ii) those which suggest that rapid partial solidification of the meniscus results in the formation of oscillation marks [9-14]. Most of these hypotheses are based upon post-occurrence observations because it was not possible to conduct transient in-situ observation. This inability to perform direct observation is simply due to the fact that continuous casters exist in harsh environments and the phenomena are highly transient. This also makes sensor attachment difficult, and it is almost impossible to visually observe the liquid steel meniscus during a casting operation. The highly transient nature of the phenomena in continuous casting molds requires very powerful data acquisition equipment which was unavailable until relatively recently.
The hypotheses of shell deformation (i) are all essentially the same with the exception of the source of the stress. In all shell deformation hypotheses, some source of stress acts on the shell in the negative strip period, causing the shell to bend away from the mold surface. In many casting operations employing mold flux, it is normal that the mold flux in the vicinity of the meniscus forms a crust on the mold called a slag rim. This slag rim is attached to the copper mold and thus moves with the mold velocity. It is thought that the slag rim can cause either one of two effects in the strip. First, as the mold moves down into negative strip, the slag rim forces an increase in pressure in the liquid flux layer. This increased pressure applies a sufficiently high force to push the initial shell near the meniscus away from the mold. After this deformation the shell thickens and becomes too strong to be pushed back to the mold wall, thereby forming the oscillation mark. The second effect is an actual mechanical interaction (collision) between the slag rim and initial steel shell. In the negative strip period, the mold is moving downwards more rapidly than the shell. This can cause a situation where the slag rim contacts the initial steel shell and mechanically forces the tip of the shell away from the mold wall. The end result is the same as that of the first effect, an oscillation mark.

6
In the evidence provided by the authors supporting the slag rim theory as the cause of oscillation marks, the very presence of the slag rim itself is thought to be sufficient to cause oscillation marks. Aside from the presence of the slag rim, evidence showing the slag rim decreasing in size with increasing mold temperature was also used to support this claim, by explaining that this was the reason oscillation mark severity decreased with increasing mold temperature. It is clear that if the liquid level fluctuations in the mold allow the steel level to physically interact with the slag rim, a meniscus mark could occur and, in fact, such interactions can lead to severe depressions and meniscus marks during times of severe level fluctuation. However, in controlled operations, the liquid level does not interfere with the solidified slag rim, therefore, this mechanism is unlikely to explain the formation of all oscillation marks.
Another mechanism by which the shell could be deformed is through an increase of the pressure in the liquid mold flux between the shell and the mold. Several authors [2-4] have asserted that the period of negative strip is associated with a rapid increase of the fluid pressure in the mold flux channel. There is also evidence that there is an increase in the friction force required to extract the shell during the negative strip period [5,6]. This rise in fluid pressure is thought to be transferred to the initial shell, which is assumed to have insufficient strength to maintain its shape along the mold surface. Under this strong force the shell then bends into the melt, away from the mold surface, forming an oscillation mark. This force clearly exists and may account for the smooth undulations that can be seen on the surfaces of slabs with large alloy contents, such as stainless steels, where the surface topography of the oscillation marks are more of an undulating depression rather than defined marks.
Another hypothesis speculates that the shell deforms due to the actions of large thermal gradients developed across its cross section [7,8]. These thermal gradients are indeed steep because the thin shell is held between a cold copper mold on one side and liquid steel on the other. The steep temperature gradient coupled with the thin and tapered shell shape result in thermal stresses that can induce deformation in the shell. However, this deformation causes the shell to deform in a direction opposite to that which would be expected of an oscillation mark. With respect to the mold, the shell becomes concave with its tip being forced against the mold. This would result in a depression with a large continuous radius of curvature, unlike the very sharp distinct oscillation marks.
Another group (ii) of theories [9-14], postulated most recently by Saucedo [14], involves the liquid steel meniscus coming into close proximity with the copper mold surface, where the copper mold cooling potential then allows for solidification of the meniscus. For the solidification of the meniscus to occur, two conditions must occur simultaneously. First, the mold must be sufficiently cold that it can rapidly cause solidification of the liquid steel by allowing an increase in heat transfer rate. Second, the liquid steel must be brought into close proximity with the copper mold. The first condition is easily met through the reciprocating action of the copper mold in the liquid steel bath. As the mold is lowered into the bath, the temperature of the mold surface begins to rise and as it is being retracted from the bath, less of the mold surface is exposed to the heat source (liquid steel) and thus the temperature of the mold surface begins to decrease. Then, the mold is brought down into the steel again. The copper

7
mold is at its coldest immediately before re-immersion. Thus, the simple act of oscillating the mold in and out of a liquid steel bath satisfies the first condition of the mold having the required cooling potential. The longer the stroke and the lower the frequency of oscillation, the larger the cooling potential.
The second condition is that the liquid steel meniscus be brought into close proximity with the copper mold [11]. As the mold enters the period of negative strip, the liquid meniscus deforms and moves against the mold. Therefore, the two conditions for the formation of oscillation marks are met when a mold is oscillated and the negative strip period exists.
Recently work by Badri et al. (16-21), using a mold simulator to measure heat flux during an oscillation cycle, has shown that the meniscus solidification hypothesis is correct in the case of low carbon steels. The observation of the temperature during the oscillation cycle required a comprehensive study of temperature measurement in conducting solids. When a temperature sensor is inserted into a conducting solid, the void created for the sensor and the sensor material itself can introduce errors into the measured temperature signal. These errors were studied to determine how best to install the sensors in the mold. Additionally, the response of the material, as deduced from the temperature sensors, was studied under conditions of transient high thermal fluxes to determine the ability of the sensor to discriminate between different functional forms of surface heat flux [16]. A heat transfer simulator was also used to confirm the ability of subsurface thermocouples to measure small variations in temperature due to oscillations in the surface heat flux [17]. The conceptual models provided a greater understanding of meniscus heat transfer and also resulted in such ideas as meniscus level detection, passive detection of surface transients [20] and finally the ability to detect the formation of oscillation marks by measuring the heat flux within the oscillation cycle.
The heat flux measured during the oscillation cycle varies with several wavelengths. The changes in heat flux due to oscillation phenomena are small and occur at high frequencies. Other events in the system contribute heat fluxes at lower frequencies. The measured global heat flux can be separated into its contributing components to clarify the variation of the heat flux occurring on the time-scale of the oscillation. As the different components of the heat flux are due to different events occurring in the mold, they can be mathematically separated. Thus, the global heat flux is decomposed into a low-frequency heat flux corresponding to the low-frequency solidification and long-term system variations, and a high-frequency heat flux corresponding directly to phenomena occurring on the time scale of the oscillation phenomena. The decomposition of the heat flux highlights the rapid changes in heat flux that occur during the negative strip period. It was found that this case is true only if the cast shell exhibits clearly defined oscillation marks. For a smooth shell without oscillation marks, the high frequency heat transfer variation is due simply to the oscillatory motion of the mold in the liquid steel. In addition, the rise in heat flux was correlated with the locations of the oscillation marks. Another conclusive result was that the frequency spectra of both the shell surface and the heat flux had similar fundamental components, indicating that the underlying phenomena were related. This experimental evidence showed conclusively that the oscillations in heat flux corresponded directly with variations in the shell surface profile, and that the

8
main frequency component of both was related to the frequency of oscillation. This provides further evidence that the heat flux evolution with time is intimately related to the formation of the cast shell surface. This experimental evidence shows that the main mechanism of formation of oscillation marks is indeed the solidification of the meniscus. The research also shows that neither mold oscillation nor negative strip alone were sufficient conditions for oscillation marks to form.
The other hypotheses of oscillation mark formation mechanisms can either be rationalized using this criterion of necessary conditions or eliminated entirely due to the inconsistencies with experimental results. Most of the criteria eliminated would result in a decrease in heat flux in the negative strip period, thereby contradicting experimental evidence. However, even though these mechanisms have been disproved as the mechanism of formation, it is possible that they can still contribute or exacerbate the severity of the oscillation marks.
There are two necessary conditions for the formation of a solidified meniscus. First, the mold conditions at the meniscus must be such that the potential for heat transfer is sufficient to cause accelerated solidification. Second, the liquid meniscus must deform such that the liquid comes into close proximity with the copper mold. The simultaneous occurrence of these two necessary conditions provides the sufficient condition for the solidification of the meniscus. The final necessary condition required depends on the type of mark formed. The frozen meniscus can be overflowed to form a subsurface hook type oscillation mark, or if the frozen meniscus lacks strength, the rising liquid can force the shell back to the mold, forming a depression type mark. Thus, the first two necessary conditions must occur simultaneously, followed by the third condition, to create a series of events necessary and sufficient for the formation of oscillation marks. These necessary criteria form the hypothesis of the mechanism of formation of oscillation marks based upon experimental evidence.
There are two issues outlined in the above discussion – (1) heat transfer rate in the meniscus region of the continuous caster and (2) the position of the meniscus during oscillation of the mold.
To study the heat transfer rate in the meniscus region a heat transfer simulator will be used. This simulator has been developed at CMU [19,20] and is a unique piece of apparatus as it allows thermal conditions in the mold to be accurately simulated. To attempt a detached evaluation of mold heat transfer, this study uses a high-powered heat source that irradiates a copper sample with infrared radiation, and the temperature at various points within the sample is measured. A schematic of the experimental apparatus is shown in Figure 1.1. The equipment used in these experiments includes a high-heat flux infrared radiant heater with a heating unit, power controller, data acquisition and a command-and-control unit. The heating unit contains the heating elements that are protected by a quartz window, and a reflector behind the heating elements that directs the radiation through the quartz window. The heating parameters such as the initial heat flux and heat flux pattern (with time) can be controlled manually using digital potentiometers or the control computer. The heat flux can also be controlled automatically by using an input function with the control computer. When a voltage is applied to the heating

9
elements, the elements emit infrared radiation. The intensity level of this radiation can be controlled precisely by changing the voltage applied across the elements. By using a silicon-controlled rectifier (SCR) based power controller, the voltage across the lamps can be manipulated between 0 and 208 V, and thus the resulting output flux of the lamps can be varied from 0 to 0.8MW/m2.
Data acquisition / command-and-control
computer
PowerController
V
I
Coolingair in
Coolingair out
Water-cooled reflector
Coolingwater out
Coolingwater in
Power cables
Thermocouple output
Voltage and current feedback
Commandsignal
Infrared Radiation
Figure 1.1: Experimental apparatus showing infrared emitter
To generate heat fluxes using specified mathematical functions, the power controller is connected to a data acquisition and control board, which is in turn connected to a computer. Any arbitrary signal generated by the computer can be sent in real time to the power controller, and translated into an output heat flux by the heating elements.
The copper mold is simulated by a water-cooled copper bar. The copper samples are designed so that one end can be chilled while the opposite end is irradiated with the infrared radiation. This design has a copper cylinder with a cooling cap held against the chilled end, and water is flowed through the cooling cap onto the chilled surface. Mold slag samples can be prepared as thin discs with the same diameter as the copper substrates that they were placed upon. To prepare the mold flux for use as heat transfer samples, the mold flux had to be fabricated into an easily reproducible form. The best way is to fabricate discs of mold flux of various thicknesses. To make these discs, the mold flux will be first pre-fused to remove the bulk of the graphite. Then, the fused mold flux, now depleted of free graphite, will be melted in a graphite crucible in an induction furnace and then cooled at a controlled rate to either form a glassy or crystalline cylinder with the same diameter of copper mold.
Controlled cooling of the mold flux cylinders was achieved by transferring the crucible containing the liquid mold flux into a programmable furnace. Once cool, the cylinder of solid mold flux can be removed from the graphite crucible. This cylinder is then sectioned using slow speed diamond blades to produce discs ranging in thickness from
10
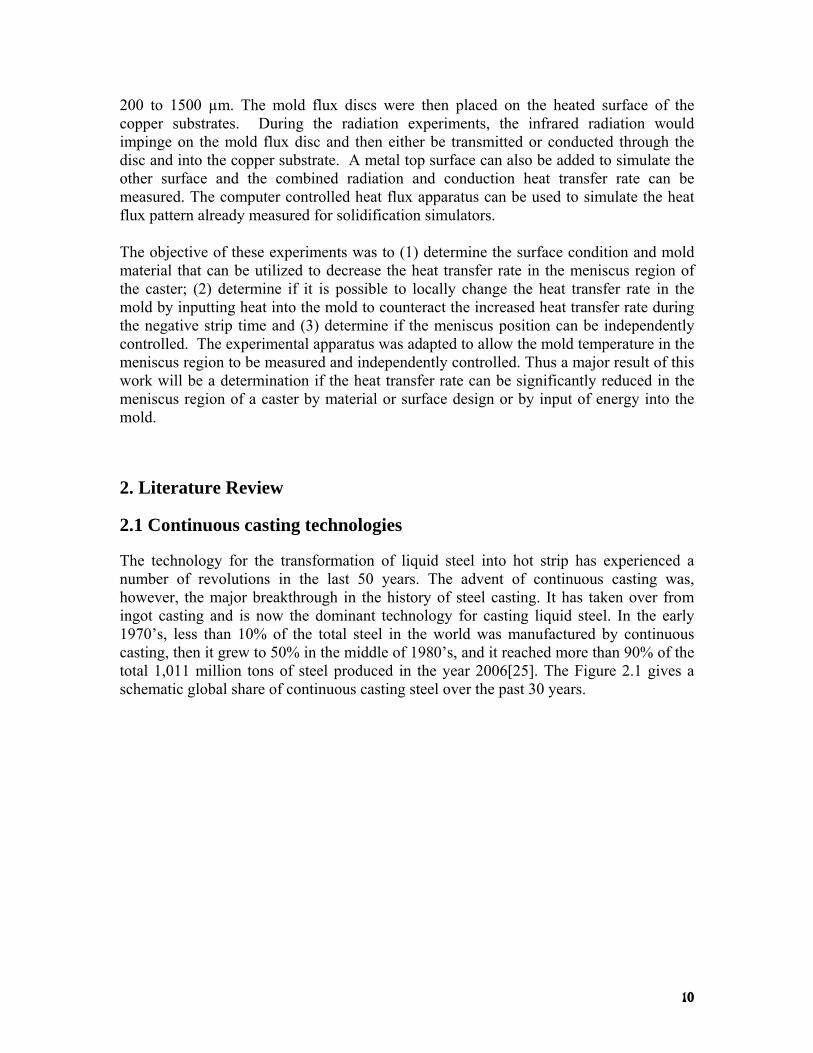
200 to 1500 µm. The mold flux discs were then placed on the heated surface of the copper substrates. During the radiation experiments, the infrared radiation would impinge on the mold flux disc and then either be transmitted or conducted through the disc and into the copper substrate. A metal top surface can also be added to simulate the other surface and the combined radiation and conduction heat transfer rate can be measured. The computer controlled heat flux apparatus can be used to simulate the heat flux pattern already measured for solidification simulators.
The objective of these experiments was to (1) determine the surface condition and mold material that can be utilized to decrease the heat transfer rate in the meniscus region of the caster; (2) determine if it is possible to locally change the heat transfer rate in the mold by inputting heat into the mold to counteract the increased heat transfer rate during the negative strip time and (3) determine if the meniscus position can be independently controlled. The experimental apparatus was adapted to allow the mold temperature in the meniscus region to be measured and independently controlled. Thus a major result of this work will be a determination if the heat transfer rate can be significantly reduced in the meniscus region of a caster by material or surface design or by input of energy into the mold.
2. Literature Review
2.1 Continuous casting technologies
The technology for the transformation of liquid steel into hot strip has experienced a number of revolutions in the last 50 years. The advent of continuous casting was, however, the major breakthrough in the history of steel casting. It has taken over from ingot casting and is now the dominant technology for casting liquid steel. In the early 1970’s, less than 10% of the total steel in the world was manufactured by continuous casting, then it grew to 50% in the middle of 1980’s, and it reached more than 90% of the total 1,011 million tons of steel produced in the year 2006[25]. The Figure 2.1 gives a schematic global share of continuous casting steel over the past 30 years.

11
0
10
20
30
40
50
60
70
80
90
100
1970 1975 1980 1985 1990 1995 2000 2005
Year
Ratio
in %
Figure 2.1: Global share of continuous casting steel over the years [26]
The general view of a continuous slab caster is given in Figure 2.2 [27]. The molten steel flows from a ladle, through a tundish into the mold. The tundish, a vessel that regulates the quantity of liquid iron that enters the mold, holds enough metal to provide a continuous flow to the mold. In addition, it enhances oxide inclusion separation and stabilizes the flow patterns of steel in the mold. The liquid metal then flows into the mold through ceramic submerged entry nozzles. The liquid steel must be protected from exposure to air by using a liquid slag to cover its top surface and by using a ceramic nozzle between the tundish and the mold.
China
Japan
USA
World

12
Figure 2.2: General view of a continuous slab caster [27]
The mold, made of a copper alloy, is water cooled, such that once metal exits the mold at the other extremity, the solidified shell is thick enough (1-2 cm) for the strand to support itself. In order to prevent the metal sticking to the mold and to facilitate movement, not only is lubrication needed (either oil or slag), but the mold oscillates vertically. The interior faces of the mold are coated with materials like nickel and chromium to increase mold life and avoid defects due to copper pick up from the mold during continuous casting. These molds are typically 1 meter long, and the steel needs from 20 seconds to one minute to go from the nozzle to the exit of the mold [27, 28]. The strand progresses at a speed varying between a few tens of centimeters per minute and a few meters per minute. The role of the mold is crucial: not only a sufficient amount of heat must be removed to form a solid shell, but improper conditions of heat transfer may result in defects in the final product. The most important part of this process is the initial solidification at the meniscus, which is where the top of the shell meets the mold, and the liquid surface. This is the place where the surface of final product is developed, and it is also the original source for the formation of oscillation marks, surface cracks and other defects. Mold slag is added to the liquid steel surface in the mold and covers the meniscus area. It then infiltrates the gap between the stand and copper mold to lubricate the contact, protect the steel from air, absorb inclusions and provide a thermal resistance to moderate heat transfer rates.
Drive rolls lower in the machine continuously withdrawing the shell from the mold at a “casting rate” that matches the incoming flow rate, such that the whole process is in a steady state. As the skin cools and contracts, a gap forms between the wall and the strand, which fills with mold slag and leads to a decreased heat transfer rate, for this reason most
Tundish

13
molds are tapered to account for shrinkage as the steel shell cools. Upon leaving the mold, the steel shell is not strong enough to support the internal pressure caused by the column of liquid steel yet to solidify, therefore it is supported by closely spaced rollers. Water or air mist sprays cool the surface of the strand between the supported rolls. The strand is then bent to the horizontal position while it is rigorously water or air cooled, so that the mostly liquid strand is totally solidified within the containment length of the machine. Finally, when fully solidified, the strand is cut into pieces by a cutting torch.
Different continuous casting processes produce different cross sectional shapes and sizes. Four piece plate molds with rigid backing plates are used to cast large and rectangular slabs; while single piece tube molds are used to cast small, square billets that could be rolled into long products, like nails, rails, etc.
2.2 Heat transfer and solidification during continuous casting
Heat transfer in the mold is one of the most important phenomena during the continuous casting of steel, as it strongly influences the surface quality of cast slabs. A significant amount of work has been done to characterize the heat transfer conditions in a continuous casting mold [5, 6, 10, 29-34]. The occurrence of surface defects on a continuous cast steel slab is strongly influenced by the heat transfer rate during initial solidification of the slabs in mold. An excessively large local heat flux can cause longitudinal surface cracks on the slab [10], consequently, control of the heat flux in the mold is an important issue to produce defect free slabs.
2.2.1. General heat transfer considerations in the mold
As the importance of heat transfer in the mold has been recognized, research has been conducted to explore the overall heat transfer behavior and its influence on final slab quality. For example, some research and plant data indicate that if the rate of heat flux is excessively large and varied across the width, it will thermally introduce stresses, leading to longitudinal cracks. On the other hand, insufficient local heat removal tends to cause a thin strand shell that is more prone to bulging and breakouts. Therefore, the general heat transfer or the method of heat removal in continuous caster mold must be understood.
When the liquid steel flows from the submerged entry nozzle into the copper mold, it brings a large amount of super heat as casting temperatures are 20 to 50 Co above the liquidus. The mold must be cooled by flowing water to remove the super heat from the liquid steel and then the latent heat in order to initiate the solidification of steel during continuous casting. The slag powder that covers the top of the liquid steel pool to prevent the oxidation of steel will form a liquid layer and infiltrate any gap between the strand and copper mold as shown in Figure 2.3. Therefore, there exists an extreme temperature gradient from the steel shell through mold flux to the mold.

14
Figure 2.3. The schematic figure of the top of the mold [78]
The corresponding schematic of temperature profile and thermal resistance is shown in Figure 2.4. Therefore, the heat transfer sequence from liquid/solid interface to the mold is commonly described as occurring in the following steps:
(1) Convection from the liquid steel pool to the growing steel shell (2) Conduction through the strand shell (3) Heat transfer across the mold flux layer infiltrating mold/shell gap, which includes
radiation and conduction (4) Heat transfer across the gap separating the flux film and mold, i.e. the contact
resistance between the mold slag and the mold (5) Conduction through the mold walls (6) Convection from the mold surface to the cooling water flowing through the mold

15
Figure 2.4. Schematic temperature profile and heat transfer resistances across shell to mold
Usually the mold heat transfer is regulated by those factors that determine the contact resistance thickness, as well as the properties of the flux infiltrating between the solid shell and the mold wall [3, 4]. Traditional casting parameters like casting speed, steel composition, and casting powder properties have been recognized as the major controlling factors in the achieved heat transfer rate [35, 36]. Other researchers [3, 4] also have pointed out that mold geometry, oscillation frequency and hydrogen content in the liquid steel have also been thought to be related to the heat flux in the mold.
Among all of these factors, mold flux infiltration between the mold and steel shell is widely used to control the heat transfer rate to achieve an excellent surface quality of the final product of casting.
2.2.2. Heat withdraw in the mold
The molds used in continuous casting are copper alloys and cooled with water, where the cooling length is usually around 600 mm. Mold flux is widely used in continuous casting as a lubricant. It is made of mineral materials that fuse to form the slag. The melting range of the flux is around 1100-13000C, depending upon its chemical composition. The part in contact with the hot strand would be liquid. Since there may exist a high cooling rate between the hot slag and the copper mold, the layer closest to copper mold would be initially a solid glass phase. There will be a heterogeneous zone between the liquid and the solid parts consisting of a crystal-melt mixture. The shrinkage, because of thermal or solidification contraction will be addressed in detail later. Local gap formation may occur between the mold flux and mold. Therefore, the mechanism of heat transfer across the strand to the copper mold is complex, involving thermal resistances in the molten steel, shell strand, mold flux, gap, and copper wall as shown in Figure 2.4. Some literature
Temperature
Position
Flux (melt)
T mpt
Shell Flux(Cry. &Glass)
Mold
Tshell
R1 R2 R3 R3 R4 R5
Tmold Tflux
Contact resistance

16
reviews about heat transfer from the liquid pool to the copper mold according to the steps as shown in section 2.2.1 are summarized in the following sections.
2.2.2.1. Heat convection from liquid pool
The superheat absorbed and carried by the liquid steel, which is proportional to the molten steel heat capacity, cp, the temperature gradient, ΔT, and the liquid volume, V, i.e., TVcq vpsh Δ= , , must be removed before the solidification of liquid steel. The super heat is not uniformly distributed due to turbulent convection in the liquid pool. Meng and Thomas [37] have stated that the super heat flux, qsh, which dissipates to the solid/liquid interface, is a function of the distance below the meniscus, they also found that the super heat flux varies linearly with superheat temperature difference and it is proportional to casting speed. Meng and Thomas then adjusted the superheat flux function corresponding with current superheat temperature difference, spTΔ , and casting speed, Vc, as shown in the following equation.
co
spo
cspsh
osh vT
vTqq
Δ
Δ= (2.1)
where qosh is the superheat flux from the database with conditions of the matched super
heat temperature difference ΔTosp and casting speed Vo
c. Figure 2.5 gives one example of the superheat flux function, which represents results for a typical bifurcated, downward-directed nozzle. It is shown that the influence of this function is insignificant to shell growth over most of the wide face.

17
Figure 2.5. Model of solidifying steel shell domain showing heat flux conditions [37]
2.2.2.2. Heat conduction through the strand shell
As the solidification of the strand shell progresses, the latent heat from molten steel will dissipate to the thin shell, leading to the heat conduction through the thin steel shell in a slab mold, which is governed by the transient heat conduction equation. The inverse heat conduction method for estimating the heat flux history for a solid by utilizing measured transient interior temperature was adopted as follows. The 1-D transient heat conduction equation is:
)(**xTk
xtTC p ∂
∂∂∂
=∂∂ρ (2.2)
here Cp, ρ, k and T are steel heat capacity, density, thermal conductivity and temperature of the shell. If the thermal conductivity of the solidified shell is varying with the thickness x, the inverse heat conduction equation would be changed to:
xT
xk
xTk
tTC p ∂
∂∂∂
+∂∂
=∂∂ )(** 2
2
ρ (2.3)
The inverse solution methodology for this type of problem was developed by Beck and if one has knowledge of the temperature profile in the mold as a function of time, it is
18
possible using Beck’s algorithm to calculate a corresponding heat flux that accounts for the measured temperature profile.
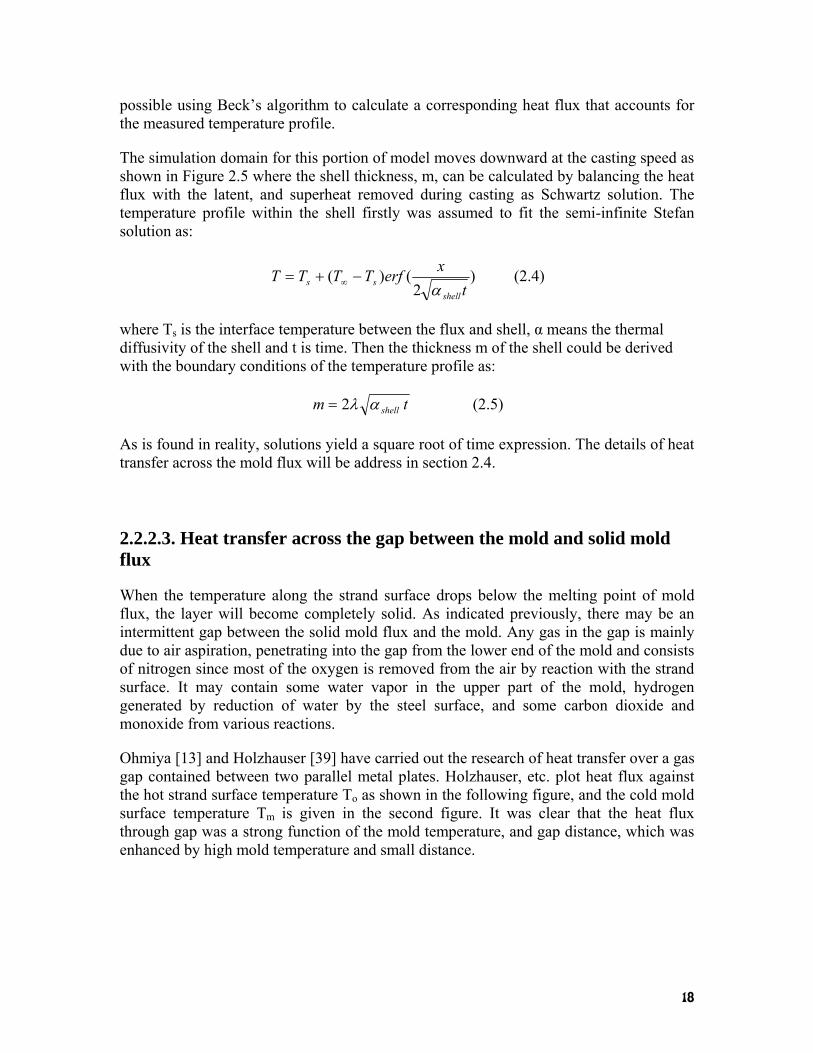
The simulation domain for this portion of model moves downward at the casting speed as shown in Figure 2.5 where the shell thickness, m, can be calculated by balancing the heat flux with the latent, and superheat removed during casting as Schwartz solution. The temperature profile within the shell firstly was assumed to fit the semi-infinite Stefan solution as:
)2
()(t
xerfTTTTshell
ss α−+= ∞ (2.4)
where Ts is the interface temperature between the flux and shell, α means the thermal diffusivity of the shell and t is time. Then the thickness m of the shell could be derived with the boundary conditions of the temperature profile as:
tm shellαλ2= (2.5)
As is found in reality, solutions yield a square root of time expression. The details of heat transfer across the mold flux will be address in section 2.4.
2.2.2.3. Heat transfer across the gap between the mold and solid mold flux
When the temperature along the strand surface drops below the melting point of mold flux, the layer will become completely solid. As indicated previously, there may be an intermittent gap between the solid mold flux and the mold. Any gas in the gap is mainly due to air aspiration, penetrating into the gap from the lower end of the mold and consists of nitrogen since most of the oxygen is removed from the air by reaction with the strand surface. It may contain some water vapor in the upper part of the mold, hydrogen generated by reduction of water by the steel surface, and some carbon dioxide and monoxide from various reactions.
Ohmiya [13] and Holzhauser [39] have carried out the research of heat transfer over a gas gap contained between two parallel metal plates. Holzhauser, etc. plot heat flux against the hot strand surface temperature To as shown in the following figure, and the cold mold surface temperature Tm is given in the second figure. It was clear that the heat flux through gap was a strong function of the mold temperature, and gap distance, which was enhanced by high mold temperature and small distance.

19
Figure 2.6. Heat transfer through gap filled with nitrogen-hydrogen gas [39]
The overall heat flux across the gap can be written as the sum of conductive and radiative parts as suggested by Siegel and Howell [40].
rc qqq += (2.6)
which are independent of each other and are given as:
dxdTkq gasc = (2.7)
1)(
110
40
4
−+−
= −−m
mr
TTqεε
σ (2.8)

20
Since the thermal conductivity for 95% N2 and 5% H2 is expressed as: )/(1032.61090.5 68.1868.04
22 mKWTTk HN−−
− ×+×= , the calculated conduction heat transfer flux, the total heat flux was given as follows:
1)()(1036.2)(1051.3
11
440
68.268.2868.168.10
4
−+
−+
−×+−×= −−
−−
mo
m
gap
mom TTd
TTTTq
εεσ
(2.9)
Hiroyuki, etc [41] investigated the interfacial thermal resistance between the copper mold and mold flux by pouring molten mold flux onto copper plate, and recording the mold temperature and subsurface temperature histories. The interfacial thermal resistance was calculated by the measured heat flux through copper mold and the mold surface temperature change.
Figure 2.7. Calculated interfacial thermal resistance for different mold flux [41]
The resistance values are in good agreement with previously reported by Nakato et al [42] (3-9 cm2 KW-1), and Yamauchi et al. [43] (4-8 cm2 KW-1).
2.2.3. Effect of carbon content of cast steel on heat transfer rate
The effect of the carbon content of cast steel has been regarded as one important factor controlling the overall heat transfer rate in continuous casting, because the carbon content tends to affect the final slab surface, which in turn influences the overall heat transfer rate [6, 34]. In the early mold simulator studies, Singh and Blazek [6] investigated how the surface rippling phenomena in low carbon steels influenced the overall heat transfer rates by employing a stationary continuous casting mold simulator without mold flux. Measurements of the cast steel shell thickness were taken and were shown in Figure 2.8. They found that the low carbon steel exhibited a dramatically rippled surface at 0.05% C; however, the high carbon (0.9% C) was relatively smooth.

21
Figure 2.8: Thickness of the shell in the mold below meniscus [6]
The mold was instrumented with thermocouples to determine the mold thermal distribution and to examine its dependence upon the carbon content of the steel being cast. It was found that the mold temperatures reduced significantly when casting steels with carbon content around 0.1%. This could explain why the 0.1% carbon steel has the roughest surface as shown in Figure 2.8. Therefore, the corresponding in-mold temperatures were lowest due to the least contact between the steel shell and the mold.
The in-mold heat transfer rate was calculated by the cooling water temperature gradient. The relative results of the effect of carbon content of steels on the overall heat transfer rates were shown in Figure 2.9. It has been found that the mold heat transfer rate had a sharp minimum for steels with 0.10% C, and that the mold heat flux was independent of the steel carbon content when the steel carbon composition is above 0.3% C as shown in Figure 2.9.

22
Figure 2.9: Effect of carbon content on mold heat transfer rate during continuous casting
[6]
Grill and Brimacombe [34] conducted further research of the carbon content and its effect on heat transfer rates via statistical analysis of the data acquired from industrial continuous casting machines. Their findings pointed out that the mold heat transfer rate achieved a maximum at 0.3% C and decreased with increasing carbon contents above 0.3% C, as is shown in Figure 2.10.
Figure 2.10: Influence of carbon content of steel cast on overall mold heat flux [34]
They even proposed a more refined mechanism of the surface rippling for low carbon steels. There is a rapid cooling (>100oC/s) outside of copper mold that allows a δ to γ phase transformation on the mold side of the shell, while the liquid side remains unchanged δ phase. This transformation is maximized at 0.10% C, which induces a tensile stress on the mold side while a compressive stress is developed on the liquid side.

23
Thus a gap is formed due to the steel shell bending into the liquid steel when the forces on the shell overcome the ferrostatic pressure. Therefore, the local heat transfer rate across the gap attenuated, which in turn leads to the localized heating of the shell in the vicinity of the bending gap. This localized heating will reduce the strength of the shell enough that the ferrostatic pressure can cause the shell to re-bend towards the mold.
Sugitani and Nakamura [44] suggested the initial solidified shell deforms in the convex way instead of the concave way of Grill and Brimacombe where they thought that the shrinkage of the shell around the liquid/solid interface is larger than that of subsurface. Suzuki etc. [45] carried out experiments to understand the heat transfer anomaly and solidifying shell deformation of peritectic steels in continuous casting. In their experiments, they found that the calculated heat flux from the temperature measurement for 0.126 mass% C steel exhibits a lower value than that of others as shown in following figure.
Figure 2.11. Heat flux on the mold surface vs time from the start of casting [45]
The peak value of the heat flux is given in Figure 2.12 as a function of carbon content. The peak heat flux for peritectic medium carbon is much lower than that for others, similar to the observation of Singh and Blazek.

24
Figure 2.12: The effect of carbon content on the heat flux [45]
They pointed out that peritectic medium carbon steels exhibit an anomalous decrease of the heat flux on the mold surface, due to the surface roughness of the solidifying shells, whereas ultra low carbon steel exhibits large heat flux despite large surface roughness. The difference is caused by the fact that the roughness of ultra low carbon arises from δ/γ transformation which occurred later than the completion of solidification. The shrinkage of the solidifying steel of peritectic medium carbon steel becomes significant just after the start of solidification and the shrinkage rate remains the largest among others. However, Suzuki did not explain well the exact mechanism of the initial steel deformation; it is due to δ/γ transformation or due to the different solidification rate or something else.
2.2.4. Effect of casting speed on heat transfer rate
Casting speed has been studied intensively in the early 1950s as an important effect on heat transfer rate. Savage and Pritchard [5] pointed out that the local heat flux on the mold is only a function of the residence time of the steel in the mold.
Wolf [28] conducted a broad survey of mold heat flux measured in plant operations. Based on observations of plant measurements, Wolf determined that in oil lubricated castings, the carbon content of the steel and the mold geometry had the strongest influence on the heat flux; while the slag viscosity was the controlling factor for mold flux lubricated casting. The relationship between average heat flux on the mold in a closed pouring mold with slag powder and the residence time of the steel in the mold, tm is: 5.013700 mt≈Η . Blazek et al. [46] stated that the mold flux reduces the heat transfer rate in the mold. In addition, results were also presented showing the relationship between the mold heat transfer rate and the casting speed in Figure 2.13. However, they did not give much more explanation of why the increase of casting speed leads to a higher heat flux in the continuous caster mold.

25
Figure 2.13: Effect of casting speed on the mold heat transfer rate for 0.1% carbon steels [46]
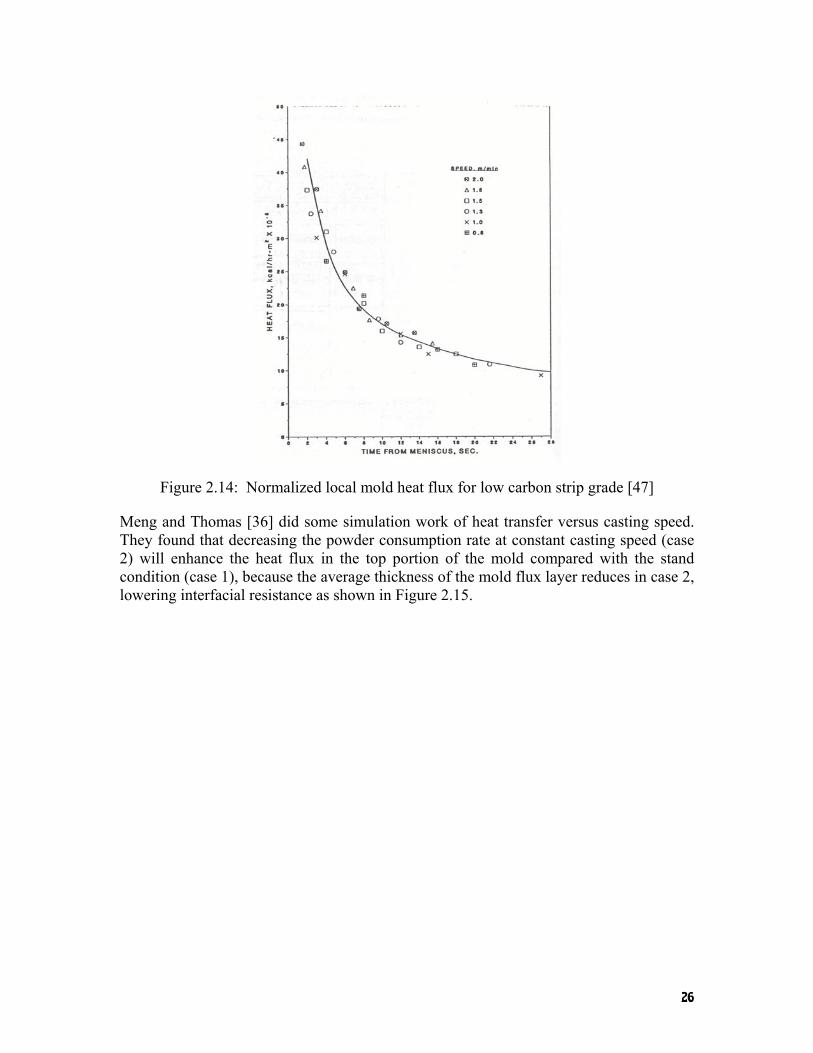
The assumption of the residence time was proved by Gilles [47] who proposed that even though the heat flux increases with increasing casting speed, the heat flux could be normalized by considering the heat flux as a function of time from the meniscus instead of distance from the meniscus. It was found that the heat flux data converges to a single curve for a wide range of casting speeds (0.6 – 2.0 m/min) as shown in Figure 2.14.
26
Figure 2.14: Normalized local mold heat flux for low carbon strip grade [47]
Meng and Thomas [36] did some simulation work of heat transfer versus casting speed. They found that decreasing the powder consumption rate at constant casting speed (case 2) will enhance the heat flux in the top portion of the mold compared with the stand condition (case 1), because the average thickness of the mold flux layer reduces in case 2, lowering interfacial resistance as shown in Figure 2.15.

27
Figure 2.15. Effect of casting speed on heat flux profile [37]
The practical case of increasing casting speed and simultaneously reducing total powder consumption rate (case 3) will enhance heat flux toward the bottom of the mold. This is due to the lower thermal resistance of a thinner steel shell produced with less solidification time, which becomes predominant with distance down to the bottom of mold. The net result of increasing casting speed is to increase heat flux almost uniformly down to the mold, which is reflected in Figure 2.16 as the uniformly higher case 3 temperature.
Figure 2.16. Effects of casting speed on mold temperature [37]
28
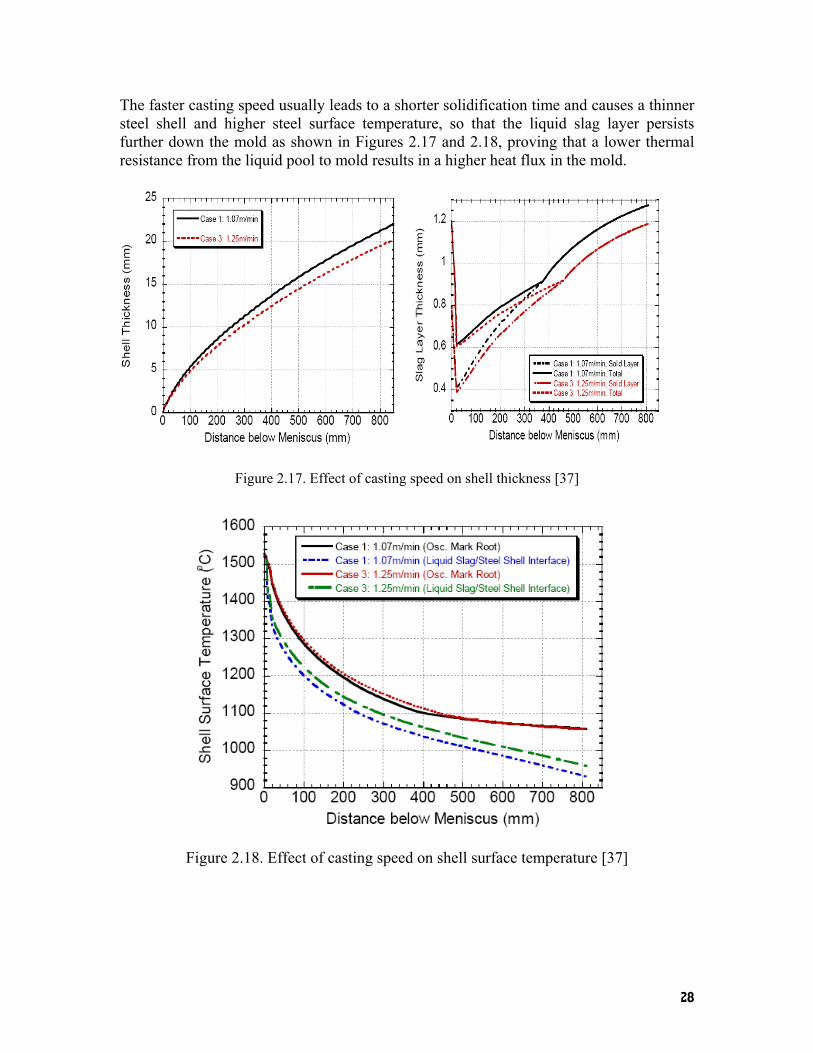
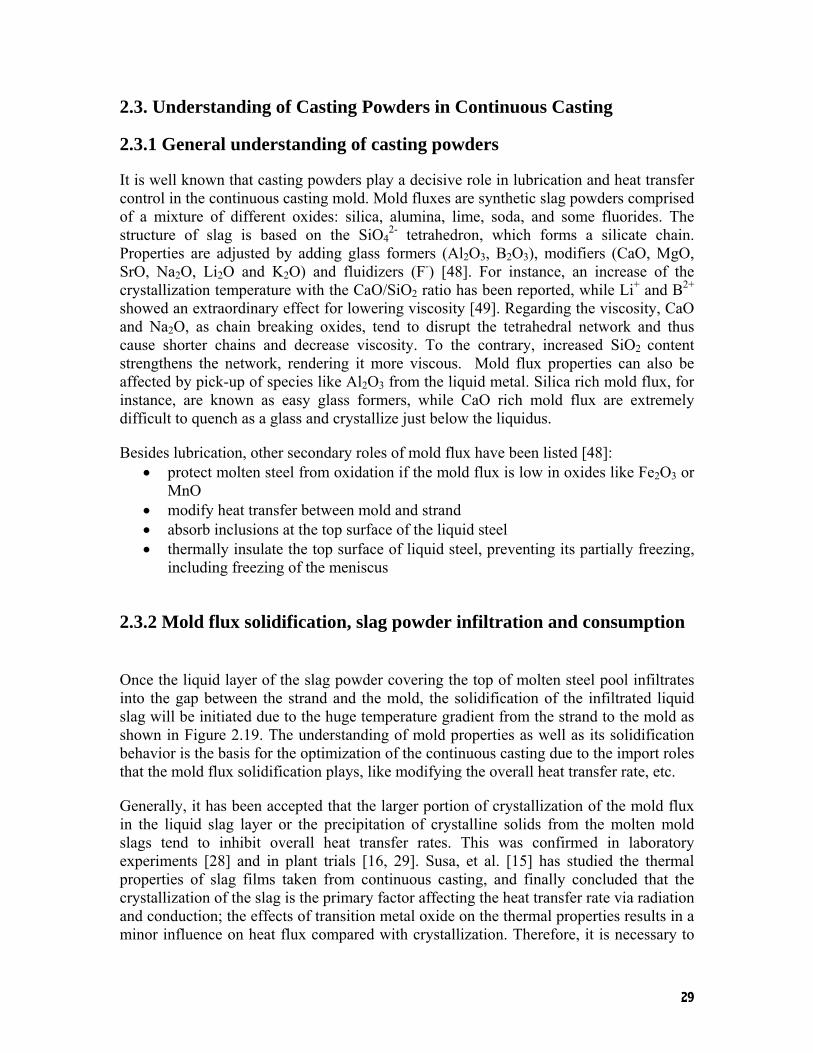
The faster casting speed usually leads to a shorter solidification time and causes a thinner steel shell and higher steel surface temperature, so that the liquid slag layer persists further down the mold as shown in Figures 2.17 and 2.18, proving that a lower thermal resistance from the liquid pool to mold results in a higher heat flux in the mold.
Figure 2.17. Effect of casting speed on shell thickness [37]
Figure 2.18. Effect of casting speed on shell surface temperature [37]
29
2.3. Understanding of Casting Powders in Continuous Casting
2.3.1 General understanding of casting powders
It is well known that casting powders play a decisive role in lubrication and heat transfer control in the continuous casting mold. Mold fluxes are synthetic slag powders comprised of a mixture of different oxides: silica, alumina, lime, soda, and some fluorides. The structure of slag is based on the SiO4
2- tetrahedron, which forms a silicate chain. Properties are adjusted by adding glass formers (Al2O3, B2O3), modifiers (CaO, MgO, SrO, Na2O, Li2O and K2O) and fluidizers (F-) [48]. For instance, an increase of the crystallization temperature with the CaO/SiO2 ratio has been reported, while Li+ and B2+ showed an extraordinary effect for lowering viscosity [49]. Regarding the viscosity, CaO and Na2O, as chain breaking oxides, tend to disrupt the tetrahedral network and thus cause shorter chains and decrease viscosity. To the contrary, increased SiO2 content strengthens the network, rendering it more viscous. Mold flux properties can also be affected by pick-up of species like Al2O3 from the liquid metal. Silica rich mold flux, for instance, are known as easy glass formers, while CaO rich mold flux are extremely difficult to quench as a glass and crystallize just below the liquidus.
Besides lubrication, other secondary roles of mold flux have been listed [48]: • protect molten steel from oxidation if the mold flux is low in oxides like Fe2O3 or
MnO • modify heat transfer between mold and strand • absorb inclusions at the top surface of the liquid steel • thermally insulate the top surface of liquid steel, preventing its partially freezing,
including freezing of the meniscus
2.3.2 Mold flux solidification, slag powder infiltration and consumption
Once the liquid layer of the slag powder covering the top of molten steel pool infiltrates into the gap between the strand and the mold, the solidification of the infiltrated liquid slag will be initiated due to the huge temperature gradient from the strand to the mold as shown in Figure 2.19. The understanding of mold properties as well as its solidification behavior is the basis for the optimization of the continuous casting due to the import roles that the mold flux solidification plays, like modifying the overall heat transfer rate, etc.
Generally, it has been accepted that the larger portion of crystallization of the mold flux in the liquid slag layer or the precipitation of crystalline solids from the molten mold slags tend to inhibit overall heat transfer rates. This was confirmed in laboratory experiments [28] and in plant trials [16, 29]. Susa, et al. [15] has studied the thermal properties of slag films taken from continuous casting, and finally concluded that the crystallization of the slag is the primary factor affecting the heat transfer rate via radiation and conduction; the effects of transition metal oxide on the thermal properties results in a minor influence on heat flux compared with crystallization. Therefore, it is necessary to

30
understand the precipitation of crystalline solids, the growth of these crystals and how this crystallization affects heat transfer rate in continuous casting.
Figure 2.19. General figure of the mold flux in continuous casting [78]
In order to understand the precipitation of a second solid phase from a liquid, the thermal field and phase diagram should be defined and the crystals nucleation and growth mechanism should be studied. The conditions under which glass formation is possible and the conditions under which the solidification is initiated should be described. Therefore, the construction of isothermal time temperature transformation diagrams (TTT curves) is desirable to understand crystals growth rate and evolution with time under different cooling conditions. Thus, the crystallization of mold flux and how it modifies heat transfer rate in continuous casting should be researched. A new technology by Kashiwaya, et al. [20] at Carnegie Mellon University, the Double Hot Thermocouple Technique (DHTT), was successfully developed to allow the study of the kinetics of mold flux crystallization. An example TTT diagram constructed upon DHTT is shown in Figure 5.20, where the crystals growth rate could be clearly measured as a function of time, cooling rates, etc.
LIQUID FLUX
SOLID FLUX
MENISCUS REGION
CO
PPER
M
OL
D
OM
Glass layer
MENISCUS
1 mm
MOLTEN STEEL POOL
ARGON BUBBLES
Metal entry from nozzle
Crystalline layer
STEELSHELL

31
Figure 2.20 A example TTT diagram from Kashiwaya [20]
Various studies as indicated previously have shown that the slag film infiltrated between mold and strand contains three layers: a glass zone close the mold, a crystalline layer in the center and a liquid film in contact with the shell, because of their chemical composition and the variety of temperature gradients between the hot steel strand and the cold water-cooled mold.
Figure 2.21 Sample of slag layer and its microstructure [62]

32
A 20cm long piece of slag film taken from the corner of an operating caster mold was shown in Figure 2.21(a). Many researchers believe that a glassy slag layer forms against mold wall due to the high cooling rates during initial contact of the molten slag with the water-cooled copper mold. A liquid layer is present when the shell surface temperature is higher than the melting point of the slag powder. The crystalline phase forms in between the molten layer and the solid glass mold flux layer as shown in Figure 2.21.
When casting powder is fed on top of the liquid steel, the carbon added with the powder will combust due to the high temperature and source of oxygen. After that the powder will start to sinter and melt and eventually produce a pool of liquid slag covering the surface of the liquid steel. During each oscillating stroke, the liquid slag is pumped from the meniscus into the gap between the steel shell and the mold wall to act as a lubricant. The re-solidified mold powder adjacent to the mold wall cools dramatically to form a solid glass phase layer. The solidified portion is thicker near and above the meniscus area, where it is called the “slag rim”. The relatively solid slag layer often sticks to the mold wall, although it is sometimes dragged intermittently downward at an average speed less than the casting speed [50]. When a solid layer stably attaches to the mold wall, the remaining liquid slag layer will move downward, causing slag to be consumed at a rate balanced by the replenishment of solid slag powders which were put from the top surface of mold, as long as the steel shell temperature remains above the mold flux crystallization temperature. It is of importance to know the quantity of mold flux that actually infiltrates the gap as it influences heat transfer rate, and it changes the thickness of the liquid slag layer and modifies the temperature distribution. One part of the slag solidifies until the thickness of this phase reaches a certain limit [51], whereas the other part is consumed. The solid thickness is usually 1 to 3 mm; however, the liquid film thickness is around 0.1 mm [4]. Consumption of flux increases with decreasing viscosity and decreasing oscillation frequency, while increasing withdrawal speed doesn’t have any effect. Increasing steel temperature also increases powder consumption [52, 53]. It is often expressed in Kg/m2, given that it is proportional to the surface of the mold. It can be measured by weighting the slag remaining on top of the meniscus at the end of the sequence.
Wolf [28] established an empirical relation for flux consumption:
1.016055.05.0
2 +⎟⎟⎠
⎞⎜⎜⎝
⎛⎟⎟⎠
⎞⎜⎜⎝
⎛=
cVfQ
μ (2.10)
here f is oscillation frequency, Vc means oscillating velocity, and μ represents for viscosity. Another empirical correlation was established between the flux consumption, the positive strip time tP and a new parameter defined as negative strip area ratio RNA (i.e. the distance covered by the mold over the steel shell during the negative strip time over the total distance covered by the mold during one cycle) [54]. The following formula was obtained:

33
Flux consumption = 0.047+0.202.RNA0.3.tP
0.5 (2.11)
T. Emi et al.[55] studied variation of slag thickness when viscosity, withdrawal speed and oscillation frequency varied. He based his results on the average slag consumed, so the results he achieved represented only the liquid layer of slag.
2.3.3 Mold flux friction
Powder lubrication leads to more uniform and usually lower heat transfer rates compared with oil lubrication [56]. Therefore, layers of mold slag comprise a large resistance to the heat removal, although they provide uniformity relative to the alternative of an intermittent vapor gap found with oil casting of billets. Heat transfer across the mold flux depends upon the thickness of the mold flux layer [57], and thermal properties, like thermal conductivity, crystallization temperature, viscosity, and its state [58]. It was reported that the slag conductivity dominates heat transfer across the crystalline layer. However, radiation is very important through the glass and liquid layer. Crystalline slag flux with high solidification temperature reduces mold heat transfer due to the lower conductivity of crystalline slag and the thicker solid layer. Usually the slag conductivity depends mainly on the crystallinity of the slag layer and on the internal evolution of its dissolved gas to form bubbles.
The hydrostatic pressure of the molten steel forces the unsupported shell against the mold wall, causing friction between the strand shell and the oscillating mold. The friction becomes especially significant at the bottom of the narrow faces due to the excessive taper which squeezes the wide face shell. Misalignment of the mold and strand will increase friction if the stroke is large. Suzuki al et [45] pointed out that friction can cause fracture of the solidified layer which gives rise to local heat flux fluctuations, and the accompanying temperature and stress variations in the shell could lead to quality problems, like shell tearing, sticking and even breakouts [59,60]. Emling and Dawson [61] suggested that if the friction signal can be better understood, friction monitoring could be used to identify the status of mold lubrication to predict surface defects and to help prevent breakouts. Shrinkage of the steel shell away from the mold walls may generate contact resistance or air gap, which act as a further resistance to heat flow, especially after the slag is completely solid and unable to flow into the gaps. The surface roughness depends on the tendency of the steel shell to ripple during solidification at the meniscus to form an uneven surface with deep oscillation marks, which depends on the oscillation practice, the slag rim shape and properties, and the strength of the steel grade relative to ferrostatic pressure, mold taper, and mold distortion.

34
2.3.4 Mold flux thermal and physical properties
2.3.4.1 Refractive index
When light travels in a mold flux layer, it tends to interact with ions. The refractive index of slag, n, gauges the magnitude of the interaction between light with ions in slags causing the decrease in the velocity of the absorbed radiation and changes in the direction. Therefore, the larger the refractive index is, the stronger the interaction will be. It can be measured with a refractometer or ellipsometer [63], but the measured value depends on the slag composition, incident wavelength, the surface condition and the liquid used. The refractive index value for glassy mold fluxes at room temperature ranges from 1.58 to 1.7. It also could be calculated by a simple empirical equation [79].
∑=−
i
ii
MNn
100)1(
ρ (2.12)
where n stands for refractive index, ρ means the density (g cm-3) of the slag, and Ni and Mi are the specific refractive index of the various oxides in the slag, and mass % respectively.
2.3.4.2 Extinction coefficient
When there is an incident light applied to a mold flux sample, some portion would be reflected; the rest will be absorbed and transmitted. Once the absorbed photon travels through the medium, there is an exponential decay according to experimental results and theoretic derivation, and this exponential decay was defined as Beer’s law. Therefore, the part of the energy transmitted through the medium is strongly dependent upon this attenuation part and described as equation 2.13.
)exp( dατ −= (2.13)
where τ is transmittance, α is absorption coefficient and d is thickness. The extinction (absorption) coefficient, α, can be measured by measuring the transmittance of a sample whose length is known with a spectrometer. It is a function of the wavelength and the temperature, but is also dependant of the slag structure. The value for crystalline slag can vary between 1000 and 30,000 m-1 and from 200 to 1000 m-1 for glassy slag [68]. Since the wavelength in the continuous casting is in the infrared regime, the wavelength has limited effect of the extinction coefficient as shown in the Figure 2.22.

35
Figure 2.22. Absorption coefficient versus wavelength at room temperature [68]
As for the chemical composition, Susa et al. [76] reported that the absorption coefficient decreases with the increasing of basicity in the range of 0.35-1 um for the system of SiO2-Fe2O3-CaO-Al2O3, and they also concluded that the absorption coefficient is also increasing with the addition of Fe+3 ions. J. Cho et al. [68], reported that the selected absorption coefficient and extinction coefficient observed at different temperatures do not show abrupt changes for all wavelengths as shown in Figure 2.23. Averaged extinction coefficients show a small increase with the increase of temperature due to an enhanced scattering factor at an elevated temperature.
Figure 2.23 Change of absorption and extinction coefficient with temperature [68]

36
2.3.4.3 Heat capacity
Measurement of heat capacities for a glassy slag usually leads to values ranging between 1 and 10 J/(K•kg), since it usually varies with the change of temperature and the presence of glass transition temperature. An example of the mold flux heat capacity variance with the temperature is given in Figure 2.24, where the glassy specimen is depicted as the dotted line. Thus, the measurements of heat capacity, Cp, are difficult. The values can also be obtained by Differential Scanning Calorimetry (DSC) [4].
Figure 2.24. Heat capacity of mold flux as function of temperature [63]
2.4 Heat Transfer across Mold Flux in Continuous Casting
2.4.1 The mechanism of heat transfer across the mold flux
It is known that the mold flux film beneath the meniscus consists of two vertical parallel layers, a molten layer and a solid layer (crystal and glass film). The two layers provide the film with thermal resistance to the conductive and radiative heat transfer in the mold [19], and each part of the layer plays a different role in the heat transfer.
Due to the high temperature inside the mold, the heat is transferred from liquid steel across the mold flux to the caster mold through two mechanisms, i.e., lattice (photon) conduction and radiation. Therefore, the overall heat flux across the flux has been determined by a “defined” effective thermal conductivity of the mold flux, keff, and the flux temperature gradient, ΔT, over the thickness of the flux, d, as:

37
dTkq eff
Δ= (2.14)
For the semitransparent flux, this effective thermal conductivity keff, is usually split by the lattice conductive thermal conductivity, kc, and radiative thermal conductive term, kr, in following equation:
rceff kkk += (2.15)
In the liquid layer of the flux, the radiation conductivity kc is usually defined by:
ασ3
16 32Tnkr = (2.16)
where σ is the Stefan-Boltzmann constant, n stands for the refractive index, α represents the absorption coefficient, and T is the temperature (usually melting point) of the flux. Therefore, kr is around one order of magnitude higher than kc, where it can go up to 12.76 W/(mK) [73], and radiative heat flux is considered to dominate in the molten liquid flux layer.
As for the solid mold flux, it is usually composed of a crystalline layer developed towards the glassy layer adjacent to the mold. Therefore, it is quite difficult to split the overall heat flux into radiation and conduction. Yamauchi, etc. [43] reported the kc for a solid mold flux with low solidifying temperature is around 1.04 W/(mK), and kr for the same mold flux was around 0.24 W/(mK) determined via the gray gas approximation method where: )/()()]175.0/([ 44112
msmssmr TTTTddnk −−−++= −− εεασ . Thus the contribution of the radiative term is 20% of the total effective thermal conductivity and the ration of kr/k =0.23 at continuous casting temperatures. However, Emi, etc, investigated that the effective thermal conductivity, keff, is around 1.7-2.1 W/(mK) proportional to the disk thickness as shown in Figure 2.25, and suggested that the ratio of radiative conductivity to the conduction component of conductivity across the solid crystalline phase of mold flux is lower than 10% , kr/kc = 0.1[68]. The results of this study suggest that the effect of radiation hat transfer is closer to 20%.

38
Figure 2.25 The calculated effective thermal conductivity and flux thickness [68]
Therefore, it has been concluded that the radiative heat transfer plays an important role in the liquid layer and that it tends to be inhibited by the solid crystalline layer, such that the overall heat flux in the crystalline layer can be reduced by 20% upon complete crystallization of the slag. However, there is little knowledge of the ratio of the radiative to the conductive component in the glassy layer of the mold flux. This project will focus on the mechanism of radiative heat flux across the crystalline and glassy mold flux and quantify the degree to which it evolves with crystallization of the flux.
2.4.2 The effect of mold flux properties and thickness on heat flux
Research has been carried out to analyze the effect of mold flux properties such as: viscosity, glass transition temperature, crystallization temperature, etc, on the heat transfer rate [15, 16, 17, 20]. Heat transfer between the mold and the shell is greatly dependant on the slag properties present in the gap. Emi [52] mentioned that heat flux through mold has been found to increase with decreasing viscosity, glass transition temperature (Figure 2.26), melting range and crystallization temperature. As a low viscosity of the mold flux favors infiltration of the molten fluid from the upper part of the mold, it leads to higher flux consumption due to the formation a thicker lubricating film. Thus, decreasing viscosity increases flux consumption. Transition temperature seems to have a stronger effect: the higher it is, the thicker the solid phase is, which acts like a heat resistance.
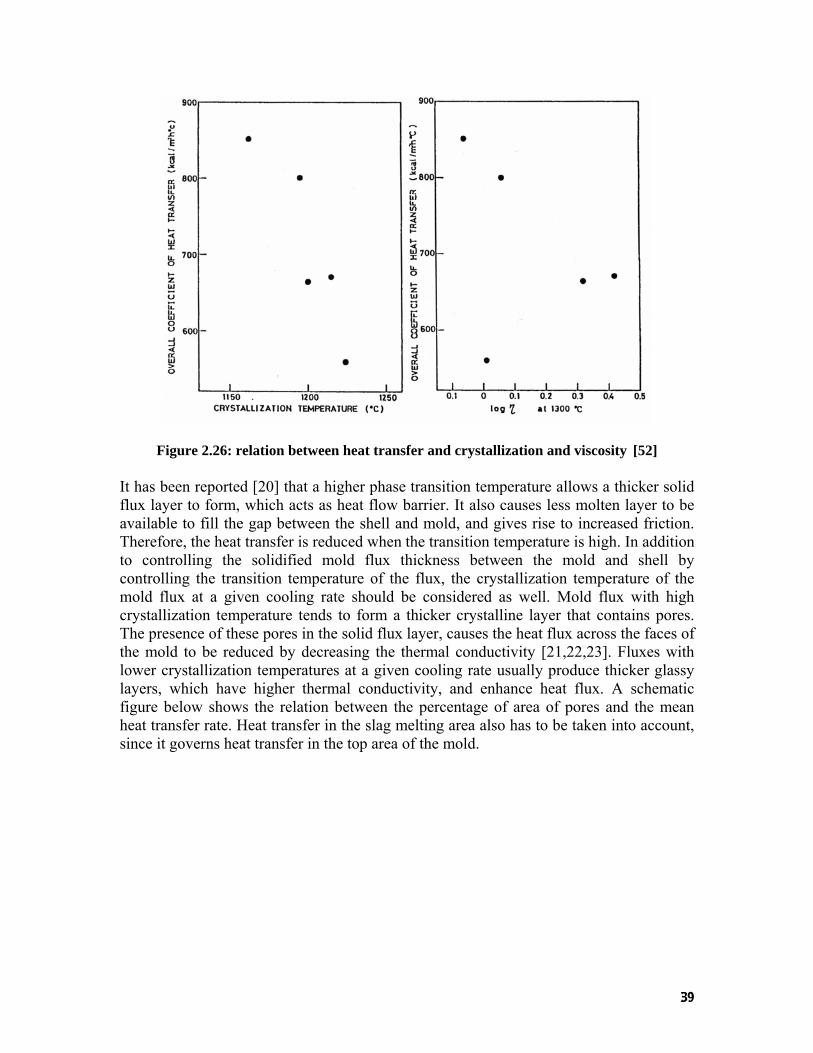
39
Figure 2.26: relation between heat transfer and crystallization and viscosity [52]
It has been reported [20] that a higher phase transition temperature allows a thicker solid flux layer to form, which acts as heat flow barrier. It also causes less molten layer to be available to fill the gap between the shell and mold, and gives rise to increased friction. Therefore, the heat transfer is reduced when the transition temperature is high. In addition to controlling the solidified mold flux thickness between the mold and shell by controlling the transition temperature of the flux, the crystallization temperature of the mold flux at a given cooling rate should be considered as well. Mold flux with high crystallization temperature tends to form a thicker crystalline layer that contains pores. The presence of these pores in the solid flux layer, causes the heat flux across the faces of the mold to be reduced by decreasing the thermal conductivity [21,22,23]. Fluxes with lower crystallization temperatures at a given cooling rate usually produce thicker glassy layers, which have higher thermal conductivity, and enhance heat flux. A schematic figure below shows the relation between the percentage of area of pores and the mean heat transfer rate. Heat transfer in the slag melting area also has to be taken into account, since it governs heat transfer in the top area of the mold.

40
130
135
140
145
150
155
160
0 2 4 6 8 10 12 14
Area of the pores (%)
Heat Transfer Rate (Kcar x
104 / m
2 hour) Viscosity (at 1573K)
1.0 Poise
Viscosity (at 1573K) 1.5 Poise
Figure 2.27. Relation between the percentage of area of pores and the mean heat transfer rate [23]
Occurrence of surface defects on continuously cast steel slags is strongly influenced by the heat transfer during initial solidification of the slabs in mold. The control of the heat flux in the mold based on a reliable heat analysis is an important issue to produce defect free slabs.
Many efforts have been concentrated on reducing the heat flux by increasing thermal resistance provided by mold flux film which infiltrates between mold and solidifying steel shell. The mold flux film for casting low carbon or medium carbon steel slab was shown to consist of two vertical parallel layers, melt and solid, by the observations beneath the meniscus [66, 67]. The two layers provide the film with thermal resistances to the conductive and radiative heat transfer in the mold [13]. In addition, experimental studies show that another thermal resistance caused by the air gap at mold /mold flux film interface plays an important role in the heat transfer in the mold. Thus, consideration of the thermal resistances arising from the molten layer, solid layer and the air gap is essential to carry out the heat transfer analysis in the mold.
Cho, Emi, and Suzuki [68-70] have done several research studies on the heat transfer rate across a mold flux film during initial solidification in continuous casting. Two kinds of mold fluxes, commercial mold flux for high speed casting of low carbon steel (LC) and medium carbon steel (MC) were studied in their papers. A mold flux was placed on a steel plate, which was then heated from the bottom to make the temperature at the steel plate/flux melt interface (TLS) close to the temperature near the meniscus part of a continuous casting mold. On melting the mold flux, bubbles which emerged at an early stage were cleared by raising the flux temperature higher than its melting point. When the mold flux was homogenized, TLS was cooled down to its original temperature which was close to practical casting. Then a one-end water cooled copper mold was lowered to contact with the contact the molten mold flux to yield flux film with the preset thickness between 0.5 mm and 2.0 mm.

41
They found that the observed heat flux passing through copper mold, qobs, decreases substantially with increasing the total mold flux thickness, dtot, as shown in the following Figure 2.28. Heat flux for MC is lower than that for LC, whereas TLS for MC is 50 K higher than that for LC. They explained this fact by that total thermal resistance, Rtot, for MC is larger than that for LC.
Figure 2.28. The change of observed heat flux and thermal resistances with thickness of
mold flux [69]
The total thermal resistance, Rtot, is composed of the interfacial thermal resistance (Rint) and flux resistance (Rflux). They also noted that the total thermal resistance is a strong function of total mold flux thickness as shown in Figure 2.29. It was also found that the thermal resistance of each layer of flux film does not vary greatly between MC and LC, as the thermal and optical properties such as thermal diffusivity and absorption coefficient are similar.

42
Figure 2.29. The change interfacial and flux thermal resistance with thickness of mold
flux [69]
They finally obtained two equations for interfacial thermal resistance as expressed as follows:
)(),(4.16)/10( 24
int forMCmmdWKmR cry×=− (2.17)
)(52.3)(94.2)/10( 24 forLCmmdWKmR crynti +×=− (2.18)
From above results, Cho, etc. [70] calculated the overall heat flux by assuming that the mold flux film consists of crystalline and molten layers, heat flow was in one direction, no interaction between radiation and conduction, and mold flux behaves like a gray gas. The calculated total heat flux, qtot, decreases exponentially with increasing flux film thickness as shown in Figure 2.30.

43
Figure 2.30. Heat flux as a function of flux film thickness [70]
The total heat flux for LC is always higher than that for MC at the same film thickness. One must control the thickness of flux film to a certain value to avoid the occurrence of the longitudinal cracks according to these methods.
Figure 2.31. Comparison of calculated threshold interfacial thermal resistance with observed [70]

44
It was also found that the heat flux for MC2 at the thickness of 0.75 mm is 25% less than 0.67mm LC2, which agrees well with plant observation that heat flux near the meniscus in mold is lower in casting medium carbon steels. The reason for this is due to the fact that interfacial thermal resistance, Rint, for MC is always large than that of LC as shown Figure 2.31.
They also did the research of effect of mold temperature, casting speed and mold flux properties on heat transfer rates in continuous casting. As shown in Figure 2.32, the difference in total heat flux is only 2.2% for LC and 1.6% for MC, when the mold temperature was lowered from 593K to 553K.
Figure 2.32. Effect of mold temperature on heat flux near meniscus [70]
The effect of casting speed, Vc, on the total heat flux is calculated and shown in Figure 2.33. The change of Vc from 1.6 to 3 m/min results in approximately a 5% increase in total heat flux. Since there is a reduction of thickness due to the increase of casting speed, the net effect of increased casting speed will lead to 30% higher total heat flux.
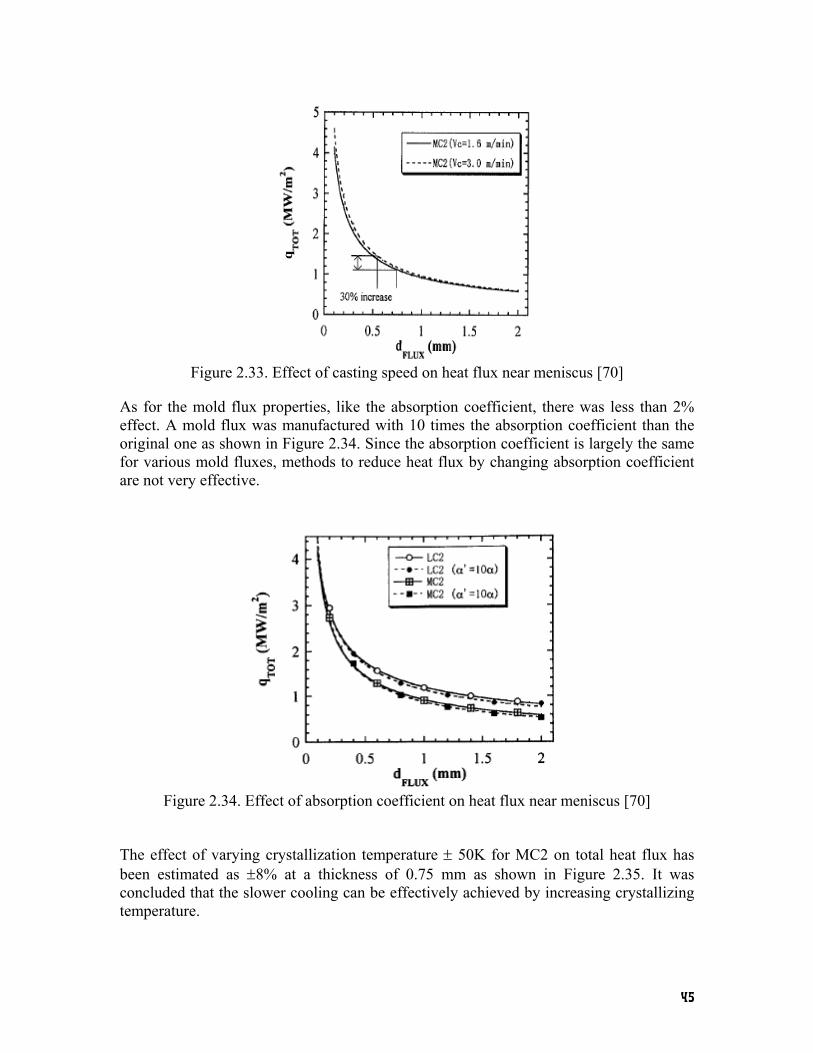
45
Figure 2.33. Effect of casting speed on heat flux near meniscus [70]
As for the mold flux properties, like the absorption coefficient, there was less than 2% effect. A mold flux was manufactured with 10 times the absorption coefficient than the original one as shown in Figure 2.34. Since the absorption coefficient is largely the same for various mold fluxes, methods to reduce heat flux by changing absorption coefficient are not very effective.
Figure 2.34. Effect of absorption coefficient on heat flux near meniscus [70]
The effect of varying crystallization temperature ± 50K for MC2 on total heat flux has been estimated as ±8% at a thickness of 0.75 mm as shown in Figure 2.35. It was concluded that the slower cooling can be effectively achieved by increasing crystallizing temperature.

46
Figure 2.35. Effect of crystallizing temperature on heat flux near meniscus [70]
2.4.3 The development of heat simulator
As the complexity of the heat transfer in a continuous casting mold increases, it is desirable to split the overall heat transfer into conduction and radiation. A new radiation heat simulator, infrared emitter, has been successfully developed by Adam Badri at Carnegie Mellon University [22-24], which could generate rapid responding high level thermal radiation seen in the caster (1 MW/m2). The description of this infrared emitter is provided in chapter 3.
Badri, etc. carried out the research to test the physical properties of this simulator, like how the subsurface temperature responds to a sinusoidal surface heat flux [23]. They determined the functional relationship between the amplitude and frequency of the surface stimulus with the subsurface temperature response. As shown in the Figure 2.36, a fast-Fourier transform filtered signal of the temperature response to a sinusoidal flux figure clearly indicates that changing the frequency of the sinusoidal signal leads to the a change of responding temperature amplitude: the amplitude of the temperature response signal reduces with the increase of signal frequency.

47
Figure 2.36 The temperature response to a sinusoidal flux [23]
They also compared the effect of the distance of the thermocouple from the heated surface. As shown in Figure 2.37, it indicated that the temperature response amplitude decreases with increasing distance from the heated surface.
Figure 2.37 Temperature response amplitudes for different subsurface thermocouples [23]

48
With such experiments, the set up of this equipment is expected to be limited by the accuracy of the thermocouple being used. These thermocouples are accurate, precise and relatively free from electromagnetic contamination. They are sensitive to small changes in temperature such that they could detect a small amplitude high frequency signal.
Park, etc. [86] have already conducted tentative research of the effect of mold flux on radiative heat transfer on copper by incident thermal flux on a copper mold covered with 1 mm crystalline slag disk. Instead of a lower responding temperatures found in the mold with a solid crystalline flux disk, the subsurface response temperature in the mold is high than the bare copper as indicated in Figure 2.38. It turns out that the solid flux layer enhanced the heat transfer absorption into the copper mold, which is unusual, in that the crystallization is believed to be an insulator.
Figure 2.38 Responding Temperature 2 mm below the hot surface [86]
The corresponding heat flux through the copper mold was calculated as shown in Figure 2.39. It shows that the replacement of solid mold flux increases the radiation transfer into the mold.

49
Figure 2.39 The measured heat flux for bare copper and crystalline disk [86]
Considering the accuracy of such a heat simulator set up and some tentative results of the effect of mold flux on radiation transfer, it gives rise the idea that it is possible to carry out the study of mold flux crystallization and its influence on radiative heat transfer in the meniscus area in continuous casting, which is the main focus on this project.
2.5 Relation to Current Work
Research has been carried out to investigate the heat transfer phenomena in continuous casting, and its influence on final casting slab surface quality. It was found that the mold flux infiltrated between the steel strand and copper mold has been widely used to moderate heat transfer rate during continuous casting via the selection of mold powder composition (due to the importance of its properties on heat transfer rate) and mold design. It was also shown that the crystallization of mold flux was recognized as one of the primary issues to affect heat transfer rate through the strand to the copper mold. However, it turns out that little research has been done to relate and quantify the effect of slag crystallization on the heat transfer rate, and most of these studies are limited to a discussion of conduction heat transfer during continuous casting to explain the overall heat transfer rate. Very few investigations were carried out on the radiative heat transfer rate due to its complexity and the harsh casting environment. The specifics of the solid mold flux layers and their influence on heat transfer rates during continuous casting have not been studied in detail and are the focus of this project.

50
3. Experimental Apparatus and Procedures
3.1 Infrared emitter
A schematic of the experimental apparatus of infrared emitter developed by Adam Badri at Carnegie Mellon University [22-24] is shown in Figure 3.1. The equipment used in these experiments includes: a power controller, a high-heat flux infrared radiant heater with a heating unit, a data acquisition system and a command-and-controlled unit. It was decided that an infrared radiation system was needed to produce the levels of thermal flux seen in a continuous caster (1 MW/m2). These lamps are vacuum-sealed tungsten-alloy filaments, which are manufactured by General Electric and are capable of emitting 1.0 MW/m2 at 44% above its rated voltage.
Data acquisition / command-and-control
computer
PowerController
V
I
Coolingair in
Coolingair out
Water-cooled reflector
Coolingwater out
Coolingwater in
Power cables
Thermocouple output
Voltage and current feedback
Commandsignal
Infrared Radiation
Figure 3.1. Experimental apparatus of the infrared emitter.
When a voltage is applied to the heating elements, the elements begin to emit infrared radiation. The intensity level of this radiation can be controlled precisely by changing the voltage applied across the elements. To focus all of this radiation onto a sample plane, a quasi-parabolic reflector is mounted behind the elements. By using a silicon-controlled rectifier (SCR) based power controller, the voltage across the lamps can be manipulated between 0 and 208 V, and thus the resulting output flux of the lamps can be varied from 0 to 1.0 MW/m2. In order to be able to generate heat fluxes using specified mathematical functions, the power controller is connected to a data acquisition and control board, which is in turn connected to a computer. Thus, any arbitrary signal generated by the computer can be sent in real time to the power controller, and translated into an output heat flux by the heating elements.
The infrared emitter is equipped with monitoring systems to ensure that the emitter operates safely and properly. This instrumentation includes monitoring the inlet cooling air pressure, inlet water pressure to the sample and reflector, and the flow-rate of cooling water. In addition, the inlet and outlet cooling water temperatures for the sample and

51
reflector are also monitored. The copper mold is simulated by a one-end water cooled copper cylinder, which acts as the radiation target, and the schematic figure is shown in Figure 3.2. As the heat flux (infrared radiation) is applied on the top surface of the copper mold, which is covered with mold flux film, the response temperatures could be measured using the sub-surface thermocouples.
Figure 3.2. Schematic figure of copper substrate used as the radiation target
Figure 3.3 gives one example of responding thermocouples’ temperatures history, when a constant 510 KW/m2 radiative heat flux was applied to the copper mold. The responding temperatures at 2, 5, 10, 15 mm below the hot surface of copper mold are recorded as T1, T2, T3, T4, and the cooling water inlet and outlet temperatures are presented as Tin and Tout as shown below.
Mold Flux 32 mm
Thermal couples
25mm
Chilled surface
Cooling water outlet
Cooling water inlet

52
0
10
20
30
40
50
60
70
0 500 1000 1500 2000 2500 3000
Time S
Res
pon
din
g Te
mpe
ratu
res o C T1
T2
T3
T4
Tout
Tin
Figure 3.3.The responding temperatures history for the copper mold coated with graphite
It can be found that the system comes into steady state after 200-300 seconds. The heat flux at steady state was calculated in two ways, one from traditional Fourier Law,
∑−=
iidx
dTkn
q )(1" , by the subsurface temperature gradient which was recorded by the
four subsurface thermocouples; and the other was from the heat released by cooling water.
)*/(/*/*/*)*/(/***" 22 msJmKLkgsLKkgJAreaflowratedensityTcq p ==Δ=
(13)
cp here is the heat capacity of water, area is the cross area of water flow, and both heat fluxes calculated in above methods are plotted in Figure 3.4.

53
80
85
90
95
100
105
110
115
400 900 1400 1900 2400
Time S
Mea
sure
d he
at f
lux
KW/m
2
Figure 3.4. Calculated heat flux with time at steady state.
From Figure 3.4, it can be observed that although there are very small fluctuations along 100 KW/m2 line, both lines drawn from the above two methods still keep constant at steady state along this 100 KW/m2 line. The technology developed using the infrared emitter as a radiation source is valid and allows one to conduct experiments, which focus on the effect of the mold flux on the in-mold heat transfer rates due to radiation heat transfer.
3.2 The fabrication of mold flux disks
3.2.1 Preparation by cooling and section
To prepare the mold flux for use as heat transfer samples, the mold flux was fabricated into a disk. Disks of mold flux of various thicknesses with a different phase composition, i.e. glassy or crystalline phase or mixed were produced. To make these disks, the mold flux was first pre-fused to remove the bulk of the graphite. Then, the fused mold flux was melted in a graphite crucible in an induction furnace (Figure 3.5) and then cooled at a controlled rate to achieve either a crystalline phase or a glassy phase cylinder with the same diameter of copper mold.
Calculated by water cooling system
Calculated through subsurface thermo-co ples

54
Figure 3.5. Induction furnace used to melt mold flux into cylinder
Controlled cooling of the mold flux cylinders was achieved by transferring the crucible containing the liquid mold flux into a programmed furnace. Once cool, the cylinder of solid mold flux was removed from the graphite crucible. This cylinder is then sectioned using slow speed diamond blade to produce disks ranging in thickness from 200 to 1500 micron meters. This procedure is summarized in Figure 3.6.
Figure 3.6 . The Flowchart for mold flux disks preparation
One sample mold flux used in chapter 4 is an industrial mold slag powder for casting ultra-low carbon steels used in the continuous casting, and its main chemical composition is listed in Table 3.1. The following figure gives some typical pictures of the slag disks. The glassy slag disks are found to be transparent and the crystalline slag disk has opaque optical properties.
Melt mold flux in cylinder graphite crucible
Solidify at a controlled rate furnace
Pre-melt for decarburization
Section mold flux into disks with varied thickness
Induction
Mold flux
Graphite
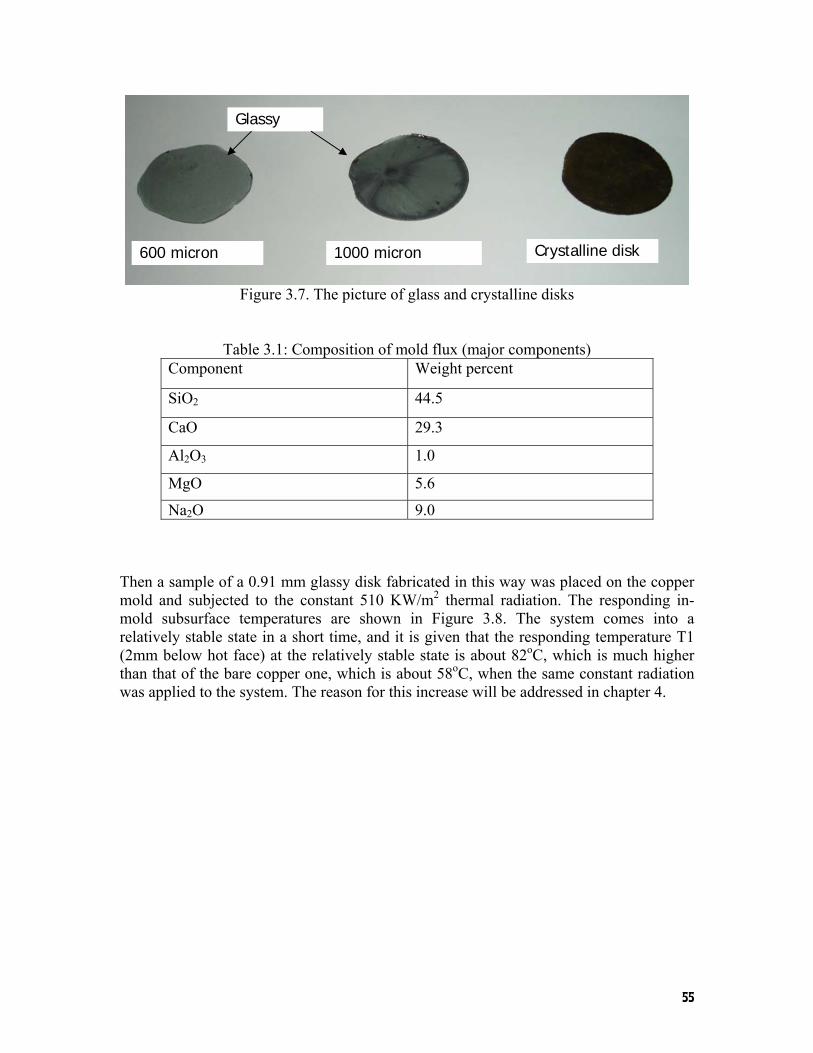
55
Figure 3.7. The picture of glass and crystalline disks
Table 3.1: Composition of mold flux (major components) Component Weight percent
SiO2 44.5
CaO 29.3
Al2O3 1.0
MgO 5.6
Na2O 9.0
Then a sample of a 0.91 mm glassy disk fabricated in this way was placed on the copper mold and subjected to the constant 510 KW/m2 thermal radiation. The responding in-mold subsurface temperatures are shown in Figure 3.8. The system comes into a relatively stable state in a short time, and it is given that the responding temperature T1 (2mm below hot face) at the relatively stable state is about 82oC, which is much higher than that of the bare copper one, which is about 58oC, when the same constant radiation was applied to the system. The reason for this increase will be addressed in chapter 4.
600 micron 1000 micron Crystalline disk
Glassy

56
20
30
40
50
60
70
80
90
0 1000 2000 3000 4000Time S
Resp
ndin
g Te
mpe
ratu
re o C
T1T3T4TinTout
Figure 3.8. The in-mold responding temperatures under a 0.91 mm glassy disk
3.2.2 Preparation by direct casting
Since there is carbon contamination of the disks, especially in the preparation of glassy disks as shown in Figure 3.7, from the graphite crucible, when the disks were fabricated using the method described in section 3.2.1, a new way to prepare glassy disks (direct casting) was developed to avoid the carbon contamination. The disks used in this project except those in chapter 4 were fabricated by direct casting.
The original slag powders were initially decarburized by placing them into a programmable furnace as in section 3.2.1. Then, they were melted in an alumina crucible placed on top of the graphite crucible in an induction furnace (Figure 3.9). When depleted of free graphite after the process of decarburization, the slag was melted, and then held at a higher temperature (around 1500 Celsius) for 5 minutes to homogenize its composition., Subsequently, it was quenched from its molten state form on a stainless steel plate (at room temperature). A new cylindrical tube-like copper mold with the same size as the copper substrate in the experiment was used to cast the molten mold flux, before it solidified on a stainless steel plate. In this manner a thin glassy mold flux disk was produced. The schematic of the apparatus used to melt mold flux in cylinders is shown in Figure 3.9.

57
Figure 3.9. Apparatus used to melt mold flux
The mold flux disks as shown in Figure 3.10 were then placed on the heated surface of the copper substrates individually. During the radiation experiments, the infrared radiation would impinge on the mold flux disk and then be transmitted through the disk and into the copper substrate.
Figure 3.10. The glassy disks prepared by direct casting

58
3.3 Double hot thermocouple technology
The double hot thermocouple technique (DHTT) [20, 21] has been developed to allow the in situ observation of mold slag crystallization under defined thermal conditions, such that the kinetics of crystal growth could be measured.
The schematic figure of DHTT used for the measurement of crystallization kinetics is shown in Figure 3.11. It includes: a quartz reaction tube, the hot thermocouple controller for each thermocouple, a data acquisition computer system, and an observation system consisting of a microscope and a Sony digital camcorder.
Figure 3.11. Schematic figure of DHTT
In the DHTT, a sample with the size of 2-5 mm is placed in between two thermocouples, and its temperature was measured and controlled continuously and independently through the data acquisition system, which has a two channel D/A (digital –analog: 0-5 DC volt) converter to control the hot thermocouples. An optical microscope, connected to a digital camcorder, is located above the sample to observe the crystallization phenomenon of sample. The image is then sent to the camcorder through the connected microscope, and the video signal with the information of experimental time is recorded in the tape. Two examples of the mold flux crystallization photos are shown in Figure 3.12, where a full glass disk was annealed at 900 degree
Hot Thermocouple Driver
Data Acquisition Computer system
Power
Digital Camcorder
Microscope
Power Control
B type T.C.
Temperature measurement

59
Figure 3.12. Photos of a glass mold flux crystallization
The glass mold flux sample is clearly shown in the left photo of Figure 3.9, then the opaque crystals could be observed at the right photo when it was annealed for almost two minutes as the time difference shown in the up right corner of the photo.
The computer with image capturing and analysis software (NIH Image 162) allows a more detailed analysis of the crystallization kinetics phenomena. High heating and cooling rates can be easily obtained due to the low thermal inertia of the system, which is very useful for the determination of TTT diagrams, where a fast initial cooling rate is required.
4. A Study of a solid mold flux and its effect on radiative heat transfer
4.1 The radiative properties of a mold Flux
The mold flux used in this project is an industrial mold powder that is used for casting ultra-low carbon steels, and its main composition is listed in Table 3.1. The mold slag samples were prepared as thin discs with the same diameter as the copper mold as indicated in section 3.2.1. When the surface of the disc receives thermal radiation, usually called irradiation and denoted by G, from the infrared emitter, some portion of this energy is absorbed, another fraction will be reflected and the rest will be transmitted as shown in Figure 4.1. If the transmission is so small that it could be neglected, the surface is said to be opaque and if a measureable transmission occurs, the surface is termed as semitransparent. Absorption and emission of photons within the mold flux are due to the interactions with free electrons as well as due to excitation of lattice vibrations. Based on this observation we define the following three fundamental radiative properties [71]:

60
Reflectivity,
GGofpartreflected
=ρ (4.1)
Absorptivity, G
Gofpartabsorbed=α (4.2)
Transmissivity, G
Gofpartdtransmitte=τ (4.3)
Figure 4.1. Schematic of splitting irradiation into absorption, reflection, and transmission
Since all the irradiation is split into reflection, absorption, and transmission, the three energies must sum to total incident G. Therefore, it leads to the following equation:
1=++ τρα (4.4)
Among the above three split energies, τ, the transmittance is of interest, because heat transfer from the liquid steel pool to the mold walls controls the heat transfer rate in the meniscus area of a continuous caster. It has been reported [72] that transmittance depends upon the mixture of the incident thermal wave length, λ, and the incident direction, which is usually defined by θ (from z-axis). As radiative energy penetrates through the slag disc layer, it will attenuate gradually by absorption as shown in Figure 4.1. Experience and theoretic development show that there is an exponential decay of incident irradiation, which is described by Beer’s Law, so that the transmissivity could be expressed in the following equation:
)*exp(),,,( df βαρλθτ −∝= (4.5)
Irradiation from environment G (W/m2) Reflected
energy ρG
Transmitted energy τG
Absorbed energy αG

61
In which β is named as the extinction coefficient, d is the thickness of the flux disc. When the radiation photons travel through the slag disk, some portion of the energy is absorbed and a fraction will be scatted especially at any phase or grain boundaries or other defects in the various phases. Therefore, the extinction coefficient, β, is usually defined by the sum of the adsorption coefficient, κ, and the scattering coefficient, σ. i.e., σκβ += . Equation 4.5 can be rewritten as equation 4.6.
dede )( σκβτ +−=−= (4.6)
However, the glassy phase absorbs radiation gradually as it travels through the medium but does not scatter radiation appreciably due to its amorphous structure. Thus, the scattering coefficient for a glass phase is rather small compared with a crystalline phase. Therefore, the extinction coefficient of a glassy substance is usually referred to as the absorption coefficient, when scattering factor is small.
4.2 Effect of the crystalline phase on radiative heat transfer rate
As described in chapter 2, the mold flux film beneath the meniscus consists of two vertical parallel layers, a molten layer and a solid layer (crystalline and glassy film). The two layers provide the film with thermal resistance to the conductive and radiative heat transfer in the mold [19], and each part of the layer plays a different role on the heat transfer. As for the crystalline phase film, which is next to the molten slag layer, it is believed to retard the heat transfer rate [17-19]. However, all of these studies were related to conductive heat transfer. This section will focus on the effect of a pure solid crystalline mold flux on the radiative heat transfer rate.
In the industrial operation of continuous casting, the most useful data would be the effect of mold flux films on the heat transfer rate during steady state operation. The experiment carried out in this project simulated the heat transfer rates of a caster by applying a constant infrared radiative heat flux onto the top of copper mold covered by a slag disk, and the constant heat fluxes were produced by the infrared emitter. Then the opaque crystalline slag disk was placed on the top surface of the copper mold and subjected to constant thermal radiation. The responding temperatures during the experiments were measured by the subsurface thermal couples at several locations (2, 5, 10, and 15 mm) below the hot surface. The following figure 4.2 gives one example of the responding subsurface temperatures histories, when a constant 510 KW/m2 radiative heat flux was applied to 0.63 mm crystalline disk (its X-ray pattern was shown as W1p in Figure 4.3) on top of the copper mold. The responding temperatures at 2, 5, 10, and 15 mm below the hot surface were recorded as T1, T2, T3, T4, and the cooling water inlet and outlet temperatures were presented by Tin and Tout.

62
20
30
40
50
60
70
80
0 1000 2000 3000 4000 5000 6000 7000Time S
Resp
ondi
ng T
empe
ratu
re o C
T1T2T3T4TinTout
Figure 4.2. The responding temperatures versus time for 0.625mm slag disc
From above figure, it is obvious that the system comes into steady state in a very short time (200-300 seconds). The T1 responding temperature at steady state approaches 69 oC, which is about 10 degrees higher than the T1 response for a bare copper mold as shown in Figures 3.3.
In order to confirm that the dominant phase of the original slag and the final slag remains crystalline, the slag samples after treatment were scanned by X-ray as shown in Figure 4.3. From the X-ray pattern, it could be observed that the all the patterns: W1p (the original sample), W2p (the sample being treated by 0.9 MW/m2 infrared radiation for 300 seconds), W3p (the sample being treated by 0.9 MW/m2 radiation for 1 hour, and W4p (the sample being treated for 8 hours), have the same characteristic peaks and position, which has been identified as Cuspidine (Ca4Si2O7F2 or 3CaO.2SiO2.CaF2.).
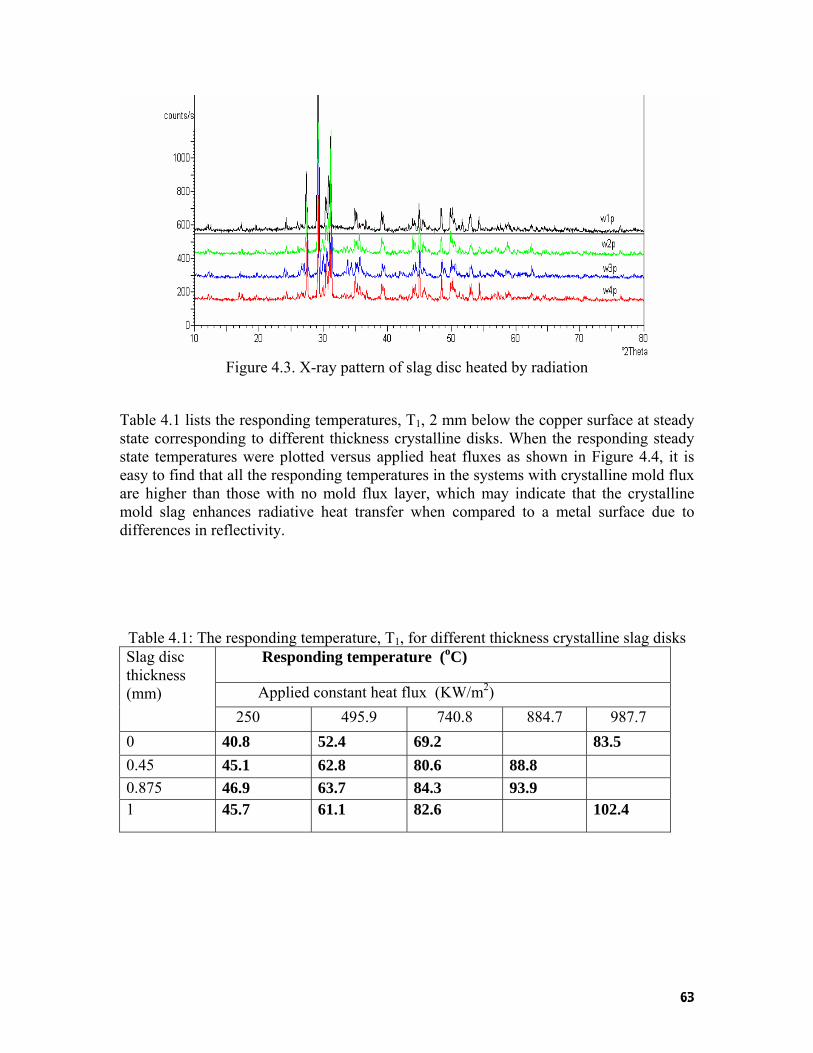
63
Figure 4.3. X-ray pattern of slag disc heated by radiation
Table 4.1 lists the responding temperatures, T1, 2 mm below the copper surface at steady state corresponding to different thickness crystalline disks. When the responding steady state temperatures were plotted versus applied heat fluxes as shown in Figure 4.4, it is easy to find that all the responding temperatures in the systems with crystalline mold flux are higher than those with no mold flux layer, which may indicate that the crystalline mold slag enhances radiative heat transfer when compared to a metal surface due to differences in reflectivity.
Table 4.1: The responding temperature, T1, for different thickness crystalline slag disks Responding temperature (oC)
Applied constant heat flux (KW/m2)
Slag disc thickness (mm)
250 495.9 740.8 884.7 987.7 0 40.8 52.4 69.2 83.5 0.45 45.1 62.8 80.6 88.8 0.875 46.9 63.7 84.3 93.9 1 45.7 61.1 82.6 102.4

64
30
40
50
60
70
80
90
100
110
0 200 400 600 800 1000 1200Applied Heat flux (KW/ m2)
Res
pond
ing
Tem
pera
ture
0 C
bare copper
0.45mm crystalline disc
0.875mm crystalline disc
1mm crystalline disc
Figure 4.4. The responding temperatures versus applied heat fluxes for the system with
crystalline slag disc on top of the copper mold
As the measured temperature only gives a relative measure of the ability for a crystalline mold flux disk to transfer radiative heat, it is better to show that the heat flux passing through the copper mold does increase when the slag discs were placed on top of mold. Therefore, all heat fluxes at steady state passing through the copper mold were calculated
according to the Fourier’s First Law, ∑−=
iidx
dTkn
q )(1" , q” here refers heat flux, n is the
total number of the thermocouple pair, i is the index number, k is the thermal conductivity, and (dT/dx)i is the temperature gradient measured by ith thermal couple pair. The calculated heat fluxes versus applied heat fluxes are plotted in Figure 4.5. The placement of crystalline discs on copper increases the heat transfer rate by 39 KW/m2 for an applied flux of 244 KW/m2, and up to 118 KW/m2 for an applied flux of 740.8 KW/m2 as shown in Figure 4.5.
Since the ability of a material to absorb radiation determines how well it serves as a heat sink, which may be of great interest to continuous casting due to its primary function as a heat sink to remove heat from liquid steel, the above results give rise to the idea that mold flux could be better used in the heat transfer modification in continuous casting.

65
45
95
145
195
245
295
345
395
0 200 400 600 800 1000Applied heat flux KW/ m2
Mea
sure
d H
eat
Flux
KW
/m2
Bare copper
1.0 mm crystalline disc
0.625mm crystalinne
0.55 mm crystalline disc
0.875 mm crystalline disc
Figure 4.5. Measured heat fluxes through the copper mold
As discussed before, the increase in temperature response and heat flux through the copper mold suggests that the mold flux enhances radiative heat transfer in continuous casting. With further investigation, the crystalline slag disks have the similar ability to transfer radiation regardless the thickness, and the measured heat fluxes through the copper mold have the same magnitude.
In order to explain why the mold flux enhances radiation the heat transfer rate, the mechanism of absorption of radiation with a mold flux disk and on bare copper was investigated. The main photon absorption mechanism for a solid is by interactions with free electrons (free—free interactions that are common in metals) or due to excitation of lattice vibration (phonons). Since a metal like copper is an excellent electrical conductor, and has an abundance of free electrons, absorption and transmission of photons are through free-free transitions, which means electrons can absorb or emit photons. As all these electrons do not oscillate but are donated to the shared electron cloud within the rigid structure, it is difficult under these conditions for a photon to be propagated through the lattice and then transmitted. However, the slag disk, which consists of a mixture of metal oxides, does not have many free electrons, and does not display a high reflectance and opaqueness behavior across the infrared spectrum i. e. oxides tend to be transparent or translucent. The radiative properties of oxides are dominated in the infrared by photon-phonon interaction, i.e. by the photon excitation of the vibration energy of the solid’s crystalline lattice and scattering from phase boundaries, which results in a stronger radiation absorption. Of course amorphous oxide materials, such as glasses, tend to be transparent and there is no significant photon transmission due to the non repeating structure which leads to low thermal conductivity. Single crystals, however, can have a very high thermal conductivity due to ease of photon transmission via lattices vibrations.

66
Transmissivity, τ, is the ratio of the transmitted part of energy to total incident energy. It is an exponential function of extinction coefficient, β, where β is described as:
ok λπβ /4= [72], here λo is the wavelength of the incident light in vacuum, and k is absorptive index, which could be expressed by following function.
),,,( oe cfk σλε= (4.7)
Where co is light speed in the vacuum, εis the electric permittivity, σe is the electrical conductivity, k is proportional to σe. Thus, equation 4.6 could be rearranged in to equation 4.8.
okdede λπβτ /4−∝−∝ (4.8)
Combining equation 4.7, and 4.8, leads to equation 4.9, which gives the relationship between the electrical conductivity and transmissivity.
ooe dcfe λσλεπτ /),,,(4−∝ (4.9)
It is obvious that the electric conductivity of copper is much larger than that of slag, which leads to a smaller transmissivity of copper. Therefore, the copper will hardly transmit infra red radiation (as it reflects radiation) and the heat flux through copper mold and would be lower than the system that allows adsorption such as a slag disc. If the transmitted heat fluxes were plotted in terms of fraction of heat transmitted versus the applied heat fluxes, as shown in Figure 4.6, it is found that the placement of a disk leads to a transfer of 40% of incoming radiation, resulting in a 20% improvement with regard to a bare copper surface. As reflectivity is an issue, the surface condition is also important in radiation heat transfer.

67
0.1
0.15
0.2
0.25
0.3
0.35
0.4
0.45
0 200 400 600 800 1000Applied Heat flux (KW/ m2)
Frac
tion
of M
easu
red
heat
Flu
x (%
)bare copper0.625 mm crystalline disc
1 mm crystalline disc
Figure 4.6. The fraction of measured heat flux versus applied heat flux.
4.3 Effect of a glass disk on the radiative heat transfer rate
The glass slag disks which were manufactured as outlined in chapter 3 were first scanned by X-ray to confirm that these disks were predominantly glassy. From the X-ray pattern shown in Figure 4.7, no characteristic peak was found.
Figure 4.7. The X-ray pattern of glassy slag disk
In order to compare the effect of differing disk phase on the radiative heat transfer rate, a 0.66 mm thick glass disk was placed on the top of the copper mold and subjected to the same constant radiation, 510 KW/m2, as used for the 0.63 mm crystalline sample in

68
section 4.2. The responding temperatures versus time are shown in Figure 4.8. The system comes into a relatively stable state in a short time. The responding temperature, T1, 2mm below hot face is 82Co, which is higher than that of the measured crystalline flux (68 Co) in Figure 4.2.
20
30
40
50
60
70
80
90
0 2000 4000 6000 8000 10000 12000Time S
Resp
ondi
ng T
emp.
o C
T1T2T3T4ToutTin
Figure 4.8. The responding temperatures versus time for glassy slag disc.
Similar experiments were conducted by changing the applied radiation heat flux, and the responding temperatures, T1, were given with the comparison of the other two systems, i.e. the bare copper system and the system with crystalline sample in Figure 4.9. It could be found that all the values for T1 in the system with glass disk are higher than others. The responding temperature difference between crystalline and glass disk samples range from approximately 7 centigrade at the application of 250 KW/m2 to 19 centigrade at 881 KW/m2. Therefore, it indicates that the glass phase has a better ability to transfer radiation than a crystalline phase.

69
40
50
60
70
80
90
100
110
120
0 200 400 600 800 1000Applied Heat Flux KW/m2
Res
pond
ing
tem
prat
ure o C
bare cppor
1.0 mm crystalline disc
0.625mm crystalline disc
0.55 mm crysalline disc
0.875 mm crysalline disc
0.66 mm glassy disc
Figure 4.9. Responding temperatures versus applied heat fluxes for different systems
The transmitted heat flux passing through the copper mold was also calculated to confirm the above result. As the thermal profile in this case is a function of temperature and time, inverse heat conduction methods were used to estimate the heat flux history, and the program of 1-D inverse heat transfer calculation is listed in the appendix. The inverse heat conduction method is based upon finding a solution to the following 1-D transient heat transfer equation:
tTc
xTk
xi
pi
∂∂
=∂∂
∂∂ )()( ρ (4.10)
in which ρ is the mass density, cp is the copper heat capacity, and t is time. By inputting all the thermocouple’s temperatures history, heat flux can be calculated along with the thermal boundary conditions. The method used here is that of Beck.
The calculated heat fluxes corresponding to Figure 4.9 are plotted in Figure 4.10. It is quite clear that all the measured heat fluxes through the glassy disk are higher than others. Therefore, the glassy phase disk does have a stronger ability to transfer radiative heat flux than crystalline one.

70
45
95
145
195
245
295
345
395
0 200 400 600 800 1000Applied heat flux KW/ m2
Mea
sure
d He
at F
lux
KW
/m2
Bare copper
1.0 mm crystalline disc
0.625mm crystalline disc
0.55 mm crystalline disc
0.875 mm crystalline disc
0.66 mm glassy disc
Figure 4.10. The measured heat fluxes for different systems
In order to investigate the net heat transfer ability difference between crystalline and glass samples, the same incident radiation flux (510 KW/m2) was applied to the same thickness (0.625 mm) crystalline and glass samples individually. The determined in-mold heat transfer rates were given in Figure 4.11.
0
50000
100000
150000
200000
250000
300000
0 500 1000 1500 2000 2500 3000Time S
Mea
sure
d H
eat
Flux
(W
/m2 )
glassy phasecrystalline phase
Figure 4.11. The calculated heat flux histories for glassy and crystalline phases

71
The heat flux transmitted through the glass disk to the copper is around 250 KW/m2, which is much larger than 195 KW/m2 for the crystalline disk under the same conditions. The crystallized disk heat transfer rate is around 20% lower than that of a glassy disk. However, both heat fluxes with the presence of the slag disks are still higher than that of bare copper.
In order to study the effect of thickness of glass disk on radiation, constant radiative thermal flux (510 KW/m2) was applied to five different thickness glassy phase disks ranging from 0.55 to 0.91 mm. The measured heat fluxes histories through the copper are shown in Figure 4.12. It is different from that of the crystalline disk, which has little effect on radiative heat transfer. The thickness for a glass disk does have a significant effect on the radiation heat transfer rate, which was an exponential function of thickness as shown in Figure 4.13, when the measured heat fluxes points versus sample’s thickness were regressed.
100000
150000
200000
250000
300000
0 500 1000 1500 2000 2500 3000Time S
Mea
sure
d H
eat
Flux
(W
/m2 )
0.91 mm glassy0.85 mm glassy0.78 mm glassy0.66 mm glassy0.55 mm glassy 0.91 mm crystalline
Figure 4.12. The measured heat fluxes histories for five different thickness glassy discs
As the thickness of the sample increases, more energy is absorbed according to Beer’s Law and this energy heats the sample disk to a higher temperature, leading to a larger heat flux that is transmitted to the copper mold. The heat flux through copper is around 234 KW/m2 at the thickness of 0.55 mm, and it goes up to 291 KW/m2 once the thickness increases to 0.91 mm.
When the responding heat flux at steady state is plotted as a function of thickness at steady state in Figure 4.13, it is clear that the heat flux increases exponentially with the addition of the thickness. As indicated by Beer’s Law, there is an exponential attenuation

72
when the absorbed photons travel in the transparent medium like glass disk in this case (shown in Figure 4.14). Therefore, it is expected that an exponential relationship appears in the corresponding heat flux through copper mold. When all the data in Figure 4.12 were normalized, the exponential coefficient is around 440, which is related to the extinction coefficient or absorption coefficient as indicated in section 4.1.
y = 178.28e438.39x
220
230
240
250
260
270
280
290
300
0.0005 0.0006 0.0007 0.0008 0.0009 0.001Thickness m
Mae
sure
d he
at f
lux
KW
/m2
Figure 4.13. The effect of thickness on heat fluxes
Figure 4.14. Two typical glass disks picture
From the above experimental results and phenomenon, it suggested that the heat flux through the mold is a strong function of the surface covering of the heat receiving system. Therefore, the surface of the copper mold was changed to study the effect of top surface of the copper mold on responding heat transfer rate in continuous casting, to give some insight for moderating heat transfer rate by a change of mold surface characteristics.

73
4.4. Effect of top surface on radiative heat transfer
In order to explore the mechanism of radiative heat transfer across a solid mold flux to a copper mold, the top surface of copper mold was modified, by adding different materials to its surface, to change its reflectivity and its absorbance. Figure 4.15 gives one example of responding thermocouples’ temperatures history, when a constant 510 KW/m2 radiative heat flux was applied to a copper mold coated with graphite. The responding temperatures at 2, 5, 10, and 15 mm below the hot surface of copper mold are recorded as T1, T2, T3, T4, and the cooling water inlet and outlet temperatures are presented as Tin and Tout as shown below.
20
30
40
50
60
70
80
90
100
0 500 1000 1500Time S
Resp
ondi
ng T
empe
ratu
re 0 C
T1T2T3T4TinTout
Figure 4.15.The responding temperatures history for the copper mold coated with graphite
The system reaches a steady state in a very short time (200-300 seconds), as shown in above figure, and the measured heat flux traveling through copper mold at steady state could be calculated by an inverse solution of the heat conduction equation with the given temperature gradient. A series of experiments was conducted, and the responding temperatures, T1, 2 mm below hot surface at steady state, for different surface coated systems were plotted versus applied heat fluxes in Figure 4.16a. Their corresponding heat fluxes histories for each system were given in Figure 4.16b, when constant 510 KW/m2 incident radiation was applied.

74
40
50
60
70
80
90
100
110
120
130
140
0 200 400 600 800 1000Applied Heat Flux KW/ m2
Res
pond
ing
Tem
peat
ure
oC
bare alumina powder
C coating0.66 mm glassy disc0.45 mm crystalline disc
0.75 mm crystalline disc0.95mm crystalline disc
0
50000
100000
150000
200000
250000
300000
350000
0 500 1000 1500 2000Time S
Mea
sure
d H
eat
Flux
W/m
2
barealumina powderC coating0.95 crystalline disc0.66 mm glassy disc
Figure 4.16 (a). Responding temperatures versus applied heat fluxes and
(b). Measured heat flux going through copper mold for varied top surface
There are five temperature trends in Figure 4.16, corresponding to each experimental system: (1) a bare copper surface; (2) a copper mold with an alumina surface; (3) a copper mold with a black graphite surface; (4) a copper mold with solid slag (crystalline) disk; and, (5) a copper mold with solid glassy disk. It is clear that the results are a strong function of the surface condition of the mold and the presence of the slag disk. The reason for this may be due to the different heat absorbance of the top surface, such that the responding subsurface temperatures and heat fluxes vary when the top surface of the copper mold changes. The bare copper surface or that coated with alumina powder has the weakest ability to transfer heat: around 20% of the incoming radiant energy, as shown in Figure 4.17. Also the responding temperatures and the measured heat fluxes passing through the copper mold are lowest when compared with others (Figure 4.16). For the systems with solid mold slag discs placed on top of the copper mold, they can better absorb incident energy and lead to a higher measured heat flux as discussed in sections 4.2 and 4.3. The absorption behavior of these materials is mainly due to interaction between photons and excitation of lattice vibrations (phonons). Therefore, the energy absorbed by the disk will increase its temperature and conduct energy to the copper mold leading to the fraction of the heat flux going through copper mold increasing by 40-50%, depending upon disc’s surface and structure. The presence of a slag disk actually increases the energy transferred into the mold, when compared to a bare copper mold.

75
0.1
0.2
0.3
0.4
0.5
0.6
0.7
0 200 400 600 800 1000Applied Heat flux (KW/ m2)
Frac
tion
of
Mea
sure
d he
at F
lux
(%)
bare copper0.625 mm crystalline disc1 mm crystalline discC coating0.85 mm glassy disc
Figure 4.17. The fraction of measured heat flux versus applied heat fluxes
If the copper mold was coated with graphite, which has excellent heat conductivity and a high absorbance capability due to its black surface, more than 60% of the incident radiant energy was conducted to mold as shown in Figure 4.17, such that the T1 temperatures and the measured heat flux in this system are highest.
All of the above results suggest the top surface optical property has a large influence on the heat transfer rate through metal mold in continuous casting when the heat transfer rate is dominated by radiation.
4.5. Modeling of Radiative Heat Transfer in Solid Mold Flux
With all of the above experimental results, it is desirable to set up a model to study the radiation through the solid mold flux layer to the copper mold. As glass, quartz, etc. have been defined as a “semi-transparent” phase by researchers due to the property that they absorb some radiative energy, the model developed here is developed through geometric optics and ray tracing to explore the mechanism of radiative heat transfer from the solid mold flux to copper mold.
In order to simplify this model, the incident flux is assumed to be normal to the slag disk. Consider a semitransparent sheet, as depicted in Figure 4.18, which represents the slag disc as mentioned before. When the incident energy I0 first strikes at the interface, part of it is reflected and the reflected portion is the reflectivity RI0, the remaining flux (1-R)I0 that passes through the interface will traverse the thickness of the slab while being absorbed and eventually reach the back side. During the process of traversing, the radiant

76
flux is attenuated exponentially according to Beer’s Law, which is usually described as following equation:
deT β−= (4.11)
where β is the extinction coefficient, and d is the slag thickness. Thus, the part that reaches the back side will be (1-R)TI0, then a fraction R is reflected by backside and the rest (1-R)T(1-R)I0 is transmitted to outside. The process of multiple reflections at the interfaces and traversing of the thickness should be accounted for to determine the overall reflectance and transmittance of the slag disk. As shown in Figure 4.18, the overall reflectance ρ and transmittance τ could be calculated via the following equations:
]1
)1(1[....)1()1( 22
2243222
0
2
TRRTRTRRRTRR
II
total −−
+=+−+−+==ρ (4.12)
22
254222
0
1
1)1(.....][)1(TR
RTTRTRTRII
−−
=+++−==τ (4.13)
where I1 is the part of energy to be transmitted and I2 represents the part of energy to be reflected and lost to the environment. Once I1 is transmitted from slag disk, it acts as incident energy upon the copper mold. As this energy strikes the top surface of copper mold, there is around 20% incident energy absorbed by the copper mold as shown in Figure 4.17. Then by assuming all the rest of the transmitted energy, RcuI1 (it is around 0.8I1 in this case), is reflected back to the slag disk as shown in Figure 4.19.
Figure 4.18. The first cycle of light tracing of the semitransparent sheet
(1-R)2R3T4
(1-R)2T
(1-R)2R2T3
(1-R)2R4T5
I0
R
(1-R)2RT2
I1 I2
(1-R)T
RT(1-R)
1-R

77
Once RcuI1 hits the back side of slag disk in Figure 4.19, part of it, RcuRI1, is reflected, the rest of it will be transmitted into slag disk as the same procedure as the first incident light I0 did in Figure 4.18, until the transmitted part I4 lost to the outside environment. The reflected part RcuI3 then will act as incident radiation upon the back side of the slag sheet causing the third cycle.
Figure 4.19. The second cycle of light tracing of the semitransparent sheet
Therefore, all the procedures will repeat as same as the second cycle till the nth cycle, when the I2n-1 is so smaller than I0 that it could be neglected. The flowchart for modeling the mechanism of radiative heat transfer phenomena through solid mold flux to copper mold is depicted in Figure 4.20. The overall heat lost to environment could be calculated according to above figures as shown in the following equation.
nloss IIIII 2642 ...++++= (4.14)
This is a two variance program. The first variance j is set up to determine a suitable extinction coefficient, β, to match the research data; the second variance i is set up to search for the cycle times, such that I2n-1 could be neglected. The reflectivity, R, of the disc specimens could be measured by spectrometer. Therefore, the overall Iloss could be calculated by the following equations:
(1-R)2T
(1-R)2R2T3
(1-R)2R4T5
RcuI1R
(1-R)2RT2
(1-R)2R3T4
I3 I4

78
...])1
)1(1(798.0)1
)1(1(798.01[
*]1
)1([798.0)1
)1(1(
222
2222
22
22
222
22
22
22
+−
−++
−−
++
−−
+−
−+=
TRRTR
TRRTR
TRRTI
TRRTRII ooloss
(4.15)
)1
)1(1(798.01
]1
)1([798.0]
1)1(1[
22
22
222
22
0
22
22
TRRTR
TRRTI
TRRTRII oloss
−−
+−
−−
+−
−+= (4.16)
Combining equations 4.12 and 4.13, equation 4.16 could be rearranged into equation 4.17, which makes the lost energy related to the overall reflectance and transmittance.
)798.01798.0(
2
totaltotaloloss II
ρτρ
−+= (4.17)
The total heat transferred to the copper mold was estimated as 1-Iloss by assuming the remaining heat flux was conducted to copper mold.
)]798.01798.0(1[
2
totaltotalolossoabsorb IIII
ρτρ
−+−=−= (4.18)
The calculated extinction coefficient and surface reflectivity for crystalline and glass slag disc are 4500 m-1, 0.598 and 400 m-1, 0.103 respectively. Both values for extinction (adsorption) coefficient and reflectivity are consistent with other researchers’ results [68, 73]. Therefore, all the above experimental phenomenon: (1) the glassy disk has a better ability to transfer radiation than the crystalline disk, and (2) the effect of the thickness of a glass and a crystalline disks on radiation heat transfer is different, and can be explained in two ways, as it is in the literature [74-76], i.e., by considering the top surface property and the bulk structure of the disks.
The glassy slag disc has a transparent surface rather than an opaque one, and most of the incident energy can pass through the top surface resulting in a small value of reflectivity (0.103). However, the crystalline surface is opaque, blocks a large amount of incident energy and leads to a larger reflectivity (0.598). Therefore, less energy will pass into and be absorbed by the crystalline disc. The second factor is the extinction coefficient. The radiation photons passing across the crystalline layer will be scattered especially at the surface, phase boundaries and defects, which results in a larger extinction coefficient (4500 m-1). With these conditions, the thickness of crystalline disk has no significant effect on radiative heat transfer as penetration is low. However, the absorption coefficient for a glassy specimen is rather small (400 m-1) due to its amorphous structure, and there will be a significant role of samples thickness on the radiative heat transfer rate.

79
Figure 4.20. The flowchart for modeling heat transfer phenomena through solid mold flux
Start
Input Incidence I0
j =1, β=10, d
T= exp(-βd)
]1
)1(1[
1)1(
22
22
22
2
TRRTR
TTR
R
−−•
+•=
•−−
=
ρ
τ
i =1
Ij,i = I0* τ Ij,i+1 = I0 * ρ
Iloss = Ij, i+1
k = i +2
Ij, k = 0.798 Ij, i * ρ Ij, k+1 = 0.798 Ij, i * τ
Iloss = Ij, k+1 + Iloss
Ij, k < 10-6 I0
No
Yes
i = i +2
Iloss = Iexperiment
k = k, R, Itransmit = 1- Iloss
End
No
j = j + 1 β= β+20

80
4.6. The Effect of a Mixture of Phases on the Radiative Heat Transfer Rate
It has been recognized that the glass phase mold flux has a better heat transfer ability than that of fully crystalline phase mold flux. This section documents the research conducted of the influence of a mixture of phases within the mold flux on the radiative heat flux and will indicate the manner by which the radiative heat flux evolves as the crystalline phase develops in the amorphous disk.
The experiments were simulated by the application of a constant radiative heat flux to the slag disks, which were annealed at constant temperature, for different times to achieve varied degrees of crystallization. The disks were then placed on top of the copper mold. Subsurface responding temperatures during the experiments were measured to determine the heat flux that passed through copper mold. Once steady state is reached heat fluxes are constant as the in disk temperatures at low heat fluxes are not high enough to lead to significant coarsening of the partially crystallized structures. Thus the effect of crystallization can be unambiguously measured in this type of experiment.
A fully glassy disc with a thickness of 0.66 mm was first placed on top of the copper mold for the test. Then, glassy slag disks of the same thickness were crystallized at 900oC for different times to achieve varied crystalline fractions until 100% crystallization was achieved. The x-ray pattern of the fully crystallized sample was identified as: Cuspidine (Ca4Si2O7F2 or 3CaO.2SiO2.CaF2). All these samples were subjected to the same constant 510 KW/m2 heat flux, and their responding heat fluxes histories are given in Figure 4.21.
100000
120000
140000
160000
180000
200000
220000
240000
260000
280000
0 1000 2000 3000 4000Time S
Mea
sure
d H
eat
Flux
W/m
2
1: The fully glassy sample, 2: annealed at 900oC for 93 seconds, 3: annealed at 900 0C for 118
seconds, 4 annealed for 155 seconds, 5 (for 400 seconds) fully crystalline sample
Figure 4.21. The measured heat flux histories for partially crystallized slag discs
1
2 3
45

81
Since longer crystallization time leads to a larger fraction of crystalline phase in the sample, the absorbed energy by the specimen attenuates as the top surface of specimen loses its transparency and more radiation is scattered, such that the heat flux transferred to copper mold would reduce till the level of fully crystalline sample as shown in Figure 4.21. The heat flux passing through the copper mold is around 258 KW/m2 for the system of glass disc, and reduced to around 198 KW/m2 when the glass sample was totally crystallized. This shows the effect of fully crystallization was to reduce radiative heat transfer rate by 20.5%. Two SEM photos of glass and crystallized disk are presented in Figure 4.22, where the fully amorphous structure of sample 1 (glass disk) was totally crystallized after it was annealed at 900 0C for more than 500 seconds, and the equiaxed forms of the crystals of sample 5 are clearly seen in Figure 4.22 (b).
(a) (b)
Figure 4.22. Two SEM figures for samples1 (a) and 5 (b).
4.7. Kinetics of Slag Disc Crystallization
Experiments were conducted by using DHTT to observe the slag crystallization phenomena. The temperature profile is shown in Figure 4.23, and all the temperatures were controlled by decreasing or increasing the electric current.
The sample (8 mg) of the mold powder was melted on the tips of two thermocouples; then continuously heated to 15000C for 4-5 minutes to eliminate the gas impurities and to homogenize its composition. After that, the sample was rapidly cooled to room temperature to achieve a pure glassy phase, then, lasted for 20 minutes. Finally, the specimen was crystallized at 900 0C. The video of this procedure was recorded by the digital camcorder; as well the temperature-time data was stored by the computer

82
Figure 4.23. Thermal Cycle of experiment
The computer with image capturing and analyzing software (NIH Image 162) allows a series of figures to be recorded to show the procedure of crystallization. Figure 4.24 shows pictures captured during slag crystallization at 900 0C (times appearing in the upper part of each figure). The fraction of crystalline phase could be determined by the ratio of opaque area to the total sample area.
Tem
perature
Time
4-5 min at 1500 0C
Quenching (~85 0C)
Annealing at 900 0C
Cooling at 25oC for 20 minutes

83
Figure 4.24. Crystallization Behavior of mold slag at 900 0C
Since the method of using single crystal volume evolution or using the all crystal volume fraction in the whole sample evolution to measure the crystal growth has been reported to be identical [20, 21], image analyses were performed to evaluate the volume fraction of crystals evolved as a function of time to obtain the rate of crystal growth. The Avrami equation was adapted to describe the kinetics of crystallization in this case.
))(exp(1 nktX −−= (4.19)
in which X is the crystals fraction, k stands for the coefficient corresponding to the nucleation and growth mechanism, t means time and n is a time exponent. Therefore, the values for n and k could be determined according to the following equation by rearranging equation 4.19 into equation 4.20.
nLntnLnkX
LnLn +=−
)1
1(( (4.20)
Having the measured crystals volume fraction data for different annealing time, a plot of Ln(Ln(1/(1-X)) versus Ln t gives the values of n as the slope of regression line which is around 3 in Figure 4.25.

84
y = 2.973x - 11.599
- 3.5
- 3
- 2.5
- 2
- 1.5
- 1
- 0.5
0
2 2.5 3 3.5 4Ln Time (S)
Ln (
Ln(1
/(1-
X))
Figure 4.25. The relation of crystals volume fraction evolution with function of time
The crystal volume growth is usually expressed as: 33 *)(34 ttGV −= π , where G is
growth rate and t* is incubation time. Thus the crystal volume fraction could be calculated by integrating the product of crystals volume growth and nucleation rate in an infinite time as shown in the following equation:
IdtttGtt
ttXdXX
33
0
*)(* 3
41
−∫=
==
−∫ π (4.21)
where I stands for nucleation rate. Then the Johnson –Mehl -Avrami equation could be derived as follows:
)3
exp(1 43
ItGX π−−= (4.22)
Since the nucleation rate I is a function of t, and the nucleation sites decrease due to the
growth, I is inversely proportional to t, as t
I 1∝ . If the nucleation rate is zero before a
given incubation time, t*, thus, finally the J-M-A equation is simplified as equation 4.23 in this case.

85
)*))((exp(1 3ttkX −−−= (4.23)
Thus with n equal to 3, the phase transition is at a constant growth rate with a varying nucleation rate, due to the decrease of nucleation sites with the progression of crystallization. The comparison of calculated and observed crystal growth rate at 900 0C and 950 0C was in good agreement up for crystal fraction of 70% as shown in Figure 4.26. The deviation over 70% can be explained by the assumption of constant growth rate, which is reduced due to the fraction of surface area available for growth sites, f, which is decreasing with the progression of crystallization phase transition.
0
0.1
0.2
0.3
0.4
0.5
0.6
0.7
0.8
0.9
1
0 50 100 150 200
Time S
Cry
stal
line
frac
tion
X
Figure 4.26. Comparison of crystal fraction versus time between calculation and observation
4.8. Quantification of the Effect of Crystallization on Radiative Heat Transfer
The crystallization kinetics equation at 900 0C for the slag powder could be obtained with the measured crystal growth rate as shown by equation 4.24.
)))41(0127.0(exp(1 3−−−= tX (4.24)
X= 1-exp(-(k(t-t*))3) K=0.0273 t* =15s
X=1-exp(-(k(t-t*))3) K=0.0127 t* = 41S
9000C 950 0C

86
With this kinetic model, the crystal fractions can be calculated from the mixed phase slag disks, crystallized at 900 0C for different times. Thus, the measured heat flux passing through the copper mold versus the crystal fraction is plotted in the Figure 4.27. It could be found that the heat flux transferred to the copper mold decreases linearly with the addition of crystalline phase.
100
120
140
160
180
200
220
240
260
280
0 0.2 0.4 0.6 0.8 1Crystalline Fraction
Mea
sure
d H
eat
Flux
KW
/W2
Figure 4.27. The relation between crystalline fraction and measured heat flux
The model developed in section 4.5 was used to explain the mechanism of radiative heat transfer across solid mold flux through the copper mold and was adopted to quantify the effect of crystallization on radiative heat transfer rate. Therefore, the measured heat flux for a partially crystallized slag disc could be determined according to equation 4.25 by assuming there is no interaction between the parts of crystalline, X, and 1-X glassy phase.
)]}798.01
798.0(1)[1()]
798.01798.0
(1[{2
.
2
.glassy
glassyglassy
cry
crycryo XXII
ρτ
ρρ
τρ
−+−−+
−+−= (4.25)
For the specific slag disc with 0.66 mm thickness in this study, the total reflectance and transmittance for pure crystalline and glassy phase could be obtained from equations 4.12 and 4.13, due to the fixed surface reflectivity and extinction or absorption coefficient, which are around 0.598, 4500 m-1 and 0.103, 400 m-1 respectively from previous study. The measured heat flux equation could be simplified into equation 39, combined with the above values.
I = 253.674 - 49.67 X

87
XIXXII o
67.49674.253]}5026.01)[1()]0001.06.0(1[{
−=−−++−= (4.26)
This model appears to provide excellent agreement with the measured heat flux as shown in Figure 4.27. The reason for the reduction of heat flux with increase of crystalline fraction is because more incident radiation is reflected and scattered from the crystals surface, phase boundaries, and defects, such that less energy would be absorbed and conducted to mold. If the crystal fraction is replaced by the crystallization kinetics equation, the equation 4.26 could be rearranged into 4.27, which describes the measured heat flux behavior as it varies with crystallization time. A plot of the comparison between the measured value and predicted results are shown in Figure 4.28.
]}5026.01)[))41(0127.0(exp(]6.01)][))41(0127.0(exp(1{[ 33
0 −−−+−−−−= ttII (4.27)
100
120
140
160
180
200
220
240
260
0 100 200 300 400 500Annealing Time S
Mea
sure
d H
eat
Flux
kW
/m2
Figure 4.28. The relationship between annealing time and measured heat flux
The heat flux passing through the mold attenuates exponentially with the increase of crystallization time until full crystallization of the slag sample is experienced. This is consistent with the methods developed before. With longer crystallization time, there will be more fraction crystallized, leading to less heat absorbed, until the whole sample is totally crystallized.
I= Io [exp(-(kt)3)Iglass + (1- exp(-(kt)3) Icry.)
88
5. Further Results from the Mold Simulator
Complete details of the mold simulator experiments are given in Appendices 1 through 5. These are copies of papers that have been prepared for publication in various journals. The major results are summarized here: Appendix 1
In appendix 1 details of a new mold flux that was developed in the casting of TRIP steels is discussed. In the casting of high aluminum containing grades, the mold flux chemistry that is attained in the mold can be significantly different from that of the original flux chemistry. Recent developments, aimed at developing an in-mold flux chemistry that is compatible with sequence casting for high aluminum steels, have lead to the development of fluxes with quite different properties that normally used in continuous casting.
These fluxes (1) partially crystallize on cooling; (2) do not form glasses; (3) have a primary solidification phase that is calcium fluoride; (4) further crystallize with holding time and (5) successfully block radiation heat transfer.
This work suggests that fluxes can be developed that are fully crystallized and always block radiation heat transfer by precipitation of second phases against the mold wall. This gives a potential solution which could lead to reduced heat transfer rates and thus reduced oscillation mark formation in a continuous caster.
Appendix 2
In appendix 2 details of the work on mold coatings is given. Most mold coatings increase the heat transfer rate and would lead to an increased oscillation mark depth. Only an alumina coating was found to exhibit potential in reducing the heat transfer rate in the meniscus area; however, as alumina is easily dissolved in mold fluxes this may not be an appropriate method to follow.
The major findings of this part of the work is that the radiative heat flux passing through a metal mold depends upon its top surface conditions, and one can increase the heat transfer rate by choosing an appropriate coating or covering. When a slag disk is placed on a water-cooled copper mold under thermal radiation, it tends to enhance the responding heat transfer rate passing through the system. The effect of crystallization of the solid mold flux on the radiative heat transfer rate in continuous casting is to inhibit the overall heat flux. The maximum reduction in heat transfer rate was 23% for a fully crystallized sample in this study. The absorbed heat conducted to the mold is reduced with increased crystalline volume fraction.
Appendix 3
In appendix 3 details on the work on transition metal oxides is given. The experimental results in this study show that the addition of the transition metal oxides, MnO and FeO, reduces the radiation heat transfer rate by up to 25%. Both the refractive index and the
89
adsorption coefficient increase significantly with the addition of these transition metal oxides.
The addition of these transition metal oxides leads to fully glassy mold flux samples that lose their transparency but remain as a glass. The addition of MnO and Fe2O3 to the initial flux also leads to an increase in both the absorption coefficient (from 400 to 1800 m-1) and the refractive index (from 1.6 to 1.7) of these fluxes. Thus additions of 5% FeO and 10%MnO can be more effective in reducing the radiation heat transfer rate in the meniscus area of a continuous caster. The effect on the overall heat transfer rate is however low.
Appendix 4
A new technique has been developed to allow the observation of the effect of in-situ mold flux crystallization on the radiation heat transfer rate. The in-mold heat flux evolution in the system experiences three stages: incubation, attenuation, and steady state, if the temperature within the flux disk remains below its solidus temperature. The incubation and attenuation stages are a strong function of the thickness of the mold flux and the incident thermal flux. The heat flux attenuates with the development of the mold flux crystallization and reaches steady state, when full crystallization is completed, and the full crystallization of a slag disk inhibited the radiation heat transfer rate by about 16% in this study. If temperatures within the disk increased above its liquidus, and melting occurs, a fourth stage can be measured where the radiation heat transfer rate increased again due to a decrease in the crystal volume fraction due to melting.
Appendix 5
Experiments were conducted that allowed real casting conditions in the mold flux to be simulated where the following conditions could be achieved: a liquid at the top, a solid glassy layer close to the copper substrate and a crystalline layer developed in between. All layer thicknesses could be varied. The effect of mold flux melting and crystal fraction dissolution on radiative heat transfer rates was also measured. It was found that the melting of the solid crystalline flux enhances the incident radiation and results in a higher overall heat transfer rate in the system due to the minimization of the crystal volume which in turn to reduce the solid flux thermal resistance. Thus heat transfer rates will be highest in the meniscus area due to this effect.

90
6. Simulation of the Meniscus Area in a Continuous Caster
A static model for the meniscus in continuous casting In continuous casting, oscillation marks formation is related to the heat transfer rate in the meniscus area. It was experimentally shown that down strokes of the mold are accompanied by an increase of heat transfer rate in the meniscus area, and that upstrokes are characterized by a decrease in the meniscus heat transfer rate. Those heat transfer variations are thought to be a sign that the steel solidification rate increases during the negative strip portion of the oscillation cycle causing the meniscus to be solidified, leading to a solid hook which can either be deformed if its strength is low or overflowed if its strength is high. Of course a combination of effects is also possible and meniscus solidification during negative strip would explain the periodicity of the marks seen in a continuous caster. However, in order to validate this hypothesis, it is necessary to quantify the meniscus heat transfer rate and answer such questions as: (1) how much steel solidifies?; (2) is it enough to cause overflow?; and, (3) what are the exact causes of the increase in heat transfer rate during the negative strip portion of the oscillation cycle? The harsh conditions at the meniscus in a real continuous caster prevent direct observation. Therefore, the best means to answer the above questions is to numerically model the meniscus region. Unfortunately, many phenomena (fluid flow, radiative, conductive and convective heat transfer rates, solidification and the movement of the free surface) occur in this region. These phenomena may be solvable one by one, but when put together they represent a very complex problem. It is the goal of this study to solve it. However, before this can be done, there are a number of assumptions and simplifications to our model of reality that must be validated. Thus, a static model of the meniscus (i.e. the interface between the liquid steel and the slag when it does not deform) was designed and tested. Results of this work will be described in this report.
Continuous casting, meniscus and oscillation marks: background Even though the continuous casting process has constantly been improved since its early development, continuously cast products are not defect free. Among the defects, oscillation marks are not only a source of problems (surface cracks, inclusions and segregation) but they require a costly and excessive surface treatment--spot scarfing and/or surface removal - in order to ensure cast surface quality. Early studies located oscillation mark formation in the meniscus area, where the liquid metal/liquid slag interface next to the mold is curved by the surface tension and many hypotheses were formulated in order to explain the mechanism of formation. A few were discarded, but two remained:

91
− The solidified shell along the wall was thin enough to be bent under the pressure changes caused by the mold oscillations, and that oscillation marks were caused by oscillation based pressure fluctuations.
− The meniscus freezes during the oscillation cycle and as the shell is removed at a
constant velocity, the solidified meniscus must be over flown by liquid steel and an oscillation mark is formed.
They are both based on physical evidence, and no decisive argument has ever been found in order to definitely discard one of those two hypotheses. They both might even be valid. Nevertheless, it was shown that 1) heat transfer rate measurements, through the mold at the meniscus level, indicated that the heat transfer rate increases during the negative strip time; and 2) the (non-frozen) meniscus deforms with the mold’s oscillation, and comes close to the mold during negative strip time. Putting together these two facts leads to the following questions: (1) does the meniscus freeze when it is brought close to the meniscus?; and (2) does the meniscus freeze enough to cause an overflow? Numerical simulation can help us solve this problem; however, there is no direct way to simulate an overflow. The heat transfer (with solidification and radiation) and fluid flow problems have to be solved, with the additional constraint of a moving interface between the liquid metal and the liquid slag. No commercial software can provide a solution, and that is why numerical tools need to be developed.
Why a static model of the meniscus?
We know that the meniscus can freeze and could be overflowed by liquid steel leading to the formation of hook type defects. The interface between the liquid steel (frozen or not) constantly moves. Consequently, keeping this interface fixed is not representative of a real-life situation. Nevertheless, before a moving meniscus model can be designed, some questions must be answered. They are partly attributable to the fact that we intend to model a part of a system (the meniscus and its surroundings) independently from the rest of the system (the liquid steel plus the mold). Thus, boundary conditions that are both realistic and do not significantly affect the results must established. The following conditions must be considered: When poured into the mold through the submerged entry nozzles, liquid steel is
slightly hotter than its liquidus temperature. Some superheat is dissipated through the nozzles, but the temperature of the steel at the exit of the nozzles is still greater than the liquidus. Thus, there exists a temperature gradient from the nozzle exit to the shell. If the meniscus only is modeled, the temperature of the liquid steel on the boundary must be fixed, to a certain temperature, between the liquidus temperature and the superheat temperature. Given the high effective thermal conductivity in the mold due to turbulence, we can assume that at steady state, the decrease in superheat is proportional to the distance to the exit nozzle (boundary 1 in Figure 6.2). Given that the width of the area that we model is of the order of 5 cm, that the distance to

92
the nozzle is 10 times more, the temperature of boundary 1 would be about 1/10th of the superheat temperature.
However, a temperature cannot be imposed on the solidified shell as it exits. The
mold must be calculated (boundary (2) in Figure 6.2) as it would determine whether the shell solidifies: if the temperature is below solidus, the whole boundary would be set to solid state, if above liquidus, it would be set to liquid, while what we aim to determine is whether it is solid or liquid. Consequently, applying a heat flux corresponding to actual conditions found in the mold would be appropriate.
Figure 6.2: description of phenomena to simulate and location of boundaries
Cooling of continuous casting molds (boundary (3) in Figure 6.2): continuous casting
molds are thoroughly water-cooled. Convection coefficients are usually estimated at 10,000-20,000 W/m2/K, but cannot be precisely defined.

93
The flow in the liquid steel is turbulent: at different scales, the flow becomes chaotic, random and unsteady. Accordingly, the fluid’s apparent properties are changed; notably, the apparent viscosity and thermal conductivity are increased ((4) in Figure 6.2). Some numerical models yield a good approximation of these apparent properties. However, they are not simple and require additional computation complexity.
The flow in the caster is complex ((5) in Figure 6.2); even in the meniscus area, the
flow pattern can vary. The surface that we actually model has to surround the meniscus. Yet, which size
should it be? Making it too large would make the computational problem too difficult. Making it too small would imply setting the temperature too close to the meniscus, thus the temperature field at the meniscus would be influenced by this boundary.
Numerical methods
Conduction
Heat transfer is governed by Fourier’s law:
•
+∇=⎟⎠⎞
⎜⎝⎛ ∇+∂∂
= QTkTtTC
dtdTC pp
2.Vρρ Eq. 1
Where ρ is the density (kg.m-3), Cp is the heat capacity (J.K-1.kg-1), T the temperature (K), t the time (s), V is the velocity field (m.s-1), k the material’s conductivity (J.K-1.m-1) and •
Q is any heat source (J.s-1.m-3), which includes latent heat from melting and solidification.
Pure conduction problems ( TktTC p
2∇=∂∂ρ ) are well known, can be analytically
solved according to the boundary limits, and the finite element solution is straight forward. If w is the weight function, and N the interpolation function, the finite element discretization is simply:
FKM +=•
TT Eq. 2
With:
Ω= ∫Ω
dwCNe
pρM (capacitance matric) Eq. 3

94
Ω∂∂
∂∂
−= ∫Ω
dxw
xNk
e ii
K (conductance matrix) Eq. 4
Γ∂∂
= ∫Γ
dxwNk
i
F (boundary terms) Eq. 5
An implicit time discretization is often preferred to an explicit discretization:
( ) ( ) FMKMKFMM +=Δ+⇒=+Δ−
= +++•
nnnnn
TTtTt
TTT 111
Eq. 6
This formulation are unconditionally stable (i.e. there will not be any divergence due to a too large time step)
Advection stabilization
Convection adds another term to the finite element discretization:
TTktTC p ∇−∇=∂∂ V2ρ Eq. 7
Consequently, the finite element formulation is added one extra term:
TTTeff CKM +=•
Eq. 8
With:
Ω∂∂
= ∫Ω
dxwVNCp
e iiρC Eq. 9
∫Ω
Ω=e
dwNC effpρeffM Eq. 10

95
Nevertheless, such formulations are never used. Actually, just like finite difference methods, they yield very unstable results at high péclet numbers (i.e. convective heat transfer dominating over conductive heat transfer). With finite difference methods, this was overcome with upwind techniques: derivatives at a point are calculated according to values of the fluid located upstream of this point. Similar methods were introduced with finite elements, by modifying the weight function. Several modifications were proposed. According to the so-called Characteristic-Galerkin[22], only the weight function for the convective term is modified; the weight function is the same as the interpolation function for all term but the convective term:
w = N Eq. 11
While the weight function w’ for the convective term is:
ixUit
∂∂
Δ−=NNw'
21 Eq. 12
Solidification
As mentioned above, solidification can be considered as a heat source in the heat transport equation. The heat released during solidification is:
TfHC
tTC
tT
TfH
tfHQ LeffpeffpLL ∂
∂=⇒
∂∂
=∂∂
∂∂
=∂∂
=•
ρρρ Eq. 13
Where f is the liquid fraction, HL (in J.Kg-1) is the latent heat of release. Tf
∂∂ can be
obtained from the phase diagram and Cp eff is defined as an effective heat capacity. Inside the liquid or solid zone, where there is no solidification involved, Cp eff is simply Cp. In
the mushy zone, if we neglect solute variations, Tf
∂∂ can be considered constant with the
mushy zone and is:
Solidusliquidusf TTTTf
−=
Δ=
∂∂ 11 Eq. 14

96
First implementations relied on the apparent heat capacity method, according to which the effective heat capacity is simply inserted into Eq. 3, such that the capacitance matrix is modified:
FKM +=•
TTeff With
Ω= ∫Ω
dwCNe
effpeff ρM
However, the effective heat capacity Cp eff cannot be decomposed over simple shape functions (such as linear or quadratic shape functions) like temperature can be. Indeed, the general case is that the transition from solid or liquid to mushy occurs within an element. Thus, the effective heat capacity is a discontinuous function while classical finite elements are only able to manage continuous functions. So the matter is to deal with setting a value for effective heat capacity for elements containing a border between a mushy zone and liquid/solid zone. Several attempts were made in order to deal with this issue (see Figure 6.3).
Figure 6.3: graphic representation of the discretization of the heat capacity method
Cp eff is either set to Cp or f
Lp T
HCΔ
+ρ for the whole element, according to a condition
such as: a certain point at the center of the element is below/above the liquidus/meniscus, etc. This is a very prevalent method, but it suffers from very unstable results if the mesh size is inappropriate: the change in the heat capacity is very large, especially if HL is large

97
and/or ΔTf is small. Consequently, the heat will increase at a high rate when Cp eff =Cp and
suddenly slowly when Cp eff =f
Lp T
HCΔ
+ρ . As the solidification front moves, its velocity
will constantly oscillate. The mesh must be refined enough for this oscillating behavior to be unnoticeable. This also leads to non-conservation of energy (Figure 6.3, (1)). A refinement of the previous method consists of giving a value to the effective heat
capacity for each integration point. The issues rising from this method are identical to those of the method aforementioned, minimized according to the integration level[23]. The values of the effective heat capacities can also be smoothed. A few methods were
derived [24]. Oscillations are reduced, which helps conservation of energy. However, the limit between solid, mushy and liquid zone is not well defined, and this method is not compatible with extended finite elements, which are two necessary conditions for the sake of this project (Figure 6.3, (2)). Lastly, numerical integration can be realized separately on each side of the
interface[25]. The elements containing more than one phase are spitted into as many as necessary, so that either the heat capacity Cp or the effective heat capacity Cp eff is used according to the phase. Shape functions are the same as for normal element, but Gauss quadrature integration points and coefficients must be computed at each step, for each element where it is necessary. Yet, there exists formulas only for triangle and quadrilateral. But when a quadrilateral is split in half, a pentagon might result. This pentagon must be split into triangles in order to compute (Figure 6.3, (3)).

98
Implementation of the model
Figure 6.4: Part of the caster that is modeled
The target of this model is to estimate the thickness of the solidified shell of the meniscus at steady state though the meniscus is never at steady state. In fact, it was shown that it constantly melts and solidifies. When melted, the steel/slag surface close to the mold deforms owing to mold oscillations. Lastly, liquid steel might overflow the solidified shell. This model keeps the interface between the steel and the slag constant and consequently, outputs from this model do not show such effects. Emphasis is put on heat transfer and all the parameters that might exert an influence on heat transfer. Consequently, the goal of this model is to balance heat transfer, taking account of all the parameters previously quoted. The mesh that was designed is represented in Figure 6.5: Mesh used. Figure 6.4 denotes which part of the caster is modeled. It uses 10,000 quadrilateral quadratic elements and is divided into 3 regions: the copper mold, where temperature gradients are comparatively large so element size is rather large, as opposed to the slag where gradients are large and elements small. In the metal region, the mesh is only refined where solidification is suspected of happening. The copper mold’s width is 10 cm and its height is 6 cm; the steel zone is 5cm wide and 5 cm high, rounded on the top left with a 2.5 cm radius. The slag layer on top of the steel is 1 cm thick

99
One issue with a static meniscus is that even though no withdrawal velocity is imposed to the solid phase, the solidified steel must be removed at the same rate as it would be in reality. Therefore, a fluid flow pattern has to be applied and convection effects calculated in the steel part. Given that the flow has to be conservative, a simple flow field was calculated so that close to the meniscus, the velocity is the velocity withdrawal. The solution is shown in Figure 6.6. Then the finite element model solved the heat transfer according to the phasewise integration method solidification and Characteristic-Galerkin advection stabilization methods which were described above
Outcomes from the model
Benchmark (see appendix 6.I) First, in order to test the model, a benchmark was done:
• Initial temperature of the whole system was set to 1532 °C • Water cooling temperature was set at 20°C, the convection coefficient at 10,000
W/m/K. • The superheat was set to 1532°C. • The steel liquidus was 1530 °C; the solidus was 1492°C. The effective conductivity
of steel was 100,000 W/m/K • The slag density was set to 1000 kg.m-3; its heat capacity was 1000 J.K.m-3 and its
conductivity 1 W.m-1.K-1. Its thickness was 1mm.
Figure 6.5: Mesh used

100
• Copper’s property were standard pure copper properties.
The state of the meniscus is shown in Appendix 6.A every 1 s. The evolution is smooth and no oscillations due to convection or solidification happen. All simulations were compared with this benchmark.
Influence of input parameters on the model Slag conductivity According to its composition, the conductivity of a slag can vary between 0.5 and 2 W/m/K. The effect of slag conductivity is shown in appendix 6.B, for a slag layer thickness of 1 mm. The consequence is quite dramatic, since for k = 0.5 W/m/K, the meniscus is hardly frozen, while k = 2 W/m/K, the meniscus is half frozen. Mold water cooling Theoretical calculations of the convection coefficient of the mold water cooling give values between 5,000 and 20,000 W/K. Computations using any of those two values yield similar results. Similarly, the cooling of the top slag layer by fresh air can be ignored. Effect of turbulence and effective conductivity of the liquid steel Flow in the liquid steel inside the mold is turbulent. One consequence is to greatly increase the effective thermal conductivity of the liquid steel: while the actual thermal conductivity of liquid steel is 30 W/m/K, the effective heat conductivity given by k-ε models reaches values of the order of 105 W/m/K. Obviously, this phenomena also happen in the neighborhood of the meniscus. It could be possible to compute turbulences in our model, but it would be more convenient if the thermal conductivity could be approximated. Here, it was linearly approximated as a function of the distance to the
• A flow that simulates steel withdrawal was calculated and applied to all calculations
Shell withdrawal velocisty
Figure 6.6: velocity field for simulating steel removal

101
walls. Simulation with the Fluent software showed that the maximum effective thermal conductivity at the boundaries of the zone we study was about 104 W/m/K. Consequently, simulations were made where the effective heat conductivity was a linear function of the distance to the slag/steel interface, and where the maximum thermal conductivity were 8.104 W/m/K, 10.104 W/m/K, 12.104 W/m/K. Results are shown in appendix 6.C; they do not show any difference for any of the values quoted above. As a consequence, the exact knowledge of the turbulent parameters is not necessary to understand thermal behavior of the meniscus area. Effect of the superheat Liquid steel is injected in the caster a couple Kelvin above the liquidus temperature (10-20 Kelvin). Since the solidified shell is always thin compared with the dimension of the mold (the solid shell is 10 mm thick at the exit of the mold, while in the case of thick slab casting, the mold might be 400-500 mm wide). Consequently, a gradient of temperature exists between the solid shell and the nozzle entrance (where the superheat temperature is usually measured). However, due to the flow and the variation of the effective thermal conductivity, even at steady state, it is far from being linear. Fluent simulations showed us that due to the relatively low thermal conductivity of the liquid steel close to the surface of the steel (compared with the rest of the caster), the temperature suddenly drops in the vicinity of the steel shell, so that about half of the temperature drop between the entrance of the nozzle and the steel shell happens in this 50 mm layer of liquid steel. Appendix 6.D shows two representations of meniscus for standard conditions, one with a superheat of 10 K (i.e. the steel is 5 K above the liquidus at 50 mm away from the solid shell), another one with a superheat of 20 K (i.e. the steel is 10 K above the liquidus at 50 mm away from the solid shell). Results are dissimilar, which show the importance of superheat. Effect of the heat input in the mold and of a insulating board in order to minimize the solidification of the meniscus Many authors explain the formation of oscillation marks by a premature freezing of the meniscus. If the solidification of the meniscus could be avoided by a better control of the temperature in the meniscus area, it is tempting to say that oscillation marks could be decreased. The following simulations were done: the initial state is the one described above as a benchmark, once steady state is obtained. Immediately at the beginning of the simulation, a heat source – with a insignificant width, 50 mm high – is turned on. The effect on the freezing of the meniscus and the temperature field are then observed. Appendix 6.E shows for instance the effect of a 10 MW/m2 heat source on the meniscus. It doesn’t have any effect: steady state is reached without any obvious change of the solidified height of the meniscus. Appendix 6.F shows the same simulation, with a 1,000 MW/m2 heat source (ignoring the feasibility of such power). Here, the meniscus is actually affected by the heat source, but after a couple seconds only. A look at the temperature field in the mold (Appendix 6.G shows the 100X100 mm section of the mold along the meniscus at different time of the simulation) shows that the heat actually dissipates in the whole width of the mold rather than in the border of the mold, where it is emitted.

102
This is why the idea of using an insulating board instead of a heat source might be interesting. Obviously, it cannot be controlled the same way a heat source can be. But, as shown in appendix 6.H, they can have dramatic effects. This simulation is similar than the two previous ones, except that the region that was a heat source is now an insulating region (this insulating board is 5 mm thick, 50 mm high and its thermal characteristics were taken equal to those of the slag). Results show a dramatic reduction of the frozen meniscus within a couple seconds. However, the temperature reached between the insulating board and the slag layer quickly exceeds the copper solidification temperature.
Conclusion
After explaining the necessity for a model for a static meniscus and listing all the results we could obtain from it, a review of discretization techniques for solidification described the pros and cons of the various techniques. A separated integration per phase is more complex and computationally more expensive; however, it yields very smooth results. First, this model allows us to acknowledge the difference between some parameters that can be neglected for a transient study of the meniscus and those which have to be considered. The convection coefficient, the exact knowledge of turbulence can be simplified. However, the superheat, the slag properties are crucial knowledge that cannot be ignored. Furthermore, it was noticed that inputting some heat in the mold could affect the freezing of the meniscus. An insulating board could have the same effect, but cannot be controlled. The use of both of them together has to be studied.

103
Appendix 6.A: Evolution of the meniscus with time for standard conditions
t = 0.1 s t = 1 s t = 2 s
t = 3 s t = 4 s t = 5 s

104
Appendix 6.B: Effect of slag conductivity
k = 0.5 W/m/K k = 1 W/m/K k = 2 W/m/K

105
Appendix 6.C: Effect of effective conductivity in steel
keff = 100,000 W/K/m keff = 120,000 W/K/m keff = 80,000 W/K/m

106
Appendix 6.D: Effect of superheat
Superheat = 10K Superheat = 20 K

107
Appendix 6.E: Effect of a heat input in the mold (10 MW/m2)
t = 0.1 s t = 5 s t = 7 s
10 mm

108
Appendix 6.F: Effect of a heat input in the mold (1 GW/m2): answer regarding phase evolution
t = 0.1 s t = 1 s t = 2 s
t = 3 s t = 4 s t = 5 s

109
Appendix 6.G: Effect of a heat input in the mold (1 GW/m2): answer regarding temperature field
t = 0.1 s t = 1 s t = 2 s
t = 3 s t = 4 s t = 5 s
T (°C)
100 mm

110
Appendix 6.H: Effect of an insulating board
t = 0.1 s t = 1 s t = 2 s
t = 4 s t = 5 s t = 6 s
t = 7 s t = 8 s

111
Appendix 6.I: Typical values for the benchmark model
Steel
Solidus 1492 °C
Liquidus 1530 °C
Thermal conductivity in solid 40 W/m/K
Effective thermal conductivity in liquid
5,000 W/m/K
Latent heat of fusion 250,000 J/kg
Density 7000 kg/m3
Heat capacity 800 J/K/kg
Slag
Thermal conductivity in solid 1 W/m/K
Radiative heat transfer no
Density 1000 kg/m3
casting parameters
Withdrawal velocity 0.02 m/s
Superheat 27 °C
water cooling convection coefficient
20,000 W/K/m2

112
7. Conclusions
The major findings of this project were that: (1) A new experimental technique was developed that allowed the effect of mold flux chemistry and crystallization on the radiation heat transfer rate to be measured dynamically. (2) Mold flux crystallization can result in a significant decrease in the rate of radiation heat transfer in continuous casting. Crystallization of a mold flux can lead to a 20% decrease in the radiation heat transfer rate.
(3) Most mold coatings increase the radiation heat transfer rate by decreasing reflectivity and would lead to an increased oscillation mark depth. Only an alumina coating was found to have potential in reducing the heat transfer rate in the meniscus area; however, as alumina is easily dissolved in mold fluxes this may not be an appropriate method to follow.
(4) In the casting of high aluminum containing grades, the mold flux chemistry that is attained in the mold can be significantly different from that of the original flux chemistry. Recent developments, aimed at developing an in-mold flux chemistry that is compatible with sequence casting for high aluminum steels, have lead to the development of fluxes with quite different properties than normally used in continuous casting. These fluxes (1) partially crystallize on cooling; (2) do not form glasses; (3) have a primary solidification phase that is calcium fluoride; (4) further crystallize with holding time, and (5) successfully block radiation heat transfer. This work suggests that fluxes can be developed that are fully crystallized and always block radiation heat transfer by precipitation of second phases against the mold wall. This gives a potential solution which could lead to reduced heat transfer rates and thus reduced oscillation mark formation in a continuous caster.
(5) The addition of the transition metal oxides, MnO and FeO, reduces the radiation heat transfer rate by up to 25%. The addition of these transition metal oxides leads to fully glassy mold flux samples that lose their transparency but remain as a glass. The addition of MnO and Fe2O3 to the initial flux also leads to an increase in both the absorption coefficient (from 400 to 1800 m-1) and the refractive index (from 1.6 to 1.7) of these fluxes. Thus additions of 5% FeO and 10%MnO can be effective in reducing the radiation heat transfer rate in the meniscus area of a continuous caster.
(6) Experiments were conducted that allowed real casting conditions in the mold flux to be simulated where the following conditions could be achieved: a liquid at the top, a solid glassy layer close to the copper substrate and a crystalline layer developed in between. All layer thicknesses could be varied. The effect of mold flux melting and of crystal fraction dissolution on radiation heat transfer rates were also measured. It was found that the melting of the solid crystalline flux enhanced the incident radiation transfer and resulted in a higher overall heat transfer rate in the system due to the minimization of the

113
crystal volume which in turn reduced the solid flux thermal resistance. Thus, radiation heat transfer rates will be highest in the meniscus area due to this effect.
(7) Insulation or heat input in the meniscus area should be effective in reducing oscillation marks if carried out simultaneously.
(8) Meniscus movement should also be possible and techniques that move the meniscus further away from the mold will allow decreased mark formation.
8. References [1] Savage, J. and W. H. Pritchard (1954) Journal of the Iron and Steel Institute, November 1954 pp. 269-277 [2] Takeuchi, E. and J. K. Brimacombe (1984) Metallurgical Transactions B Vol. 15B, pp. 493-508 [3] Nakato, H. ,T. Nozaki, , Y. Habu, H. Oka and T. Ueda (1985) Steelmaking Conference Proceedings, The Iron and Steel Society: Warrendale, PA pp. 361-365 [4] Wolf, M. M. (1991) Steelmaking Conference Proceedings, The Iron and Steel Society: Warrendale, PA pp. 51-71 [5] Iwasaki, T. and E. Takehara (1970) Mitsubishi Heavy Industries Ltd., Technical Review, January 1970, pp. 1-14. [6] Nakamori, Y. Y. Fujikake, K. Tokiwa, T. Kataoka, S. Tsuneoka and H. Misumi (1984) Tetsu-to-Hagane Vol. 70 pp. 1262-1268 [7] Wray, P.J. (1981) Metallurgical Transactions B Vol. 12B, pp. 167-176 [8] Singh, S. N. and K. E. Blazek (1974) Journal of Metals, Oct. 1974, pp. 17-27 [9] Sato, R. (1979) Proceedings of the National Open Hearth and BOS Conference Vol. 62, pp. 48-37 [10] Matsushita, A., K. Isogami, M. Temma, T. Ninomiya and K. Tsutsumi (1988) ISIJ Transactions Vol. 28 pp. 531-534 [11] Tomono, H., P. Ackermann, W. Kurz, and W. Heinemann (1980) Proceedings of the International Conference on Solidification Technology in Foundry and Cast House, The Metals Society, Warwick, pp. 524-531 [12] Jimbo, I. and A. W. Cramb (1993) Transactions of the Iron and Steel Society, June 1993, pp. 55-64 [13] Laki, R. S., J. Beech, and G. J. Davies (1984) Ironmaking and Steelmaking, Vol. 11, No. 5 pp. 283-291 [14] Saucedo, I. G. (1997) Continuous Casting Vol.9: Initial Solidification and Strand Surface Quality of Peritectic Steels, The Iron and Steel Society, Warrendale, PA pp. 131-141 [15] Stemple, D. K., E. N. Zulueta and M. C. Flemings (1982) Metallurgical Transactions B Vol. 13B, pp. 503-509 [16] Szekeres, E. S. (1996) Iron and Steel Engineer, July 1996 pp. 29-37 [17] Badri, A., T. T. Natarajan, C. C. Snyder, K. D. Powers, F. J. Mannion and A. W. Cramb

114
[18] Badri, A. B. and A. W. Cramb (2002) 85th Steelmaking Conference Proceedings, ISS-AIME pp. 65-76 [19] Badri, A. B. and A. W. Cramb (2002) 60th Electric Furnace Steelmaking Conference Proceedings, ISS-AIME [20] Badri, A., J. Park and A. W. Cramb (2003) 1st ISSTech Conference Proceedings, ISS-AIME [21] A. Badri: PhD Thesis, Carnegie Mellon University, Pittsburgh, Pa., 2003 [22] A. B. Badri, and A. W. Cramb, “Heat Flux Calculations From Thermocouples – What Can Be Measured?” 85th Steelmaking Conference Proceedings, ISS-AIME, 2002, pp. 65-76. [23] B. Badri, and A. W. Cramb, “Measurement of Oscillating Temperatures Using Subsurface Thermocouples” 60th Electric Furnace Steelmaking Conference Proceedings, ISS-AIME, 2002. pp.412 [24]A. B. Badri, and A. W. Cramb, “Thermocouples – What temperature are they measuring?” 2001 ISS Electric Furnace Conference Proceedings, 2001, pp. 661-670. [25] J. F. King, “Global steel industry analysis-Iron & Steel industry production reports from the ISSB”, ISSB monthly world, I & S review, 2006. [26]D. Ameing, “The pivotal nature of continuous casting in the steel industry”, Dr. Manfred Wolf Symposium—Innovation and Excellence in Continuous Casting, Zurich, Switzerland, May 2002, pp 2-14. [27]B.G. Thomas, “Continuous Casting Modeling”, The Encyclopedia of Advanced Materials, Pergamon Elsevier Science Ltd., Oxford, UK, Vol. 2, 2001, pp8. [28]M.M. Wolf, “History of Continuous Casting”, Steelmaking Conference Proceedings, Vol 75, 1992, pp 83-187. [29]P.V. Ribound, M. Larrecq, “Lubrication and heat transfer in a continuous casting mold”, Steelmaking Conference Proceedings, The Iron and Steel Society, 1979, Warrendale, PA [30]I. Saucedo, J. Beech and G. J. Davies “Heat transfer and solidification kinetics in meniscus zone during casting” Metals Technology, Vol. 9, 1982, pp. 282-291 [31]R.B. Mahapatra, J. K. Brimacombe, I. V. Samarasekera, N. Walker, E. A. Paterson, J. D. Young (1990) “Mold behavior and its influence on quality in the continuous casting of steel slabs: Part I. Industrial trials, mold temperature measurements and mathematical modeling” Metallurgical Transactions B Vol. 22B, pp. 861-873 [32]E.A. Vladimiroy, (1970) “On the experimental determination of thermal fluxes in the walls of molds used for the continuous casting of metals” Inzhenerno-Fizicheskii Zhurnal, Vol. 18, No. 2, pp. 270-277 [33]A.W. Hills, (1964) “Simplified theoretical treatment for the transfer of heat in continuous casting moulds” Journal of the Iron and Steel Institute January 1965 pp. 18-26 [34]A. Grill, and J. K. Brimacombe (1976) “Influence of carbon content on rate of heat extraction in the mold of a continuous casting machine” Ironmaking and Steelmaking, 1976 No. 2 pp.76-79 [35]P. J. Zasowski and D. J. Sosinski, (1990) “ Control of heat removal in the continuous casting mold” Steelmaking Conference Proceedings, ISS, Vol. 73, 1990, pp. 253-259. [36]W. H. Emling and S. Dawson, “Mold Instrumentation for Breakout Detection and Control” Steelmaking Conference Proceedings, ISS, Vol. 74, 1991, pp. 197-217.

115
[37]Y. Meng, B.G. Thomas, Metallurgical and Materials Transaction B, Vol. 34B, 2003, pp. 685-705 [38]R.D. Pehlke, A. Jeyarajan, H. Wada, “Summary of Thermal Properties for Casting Alloys and Mold Materials” Michigan University, Report Number: NSFMEA82028, 1982. [39]J.F. Holzhauser, K.H. Spitzer, “ The influence of casting aids on heat transfer in the mold, the surface quality and incidence of breakouts in the continuous casting of steel, ECSC Contract, 7210 CA/139, Final report, EUR 12198 DE [40]R. Siegel and J.R. Howell, Thermal Radiation Heat Transfer, McGraw-Hill, Kogakusha. [41]H. Shibata, M. Suzuki, T. Emi, ISIJ international, Vol. 36, 1996, Supplément, pp. s179 [42]H. Nakato, M. Ozawa, K. Kinoshita, Tetsu-to-Hagane, Vol. 67, 1981, pp 1200 [43]A. Yamauchi, T. Sakaraya, T. Emi, Tetsu-to-Hagane, Vol. 79, 1993, pp 167 [44]Y. Sugitani, M. Nakamura, Tetsu-to-Hagane, Vol. 81, 1995, pp 971 [45]M. Suzuki, H. Shibata, T. Emi, ISIJ international, Vol. 36, 1996, Supplement, pp. S171 [46]K.E. Blazek, I.G. Saucedo, H.G. Tsai, “An investigation on mold heat transfer during continuous casting”, Steelmaking Conference Proceedings, ISS, Warrendale, PA, 1993, pp.411 [47]H.L. Gilles, “Development of thermal solidification models for Bethlehem Steel slab casters”, Steelmaking conference Proceedings, ISS, Warrendale, PA, 1993, pp.315 [48]steelmaker, 1994(October): pp. 55-56. [49]H. Kyoden, et al, “Development of mold powders for high speed continuous casting of steel”, Steelmaking conference proceedings, the iron and steel society: Warrendale, PA, 1987: pp. 45-51. [50]E. Takeuchi, J.K. Brimacombe, “The formation of oscillation marks in the continuous casting of steel slabs”, Metallurgical and Materials Transaction B, Vol. 15B, 1984, pp.493 [51]P.V. Larrecq, et al, “Lubrication and heat transfer in a continuous casting mold”, 62nd national open hearth & basic oxygen steel conference proceedings, Detroit, 1979, pp. 78-90. [52]M. Emi, “The mechanism for sticking break-outs and net developments in continuous casting”, Steelmaking conference proceedings, the iron and steel society: Warrendale, PA, 1991, pp. 623-630. [53]E.L. Oriel, Journal of metals, Vol. 26, No. 10, 1974, pp. 37-42. [54]T.A. Ikeda, et al, “Optimization of mold oscillation for high speed casting - new criteria for mold oscillation”, Canadian metallurgical quarterly, Vol. 38, 2000, pp. 295-300. [55]T. Emi, et al., “Influence of physical and chemical properties of mold powders on the solidification and occurrence of surface defects of strand cast slabs”, 61st national open hearth and basic oxygen steel conference proceedings, Chicago ,1978, pp. 350-361. [56]C.A.M. Pinheiro, I.V. Samarasikera and B.N. Walker, “Mold heat transfer and continuously cast billet quality with mould flux lubrication:, Ironmaking and Steelmaking, Vol 27, 2000, pp.37 [57]J. Cho, H. Shibata, T. Emi and M. Suzuki, ISIJ international, Vol. 38, 1998, pp.440

116
[58]J.F. Chavez, A. Rodriguez, V. H. Tapia , ‘Laboratory and plant studies on thermal proterties of mold powders’, Steelmaking ConferenceProceedings, Nashville, TN, 1995, Vol. 78, pp.679 [59]Y. Nakamori, Y. Fujikake, K. Tokiwa, Tetsu-to-Hagane (J. Iron Steel Ins. Jpn), Vol. 70, 1984, pp. 1262 [60]M.M. Wolf, “Review of Mould Friction”, BHM, 2000, Vol. 145, pp. 270 [61]W.H. Emling, S. Dawson, “Mold instrumentation for breakout detection and control”, 74th Steelmaking Conference, Washington, D.C., Vol. 74, 1991, pp.197 [62]Y. Meng, B.G. Thomas, Metallurgical and Materials Transaction B, Vol. 34B, 2003, pp.707 [63]M. Susa, K.C.M., M.J. Richardson, R. Taylor and D. Stewart, “Thermal properties of slag films taken from continuous casting mould”, Ironmaking and steelmaking, Vol. 21, 1994, pp. 279-286. [64]J. Cho, H, Toshihiko, T. Emi and M. Suzuki, “Radiative heat transfer through mold flux film during initial solidification in continuous casting of steel”, Transaction of the iron and steel Institute of Japan, Vol. 38, 1998, pp. 268-275. [65]M. D. Rosa, et al, Metallurgical Transactions B, Vol.12B, 1981, pp. 287-298. [66]T. Kanazawa, S. Hiraki, T. Murakami, Tetsu-to-Hanane, Vol. 83, 1997, pp. 701 [67]J. Fukuta, T. Kondo, M. Okumura, ISIJ, Tokyo, 1994, pp.68 [68]J. Cho, H. Shibata, M. Suzuki, ISIJ international, Vol. 38, 1998, pp. 268 [69]J. Cho, H. Shibata, M. Suzuki, ISIJ international, Vol. 38, 1998, pp. 440 [70]J. Cho, H. Shibata, M. Suzuki, ISIJ international, Vol. 38, 1998, pp. 834 [71]F.M. White, F. M, Heat Transfer, Addison-Wesley, Reading, MA, 1984. pp.563 [72]M. F Modest, Radiative Heat Transfer, 2nd Edition, Academic Press, CA, 2003. [73]M. Susa, K. Nagata, K.C. Mills, Ironmaking and steelmaking, Vol. 20, 1993, pp. 372. [74]Wanlin Wang, Alan Cramb. “Model of Radiative Heat Transfer in Solid Mold Flux Phase during Continuous Casting” Proc. of Automation & Control/Advanced Online Metallurgical Models/Sensors MS&T 2005, pp 33-44, 2005 [75]Wanlin Wang, Alan Cramb. “The Effect of Mold Flux Crystallization on Radiative Heat Transfer Rates” TMS letters, 2005. [76]Wanlin Wang, Alan Cramb. “The Observation of Mold Flux Crystallization on Radiative Heat Transfer”, ISIJ Vol. 45, no.12, 2005, pp.1864-1870. [77]M Susa, F. Li, K. Nagata, Metallurgical Transactions B, Vol. 23B, 1992, pp.331. [78]J. Sengupta, H. Shin, BG Thomas, et al, Acta Mat., Vol. 54, 2006, pp.1165 [79]E. S. Larsen and H. Berman, “The microscopical determination of non-opaque minerals”, 2nd edn, US Geological Survey Bull. 1934, Washington, DC, US Government Printing Office, pp. 848 [80]M. R. Berrahmoune, S. Berveiller, K. Inal, A. Moulin, E. Patoor, Materials Science and Engineering A, Vol. 378, 2004, pp. 304 [81]H.C. Chen, H. Era, M.Shimizu, Metallurgical Transactions A, Vol. 20A, 1989, pp. 437 [82]W.C. Jeong, D.K. Matlock, G. Krauss, Materials Science and Engineering A, Vol. 165, 1993, pp. 9 [83]O. Matsumura, Y. Sakuma, H. Takechi, ISIJ, Vol.32, 1992, pp. 1014 [84]T. L. Baum, R. J. Fruehan and S. Sridhar, Metallurgical Transactions B, in press.

117
[85]Y. Shiraishi, Handbook of physo-chemical properties at high temperature, ISIJ, Tokyo, 1988, Ch 10 [86]J Park, A. B. Badri, J. T. Wolfe, P. Nolli, A. W. Cramb, ISS Tech 2003 Conference Proceedings, 2003, pp. 575

118
Appendix 1:
A Study of the Crystallization Behavior of a New Mold Flux Used in the Casting of TRIP Steels
Wanlin Wang1, Kenneth Blazek2 and Alan Cramb3 1 Research Scientist,
Reckitt Benckiser Innovation Center 1 Philips Parkway,
Montvale, NJ, 07645 [email protected]
2Principal Research engineer Mittal Steel USA Research laboratory
3001 East Chicago, IN 46312 3 Dean of Engineering
John A. Clark and Edward T. Crossan Professor, Rensselaer Polytechnic Institute
Troy, NY, 12180
ABSTRACT
Transformation Induced Plasticity steels or TRIP steels are one of a new generation of
steel grades that are under development for use in automotive products. Because of the
addition of significant quantities of aluminum to the chemistry of some TRIP steels, one
of the challenges in continuous casting is to design a mold flux that is compatible with
this steel chemistry and allows sequence casting. This paper documents the solidification
behavior of a mold flux that was developed to be more compatible with high aluminum
containing steels and compares its solidification behavior to a commercial mold flux used
in the casting of low carbon aluminum killed steel. This new mold flux precipitates
calcium fluoride at high temperatures and does not form a glass at the cooling rates that
are normally found in a continuous caster.

119
KEY WORDS: Continuous Casting, Heat Transfer, Phase Transformation, Mold Flux
Crystallization, TRIP Steel
1. Introduction
TRIP steels or TRansformation Induced Plasticity steels, are a new generation of steel
grades that can be used in automotive manufacture. TRIP steels exhibit a better ductility
at a given strength when compared to other advanced high-strength steels. This enhanced
formability is due to the transformation of retained austenite to martensite during plastic
deformation. Typical TRIP steels possess a three-phase microstructure, i.e., ferrite,
bainite and retained austenite. One microstructure of TRIP steel, from Mittal Steel USA
in East Chicago, IN, is shown in Figure 1. Because of the improved formability, TRIP
steels could be used to produce more complicated parts than other high strength steels.
Figure 1 A typical microstructure of TRIP steel

120
Aluminum is added to TRIP steels for two reasons. The first reason is to increase
austenite thermal stability, such that it can be retained upon thermo-mechanical loading.
The addition of aluminum is widely employed as it promotes the carbon enrichment in
austenite, which in turn favors austenite stability [1-3]. The second reason is as a
substitute for silicon in TRIP grades that are to be galvannealed. Silicon contents above
0.1% do not permit the formation of a uniform galvannealed product while aluminum
does not have a detrimental effect on the galvanealing process. Therefore, the content of
aluminum (1% or higher) in galvannealed TRIP steels is significantly higher than other
commercial carbon steels (0.005 to 0.08%), and one example of the chemical
composition of a high aluminum TRIP steel in listed in Table I [4].
Table I: Chemical composition of a TRIP steel
Steel C (wt.%) Mn (wt.%) Si (wt.%) Al (wt.%)
TRIP 600 0.139 1.77 0.58 1.05
Because of the addition of significant quantities of aluminum, the great challenge of
casting high aluminum TRIP steels is to design of a mold flux that is chemically
compatible with this steel chemistry. As all mold fluxes are currently based on the lime-
silica system, casting of steel grades containing significant quantities of highly reactive
elements, such as aluminum or titanium, is problematic due to the reduction by aluminum
of any oxides having a metallic component nobler than aluminum during casting.
Dynamically changing chemistry of a mold slag leads to varying viscosity and to a
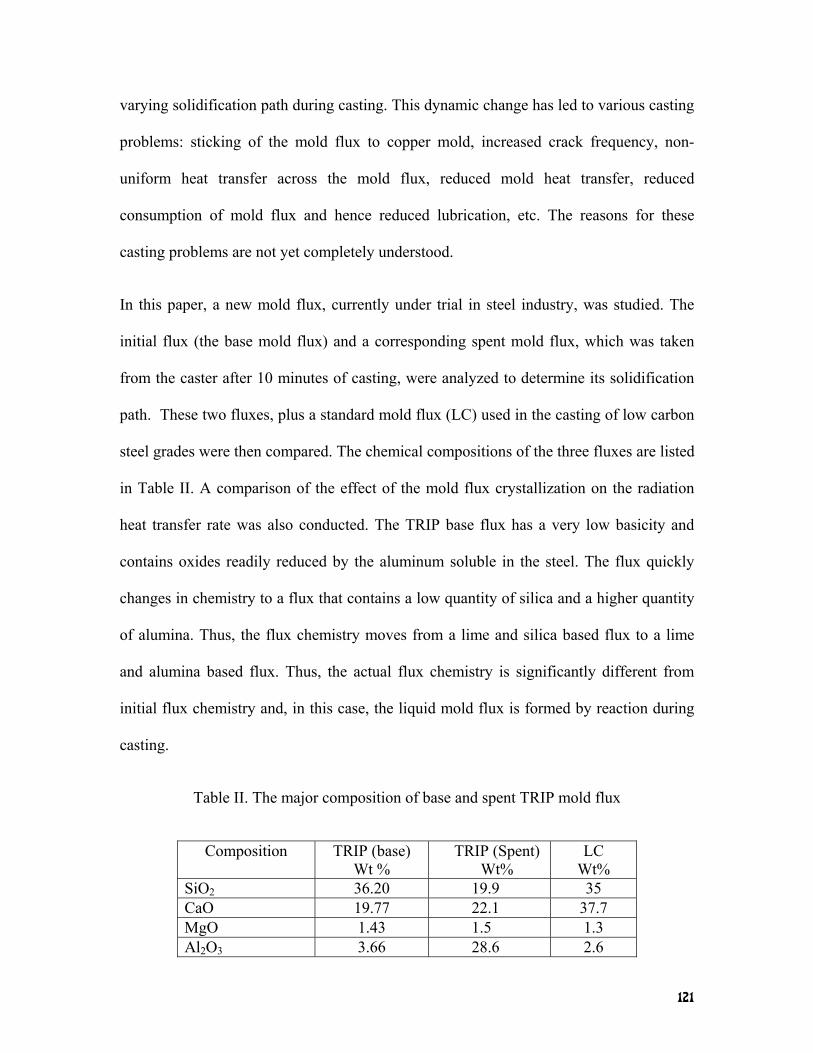
121
varying solidification path during casting. This dynamic change has led to various casting
problems: sticking of the mold flux to copper mold, increased crack frequency, non-
uniform heat transfer across the mold flux, reduced mold heat transfer, reduced
consumption of mold flux and hence reduced lubrication, etc. The reasons for these
casting problems are not yet completely understood.
In this paper, a new mold flux, currently under trial in steel industry, was studied. The
initial flux (the base mold flux) and a corresponding spent mold flux, which was taken
from the caster after 10 minutes of casting, were analyzed to determine its solidification
path. These two fluxes, plus a standard mold flux (LC) used in the casting of low carbon
steel grades were then compared. The chemical compositions of the three fluxes are listed
in Table II. A comparison of the effect of the mold flux crystallization on the radiation
heat transfer rate was also conducted. The TRIP base flux has a very low basicity and
contains oxides readily reduced by the aluminum soluble in the steel. The flux quickly
changes in chemistry to a flux that contains a low quantity of silica and a higher quantity
of alumina. Thus, the flux chemistry moves from a lime and silica based flux to a lime
and alumina based flux. Thus, the actual flux chemistry is significantly different from
initial flux chemistry and, in this case, the liquid mold flux is formed by reaction during
casting.
Table II. The major composition of base and spent TRIP mold flux
Composition TRIP (base) Wt %
TRIP (Spent) Wt%
LC Wt%
SiO2 36.20 19.9 35 CaO 19.77 22.1 37.7 MgO 1.43 1.5 1.3 Al2O3 3.66 28.6 2.6

122
Na2O 10.73 12.0 8 F- 9.72 11.4 5.3 C 4.82 MnO2 6.48 1.6 Li2O 2.10 Basicity 0.55 1.11 1.077
2. Experimental apparatus and procedures
2.1 Infrared emitter
A schematic of the experimental apparatus of an infrared emitter developed at Carnegie
Mellon University by Adam Badri [5-7] is shown in Figure 2. The equipment used in
these experiments includes: a power controller, a high-heat flux infrared radiant heater
with a heating unit, a data acquisition system and a command-and-controlled unit. The
infrared radiation produces the levels of thermal flux seen in a continuous caster (1
MW/m2). These lamps are vacuum-sealed tungsten-alloy filaments, which are
manufactured by General Electric and are capable of emitting 1.0 MW/m2 at 44% above
its rated voltage.
Data acquisition / command-and-control
computer
PowerController
V
I
Coolingair in
Coolingair out
Water-cooled reflector
Coolingwater out
Coolingwater in
Power cables
Thermocouple output
Voltage and current feedback
Commandsignal
Infrared Radiation

123
Figure 2 Experimental apparatus of the infrared emitter.
When a voltage is applied to the heating elements, the elements begin to emit infrared
radiation. The intensity level of this radiation can be controlled precisely by changing the
voltage applied across the elements. To focus all of this radiation onto a sample plane, a
quasi-parabolic reflector is mounted behind the elements. By using a silicon-controlled
rectifier (SCR) based power controller, the voltage across the lamps can be manipulated
between 0 and 208 V, and thus the resulting output flux of the lamps can be varied from 0
to 1.0 MW/m2. In order to be able to generate heat fluxes using specified mathematical
functions, the power controller is connected to a data acquisition and control board,
which is in turn connected to a computer. Thus, any arbitrary signal generated by the
computer can be sent in real time to the power controller, and translated into an output
heat flux by the heating elements.
The infrared emitter is equipped with monitoring systems to ensure that the emitter
operates safely and properly. This instrumentation includes monitoring of the inlet
cooling air pressure, the inlet water pressure to the sample and reflector, and the flow-rate
of cooling water. In addition, the inlet and outlet cooling water temperatures for the
sample and reflector are also monitored. The copper mold is simulated by a water cooled
copper cylinder, which acts as the radiation target, and as shown schematically in Figure
3. As the heat flux (infrared radiation) is applied on the top surface of the copper mold,
which is covered with a mold flux film, the response temperatures could be measured
using the sub-surface thermocouples.

124
Figure 3 Schematic figure of copper substrate used as the radiation target
2.2 The fabrication of mold flux disks
The mold flux was fabricated into a disk for the use during experimentation. To make
these disks, the original slag powders were first pre-fused and oxidized to remove the
bulk of the graphite present in the powder. Then, they were melted in an alumina
crucible, placed on top of the graphite crucible in an induction furnace (Figure 4), and
held at a higher temperature (around 1500 Celsius) for 5 minutes to homogenize its
composition. Subsequently, it was quenched from its molten state by pouring onto a
stainless steel plate (at room temperature). A cylindrical tube-like copper mold with the
same size as the copper substrate in the experiment was used to cast the molten mold
flux, before it solidified on the stainless steel plate. In this manner, a thin glassy mold
Mold Flux 10 mm
Thermal couples
Cooling water inlet
Cooling water outlet
95mm
Chilled surface
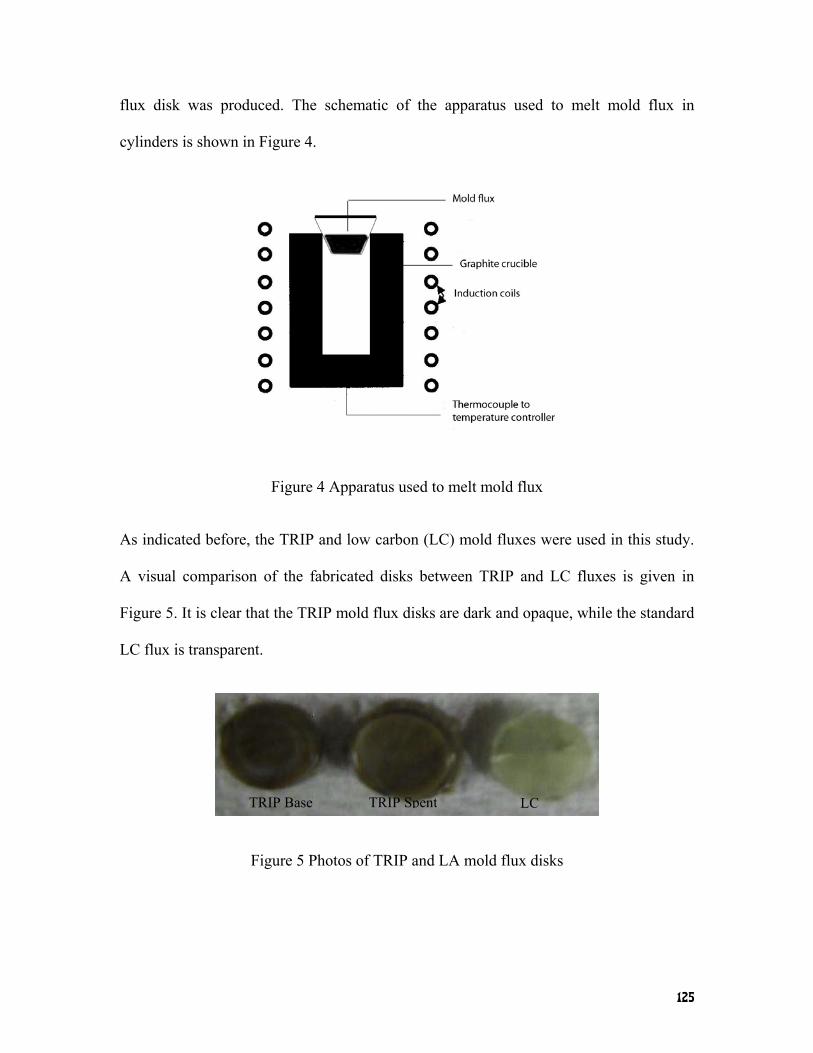
125
flux disk was produced. The schematic of the apparatus used to melt mold flux in
cylinders is shown in Figure 4.
Figure 4 Apparatus used to melt mold flux
As indicated before, the TRIP and low carbon (LC) mold fluxes were used in this study.
A visual comparison of the fabricated disks between TRIP and LC fluxes is given in
Figure 5. It is clear that the TRIP mold flux disks are dark and opaque, while the standard
LC flux is transparent.
Figure 5 Photos of TRIP and LA mold flux disks
TRIP Base LCTRIP Spent

126
3. Results and Discussions
In order to study the optical properties of above three disks, the TRIP base flux, the TRIP
spent flux and low carbon (LC) flux, were scanned and their X-ray patterns are shown in
Figure 6.
(a)
(b)
Figure 6 The X-ray pattern of (a) TRIP base, spent and (b) LC mold fluxes
Figure 6 (a) indicates that there are the same characteristic peaks appearing in both base
and spent TRIP samples. Instead of a fully amorphous curve in Figure 6 (b), as is
common in commercial mold fluxes that are cooled fast enough to form a full glass
phase, complete glass formation was not observed in the above two TRIP samples, even
though they were subjected to the same fast cooling rate as the LC samples in this study.
--TRIP base mold flux --TRIP spent mold flux

127
All of the small crystallized particles precipitated in the disks were clearly observed by
SEM and are shown in Figures 7 (a) and (b); however in Figure 7 (c), the LC mold flux,
the sample is amorphous and transparent (a few bubbles can be seen in the sample).
(a)
(b)

128
(c)
Figure 7 SEM photos of (a) TRIP base mold flux (b) spent mold flux (c) LC sample
The particles crystallized in above two SEM photos have been identified as calcium
fluoride by X-ray identification, as shown in Figure 8 a. The amorphous part of the TRIP
fluxes (base and spent) has also been identified by SEM. Its major composition is listed
in Table III, and its X-ray identification pattern is shown in Figure 8 b.
(a)

129
(b)
Figure 8: (a) X-ray identification of CaF2 and (b) amorphous part
Table III Chemical composition of the amorphous phase of TRIP mold flux
Element O Na Mg Al Si Ca Mn Fe
Weight% 40.96 5.66 0.57 3.42 18.23 21.71 4.71 0.61
Atomic% 60.03 5.77 0.55 2.97 15.22 12.70 2.01 0.26
From both Table III and Figure 8 b, the major composition of the amorphous phase is
calcium silicate CaSiO4, with some small amounts of other oxides (Na2O, MnO2).
Calcium fluoride has a relatively high melting point, 1402oC, is a white (colorless)
crystal, and naturally exists as the mineral fluorite. However, the TRIP mold fluxes have
a lower melting range, from 900 to 1200oC. The liquid slag only becomes transparent
when it was heated up to above 1500 degrees, as was shown by running Double Hot
Thermocouple tests. Therefore, calcium fluoride easily precipitates when the liquid TRIP
mold flux is cooled due to the crystallization of CaF2 in the disks, and results in the

130
opaque nature of the TRIP flux disks. However, the LC and other commercial mold
fluxes become glasses when the liquid flux is quenched. In addition, both TRIP fluxes
have crystallization temperatures higher than any previously used casting flux, as they are
significantly crystallized at all cooling rates normally found during continuous casting.
Experiments were carried out to investigate (1) crystalline phase evolution within the
disks when they were subjected to a thermal flux; and (2) the heat transfer rate through
the mold flux to the mold. The research was conducted by placing the base, spent and LC
flux disks individually on top of the copper mold and subjecting them to the thermal
radiation from the infrared emitter. Subsurface in-mold responding temperatures were
monitored to observe heat flux changes with the development of disk crystallization.
A 2.3 mm glass LC flux disk was first studied in the system. It was pre-heated under 200
KW/m2 thermal radiation for 5 minutes followed by a high constant 1050 KW/m2 thermal
heat flux until full crystallization of the sample was achieved. The measured heat flux
going through copper mold determined by inverse heat conduction methods and its
overall ratio to the incident thermal flux is given in Figure 9.

131
1.0E+05
2.0E+05
3.0E+05
4.0E+05
5.0E+05
6.0E+05
7.0E+05
8.0E+05
9.0E+05
0 400 800 1200 1600
Time S
Mea
sure
d he
at fl
ux W
/m2
0.1
0.2
0.3
0.4
0.5
0.6
0.7
0.8
Ove
ral R
atio
Measured heat flux
Overal ratio
Figure 9: The in-mold responding heat flux and its overall ratio versus time
Figure 9 indicates three stages appearing in the heat flux history: a transient heating
stage, an attenuation stage and a period of steady state. During the first stage, it takes
100-200 seconds for the system to reach the maximum value of the heat transfer rate
prior to the initiation of crystallization. After that, the heat flux starts to attenuate from
815 KW/m2, to 700 KW/m2, when crystallization of the sample is completed during the
attenuation stage. The net effect of crystallization for this 2.3 mm thick glass disk is to
inhibit 15% of the incident thermal flux transmitted to the mold (from 75% to 60%).
Finally, the attenuated heat flux tends to steady state at around 60% of the incident
thermal flux. A SEM photo of this fully crystallized disk is presented in Figure 10, where
the fully amorphous structure of Figure 7 (c) was completely crystallized after it was
annealed under 1MW/m2 thermal flux for 1500 seconds. The equiaxed forms of the
crystals are clearly shown in Figure 10.

132
Figure 10. The SEM photo for the crystallized LC disk sample
The crystallized phase above in above figure for the LC flux has been identified as
Cuspidine (Ca4Si2O7F2 or 3CaO.2SiO2.CaF2) as shown in its X-ray pattern in Figure 11.
Cuspidine is often found in studies of the crystallization of such fluxes.
Figure 11. The X-ray pattern of the crystallized LC disk
A 3 mm TRIP base flux disk was then studied. It was heated with the same constant
1MW/m2 thermal radiation, and the responding in-mold heat flux is given in Figure 12. It
can be observed that the responding in-mold heat flux under the TRIP base flux disk
tends to be constant around 700 KW/m2, once it reaches steady state. And no maximum

133
or decrease in the heat flux is observed; suggesting that further structural effects due to
further crystallization do not affect the overall radiation heat flux, i.e., the crystallization
due to calcium fluoride precipitation has already eliminated the radiation effects that are
found in amorphous fluxes.
0.0E+001.0E+05
2.0E+053.0E+054.0E+05
5.0E+056.0E+05
7.0E+058.0E+05
0 500 1000 1500 2000Time S
Mea
sure
d he
at fl
ux W
/m2
Figure 12: The responding in-mold heat flux in the system with 3 mm TRIP base disk
The annealed flux disk was scanned by X-ray to study the further crystallization behavior
of the base flux. A comparison of X-ray patterns between the original TRIP base disk and
the heated one is shown in Figure 13. It was noticed that another phase crystallized as the
green curves developed along with calcium fluoride (red line) during the experiment
(Figure 13a), and this further crystallization of the original TRIP mold flux has a minor
effect on the heat transfer rates as shown in Figure 12. The new crystallized phase has
been identified Ca(Mn,Fe)Si2O6 (Bustamite, Ferroan).

134
(a)
(b)
Figure 13. (a). A comparison of X-ray patterns between original and final TRIP base mold flux, and (b).The X-ray identification patterns for final TRIP base mold flux
In order to study the TRIP spent flux, a 2.2 mm TRIP spent flux disk was placed in the
system and subjected to the same incident thermal flux. The responding in-mold heat flux
is given in Figure 14. Similarly, the steady state heat transfer rate is around 700 KW/m2,
and there is no fluctuation of the heat flux, once the system approaches steady state.
--Original TRIP base mold flux --TRIP base mold flux after heating

135
0.E+00
1.E+05
2.E+05
3.E+05
4.E+05
5.E+05
6.E+05
7.E+05
8.E+05
0 500 1000 1500 2000
Time S
Mea
sure
d he
at fl
ux W
/m2
Figure 14. The responding in-mold flux in the system with 2.2 mm TRIP spent disk
Both the original and the heated TRIP spent flux disk were also scanned by X-ray, and
their compared X-ray pattern is given in Figure 15. It is also observed that a more
complex polycrystal phase is developed (blue line) along with the red original calcium
fluoride during the heating of the sample. The further crystallization of this spent mold
flux does not introduce a significant effect on the heat transfer rate as shown in Figure 14
Figure 15. X-ray pattern of TRIP spent mold fluxes
--Original TRIP spent mold flux -- TRIP spent mold flux after heating
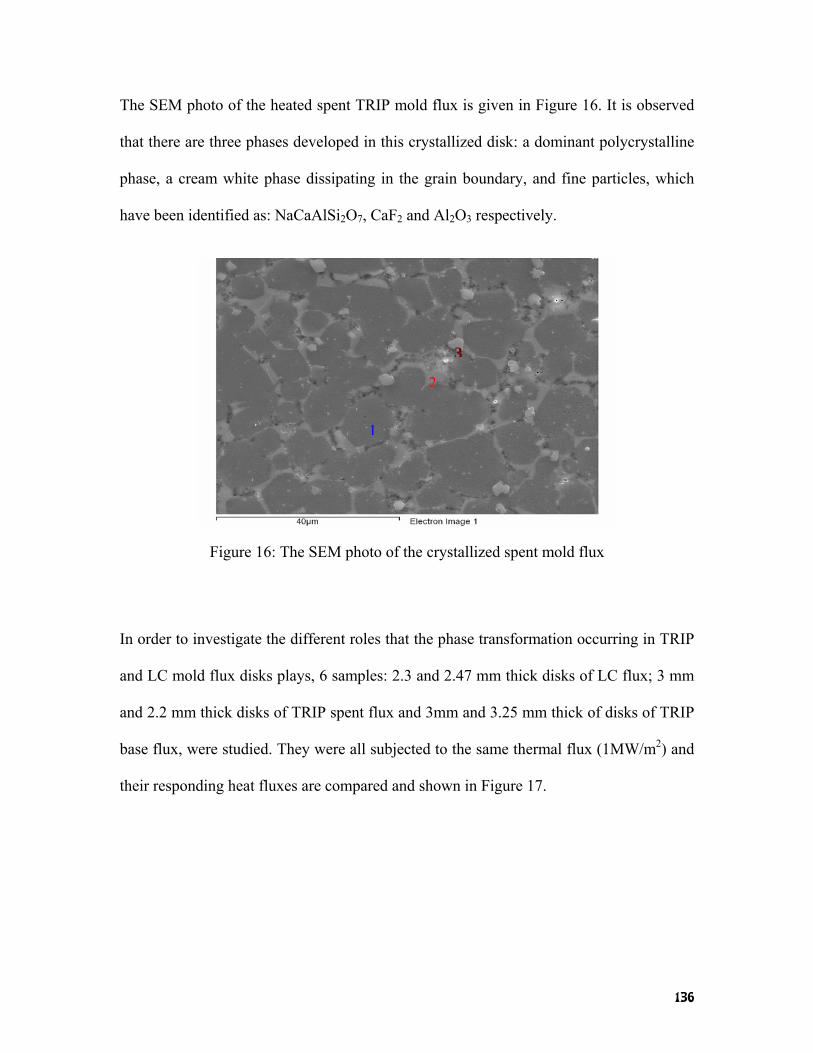
136
The SEM photo of the heated spent TRIP mold flux is given in Figure 16. It is observed
that there are three phases developed in this crystallized disk: a dominant polycrystalline
phase, a cream white phase dissipating in the grain boundary, and fine particles, which
have been identified as: NaCaAlSi2O7, CaF2 and Al2O3 respectively.
Figure 16: The SEM photo of the crystallized spent mold flux
In order to investigate the different roles that the phase transformation occurring in TRIP
and LC mold flux disks plays, 6 samples: 2.3 and 2.47 mm thick disks of LC flux; 3 mm
and 2.2 mm thick disks of TRIP spent flux and 3mm and 3.25 mm thick of disks of TRIP
base flux, were studied. They were all subjected to the same thermal flux (1MW/m2) and
their responding heat fluxes are compared and shown in Figure 17.
1
3
2

137
3.E+05
4.E+05
5.E+05
6.E+05
7.E+05
8.E+05
9.E+05
0 500 1000 1500 2000Time S
Mea
sure
d he
at fl
ux W
/m2
Base 3.0Base 3.25LC 2.47LC 2.3Spent 3.0Spent 2.2
Figure 17. The heat fluxes comparison for three mold fluxes
The LC mold powder has a better radiation heat transfer capacity than the TRIP mold
powders, such that the maximum heat transfer rate (830 KW/m2 for the LC 2.47 mm
disk) is about 18% higher than the TRIP fluxes. The LC heat fluxes attenuate with the
development of crystallization, until they reach steady state, which is consistent with
previous studies. [8-10]. However, for the TRIP flux, the crystallized calcium fluoride
crystals existing in the original sample cause the TRIP flux disks to lose their
transparency. The precipitation of the fine calcium fluoride crystals in the sample, results
in less heat transferred through the disk to the mold. This introduces a larger scattering
factor when the absorbed energy travels within the disk. Therefore, the further
crystallization of the TRIP mold flux will have only a minor effort on the radiation heat
transfer rates. Finally, all heat fluxes at steady state are of the same magnitude (700
KW/m2) as indicated in Figure 17, which indicates that the thermal conductivity for all
fully crystallized fluxes may be in the same range regardless of their composition.

138
It also could be observed in this work that the crystallization of the slag is the primary
factor to affect the radiation heat transfer rate in continuous casting; and that the solid
crystalline mold flux chemistry (compare the composition of the three fluxes in Table II)
has an insignificant influence on the radiation heat transfer rate. This result is consistent
with other researchers’ results [11, 12]. Therefore, all of the heat fluxes at steady state,
under crystallized mold flux disks, are of the same magnitude, even when the crystalline
disks exist with large chemistry differences (Figure 17).
The results indicate that calcium fluoride can be easily precipitated in the TRIP sample
disks, and that glass formation in this composition range is doubtful. Thus it is difficult to
achieve a full glassy phase in the solid TRIP mold flux layer close to the copper mold
leading to a crystallized flux forming from the liquid flux in the mold. This behavior is
quite different to other mold fluxes commonly used in continuous casting where
crystallization occurs after glass formation. Thus, this family of fluxes should not exhibit
the transient radiation based heat transfer behavior that is seen with more conventional
flux chemistries.
The second precipitated crystal chemistry in TRIP mold fluxes (after the precipitation of
Calcium Fluoride) changes with an increase of the alumina content in the spent mold
flux. This second crystallized phase in the base mold flux is Ca(Mn,Fe)Si2O6 (Bustamite,
Ferroan), when the alumina content is around 3.66 weight percentage. However, it
transforms into NaCaAlSi2O7 when the alumina content goes up to 28.6% in the spent
mold flux. Therefore, the addition of alumina into the spent mold flux induces a
transformation of the crystallized phase, which may cause the flux film to rupture during
casting and detach from the mold or cause other transient effects.

139
Finally, very fine alumina crystals could be clearly seen in the SEM photos of the spent
mold flux. The precipitation of fine alumina crystals in the spent mold flux is due to the
pick up of the alumina content in the spent mold flux. These precipitated alumina crystals
will greatly increase the viscosity of the flux, and will exacerbate any mold sticking
problems during continuous casting of these grades.
The solidification path of these fluxes is very complicated. First calcium fluoride
precipitates, followed by a complex oxide followed by alumina when the alumina content
is high. It is of no surprise that these fluxes may cause casting difficulties-they are not
chemically stable, are reactive, are poor glass formers and precipitate numerous small
crystals which when combined with the increased alumina content will lead to a very
viscous and sticky flux layer against the mold wall. The presence of such a layer will lead
to local “hot spots” and shell sticking, as is observed.
4. Conclusion:
In the casting of high aluminum containing grades, the mold flux chemistry that is
attained in the mold can be significantly different from that of the original flux chemistry.
Recent developments, aimed at developing an in-mold flux chemistry that is compatible
with sequence casting for high aluminum steels, have lead to the development of fluxes
with quite different properties that normally used in continuous casting.
These fluxes (1) partially crystallize on cooling; (2) do not form glasses; (3) have a
primary solidification phase that is calcium fluoride; (4) further crystallize with holding
time and (5) successfully block radiation heat transfer.

140
5. Acknowledgement
Funding from Center of Iron and Steelmaking Research and the Department of Energy
and the American Iron and Steel Institute is greatly appreciated.
6. References:
1. 1. H.C. Chen, H. Era, M.Shimizu. Metall. Trans. A, 1989, Vol. 20A, pp. 437 2. W.C. Jeong, D.K. Matlock, G. Krauss. Materials Science and Engineering A, 1993, Vol. 165,
pp. 9 3. O. Matsumura, Y. Sakuma, H. Takechi. ISIJ, 1992, Vol.32, pp. 1014 4. T. L. Baum, R. J. Fruehan and S. Sridhar. Metall. Trans. B, 2007, Vol. 38, pp. 287 5. A. B. Badri, and A. W. Cramb, “Heat Flux Calculations From Thermocouples – What Can Be
Measured?” 85th Steelmaking Conference Proceedings, ISS-AIME, 2002, pp. 65-76. 6. A. B. Badri, and A. W. Cramb, “Measurement of Oscillating Temperatures Using Subsurface
Thermocouples” 60th Electric Furnace Steelmaking Conference Proceedings, ISS-AIME, 2002. pp.412
7. A. B. Badri, and A. W. Cramb, “Thermocouples – What temperature are they measuring?” 2001 ISS Electric Furnace Conference Proceedings, 2001, pp. 661-670.
8. Wanlin Wang, Alan Cramb. “Model of Radiative Heat Transfer in Solid Mold Flux Phase during Continuous Casting” Proc. of Automation & Control/Advanced Online Metallurgical Models/Sensors MS&T 2005, pp 33-44, 2005
9. Wanlin Wang, Alan Cramb. “The Effect of Mold Flux Crystallization on Radiative Heat Transfer Rates” TMS letters, 2005, Vol.2. pp. 115.
10. Wanlin Wang, Alan Cramb. “The Observation of Mold Flux Crystallization on Radiative Heat Transfer”, ISIJ, 2005, Vol. 45, pp.1864-1870
11. J. Cho, H. Shibata, M. Suzuki. ISIJ international, 1998, Vol. 38, pp. 268 12. M. Susa, K. Nagata, K.C. Mills. Ironmaking and steelmaking, 1993, Vol. 20, pp. 372

141
Appendix 2: A Study of a Solid Mold Flux and Its Effect on Radiative Heat Transfer in Continuous
Casting
Wanlin Wang1, Alan W Cramb2 1 Research Scientist
Reckitt Benckiser North America Innovation Center 1 Philips parkway
Montvale, NJ, 07645 [email protected]
2Dean of engineering John A Clark and Edward T Cross professor
Rensselaer Polytechnic Institute Troy, NY, 12180 [email protected]
Abstract
A significant amount of research has been carried out to investigate the role of a mold
flux in the moderation of the heat flux from the strand to copper mold in continuous
casting. However, most studies were were not able to separate the contribution of
radiative component of heat transfer from the conductive component. By using an
infrared radiation emitter, a radiative heat flux was applied to a copper mold, covered
with solid slag disk, to simulate the radiation heat transfer phenomena in continuous
casting. The solid slag disk could either be glass or a mixture of glass and precipitated
crystals. It was discovered that the transferred heat flux through mold flux strongly
depends upon the surface properties of the mold and the slag. Crystallization of a slag
disk reduced the overall heat transfer rate by 20%, when compared to a completely glassy
sample.
Key words: Radiative heat transfer; Continuous casting; Adsorption and extinction
Coefficient; Crystallization; Crystal Growth
1. Introduction
Many studies have been carried out to investigate the solidification of steel by mold heat
transfer measurements [1-5] due to the strong influence of the heat transfer rate in the mold on
the surface quality of cast slabs. A mold slag plays an important role in continuous casting as it

142
allows lubrication, adsorption of inclusions and moderation of heat transfer. It has been
recognized that the slag film formed between the strand and mold may contain up to three
layers: a glassy zone close to the mold, a precipitated crystalline layer in the center and a
molten film in contact with the steel strand, where each layer provides different thermal
resistance to the heat transfer [6-8]. Depending upon the position in the mold and the time of
casting these three layers can vary greatly. For example, in the meniscus area there can be only
a liquid layer connected to a glass later against the mold wall and at the end of the mold, after
significant casting time there can be no liquid layer and almost 100% crystallinity in the film.
The fraction of the crystalline and glassy phases has, however, been reported to control the
heat transfer rate in the mold [9, 10].
The proportion of the radiative heat transfer rate in the total heat transfer across the mold flux
film has been quoted in the literature as 20-50% depending on the thickness of molten layer
[11, 12]. This study will determine the effect of solid mold flux films and its crystallization
behavior, on the radiation heat transfer rate during continuous casting.
The double hot thermocouple techniques (DHTT) [13,14] has been developed to allow the in
situ observation of mold slag crystallization under defined thermal conditions, such that the
kinetics of crystal growth could be measured. This technique was used to determine the
crystallization behavior of the slags studied in this study. The research of this paper was
conducted in the following manner: (1) application of infrared radiation onto a copper mold
covered with a thin layer of mold flux with different degrees of crystallization (15-17); (2)
evaluation of the effect on the mold of thermal radiation by analyzing the response of
subsurface mold temperatures and calculation of in-mold heat fluxes; and, (3) evaluation of the
effect of crystallization of mold flux on the heat transfer rate in the mold.

143
2. Experimental Procedures
2.1 Infrared emitter
A schematic of the experimental apparatus of infrared emitter is shown in Figure 1 and was
initially developed by Adam Badri ( xx). The equipment used in these experiments includes: a
power controller, a high-heat flux infrared radiant heater with a heating unit, a data acquisition
system and a command-and-controlled unit. It was decided that an infrared radiation system
was needed to produce the levels of fast response of thermal flux seen in the caster (1 MW/m2)
(Badri reference). These lamps are vacuum-sealed tungsten-alloy filaments, which are
manufactured by General Electric; capable of emitting 1.0 MW/m2 at 44% above rated
voltage.
Data acquisition / command-and-control
computer
PowerController
V
I
Coolingair in
Coolingair out
Water-cooled reflector
Coolingwater out
Coolingwater in
Power cables
Thermocouple output
Voltage and current feedback
Commandsignal
Infrared Radiation
Figure1. Experimental apparatus of the infrared emitter.
When a voltage is applied to the heating elements, the elements begin to emit infrared
radiation. The intensity level of this radiation can be controlled precisely by changing the
voltage applied across the elements. To focus all of this radiation onto a sample plane, a quasi-
parabolic reflector is mounted behind the elements. By using a silicon-controlled rectifier
(SCR) based power controller, the voltage across the lamps can be manipulated between 0 and
208 V, and thus the resulting output flux of the lamps can be varied from 0 to 1.0 MW/m2. In

144
order to be able to generate heat fluxes using specified mathematical functions, the power
controller is connected to a data acquisition and control board, which is in turn connected to a
computer. Thus, any arbitrary signal generated by the computer can be sent in real time to the
power controller, and translated into an output heat flux by the heating elements.
The infrared emitter is equipped with monitoring systems to ensure that the emitter operates
safely and properly. This instrumentation includes monitoring the inlet cooling air pressure,
inlet water pressure to the sample and reflector, and the flowrate of cooling water. In addition,
the inlet and outlet cooling water temperatures for the sample and reflector are also monitored.
The copper mold is simulated by a one-end water cooled copper cylinder.
2.2 Double Hot Thermal Couple Technology The schematic figure of DHTT used for the measurement of crystallization kinetics is
shown in Figure 2. It includes: a quartz reaction tube, the hot thermocouple controller for
each thermocouple, an observation system consisting of a microscope and a Sony digital
camcorder, and a data acquisition computer system.
Figure 2. Schematic figure of DHTT In the DHTT, a sample with the size of 2-5 mm is placed between two thermocouples,
and its temperature was measured and controlled continuously and independently
through the data acquisition system, which has a two channel D/A (digital –analog: 0-5
Hot Thermocouple Driver
Data Acquisition Computer system
Power
Digital Camcorder
Microscope
Power Control
B type T.C.
Temperature measurement

145
DC volt) converter to control the hot thermocouples. An optical microscope, connected
with digital camcorder, is located above the sample to observe the crystallization
phenomenon of sample. The image is sent to the camcorder through the connected
microscope, and the video signal with the information of experimental time is recorded in
the tape. The computer with image capturing and analysis software (NIH Image 162)
allows a more detailed analysis of the crystallization phenomena. High heating and
cooling rates can be easily obtained due to the low thermal inertia of the system, which is
very useful for the determination of TTT diagrams, where a fast initial cooling rate is
required.
The mold flux used in this study was an industrial mold slag used in the continuous casting for
ultra-low carbon steels, and its main chemical composition is listed in Table I.
Table I: Composition of mold flux (major components)
Chemical composition (mass %)
SiO2 CaO MgO Al2O3 Na2O F C
Basicity
CaO/SiO2
35 37.7 1.3 2.6 10.8 8 5.3 1.077
3. Results and Discussion
3.1 Mechanism of Radiative Heat Transfer in Solid Mold Flux
In order to explore the mechanism of radiative heat transfer across a solid mold flux to the
copper mold, the top surface of copper mold was modified by adding different materials to
change its heat reflectivity and absorbance. Figure 3 gives one example of responding
thermocouples’ temperature history, when a constant 2000 W thermal radiation was applied to
a copper mold coated with graphite. The responding temperatures at 2, 5, 10, 15 mm below the

146
hot surface of copper mold were recorded as T1, T2, T3, T4, and the cooling water inlet, outlet
temperatures were presented as Tin and Tout as shown below.
20
30
40
50
60
70
80
90
100
0 500 1000 1500Time S
Resp
ondi
ng T
empe
ratu
re 0 C
Figure 3.The responding temperatures history for the copper mold coated with graphite
The system reaches steady state in a very short time (200-300 seconds) as shown in the above
figure, and the measured heat flux traveling through copper mold at steady state in 1
dimension was calculated by Fourier’s First Law, where,q"= − k( dTdx
)ii∑ , q” here refers heat
flux, , i is the index number, k is the thermal conductivity, and (dT/dx)i is the temperature
gradient. A series of experiments were conducted, and the responding temperatures 2 mm
below hot surface, at steady state, for different surface coated systems was plotted versus
applied heat fluxes in Figure 4a. The corresponding measured heat fluxes histories for each
system are given in Figure 4b, when constant 510 KW/m2 level of incident radiation was
applied.
T1 T2
T3
T4
Tout
Tin

147
40
50
60
70
80
90
100
110
120
130
140
0 200 400 600 800 1000Applied Heat Flux KW/ m2
Res
pond
ing
Tem
peat
ure
oC
bare alumina powder
C coating0.66 mm glassy disc0.45 mm crystalline disc
0.75 mm crystalline disc0.95mm crystalline disc
0
50000
100000
150000
200000
250000
300000
350000
0 500 1000 1500 2000Time S
Mea
sure
d H
eat
Flux
W/m
2
barealumina powderC coating0.95 crystalline disc0.66 mm glassy disc
Figure 4 (a). Responding temperatures versus applied heat fluxes and
(b). Measured heat flux going through copper mold for varied top surface There are five temperatures and measured heat fluxes trends in Figure 4, corresponding to
each system: (1) a bare copper surface; (2) a copper mold with an alumina surface; (3) a
copper mold with a black graphite surface; (4) a copper mold with solid slag (crystalline) disk;
and, (5) a copper mold with solid glassy disk. It is clear that all the results are a strong function
of the top surface condition of the mold. The reason for this may be due to the different heat
absorbances of top surface, such that the responding subsurface temperatures and heat fluxes
vary when the top surface of the copper mold changes. The bare copper surface or that coated
with alumina powder has weakest ability to transfer heat, and the responding temperatures and
the measured heat fluxes passing through copper mold are lowest when compared with others.
Systems with solid mold slag disks placed on a mold can better absorb incident energy than
the bare mold and lead to a higher measured heat flux [18-20]. The absorption behavior of
these materials is mainly due to interaction between photons and excitation of lattice
vibrations (phonons). Therefore, the energy absorbed by disks will heat the samples and lead
to increased conduction to the copper mold. The presence of a slag disk actually increases the
energy transferred into the mold, when compared to bare copper mold.

148
If the copper mold was coated with graphite, which has excellent heat conductivity and a high
absorbance capability due to its black surface, much more of the incident radiant energy was
conducted to mold, such that the T1 temperatures and the measured heat flux in this system are
highest. All of above results suggest the top surface optical property of copper mold has a
large influence on the heat transfer rate through metal mold in continuous casting when the
heat transfer rate is dominated by radiation.
3.2 Effect of Mixture Phase on Radiative Heat Transfer Rate
It was previously recognized that the glass phase mold flux has a better heat transfer
ability than that of fully crystalline phase mold flux [21].As the glass disk is heated
cruystallization occurs and a mixture of phases appears in the solid mold flux. The effect
of this mixture of phases within the solid mold flux and its impact on the radiation heat
transfer rate, are important considerations when one attempts to understand the heat
transfer rate within the mold of a continuous caster.
The slag disks were annealed at high temperature for different times to achieve varied
degrees of crystallization. These disks were then placed on top of the copper mold, and
subjected to constant radiation. Subsurface responding temperatures during the
experiments were measured to determine the heat flux that passed through copper mold.
Once steady state was reached the heat fluxes were constant, as the in-disk temperatures
at low heat fluxes are not high enough to lead to significant coarsening of the partially
crystallized structures. Thus the effect of crystallization can be unambiguously measured
in this type of experiment.

149
0.66 mm glassy slag disks with the same thickness were crystallized at 900oC for
different times to achieve varied crystalline fractions until 100% crystallization was
achieved. The x-ray pattern of the fully crystallized sample was identified as: Cuspidine
(Ca4Si2O7F2 or 3CaO.2SiO2.CaF2). All these samples were then subjected to the same
constant 510 KW/m2 heat flux, and their responding heat fluxes histories are given in
Figure 5.
100000
120000
140000
160000
180000
200000
220000
240000
260000
280000
0 1000 2000 3000 4000Time S
Mea
sure
d H
eat
Flux
W/m
2
1: The fully glassy sample, 2: annealed at 900oC for 93 seconds, 3: annealed at 900 0C for 118 seconds, 4 annealed for 155 seconds, 5 (for 400 seconds) fully crystalline sample
Figure 5: The measured heat flux histories for partially crystallized slag discs
Since longer annealing time leads to a larger fraction of crystalline phase in the sample,
the absorbed energy by the specimen attenuates as the top surface of specimen loses its
transparency and more radiation is scattered, such that the heat flux transferred to copper
mold is reduced until the level of a fully crystalline sample as shown in Figure 5. The
heat flux passing through copper mold was around 260 KW/m2 for the system with the
glass disk, and reduced to around 200 KW/m2 when the glass sample was totally
1
2 3
4 5

150
crystallized. This shows the effect of full crystallization was to reduce radiative heat
transfer rate by 23%. Two SEM photos of the glass and crystallized disk are presented in
Figure 6, where the fully amorphous structure of sample 1 (glass disk) was completely
crystallized after it was annealed at 900 0C for more than 500 seconds, and the equiaxed
forms of the crystals of sample 5 are clearly seen in Figure 6 (b).
(b) (b)
Figure 6. Two SEM figures for samples1 (a) and 5 (b).
3.3 Kinetics of Slag Disk Crystallization
Experiments were conducted by using DHTT to observe the slag crystallization phenomena.
The temperature profile is shown in Figure 7, and all the temperatures were controlled by
decreasing or increasing electric current.
The sample (8 mg) of the mold powder was melted on the tips of two thermocouples, then
continuously heated to 15000C for 4-5 minutes to eliminate the bubbles and homogenize its

151
composition. After that, the sample was rapidly cooled to room temperature for 20 minutes to
achieve a pure glassy phase. Finally, the specimen was annealed at 900 0C. The video of this
procedure was recorded by the digital camcorder; as well the temperature-time data was stored
by the computer
Figure 7. Thermal Cycle of experiment
The computer with image capturing and analyzing software (NIH Image 162) allows a series
of figures to be recorded to show the procedure of crystallization. Figure 8 shows some figures
of slag crystallization when it was annealing at 900 0C for different times.
Tem
perature
Time
4-5 min at 1500 0C
Quenching (~85 0C)
Annealing at 900 0C
Cooling at 25oC for 20 minutes

152
Figure 8. Crystallization Behavior of mold slag at 900 0C Since the method of using single crystal volume evolution and using the all crystal volume
fraction in the whole sample to measure the crystal growth rate has been reported to be equal
[16], image analyses were performed to evaluate the volume fraction of crystals in the whole
sample evolved as a function of time to obtain the rate of crystal growth. The Avrami equation
was adapted to describe the kinetics of crystallization in this case.
))(exp(1 nktX −−= (1)
in which X is the crystals fraction, k stands for the coefficient corresponding to the nucleation
and growth mechanism, t means time and n is a time exponent. Therefore, the values for n and
k could be determined according to the following equation by rearranging equation 1 into
equation 2.
nLntnLnkX
LnLn +=−
)1
1(( (2)
With the measured crystals volume fraction data for different annealing time, a plot of
Ln(Ln(1/(1-X)) versus Ln t gives the values of n which is around 3.

153
y = 2.973x - 11.599
- 3.5
- 3
- 2.5
- 2
- 1.5
- 1
- 0.5
0
2 2.5 3 3.5 4Ln Time (S)
Ln (
Ln(1
/(1-
X))
Figure 9. The relation of crystals volume fraction evolution with function of time
Finally the Johnson –Mehl -Avrami is simplified as equation 3 in this case.
)*))((exp(1 3ttkX −−−= (3)
Thus n equal to 3 means that the phase transition is at a constant growth rate with a varying
nucleation rate due to the decrease of nucleation sites with the processing of crystallization.
The comparison of calculated and observed crystal growth rate at 900 0C and 950 0C is in good
agreement. When the crystal fraction reached 70%, the results deviated because of the
assumption of constant growth rate, which is reduced due to the fraction of surface area
available for growth sites, f, that is decreased with the process of phase transition.

154
0
0.1
0.2
0.3
0.4
0.5
0.6
0.7
0.8
0.9
1
0 50 100 150 200
Time S
Cry
stal
line
frac
tion
X
Figure 10. Comparison of crystal fraction versus time between calculation and observation
The crystallization kinetics equation at 900 0C for the slag powder could be obtained with
the measured crystal growth rate as shown by equation 4.
)))41(0127.0(exp(1 3−−−= tX (4)
With this kinetic model, the crystal fractions can be calculated from the mixed phase slag
disks, crystallized at 900 0C for different times. Thus, the measured heat flux passing
through copper mold versus crystal fraction is plotted in the Figure 11. It could be found
that the heat flux transferred to the copper mold decreases with the addition of crystalline
phase. The reason for the reduction of heat flux with increase of crystalline fraction is
because more incident radiation is reflected and scattered from the crystals surface, phase
boundaries, and defects, such that less energy would be absorbed and conducted to mold.
X= 1-exp(-(k(t-t*))3) K=0.0273 t* =15s
X=1-exp(-(k(t-t*))3) K=0.0127 t* = 41S
9000C 950 0C

155
Figure 11. The relation between crystalline fraction and measured heat flux
The model developed in previous studies [20, 22] describing the mechanism of radiative
heat transfer across solid mold flux through the copper mold and was employed to
quantify the effect of crystallization on radiative heat transfer rate as shown in equation 5.
Therefore, the measured heat flux for a partially crystallized slag disc could be
determined according to equation 5 by assuming there is no interaction between the parts
of crystalline, X, and 1-X glassy phase.
)]}1
(1)[1()]1
(1[{2
.
2
.glassymold
glassymoldglassy
crymold
crymoldcryo R
RX
RR
XIIρ
τρ
ρτ
ρ−
+−−+−
+−= (5)
in which I is the transferred heat flux, I0 means the incident thermal flux, ρcry, ρglassy, τcry,
τglassy are the light reflectance and transmittance for crystalline and glassy phases
respectively, and Rmold stands for the reflectance of the mold. If crystal fraction, X, is
150
170
190
210
230
250
270
290
0 0.25 0.6 0.95 1
Crystal fraction
Measured heat flux kW
/m2

156
replaced by crystallization kinetics equation, the equation 5 could be rearranged into 6,
which describes the measured heat flux behavior as it varies with crystallization time. A
plot of the comparison between the measured value and predicted results are shown in
Figure 12.
)]}1
(1)[))41((exp()]1
(1)][))41((exp(1{[2
32
30
glassymold
glassymoldglassy
crymold
crymoldcry R
Rtk
RR
tkIIρ
τρ
ρτ
ρ−
+−−−+−
+−−−−= (6)
100
120
140
160
180
200
220
240
260
0 100 200 300 400 500Annealing Time S
Mea
sure
d H
eat
Flux
kW
/m2
The values used for the model are: I0 equals 510KW/m2; k is 0.0127; ρcry, ρglassy, τcry, and τglassy are 0.598, 0.103, 4500 m-1 and 400 m-1 respectively; Rmold is 0.8 [21]
Figure 12. The relationship between annealing time and measured heat flux
The heat flux passing through mold attenuates exponentially with the increase of
crystallization time, till the full crystallization of the slag sample. With longer
crystallization time, there will be more fraction crystallized, leading to less heat absorbed,
until the whole sample is totally crystallized.
I= Io [exp(-(kt)3)Iglass + (1- exp(-(kt)3) Icry.)

157
The glass phase has an amorphous structure that results in a very small absorption
coefficient of 400 m-1; however, the crystalline phase has a larger extinction coefficient
that is 4500 m-1. Therefore, a large quantity of the thermal radiation will be scattered at
the grain boundaries, defects and surfaces in crystalline samples leading to a decrease in
efficiency in energy transfer. The other contribution of the radiation inhibition of
crystalline flux is its opaque top surface, whose reflectance is larger than glass. Thus
there will be more incident radiation reflected for the crystalline sample disk. It is of
interest that the crystalline disks display little effect of thickness on radiation heat transfer
rate due to its huge extinction coefficient, a fact that will help moderate local heat transfer
fluctuations due to cast surface irregularities when results are compared to fully glassy
samples. This effect probably accounts for the success of fully crystallized mold slags in
the casting of peritectic steel grades where cast surface wrinkling is observed.
Conclusions
The radiative heat flux passing through a metal mold depends upon its top surface conditions,
and one can increase the heat transfer rate by choosing an appropriate coating or covering.
When a slag disk is placed on a water-cooled copper mold under thermal radiation, it tends to
enhance the responding heat transfer rate passing through the system. The effect of
crystallization of the solid mold flux on the radiative heat transfer rate in continuous casting is
to inhibit the overall heat flux. The maximum reduction in heat transfer rate was 23% for a
fully crystallized sample in this study. The absorbed heat conducted to mold is reduced with
increased crystalline volume fraction.

158
Acknowledgement This research is funded by the Center for Iron and Steelmaking Research membership companies. References: 13. J. Savage, and W. H. Pritchard, “The problem of rupture of the billet in the continuous casting of
steel”, Journal of the Iron and Steel Institute, Nov. 1954 pp. 269-531. 14. S.N. Singh, and K.E. Blazek, “Heat transfer and solidification kinetics in meniscus zone during
casting” Metals Technology, Oct. 1974, pp. 17-27. 15. H. Tomono, P. Ackermann, W. Kurz, and W. Heinemann, “Elements of surface mark formation in
continuous casting of steel” Proceedings of the International Conference on Solidification Technology in Foundry and Cast House, The Metals Society, Warwick, 1980, pp. 524-531.
16. H. Tomono, W. Kurz, and W. Heinemann, “The liquid steel meniscus in molds and its relevance to the surface quality of castings”, Metallurgical transactions B, Vol. 12B, 1981, pp. 409-411.
17. I. Saucedo, J. Beech and G. J. Davies, “Heat transfer and solidification kinetics in meniscus zone during casting” Metals Technology Vol. 9, 1982, pp282-291.
18. R.B. Mahapatra, J. K. Brimacombe, I.V. Samarasekera, N. Walker, and J. D. Young, “Mold behavior and its influence on quality in the continuous casting of steel slabs: Part I. Industrial trials, mold temperature measurements, and mathematical modeling” Metallurgical Transactions B, Vol.21, 1990, pp.861-874.
19. K.C. Mills et al., “Effect of casting powder on heat transfer in continuous casting”, Continuous Casting ’85, The Metal Society, London England, 1985, paper 57, pp. 57.1-57.7
20. S. Ohmiya, K.H. Tracke and K. Schwerdtfeger, Iron making Steelmaking, Vol.10, 1983, No. 1, pp24.
21. M. Jenkins, ISS Steelmaking Proceedings, 1995, pp.395. 22. M Susa, K. Mills, M. Richardson and D. Stewart, Ironmaking Steelmaking, Vol. 21, 1994, pp.623. 23. S. Ohmiya, K. H. Tacke and K. Schwerdtfeger, Ironmaking Steelmaking, Vol.10 1983, pp 24. 24. K. Watanabe, M. Suzuki, K. Murakami and T. Shiomi, Tetsu-to-hagane, 83 1997, No. 2, pp115 25. Y. Kashiwaya, C. Cicutti and Alan Cramb, ISIJ Vol.38, 1998, pp.348 26. Y. Kashiwaya, C. Cicutti and Alan Cramb, ISIJ Vol.38,1998, pp.357 27. A. B. Badri, and A. W. Cramb, “Heat Flux Calculations From Thermocouples – What Can Be
Measured?” 85th Steelmaking Conference Proceedings, ISS-AIME 2002, pp. 65-76. 28. A. B. Badri, and A. W. Cramb, “Measurement of Oscillating Temperatures Using Subsurface
Thermocouples” 60th Electric Furnace Steelmaking Conference Proceedings, ISS-AIME, 2002. 29. A. B. Badri, and A. W. Cramb, “Thermocouples – What temperature are they measuring?” 2001
ISS Electric Furnace Conference Proceedings, 2001, pp. 661-670. 30. W. Wang and A. W. Cramb, “Model of Radiative Heat Transfer Phenomena in Solid Mold Flux
Phase during Continuous Casting”, Materials Science & Technology 2005, Pittsburgh, PA. 31. W. Wang and A. W. Cramb, TMS letters, Vol.2. pp. 115, 2005. 32. W. Wang and A. W. Cramb, ISIJ Vol. 45, no.12, p.1864-1870, 2005. 33. W. Wang, Ph.D. thesis, Carnegie Mellon University, Pittsburgh, PA, 2007.

159
Appendix 3:
The Effect of the Transition Metal Oxide Content of a Mold Flux on the Radiation Heat Transfer Rates
Wanlin Wang1, Alan W Cramb2 1 Research Scientist
Reckitt Benckiser North America Innovation Center 1 Philips parkway
Montvale, NJ, 07645 [email protected]
2Dean of engineering John A Clark and Edward T Cross professor
Rensselaer Polytechnic Institute Troy, NY, 12180 [email protected]
ABSTRACT
Heat transfer in the mold of a steel continuous casting machine strongly influences cast
surface quality. Transition metal oxides have been widely used in mold slags in
continuous casting to aid in liquid pool formation and enhance melting rates. Although a
few research studies have been carried out to investigate the thermal properties of mold
slags containing transition metal oxides, very few studies have directly correlated their
effect on radiation heat transfer rate in continuous casting. This study investigated the
radiation heat transfer rates across a mold flux film and determined the influence of the
transition metal oxides, MnO and Fe2O3, on these rates. It was found that additions of
10% MnO or 5% Fe2O3 reduced the radiation heat transfer rate by approximately 25%
and increased the adsorption coefficient from 400 to 1800 m-1.
KEY WORDS: Continuous Casting, Radiative Heat Transfer, Extinction and Absorption
Coefficients, Heat Transfer Rate

160
1. Introduction
Due to the importance of the heat transfer in the continuous casting, a number of studies
of the rate of heat transfer across a mold slag film have been conducted [1-8]; however,
most were focused on either the conduction or overall heat transfer rate. The contribution
of the radiation in the meniscus area to the total heat transfer rate has been estimated in
the literature to range from 20-50% depending upon the thickness of the molten layer [9-
10]. Due to the importance of the radiation heat transfer rate in continuous casting, this
work focused on measurement of the radiation heat transfer rate and its variation with the
addition of transition metal oxides such as iron oxide and manganese oxide.
The amount of radiation transmitted through the mold flux to the mold is determined by
the following thermal properties: the extinction coefficient (β), and the refractive index
(n).
1.1 The Refractive Index
When the light travels through a mold flux layer, it tends to interact with ions present in
the liquid oxide. The refractive index of a slag, n, gauges the magnitude of this
interaction. Therefore, the larger the refractive index, the stronger is the interaction.
Refractive index can be measured with either a refractometer or ellipsometer [11], and
the measured value depends on the slag composition, incident wavelength, and the
surface condition. The refractive index value for glassy mold fluxes at room temperature
ranges from 1.58 to 1.7. It can be calculated by a simple empirical equation [12].

161
∑=−
i
ii
MNn
100)1(
ρ (1)
where n stands for refractive index, ρ is the density (g cm-3) of the slag, and Ni and Mi are
the specific refractive index of the various oxides in the slag, and their mass %
respectively.
Equation 1 was used to estimate refractive index, where the values of Ni given in Table I
[12]. The calculated values for refractive indices for a MnO containing mold flux are
presented as orange triangles, and for the Fe2O3 containing samples as green dots, in
Figure 1. There is a linear increase of refractive index with the addition of transition
metal oxides according to equation 1. These calculations are in good agreement with the
results of Susa et al [13], (blue squares in Figure 1) who measured the refractive index, n,
of Fe2O3-SiO2-CaO-Al2O3 slags as a function of the Fe2O3. Thus these calculations
indicate that the addition of FeO should be more effective than in MnO in retarding
radiation heat transfer rates.
1.2 Extinction and Adsorption Coefficients
When there is an incident light applied to a mold flux sample, some portion is reflected;
the rest is either absorbed or transmitted. The transmitted portion of the light,
transmittance, follows an exponential decay relationship with thickness which is
represented by Beer’s law and is given in equation 2,
)exp( dβτ −= (2)

162
where τ is the transmittance, β is extinction coefficient and d is thickness. The extinction
coefficient, β, is composed by two parts, i.e., σαβ += where α stands for the absorption
coefficient, and σ presents the scattering factor. As the scattering factor in a glassy phase
is small due to its amorphous structure, the extinction coefficient for solid glass flux
usually is expressed as its absorption coefficient α. The extinction coefficient for a
crystallized slag can very between 1000 and 30,000 m-1 and from 100 to 1000 m-1 for a
glassy slag [14].
The extinction (absorption) coefficients of a slag are known to be significantly dependent
upon the concentrations of transition metal oxides present in the slag. Some research has
been carried out to investigate the absorption coefficients and refractive indices of
synthetic glassy slags containing transition metal oxides by Susa, et al [11, 13]. The
absorption coefficient variation with the addition of transition metal oxides has not been
however directly correlated to radiative heat transfer rate.
The research described in this paper was carried out in the following manner [15]: (1)
infrared radiation was applied to a water cooled copper mold covered with a thin disk of
pre-melted and solidified mold flux, which contained varying amounts of the transition
metal oxides, Fe2O3 and MnO; and (2) The effect of these transition metal oxides on
radiative heat transfer rates was determined by analyzing the in-mold heat transfer rate.

163
2. Experimental Apparatus and Procedures
2.1 Infrared Emitter
A schematic of the experimental apparatus of infrared emitter developed by Adam Badri
at Carnegie Mellon University [16-18] is shown in Figure 2. The equipment used in these
experiments includes: a power controller, a high-heat flux infrared radiant heater with a
heating unit, a data acquisition system and a command-and-controlled unit. It was
decided that an infrared radiation system was needed to produce the levels of thermal flux
seen in a continuous caster (1 MW/m2). These lamps are vacuum-sealed tungsten-alloy
filaments, which are manufactured by General Electric and are capable of emitting 1.0
MW/m2 at 44% above its rated voltage.
When a voltage is applied to the heating elements, the elements begin to emit infrared
radiation. The intensity level of this radiation can be controlled precisely by changing the
voltage applied across the elements. To focus all of this radiation onto a sample plane, a
quasi-parabolic reflector is mounted behind the elements. By using a silicon-controlled
rectifier (SCR) based power controller, the voltage across the lamps can be manipulated
between 0 and 208 V, and thus the resulting output flux of the lamps can be varied from 0
to 1.0 MW/m2. In order to be able to generate heat fluxes using specified mathematical
functions, the power controller is connected to a data acquisition and control board,
which is in turn connected to a computer. Thus, any arbitrary signal generated by the
computer can be sent in real time to the power controller, and translated into an output
heat flux by the heating elements.

164
The infrared emitter is equipped with monitoring systems to ensure that the emitter
operates safely and properly. This instrumentation includes monitoring the inlet cooling
air pressure, inlet water pressure to the sample and reflector, and the flow-rate of cooling
water. In addition, the inlet and outlet cooling water temperatures for the sample and
reflector are also monitored. The copper mold is simulated by a one-end water cooled
copper cylinder, which acts as the radiation target, and the schematic figure is shown
schematically in Figure 3. As the heat flux (infrared radiation) is applied on the top
surface of the copper mold, which is covered with a mold flux film, the response
temperatures could be measured using the sub-surface thermocouples.
All experiments were carried out under conditions where the disk did not crystallize or
significantly change during the experiment. In this manner the effect of chemistry could
be clearly distinguished from other affects (crystallization or melting, for example) which
can occur at high energy inputs and subsequent increased disk temperatures.
2.2 The Fabrication of Mold Flux Disks
To prepare the mold flux for the use as in the experiment, the mold flux was fabricated
into a disk. The original slag powders were first pre-fused by placing them into a
programmable furnace. Then, they were melted in an alumina crucible which was placed
inside a graphite crucible (Figure 4). When depleted of free graphite after the process of
decarburization, the slag was melted, and then held at a higher temperature (around 1500
Celsius) for 5 minutes to homogenize its composition. Subsequently, it was quenched
from its molten state on a stainless steel plate (at room temperature). A new cylindrical
tube-like copper mold with the same size as the copper substrate in the experiment was

165
used to cast the molten mold flux, before it solidified on a stainless steel plate. In this
manner, a thin glassy mold flux disk was produced.
The initial mold flux used in these experiments was an industrial flux for casting of ultra-
low carbon steel (LC) and its chemical composition is listed in Table II. The mold slag
samples were prepared as thin disks with the same diameter as the copper substrates that
they were placed upon. Various amounts of manganese oxide (MnO) were fused with the
matrix mold flux to obtain the different manganese oxide compositions within a range
from 0 to 10 weight percentage. The major components are listed in Table III below.
Subsequently, various amounts of iron oxide (Fe2O3) were fused with the mold flux to
obtain different compositions within a range from 0 to 5 percent of iron oxide. The major
components are listed in Table IV below.
The mold flux disks were then placed on the surface of the copper substrates individually.
During the radiation experiments, the infrared radiation would impinge on the mold flux
disk and be transmitted through the disk and into the copper substrate.
3.1 Results and Discussion
Figure 5 shows a series of glassy slag disks containing differing amounts of MnO. The
color of the sample changes from transparent to green, to brown, and finally to black as
the MnO concentration increases from 0%, to 2%, to 5%, and then to 10%. As the
original color of pure MnO is green, the disks exhibit a green color with small additions
of MnO (1% to 2%). When the MnO concentration increases (greater than 2%), a brown
color becomes apparent in the solidified disk (3%). The brown areas increase until the
disk reaches a 5% MnO concentration where the disks appear fully brown. It should be

166
noted that these color changes are indicative of precipitation or phase separation during
cooling of the disks. The samples became black as a 10% MnO concentration level was
reached. Again within the predominant black color, small grey areas can be seen that are
indicative of precipitation or phase separation during cooling. Thus, the addition of
MnO leads to a loss of transparency in the solidified disk due to both chemical effects
and the precipitation of second phases within the sample.
In order to gauge the effect of MnO on radiative heat transfer rate, samples with the same
thickness of 1.8 mm (Figure 5) and one crystalline disk were individually placed on top
of the copper mold, and were subjected to the same constant 500 KW/m2 of thermal
radiation. The measured responding in-mold heat fluxes in each case are shown in Figure
6.
There was one experiment in which the disk was made to stick on top of the copper mold
during the casting process. The result of this experiment was used to observe the effect of
the interface contact between the mold flux and the copper mold. The results shown in
Figure 6 prove that the interface contact between the mold flux and the copper mold does
not have a significant impact on the measured heat flux (compare 0% MnO to 0% MnO
disk sticking on copper mold), and it can be assumed that the interface resistance of the
mold flux is constant in this study.
All of the heat fluxes passing through the system come to steady state within several
hundred seconds, and there is little evidence of significant phase transformation during
the heating due to the low level of impinging thermal radiation. Generally it could be
observed that the heat transferred to copper mold reduces with the increase of manganese

167
oxide, but it is still higher than the crystalline disk sample. In the case of no addition of
the MnO, the heat flux is around 290 KW/m2, once the system comes into steady state.
However, it decreases to 215 KW/m2 when MnO amount is increased to 10%. This
results in a 25% decrease in the radiation heat transfer rate when MnO is added to the
slag. Figure 7 gives the decrease in radiation heat transfer rate as the percentage of MnO
increases. The addition of MnO thus retards the radiation heat transfer rate.
In order to investigate the effect of another transition metal oxide, Fe2O3, on the radiative
heat transfer rate, a similar experimental procedure was repeated. Figure 8 shows a series
of glass mold flux disks with varying amount of Fe2O3, whose major components are
listed in Table III. Similar to that of the MnO disks, the color of each Fe2O3 disk
becomes darker with the increasing Fe2O3 concentration until it is fully dark at a 5%
Fe2O3 concentration.
Again, all the disks in Figure 8 (with different amounts of iron oxide) were tested and
subjected to the same thermal radiation. Figure 9 shows the calculated responding heat
fluxes for each Fe2O3 containing glass disk. The system reaches steady state quickly
(within several hundred seconds).
The heat transfer rate is around 290 KW/m2 for the system without iron oxides, and it
reduces to 210 KW/m2 when the concentration of Fe2O3 goes up to 5%, a 27% reduction
in the heat transfer rate as shown in Figure 7. For the 10% MnO and 5% Fe2O3 disk
samples, both of them exhibit a black color and their measured responding heat transfer
rates were similar, around 210 KW/m2. As predicted from the refractive index (Figure 1)

168
the Fe2O3 containing disks are more effective than the MnO containing disks, in reducing
the radiation heat transfer rate.
3.2 Structural Issues of Glass Mold Flux Disks
It was observed that the glass disk lost its transparency with the addition of either MnO or
Fe2O3 as shown in Figures 5 and 8. The disk with 10% percentage (mass) of MnO was
scanned by X-ray to determine whether there was significant crystallization that occurred
during the making of glass disks. A scanned X-ray pattern shown in Figure 10 confirms
that there is no significant crystallization in this sample as indicated by the full
amorphous curve. Therefore, the effect on the radiation heat transfer rate is not due to
slag crystallization during fabrication.
The disks were placed into a magnetic field to measure their magnetic moment to check
the internal transition metal ion content.
From their magnetic moment curves as shown in Figure 11, the maximum values for each
disk’s magnetic moment is improved with the addition of MnO into the slag disks.
Because the maximum of magnetic moment is proportional to the transition metal ion
concentration, the internal manganese ions content increases with the addition of
manganese oxides. Thus the X-ray and magnetic moment data suggest the predominant
structure is glassy for all the disks, and the darkening of these disks may be due to the
increased transition metal ions content in the disk.
As the extinction coefficient, β, gauges the ability of a glass disk absorb heat, this
property was investigated with the addition of transition metal oxides. The disks
containing 10% MnO with different thickness from 0.52 mm to 2.08 mm were placed

169
onto a copper mold under 500 KW/m2 thermal radiation, and their responding thermal
fluxes are shown in following Figure 12.
The measured heat flux at steady state increased continuously from 200 KW/m2 to 222
KW/m2 when the thickness of disk is added from 0.52 mm to 2.1 mm. The thicker the
disk, the more heat the disk will absorb. Thus, increased thickness promotes a larger
transferred heat flux, which is consistent with previous studies [19-22]. However, the 1.5
mm thickness difference, for this 10% MnO disk, only induces a 20 KW/m2 heat transfer
variation (from 200 KW/m2 to 220 KW/m2 according to Figure 12), which is a minor
effect when compared to the results with the initial glass disks (Figure13), where a 0.5
mm thickness difference causes a 60 KW/m2 heat variation (from 235 KW/m2 to 295
KW/m2).
The measured absorption coefficient for the 10% MnO and matrix glass disks were
determined to be 1800 m-1 and 400 m-1 respectively, based upon the radiative heat
transfer model developed in our previous paper [20]. All the calculated absorption
coefficients were plotted versus the amount of MnO and Fe2O3 in Figure 14. There is an
increase of absorption coefficient with the additions of transient metal oxides, which is
consistent with other researchers’ results [13] that there is linear increase for the
absorption coefficient with the addition of transition metal oxides. Therefore, there will
be less energy to be transmitted through the disk, according to Beers’ law, as shown in
equation 2.

170
3.3 Heating transfer modeling
The total heat flux from the strand passing through mold flux to copper mold is assumed
to consist of two parts, i.e., the radiative and the conductive heat flux. Consequently, the
effective thermal conductivity Keff represents the total heat transfer rate as the sum of
thermal conductivity, Kcond, and radiation part of the heat flux written as a thermal
conductivity, Krad as shown in equation 3.
radcondeff KKK += (3)
To analyze and calculate the heat transfer rate from the flux, the boundary temperatures
profiles across the mold flux is assumed as shown in Figure 15, where T1 represents the
top layer of the solid flux temperature and Ts/c stands for the interface temperature
between solid layer and copper mold.
It is convenient to use the same form as the Fourier law to compute radiative heat transfer
rate. Therefore, the radiation heat flux is calculated as equation 4, where the term ∆T/d is
the temperature gradient across the disk.
dcTsTKq radrad
/1−= (4)
The radiative heat transfer in the solid mold flux is calculated via the gray gas
approximation as shown in equation 5, which is also employed by other researchers [15,
22].
)175.0/(
)/1(112
44
−++=
−×=−−
cs
rad
dn
cTsTq
εεασφ
φ (5)

171
in which ф stands for the radiative heat transfer coefficient, n is refractive index, σ means
the Boltzmann constant (5.6705 *10-8 (W/(m2K4)), α is absorption coefficient is 400/m
for glass and 4500/m for crystal, d is the thickness of the disk, εs and εc are the emissivity
of the slag surface and copper mold surface and are 0.92 (glass), 0.7 (crystalline) and 0.4
(copper) individually [22].
The increased refractive index, absorption coefficient and reflectivity of glass flux disks
containing transition metal oxides account for the attenuation of the transferred heat flux
in copper mold. Therefore, the radiative heat transfer coefficients of the glassy solid mold
fluxes, ф, in the two extreme circumstances: the original transparent glassy phase and the
glassy phase 10% MnO, are able to be determined based on equation 5 with the
measurement of the absorption coefficient and refractive index evolving with the addition
of transition metal oxides. The calculated ф values are given in Figure 16, where the
absorption coefficient and refractive index values for original and 10% MnO are 400 m-1,
1.6 and 1800 m-1, 1.68 respectively. It is obtained that the radiative heat transfer
coefficient for the matrix flux is around 5x10⁻⁸ W/(m2K4), and attenuates to 3-4x10⁻⁸ with
10% MnO.
Thus, from equation 5, the radiative thermal conductivity Krad of the flux can be
determined as equation 6:
cs
csrad TT
dTTK
/1
4/.
41 )(
−−
= φ (6)
A comparison of the radiative thermal conductivities between the matrix flux (pink bar)
and the 10% MnO flux (blue bar) is given in Figure 17.

172
The radiative thermal conductivity of the original glassy flux is around 0.67 W/(mK)
(pink bar) when the solid thickness is 2 mm, which contributes 18% to the overall heat
transfer rate in the solid matrix flux as shown in Figure 18 (pink bar) when the fraction is
determined by the ratio of the radiation to the overall heat transfer rate as: Krad/Keff.
However, the Krad decreases to 0.42 W/(mk), leading to a lower radiation contribution to
the overall heat transfer, which is 12% (blue bar) when the MnO is 10% and thickness is
2mm.
Consequently, the addition of the transition metal oxides block a portion of radiation,
such that the overall heat transferred to the mold would be lowered by 2 to 6% (in Figure
19) depending on the thickness of the glass flux based on the difference between the
matrix flux and 10% MnO sample.
4. Conclusion:
The experimental results in this study show that the addition of the transition metal
oxides, MnO and FeO, reduces the radiation heat transfer rate by up to 25%. Both the
refractive index and the adsorption coefficient increase significantly with the addition of
these transition metal oxides.
The addition of these transition metal oxides leads to fully glassy mold flux samples that
lose their transparency but remain as a glass. The addition of MnO and Fe2O3 to the
initial flux also leads to an increase in both the absorption coefficient (from 400 to 1800
m-1) and the refractive index (from 1.6 to 1.7) of these fluxes. Thus additions of 5% FeO
and 10%MnO can be more effective in reducing the radiation heat transfer rate in the

173
meniscus area of a continuous caster. The effect on the overall heat transfer rate is
however low.
Acknowledgement:
Funding from Center of Iron and Steelmaking Research and Department of Energy and
the American Iron and Steel Institute is greatly appreciated.
5. References:
34. J. Savage, and W. H. Pritchard: Journal of the Iron and Steel Institute, 12 (1954), No. 11, 269-531.
35. S.N. Singh, and K.E. Blazek: Metals Technology, 2(1974) No. 1, 17-27 36. H., P. Tomono, W. Ackermann and W. Heinemann: Elements of surface mark formation in
continuous casting of steel, Proceedings of the International Conference on Solidification Technology in Foundry and Cast House, The Metals Society, Warwick, 1980, p 524-531.
37. H. Tomono, W. Kurz, and W. Heinemann: Metallurgical transactions B, 12B (1981), 409-411.
38. I. Saucedo, J. Beech and G. J. Davies: Metals Technology, 9 (1982), No. 9, 282-291. 39. R. S. Laki, , J. Beech, and G. J. Davies: Iron making and Steel making, 11 (1984), No. 5, 283-
291. 40. E.S. Szekeres: Iron and Steel Engineer, 5(1996), No. 7, 29-37. 41. R. J. O’Malley: Observations of various steady state and dynamic thermal behaviors in a
continuous casting mold, 82nd Steelmaking Conference- Iron and Steel Society, March 1999. 42. S. Ohmiya, K. H. Tacke and K. Schwerdtfeger: Ironmaking Steelmaking, 10 (1983), No. 1,
24. 43. K. Watanabe, M. Suzuki, K. Murakami and T. Shiomi: Tetsu-to-hagane, 83, (1997), No. 2,
pp. 115 44. M. Susa, K.C.M., M.J. Richardson, R. Taylor and D. Stewart: Ironmaking and steelmaking,
21 (1994), pp. 279-286. 45. E. S. Larsen and H. Berman, “The microscopical determination of non-opaque minerals”, 2nd
edn, US Geological Survey Bull. 1934, Washington, DC, US Government Printing Office, pp. 848
46. M. Susa, K. Nagata, K.C. Mills: Ironmaking and steelmaking, 20 (1993) No. 5, 372.
47. J. Cho, H. Shibata, M. Suzuki: ISIJ international, 38 (1998), No. 6, 268. 48. Jui-Hun Chien, W. Wang and A. W. Cramb: TMS letters, 2006, vol. 3, No.2, p 67-68 49. A. B. Badri, and A. W. Cramb, “Heat Flux Calculations From Thermocouples – What Can Be
Measured?” 85th Steelmaking Conference Proceedings, ISS-AIME, 2002, pp. 65-76. 50. A. B. Badri, and A. W. Cramb, “Measurement of Oscillating Temperatures Using Subsurface
Thermocouples” 60th Electric Furnace Steelmaking Conference Proceedings, ISS-AIME, 2002. pp.412
51. A. B. Badri, and A. W. Cramb, “Thermocouples – What temperature are they measuring?” 2001 ISS Electric Furnace Conference Proceedings, 2001, pp. 661-670.

174
52. Wanlin Wang, Alan Cramb. “Model of Radiative Heat Transfer in Solid Mold Flux Phase during Continuous Casting” Proc. of Automation & Control/Advanced Online Metallurgical Models/Sensors MS&T 2005, pp 33-44, 2005
53. Wanlin Wang, “The Heat Transfer Phenomenon across Mold Flux to Copper Mold in Continuous Casting”, Carnegie Mellon University, 2007
54. Wanlin Wang, Alan Cramb: ISIJ, 45, (2005), No.12, 1864-1870 55. A. Yamauchi, T. Sakaraya, T. Emi : Tetsu-to-Hagane, 79 (1993), No. 4, 167. 56. Y. Shiraishi, Handbook of physo-chemical properties at high temperature, ISIJ, Tokyo, 1988,
Ch 10

175
Table I. Specific refractive indices for various oxides Ni
CaO MgO Na2O K2O Fe2O3 MnO Al2O3 SiO2 FeO
0.225 0.200 0.181 0.189 0.308 0.224 0.214 0.207 0.187
Table II: The major composition of matrix mold flux (LC)
Chemical composition (mass %)
SiO2 CaO MgO Al2O3 Na2O F
Basicity
CaO/SiO2
35 37.7 1.3 2.6 10.8 8 5.3 1.077
Table III: Composition of mold flux with MnO from 0 to 10 percent
MnO SiO2 CaO MgO Al2O3 Na2O F-
0 35 37.7 1.3 2.6 10.8 5.3
1 34.7 37.3 1.29 2.57 10.69 5.24
2 34.3 36.9 1.27 2.54 10.52 5.19
3 34 36.6 1.26 2.52 10.47 5.14
5 33.3 35.8 1.24 2.47 10.26 5.0
10 31.5 33.9 1.17 2.34 9.72 4.77

176
Table IV: Composition of mold flux with Fe2O3 from 0 to 5 percent
Fe2O3 SiO2 CaO MgO Al2O3 Na2O F-
0 35 37.7 1.3 2.6 10.8 5.3
0.5 34.83 37.51 1.294 2.587 10.75 5.27
1 34.65 36.32 1.287 2.574 10.69 5.24
2 34.3 36.95 1.274 2.548 10.58 5.19
3 33.95 36.57 1.261 2.522 10.48 5.14
5 33.25 35.82 1.235 2.47 10.26 5.0

177
Figure 1: Refractive index as a function of transition metal oxides concentration
1.6
1.62
1.64
1.66
1.68
1.7
1.72
1.74
0 5 10 15 20 25Mass percentage of MO
Ref
ract
ive
inde
x
Susa, et al (reference 13)
• Fe2O3
▲MnO

178
Data acquisition / command-and-control
computer
PowerController
V
I
Coolingair in
Coolingair out
Water-cooled reflector
Coolingwater out
Coolingwater in
Power cables
Thermocouple output
Voltage and current feedback
Commandsignal
Infrared Radiation
Figure 2: Schematic of the infrared emitter.

179
Figure 3: Schematic of the copper mold used as a radiation target
Mold Flux 32 mm
Thermal couples
25mm
Chilled surface
Cooling water outlet
Cooling water inlet

180
Figure 4: Apparatus used to melt mold flux

181
Figure 5. A series of MnO discs made for this experiment

182
Figure 6: Measured heat fluxes for MnO glassy disks and crystalline disk
0% MnO disk sticks on copper mold
0% MnO
5% MnO
1% MnO
3% MnO
Crystalline
10% MnO

183
200
250
300
Ste
ady
stat
e in
-mol
d he
at
trans
fer r
ate
KW
/m2
0 0.5 1 2 3 5 10Mass percentage of MO
Figure 7: Heat transfer rate versus the mass percentage of MnO
MnO Fe2O3

184
Figure 8: A series of Fe2O3 discs made for this experiment

185
Figure 9: Measured heat fluxes for Fe2O3 glassy discs.
0% Fe2O3
5% Fe2O3
1 % Fe2O3 2% Fe2O3
0.5% Fe2O3
50000
100000
150000
200000
250000
300000
350000
0 100 200 300 400 500 600 700 800Time S
Mea
sure
d he
at fl
ux W
/M2

186
Figure 10: The X-ray pattern of 10% MnO slag disk
Position [°2Theta]
10 20 30 40 50 60 70
Counts
0
50
100
10% MnO Sample
Position (2 theta)
Counts
20 70 40
50 100

187
Figure 11: The magnetic moment of MnO containing disks
- 0.015
- 0.01
- 0.005
0
0.005
0.01
0.015
- 12000 - 7000 - 2000 3000 8000 13000
Magnetic field (Oe)
Mag
etic
mom
ent
(em
u)
10% 5% 3% 2%

188
Figure 12: Measured heat flux versus time for MnO discs with different thickness
2.08mm 1.78mm 1.45mm 0.52mm

189
100000
150000
200000
250000
300000
0 500 1000 1500 2000 2500 3000Time S
Mea
sure
d H
eat
Flux
(W
/m2 )
0.91 mm glassy0.85 mm glassy0.78 mm glassy0.66 mm glassy0.55 mm glassy 0.91 mm crystalline
Figure 13: The measured heat fluxes histories for five different thickness glassy discs

190
200
400
600
800
1000
1200
1400
1600
1800
2000
0 2 4 6 8 10Mass percentage of MO
Abs
orpt
ion
coef
ficie
nt m
-1
MnO
Fe2O3
Figure 14: The absorption coefficient versus mass percent of transition metal oxides

191
Figure 15: Schematic temperature profiles from strand to mold in meniscus area
200 oC 1600 oC
Liquid layer Solid layer Shell
600 oC 1200 oC
Mold
Ts/c T1

192
1.E-08
2.E-08
3.E-08
4.E-08
5.E-08
6.E-08
0.5 1 1.5 2 2.5
Thickness of solid flux mm
Rad
iativ
e he
at tr
ansf
er
coef
ficie
nt W
/(m2 K
4 )
Figure 16: The computed radiative heat transfer coefficient values for two glass disks
Original matrix glass disk 10% MnO disk

193
0
0.1
0.2
0.3
0.4
0.5
0.6
0.7
0.8
2 1.9 1.8 1.7 1.6 1.5 1.4 1.3 1.2 1.1 1
Thickness of flux mm
Radi
atio
n th
erm
al c
ondu
ctiv
ity
W/(m
K)
Figure 17: The calculated radiative thermal conductivity for two samples
0
0.05
0.1
0.15
0.2
Frac
tion
of th
e ra
diat
ion
in
solid
flux
2 1.9 1.8 1.7 1.6 1.5 1.4 1.3 1.2 1.1 1
Thickness of solid flux mm
Figure 18: The fraction of the radiation in solid flux
Original matrix flux 10% MnO flux

194
0
0.01
0.02
0.03
0.04
0.05
0.06
0.07Th
e fra
ctio
n of
the
atte
nuat
ed h
eat
2 1.9 1.8 1.7 1.6 1.5 1.4 1.3 1.2 1.1 1
Thickness of the solid flux mm
Figure 19: The fraction of the overall attenuated heat through the glassy flux

195
57.

196
Appendix 4:
The Effect of In-situ Dynamic Mold Flux Crystallization on Radiative Heat Transfer
Wanlin Wang1, Alan W Cramb2
1 Research Scientist Reckitt Benckiser North America Innovation Center
1 Philips parkway Montvale, NJ, 07645
[email protected] 2Dean of Engineering
John A Clark and Edward T Crossan Professor Rensselaer Polytechnic Institute
Troy, NY, 12180 [email protected]
ABSTRACT
By using an infrared radiation emitter, a radiative heat flux was applied to a copper mold
covered with solid slag disk to simulate the radiation component of the heat transfer
phenomena that can be encountered during continuous casting. The solid slag disk was
initially glass and by application of high levels of incident radiation the glass disk would
dynamically crystallize “in situ” during the experiment. This novel experiment allowed
the progress of crystallization and its effect on radiation heat transfer rates to then be
measured. In addition, it was also possible to melt the top surface of the sample and allow
measurements to be made where there was a glass layer next to the mold wall, a
crystallized layer and a liquid layer. In this manner conditions similar to that found in a
continuous caster can be simulated.
Key words: Radiative heat transfer; Continuous casting; Adsorption and extinction
coefficient; Crystallization; Crystal Growth
2. Introduction
Numerous studies have been carried out to investigate the solidification of steel in a
continuous casting machine by analysis of mold heat transfer measurements and the effect of
operational issues such as slag layer thickness, steel grade, casting speed, slag chemistry, etc..
are well recognized in the literature[1-5]. It has also been recognized that the slag film formed
between the strand and mold contains three layers: a glassy zone close to the mold, a

197
precipitated crystalline layer in the center and a molten film in contact with the steel strand,
where each layer and any issues between the contact of the mold slag film and the mold itself,
provides a contribution to the overall resistance to heat transfer [6-8]. In addition, it is well
known that the measured in-mold heat transfer rate can decrease with time due to the
continued development of the crystallized zone. Therefore, the fraction of crystalline and
glassy phases has been reported to significantly affect the heat transfer rate in the mold [9, 10].
Although various studies [11, 12] have shown that the crystallization of a mold flux acts as a
key parameter in the prudent operation of a steel continuous caster, there has been little
quantification of the effect of the development of the crystalline portion of the flux film during
casting on the overall heat transfer rate.
The percentage of the radiation contribution to the heat transfer rate across the mold flux film
has been quoted in the literature as varying between 20 and 50% depending on the thickness of
the slag film [13, 14]. This study will determine the effect of the dynamic crystallization
behavior of a solid mold flux film on the measured heat transfer rate when the method of heat
transfer is by radiation.
Previous work [15-17], using a radiation emitter, was focused on the understanding of
radiative heat transfer phenomena on copper surfaces by characterizing the subsurface
temperature response in a copper mold to certain radiative heat fluxes. Thus, radiative
phenomena could be analyzed by studying the responding subsurface temperatures in the
copper mold. Previous studies [18-20] focused on the effect of disk thickness, crystal fraction
and chemistry and were conducted at lower power inputs than this study, where dynamic
crystallization of the sample was not possible as the disk temperatures were very low. In these
studies, due to an improved experimental technique, high disk temperatures were achieved that
not only allowed recrystallization but also allowed flux melting.
The research of this paper was conducted in the following manner: (1) infrared radiation was
applied onto a copper mold covered with a thin layer of solid mold flux disk; (2) the in-mold
heat flux variance was determined during dynamic crystallization of the mold flux disk by
analyzing the response of subsurface mold temperatures; and, (3) the effect of crystallization

198
of the mold flux on the heat transfer rate in the mold was then modeled. The heat fluxes
applied were sufficient to cause dynamic crystallization of the samples and it was possible to
measure the effect of dynamic mold flux crystallization on radiative heat transfer. In
subsequent trials, it was possible to also melt the top surface of the slag disks.
2. Experimental Procedures
2.1. Heat Transfer Simulator
A schematic of the experimental apparatus of the infrared emitter is shown in Figure 1. The
equipment used in these experiments includes: a power controller, a high-heat flux infrared
radiant heater with a heating unit, a data acquisition system, and a command-and-controlled
unit. It was decided that an infrared radiation system was needed to produce the high levels of
thermal flux which can be seen in a continuous caster (1 MW/m2). These lamps are vacuum-
sealed tungsten-alloy filaments, which are manufactured by General Electric, and are capable
of emitting 1.0 MW/m2 at 44% above rated voltage.
Data acquisition / command-and-control
computer
PowerController
V
I
Coolingair in
Coolingair out
Water-cooled reflector
Coolingwater out
Coolingwater in
Power cables
Thermocouple output
Voltage and current feedback
Commandsignal
Infrared Radiation
Figure1: Experimental apparatus of the infrared emitter.
When a voltage is applied to the heating elements, the elements begin to emit infrared
radiation. The intensity level of this radiation can be controlled precisely by changing the
voltage applied across the elements. To focus all of this radiation onto a sample plane, a quasi-

199
parabolic reflector is mounted behind the elements. By using a silicon-controlled rectifier
(SCR) based power controller, the voltage across the lamps can be manipulated between 0 and
208 V, and thus, the resulting output flux of the lamps can be varied from 0 to 1.0 MW/m2. In
order to be able to generate heat fluxes using specified mathematical functions, the power
controller is connected to a data acquisition and control board, which is in turn connected to a
computer. Thus, any arbitrary signal generated by the computer can be sent in real time to the
power controller, and translated into an output heat flux by the heating elements.
The infrared emitter is equipped with monitoring systems to ensure that the emitter
operates safely and properly. This instrumentation includes monitoring the inlet cooling
air pressure, inlet water pressure to the sample and reflector, and the flow rate of cooling
water. In addition, the inlet and outlet cooling water temperatures for the sample and
reflector are also monitored. The copper mold is simulated by a one-end water cooled
copper cylinder, which acts as the radiation target, and a schematic figure of the
apparatus is shown in Figure 2. As the heat flux (infrared radiation) is applied on the top
surface of the copper mold, which is covered with the mold flux disk, the response
temperatures could be measured using the in-mold sub-surface thermocouples.
Figure 2. Schematic of the Copper Mold
Mold Flux Disk 0.5-3 mm
10 mm
Thermal couples
Cooling water inlet
Cooling water outlet
95mm
Chilled surface
5 mm
20 mm 30 mm

200
2.2 Preparation of Mold Slag Disk
The mold flux used in this study was an industrial mold slag used in the continuous
casting of ultra-low carbon steels. Its main chemical composition is listed in Table I.
Table I: Composition of mold flux (major components)
Chemical composition (mass %)
SiO2 CaO MgO Al2O3 Na2O F C
Basicity
CaO/SiO2
35 37.7 1.3 2.6 10.8 8 5.3 1.077
The mold slag samples were prepared as thin disks with the same diameter as the copper
substrates that they were placed upon. As most of the free graphite in a mold flux is not
incorporated in the liquid phase which infiltrates in the meniscus area, and this study was
designed for the research of radiative heat transfer in the meniscus area, the original mold
powders were decarburized by placing them into a programmable furnace prior to the
fusion process. The fused mold flux, depleted of free graphite after the process of
decarburization, was melted in an alumina crucible and placed on top of a graphite
crucible which was then placed inside an induction furnace (Figure 3). Once liquid, the
slag was quenched from its molten state (by pouring onto a stainless steel plate) to
achieve a fully glass phase. A new cylindrical copper mold, with the same diameter as the
mold in Figure 2, was then used to cast a cylinder of mold flux. The cylinder was
subsequently cut into disks of varying thickness.

201
Figure 3: Apparatus used to melt the mold flux
The mold flux disk was then placed on the heated surface of the copper mold. During the
radiation experiments, the infrared radiation would impinge on the mold flux disk and
then either be transmitted or conducted through the disk and into the copper substrate.
The real-time responding temperatures of the thermocouples at several locations as
shown in Figure 2 were recorded to allow the calculation of the heat flux passing through
the copper mold.
3. Results and Discussion
3.1 Observation of the influence of crystallization on heat flux
It has been previously recognized that the crystalline phase of mold flux retards the
radiation heat transfer rate due to the development of an opaque top surface and the
development of a large extinction coefficient due to scattering of incoming radiation at
crystal-glass boundaries. Because of this the film thickness had no significant effect on
the radiation heat transfer rate over the range of thickness that were measured [18-20]. In
order to quantify the relationship between the extent of mold flux crystallization and the
heat transfer rate to a water cooled copper mold, a constant radiative heat flux was
applied to a slag disk, which was initially glassy, and placed on top of a copper mold.

202
During the experiment, and as the glass disk increased in temperature, crystallization of
the slag disk occurred, and then the corresponding in-mold heat transfer rate, which
could be determined via the measurement of subsurface responding temperatures in real
time, would change along with the disk crystallization.
A 2.6 mm glassy disk, with a K type thermocouple connected to its top surface, was first
placed on top of the copper mold. A 200 KW/m2 constant thermal radiation was applied
to pre-heat the system for 5 minutes, then, a higher constant 1 MW/m2 thermal radiation
was supplied to anneal and crystallize the glass disk, until 100% crystallization was
achieved. The corresponding heat transfer rate during the process in the copper mold was
determined using Beck’s algorithm for 1 dimension inverse solution of the heat transfer
equation and is presented in Figure 4.
3.E+05
4.E+05
5.E+05
6.E+05
7.E+05
8.E+05
9.E+05
0 500 1000 1500 2000
Time S
Mea
sure
d he
at fl
ux W
/m2
Figure 4. Calculated Heat Flux in the copper mold
The heat flux curve shown above indicates three stages in the heat flux history: I, an
initial transient; II, an attenuation stage; and III, a period of steady state. During the first
I
II III

203
stage, it took 100-200 seconds for the system to heat up and reach the maximum value of
the heat transfer rate prior to the initiation of crystallization. After that, the heat flux
began to attenuate from 840 KW/m2 to 700 KW/m2, when crystallization of the sample
was completed. The net effect of crystallization for the 2.6 mm thick glass disk was to
reduce the radiation transmitted to the mold by 16%.
In order to study the mechanism of heat flux reduction due to flux crystallization, a series
of similar experiments for the systems with 2.8 mm glass disks were performed under
different conditions of thermal radiation for different times. The responding heat fluxes in
the mold under different crystallization conditions are given in Figures 5 and 6.
The calculated heat flux of sample 1 (under 700 KW/m2 thermal radiation for 362
seconds) is shown in Figure 5. In this case there was no crystallization. Sample 1
remained transparent as shown in Figure 7. Sample 2 was heated for 740 seconds. In this
case the heat flux rose to maximum and then began to decrease. After the experiment,
crystallization was observed to have initiated. A very thin cream white crystalline layer
was observed on the top surface of sample 2 and this is shown in Figure 7.
250
300
350
400
450
500
0 200 400 600 800
Time Second
Hea
t flu
x
K
W/c
m2
Sample 1
Sample 2

204
Sample 1: 2.8 mm full glass disk under 7000 W thermal radiation for 362 S; Sample 2: 2.8 mm glass disk under 7000 W radiation for 741 S
Figure 5. The heat fluxes measured in copper mold for samples 1 and 2
In order to make crystallization easier to initiate, the incident power was increased to 800
KW/m2 and the experiment was extended to longer times (samples 3 and 4). The opaque
crystals in samples 3 and 4 were observed to grow to the bottom of the disk (Figure 7). The
corresponding heat fluxes for samples 3 and 4 are shown in figure 6 and the heat flux
attenuated with the evolution of the crystallization. When sample 6 was heated (under 850
KW/m2) for a long enough time (2451 seconds) to allow the completion of its crystallization,
the calculated heat flux finally approached a steady state.
400
450
500
550
600
650
0 500 1000 1500 2000 2500Time S
Hea
t flu
x
KW
/m2
Sample 3
Sample 4
Sample 5
Sample 6
Sample 3: 2.8 mm glass disk under 8000 W for 784S; sample 4: under 8000 W for 1076S; sample 5: 2.8 mm glass disk under 8000 W for 2714 S; sample 6: under 8500 W for 2451 S.
Figure 6: The heat fluxes in copper mold for samples 3, 4, 5 and 6.
0.2mm

205
Sample (1) Sample (2) Sample (3)
Sample (4) Sample (5) Sample (6)
Figure 7: Side view of the samples
In order to further investigate the crystallization phenomena of the slag disk, the top
surface temperatures of specimen disks, T1, in above experiments, was measured. The
temperatures at the top disk ranged from 700 C to 1000 C, depending upon the applied
radiation power (700 KW/m2 to 850 KW/m2). With such a temperature profile in the disk,
the original amorphous disk will crystallize, as can be seen in the mold flux TTT diagram
shown in Figure 8 [21].

206
Figure 8: TTT diagram of industrial mold flux studied by Kashiwaya, etc [21]
The opaque crystals initiated at the top surface of the disks and then grew down to the
bottom of the disks (sample 3, 4, 5) as the temperature inside of the disk increased.
The crystallization of the slag disk inhibited the heat transfer rate across mold flux to the
copper mold. As the annealing time increased, there was a larger volume fraction of
crystalline phase developed in the sample. Thus, the absorbed thermal energy passing
through the specimen attenuated as the top surface lost its transparency and as the
crystallized volume fraction increased.
3.2 The modeling of the heat flux during crystallization
The effective thermal conductivity of the slag, Kslag, with the development of
crystallization, can be calculated using equation 1.
cryKXglassXKcryKglassK
TTq
dslagKcs
tot
)1(
*
/1 −+=
−= (1)
Since the Kglass has a larger value than Kcry, the total slag thermal conductivity attenuates
with the development of slag disk crystallization. A plot of the calculated Kslag (equation
A-1) versus the corresponding crystal fraction, X, is shown in Figure 9 where the thermal
conductivity values were determined in these and previous studies.

207
3
3.2
3.4
3.6
3.8
4
0 0.2 0.4 0.6 0.8 1
Part of crystallization
Them
al c
ondu
ctiv
ity o
f sla
g W
/(Km
)
Figure 9: The change of thermal conductivity of mold flux with the development of crystallization
.
As crystallization inhibits the radiative heat transfer, it became desirable to investigate
how the heat flux evolves with the development of crystallization. A 2.2 mm glassy slag
disk with a K-type thermocouple connected to its top surface was placed on top of copper
mold and the mold was partially insulated. Then the whole system was subjected to a 900
KW/m2 thermal radiation for a long time after it had been pre-heated by a low 200
KW/m2 thermal radiation for 5 minutes. All the responding temperatures histories
including the top disk surface temperature, T1, subsurface responding temperatures, T2
and T3 (5 mm and 15 mm below mold surface respectively), were recorded and are
shown in Figure 10. Since both the temperatures of the top mold surface, Tm, and the
interface temperature between disk and mold, Ts/c, could be easily calculated at steady
state, they are also given along with T1 and T2.
crystalKXglassXKcrystalKglassK
slagK)1(
*
−+=

208
100
300
500
700
900
0 500 1000 1500 2000 2500Time S
Res
pond
ing
tem
p. D
eg C
T1
T2
T3
Tm
Ts/c
Figure 10. The responding temperatures’ histories in system with 2.2 mm glass disk
With the temperatures gradient history in the mold, the in-mold heat flux was then
calculated and is presented as the green line in Figure 11. As the heat flux through the
slag disk was equal to that of copper mold at steady state, the heat flux evolving with the
variance of mold slag thermal conductivity, Kslag, was expressed in terms of crystal
volume fraction, X, by the rearrangement of equation 1:
dTT
KXXKKK
KdTT
q cs
cryglass
cryglass
slag
cstot
/1/
)1(1 −
∗−+
•=
−= (2)
Therefore, the evolution of heat flux as a function of time could be determined by the
input of a crystallization kinetics model developed in our previous studies [26] such that:
dTT
KttkKttkKK
q cs
cryglass
cryglasstot
/133 *)*)))((exp(]*)))((exp(1[
−−−+−−−
•=
(3)

209
The nucleation and growth coefficient k was 0.0035 and is in the range of other
researcher’s results [27]. Kcry = 3.1 W/(Km), Kglass = 3.83 W/(Km), d=2.2 mm, and the
estimated Ts/c values are also used. The predicted heat flux line during crystallization is
shown in pink in Figure 11.
200000
300000
400000
500000
600000
700000
800000
0 500 1000 1500 2000 2500
Time S
Mea
sure
d he
at fl
ux W
/m2
measured in-mold heat flux
predicted heat flux
Figure 11. The comparison of the measured and predicted heat flux in the experiment
The predicted results are consistent with the measured experimental heat flux.
Consequently, the complex flux disk temperature profiles can be predicted. The
temperature profile within the disk was derived as a function of disk thickness, d, and
annealing time, t, as shown in equation 4.
:
}*))(exp(]*))(exp(1{[*
33/ cryglass
cryglass
totcsslag kttkkttk
KKdq
TT −−+−−−∗
+= (4)

210
An example of T1, the temperature of the disk top surface, was predicted according to
equation 6, where the thickness d is 2.2 mm, and t* is 152 seconds. A comparison of the
predicted T1 (blue line) and the measured T1 (red line) was given in Figure 12.
500
600
700
800
900
1000
0 500 1000 1500 2000 2500Time S
Res
pond
ing
tem
pera
ture
s of
T1
Figure 12. The comparison between the measured and predicted T1 Temperatures
3.3 Melting of the Mold Flux
In order to simulate the dynamic situation of the mold flux in continuous caster, i.e. liquid
at the top, glass at the bottom, and a crystallized portion in the middle; a new
manufactured powder was prepared. A comparison of two mold fluxes was listed below
in Table 2.
Table 2: The chemical composition of the initial and the manufactured slag
Components Initial Manufactured
--measured T1 --predicted T1

211
Composition
(%(wt))
Composition
(%(wt))
SiO2 35 25
CaO 37.7 41.2
MgO 1.3 0.9
Al2O3 2.6 1.86
Na2O 10.8 7.7
F2 8 5.7
C 5.3 3.6
B2O3 14.3
A 5 mm thick glass disk of this newly designed mold flux was fabricated and placed on
the copper mold. It was preheated by a 200 KW/m2 thermal radiation and then subjected
to 1 MW/m2 thermal radiation for the test. The responding in-mold temperatures T2, T3
are given in Figure 13 along with the calculated disk top surface temperature T1.
0
200
400
600
800
1000
1200
0 1000 2000 3000 4000 5000Time S
Res
pond
ing
tem
pere
ture
s de
gree
C T2T3
T1
kglass and kcry used here are 3.8 and 3.1 W/(Km) , k is 0.0087, d is 5mm and t* is 82 seconds

212
Figure 13: The temperatures of T1, T2 and T3
With the increased applied thermal energy and glass disk thickness, the responding
temperatures in the system were significantly higher than the former systems. The T1
temperature, in this case, was around 1200 Celsius. As T1 passed the incubation time
and reached its first peak, it began to attenuate with the development of crystallization,
because the radiation heat transfer rate was inhibited. Once the crystallization was
completed, the T1 temperature started to increase slowly, due to the increased disk
thermal resistance and system heat accumulation [12], until it reached the melting point
of the disk. Then the top disk melted and the crystals re-dissolved. When the T1
temperature was above the flux liquidus, enhancement of the radiation heat transfer rate
in the disk occurred. The corresponding in-mold heat transfer rate is given in Figure 14.
300000
350000
400000
450000
500000
550000
600000
0 1000 2000 3000 4000 5000Time S
Mea
sure
d he
at fl
ux W
/m2
Figure 14. The measure heat flux under a 5 mm thick manufactured slag disk
There were five stages in the heat flux history above, i.e.: an initiation time, an
attenuation stage, a period of steady state, a increase and then a final steady state. The
I
II III
IV V

213
initiation time was rather short due to the very high temperature developed on the top
surface of this disk (around 1200 Celsius). The crystallization occurred as the system was
heated. The heat flux subsequently reached its maximum value, and started to attenuate
with the development of crystallization. Then the heat flux came to a steady state once
the crystallization of the disk was completed. During this period steady state, the disk top
surface temperature, T1, increases due to the increased thermal resistance and heat
accumulation until it reached the mold flux liquidus. Then melting and crystal dissolution
was initiated at the disk top surface and the overall heat transfer rate subsequently
increased, as shown in Figure 9. The increased heat flux due to melting and crystal
dissolution, improved the temperature gradient inside the disk, such that the molten layer
moved down. Eventually, when the system came to its final steady state, in other words,
when the thickness of the liquid layer, crystalline lay and glass layer was fixed, the heat
transfer rate became stable.
Thus the radiation heat transfer rate is affected by the thickness of all three layers and is
sensitive to the exact condition of the glass, crystallized and liquid layer.
Conclusions:
A new technique has been developed to allow the observation of the effect of in-situ
mold flux crystallization on the radiation heat transfer rate. The in-mold heat flux
evolution in the system experiences three stages: incubation, attenuation, and steady state,
if temperature within the flux disk remain below its solidus temperature. The incubation
and attenuation stages are a strong function of the thickness of the mold flux and the
incident thermal flux. The heat flux attenuates with the development of the mold flux

214
crystallization and reaches steady state, when full crystallization is completed, and the
full crystallization of a slag disk inhibited the radiation heat transfer rate by about 16% in
this study. If temperatures within the disk increased above its liquidus, and melting
occurs, a fourth stage can be measured where the radiation heat transfer rate increased
again due to a decrease in the crystal volume fraction due to melting.
Acknowledgement
This research is funded by the Center for Iron and Steelmaking Research membership
companies.
Nomenclature: q: heat flux (W/m2) R: thermal resistance ( d: thickness (m) K: thermal conductivity ( T: temperature (K) X: crystals fraction σ: Boltzmann constant (W/(m2K-4) α: absorption coefficient (m-1) ε: emissivity φ: radiative heat transfer coefficient (W/(m2K4) Subscripts cond: conduction rad: radiation cry: crystalline glass: glassy m: mold s/c: solid/copper interface int: interfacial tot: total References: 58. J. Savage and W. H. Pritchard: Journal of the Iron and Steel Institute, 1954, Vol. 192, pp. 269-531. 59. S.N. Singh and K.E. Blazek: Metals Technology, 1974, Vol. 10, pp. 17-27. 60. H. Tomono, P. Ackermann, W. Kurz, and W. Heinemann, “Elements of surface mark formation in
continuous casting of steel” Proceedings of the International Conference on Solidification Technology in Foundry and Cast House, The Metals Society, Warwick, 1980, pp. 524-531.
61. H. Tomono, W. Kurz, and W. Heinemann: Metallurgical transactions B, Vol. 12B, 1981, pp. 409-411.
62. I. Saucedo, J. Beech and G. J. Davies: Metals Technology, 1982, Vol. 18, pp282-291. 63. R.B. Mahapatra, J. K. Brimacombe, I.V. Samarasekera, N. Walker, and J. D. Young: Metallurgical

215
Transactions B, 1990, Vol.21, pp.861-874. 64. K.C. Mills et al., “Effect of casting powder on heat transfer in continuous casting”, Continuous
Casting ’85, The Metal Society, London England, 1985, paper 57, pp. 57.1-57.7 65. S. Ohmiya, K.H. Tracke and K. Schwerdtfeger: Iron making Steelmaking, 1983, Vol.10, pp24. 66. M. Jenkins: ISS Steelmaking Proceedings, 1995, pp.395. 67. M Susa, K. Mills, M. Richardson and D. Stewart: Ironmaking Steelmaking, 1994, Vol. 21, pp.623. 68. M. Emi: ISS Steelmaking Proceedings. 1991, pp.623. 69. H. Kyoden, T. Doihara and O. Nomura: ISS Steelmaking Proc., 1986, pp.153. 70. S. Ohmiya, K. H. Tacke and K. Schwerdtfeger: Ironmaking Steelmaking, 1983, Vol.10, pp. 24. 71. K. Watanabe, M. Suzuki, K. Murakami and T. Shiomi: Tetsu-to-hagane, 1997, Vol. 83, pp.115 72. A. B. Badri, and A. W. Cramb, “Heat Flux Calculations From Thermocouples – What Can Be
Measured?” 85th Steelmaking Conference Proceedings, ISS-AIME 2002, pp. 65-76. 73. A. B. Badri, and A. W. Cramb, “Measurement of Oscillating Temperatures Using Subsurface
Thermocouples” 60th Electric Furnace Steelmaking Conference Proceedings, ISS-AIME, 2002. 74. A. B. Badri, and A. W. Cramb, “Thermocouples – What temperature are they measuring?” 2001
ISS Electric Furnace Conference Proceedings, 2001, pp. 661-670. 75. W. Wang and A. W. Cramb: Materials Science & Technology, 2005, Vol. 1, pp. 33-44 76. W. Wang and A. W. Cramb, TMS letters, 2005, Vol.2. pp. 115. 77. W. Wang and A. W. Cramb, “A study of the Effect of Mold Flux Crystallization on Radiative
Heat Transfer rate”, Proceedings of Baosteel Secondary Biennial Academic Conference, Vol. 1, pp 129, Shanghai, China, 2006.
78. Y. Kashiwaya, C. Cicutti and Alan Cramb: ISIJ, 1998, Vol.38, pp.348. 79. M. Susa, K. Nagata, and K.C. Mills: Ironmaking and steelmaking, 1993, Vol. 20, pp. 372.
80. J. Cho, H. Shibata, and M. Suzuki: ISIJ international, 1998, Vol. 38, pp. 268. 81. M. Susa, M.J. Richardson, R. Taylor and D. Stewart: Ironmaking and steelmaking, 1994, Vol.
21, pp. 279-286. 82. Y. Shiraishi, Handbook of physo-chemical properties at high temperature, ISIJ, Tokyo, 1988,
Ch 10 83. Wanlin Wang, Ph.D. Thesis, Carnegie Mellon University, Pittsburgh, PA, 2007 84. Y. Kashiwaya, C. Cicutti and Alan Cramb: ISIJ, 1998, Vol. 28, pp. 357.

216
Appendix 5: The Study of the Effect of Mold Flux Melting and Crystal Fraction
Dissolution on Radiative Heat Transfer Wanlin Wang1, Alan W Cramb2
1 Research Scientist Reckitt Benckiser North America Innovation Center
1 Philips parkway Montvale, NJ, 07645
[email protected] 2Dean of engineering
John A Clark and Edward T Cross professor Rensselaer Polytechnic Institute
Troy, NY, 12180 [email protected]
ABSTRACT
A mold flux is widely used to modify heat transfer rates in continuous casting, and
crystallization of a mold flux has been identified as a primary factor that influences heat
flux from the strand to the mold. By using an infrared radiation emitter, a radiative heat
flux was applied to a copper mold covered with solid mold flux disk to simulate the heat
transfer phenomena in continuous casting. By this technique it is possible to have a liquid
layer, a crystalline layer and a glassy layer in contact with one another and, by varying
the energy input, it is possible to study the dynamic nature of the film and its effect on the
radiative and overall heat transfer rate. A general heat transfer model was also developed
to allow the prediction of the effect of varying the thickness of the three potential layers
in the flux film.
Key words: Radiative heat transfer; Continuous casting; Adsorption and extinction
Coefficient; Crystallization; Crystal Growth

217
3. Introduction
As the heat transfer rate in the mold strongly influences the surface quality of slabs, many
studies have been carried out to investigate the solidification of steel by mold heat
transfer measurements [1-5]. Once the liquid layer of the slag covering the top of the
molten steel pool has infiltrated into the gap between the strand and the mold, the
solidification of the infiltrated liquid slag is initiated due to the large temperature gradient
from the strand to the mold. Depending upon the cooling rate and the temperature
variations that occur within the liquid slag film, it is possible to form a glass or a mixture
of precipitated crystals and glass within the solidifying layer and, often, a glass layer is
found against the mold wall and a crystallized layer is found between the glass layer and
the liquid layer that can exist next to the solidifying shell. Of course the various
proportions of these layers depend upon position and time, as the crystal fraction within
the film tends to coarsen with time.
Generally, it has been accepted that the precipitation of crystalline solids from the molten
mold slags tend to inhibit overall heat transfer rates, a fact that was confirmed in
laboratory experiments [6] and in plant trials [7, 8]. Susa, et al. [9, 10] studied the thermal
properties of slag films taken from continuous casting molds, and finally concluded that
the crystallization of the slag is the primary factor affecting the heat transfer rate via
radiation and conduction and that the effects of transition metal oxides on the thermal
properties of a slag results in only a minor influence on heat flux compared with that of
crystallization. Therefore, it is necessary to understand the precipitation of crystalline

218
solids, the growth of these crystals, the melting of the crystalline solids, and how these
phenomena affect heat transfer rate in continuous casting.
The research of this paper was conducted in the following manner: (1) application of
infrared radiation onto a copper mold covered with a thin layer of glassy phase solid
mold flux disk; (2) setting up a situation where the three layers of the film could co-exist
by “in-situ” melting of the top layers of the disk; (3) determination of the in-mold heat
flux variance by analyzing the response of subsurface mold temperatures; and, (4)
calculation of the effect of crystallization and melting of a mold flux on the heat transfer
rate in the mold.
2. Experimental Procedures
2.1. Heat Transfer Simulator
A schematic of the experimental apparatus is shown in Figure 1. The equipment used in
these experiments includes: a power controller, a high-heat flux infrared radiant heater
with a heating unit, a data acquisition system and a command-and-control unit. It was
decided that an infrared radiation system was needed to produce the levels of fast
response of thermal flux seen in the caster (1 MW/m2). These lamps are vacuum-sealed
tungsten-alloy filaments, which are manufactured by General Electric; capable of
emitting 1.0 MW/m2 at 44% above rated voltage.

219
Data acquisition / command-and-control
computer
PowerController
V
I
Coolingair in
Coolingair out
Water-cooled reflector
Coolingwater out
Coolingwater in
Power cables
Thermocouple output
Voltage and current feedback
Commandsignal
Infrared Radiation
Figure1. Schematic of the infrared emitter.
When a voltage is applied to the heating elements, the elements begin to emit infrared
radiation. The intensity level of this radiation can be controlled precisely by changing the
voltage applied across the elements. To focus all of this radiation onto a sample plane, a
quasi-parabolic reflector is mounted behind the elements. By using a silicon-controlled
rectifier (SCR) based power controller, the voltage across the lamps can be manipulated
between 0 and 208 V, and thus the resulting output flux of the lamps can be varied from
0 to 1.0 MW/m2. In order to be able to generate heat fluxes using specified mathematical
functions, the power controller is connected to a data acquisition and control board,
which is in turn connected to a computer. Thus, any arbitrary signal generated by the
computer can be sent in real time to the power controller, and translated into an output
heat flux by the heating elements.
The infrared emitter is equipped with monitoring systems to ensure that the emitter
operates safely and properly. This instrumentation includes monitoring the inlet cooling
air pressure, inlet water pressure to the sample and reflector, and the flow rate of cooling

220
water. In addition, the inlet and outlet cooling water temperatures for the sample and
reflector are also monitored. The copper mold is simulated by a one-end water cooled
copper cylinder, which acts as the radiation target, and the schematic figure is shown in
Figure 2. As the heat flux (infrared radiation) is applied on the top surface of the copper
mold, which is covered with mold flux film, the response temperatures could be
measured using the sub-surface thermocouples.
Figure 2. Schematic figure of copper substrate used as the radiation target
2.2 Preparation of Mold Slag Disk
The mold flux employed in this study was an industrial mold slag used in the continuous
casting for ultra-low carbon steels, and its main chemical composition is listed in Table I.
Mold Flux 10 mm
Thermal couples
Cooling water inlet
Cooling water outlet
95mm
Chilled surface

221
Table I: Composition of mold flux (major components)
Chemical composition (mass %)
SiO2 CaO MgO Al2O3 Na2O F C
Basicity
CaO/SiO2
35 37.7 1.3 2.6 10.8 8 5.3 1.077
The mold slag samples were prepared as thin disks with the same diameter as the copper
substrates that they were placed upon. The original mold powders were decarburized by
placing into a programmable furnace prior to the fusion process. The fused mold flux,
when depleted of free graphite after the process of decarburization, was melted in an
alumina crucible placed on top of the graphite crucible in an induction furnace (Figure 3)
and then quenched from its molten state onto a stainless steel plate at room temperature
to achieve fully glass phase. A new cylindrical tube-like copper mold with the same
diameter as the copper substrate was used to cast the mold flux before it solidified on the
steel plate to make a thin glass mold flux disk.
Figure 3: Apparatus used to melt mold flux in a container on top of the graphite crucible

222
The mold flux disk was then placed on the heated surface of the copper mold. During the
radiation experiments, the infrared radiation would impinge on the mold flux disk and
then either be transmitted or conducted through the disk and into the copper substrate.
The real-time responding temperatures of the thermocouples at several locations as
shown in Figure 2 were recorded for the calculation of the heat flux passing through
copper mold.
3. Results and Discussion
3.1 The observation of heat flux fluctuation with a dynamic change in the mold flux
layer
A 4 mm thick glass disk was first placed the copper mold. The system was pre-heated by
a 200 KW/m2 thermal radiation. It was then subjected to a high 900 KW/m2 thermal
radiation. The two responding temperatures, T2 (5 mm below the hot copper surface) and
T3 (10 mm below), in the mold were shown in Figure 4.

223
0
50
100
150
200
250
300
0 1000 2000 3000 4000 5000
Time S
Res
pond
ing
tem
pera
ture
s C
0
T2
T3
Figure 4. The responding temperatures in the mold
The responding in-mold heat flux was then calculated using Beck’s algorithm and the
results are shown in Figure 5. There were 4 stages appearing in the responding heat flux:
stage I: an incubation stage where the heat flux came to maximum; stage II: an
attenuation stage; stage III: a small area of steady state; and stage IV: an area of further
increase. In order to study the heat flux evolution with the dynamic change of the mold
flux, the top surface temperature of the disk was studied based on the following
assumptions: (1) the solid mold flux consists of glass and crystalline layers in series; (2)
heat flows one dimensionally through the solid mold flux to copper mold; and (3) there is
no interaction between the radiation and conduction.

224
0
100000
200000
300000
400000
500000
600000
0 1000 2000 3000 4000 5000Time S
Mea
sure
d he
at fl
ux W
/m2
Figure 5: The calculated heat transfer rate in the copper mold
The total heat flux, qtot, passing through copper mold at steady state could be determined
by using Fourier’s First Law as shown in Equation 1 with the measured responding
subsurface temperatures T2 and T3.
radcond
slag
cscoppertot qq
KdTT
dTTKq +=
−=
−= /1
2)32( (1)
Here, Kcopper, slag is the thermal conductivity of copper, slag disk, d2 is the distance
between T2 and T3, T1 is the top surface temperature of disk, Ts/c means the interfacial
temperature between the mold and disk, d is the thickness of the mold disk, qcond and qrad
stand for the conductive and radiative heat transfer rate respectively. Thus, the top
surface temperature of the mold, Tm, could be derived as:
12 dkq
TTcopper
totm += (2)
I II III IV

225
where d1 is the distance between Tm and T2. Thus, the interface temperature, Ts/c, could
also be determined as equation 3:
int/ RqTT totmcs ×+= (3)
Consequently, the temperature profile within the disk was able to be derived as a function
of disk thickness, d, and annealing time, t, in following equation from previous studies
[11, 12]:
}*))(exp(]*))(exp(1{[*
33/ cryglass
cryglass
totcsslag kttkkttk
kkdq
TT −−+−−−∗
+= (4)
where kglass and Kcry are the thermal conductivity of solid mold flux in glassy and
crystalline phase respectively, t* represents incubation time, and k represents the
nucleation and growth coefficient. The determined T1 value was given in Figure 6.
0
200
400
600
800
1000
1200
0 1000 2000 3000 4000 5000Time S
Res
pond
ing
tem
pere
ture
of
slag
top
surf
ace
deg
ree
kglass and kcry used here are 3.8 and 3.1 W/(Km) , k is 0.0035, d is 4mm and t* is 82 seconds
Figure 6. The responding temperature of disk top surface

226
It was found that the disk top surface temperature increased and went to 1000 degrees in
the first hundreds seconds corresponding to the responding heat flux stage I. When the
disk annealed in such a high temperature, the crystallization was initiated quickly. Then
the transferred heat flux through mold flux was attenuated due to the flux crystallization.
Once there was no further crystallization of the disk, the flux kept constant. The
crystallization of the disk could be clearly observed in Figure 7, where the opaque
crystals developed and grew towards the bottom of the disk.
Figure 7. The photo of the 4 mm thick sample
However, the heat flux started to increase at the end of the test as shown in stage IV
corresponding to the temperature T1 in Figure 6. It was found that the disk top surface
temperature was approaching 1060 Celsius, which was higher than the mold flux initial
melting point range that is around 1050 degrees. Therefore, the top surface of the disk
became liquid and the crystallized portion began to re-dissolve when the sample was
heated longer than 3819 seconds. Consequently, the melting of the disk enhanced the heat
transfer rate through the mold flux to copper mold by reduction of the crystallized
volume.

227
In order to simulate the real dynamic situation of the mold flux in continuous caster, i.e.
liquid at the top, glass at the bottom, then crystals in the middle growing from liquid to
bottom and to observe the mold flux melting or solidification effect on heat transfer rate,
a new manufactured powder was prepared with the addition of CaO and B2O3 to increase
its melting point (1210C0). The comparison of two mold fluxes was listed below.
Table II The chemical composition of initial slag and a manufactured
Composition Initial %(wt) Manufactured %(wt)
SiO2 35 25
CaO 37.7 41.2
MgO 1.3 0.9
Al2O3 2.6 1.86
Na2O 10.8 7.7
F2 8 5.7
C 5.3 3.6
B2O3 14.3
A 5 mm thick glass disk of this new designed mold flux was fabricated and placed into
the copper mold. It was preheated by a 200 KW/m2 thermal radiation and then subjected
to a 1 MW/m2 thermal radiation for the test. The responding in-mold temperatures T2, T3
were given in Figure 8 along with the calculated disk top surface temperature T1
determined by equation 4.

228
0
200
400
600
800
1000
1200
0 1000 2000 3000 4000 5000Time S
Res
pond
ing
tem
pere
ture
s de
gree
C T2T3
T1
kglass and kcry used here are 3.8 and 3.1 W/(Km) , k is 0.0087, d is 5mm and t* is 82 seconds
Figure 8: The responding temperatures of T1, T2 and T3
With the increased applied thermal energy and glass disk thickness, the responding
temperatures in the system were obviously higher than the former systems. The T1 in this
case was around 1200 Celsius. As T1 passed the incubation time and reached its first
peak, it began to attenuate with the development of crystallization, because the radiative
heat transfer was inhibited resulting in a lower temperature gradient in the disk. Once the
crystallization was completed, the T1 started to increase slowly due to the increased disk
thermal resistance and system heat accumulation [12], until it reached the melting point
of the disk. Then the top disk melted and the crystals re-dissolved. When T1 was above
the flux liquidus, enhancement of the radiation heat transfer rate in the disk occurred. The
corresponding in-mold heat transfer rate is given in Figure 9.

229
300000
350000
400000
450000
500000
550000
600000
0 1000 2000 3000 4000 5000Time S
Mea
sure
d he
at fl
ux W
/m2
Figure 9. The measure heat flux under a 5 mm manufactured I slag disk
There were five stages in the heat flux history above, i.e.: an incubation time, an
attenuation stage, a period of steady state, a increase and then a final steady state. The
incubation time was rather short due to the very high temperature developed on the top
surface of this disk (around 1200 Celsius). The crystallization occurred right after the
system was heated. The heat flux subsequently reached its maximum value, and started to
attenuate with the development of crystallization. Then the heat flux came to a steady
state once the crystallization of the disk was completed. During this period steady state,
the disk top surface temperature, T1, increases due to the increased thermal resistance
and heat accumulation until it reached the mold flux liquidus. Then melting and crystal
dissolution was initiated at the disk top surface, the overall heat transfer rate subsequently
increased as shown in Figure 9. The increased heat flux improved the temperature
gradient inside the disk, such that the molten layer moved down, and it lead to a reduction
of the crystal volume resulting in a further increase of the heat flux. Eventually, when the
I II
III IV V

230
system came to its final steady state, in other words, when the thickness of the liquid
layer, crystalline lay and glass layer was fixed, the heat transfer rate became stable.
3.2. Modeling of overall heat transfer in the meniscus area
With the above understanding of the mold flux crystallization, melting and crystal
fraction dissolution effects on the radiative heat transfer rates, a model of the overall heat
transfer from steel strand across the mold flux to the copper mold in meniscus area could
be developed. This allows the dramatic effect on radiation heat transfer due to
crystallization of solid mold flux to be considered. A schematic figure of the meniscus
area in the caster mold was shown in Figure 10 where it was observed that a larger ratio
of liquid phase infiltrates between the strand and the solid mold flux. In order to simplify
the modeling, the thickness of the whole mold flux including liquid and solid layer in the
meniscus area was assumed to be 3 mm with the liquid layer ranging from 2 to 1 mm.
Figure 10: The schematic figure of meniscus area in caster mold
Steel Shell
Liquid steel
Meniscus Mold
Flux Powder Liquid flux
Solid flux

231
The total heat flux from the strand passing through mold flux to copper mold was
assumed to consist of two parts according to equation 1, i.e., the radiative and conductive
heat flux. Consequently, a term defined as effective thermal conductivity Keff was
introduced to represent the actual thermal conductivity, which was including the sum of
conductive part, Kcry, and radiative part, Krad as shown in equation 5.
radcondeff KKK += (5)
The radiative heat transfer in the solid mold flux was calculated via the gray gas
approximation as shown in equation 6, which was also employed by other researchers
[13, 14].
)175.0/(
)1(112
44
−++=
−×=−−
cs
rad
dn
TmTq
εεασφ
φ (6)
in which ф stands for the radiative heat transfer coefficient, n is refractive index, which is
usually referred to be 1.6 [15], σ, the Boltzmann constant is 5.6705 *10-8 (W/(m2K4), α is
absorption coefficient that is 400/m for glass and 4500/m for crystal [11, 12]; εs and εc
are the emissivity of the slag surface and copper mold surface and they are 0.92 (glass),
0.7 (crystalline) and 0.4 (copper) individually [16]. As it was convenient to use the same
form as the Fourier law to compute radiative heat transfer rate; the radiation heat flux was
calculated as equation 7.
dTT
Kq csradrad
/1−= (7)

232
Thus, by the combination of equation 6, the radiative thermal conductivity Krad of the
flux can be determined as equation 8.
cs
csrad TT
dTTK
/1
4/.
41 )(
−−
= φ (8)
Consequently, the calculated radiative heat transfer coefficient, ф, for the mold flux
ranges from 7 to 8 x 10⁻⁸ W/(m2 K4) depending on the thickness of flux, which was
consistent with Cho’s values [13]. A comparison of the ф values between this paper and
Cho’s was given in Figure 11 where the small difference may originate from the specific
different boundary conditions.
0
2
4
6
8
10
0.0005 0.001 0.0015 0.002 0.0025
Thickness of liquid flux m
Radi
ativ
e he
at tr
ansf
er
coef
ficie
nt (1
0-8 W
/(m-2
K-4)
Figure 11. The comparison of the radiative heat transfer coefficients
To analyze and calculate the radiative heat transfer rate from the liquid flux, the boundary
temperatures profiles was also assumed as shown in Figure 12, where the liquid layer
varies from 2 to 1 mm.
This study -- Results from Cho [68]

233
Figure 12. Schematic temperature profiles from strand to mold in meniscus area
Consequently, the radiative thermal conductivity for the liquid flux was calculated via
equation 8 by using the determined radiative heat transfer coefficient and the assumed
temperature profile inside the mold and given in Figure 13. The calculated Krad values
were from 2.48 to 1.48 W/(mK) depending upon the thickness of the liquid layer. The
thicker the liquid layer, the larger the radiative thermal conductivity would be, and there
would be more radiation emitted from liquid flux and the melting of mold flux enhances
radiation in the mold.
1
1.5
2
2.5
3
0.0005 0.001 0.0015 0.002 0.0025
Thickness m
Radi
ativ
e th
emal
con
duct
ivity
W
/(mK)
Figure. 13 The calculated radiation thermal conductivity for liquid flux
200 oC 1600 oC
Liquid layer Solid layer Shell
600 oC 1200 oC
Mold

234
Therefore, the contribution to the overall heat flux from the radiation in liquid flux was
determined from equation 5. The conduction thermal conductivity, Kcond, was assumed to
be equal to Kcry due to more than 96% heat transferred in the crystalline layer was
conduction as described in previous studies [12]. Then, the ratio of the radiation from the
liquid flux, Krad/Keff, was calculated and given in Figure 14.
0
0.2
0.4
0.6
0.8
1
2 1.9 1.8 1.7 1.6 1.5 1.4 1.3 1.2 1.1 1
Thickness of liquid flux mm
Ratio
of t
he K
r ov
er K
eff
Figure 14. The ratio of the radiation to overall heat flux from meniscus
The radiation contribution to the overall heat transfer rate ranges from 47% to 33%
depending upon the thickness of the liquid layer as the red bars shown in above figure.
The blue bar stands for the portion of conduction. The obtained values from this study
were consistent with Cho, Watanabe and Ohmiya’s results [14, 17, 18]. The portion of
the radiation heat flux was then applied to the adjacent solid mold flux, which was
assumed to be either pure glassy or crystalline phase. The part of the radiation transferred
through the solid flux to the mold was then calculated according to equation 9, the heat
absorption model developed in previous studies [19], and shown in Figure 15.

235
]}]
)(exp1)1)((exp1[1
])(exp1
)1()[exp()
)(exp1)1)((exp1([1{
22
22
,
222
2
,
22
22
dRRdRR
dRRdR
dRRdRII
coppersystem
coppersystem
otransfer
ββ
ββ
ββ
−−−−
+−
−−−
−+
−−−−
+−=
(9)
Where I0 is the incident thermal radiation, R is the surface reflectivity of the flux, β
stands for the extinction coefficient values, and Rsystem,copper is the copper mold thermal
heat reflectivity.
0.05
0.1
0.15
0.2
0.25
0.3
0.35
0.5 1 1.5 2 2.5
Thickness of solid mold flux mm
Frac
tion
of h
eat t
rans
ferr
ed to
m
old
I0 is 33-47%, R is 0.103 and 0.598 for glassy and crystalline disks respectively, Rsystem-copper is 0.49, and β is 400 m-1 and 4500 m-1 for glassy and crystalline disks
Figure 15. The fraction of heat transferred versus solid mold flux
It was observed that the transferred radiation part to the mold reduces with the increase of
the solid mold flux. The main reason was due to the dramatic radiation reduction with the
decrease of the liquid flux thickness and the solid flux thermal resistance. The heat flux
transferred through the crystalline phase disk was less than that of glassy one due to the
--glassy phase --crystalline phase

236
large amount of radiation blockage by the flux crystallization, and the fraction of the
transferred radiation reduces from original 47-33% to 27-19% depending upon the
incident radiation fraction. A comparison of the incident radiation portion from the liquid
flux (red bar) and the transferred part through the crystallized solid flux (blue bar) was
given in Figure 16.
0.1
0.2
0.3
0.4
0.5
2 1.9 1.8 1.7 1.6 1.5 1.4 1.3 1.2 1.1 1
Thickness of liquid flux mm
Frac
tion
of h
eat f
lux
Figure 16. The comparison of the incident and transferred radiation fraction
It was clear that the incident radiation, 47% of the overall heat flux from the liquid mold
flux was inhibited by the mold flux crystallization resulting in only 27% of the overall
heat transferred to the mold when the liquid layer is around 2mm as indicated in Figure
16. There was around 20% of the overall heat reduction due to the radiation blockage
from liquid mold flux inhibited by the flux crystallization based upon the difference of
the incident and transferred radiation fraction in Figure 16. The fraction of the attenuated
heat flux versus liquid flux thickness was given in Figure 17, which indicated that the
mold flux crystallization leads to around 20% of the overall heat reduction.

237
0
0.1
0.2
0.3
2 1.9 1.8 1.7 1.6 1.5 1.4 1.3 1.2 1.1 1
Thickness of liquid mold flux mm
Frac
tion
of a
ttenu
ated
ra
diat
ion
Figure 17. The fraction of the attenuated radiation
Conclusions
Experiments were conducted that allowed real casting conditions in the mold flux to be
simulated where the following conditions could be achieved: a liquid at the top, a solid
glassy layer close to the copper substrate and a crystalline layer developed in between.
All layer thicknesses could be varied. The effect of mold flux melting and crystal fraction
dissolution on radiative heat transfer rates has also measured. It was found that the
melting of the solid crystalline flux enhances the incident radiation and results in a higher
overall heat transfer rate in the system due to the minimization of the crystal volume
which in turn to reduce the solid flux thermal resistance. Thus heat transfer rates will be
highest in the meniscus area due to this effect.
Finally, a general heat transfer model has been developed to allow the study of how the
mold flux crystallization modifies the radiation transfer in the meniscus area of a caster.
The contribution of the radiation to the overall heat transfer from the liquid layer could be

238
high, in the range from 33-47%, depending upon the molten flux thickness.
Crystallization of the solid flux would inhibit around 20% of the overall heat transfer rate
in the meniscus area.
Acknowledgement
This research is funded by the Center for Iron and Steelmaking Research membership
companies.
References:
85. J. Savage, and W. H. Pritchard, “The problem of rupture of the billet in the continuous casting of steel”, Journal of the Iron and Steel Institute, Nov. 1954 pp. 269-531.
86. S.N. Singh, and K.E. Blazek, “Heat transfer and solidification kinetics in meniscus zone during casting” Metals Technology, Oct. 1974, pp. 17-27.
87. H. Tomono, P. Ackermann, W. Kurz, and W. Heinemann, “Elements of surface mark formation in continuous casting of steel” Proceedings of the International Conference on Solidification Technology in Foundry and Cast House, The Metals Society, Warwick, 1980, pp. 524-531.
88. H. Tomono, W. Kurz, and W. Heinemann, “The liquid steel meniscus in molds and its relevance to the surface quality of castings”, Metallurgical transactions B, Vol. 12B, 1981, pp. 409-411.
89. I. Saucedo, J. Beech and G. J. Davies, “Heat transfer and solidification kinetics in meniscus zone during casting” Metals Technology Vol. 9, 1982, pp282-291.
90. M.M. Wolf, “History of Continuous Casting”, Steelmaking Conference Proceedings, Vol 75, 1992, pp 83-187.
91. M. Emi, ISS Steelmaking Proceedings. 1991, pp.623. 92. P.V. Ribound, M. Larrecq, “Lubrication and heat transfer in a continuous casting mold”,
Steelmaking Conference Proceedings, The Iron and Steel Society, 1979, Warrendale, PA 93. I. Saucedo, J. Beech and G. J. Davies, “Heat transfer and solidification kinetics in meniscus
zone during casting” Metals Technology Vol. 9, 1982, pp282-291. 94. M Susa, K. Mills, M. Richardson and D. Stewart, Ironmaking Steelmaking, Vol. 21, 1994,
pp.623. 95. Wanlin Wang, Alan Cramb, “Study of the Effect of mold Flux Crystallization on Radiation Heat
transfer” Submitted to AIST Transactions. 96. Wanlin Wang, Ph.D. Thesis, Carnegie Mellon University, Pittsburgh, PA, 2007 97. J. Cho, H. Shibata, M. Suzuki, ISIJ international, Vol. 38, 1998, pp. 268 98. M. Susa, K. Nagata, K.C. Mills, Ironmaking and steelmaking, Vol. 20, 1993, pp. 372. 99. M. Susa, K.C.M., M.J. Richardson, R. Taylor and D. Stewart, “Thermal properties of slag
films taken from continuous casting mould”, Ironmaking and steelmaking, Vol. 21, 1994, pp. 279-286.
100. Y. Shiraishi, Handbook of physo-chemical properties at high temperature, ISIJ, Tokyo, 1988, Ch 10
101. K. Watanabe, M. Suzuki, K. Murakami and T. Shiomi, Tetsu-to-hagane, 83 1997, No. 2, pp115 102. S. Ohmiya, K. H. Tacke and K. Schwerdtfeger, Ironmaking Steelmaking, Vol.10 1983, pp 24. 103. W. Wang and A. W. Cramb, “Model of Radiative Heat Transfer Phenomena in Solid Mold
Flux Phase during Continuous Casting”, Materials Science & Technology 2005, Pittsburgh, PA.

239
Appendix 6:
Final Thesis of Wanlin Wang
Wanlin Wang1, Alan W Cramb2 1 Research Scientist
Reckitt Benckiser North America Innovation Center 1 Philips parkway
Montvale, NJ, 07645 [email protected]
2Dean of engineering John A Clark and Edward T Cross professor
Rensselaer Polytechnic Institute Troy, NY, 12180 [email protected]

1
Table of Contents
Abstract 3
1. Introduction 5
2. Literature Review 10
2.1 Continuous casting technologies 10
2.2 Heat transfer and solidification during continuous casting 14
2.2.1. General heat transfer considerations in the mold 14
2.2.2. Heat withdraw in the mold 17
2.2.2.1. Heat convection from liquid pool 18
2.2.2.2. Heat conduction through the strand shell 19
2.2.2.3. Heat transfer across the gap between the mold and solid mold flux 21
2.2.3. Effect of carbon content of cast steel on heat transfer rate 24
2.3. Understanding of Casting Powders in Continuous Casting 35
2.3.1 General understanding of casting powders 35
2.3.2 Mold flux solidification 36
2.3.3 Slag powder infiltration and consumption 40
2.3.4 Mold flux friction 42
2.3.5 Mold flux thermal and physical properties 43
2.4 Heat Transfer across Mold Flux in Continuous Casting 47
2.4.1 The mechanism of heat transfer across the mold flux 47
2.4.2 The effect of mold flux properties and thickness on heat flux 50
2.4.3 The development of heat simulator 60
2.5 Relation to Current Work 64
3. Experimental Apparatus and Procedures 65
4. A Study of a Solid Mold flux and Its Effect on Radiative Heat Transfer 78

2
4.1 The radiative properties of a mold flux 78
4.2 Effect of the crystalline phase on radiative heat transfer rate 81
4.3 Effect of a glassy disk on the radiative heat transfer rate 89
4.4. Effect of top surface on radiative heat transfer 95
4.5. Modeling of radiative heat transfer in solid mold flux 99
4.6. The Effect of a mixture of phases on the radiative heat transfer rate 106
4.7. Kinetics of slag disk crystallization 109
4.8. Quantification of the effect of crystallization on radiative heat transfer 114
5. The Effect of Crystallization and Melting of Mold Flux on Radiative Heat Transfer Rate 119
5.1 The redesign of the copper mold 119
5.2 The effect of mold flux crystallization on radiative heat transfer 122
5.2.1 Observation of the influence of crystallization on heat flux 122
5.2.2 Quantification of the effect of crystallization on radiative heat transfer rate 130
5.2.3 The Effect of thickness of mold flux on heat transfer 139
5.2.4 The modeling of the heat flux during crystallization 149
5.3 The effect of mold flux melting and crystal fraction dissolution on radiative heat transfer rates 158
5.4. Modeling of overall heat transfer in the meniscus area 168
6. The Effect of the Fe2O3 and MnO Content of a Mold Flux on Radiative Heat Transfer Rates
6.1 The Effect of transition metal oxides on radiative heat transfer rates 177
6.2 The preparation of mold slag disk 178
6.3 Results and discussion 180
6.4 Study of thermal properties of glassy slags 185
7. A Study of Mold Fluxes Used in the Casting of Trip Steels 197
8. Summary, Conclusions and Future Work 210
9. References 217

3
Abstract
In the development of steel technology, continuous casting has become the main process
route for mass production of steel today. 1100 million tons of steel was casted annually
corresponding to more than 90% of the total steel production in the world. Like any other
new process, continuous casting is efficient. However, it also introduces new types of
defects, like oscillation marks, corner cracks, facial cracks, macro inclusions, etc.
Currently, a wealth of experience in industry has been developed to improve slab surface
qualities. Most of the research has indicated that the final cast slab surface is strongly
dependent upon the heat release rate from the steel strand, i.e., heat transfer rate from the
partially solidified strand to caster mold.
Mold fluxes have been widely used to infiltrate in between the caster mold and strand to
moderate the heat transfer rate. The main goal of this study is to explore the effects of
mold flux composition and solidification on heat transfer rates, especially on radiative
heat transfer rates.
It has been shown in the work that both solid crystalline and glassy phase films have
different thermal resistance and affect the radiative heat transfer rate, and the
crystallization behavior of the mold flux is the primary factor affecting the overall heat
transfer rate in continuous casting. By using an infrared radiation emitter, which was

4
developed at Carnegie Mellon University, a radiative heat flux was applied to a copper
mold covered with solid mold flux disk to simulate the radiative heat transfer phenomena
in continuous casting. The solid slag disk could either be glass or a mixture of glass and
precipitated crystals. The kinetics of mold slag crystallization was studied by the recently
developed double hot thermocouple techniques (DHTT) as well. It has been investigated
that the effect of full crystallization of a slag disk is able to reduce the heat transfer rate
by 20% in the meniscus area in this work. By studying the heat transfer mechanism
proposed here, the hypothesis could be used in real casting industry to help moderating
heat transfer rates to eliminate or minimize oscillation marks, to achieve a defects free
final slab.

5
1. Introduction
A large proportion of the steel produced in the world today is by use of the continuous
casting process. A key feature of continuous casting is the oscillation of the mold, which
prevents the steel shell from sticking to the mold. The continuous oscillation between the
mold and steel forces the relative position of steel and mold to continuously change, and
enhances the infiltration of liquid mold flux between the mold and steel strand. Without
this oscillation, continuous casting would not be possible. Continuous casting is efficient,
and brings the ability to produce many shapes: billets, blooms, slabs, and beam blanks,
etc. However, it also gives rise to some specific defects related to the process, such as,
oscillation marks, corner cracks, facial cracks, and macro inclusions, etc. Currently, a
wealth of experience in industry has been developed to improve the slab surface quality.
Most of this research has indicated that the final cast slab surface is strongly dependent
upon the heat release rate from the steel strand, i.e., the heat transfer rate from the
partially solidified strand to the mold.
Heat transfer in the mold is one of the most important phenomena during the continuous
casting of steel, as it strongly influences the surface quality of final slabs. If the rate of
heat flux is excessively large locally, it will thermally induce stresses, which may lead to
longitudinal cracks. On the other hand, locally insufficient heat removal tends to form a
thin strand shell that is more prone to bulging and breakouts [1, 2]. Thus, an even rate of

6
heat transfer is desired. The heat transfer sequence from the liquid pool to the mold
occurs in the following steps:
(1) Convection from the liquid steel pool to the growing steel shell
(2) Conduction through the strand shell
(3) Heat transfer across the mold flux layer infiltrating mold/shell gap which includes
radiation and conduction
(4) Heat transfer across any gap that occurs between the flux film and the mold, i.e. the
contact resistance between the flux and the mold
(5) Conduction through the mold walls
(6) Convection from the mold surface to the cooling water flowing through the mold
Therefore, the mold heat transfer is regulated by those factors that determine the thermal
resistance between the strand and the mold wall, as well as the properties of the flux
infiltrating between the solid shell and the mold wall. The traditional casting parameters,
such as casting speed, steel composition, and casting powder properties have been
recognized as the major controlling operational factors in the rate of heat transport [3, 4,
5], and also the mold geometry, oscillation frequency and hydrogen content in the liquid
steel are related to the heat flux in the mold. Among all of these factors, mold flux
infiltration between the mold and steel shell is widely used to moderate the heat transfer
rate and to achieve an excellent surface quality of the final product of casting. Although
there have been a number of studies of the overall heat transfer rate in continuous casting
[5-12], there are few studies that have focused on the role of radiation heat transfer during
continuous casting. Thus radiative heat transfer rates across the mold flux film will be
the focus of the research in this thesis.

7
Research studies [5-12] carried out to investigate the solidification of steel by mold heat
transfer measurements, due to the strong influence of the heat transfer rate in the mold on
the surface quality of slabs. Mold slags also play some other important roles in
continuous casting, for example lubrication and adsorption of inclusions. It is known that
three layers of the mold flux formed between the strand and mold: a glassy zone close to
the mold, a molten layer in contact with the steel strand and a precipitated crystalline
layer in between, where each layer provides different thermal resistance to the heat
transfer [3, 4, 13]. Therefore, it has been postulated the fraction of crystalline and glassy
phases may control the heat transfer rate in the mold [14, 15]. Although various studies
[16, 17] have shown that the crystallization of a mold flux acts as a key parameter in the
prudent operation of a steel continuous caster, there has been little quantification of the
specifics of mold slag crystallization or of the development of the crystalline fraction
during casting and its effect on the overall heat transfer rate. Quantification of the effect
on this phenomenon on the radiation portion of the heat transfer rate will be a major focus
of this thesis.
As the importance of radiation in continuous casting especially in meniscus area, which
has been quoted in the literature ranging from 20-50%, depending on the thickness of
molten layer [18, 19], this thesis will first study solid mold flux films as well as their
effect on the radiative heat transfer through a copper substrate, where the influence of the
mold flux crystallization fraction on the heat transfer rate can be determined. Then a
study of varying mold flux chemical composition to change mold flux optical properties
to gauge how it affects radiation heat transfer will be carried out. Finally, experiments,
where all three components of a flux film, i.e., a molten layer, a crystalline layer and a

8
glassy layer, are presented, will be conducted to allow the measurement of radiative heat
transfer effects under conditions similar to that found in a continuous caster.
The research of this paper is carried out in the following manners: (1) by development of
a heat transfer simulator for radiative heat transfer; (2) by use of the simulator in
combination with slag disks and a water cooled copper mold to simulate casting
conditions; (3) by application of infrared radiation onto a copper mold that is
thermocoupled and covered with a thin layer of mold flux, which could be glass,
crystalline or a mixture with different degrees of crystallization; (4) by evaluation of the
effect on the mold of thermal radiation by analyzing the response of subsurface mold
temperatures; and, (5) by using an inverse solution of the heat conduction equation, to
calculate the effect of crystallization of a mold flux on the overall heat flux rates.
The further development of the simulator is a novel part of this research, as is the use of
the double hot thermocouple to allow slag crystallization to be fully documented. The
double hot thermocouple technique (DHTT) [20, 21] has been previously developed to
allow the in situ observation of mold slag crystallization under defined thermal
conditions, such that the kinetics of crystal growth could be measured. Previous works
[22-24] using a radiation emitter were focused on the understanding of radiation heat
transfer phenomena on copper surfaces by characterizing the subsurface temperature
response in a copper mold to certain radiative heat fluxes by using subsurface
thermocouples. Thus, the effect of complex radiative phenomena could be analyzed by
measuring the response of the subsurface temperatures in the copper mold. A
combination of both of these techniques leads to the research described in this thesis.

9
Before this work, it was hypothesized that the effect of mold slag crystallization could be
measured dynamically in such a set-up and that the effect of mold flux crystallization on
radiative heat transfer could be quantified using such a set-up. This thesis will describe
the development of the experimental technique and its successful application in the
determination of radiative heat transfer rates through mold fluxes. The effect of mold flux
crystallization on radiative heat transfer will be clearly demonstrated, as will the effect of
the addition of the transition metal oxides content of a mold slag.

10
2. Literature Review
2.1 Continuous casting technologies
The technology for the transformation of liquid steel into hot strip has experienced a
number of revolutions in the last 50 years. The advent of continuous casting was,
however, the major breakthrough in the history of steel casting. It has taken over from
ingot casting and is now the dominant technology for casting liquid steel. In the early
70’s, less 10% of the total steel in the world was manufactured by continuous casting,
then it grew to 50% in the middle of 80’s, and it reached more than 90% of the total 1011
million tons of steel produced in the year 2006[25]. The following figure gives a
schematic global share of continuous casting steel over the past 30 years.
0
10
20
30
40
50
60
70
80
90
100
1970 1975 1980 1985 1990 1995 2000 2005
Year
Ratio
in %
Figure 2.1: Global share of continuous casting steel over the years [26]
China
Japan
USA
World

11
The general view of a continuous slab caster is given in Figure 2.2 [27]. The molten steel
flows from a ladle, through a tundish into the mold. The tundish, a vessel that regulates
the quantity of liquid iron that enters the mold, holds enough metal to provide a
continuous flow to the mold. In addition, it enhances oxide inclusion separation and
stabilizes the flow patterns of steel in the mold. The liquid metal then flows into the mold
through ceramic submerged entry nozzles. The liquid steel must be protected from
exposure to air by using slag powders to cover its top surface and by using a ceramic
nozzle between the tundish and the mold.
Figure 2.2: General view of a continuous slab caster [27]
Tundish

12
The mold, made of a copper alloy, is water cooled, such that once metal exits the mold at
the other extremity, the solidified shell is thick enough (1-2 cm) for the strand to support
itself. In order to prevent the metal sticking to the mold and to facilitate movement, not
only is lubrication needed (either oil or slag), but the mold oscillates vertically. The
inside faces of the mold are coated with materials like nickel and chromium to increase
mold life and avoid defects due to copper pick up from the mold during continuous
casting. These molds are typically 1 meter long, and the steel needs about 20 seconds to
one minute to go from the nozzle to the exit of the mold [27, 28]. The strand progresses at
a speed varying between a few tens of centimeters per minute and a few meters per
minute. The role of the mold is crucial: not only a sufficient amount of heat must be
removed to form a solid shell, but improper conditions of heat transfer may result in
defects in the final product. The most important part of this process is the initial
solidification at the meniscus, which is where the top of the shell meets the mold, and the
liquid surface. This is the place where the surface of final product is developed, and it is
also the original source for the formation of oscillation marks, surface cracks and other
defects. Mold slag powders are added to the liquid steel surface in the mold and cover the
meniscus area. It then infiltrates the gap between the stand and copper mold to lubricate
the contact, protect the steel from air, absorb inclusions and provide a thermal resistance
to moderate heat transfer rates.
Drive rolls lower in the machine continuously withdraw the shell from the mold at a
“casting rate” that matches the incoming flow rate, such that the whole process is in a
steady state. As the skin cools and contracts, a gap forms between the wall and the strand,
which fills with mold slag and leads to a decreased heat transfer rate, for this reason most

13
molds are tapered to account for shrinkage as the steel shell cools. Upon leaving the mold,
the steel shell is not strong enough to support the internal pressure caused by the column
of liquid steel yet to solidify, thus it is supported by closely spaced rollers. Water or air
mist sprays cool the surface of the strand between the supported rolls. The strand is then
bent to the horizontal position while it is rigorously water or air cooled, so that the mostly
liquid strand is totally solidified within the containment length of the machine. Finally,
when fully solidified, the strand is cut into pieces by a cutting torch.
Different continuous casting processes produce different cross sectional shapes and sizes.
Four piece plate molds with rigid backing plates are used to cast large and rectangular
slabs; while single piece tube molds are used to cast small, square billets that could be
rolled into long products, like nails, rails, etc.

14
2.2 Heat transfer and solidification during continuous casting
Heat transfer in the mold is one of the most important phenomena during the continuous
casting of steel, as it strongly influences the surface quality of cast slabs. A significant
amount of work has been done to characterize the heat transfer conditions in a continuous
casting mold [5, 6, 10, 29-34]. Occurrence of surface defects on a continuous cast steel
slab is strongly influenced by the heat transfer rate during initial solidification of the slabs
in mold. An excessively large local heat flux can cause longitudinal surface cracks on the
slab [10], and hence control of the heat flux in the mold is an important issue to produce
defect free slabs.
2.2.1. General heat transfer considerations in the mold
As the importance of heat transfer in the mold has been realized, research has been
conducted to explore the overall heat transfer behavior and its influence on final slab
quality. For example, some research and plant data indicate that if the rate of heat flux is
excessively large and varied across the width, it will thermally introduce stresses, leading
to longitudinal cracks. On the other hand, insufficient local heat removal tends to cause a
thin strand shell that is more prone to bulging and breakouts. Therefore, the general heat
transfer or the method of heat removal in continuous caster mold must be understood.
When the liquid steel flows from the submerged entry nozzle into the copper mold, it
brings a large amount of super heat as casting temperature are 20 to 50 Co above the
liquidus. The mold must be cooled by the flowing water to remove the super heat from
the liquid steel and then the latent heat in order to initiate the solidification of steel during
continuous casting. The slag powder that covers the top of the liquid steel pool to prevent

15
the oxidation of steel will form a liquid layer and infiltrate any gap between the strand
and copper mold as shown in Figure 2.3. Therefore, there exists an extreme temperature
gradient from the steel shell through mold flux to the mold.
Figure 2.3. The schematic figure of the top of the mold [78]
The corresponding schematic of temperature profile and thermal resistance is shown in
Figure 2.4. Therefore, the heat transfer sequence from liquid/solid interface to the mold is
mainly considered as following steps:
(1) onvection from the liquid steel pool to the growing steel shell
(2) Conduction through the strand shell
(3) Heat transfer across the mold flux layer infiltrating mold/shell gap, which

16
includes radiation and conduction
(4) Heat transfer across the gap separating the flux film and mold, i.e. the contact
resistance between the mold slag and the mold
(5) Conduction through the mold walls
(6) Convection from the mold surface to the cooling water flowing through the mold
Figure 2.4. Schematic temperature profile and heat transfer resistances across shell to mold
Therefore, the mold heat transfer is regulated by those factors that determine the thermal
resistance from the strand to the mold: (1) conduction resistance from solidified shell, (2)
thermal resistance from liquid and solid mold flux layers, (3) contact resistance at the
interface between the solid flux and mold, and (4) conduction resistance from the mold.
Traditional casting parameters like casting speed, steel composition, and casting powder
Temperature
Position
Flux (melt)
T mpt
Shell Flux(Cry. &Glass)
Mold
Tshell
R1 R2 R3 R3 R4 R5
Tmold Tflux
Contact resistance

17
properties have been recognized as the major controlling factors in the achieved heat
transfer rate [35, 36].
Among all of these factors, mold flux infiltration between the mold and steel shell is
widely used to control the heat transfer rate to achieve an excellent surface quality of the
final slab product.
2.2.2. Heat withdraw in the mold
The molds used in continuous casting are copper alloys and cooled with water, where the
cooling length is usually around 600 mm. Mold flux is widely used in continuous casting
as a lubricant, which is made of mineral materials that fuse to form the slag. The melting
range of the flux is around 1100-13000C, depending upon its chemical composition. The
part in contact with hot strand would be liquid. Since there may exist a high cooling rate
between the hot slag and the copper mold, the layer close to copper mold would be
initially a solid glass phase. There will be heterogeneous zone between the liquid and the
solid parts consisting of a crystal-melt mixture. The shrinkage, because of thermal or
solidification contraction will be addressed in detail later. Local gap formation may occur
between the mold flux and mold. Therefore, the mechanism of heat transfer across the
strand to copper mold is complex, involving thermal resistances in the molten steel, shell
strand, mold flux, gap, and copper wall as shown in Figure 2.4. Some literature reviews
about heat transfer from the liquid pool to copper mold according to the steps as shown in
section 2.2.1 are summarized in the following sections.

18
2.2.2.1. Heat convection from liquid pool
The superheat absorbed and carried by the liquid steel, which is proportional to the
molten steel heat capacity, cp, the temperature gradient, ΔT, and the liquid volume, V,
i.e., TVcq vpsh Δ= , , must be removed before the solidification of liquid steel, and the
super heat is not uniformly distributed due to turbulent convection in the liquid pool.
Meng and Thomas [37] have stated that the super heat flux, qsh, which dissipates to the
solid/liquid interface, is a function of the distance below the meniscus, they also found
that the super heat flux varies linearly with super heat temperature difference and it is
proportional to casting speed. Meng and Thomas then adjusted the super heat flux
function corresponding with current superheat temperature difference, spTΔ , and casting
speed, Vc, as following equation.
co
spo
cspsh
osh vT
vTqq
Δ
Δ= (2.1)
where qosh is the superheat flux from the database with conditions of the matched super
heat temperature difference ΔTosp and casting speed Vo
c. The Figure 2.5 gives one
example of the superheat flux function, which represents results for a typical bifurcated,
downward-directed nozzle. It is shown that the influence of this function is insignificant
to shell growth over most of the wide face.

19
Figure 2.5. Model of solidifying steel shell domain showing heat flux conditions [37]
2.2.2.2. Heat conduction through the strand shell
As the solidification of the strand shell, the latent heat from molten steel will dissipate to
the thin shell, leading to the heat conduction through the thin steel shell in a slab mold,
which is governed by the transient heat conduction equation. The inverse heat conduction
method for estimating the heat flux history for a solid by utilizing measured transient
interior temperature was adopted as follows. The 1-D transient heat conduction equation
is:

20
)(**xTk
xtTC p ∂
∂∂∂
=∂∂ρ (2.2)
here Cp, ρ, k and T are steel heat capacity, density, thermal conductivity and temperature
of the shell. If the thermal conductivity of the solidified shell is varying with the
thickness x, the inverse heat conduction equation would be changed to:
xT
xk
xTk
tTC p ∂
∂∂∂
+∂∂
=∂∂ )(** 2
2
ρ (2.3)
The inverse solution methodology for this type of problem was developed by Beck and if
one has knowledge of the temperature profile in the mold as a function of time, it is
possible using Beck’s algorithm to calculate a corresponding heat flux that accounts for
the measured temperature profile.
The simulation domain for this portion of model moves downward at the casting speed as
shown in Figure 2.5 where the shell thickness, m, can be calculated by balancing the heat
flux with the latent, and superheat removed during casting as Schwartz solution. The
temperature profile within the shell firstly was assumed to fit the semi-infinite Stefan
solution as:
)2
()(t
xerfTTTTshell
ss α−+= ∞ (2.4)
where Ts is the interface temperature between the flux and shell, α means the thermal
diffusivity of the shell and t is time. Then the thickness m of the shell could be derived
with the boundary conditions of the temperature profile as:

21
tm shellαλ2= (2.5)
As is found in reality, solutions yield a square root of time expression. The details of heat
transfer across the mold flux will be address in section 2.4.
2.2.2.3. Heat transfer across the gap between the mold and solid mold flux
When the temperature along the strand surface drops below the melting point of mold
flux, the layer will become completely solid. As indicated before there may be an
intermittent gap between the solid mold flux and the mold. Any gas in the gap is mainly
due to air aspiration, penetrating into the gap from the lower end of the mold and consists
of nitrogen due to the removal of most oxygen from the air by reaction with the strand
surface. It may contain some water vapor in the upper part of the mold, hydrogen
generated by reduction of water by the steel surface, and some carbon dioxide and
monoxide from various reactions.
Ohmiya [13] and Holzhauser [39] have carried out the research of heat transfer over a gas
gap contained between two parallel metal plates. Holzhauser, etc. plotted heat flux
against the hot strand surface temperature To as shown in the following figure, and the
cold mold surface temperature Tm was given in the second figure. It was clear that the
heat flux through gap was a strong function of the mold temperature, and gap distance,
which was enhanced by high mold temperature and small distance.

22
Figure 2.6. Heat transfer through gap filled with nitrogen-hydrogen gas [39]
The overall heat flux across the gap could be written as the sum of conductive and
radiative parts as suggested by Siegel and Howell [40].
rc qqq += (2.6)
which were independent of each other and are given as:
dxdTkq gasc = (2.7)

23
1)(
110
40
4
−+−
= −−m
mr
TTqεε
σ (2.8)
Since the thermal conductivity for 95% N2 and 5% H2 is expressed as:
)/(1032.61090.5 68.1868.0422 mKWTTk HN
−−− ×+×= , the calculated conduction heat
transfer flux, the total heat flux was given as follows:
1)()(1036.2)(1051.3
11
440
68.268.2868.168.10
4
−+
−+
−×+−×= −−
−−
mo
m
gap
mom TTd
TTTTq
εεσ
(2.9)
Hiroyuki, etc [41] investigated the interfacial thermal resistance between the copper mold
and mold flux by pouring molten mold flux onto copper plate, and recording the mold
temperature and subsurface temperature histories. The interfacial thermal resistance was
calculated by the measured heat flux through copper mold and the mold surface
temperature change.
Figure 2.7. Calculated interfacial thermal resistance for different mold flux [41]

24
The resistance values are in good agreement with previously reported by Nakato et al
[42] (3-9 cm2 KW-1), and Yamauchi et al. [43] (4-8 cm2 KW-1).
2.2.3. Effect of carbon content of cast steel on heat transfer rate
The effect of the carbon content of cast steel has been regarded as one important factor
controlling the overall heat transfer rate in continuous casting, because the carbon content
tends to affect the final slab surface, which in turn influences the overall heat transfer rate
[6, 34]. In the early mold simulator studies, Singh and Blazek [6] investigated how the
surface rippling phenomena in low carbon steels influenced the overall heat transfer rates
by employing a stationary continuous casting mold simulator without mold flux.
Measurements of the cast steel shell thickness were taken and were shown in Figure 2.8.
They found that the low carbon steel exhibited a dramatically rippled surface at 0.05% C;
however, the high carbon (0.9%) was relatively smooth.
Figure 2.8: Thickness of the shell in the mold below meniscus [6]

25
The mold was instrumented with thermocouples to determine the mold thermal
distribution and to examine its dependence upon the carbon content of the steel being cast.
It was found that the mold temperatures reduced significantly when casting steels with
carbon content around 0.1%, which could be explained as the 0.1% carbon steel has the
roughest surface as shown in Figure 2.8. Therefore, the corresponding in-mold
temperatures were lowest due to the least contact between the steel shell and the mold.
The in-mold heat transfer rate was calculated by the cooling water temperature gradient.
The relative results of the effect of carbon content of steels on the overall heat transfer
rates were shown in Figure 2.9. It has been found that the mold heat transfer rate had a
sharp minimum for steels with 0.10%C, and that the mold heat flux was independent of
the steel carbon content when the steel carbon composition is above 0.3% C as shown in
Figure 2.9.
Figure 2.9: Effect of carbon content on mold heat transfer rate during continuous casting [6]

26
Grill and Brimacombe [34] conducted a further research of the carbon content and its
effect on heat transfer rates via statistical analysis of the data that acquired from industrial
continuous casting machines. Their finding pointed out that the mold heat transfer rate
achieved a maximum at 0.3%C and decreased with increasing carbon contents above
0.3%, as is shown in Figure 2.10.
Figure 2.10: Influence of carbon content of steel cast on overall mold heat flux [34]
They even proposed a more refined mechanism of the surface rippling for low carbon
steels. Since there is a rapid cooling (>100oC/s) outside of copper mold, which allows a δ
to γ phase transformation on the mold side of the shell, while the liquid side remains
unchanged δ phase. This transformation is maximized at 0.10%C, which induces a tensile
stress on the mold side while a compressive stress is developed on the liquid side. Thus a
gap is formed due to the steel shell bending into the liquid steel when the forces on the
shell overcome the ferrostatic pressure. Therefore, the local heat transfer rate across the
gap attenuated, which in turn leads to the localized heating of the shell in the vicinity of

27
the bending gap. This localized heating will reduce the strength of the shell enough that
the ferrostatic pressure can cause the shell to re-bend towards the mold.
Sugitani and Nakamura [44] suggested the initial solidified shell deforms in the convex
way instead of the concave way of Grill and Brimacombe where they thought that the
shrinkage of the shell around liquid/solid interface is larger than that of subsurface.
Suzuki etc. [45] carried out experiments to understand the heat transfer anomaly and
solidifying shell deformation of peritectic steels in continuous casting. In their
experiments, they found that the calculated heat flux from the temperature measurement
for 0.126 mass% C steel exhibits a lower value than that of others as shown in following
figure.
Figure 2.11. Heat flux on the mold surface vs time from the start of casting [45]
The peak value of the heat flux is given in Figure 2.12 as a function of carbon content.
The peak heat flux for peritectic medium carbon is much lower than that for others,
similar to the observation of Singh and Blazek.

28
Figure 2.12: The effect of carbon content on the heat flux [45]
They pointed out that peritectic medium carbon steels exhibit an anomalous decrease of
the heat flux on the mold surface, due to the surface roughness of the solidifying shells,
whereas ultra low carbon steel exhibits large heat flux despite large surface roughness.
The difference is caused by the fact that the roughness of ultra low carbon arises from δ/γ
transformation which occurred later than the completion of solidification. The shrinkage
of the solidifying steel of peritectic medium carbon steel becomes significant just after
the start of solidification and the shrinkage rate remains the largest among others.
However, Suzuki did not explain well what the exact mechanism of the initial steel
deformation, it is due to δ/γ transformation or due to the different solidification rate or
something else.

29
2.2.4. Effect of casting speed on heat transfer rate
As an important effect on heat transfer rate, casting speed has been studied intensively in
the early 50s. Savage and Pritchard [5] pointed out that: the local heat flux on the mold is
only function of the residence time of the steel in the mold.
Wolf [28] conducted a broad survey of mold heat flux measured in plant operations.
Based on observations of plant measurements, Wolf determined that in oil lubricated
castings, the carbon content of the steel and the mold geometry had the strongest
influence on the heat flux; while the slag viscosity was the controlling factor for mold
flux lubricated casting. The relationship between average heat flux on the mold in a
closed pouring mold with slag powder and the residence time of the steel in the mold, tm
is: 5.013700 mt≈Η . Blazek et al. [46] stated that the mold flux reduces the heat transfer
rate in the mold. In addition, results were also presented showing the relationship
between the mold heat transfer rate and the casting speed in Figure 2.13. However, they
did not give much more explanation of why the increase of casting speed leads to a
higher heat flux in the continuous caster mold.

30
Figure 2.13: Effect of casting speed on the mold heat transfer rate for 0.1% carbon steels [46]
The assumption of the residence time was proved by Gilles [47] who proposed that even
though the heat flux increases with increasing casting speed, the heat flux could be
normalized by considering the heat flux as a function of time from the meniscus instead
of distance from the meniscus. It was found that the heat flux data converges to a single
curve for a wide range of casting speeds (0.6 – 2.0 m/min) as shown in Figure 2.14.

31
Figure 2.14: Normalized local mold heat flux for low carbon strip grade [47]
Meng and Thomas [36] did some simulation work of heat transfer versus casting speed
model. They found that decreasing the powder consumption rate at constant casting speed
(case 2) will enhance the heat flux in the top portion of the mold compared with standard
condition (case 1), because the average thickness of the mold flux layer reduces in case 2,
lowering interfacial resistance as shown in Figure 2.15.

32
Figure 2.15. Effect of casting speed on heat flux profile [37]
The practical case of increasing casting speed and simultaneously reducing total powder
consumption rate (case 3) will enhance heat flux toward the bottom of the mold. This is
due to the lower thermal resistance of a thinner steel shell produced with less
solidification time, which becomes predominant with distance down to the bottom of
mold. The net result of increasing casting speed is to increase heat flux almost uniformly
down to the mold, which is reflected in Figure 2.16 as the uniformly higher case 3
temperature.

33
Figure 2.16. Effects of casting speed on mold temperature [37]
The faster casting speed usually leads to a shorter solidification time and cause a thinner
steel shell and higher steel surface temperature, so that the liquid slag layer persists
further down the mold as shown in Figures 2.17 and 2.18, proving a lower thermal
resistance from the liquid pool to mold resulting in a higher heat flux in the mold.
Figure 2.17. Effect of casting speed on shell thickness [37]

34
Figure 2.18. Effect of casting speed on shell surface temperature [37]

35
2.3. Understanding of Casting Powders in Continuous Casting
2.3.1 General understanding of casting powders
It is well known that casting powders play a decisive role in lubrication and heat transfer
control in the continuous casting mold. Mold fluxes are synthetic slag powders mixture of
different oxides: silica, alumina, lime, soda, and some fluorides. The structure of slag is
based on the SiO42- tetrahedron, which forms a silicate chain. Properties are adjusted by
adding glass formers (Al2O3, B2O3), modifiers (CaO, MgO, SrO, Na2O, Li2O and K2O)
and fluidizers (F-) [48]. For instance, an increase of the crystallization temperature with
the CaO/SiO2 ratio has been reported, while Li+ and B2+ showed an extraordinary effect
for lowering viscosity [49]. Regarding the viscosity, CaO and Na2O, as chain breaking
oxides, tend to disrupt the tetrahedral network and thus cause shorter chains and decrease
viscosity. On the contrary, increased SiO2 content strengthens the network, rendering it
more viscous. Mold flux properties can also be affected by pick-up of species like Al2O3
from the liquid metal. Silica rich mold flux, for instance, are known as easy glass
formers, while CaO rich mold flux are extremely difficult to quench as a glass and
crystallize just below the liquidus.
Besides lubrication, other secondary roles of mold flux have been listed [48]:
• protect molten steel from oxidation if the mold flux is low in oxides like Fe2O3 or
MnO

36
• modify heat transfer between mold and strand
• absorb inclusions at the top surface of the liquid steel
• thermally insulate the top surface of liquid steel, preventing its partially freezing,
including freezing of the meniscus
2.3.2 Mold flux solidification
Once the liquid layer of the slag powder covering the top of molten steel pool infiltrates
into the gap between the strand and the mold, the solidification of the infiltrated liquid
slag will be initiated due to the huge temperature gradient from the strand to the mold as
shown in Figure 2.19. The understanding of mold properties as well as its solidification
behavior is the base for the optimization of the continuous casting due to the import roles
that the mold flux solidification plays, like modifying the overall heat transfer rate, etc.
Generally, it has been accepted that the larger portion of crystallization of the mold flux
in the liquid slag layer or the precipitation of crystalline solids from the molten mold
slags tend to inhibit overall heat transfer rates, which was confirmed from laboratory
experiments [28] and in plant trials [16, 29]. Susa, et al. [15] has studied the thermal
properties of slag films taken from continuous casting, and finally concluded that the
crystallization of the slag is the primary factor affecting the heat transfer rate via radiation
and conduction; the effects of transition metal oxide on the thermal properties results in a
minor influence on heat flux compared with crystallization. Therefore, it is necessary to

37
understand the precipitation of crystalline solids, the growth of these crystals and how
this crystallization affects heat transfer rate in continuous casting.
Figure 2.19. General figure of the mold flux in continuous casting [78]
In order to understand the precipitation of a second solid phase from a liquid, the thermal
field and phase diagram should defined and the crystals nucleation and growth
mechanism should be studied. Such that the conditions under which glass formation is
possible and the conditions under which the solidification is initiated could be described.
Therefore, the construction of isothermal time temperature transformation diagrams (TTT
curves) is desirable to understand crystals growth rate, evolution with time under
different cooling conditions. Thus, the crystallization of mold flux and how it modifies
LIQUID FLUX
SOLID FLUX
MENISCUS REGION
CO
PPER
M
OL
D
OM
Glass layer
MENISCUS 1 mm
MOLTEN STEEL POOL
ARGON BUBBLES
Metal entry from nozzle
Crystalline layer
STEELSHELL

38
heat transfer rate in continues casting could be researched. A new technology developed
by Kashiwaya, et al. [20] at Carnegie Mellon University, the Double Hot Thermocouple
Technique (DHTT), was successfully developed to allow the study the kinetics of mold
flux crystallization. An example TTT diagram constructed upon DHTT is shown in
Figure 5.20, where the crystals growth rate could be clearly measured in function of time,
cooling rates, etc.
Figure 2.20 A example TTT diagram from Kashiwaya [20]
Various studies as indicated before have shown that the slag film infiltrated between
mold and strand contains three layers: a glass zone close the mold, a crystalline layer in
the center and a liquid layer in contact with the shell, because of their chemical
composition and the variety of temperature gradients between the hot steel strand and the
cold water-cooled mold.

39
Figure 2.21 Sample of slag layer and its microstructure [62]
A 20cm long piece of slag film taken from the corner of an operating caster mold was
shown in Figure 2.21(a). Many researchers believe that a glassy slag layer forms against
mold wall due to the high cooling rates during initial contact of the molten slag with the
water-cooled copper mold. A liquid layer is present when the shell surface temperature is
higher than the melting point of the slag powder. The crystalline phase forms in between
the molten layer and the solid glass mold flux layer as shown in Figure 2.21.

40
2.3.3 Slag powder infiltration and consumption
When casting powder is fed on top of the liquid steel, the carbon added with the powder
will combust due to the high temperature and source of oxygen. After that the powder
will start to sinter and melt and eventually produce a pool of liquid slag covering the
surface of the liquid steel. During each oscillating stroke, the liquid slag is pumped from
the meniscus into the gap between the steel shell and the mold wall to act as lubricant.
The re-solidified mold powder adjacent to the mold wall cools dramatically to form solid
glass phase layer. The solidified portion is thicker near and above the meniscus area,
where it is called the “slag rim”. The relatively solid slag layer often sticks to the mold
wall, although it is sometimes dragged intermittently downward at an average speed less
than the casting speed [50]. When a solid layer stably attaches to the mold wall, the
remaining liquid slag layer will move downward, causing slag to be consumed at a rate
balanced by the replenishment of solid slag powders which were put from the top surface
of mold, as long as the steel shell temperature remains above the mold flux crystallization
temperature. It is of importance to know the quantity of mold flux that actually infiltrates
the gap as it influences heat transfer rate, and it changes the thickness of the liquid slag
layer and modifies the temperature distribution. One part of the slag solidifies until the
thickness of this phase reaches a certain limit [51], whereas the other part is consumed.
Solid thickness is usually 1 or 3 mm; however, the liquid film thickness us around 0.1-2
mm [4]. Consumption of flux increases with decreasing viscosity and decreasing
oscillation frequency, while increasing withdrawal speed doesn’t have any effect.
Increasing steel temperature also increases powder consumption [52, 53]. It is often

41
expressed in Kg/m2, given that it is proportional to the surface of the mold. It can be
measured by weighing the slag remaining on top of the meniscus at the end of the
sequence.
Wolf [28] established an empirical relation for flux consumption:
1.016055.05.0
2 +⎟⎟⎠
⎞⎜⎜⎝
⎛⎟⎟⎠
⎞⎜⎜⎝
⎛=
cVfQ
μ (2.10)
here f is oscillation frequency, Vc means oscillating velocity, and μ represents for
viscosity. Another empirical correlation was established between the flux consumption,
the positive strip time tP and a new parameter defined as negative strip area ratio RNA (i.e.
the distance covered by the mold over the steel shell during the negative strip time over
the total distance covered by the mold during one cycle) [54]. The following formula was
obtained:
Flux consumption = 0.047+0.202.RNA0.3.tP
0.5 (2.11)
T. Emi et al.[55] studied variation of slag thickness when viscosity, withdrawal speed and
oscillation frequency varied. He based his results on the average slag consumed, so the
results he got concerned only the liquid layer of slag.

42
2.3.4 Mold flux friction
Powder lubrication leads to more uniform and usually lower heat transfer rates compared
with oil lubrication [56]. Therefore, layers of mold slag comprise a large resistance to the
heat removal, although they provide uniformity relative to the alternative of an
intermittent vapor gap found with oil casting of billets. Heat transfer across the mold flux
depends upon the thickness of the mold flux layer [57], and its thermal properties, like
thermal conductivity, crystallization temperature, viscosity, and its state [58]. It was
reported that the slag conductivity dominates heat transfer across the crystalline layer.
However, radiation has a larger contribution through glass and liquid layer. Crystalline
slag flux with high solidification temperature reduces mold heat transfer, due to the lower
conductivity of crystalline slag and the thicker solid layer. Usually the slag conductivity
depends mainly on the crystallinity of the slag layer and on the internal evolution of its
dissolved gas to form bubbles.
The hydrostatic pressure of the molten steel forces the unsupported shell against the mold
wall, causing friction between the strand shell and the oscillating mold. Especially, the
friction becomes significant at the bottom of the narrow faces due to the excessive taper
which squeezes the wide face shell. Misalignment of the mold and strand will increase
friction, if the stroke is large. Suzuki al et [45] pointed out that friction can cause fracture
of the solidified layer which gives rise to local heat flux fluctuations, and the
accompanying temperature and stress variations in the shell could lead to quality
problems, like shell tearing, sticking and even breakouts [59,60]. Emling and Dawson
[61] suggested that if the friction signal were better understood, friction monitoring could

43
be used to identify the status of mold lubrication to predict surface defects and to help
prevent breakouts. Shrinkage of the steel shell away from the mold walls may generate
contact resistance or air gap, which act as a further resistance to heat flow, especially
after the slag is completely solid and unable to flow into the gaps. The surface roughness
depends on the tendency of the steel shell to ripple during solidification at the meniscus
to form an uneven surface with deep oscillation marks, which depends on the oscillation
practice, the slag rim shape and properties, and the strength of the steel grade relative to
ferrostatic pressure, mold taper, and mold distortion.
2.3.5 Mold flux thermal and physical properties
2.3.5.1 Refractive index
When the light travels in a mold flux layer, it tends to interact with ions. The refractive
index of slag, n, gauges the magnitude of the interaction between light with ions in slags
causing the decrease in the velocity of the absorbed radiation and changes in the
direction. Therefore, the larger the refractive index is, the stronger the interaction will be.
It can be measured with a refractometer or ellipsometer [63], but the measured value
depends on the slag composition, incident wavelength, the surface condition and the

44
liquid used. The refractive index value for glassy mold fluxes at room temperature ranges
from 1.58 to 1.7. It also could be calculated by a simple empirical equation [79].
∑=−
i
ii
MNn
100)1(
ρ (2.12)
where n stands for refractive index, ρ means the density (g cm-3) of the slag, and Ni and
Mi are the specific refractive index of the various oxides in the slag, and mass %
respectively.
2.3.5.2 Extinction coefficient
When there is an incident light applied to a mold flux sample, some portion would be
reflected; the rest will be absorbed and transmitted. Once the absorbed photon travels
through the medium, there is an exponential decay according to experimental results and
theoretic derivation, and this exponential decay was defined as Beer’s law. Therefore, the
part of energy transmitted through the medium is strongly depending upon this
attenuation part and described as equation 2.13.
)exp( dβτ −= (2.13)
where τ is transmittance, β is extinction coefficient and d is thickness. The extinction
coefficient, β, is composed by two parts, i.e., σαβ += where α stands for the absorption
coefficient, and σ presents scattering factor. As the scattering factor in glassy phase is

45
rather small due to its amorphous structure, the extinction coefficient for solid glass flux
usually could be express as absorption coefficient α. The extinction coefficient can be
measured by measuring the transmittance of a sample, whose length is known, with a
spectrometer. It is a function of the wavelength and the temperature, but is also dependant
of the slag structure. The value for crystalline slag can vary between 1000 and 30,000 m-1
and from 100 to 1000 m-1 for glassy slag [68]. Since the wavelength in the continuous
casting is in the regime of infrared, the wavelength has limited effect of the extinction
coefficient as shown in the Figure 2.22.
Figure 2.22. Absorption coefficient versus wavelength at room temperature [68]
As for the chemical composition, Susa et al. [76] reported that the absorption coefficient
decreases with the increasing of basicity in the range of 0.35-1 um for the system of
SiO2-Fe2O3-CaO-Al2O3, and they also concluded that the absorption coefficient is also
increasing with the addition of Fe+3 ions. J. Cho et al. [68], reported that the selected
absorption coefficient and extinction coefficient observed at different temperatures do not
show abrupt changes for all wavelengths as shown in Figure 2.23. Averaged extinction

46
coefficients show a small increase with the increase of temperature due to an enhanced
scattering factor at an elevated temperature.
Figure 2.23 Change of absorption and extinction coefficient with temperature [68]
2.3.5.3 Heat capacity
Measurement of heat capacities for a glassy slag usually leads to values ranging between
1 and 10 J/(K•kg), since it usually changes with the variance of temperature and the
presence of glass transition temperature. An example of the mold flux heat capacity
varies with the temperature is given in Figure 2.24, where the glassy specimen is depicted

47
as the dotted line. Thus, the measurements of heat capacity, Cp, are difficult. The values
can be also obtained by Differential Scanning Calorimetry (DSC) [4].
Figure 2.24. Heat capacity of mold flux as function of temperature [63]
2.4 Heat Transfer across Mold Flux in Continuous Casting
2.4.1 The mechanism of heat transfer across the mold flux
It is known that the mold flux film beneath the meniscus consists of two vertical parallel
layers, a molten layer and a solid layer (crystal and glass film). The two layers provide
the film with thermal resistance to the conductive and radiative heat transfer in the mold
[19], and each part of the layer plays a different role on the heat transfer.
Due to the high temperature inside the mold, the heat transferred from liquid steel across
mold flux to the caster mold through two mechanisms, i.e., lattice (photon) conduction
and radiation. Therefore, the overall heat flux across the flux has been determined by a

48
“defined” effective thermal conductivity of the mold flux, keff, and the flux temperature
gradient, ΔT, over the thickness of the flux, d, as:
dTkq eff
Δ= (2.14)
For the semitransparent flux, this effective thermal conductivity keff, is usually split by
the lattice conductive thermal conductivity, kc, and radiative thermal conductive term, kr,
in following equation:
rceff kkk += (2.15)
In the liquid layer of the flux, the radiation conductivity kc is usually defined by:
ασ3
16 32Tnkr = (2.16)
where σ is the Stefan-Boltzmann constant, n stands for the refractive index, α represents
the absorption coefficient, and T is the temperature (usually melting point) of the flux.
Therefore, kr is around one order of magnitude higher than kc, where it can go up to 12.76
W/(mK) [73], and radiative heat flux is considered to dominate in the molten liquid flux
layer.
As for the solid mold flux, it is usually composed by a crystalline layer developed
towards the glassy layer adjacent to the mold. Therefore, it is quite difficult to split the
overall heat flux into radiation and conduction. Yamauchi, etc. [43] reported the kc for a
solid mold flux with low solidifying temperature is around 1.04 W/(mK), and kr for the
same mold flux was around 0.24 W/(mK) determined via the gray gas approximation
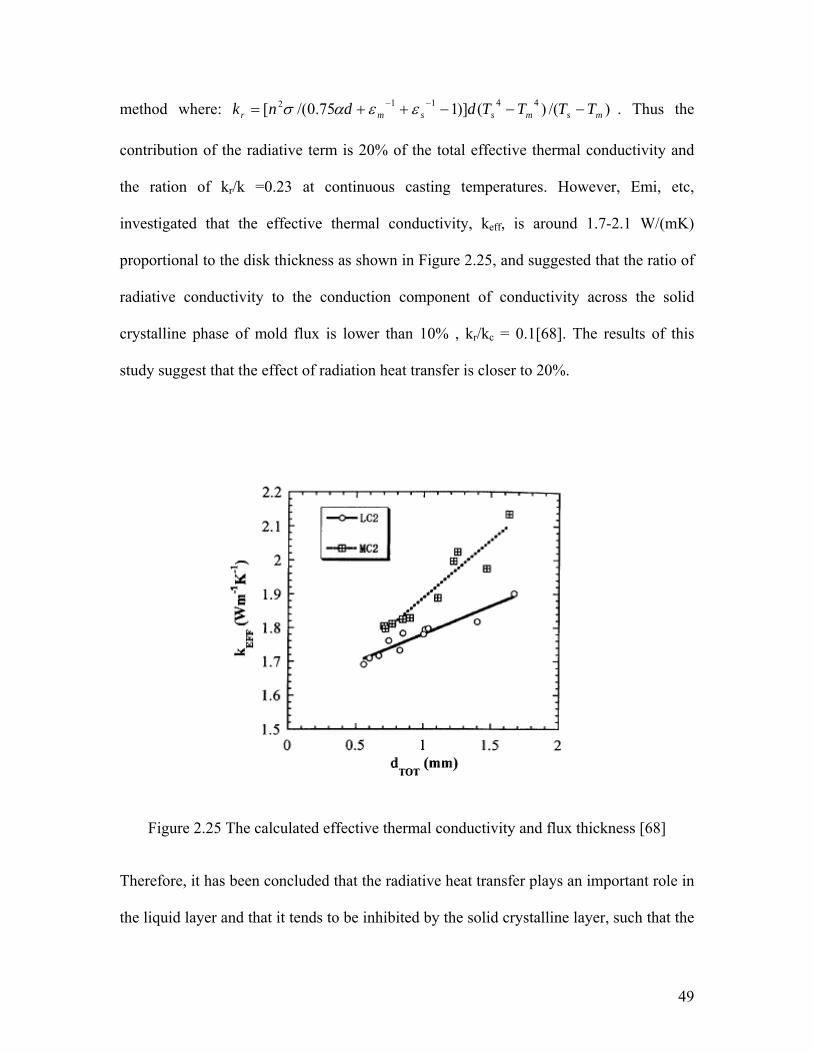
49
method where: )/()()]175.0/([ 44112msmssmr TTTTddnk −−−++= −− εεασ . Thus the
contribution of the radiative term is 20% of the total effective thermal conductivity and
the ration of kr/k =0.23 at continuous casting temperatures. However, Emi, etc,
investigated that the effective thermal conductivity, keff, is around 1.7-2.1 W/(mK)
proportional to the disk thickness as shown in Figure 2.25, and suggested that the ratio of
radiative conductivity to the conduction component of conductivity across the solid
crystalline phase of mold flux is lower than 10% , kr/kc = 0.1[68]. The results of this
study suggest that the effect of radiation heat transfer is closer to 20%.
Figure 2.25 The calculated effective thermal conductivity and flux thickness [68]
Therefore, it has been concluded that the radiative heat transfer plays an important role in
the liquid layer and that it tends to be inhibited by the solid crystalline layer, such that the

50
overall heat flux in the crystalline layer can be reduced by 20% upon complete
crystallization of the slag. However, there is little knowledge of the ratio of radiative to
the conductive component in the glassy layer of the mold flux. This thesis will focus the
mechanism of radiative heat flux across the crystalline and glassy mold flux and quantify
how it evolves with crystallization of the flux.
2.4.2 The effect of mold flux properties and thickness on heat flux
Research has been carried out to analyze the effect of mold flux properties such as:
viscosity, glass transition temperature, crystallization temperature, etc, on the heat
transfer rate [15, 16, 17, 20]. Heat transfer between the mold and the shell is greatly
dependant on the slag properties present in the gap. Emi [52] mentioned that heat flux
through mold has been found to increase with decreasing viscosity, glass transition
temperature (Figure 2.26), melting range and crystallization temperature. As a low
viscosity of the mold flux favors infiltration of the molten fluid from the upper part of the
mold, it leads to higher flux consumption due to the formation a thicker lubricating film.
Thus, decreasing viscosity increases flux consumption. Transition temperature seems to
have a stronger effect: the higher it is, the thicker the solid phase is, which acts like a heat
resistance.

51
Figure 2.26: relation between heat transfer and crystallization and viscosity [52]
It has been reported [20] that a higher phase transition temperature allows a thicker solid
flux layer to form, which acts as heat flow barrier. It also causes less molten layer that is
available to fill the gap between the shell and mold, and gives rise to increased friction.
Therefore, the heat transfer is reduced when the transition temperature is high. In addition
to controlling the solidified mold flux thickness between the mold and shell by
controlling the transition temperature of the flux, the crystallization temperature of the
mold flux at a given cooling rate should be considered as well. Mold flux with high
crystallization temperature tends to form a thicker crystalline layer that contains pores.
The presence of these pores in the solid flux layer, causes the heat flux across the faces of
the mold to be reduced by decreasing the thermal conductivity [21,22,23]. Fluxes with
lower crystallization temperatures at a given cooling rate usually produce thicker glassy
layers, which have higher thermal conductivity, and enhance heat flux. A schematic

52
figure below shows the relation between the percentage of area of pores and the mean
heat transfer rate. Heat transfer in the slag melting area also has to be taken into account,
since it governs heat transfer in the top area of the mold.
130
135
140
145
150
155
160
0 2 4 6 8 10 12 14
Area of the pores (%)
Heat Transfer Rate (Kcar x
104 / m
2 hour) Viscosity (at 1573K)
1.0 Poise
Viscosity (at 1573K) 1.5 Poise
Figure 2.27. Relation between the percentage of area of pores and the mean heat transfer rate [23]
Occurrence of surface defects on continuously cast steel slab is strongly influenced by the
heat transfer during initial solidification of the slabs in mold. The control of the heat flux
in the mold based on a reliable heat analysis is an important issue to produce defect free
slabs.
Many efforts have been concentrated on reducing the heat flux by increasing thermal
resistance provided by mold flux film which infiltrates between mold and solidifying
steel shell. The mold flux film for casting low carbon or medium carbon steel slab was
shown to consist of two vertical parallel layers, melt and solid, by the observations

53
beneath the meniscus [66, 67]. The two layers provide the film with thermal resistances
to the conductive and radiative heat transfer in the mold [13]. In addition, experimental
studies show that another thermal resistance caused by the air gap at mold /mold flux film
interface plays an important role in the heat transfer in the mold. Thus, consideration of
the thermal resistances arising from the molten layer, solid layer and the air gap is
essential to carry out the heat transfer analysis in the mold.
Cho, Emi, and Suzuki [68-70] have done several research studies on the heat transfer rate
across a mold flux film during initial solidification in continuous casting. Two kinds of
mold fluxes, commercial mold flux for high speed casting of low carbon steel (LC) and
medium carbon steel (MC) were studied in their papers. A mold flux was placed on steel
plate, which was then heated from the bottom to make the temperature at the steel
plate/flux melt interface (TLS) close to temperature near meniscus part of continuous
casting mold. On melting the mold flux, bubbles which emerged at an early stage were
cleared by raising flux temperature higher than its melting point. When the mold flux was
homogenized, TLS was cooled down to its original one which is close to practical casting.
Then a one-end water cooled copper mold was lowered to contact with the molten mold
flux to yield flux film with the preset thickness between 0.5 mm and 2.0 mm.
They found that the observed heat flux passing through copper mold, qobs, decreases
substantially with increasing the total mold flux thickness, dtot, as shown in the following
Figure 2.28. Heat flux for MC is lower than that for LC, whereas TLS for MC is 50 K
higher than that for LC. They explained this fact by that total thermal resistance, Rtot, for
MC is larger than that for LC.

54
Figure 2.28. The change of observed heat flux and thermal resistances with thickness of
mold flux [69]
The total thermal resistance, Rtot, is composed of the interfacial thermal resistance (Rint)
and flux resistance (Rflux). Also they noted that the total thermal resistance is a strong
function of total mold flux thickness as shown in Figure 2.29. It was also found that the
thermal resistance of each layer of flux film is not much different between MC and LC,
as the thermal and optical properties such as thermal diffusivity and absorption
coefficient are similar.

55
Figure 2.29. The change interfacial and flux thermal resistance with thickness of mold
flux [69]
They finally obtained two equations for interfacial thermal resistance as expressed as
following:
)(),(4.16)/10( 24int forMCmmdWKmR cry×=− (2.17)
)(52.3)(94.2)/10( 24 forLCmmdWKmR crynti +×=− (2.18)

56
From above results, Cho, etc. [70] calculated the overall heat flux by assuming that mold
flux film consist of crystalline and molten layers, heat flow was in one direction, no
interaction between radiation and conduction, and mold flux behaves like a gray gas. The
calculated total heat flux, qtot, decreases exponentially with increasing flux film thickness
as shown in Figure 2.30.
Figure 2.30. Heat flux as a function of flux film thickness [70]
The total heat flux for LC is always higher than that for MC at the same film thickness.
One must control the thickness of flux film to a certain value to avoid the occurrence of
the longitudinal cracks according to these methods. It was also found that the heat flux
for MC2 at the thickness of 0.75 mm is 25% less than 0.67mm LC2, which agrees well
with plant observation that heat flux near the meniscus in mold is lower in casting

57
medium carbon steels. The reason for this is due to the fact that interfacial thermal
resistance, Rint, for MC is always large than that of LC as shown Figure 2.31.
Figure 2.31. Comparison of calculated threshold interfacial thermal resistance with observed [70]
They also did the research of effect of mold temperature, casting speed and mold flux
properties on heat transfer rates in continuous casting. As shown in Figure 2.32, the
difference in total heat flux is only 2.2% for LC and 1.6% for MC, when the mold
temperature was lowered from 593K to 553K.

58
Figure 2.32. Effect of mold temperature on heat flux near meniscus [70]
The effect of casting speed, Vc, on the total heat flux is calculated and shown in Figure
2.33. Change of Vc from 1.6 to 3 m/min results in an around 5% increase in total heat
flux. Since there is a reduction of thickness due to the increase of casting speed, the net
effect of increase casting speed will lead to 30% higher total heat flux.
Figure 2.33. Effect of casting speed on heat flux near meniscus [70]

59
As for the mold flux properties, like absorption coefficient, there was less than 2% effect,
where a mold flux was manufactured with 10 times absorption coefficient than the
original one as shown in Figure 2.34. Since the absorption coefficient is largely same for
various mold fluxes, methods to reduce heat flux by changing absorption coefficient are
not very effective.
Figure 2.34. Effect of absorption coefficient on heat flux near meniscus [70]
The effect of varying crystallization temperature ± 50K for MC2 on total heat flux has
been estimated as ±8% at a thickness of 0.75 mm as shown in Figure 2.35. It concluded
that the slower cooling can be effectively achieved by increasing crystallizing
temperature.

60
Figure 2.35. Effect of crystallizing temperature on heat flux near meniscus [70]
2.4.3 The development of heat simulator
As the complexity of heat transfer in continuous casting mold, it is desirable to split the
overall heat transfer into conduction and radiation. A new radiation heat simulator,
infrared emitter, has been successfully developed by Adam Badri at Carnegie Mellon
University [22-24], which could generate rapid responding high level thermal radiation
seen in the caster (1 MW/m2). The main description of this infrared emitter is provided in
chapter 3.
Badri, etc. carried out the research of to test the physical properties of this simulator, how
the subsurface temperature responses to a sinusoidal surface heat fluxes [23]. They
determined the functional relationship between the amplitude and frequency of the
surface stimulus with the subsurface temperature response. As shown in the Figure 2.36,
a fast-Fourier transform filtered signal of the temperature response to a sinusoidal flux

61
figure is clearly shown that the changing of frequency of the sinusoidal signal leads to the
change of responding temperature amplitude: the amplitude of the temperature response
signal reduces with the increase of signal frequency.
Figure 2.36 The temperature response to a sinusoidal flux [23]
They also compared the effect of the distance of the thermocouple from the heated
surface. As shown in Figure 2.37, it indicated that the temperature response amplitude
decreases with increasing distance from the heated surface.

62
Figure 2.37 Temperature response amplitudes for different subsurface thermocouples [23]
With such exploration, the set up of this equipment is expected meet the accuracy of the
thermocouple being used, and these thermocouples that are accurate, precise and
relatively free from electromagnetic contamination are sensitive to small changes in
temperature such that they could detect small amplitude high frequency signal.
Park, etc. [86] have already conducted a tentative research of the effect of mold flux on
radiative heat transfer on copper by incident thermal flux on a copper mold covered with
1 mm crystalline slag disk. It was found that the responding temperatures in the mold that
was covered with disk are higher than those without disk as indicated in figure 2.38. It
turns out that the solid flux layer enhanced the heat transfer absorption into copper mold,
which was believed unusual, in that the crystallization is believed to be an insulator.

63
Figure 2.38 Responding Temperature 2 mm below the hot surface [86]
The corresponding heat fluxes in the copper mold were also calculated and shown in
Figure 2.39. It gave the fact that the replacement of solid mold flux enhances the
radiation transfer into the mold.
Figure 2.39 The measured heat flux for bare copper and crystalline disk [86]

64
With the accuracy of heat simulator and some tentative results of the effect of mold flux
on radiation transfer, it gives rise the idea that it is possible to carry out the study of mold
flux crystallization and its influence on radiative heat transfer in the meniscus area in
continuous casting.
2.5 Relation to Current Work
Research has been carried out to investigate the heat transfer phenomena in continuous
casting, and its influence on final casting slab surface quality. It was found that the mold
flux infiltrated between the steel strand and copper mold has been widely used to
moderate heat transfer rate during continuous casting via the selection of mold powder
composition (due to the importance of its properties on heat transfer rate) and mold
design. It was also shown that the crystallization of mold flux was recognized as one of
the primary issues to affect heat transfer rate through the strand to the copper mold.
However, it turns out that little research has been done to relate and quantify the effect of
slag crystallization on the heat transfer rate, and most of these research is limited to a
discussion of conduction heat transfer during continuous casting to explain the overall
heat transfer rate. Very few investigations were carried out on the radiative heat transfer
rate due to its complexity and the harsh casting environment. The specifics of the solid
mold flux layers and their influence on heat transfer rates during continuous casting have
not been studied in detail and are the focus of this thesis.

65
3. Experimental Apparatus and Procedures
3.1 Infrared emitter
A schematic of the experimental apparatus of infrared emitter developed by Adam Badri
at Carnegie Mellon University [22-24] is shown in Figure 3.1. The equipment used in
these experiments includes: a power controller, a high-heat flux infrared radiant heater
with a heating unit, a data acquisition system and a command-and-controlled unit. It was
decided that an infrared radiation system was needed to produce the levels of thermal flux
seen in a continuous caster (1 MW/m2). These lamps are vacuum-sealed tungsten-alloy
filaments, which are manufactured by General Electric and are capable of emitting 1.0
MW/m2 at 44% above its rated voltage.
Data acquisition / command-and-control
computer
PowerController
V
I
Coolingair in
Coolingair out
Water-cooled reflector
Coolingwater out
Coolingwater in
Power cables
Thermocouple output
Voltage and current feedback
Commandsignal
Infrared Radiation
Figure 3.1. Experimental apparatus of the infrared emitter.

66
When a voltage is applied to the heating elements, the elements begin to emit infrared
radiation. The intensity level of this radiation can be controlled precisely by changing the
voltage applied across the elements. To focus all of this radiation onto a sample plane, a
quasi-parabolic reflector is mounted behind the elements. By using a silicon-controlled
rectifier (SCR) based power controller, the voltage across the lamps can be manipulated
between 0 and 208 V, and thus the resulting output flux of the lamps can be varied from 0
to 1.0 MW/m2. In order to be able to generate heat fluxes using specified mathematical
functions, the power controller is connected to a data acquisition and control board,
which is in turn connected to a computer. Thus, any arbitrary signal generated by the
computer can be sent in real time to the power controller, and translated into an output
heat flux by the heating elements.
The infrared emitter is equipped with monitoring systems to ensure that the emitter
operates safely and properly. This instrumentation includes monitoring the inlet cooling
air pressure, inlet water pressure to the sample and reflector, and the flow-rate of cooling
water. In addition, the inlet and outlet cooling water temperatures for the sample and
reflector are also monitored. The copper mold is simulated by a one-end water cooled
copper cylinder, which acts as the radiation target, and the schematic figure is shown in
Figure 3.2. As the heat flux (infrared radiation) is applied on the top surface of the copper
mold, which is covered with mold flux film, the response temperatures could be
measured using the sub-surface thermocouples.

67
Figure 3.2. Schematic figure of copper substrate used as the radiation target
Figure 3.3 gives one example of responding thermocouples’ temperatures history, when a
constant 510 KW/m2 radiative heat flux was applied to the copper mold. The responding
temperatures at 2, 5, 10, 15 mm below the hot surface of copper mold are recorded as T1,
T2, T3, T4, and the cooling water inlet and outlet temperatures are presented as Tin and
Tout as shown below.
Mold Flux 32 mm
Thermal couples
25mm
Chilled surface
Cooling water outlet
Cooling water inlet

68
0
10
20
30
40
50
60
70
0 500 1000 1500 2000 2500 3000
Time S
Res
pon
din
g Te
mpe
ratu
res o C T1
T2
T3
T4
Tout
Tin
Figure 3.3.The responding temperatures history for the copper mold coated with graphite
It can be found that the system comes into steady state after 200-300 seconds. The heat
flux at steady state was calculated in two ways, one from traditional Fourier Law,
∑−=
iidx
dTkn
q )(1" , by the subsurface temperature gradient which was recorded by the
four subsurface thermocouples; and the other was from the heat released by cooling
water.
)*/(/*/*/*)*/(/***" 22 msJmKLkgsLKkgJAreaflowratedensityTcq p ==Δ=
(3.1)

69
cp here is the heat capacity of water, area is the cross area of water flow, and both heat
fluxes calculated in above methods are plotted in Figure 3.4.
80
85
90
95
100
105
110
115
400 900 1400 1900 2400
Time S
Mea
sure
d he
at f
lux
KW/m
2
Figure 3.4. Calculated heat flux with time at steady state.
From above figure, it can be observed that although there are very small fluctuations
along 100 KW/m2 line, both lines drawn from above two methods still keep constant at
steady state along this 100 KW/m2 line. The technology developed using the infrared
emitter as a radiation source is valid and allows one to conduct experiments, which
focuses on the effect of the mold flux on the in-mold heat transfer rates due to radiation
heat transfer.
Calculated by water cooling system
Calculated through subsurface thermo-co ples

70
3.2 The fabrication of mold flux disks
3.2.1 Preparation by cooling and section
To prepare the mold flux for the use as heat transfer samples, the mold flux was
fabricated into a disk. Disks of mold flux of various thicknesses with a different phase
composition, i.e. glassy or crystalline phase or mixed were produced. To make these
disks, the mold flux was first pre-fused to remove the bulk of the graphite. Then, the
fused mold flux was melted in a graphite cylinder crucible in an induction furnace
(Figure 3.5) and then cooled at a controlled rate to achieve either a crystalline phase or a
glassy phase with the same diameter of copper mold.
Figure 3.5. Induction furnace used to melt mold flux into cylinder
Controlled cooling of the mold flux cylinder was achieved by transferring the crucible
containing the liquid mold flux into a programmed furnace. Once cool, the cylinder of
solid mold flux was removed from the graphite crucible. This cylinder is then sectioned
Induction coil
Mold flux
Graphite crucible

71
using slow speed diamond blade to produce disks ranging in thickness from 200 to 1500
micron meters. This procedure is summarized in Figure 3.6.
Figure 3.6 . The Flowchart for mold flux disks preparation
One example mold flux used in chapter 4 is an industrial mold slag powder for casting
ultra-low carbon steels used in the continuous casting, and its main chemical composition
is listed in Table 3.1. The following figure gives some example pictures of the slag disks.
The glassy slag disks are found to be transparent and the crystalline one has opaque
optical properties.
Figure 3.7. The picture of glass and crystalline disks
Melt mold flux in cylinder graphite crucible
Solidify at a controlled rate furnace
Pre-melt for decarburization
Section mold flux into disks with varied thickness
600 micron 1000 micron Crystalline disk
Glassy

72
Table 3.1: Composition of mold flux (major components)
Component Weight percent
SiO2 44.5
CaO 29.3
Al2O3 1.0
MgO 5.6
Na2O 9.0
Then an example of 0.91 mm glassy disk fabricated in this way was placed on the copper
mold and subjected to the constant 510 KW/m2 thermal radiation. The responding in-
mold subsurface temperatures are shown in Figure 3.8. The system comes into a
relatively stable state in a short time, and the responding temperature T1 (2mm below hot
face) at the relatively stable state is about 82 oC, which is much higher than that of bare
copper one that is about 58 oC, when the same constant radiation was applied to the
system. The reason for this increase will be addressed in chapter 4.
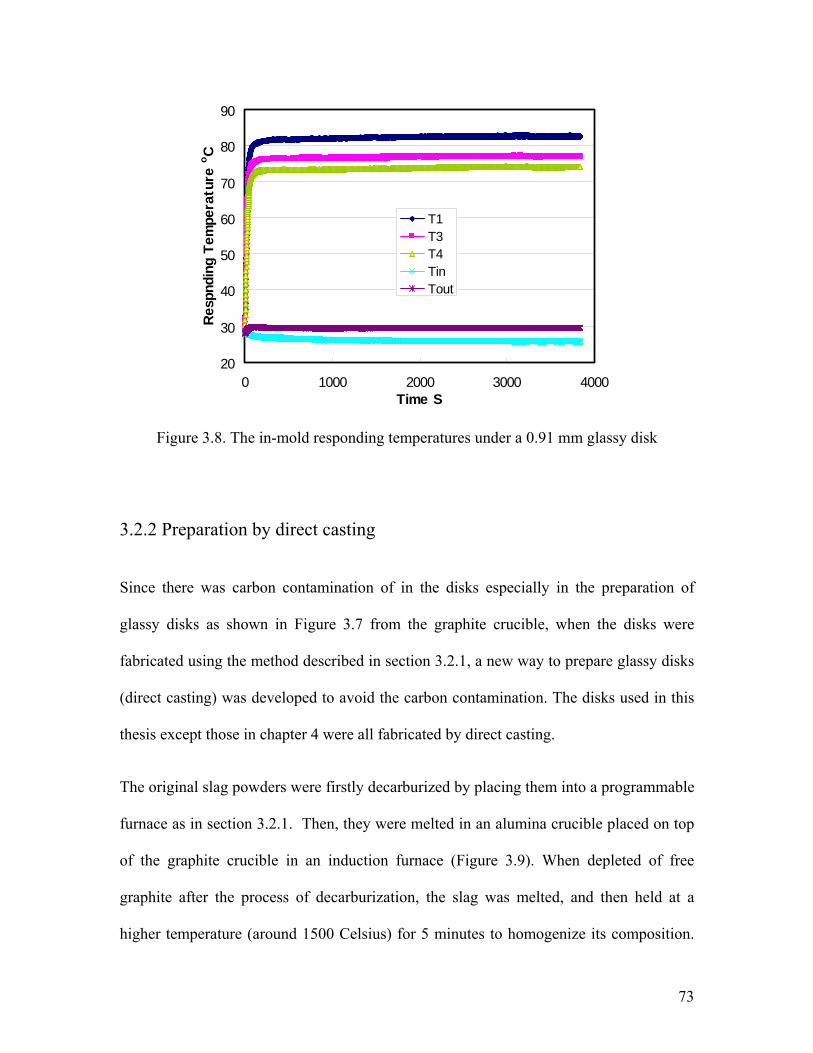
73
20
30
40
50
60
70
80
90
0 1000 2000 3000 4000Time S
Resp
ndin
g Te
mpe
ratu
re o C
T1T3T4TinTout
Figure 3.8. The in-mold responding temperatures under a 0.91 mm glassy disk
3.2.2 Preparation by direct casting
Since there was carbon contamination of in the disks especially in the preparation of
glassy disks as shown in Figure 3.7 from the graphite crucible, when the disks were
fabricated using the method described in section 3.2.1, a new way to prepare glassy disks
(direct casting) was developed to avoid the carbon contamination. The disks used in this
thesis except those in chapter 4 were all fabricated by direct casting.
The original slag powders were firstly decarburized by placing them into a programmable
furnace as in section 3.2.1. Then, they were melted in an alumina crucible placed on top
of the graphite crucible in an induction furnace (Figure 3.9). When depleted of free
graphite after the process of decarburization, the slag was melted, and then held at a
higher temperature (around 1500 Celsius) for 5 minutes to homogenize its composition.

74
Subsequently, it was quenched from its molten state form on a stainless steel plate (at
room temperature). A new cylindrical tube-like copper mold with the same size as the
copper substrate in the experiment was used to cast the molten mold flux, before it
solidified on a stainless steel plate. In this manner, a thin glassy mold flux disk was
produced. The schematic of the apparatus used to melt mold flux in cylinders is shown in
Figure 3.9.
Figure 3.9. Apparatus used to melt mold flux
The mold flux disks made through above method as shown in Figure 3.10 were then
placed on the heated surface of the copper substrates individually. During the radiation
experiments, the infrared radiation would impinge on the mold flux disk and transmitted
through the disk and into the copper substrate.

75
Figure 3.10. The glassy disks prepared by direct casting
3.3 Double hot thermocouple technology
The double hot thermocouple techniques (DHTT) [20, 21] has been developed to allow
the in situ observation of mold slag crystallization under defined thermal conditions, such
that the kinetics of crystal growth could be measured.
The schematic figure of DHTT used for the measurement of crystallization kinetics is
shown in Figure 3.11. It includes: a quartz reaction tube, the hot thermocouple controller
for each thermocouple, a data acquisition computer system, and an observation system
consisting of a microscope and a Sony digital camcorder.

76
Figure 3.11. Schematic figure of DHTT
In the DHTT, a sample with the size of 2-5 mm is placed in between two thermocouples,
and its temperature was measured and controlled continuously and independently
through the data acquisition system, which has a two channel D/A (digital –analog: 0-5
DC volt) converter to control the hot thermocouples. An optical microscope, connected
with digital camcorder, is located above the sample to observe the crystallization
phenomenon of sample. The image is then sent to the camcorder through the connected
microscope, and the video signal with the information of experimental time is recorded in
the tape. Two examples of the mold flux crystallization photos are shown in Figure 3.12,
where a full glass disk was annealed at 900 degree
Hot Thermocouple Driver
Data Acquisition Computer system
Power
Digital Camcorder
Microscope
Power Control
B type T.C.
Temperature measurement

77
Figure 3.12. Photos of a glass mold flux crystallization
The glass mold flux sample is clearly shown in the left photo of Figure 3.12, then the
opaque crystals could be observed at the right photo when it was annealed for almost two
minutes as the time difference shown in the top right corner of the photos.
The computer with image capturing and analysis software (NIH Image 162) allows a
more detailed analysis of the crystallization kinetics phenomena. High heating and
cooling rates can be easily obtained due to the low thermal inertia of the system, which is
very useful for the determination of TTT diagrams, where a fast initial cooling rate is
required.

78
4. A Study of a Solid Mold flux and Its Effect on Radiative Heat Transfer
4.1 The radiative properties of a mold flux
The mold flux used in this paper is an industrial mold powder that is used for casting
ultra-low carbon steels, and its main composition is listed in Table 3.1. The mold slag
samples were prepared as thin disks with the same diameter as the copper mold as
indicated in section 3.2.1. When the surface of the disk receives thermal radiation,
usually called irradiation and denoted by I0, from the infrared emitter, some portion of
this energy is absorbed, another fraction will be reflected and the rest will be transmitted
as shown in Figure 4.1. If the transmission is so small that it could be neglected, the
surface is said to be opaque. However, if the transmission occurs, the surface is termed as
semitransparent. Absorption and emission of photons within the mold flux are due to the
interactions with free electrons as well as due to excitation of lattice vibrations. Based on
this observation we define the following three fundamental radiative properties [71]:
Reflectivity, 0
0
IIofpartreflected
=ρ (4.1)
Absorptivity, 0
0
IIofpartabsorbed
=α (4.2)
Transmissivity, 0
0
IIofpartdtransmitte
=τ (4.3)

79
Figure 4.1. Schematic of splitting irradiation into absorption, reflection, and transmission
Since all the irradiation is split into reflection, absorption, and transmission, the three
energies must sum to total incident I0. Therefore, it leads to the following equation:
1=++ τρα (4.4)
Among the above three split energies, τ, the transmittance is of interest, because heat
transfer from liquid steel pool to mold walls controls the heat transfer rate in the
meniscus area of a continuous caster. It has been reported [72] that transmittance depends
upon the mixture of the incident thermal wave length, λ, and the incident direction,
which is usually defined by θ (from z-axis). As radiative energy penetrates through the
slag disk layer, it will attenuate gradually by absorption as shown in Figure 4.1.
Experience and theoretic development show that there is an exponential decay of incident
Irradiation from environment I0 (W/m2) Reflected
energy ρI0
Transmitted energy τI0
Absorbed energy αI0
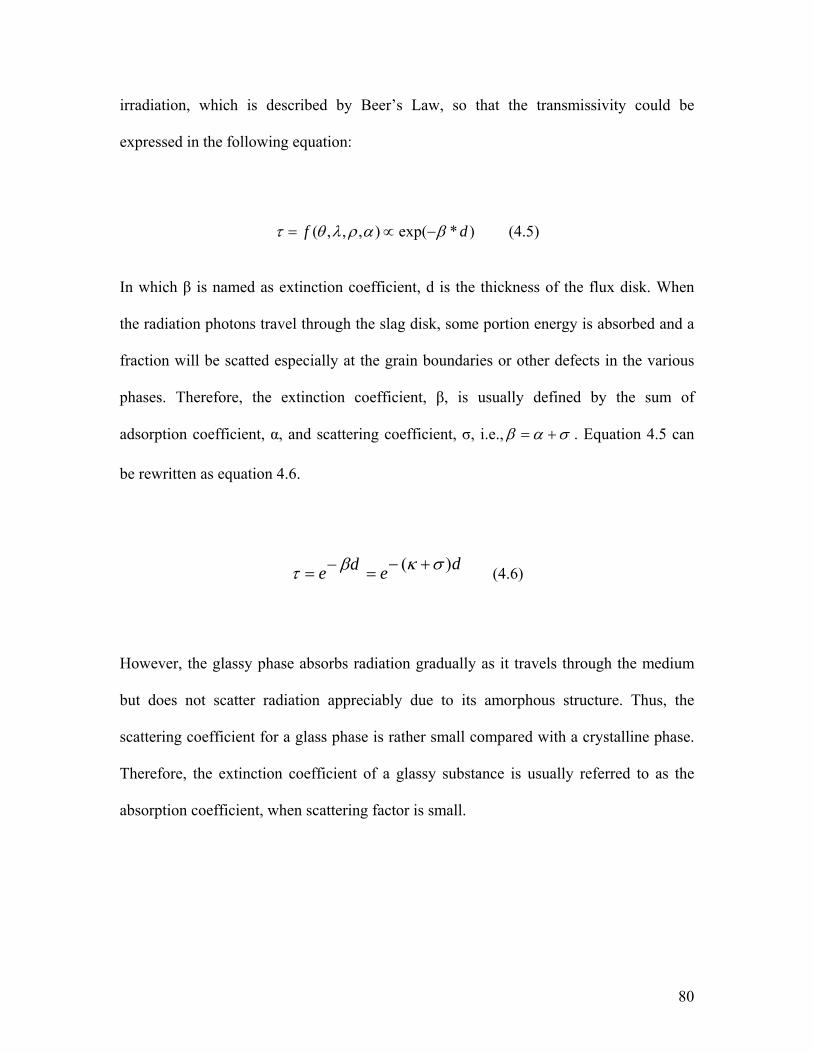
80
irradiation, which is described by Beer’s Law, so that the transmissivity could be
expressed in the following equation:
)*exp(),,,( df βαρλθτ −∝= (4.5)
In which β is named as extinction coefficient, d is the thickness of the flux disk. When
the radiation photons travel through the slag disk, some portion energy is absorbed and a
fraction will be scatted especially at the grain boundaries or other defects in the various
phases. Therefore, the extinction coefficient, β, is usually defined by the sum of
adsorption coefficient, α, and scattering coefficient, σ, i.e., σαβ += . Equation 4.5 can
be rewritten as equation 4.6.
dede )( σκβτ +−=−= (4.6)
However, the glassy phase absorbs radiation gradually as it travels through the medium
but does not scatter radiation appreciably due to its amorphous structure. Thus, the
scattering coefficient for a glass phase is rather small compared with a crystalline phase.
Therefore, the extinction coefficient of a glassy substance is usually referred to as the
absorption coefficient, when scattering factor is small.

81
4.2 Effect of the crystalline phase on radiative heat transfer rate
As described in chapter 2, the mold flux film beneath the meniscus consists of two
vertical parallel layers, a molten layer and a solid layer (crystalline and glassy film). The
two layers provide the film with thermal resistance to the conductive and radiative heat
transfer in the mold, and each part of the layer plays a different role on the heat transfer.
As for the solid crystalline film, which is next to the molten slag layer, it is believed to
retard the heat transfer rate [17-19]. However, all of these studies were related to
conductive heat transfer. This section focuses on the effect of pure a solid crystalline
mold flux on the radiative heat transfer rate.
In the industrial operation of continuous casting, the most useful data would be the effect
of mold flux films on the heat transfer rate during steady state operation. The experiment
carried out in this thesis simulated the heat transfer rates of a caster by applying a
constant infrared radiative heat flux onto the top of copper mold that covered with a slag
disk. The constant heat fluxes were produced by the infrared emitter. The opaque
crystalline slag disk was placed on the top surface of the copper mold and subjected to
constant thermal radiation. The responding temperatures during the experiments were
measured by the subsurface thermal couples at several locations (2, 5, 10, and 15 mm)
below the hot surface. The following Figure 4.2 gave one example of the responding
subsurface temperatures histories, when a constant 510 KW/m2 radiative heat flux was
applied to 0.63 mm crystalline disk (its X-ray pattern was shown as W1p in Figure 4.3)
on top of the copper mold. The responding temperatures at 2, 5, 10, and15 mm below the

82
hot surface were recorded as T1, T2, T3, T4, and the cooling water inlet and outlet
temperatures were presented by Tin and Tout.
20
30
40
50
60
70
80
0 1000 2000 3000 4000 5000 6000 7000Time S
Resp
ondi
ng T
empe
ratu
re o C
T1T2T3T4TinTout
Figure 4.2. The responding temperatures versus time for 0.625mm slag disc
From above figure, it is obvious that the system comes into steady state in a very short
time (200-300 seconds). The T1 responding temperature at steady state approaches to 69
oC, which is about 10 degrees higher than the T1 response for a bare copper mold as
shown in Figures 3.3.
In order to check the phase transformation during the heating, the original and final slag
samples were scanned by X-ray as shown in Figure 4.3. From the X-ray pattern, it could
be observed that the all the patterns: W1p (the original sample), W2p (the sample being
treated by 0.9 MW/m2 infrared radiation for 300 seconds), W3p (the sample being treated
by 0.9 MW/m2 radiation for 1 hour, and W4p (the sample being treated for 8 hours), have

83
the same characteristic peaks and position, which has been identified as Cuspidine
(Ca4Si2O7F2 or 3CaO.2SiO2.CaF2.).
Figure 4.3. X-ray pattern of slag disc heated by radiation
Table 4.1 lists the responding temperatures, T1, 2 mm below the copper surface at steady
state corresponding to different thickness crystalline disks. When the responding steady
state temperatures were plotted versus applied heat fluxes as shown in Figure 4.4, all the
responding temperatures in the systems with crystalline mold flux are higher than those
with no mold flux layer, which may indicate that the crystalline mold slag enhances
radiative heat transfer when compared to a metal surface due to differences in reflectivity.

84
Table 4.1: The responding temperature, T1, for different thickness crystalline slag disks
Responding temperature (oC)
Applied constant heat flux (KW/m2)
Slag disc
thickness
(mm) 250 495.9 740.8 884.7 987.7
0 40.8 52.4 69.2 83.5
0.45 45.1 62.8 80.6 88.8
0.875 46.9 63.7 84.3 93.9
1 45.7 61.1 82.6 102.4
30
40
50
60
70
80
90
100
110
0 200 400 600 800 1000 1200Applied Heat flux (KW/ m2)
Res
pond
ing
Tem
pera
ture
0 C
bare copper
0.45mm crystalline disc
0.875mm crystalline disc
1mm crystalline disc
Figure 4.4. The responding temperatures versus applied heat fluxes for the system with crystalline slag disk on top of the copper mold

85
As the measured temperature only gives a relative measure of the ability for a crystalline
mold flux disk to transfer radiative heat, it is better to show that the heat flux passing
through the copper mold does increase when the slag discs were placed on top of mold.
Therefore, all heat fluxes at steady state passing through the copper mold were calculated
according to the Fourier’s First Law, ∑−=
iidx
dTkn
q )(1" , q” here refers heat flux, n is the
total number of the thermocouple pair, i is the index number, k is the thermal
conductivity, and (dT/dx)i is the temperature gradient measured by ith thermal couple
pair. The calculated heat fluxes versus applied heat fluxes are plotted in Figure 4.5. The
placement of crystalline disks on copper increases the heat transfer rate by 39 KW/m2 for
an applied flux of 244 KW/m2, and up to 118 KW/m2 for an applied flux of 740.8 KW/m2
as shown in Figure 4.5.
Since the ability of a material to absorb radiation determines how well it serves as a heat
sink, which may be of great interest to continuous casting due to its primary function as a
heat sink to remove heat from liquid steel, the above results give rise to the idea that mold
flux could be better used to the heat transfer modification in continuous casting.

86
45
95
145
195
245
295
345
395
0 200 400 600 800 1000Applied heat flux KW/ m2
Mea
sure
d H
eat
Flux
KW
/m2
Bare copper
1.0 mm crystalline disc
0.625mm crystalinne
0.55 mm crystalline disc
0.875 mm crystalline disc
Figure 4.5. Measured heat fluxes through the copper mold
As discussed before, the increase in temperature response and heat flux through the
copper mold suggests that the mold flux enhances radiative heat transfer in continuous
casting. With further investigation, the crystalline slag disks have the similar ability to
transfer radiation regardless the thickness, and the measured heat fluxes through the
copper mold have the same magnitude.
In order to explain why the mold flux enhances radiative heat transfer rate, the
mechanism of absorption of radiation with a mold flux and on bare copper was
investigated. The main photon absorption mechanism for a solid is by interactions with
free electrons (free—free interactions that are common in metals) or due to excitation of
lattice vibration (phonons). Since a metal like copper is an excellent electrical conductor,
and has an abundance of free electrons, absorption and transmission of photons are

87
through free-free transitions, which means electrons can absorb or emit photons. As all
these electrons do not oscillate but are donated to the shared electron cloud within the
rigid structure, it is difficult under these conditions for a photon to be propagated through
the lattice and then transmitted. However, the slag disk, which consists of a mixture of
metal oxides, does not have many free electrons, and does not display a high reflectance
and opaqueness behavior across the infrared spectrum; i. e. oxides tend to be transparent
or translucent. The radiative properties of oxides are dominated in the infrared by photon-
phonon interaction, i.e. by the photon excitation of the vibration energy of the solid’s
crystalline lattice and scattering from phase boundaries, which results in a stronger
radiation absorption. Of course amorphous oxide materials, such as glasses, tend to be
transparent and there is no significant photon transmission due to the non repeating
structure which leads to low thermal conductivity. Single crystals, however, can have a
very high thermal conductivity due to ease of photon transmission via lattices vibrations.
Transmissivity, τ, is the ratio of the transmitted part of energy to total incident energy. It
is an exponential function of extinction coefficient, β, where β is described as:
ok λπβ /4= [72], here λo is the wavelength of the incident light in vacuum, and k is
absorptive index, which could be expressed by following function.
),,,( oe cfk σλε= (4.7)
Where co is light speed in the vacuum, εis the electric permittivity, σe is the electrical
conductivity, k is proportional to σe. Thus, equation 4.6 could be rearranged in to
equation 4.8.

88
okdede λπβτ /4−∝−∝ (4.8)
Combining equation 4.7, and 4.8, leads to equation 4.9, which gives the relationship
between the electrical conductivity and transmissivity.
ooe dcfe λσλεπτ /),,,(4−∝ (4.9)
It is obvious that the electric conductivity of copper is much larger than that of slag,
which leads to a smaller transmissivity of copper. Therefore, the copper will hardly
transmit infrared radiation (as it reflects radiation) and the heat flux through copper mold
and responding temperature would be lower than the system that allows adsorption such
as a slag disk. If the transmitted heat fluxes were plotted in terms of fraction of heat
transmitted versus the applied heat fluxes, as shown in Figure 4.6, it is found that the
placement of a disk leads to a transfer of 40% of incoming radiation, resulting in a 20%
improvement with regard to a bare copper surface. As reflectivity is an issue, the surface
condition is also important in radiation heat transfer.

89
0.1
0.15
0.2
0.25
0.3
0.35
0.4
0.45
0 200 400 600 800 1000Applied Heat flux (KW/ m2)
Frac
tion
of M
easu
red
heat
Flu
x (%
)bare copper0.625 mm crystalline disc
1 mm crystalline disc
Figure 4.6 The fraction of measured heat flux versus applied heat flux.
4.3 Effect of a glassy disk on the radiative heat transfer rate
The glass slag disks manufactured as outlined in chapter 3 were first scanned by X-ray to
confirm that these disks were predominantly glassy. From the X-ray pattern shown below
in Figure 4.7, no characteristic peak was found.
Figure 4.7. The X-ray pattern of glassy slag disk

90
In order to compare the effect of different disk phase on the radiative heat transfer rate, a
0.66 mm thick glass disk was placed on the top of the copper mold and subjected to the
same constant radiation, 510 KW/m2, as used for the 0.63 mm crystalline sample in
section 4.2. The responding temperatures versus time are shown in Figure 4.8. The
system comes into a relatively stable state in a short time. The responding temperature,
T1, 2mm below hot face is 82Co, which is higher than that of the measured crystalline
flux (68 Co) in Figure 4.2.
20
30
40
50
60
70
80
90
0 2000 4000 6000 8000 10000 12000Time S
Resp
ondi
ng T
emp.
o C
T1T2T3T4ToutTin
Figure 4.8. The responding temperatures versus time for glassy slag disc.
Similar experiments were conducted by changing the applied radiation heat flux, and the
responding temperatures, T1, were given with the comparison of the other two systems,
i.e. the bare copper system and the system with crystalline sample in Figure 4.9. It could
be found that all the values for T1 in the system with glass disk are higher than others.
The responding temperature difference between crystalline and glass disk samples range

91
from around 7 centigrade at the application of 250 KW/m2 to 19 centigrade at 881
KW/m2. Therefore, it proposed that the glass phase has a better ability to transfer
radiation than a crystalline phase.
40
50
60
70
80
90
100
110
120
0 200 400 600 800 1000Applied Heat Flux KW/m2
Res
pond
ing
tem
prat
ure o C
bare cppor
1.0 mm crystalline disc
0.625mm crystalline disc
0.55 mm crysalline disc
0.875 mm crysalline disc
0.66 mm glassy disc
Figure 4.9. Responding temperatures versus applied heat fluxes for different systems
The transmitted heat flux passing through copper mold was also calculated to confirm the
above proposal. As the thermal profile in this case is a function of temperature and time,
inverse heat conduction methods were used to estimate the heat flux history, and the
program of 1-D inverse heat transfer calculation is listed in the appendix. The inverse
heat conduction method is based upon finding a solution to the following 1 D transient
heat transfer equation:

92
tTc
xTk
xi
pi
∂∂
=∂∂
∂∂ )()( ρ (4.10)
in which ρ is the mass density, cp is the copper heat capacity, and t is time. By inputting
all the thermocouple’s temperatures history, heat flux can be calculated along with the
thermal boundary conditions.
The calculated heat fluxes corresponding to Figure 4.9 are plotted in Figure 4.10. It is
quite clear that all the measured heat fluxes through the glassy disk are higher than others.
Therefore, the glassy phase disk does have a stronger ability to transfer radiative heat flux
than crystalline one.
45
95
145
195
245
295
345
395
0 200 400 600 800 1000Applied heat flux KW/ m2
Mea
sure
d He
at F
lux
KW
/m2
Bare copper
1.0 mm crystalline disc
0.625mm crystalline disc
0.55 mm crystalline disc
0.875 mm crystalline disc
0.66 mm glassy disc
Figure 4.10. The measured heat fluxes for different systems
In order to investigate the net heat transfer ability difference between crystalline and
glass samples, the same incident radiation flux (510 KW/m2) was applied to the same

93
thickness (0.63 mm) crystalline and glass samples individually. The determined in mold
heat transfer rates were given in Figure 4.11.
0
50000
100000
150000
200000
250000
300000
0 500 1000 1500 2000 2500 3000Time S
Mea
sure
d H
eat
Flux
(W
/m2 )
glassy phasecrystalline phase
Figure 4.11. The calculated heat flux histories for glassy and crystalline phases
The heat flux transmitted through the glass disk to copper is around 250 KW/m2, which is
much larger than 195 KW/m2 for the crystalline one under same conditions, and the
crystallized disk heat transfer rate is around 20% lower than that of a glassy disk.
However, both heat fluxes with the presence of the slag disks are still higher than that of
bare copper.
In order to study the effect of thickness of glass disk on radiation, constant radiative
thermal flux (510 KW/m2) was applied to five different thickness glassy phase disks
ranging from 0.55 to 0.91 mm. The measured heat fluxes histories through the copper are
shown in Figure 4.12. It is different from that of the crystalline disk, which has little

94
effect on radiative heat transfer. The thickness for a glass disk does have a significant
effect on the radiation heat transfer rate, and their exact relationship will be addressed in
detail in chapter 5.
100000
150000
200000
250000
300000
0 500 1000 1500 2000 2500 3000Time S
Mea
sure
d H
eat
Flux
(W
/m2 )
0.91 mm glassy0.85 mm glassy0.78 mm glassy0.66 mm glassy0.55 mm glassy 0.91 mm crystalline
Figure 4.12. The measured heat fluxes histories for five different thickness glassy discs
As the transparency of the glass disks as shown in Figure 4.13, there will be more
radiation absorbed than a crystalline sample. When the thickness of the sample increases,
more energy is absorbed according to Beer’s Law and this energy heats the sample disk
to a higher temperature, leading to a larger heat flux that is transmitted to the copper
mold. The heat flux through copper is around 234 KW/m2 at the thickness of 0.55 mm,
and it goes up to 291 KW/m2 once the thickness increases to 0.91 mm.

95
Figure 4.13. Two typical glass disks picture
From above experimental results and phenomenon, it suggested that the heat flux through
mold is a strong function of the surface covering of the heat receiving system. Therefore,
the surface of copper mold was changed to study the effect of top surface of the copper
mold on responding heat transfer rate in continuous casting, to give some insight for
moderating heat transfer rate by a change of mold surface characteristics.
4.4. Effect of top surface on radiative heat transfer
In order to explore the mechanism of radiative heat transfer across a solid mold flux to a
copper mold, the top surface of copper mold was modified, by adding different materials
to its surface, to change its reflectivity and its absorbance. Figure 4.14 gives one example
of responding thermocouples’ temperatures history, when a constant 510 KW/m2
radiative heat flux was applied to a copper mold coated with graphite. The responding
temperatures at 2, 5, 10, and 15 mm below the hot surface of copper mold are recorded as

96
T1, T2, T3, T4, and the cooling water inlet and outlet temperatures are presented as Tin
and Tout as shown below.
20
30
40
50
60
70
80
90
100
0 500 1000 1500Time S
Resp
ondi
ng T
empe
ratu
re 0 C
T1T2T3T4TinTout
Figure 4.14.The responding temperatures history for the copper mold coated with graphite
The system reaches a steady state in a very short time (200-300 seconds), as shown in
above figure, and the measured heat flux traveling through copper mold at steady state
could be calculated by an inverse solution of the heat conduction equation with the given
temperature gradient. A series of experiments were conducted, and the responding
temperatures, T1, 2 mm below hot surface at steady state, for different surface coated
systems were plotted versus applied heat fluxes in Figure 4.15a. Their corresponding heat
fluxes histories for each system were given in Figure 4.15b, when constant 510 KW/m2
incident radiation was applied.

97
40
50
60
70
80
90
100
110
120
130
140
0 200 400 600 800 1000Applied Heat Flux KW/ m2
Res
pond
ing
Tem
peat
ure
oC
bare alumina powder
C coating0.66 mm glassy disc0.45 mm crystalline disc
0.75 mm crystalline disc0.95mm crystalline disc
0
50000
100000
150000
200000
250000
300000
350000
0 500 1000 1500 2000Time S
Mea
sure
d H
eat
Flux
W/m
2
barealumina powderC coating0.95 crystalline disc0.66 mm glassy disc
Figure 4.15 (a). Responding temperatures versus applied heat fluxes and
(b). Measured heat flux going through copper mold for varied top surface
There are five temperature trends in Figure 4.15, corresponding to each experimental
system: (1) a bare copper surface; (2) a copper mold with an alumina surface; (3) a
copper mold with a black graphite surface; (4) a copper mold with solid crystalline slag
disk; and, (5) a copper mold with solid glassy disk. It is clear that all results are a strong
function of the surface condition of the mold and the presence of the slag disk. The
reason for this may be due to the different heat absorbance of top surface, such that the
responding subsurface temperatures and heat fluxes vary when the top surface of the
copper mold changes. The bare copper surface or that coated with alumina powder has
weakest ability to transfer heat: around 20% of the incoming radiant energy, as shown in
Figure 4.16. Also the responding temperatures and the measured heat fluxes passing
through the copper mold are lowest when compared with others (Figure 4.15). For the
systems with solid mold slag disks placed on top of the copper mold, they can better
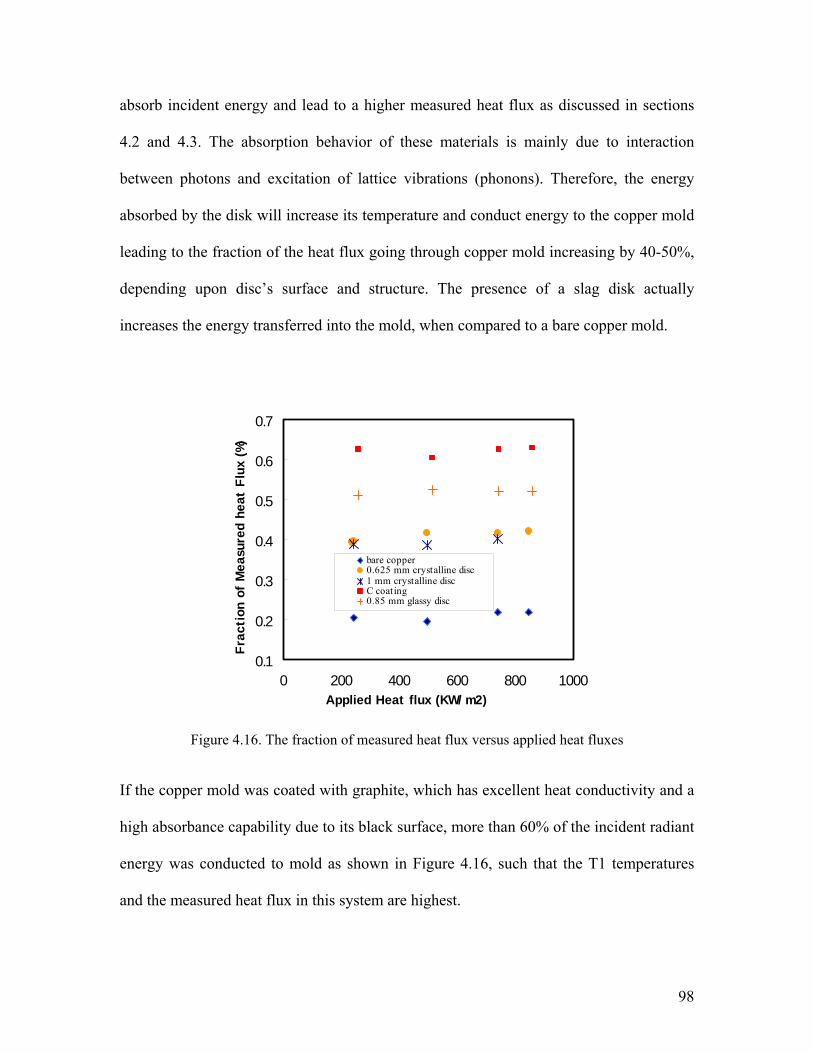
98
absorb incident energy and lead to a higher measured heat flux as discussed in sections
4.2 and 4.3. The absorption behavior of these materials is mainly due to interaction
between photons and excitation of lattice vibrations (phonons). Therefore, the energy
absorbed by the disk will increase its temperature and conduct energy to the copper mold
leading to the fraction of the heat flux going through copper mold increasing by 40-50%,
depending upon disc’s surface and structure. The presence of a slag disk actually
increases the energy transferred into the mold, when compared to a bare copper mold.
0.1
0.2
0.3
0.4
0.5
0.6
0.7
0 200 400 600 800 1000Applied Heat flux (KW/ m2)
Frac
tion
of
Mea
sure
d he
at F
lux
(%)
bare copper0.625 mm crystalline disc1 mm crystalline discC coating0.85 mm glassy disc
Figure 4.16. The fraction of measured heat flux versus applied heat fluxes
If the copper mold was coated with graphite, which has excellent heat conductivity and a
high absorbance capability due to its black surface, more than 60% of the incident radiant
energy was conducted to mold as shown in Figure 4.16, such that the T1 temperatures
and the measured heat flux in this system are highest.
99
All of above results suggest the top surface optical property has a large influence on the
heat transfer rate through metal mold in continuous casting when heat transfer rate is
dominated by radiation.
4.5. Modeling of radiative heat transfer in solid mold flux
With all of above experimental results, it is desirable to set up a model to study the
radiation through the solid mold flux layer to copper mold. As glass, quartz, etc. have
been defined as a “semi-transparent” phase by researchers due to the property that they
absorb radiative energy, the model developed here is through geometric optics and ray
tracing to explore the mechanism of radiative heat transfer from the solid mold flux to
copper mold.
In order to simplify this model, the incident flux is assumed to be normal to the slag disk.
Consider a semitransparent sheet, as depicted in Figure 4.17, represents the slag disk.
When the incident energy I0 first strikes at the interface, part of it is reflected and the
reflected portion is the reflectivity RI0, the remaining flux (1-R)I0 that passes through the
interface will traverse the thickness of the slab while being absorbed and eventually reach
the back side. During the process of traversing, the radiant flux is attenuated
exponentially according to Beer’s Law, which is usually described as following equation:
deT β−= (4.11)

100
where β is the extinction coefficient, and d is the slag thickness. Thus, the part that
reaches the back side will be (1-R)TI0, then a fraction R is reflected by backside and the
rest (1-R)T(1-R)I0 is transmitted to outside. The process of multiple reflections at the
interfaces and traversing of the thickness should be accounted for to determine the overall
reflectance and transmittance of the slag disk. As shown in Figure 4.17, the overall
reflectance ρ and transmittance τ could be calculated via the following equations:
]1
)1(1[....)1()1( 22
2243222
0
2
TRRTRTRRRTRR
II
total −−
+=+−+−+==ρ (4.12)
22
254222
0
1
1)1(.....][)1(TR
RTTRTRTRII
−−
=+++−==τ (4.13)
where I1 is the part of energy to be transmitted and I2 represents the part of energy to be
reflected and lost to the environment. Once I1 is transmitted from slag disk, it acts as
incident energy upon the copper mold. As this energy strikes the top surface of copper
mold, there is around 20% incident energy absorbed by the copper mold as shown in
Figure 4.16. Then by assuming all the rest of the transmitted energy, RcuI1 (it is around
0.8I1 in this case), is reflected back to the slag disk as shown in Figure 4.19.

101
Figure 4.17. The first cycle of light tracing of the semitransparent sheet
Once RcuI1 hits the back side of slag disk in Figure 4.18, part of it, RcuRI1, is reflected, the
rest of it will be transmitted into slag disk as the same procedure as the first incident light
I0 did in Figure 4.17, until the transmitted part I4 lost to the outside environment. The
reflected part RcuI3 then will act as incident radiation upon the back side of the slag sheet
causing the third cycle.
(1-R)2R3T4
(1-R)2T
(1-R)2R2T3
(1-R)2R4T5
I0
R
(1-R)2RT2
I1 I2
(1-R)T
RT(1-R)
1-R

102
Figure 4.18. The second cycle of light tracing of the semitransparent sheet
Therefore, all the procedures will repeat as same as the second cycle till the nth cycle,
when the I2n-1 is so smaller than I0 that it could be neglected. The flowchart for modeling
the mechanism of radiative heat transfer phenomena through solid mold flux to copper
mold is depicted in Figure 4.19. The overall heat lost to environment could be calculated
according to above figures as shown in the following equation.
nloss IIIII 2642 ...++++= (4.14)
This is a two variance program. The first variance j is set up to determine a suitable
extinction coefficient, β, to match the research data; the second variance i is set up to
search for the cycle times, such that I2n-1 could be neglected. The reflectivity, R, of the
(1-R)2T
(1-R)2R2T3
(1-R)2R4T5
RcuI1R
(1-R)2RT2
(1-R)2R3T4
I3 I4

103
disk specimens could be measured by spectrometer. Therefore, the overall Iloss could be
calculated by the following equations:
...])1
)1(1(798.0)1
)1(1(798.01[
*]1
)1([798.0)1
)1(1(
222
2222
22
22
222
22
22
22
+−
−++
−−
++
−−
+−
−+=
TRRTR
TRRTR
TRRTI
TRRTRII ooloss
(4.15)
)1
)1(1(798.01
]1
)1([798.0]
1)1(1[
22
22
222
22
0
22
22
TRRTR
TRRTI
TRRTRII oloss
−−
+−
−−
+−
−+= (4.16)
Combining equations 4.12 and 4.13, equation 4.16 could be rearranged into equation
4.17, which makes the lost energy related to the overall reflectance and transmittance.
)798.01798.0(
2
totaltotaloloss II
ρτρ
−+= (4.17)
The total heat transferred to the copper mold was estimated as 1-Iloss by assuming all the
absorbed energy in the disk was conducted to copper mold.
)]798.01798.0(1[
2
totaltotalolossoabsorb IIII
ρτρ
−+−=−= (4.18)

104
The calculated extinction coefficient and surface reflectivity for crystalline and glass slag
disc are 4500 m-1, 0.598 and 400 m-1, 0.103 respectively. Both values for extinction
(adsorption) coefficient and reflectivity are consistent with other researchers’ results [68,
73]. Therefore, all the above experimental phenomenon: (1) the glassy disk has a better
ability to transfer radiation than the crystalline disk, and (2) the effect of the thickness of
a glass and a crystalline disks on radiation heat transfer is different, and can be explained
in two ways, as it is in the literature [74-76], i.e., by considering the top surface property
and the bulk structure of the disks.
The glassy slag disk has a transparent surface rather than an opaque one, and most of the
incident energy can pass through the top surface resulting in a small value of reflectivity
(0.103). However, the crystalline surface is opaque, blocks a large amount of incident
energy and leads to a larger reflectivity (0.598). Therefore, less energy will pass into and
be absorbed by the crystalline disc. The second factor is the extinction coefficient. The
radiation photons passing across the crystalline layer will be scattered especially at the
surface, phase boundaries and defects, which results in a larger extinction coefficient
(4500 m-1). With these conditions, the thickness of crystalline disk has no significant
effect on radiative heat transfer as penetration is low. However, the absorption coefficient
for a glassy specimen is rather small (400 m-1) due to its amorphous structure, and there
will be a significant role of samples thickness on the radiative heat transfer rate.
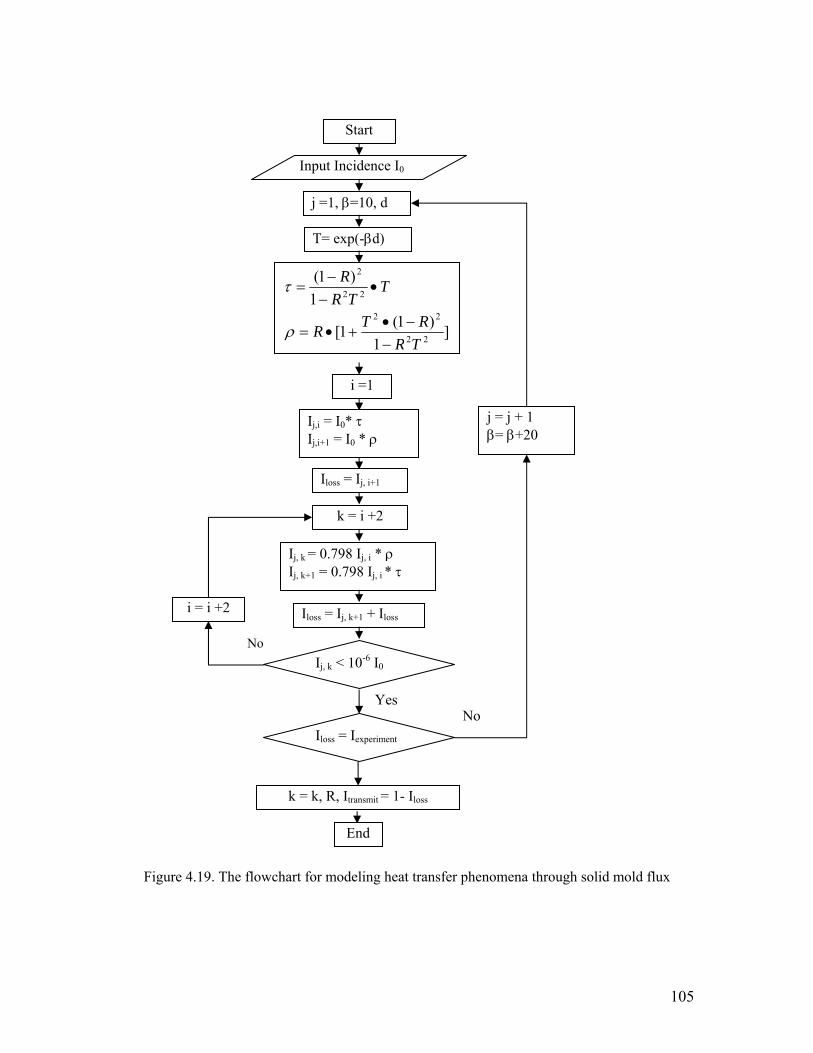
105
Figure 4.19. The flowchart for modeling heat transfer phenomena through solid mold flux
Start
Input Incidence I0
j =1, β=10, d
T= exp(-βd)
]1
)1(1[
1)1(
22
22
22
2
TRRTR
TTR
R
−−•
+•=
•−−
=
ρ
τ
i =1
Ij,i = I0* τ Ij,i+1 = I0 * ρ
Iloss = Ij, i+1
k = i +2
Ij, k = 0.798 Ij, i * ρ Ij, k+1 = 0.798 Ij, i * τ
Iloss = Ij, k+1 + Iloss
Ij, k < 10-6 I0
No
Yes
i = i +2
Iloss = Iexperiment
k = k, R, Itransmit = 1- Iloss
End
No
j = j + 1 β= β+20

106
4.6. The Effect of a mixture of phases on the radiative heat transfer rate
It has been recognized that the glass phase mold flux has a better heat transfer ability than
that of fully crystalline phase mold flux. This section documents the research conducted
of the influence of a mixture of phases within the mold flux on the radiative heat flux and
will indicate the manner by which the radiative heat flux evolves as the crystalline phase
develops in the amorphous disk.
The experiments were simulated by the application of a constant radiative heat flux to the
slag disks, which had been annealed at high temperature for different times to achieve
varied degrees of crystallization. The disks were then placed on top of the copper mold,
and subjected to constant radiation. Subsurface responding temperatures during the
experiments were measured to determine the heat flux that passing through copper mold.
Once steady state is reached heat fluxes are constant as the in disk temperatures at low
heat fluxes are not high enough to lead to significant coarsening of the partially
crystallized structures. Thus the effect of crystallization can be unambiguously measured
in this type of experiment.
0.66 mm glassy slag disks with the same thickness were crystallized at 900oC for
different times to achieve varied crystalline fractions until 100% crystallization was
achieved. The x-ray pattern of the fully crystallized sample was identified as: Cuspidine
(Ca4Si2O7F2 or 3CaO.2SiO2.CaF2). All these samples were then subjected to the same
constant 510 KW/m2 heat flux, and their responding heat fluxes histories are given in
Figure 4.20.

107
100000
120000
140000
160000
180000
200000
220000
240000
260000
280000
0 1000 2000 3000 4000Time S
Mea
sure
d H
eat
Flux
W/m
2
1: The fully glassy sample, 2: annealed at 900oC for 93 seconds, 3: annealed at 900 0C for 118
seconds, 4 annealed for 155 seconds, 5 (for 400 seconds) fully crystalline sample
Figure 4.20. The measured heat flux histories for partially crystallized slag discs
Since longer annealing time leads to a larger fraction of crystalline phase in the sample,
the absorbed energy by the specimen attenuates as the top surface of specimen loses its
transparency and more radiation is scattered, such that the heat flux transferred to copper
mold would reduce till the level of fully crystalline sample as shown in Figure 4.20. The
heat flux passing through copper mold is around 258 KW/m2 for the system of glass disc,
and reduced to around 198 KW/m2 when the glass sample was totally crystallized. This
shows the effect of fully crystallization was to reduce radiative heat transfer rate by
20.5%. Two SEM photos of glass and crystallized disk are presented in Figure 4.21,
where the fully amorphous structure of sample 1 (glass disk) was totally crystallized after
it was annealed at 900 0C for more than 500 seconds, and the equiaxed forms of the
crystals of sample 5 are clearly seen in Figure 4.21 (b).
1
2 3
4 5

108
(a) (b)
Figure 4.21. Two SEM figures for samples1 (a) and 5 (b).

109
4.7. Kinetics of slag disk crystallization
Experiments were conducted by using DHTT to observe the slag crystallization
phenomena. The temperature profile is shown in Figure 4.22, and all the temperatures
were controlled by decreasing or increasing electric current.
The sample (8 mg) of the mold powder was melted on the tips of two thermocouples;
then continuously heated to 15000C for 4-5 minutes to eliminate the gas impurities and to
homogenize its composition. After that, the sample was rapidly cooled to room
temperature to achieve a pure glassy phase, then, lasted for 20 minutes. Finally, the
specimen was crystallized at 900 0C. The video of this procedure was recorded by the
digital camcorder; as well the temperature-time data was stored by the computer
Figure 4.22. Thermal Cycle of experiment
Tem
perature
Time
4-5 min at 1500 0C
Quenching (~85 0C)
Annealing at 900 0C
Cooling at 25oC for 20 minutes

110
The computer with image capturing and analyzing software (NIH Image 162) allows a
series of figures to be recorded to show the procedure of crystallization. Figure 4.23
shows pictures captured during slag crystallization at 900 0C (times appearing in the
upper part of each figure). The fraction of crystalline phase could be determined by the
ratio of opaque area to the total sample area.
Figure 4.23. Crystallization Behavior of mold slag at 900 0C

111
Since the method of using single crystal volume evolution or using the all crystal volume
fraction in the whole sample evolution to measure the crystal growth has been reported to
be identical [20, 21], image analyses were performed to evaluate the volume fraction of
crystals evolved as a function of time to obtain the rate of crystal growth. The Avrami
equation was adapted to describe the kinetics of crystallization in this case.
))(exp(1 nktX −−= (4.19)
in which X is the crystals fraction, k stands for the coefficient corresponding to the
nucleation and growth mechanism, t means time and n is a time exponent. Therefore, the
values for n and k could be determined according to the following equation by
rearranging equation 4.19 into equation 4.20.
nLntnLnkX
LnLn +=−
)1
1(( (4.20)
Having the measured crystals volume fraction data for different annealing time, a plot of
Ln(Ln(1/(1-X)) versus Ln t gives the values of n as the slope of regression line which is
around 3 in Figure 4.24.

112
y = 2.973x - 11.599
- 3.5
- 3
- 2.5
- 2
- 1.5
- 1
- 0.5
0
2 2.5 3 3.5 4Ln Time (S)
Ln (
Ln(1
/(1-
X))
Figure 4.24. The relation of crystals volume fraction evolution with function of time
The crystal volume growth is usually expressed as: 33 *)(34 ttGV −= π , where G is
growth rate and t* is incubation time. Thus the crystal volume fraction could be
calculated by integrating the product of crystals volume growth and nucleation rate in an
infinite time as shown in the following equation:
IdtttGtt
ttXdXX
33
0
*)(* 3
41
−∫=
==
−∫ π (4.21)
where I stands for nucleation rate. Then the Johnson –Mehl -Avrami equation could be
derived as follows:

113
)3
exp(1 43
ItGX π−−= (4.22)
Since the nucleation rate I is a function of t, and the nucleation sites decrease due to the
growth, I is inversely proportional to t, as t
I 1∝ . If the nucleation rate is zero before a
given incubation time, t*, thus, finally the J-M-A equation is simplified as equation 4.23
in this case.
)*))((exp(1 3ttkX −−−= (4.23)
Thus with n equal to 3, the phase transition is at a constant growth rate with a varying
nucleation rate, due to the decrease of nucleation sites with the progression of
crystallization. The comparison of calculated and observed crystal growth rate at 900 0C
and 950 0C was in good agreement up for crystal fraction of 70% as shown in Figure
4.25. The deviation over 70% can be explained by the assumption of constant growth
rate, which is reduced due to the fraction of surface area available for growth sites, f,
which is decreasing with the progression of crystallization phase transition.

114
0
0.1
0.2
0.3
0.4
0.5
0.6
0.7
0.8
0.9
1
0 50 100 150 200
Time S
Cry
stal
line
frac
tion
X
Figure 4.25. Comparison of crystal fraction versus time between calculation and observation
4.8. Quantification of the effect of crystallization on radiative heat transfer
The crystallization kinetics equation at 900 0C for the slag powder could be obtained with
the measured crystal growth rate as shown by equation 4.24.
)))41(0127.0(exp(1 3−−−= tX (4.24)
With this kinetic model, the crystal fractions can be calculated from the mixed phase slag
disks, crystallized at 900 0C for different times. Thus, the measured heat flux passing
X= 1-exp(-(k(t-t*))3) K=0.0273 t* =15s
X=1-exp(-(k(t-t*))3) K=0.0127 t* = 41S
9000C 950 0C

115
through copper mold versus crystal fraction is plotted in the Figure 4.26. It could be
found that the heat flux transferred to the copper mold decreases linearly with the
addition of crystalline phase.
100
120
140
160
180
200
220
240
260
280
0 0.2 0.4 0.6 0.8 1Crystalline Fraction
Mea
sure
d H
eat
Flux
KW
/W2
Figure 4.26. The relation between crystalline fraction and measured heat flux
The model developed in section 4.5 was used to explain the mechanism of radiative heat
transfer across solid mold flux through the copper mold and was adopted to quantify the
effect of crystallization on radiative heat transfer rate. Therefore, the measured heat flux
for a partially crystallized slag disc could be determined according to equation 4.25 by
assuming there is no interaction between the parts of crystalline, X, and 1-X glassy phase.
I = 253.674 - 49.67 X

116
)]}798.01
798.0(1)[1()]
798.01798.0
(1[{2
.
2
.glassy
glassyglassy
cry
crycryo XXII
ρτ
ρρ
τρ
−+−−+
−+−= (4.25)
For the specific 0.66 mm slag disk in this study, the total reflectance and transmittance
for crystalline and glassy phase could be obtained from equations 4.12 and 4.13, upon the
fixed surface reflectivity and extinction, absorption coefficient, which were around 0.598,
4500 m-1 and 0.103, 400 m-1 respectively in section 4.5. The measured heat flux equation
could be simplified into equation 4.26 with the above values.
XIXXII o
67.49674.253]}5026.01)[1()]0001.06.0(1[{
−=−−++−= (4.26)
This model appears to provide excellent agreement with the measured heat flux as shown
in Figure 4.27. The reason for the reduction of heat flux with increase of crystalline
fraction is because more incident radiation is reflected and scattered from the crystals
surface, phase boundaries, and defects, such that less energy would be absorbed and
conducted to mold. If crystal fraction is replaced by crystallization kinetics equation, the
equation 4.26 could be rearranged into 4.27, which describes the measured heat flux
behavior as it varies with crystallization time. A plot of the comparison between the
measured value and predicted results are shown in Figure 4.27.
]}5026.01)[))41(0127.0(exp(]6.01)][))41(0127.0(exp(1{[ 330 −−−+−−−−= ttII (4.27)

117
100
120
140
160
180
200
220
240
260
0 100 200 300 400 500Annealing Time S
Mea
sure
d H
eat
Flux
kW
/m2
Figure 4.27. The relationship between annealing time and measured heat flux
The heat flux passing through mold attenuates exponentially with the increase of
crystallization time, till the full crystallization of the slag sample, which is consistent with
the methods developed before. With longer crystallization time, there will be more
fraction crystallized, leading to less heat absorbed, until the whole sample is totally
crystallized.
Consequently, both crystalline phase and glassy phase mold flux layers enhanced
radiative heat transfer when compared with a bare copper surface and the presence of a
flux improves the heat transfer rate by 20-40%. The glass phase disk has a stronger
radiation transferring ability than crystalline disk, because the glass phase owns an
amorphous structure resulting in a very small absorption coefficient, which is around 400
I= Io [exp(-(kt)3)Iglass + (1- exp(-(kt)3) Icry.)

118
m-1. However, the crystalline phase has a larger extinction coefficient that is 4500 m-1.
Therefore, a large quantity of the thermal radiation will be scattered at the grain
boundaries, defects and surfaces in crystalline samples leading to a decrease in efficiency
in energy transfer. The other contribution of the radiation inhibition of crystalline flux is
its opaque top surface, whose reflectance is around 0.598, and the glass disk is 0.103 in
this study. Thus there will be more incident radiation reflected for the crystalline sample
disk. It is of interest that the crystalline disks display little effect of thickness on radiation
heat transfer rate due to its huge extinction coefficient, a fact that will help moderate local
heat transfer fluctuations due to cast surface irregularities when results are compared to
fully glassy samples. This effect probably accounts for the success of fully crystallized
mold slags in the casting of peritectic steel grades where cast surface wrinkling is
observed.
A heat absorption and conduction model was developed in this study to understand the
mechanism of radiative heat transfer across the solid layer to copper mold. With this
model, the importance of the radiative heat transfer rates in meniscus area of continuous
casting could be explained.

119
5. The Effect of Crystallization and Melting of Mold Flux on Radiative Heat Transfer Rate
5.1 The redesign of the copper mold
In order to increase the glass disk temperatures, such that the solid glassy sample disk
could be crystallized or melted, the copper mold was remodeled as shown in Figure 5.1.
Figure 5.1. Schematic figure of copper substrate used as the radiation target
The mold was simulated by a one-end water cooled copper cylinder, which acts as the
radiation target. The size of the mold target was reduced from 32mm to 10 mm and the
length was elongated to 95mm. Thus, a higher temperature gradient could be achieved
and the heat through the system withdrawn by the cooling water would be less than the
previous design. Thus, the top slag disk surface temperate was increased dramatically due
Mold Flux 10 mm
Thermal couples
Cooling water inlet
Cooling water outlet
95mm
Chilled surface

120
to the increased higher temperature gradient through the copper mold, when the thermal
flux (infrared radiation) was applied to the top surface of the mold flux disk. All of the in-
mold response temperatures were measured using the sub-surface thermocouples.
An example of 4.5 mm thick glass mold flux disk (initial 403) whose composition listed
in table 5.1 was subjected to the thermal radiation. The applied power was first set as a
constant power and changed step by step, as shown in Figure 5.2.
Table 5.1: The major composition of mold flux (initial 403)
Chemical composition (mass %)
SiO2 CaO MgO Al2O3 Na2O F
Basicity
CaO/SiO2
35 37.7 1.3 2.6 10.8 8 5.3 1.077
0
1000
2000
3000
4000
5000
6000
7000
8000
9000
10000
0 1000 2000 3000 4000
Time s
Pow
er W
Figure 5.2. The applied step constant power

121
All the response temperatures during the experiment were recorded in Figure 5.3. T1 here
represents the top surface temperature of the slag disk, T2, T3 and T4 stand for the
subsurface response temperatures 5, 10, and 15 mm below the hot surface respectively.
All of the response temperatures were increased in steps with the increase of incident
thermal energy, and all approached to steady state very quickly. The top disk surface
temperature can reach up to 1200 Celsius under the power of 10000 W due to the
improved heat absorbance of the new system. T1 decreased once it reached 1200 Celsius
due to the melting of the top disk surface, as the T1 thermocouple fell from the fixed
position.
0
200
400
600
800
1000
1200
0 1000 2000 3000 4000Time S
Tem
pera
ture
oC
Figure 5.3. All the responding temperatures during the experiments
Thus the new design is possible to melt top surface of the flux developing a thermal
profile more similar to a continuous caster.
T1
T2
T3
T4

122
5.2 The effect of mold flux crystallization on radiative heat transfer
5.2.1 Observation of the influence of crystallization on heat flux
It has been recognized that the crystalline phase of mold flux retards the radiation heat
transfer rate due to the development of an opaque top surface and a large extinction
coefficient, such that the film thickness has no significant effect on the radiation heat
transfer rate over the range of thickness that were measured [74-76]. In order to quantify
the relationship between the extent of mold flux crystallization and the heat transfer rate
to a water cooled copper mold, a constant radiative heat flux was applied to a glass slag
disk, which was initial glassy, and placed on top of a copper mold. During the experiment,
and as the glass disk increased in temperature, crystallization of the slag disk occurred,
and then the corresponding in-mold heat transfer rate would change along with the disk
crystallization, which could be determined via the measurement of subsurface responding
temperatures in real time.
A pure glassy disk (2.8 mm) with a K type thermocouple connected to its top surface was
first placed on top of copper mold. As indicated by its X-ray pattern as shown in Figure
5.4 (a), the disk is amorphous as the sample is without any characteristic peaks that
would indicate the presence of a significant fraction of crystals. A 200 KW/m2 constant
thermal radiation was applied to pre-heat the system for 5 minutes, then, a higher
constant 850 KW/m2 thermal radiation was supplied to anneal and crystallize the
amorphous disk, until up to 100% crystallization was achieved. The x-ray pattern of the

123
fully crystallized sample is shown in Figure 5.4 (b) where the crystallized phase was
identified as: Cuspidine (Ca4Si2O7F2 or 3CaO.2SiO2.CaF2).
Figure 5.4 (a). X-ray pattern of glassy slag disc; (b). X-ray pattern of crystallized sample
The real-time responding temperatures of all thermocouples in the mold were recorded
and are shown in Figure 5.5 (a). The corresponding heat transfer rate during the process
in the copper mold was calculated and presented in Figure 5.5 (b).
0
100
200
300
400
500
600
700
800
900
1000
0 1000 2000 3000
Time S
Res
pond
ing
tem
pera
ture
C
T1
T2
T4
30000
130000
230000
330000
430000
530000
630000
730000
0 1000 2000 3000
Time S
Resp
ondi
ng h
eat f
lux
W/m
2
T1 represents the top surface temperature of sample disk, T2 and T4 stand for the subsurface temperatures in the mold
5 and 15 mm below the hot surface of copper mold.
Figure 5.5(a): Responding temperatures in the system; (b): Measured heat flux in copper mold

124
The system under 850 KW/m2 thermal radiation was heated, and the top surface of the
mold flux disk approached 900 degree C within few minutes and then kept relatively
constant. The very interesting issue appearing in the process of disk annealing is that the
heat transfer rate passing through the disk to copper mold attenuated from 620 KW/m2 to
530 KW/m2. A detailed study of this phenomenon will be address in following section
5.2.2.
In order to investigate the net effect of slag disk crystallization on heat transfer rate in
continuous casting, a series of similar experiments for the systems with 2.8 mm glass
disks were performed under different conditions of thermal radiations for different times
to observe how the in-mold heat flux evolves with the development of crystallization.
The responding heat fluxes in the mold under different crystallization conditions are
given in following Figures 5.6 and 5.7. The heat transfer rate of sample 1 (under 700
KW/m2 thermal radiation for 362 seconds) in Figure 5.6, comes to a meta-steady state
when the system was heated, i.e., transition state (sample 1) prior to attenuation, and
there is no any phase transformation at this moment. The sample remains transparent as
shown in Figure 5.9. As the glass disk was heated for a longer time to 740 seconds
(sample 2), crystallization was observed to initiate. A very thin cream white crystalline
layer could be observed on the top surface of sample 2 in Figure 5.9, and there is a trend
for the heat flux to start attenuate at the end of the heat flux line of sample 2 as shown in
Figure 5.6.
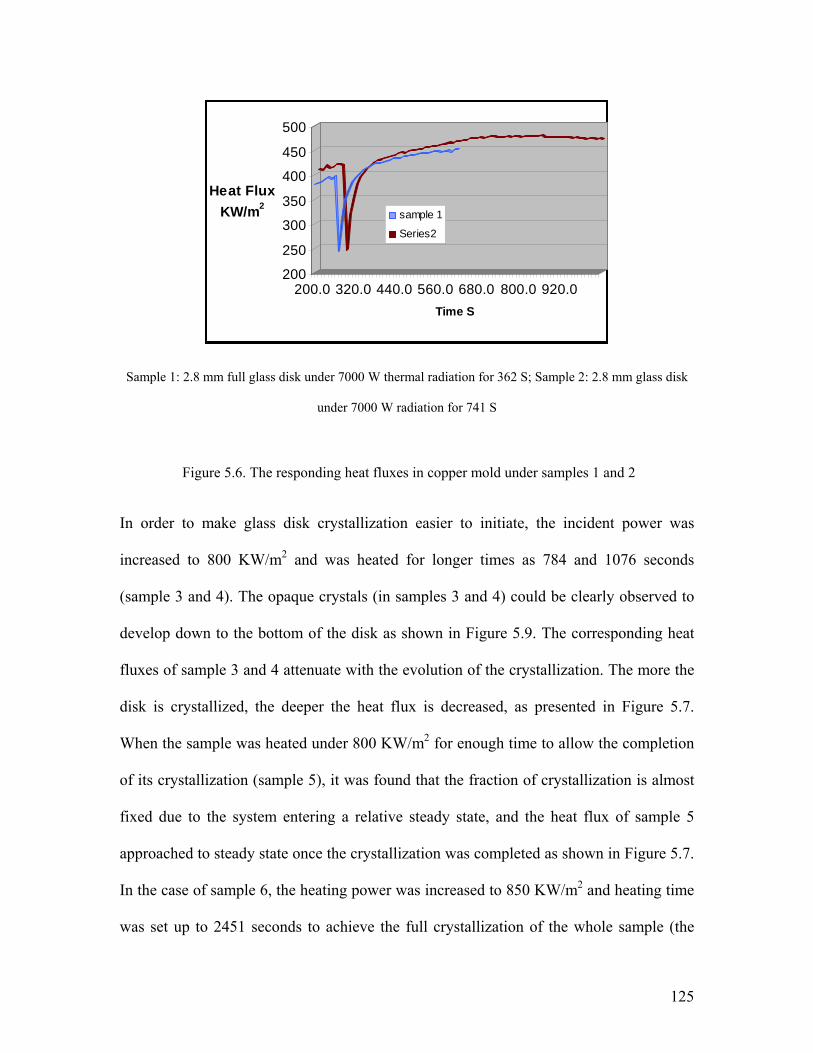
125
200
250
300
350
400
450
500
Heat Flux KW/m2
200.0 320.0 440.0 560.0 680.0 800.0 920.0Time S
sample 1
Series2
Sample 1: 2.8 mm full glass disk under 7000 W thermal radiation for 362 S; Sample 2: 2.8 mm glass disk
under 7000 W radiation for 741 S
Figure 5.6. The responding heat fluxes in copper mold under samples 1 and 2
In order to make glass disk crystallization easier to initiate, the incident power was
increased to 800 KW/m2 and was heated for longer times as 784 and 1076 seconds
(sample 3 and 4). The opaque crystals (in samples 3 and 4) could be clearly observed to
develop down to the bottom of the disk as shown in Figure 5.9. The corresponding heat
fluxes of sample 3 and 4 attenuate with the evolution of the crystallization. The more the
disk is crystallized, the deeper the heat flux is decreased, as presented in Figure 5.7.
When the sample was heated under 800 KW/m2 for enough time to allow the completion
of its crystallization (sample 5), it was found that the fraction of crystallization is almost
fixed due to the system entering a relative steady state, and the heat flux of sample 5
approached to steady state once the crystallization was completed as shown in Figure 5.7.
In the case of sample 6, the heating power was increased to 850 KW/m2 and heating time
was set up to 2451 seconds to achieve the full crystallization of the whole sample (the

126
sample was fully crystallized as shown in Figure 5.9). Then, it could be observed that the
heat flux was attenuated dramatically with the development of crystallization, and finally
approached steady state when the disk was totally crystallized.
300
400
500
600
700
Heat flux KW/m2
200.00 560.00 920.00 1280.0 1640.0 2000.0 2360.0Time S
sample 3
sample 4
sample 6
sample 5
Sample 3: 2.8 mm glass disk under 8000 W for 784S; sample 4: under 8000 W for 1076S; sample 5: 2.8 mm
glass disk under 8000 W for 2714 S; sample 6: under 8500 W for 2451 S.
Figure 5.7. The responding heat fluxes in copper mold under sample 3, 4, 5 and 6.
T1, the top surface temperatures of specimen disks in above experiments, was studied, in
order to further investigate the crystallization phenomena of the slag disk. All the T1
values suggested that the responding temperatures of the top disk range from 700 Co to
1000 Co depending upon the applied radiation power (700 KW/m2 to 850 KW/m2). With
such a temperature of the disk, the original amorphous disk should be crystallized
according to the mold flux TTT diagram shown in Figure 5.8 [21]. Therefore, the longer
the sample was subjected to thermal radiation or the higher temperature the disk achieved
during annealing, the more the disk will be crystallized.

127
Figure 5.8. TTT diagram of industrial mold flux studied by Kashiwaya, etc [21]
The opaque crystals were initiated and developed at the top surface of the disk as shown
in Figure 5.9 sample 2, where the samples were heated by the absorbed thermal energy.
The crystals then grew down to the bottom of the disk (sample 3, 4, 5) due to the existing
large temperature gradient in the disks causing by the thermal resistance of mold flux.
Once the disk was annealed for a long time under high temperature, it was totally
crystallized as seen in Figure 5.9 sample 6.

128
Sample (1) (2) (3)
(4) (5) (6)
Figure 5.9: Side view of the samples
The crystallization of slag disk retards the heat transfer rate across mold flux to the
copper mold as shown in Figure 5.7. As the annealing time increased, there was a larger
fraction of crystalline phase developed in the sample. Thus, the absorbed thermal energy
passing through the specimen tended to attenuate as the top surface lost its transparency
and more radiation was reflected and scattered. Therefore, the transferred heat flux in the
copper mold reduced until full crystallization of the sample, when the whole system
reached steady state as shown in Figure 5.7. The original heat flux transmitted to the
copper mold is 620 KW/m2 for the system covered 2.8 mm glass disk under the constant
850 KW/m2 thermal radiation (sample 6); and it decreases to 530 KW/m2 when it was
totally crystallized, which means the net effect of crystallization was to inhibit the overall
heat transfer rate by 17%. Three SEM photos of sample 5, which was partially
0.2mm

129
crystallized at different depths (from the top to the bottom), were presented in Figure
5.10, where the equiaxed forms of the crystals were clearly seen. It confirms that
crystallization was easily initiated at high temperature due to the shorter incubation time,
high nucleation density and subsequent growth rate. However, the density of the crystals
decreased with the depth, due to the large existing temperature gradient as shown in the
following pictures.
Figure 5.10. Microscope photos for sample 5.
80 μm 40 μm 80 μm

130
5.2.2 Quantification of the effect of crystallization on radiative heat transfer rate
The 2.8 mm thick glass disk in section 5.2.1 was studied further to help quantify the net
effect of crystallization on the heat transfer rate. If the heat transfer rate across the sample
was plotted during the development of crystallization, as shown in Figure 5.5 b, in terms
of the fraction of the transferred energy versus time as presented in Figure 5.11, a net
12% (from 72% to 60%) overall heat transfer reduction was observed with the
development of crystallization.
30000
130000
230000
330000
430000
530000
630000
730000
300 1300 2300
Time S
Resp
ondi
ng h
eat f
lux
W/m
2
0.2
0.3
0.4
0.5
0.6
0.7
0.8
300 1300 2300
Time S
Rat
io
Figure 5.11. The responding heat transfer rate in the system of 2.8 mm glass disk
With such a significant heat transfer reduction, it becomes desirable to investigate how
the heat transfer decreases with the evolvement of crystallization. The crystal fractions in
the mixed phase slag disk in Figure 5.9 were measured and plotted versus fraction of the
transferred heat fluxes in the Figure 5.12. The regression of the data in Figure 5.12 has

131
shown that the ratio of the heat flux transferred to the copper mold decreases inversely
with the addition of crystalline phase.
0.5
0.55
0.6
0.65
0.7
0.75
0.8
0 0.2 0.4 0.6 0.8 1
Fraction of crystal
Ratio
of t
he tr
ansf
erre
d he
at fl
ux
Figure 5.12. The relation between crystalline fraction and measured heat flux
The reason for the heat flux reduction with the development of crystallization of mold
flux was studied based on the variance of the mold flux thermal properties. Because there
is a phase transformation during the processing of the flux annealing at high temperature
when the amorphous glass disk was receiving thermal radiation, crystals nucleate and
grow to form an equiaxed structure leading to a dramatic change of mold flux thermal
properties.
The crystallization of a mold flux should introduce an increase of thermal resistance, and
this fact has been widely used to moderate the local heat transfer fluctuations that occur
due to cast surface irregularities in the casting of peritectic steel grades. However, there is
103.3727.02224.2+X

132
no quantification of the corresponding heat flux evolution in a copper mold with the
development of crystallization. In order to explore this issue, the total heat flux across
disk to mold was determined based on the following assumptions: (1) the solid mold flux
consists of glass and crystalline layers in series; (2) heat flows one dimensionally through
the solid mold flux to copper mold; and (3) there is no interaction between the radiation
and conduction. The schematic figure of the temperature distribution, thermal resistances
is presented in Figure 5.13.
Figure 5.13. Schematic representation of the temperature distribution and thermal resistance
Here qtot is the total heat flux passing across the disk to copper mold, T1 is the top surface
temperature of the slag disk, T2 and T3 stand for the subsurface responding temperatures
5 and 15 mm below the hot top surface, Ts/c represents the interfacial temperature
between the disk and copper mold, dcry and dglass mean the thickness of the solid
crystalline layer and glass layer respectively, Kcry and Kglass stand for the thermal
T2 T3
qtot qtot
Ts/c
Rcry Rglass Rint
T1 d
Tm
dcry
Kcry Kglass
dglass
d3 d1

133
conductivity for the solid crystal layer and glass layer, and Tm represents the hot surface
temperature of mold.
Thus, the total heat flux, qtot, passing through copper mold at steady state could be
determined by using Fourier’s First Law as shown in Equation (5.1) with the measured
responding subsurface temperatures T2 and T3.
radcond
slag
cs
glass
glass
cry
cry
cscoppertot qq
KdTT
Kd
Kd
TTd
TTKq +=−
=+
−=
−= // 11
1)32( (5.1)
Here, Kcopper, slag is the thermal conductivity of copper, slag disk, d1 is the distance
between T2 and T3, d is the thickness of disk, qcond and qrad stand for the conductive and
radiative heat transfer rate respectively, Kcry, glass stands for the thermal conductivity when
the slag at the stage of full crystalline and glass phase respectively. Thus, the top surface
temperature of the mold, Tm, could be derived as:
32 dkq
TTcopper
totm += (5.2)
The interface temperature, Ts/c, in Figure 5.13 could also be determined as equation 5.3:
int/ RqTT totmcs ×+= (5.3)
Before the derivation of other thermal properties like thermal conductivity, resistance,
etc., the case of sample 6 with 2.8 mm glass disk under 850 KW/m2 thermal radiation
was utilized to investigate the thermal properties of mold flux disk under two extreme
circumstances, i.e., glass phase and crystalline phase. It has been assumed that the total
heat flux in the system is composed of conductive and radiative types as shown in

134
equation 5.1. The radiative heat transfer in the solid mold flux is calculated via the gray
gas approximation as shown in equation 5.4, which is also employed by other researchers
[43, 68].
)175.0/(
)1(112
44
−++=
−×=−−
cs
rad
dn
TmTq
εεασφ
φ (5.4)
in which ф stands for the radiative heat transfer coefficient, n is refractive index, which is
usually referred to be 1.6 [63], σ, the Boltzmann constant is 5.6705 *10-8 (W/(m2K4), α is
absorption coefficient is 400/m for glass and 4500/m for crystal; εs and εc are the
emissivity of the slag surface and copper mold surface and they are 0.92 (glass), 0.7
(crystalline) and 0.4 (copper) individually [85]. Therefore, the determined radiative heat
transfer rate in the two circumstances could be calculated as following:
2441 /2.98)( mKWTTq mrad =−= φ (Glass phase)
2441 /7.21)( mKWTTq mrad =−= φ (Crystalline phase)
The total heat fluxes in above extreme circumstances are also obtained as 620 KW/m2
and 530 KW/m2 for glassy phase and crystalline phase respectively from Figure 5.11.
Therefore, the contribution of the radiation to the overall heat transfer rates in the glassy
phase is around 16% and it reduces to less than 4% in the fully crystallized sample. Thus,
the heat transfer in a solid crystallized flux is mainly by conduction. The net difference of
the total heat transfer rate in two phases, which is around 80 KW/m2, could be accounted
for the main reduction of radiative heat flux during the mold flux crystallization. With the
fact of the 12% radiation reduction by the flux crystallization, it is desirable to study the

135
effective thermal conductivity of solid mold flux, Kslag. The effective thermal
conductivity of the disk, Kslag, at the two extreme conditions (glass and crystalline phase),
i.e., Kglass and Kcry, is able to be determined in equation 5.5. The effective thermal
conductively could also be split into the conduction and radiation parts for the purpose of
understanding how the radiation changes with the flux crystallization. The radiation and
conduction thermal conductivity Krad and Kcond are determined based on equation 5.4.
radslagcond
cs
csrad
cscry
cs
tot
glass
KKKTT
TTdK
TTationcrystallizafterqtotdK
TTationcrystalliztopriorqdK
−=−−
=
−=
−=
/
4/
4
/1
/1
1)1(
)(
)(
ϕ
(5.5)
The calculated values for Kglass, Kcry, Krad and Kcond under the two phases are given in
Table 5.2.
Table 5.2. Some calculated thermal conductivity values for sample 6
Sample 6
qtot
Kslag (W/m.K) Kcond(W/m.K) Krad(W/(m.K)
qglass 617.643 3.8 3.12 0.68 qcrystal 530.154 3.10 3.02 0.08
The effective thermal conductivity of slag disk, Kglass, for a glassy flux is 3.8 W/(m.K)
due to a larger radiation contribution to the flux that is around 16% where Krad was 0.68
W/(mK). However, it reduces to 3.1 W/(m.K) when the flux is fully crystallized. The fact
for this reduction is due to most of the radiation is inhibited by the flux crystallization.

136
Therefore, how the effective thermal conductivity of the slag, Kslag, evolves with the
development of crystallization within these two limits is essential to be studied. By
rearranging equation 5.1 into equation 5.6, the effective flux thermal conductivity could
be calculated, when the disk is partially crystallized. It has been assumed that the volume
fraction of crystals is X and there is no interaction between radiative and conductive heat
flux.
cryKXglassXKcryKglassK
TTq
dslagKcs
tot
)1(
*
/1 −+=
−= (5.6)
Since the Kglass has a larger value than Kcry, the total slag thermal conductivity attenuates
with the development of slag disk crystallization, which means the precipitated crystals in
the amorphous phase tend to block phonons to pass through the mold flux resulting in a
decrease of the effective thermal conductivity and an increase of the thermal resistance of
the slag disk. The experimentally determined effective thermal conductivity of the mixed
phase disk fits well with the model, when the measured Kslag is plotted versus the
corresponding crystal fraction, X, as shown in Figure 5.14.

137
3
3.2
3.4
3.6
3.8
4
0 0.2 0.4 0.6 0.8 1
Part of crystallization
Them
al c
ondu
ctiv
ity o
f sla
g W
/(Km
)
Figure 5.14. The change of thermal conductivity of mold flux versus the development of crystallization
As for the total thermal resistance, Rtot, it could be calculated by assuming that there are
only two kinds of resistance existing in the system, i.e, interfacial thermal resistance in
between the slag disk and copper mold, Rint, and the disk thermal resistance, Rslag as
defined in Figure 5.13. Therefore, the total thermal resistance is able to be obtained with
the measured temperature gradient from the top slag disk temperature, T1, to the hot
surface temperature of mold, Tm, and the known total heat flux passing through the
system in equation 5.7.
slagcstot
csslag
tottot K
dR
dTT
K
TTRRR
qTmTR +=
−−
+=+=−
= int1
1/
/1intint (5.7)
Thus, once the slag disks are completely crystallized, the measured total thermal
resistance, Rtot, at final steady state would be the interfacial resistance, Rint, plus the
resistance from the crystalline slag disk, Rslag-cry. Therefore, a plot of Rtot versus d, the
thickness of crystal slag disks, will give the values interfacial thermal resistance as the
crystalKXglassXKcrystalKglassK
slagK)1(
*
−+=

138
intercept, Rint, and crystal slag thermal conductivity as the reverse value of the slope, Kcry,
as shown in Figure 5.15. The obtained interfacial thermal resistance is around
4104 −× m2K/W, and Kcry is about 3.16 W/(m.K), which are consistent with the values
(3.1 W/(m.K)) in Table 5.2 and others’ reports [73, 68].
y = 0.3162x + 0.0004R2 = 0.9615
0.0002
0.0006
0.001
0.0014
0.0018
0.001 0.002 0.003 0.004 0.005
Thickness m
Tota
l. Th
erm
al R
esis
tanc
e m
2 K/W
Figure 5.15. The total thermal resistance versus thickness of slag disks
The total thermal resistance of the slag disk could also be derived as the following
equations, if the slag is assumed to be composed of two vertical layers, glass and
crystalline.
glasscryglasscryglass
glass
cry
cry
slagtot
csslag
glasscryslagtot
mtot
RXXRK
dXKXd
Kd
Kd
Kd
qTT
R
RRRRRq
TTR
)1()1(1
1
/
intint
−+=−
+=+==−
=
++=+=−
=
(5.8)

139
Thus, the thermal resistance of slag disk increases linearly with the development of
crystallization. All of the experimental results fit well with these developed models and
equations as shown in Figure 5.16. Therefore, it was concluded that the reason for the
reduction of heat flux across solid mold flux to mold with the development of mold flux
crystallization is because the precipitated crystals introduce a larger thermal resistance of
the slag disk causing its thermal conductivity to decrease.
0.0005
0.0007
0.0009
0.0011
0.0013
0.0015
0 0.2 0.4 0.6 0.8 1
Part of crystallization
Ther
mal
resi
stan
ce m
2 K/W
Figure 5.16. The change of thermal resistance of mold flux versus the development of crystallization
5.2.3 The Effect of thickness of mold flux on heat transfer
Experiments were carried out to investigate the effect of the thickness of solid mold flux
on the radiative heat transfer rate by placing different thickness of glass slag disks on top
of the copper mold under same conditions of thermal radiation. The mold was tightly
insulated with ceramic wool with the aim to study the effect of both crystallization and
thickness on heat transfer rate. A 2.3 mm glass disk was first studied in this new well
insulated system. It was pre-heated under 200 KW/m2 thermal radiation for 5 minutes
glasscryslag RXXRR )1( −+=
Rtot
Rslag

140
followed by applying a high constant 1050 KW/m2 thermal heat flux until full
crystallization of the sample was achieved. The measured heat flux going through copper
mold and its overall ratio to the incident thermal flux was given in Figure 5.17.
1.0E+05
2.0E+05
3.0E+05
4.0E+05
5.0E+05
6.0E+05
7.0E+05
8.0E+05
9.0E+05
0 400 800 1200 1600
Time S
Mea
sure
d he
at fl
ux W
/m2
0.1
0.2
0.3
0.4
0.5
0.6
0.7
0.8
Ove
ral R
atio
Measured heat flux
Overal ratio
Figure 5.17. The in-mold responding heat flux and its overall ratio versus time
The responding heat flux shown above indicates three stages appearing in the heat flux
history: an incubation time, an attenuation stage and a period of steady state. During the
first stage, it takes 100-200 seconds for the system to heat up to reach the maximum
value of the heat transfer rate; then it reaches a meta-steady state prior to the initiation of
crystallization, which is usually termed as incubation time. After that, the heat flux begins
to attenuate from 815 KW/m2 once the crystallization initiated, and reduce to the steady
state at 700 KW/m2, when crystallization of the sample was completed during the
attenuation stage. The net effect of crystallization for the 2.3 mm thick glass disk is to
reduce a 15% radiation transmitted to the mold (from 75% to 60%). Finally, the
attenuated heat flux tends to steady state at around 60% of the incident thermal flux.

141
Similar experiments with different thickness of glass disks were carried out to investigate
the influence of the thickness of a glass disk on the radiative heat transfer rate. Five
glassy disks with the thickness ranging from 1.45 mm to 2.98 mm were placed on top of
the copper mold and annealed under 1050 KW/m2 thermal radiation individually, until
the full crystallization was completed and their corresponding heat flux are given in
Figure 5.18 (a), (b), (c), (d), (e) and (f). It was observed that the maximum heat flux for
the 1.48 mm thick glass disk is 792 KW/m2 and it reduces to 700 KW/m2 when the
crystallization is completed. For the 2.98 mm thick glass flux disk, it transferred 81.5% of
the incident thermal energy to the mold causing a high heat transfer rate of 863 KW/m2,
and it attenuates to 693 KW/m2 when crystallization is completed. The each individual
maximum heat transfer rate prior to the crystallization and the final steady state heat flux
after crystallization are listed in Table 5.3.
3.E+05
4.E+05
5.E+05
6.E+05
7.E+05
8.E+05
9.E+05
0 500 1000 1500 2000 2500
Time S
Mea
sure
d he
at fl
ux W
/m2
(a)

142
3.E+05
4.E+05
5.E+05
6.E+05
7.E+05
8.E+05
9.E+05
0 1000 2000 3000
Time S
Mea
sure
d he
at fl
ux W
/m2
(b)
3.E+05
4.E+05
5.E+05
6.E+05
7.E+05
8.E+05
9.E+05
0 500 1000 1500 2000 2500 3000
Time S
Mea
sure
d he
at fl
ux W
/m2
(c)

143
3.E+05
4.E+05
5.E+05
6.E+05
7.E+05
8.E+05
9.E+05
0 500 1000 1500 2000 2500
Time S
Mea
sure
d he
at fl
ux W
/m2
(d)
3.E+05
4.E+05
5.E+05
6.E+05
7.E+05
8.E+05
9.E+05
0 500 1000 1500 2000
Time S
Mea
sure
d he
at fl
ux W
/m2
(e)

144
0.E+00
1.E+05
2.E+05
3.E+05
4.E+05
5.E+05
6.E+05
7.E+05
8.E+05
9.E+05
1.E+06
0 500 1000 1500 2000 2500
Time S
Mea
sure
d he
at fl
ux W
/m2
(f)
Figure 5.18. Measure heat fluxes under (a) 1.45, (b) 1.83, (c) 2.3, (d) 2.47, (e) 2.6 and (f) 2.98 mm thick glass disks
Table 5.3 The heat transfer rates prior and after crystallization
Thickness 1.45 mm
1.83 mm
2.3 mm
2.47 mm
2.6 mm 2.98 mm
Heat flux prior to crystallization
(KW/m2)
792 808 810 826 840 863
Heat flux after crystallization
(KW/m2)
700 685 695 692 697 693

145
All of the responding heat fluxes under above 6 conditions and their individual overall
ratios are combined together and shown in Figure 5.19.
300000
500000
700000
900000
0 1000 2000 3000Time S
Mea
sure
d he
at fl
ux W
/m2
HF 1.45
HF1.83
HF2.61
HF2.98
HF 2.47
HF 2.3
Figure 5.19. The in-mold responding heat fluxes and their overall ratios versus time under glass slag disks
0.2
0.3
0.4
0.5
0.6
0.7
0.8
0.9
0 1000 2000 3000
Time S
Ove
ral r
atio
of t
he m
easu
red
heat
flu
x Ratio 1.48
Ratio 1.83
Ratio 2.3
Ratio 2.47
Ratio 2.6
Ratio 2.98

146
It is clear in Figure 5.19 that the thicker the disk, the larger the maximum of the heat
transfer rate would be, which follows our previous studies. The detailed relationship
between the thickness of the fully glassy disk and its heat transferring ability is presented
in Figure 5.20, where the maximum heat flux is plotted as a function of thickness before
the onset of crystallization.
It also confirms that the thickness of fully crystallized solid mold flux has no significant
effect on radiative heat transfer rate as presented by all the final heat fluxes at steady state
after the completion of crystallization in Figure 5.19, where all the final steady heat
fluxes are at the same magnitude, regardless of their thickness. The other interesting
phenomena from this study are the first stage incubation time and attenuation rate varied
with disks’ thickness. It is observed that there is a shorter incubation time and steeper
attenuation rate in the system with a thicker mold flux, which probably attributed to the
fact that the thicker samples could transfer a higher ratio of incident thermal energy
resulting in a higher responding temperature in the system, and promote a shorter
incubation time and a larger crystallization rate.

147
740
760
780
800
820
840
860
880
1.45 1.83 2.3 2.47 2.61 2.98
Thickness mm
Max
mea
sure
d he
at fl
ux
KW
/m2
0.64
0.66
0.68
0.7
0.72
0.74
0.76
0.78
0.8
0.82
0.84
Ove
ral r
atio
Figure 5.20. The relationship of the glassy slag disk thickness and its heat transferring ability
In order to investigate the ability of glass mold flux to transfer radiation, the heat
absorption and conduction model developed in section 4.5 was applied to above results.
Noting the following equations:
]}]
)(exp1)1)((exp1[1
])(exp1
)1()[exp()
)(exp1)1)((exp1([1{
)]1
(1[
22
22
,
222
2
,
22
22
,
2,
dRRdRR
dRRdR
dRRdRII
RR
IIII
coppersystem
coppersystem
otransfer
totalcoppersystem
coppersystemtotalolossotransfer
ββ
ββ
ββ
ρτ
ρ
−−−−
+−
−−−
−+
−−−−
+−=
−+−=−=
(5.9)
With the input of the surface reflectivity of the disk, R, the extinction coefficient values,
β, and the copper mold thermal heat reflectivity value, Rsystem,copper, the heat flux
transferred to the copper mold through mold flux disk could be calculated. The copper
-- Max heat flux -- Overall ratio

148
mold thermal heat reflectivity, Rsystem,copper, is determined as 0.49 in this new insulated
system as indicated in Figure 5.21, which dramatically improves the heat absorbance,
where the ratio of the transferred heat flux into the mold is approximately 51%, when the
bare copper system is under the 200, 600 and 900 KW/m2 thermal radiation.
0
0.1
0.2
0.3
0.4
0.5
0.6
0 500 1000 1500Time S
over
al r
atio
Figure 5.21. The ratio of transferred heat flux under different thermal radiation
The comparison of the predicted and experimental data (in Figure 5.20) using the above
model are presented in Figure 5.22. It was found that the heat transfer rate increased with
disk thickness according to above model and in line with the experimental results. The
sample with a thickness of 2.98 mm could transfer 81% incident thermal flux, while it
reduces to 71% once the thickness is down to 1.45mm, which confirms the formal results
that the thicker of the glass disk, the better ability the sample is able to transfer radiative
heat flux.
200 KW/m2
600 KW/m2
900 KW/m2
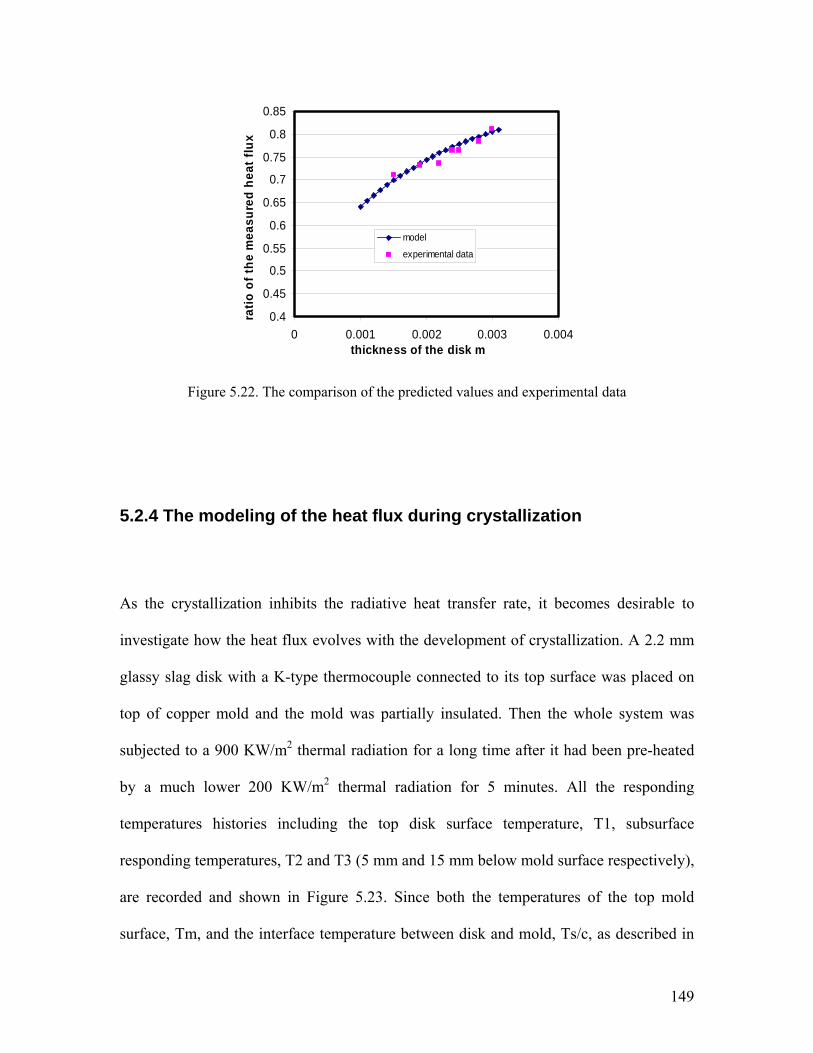
149
0.4
0.45
0.5
0.55
0.6
0.65
0.7
0.75
0.8
0.85
0 0.001 0.002 0.003 0.004thickness of the disk m
ratio
of t
he m
easu
red
heat
flux
model
experimental data
Figure 5.22. The comparison of the predicted values and experimental data
5.2.4 The modeling of the heat flux during crystallization
As the crystallization inhibits the radiative heat transfer rate, it becomes desirable to
investigate how the heat flux evolves with the development of crystallization. A 2.2 mm
glassy slag disk with a K-type thermocouple connected to its top surface was placed on
top of copper mold and the mold was partially insulated. Then the whole system was
subjected to a 900 KW/m2 thermal radiation for a long time after it had been pre-heated
by a much lower 200 KW/m2 thermal radiation for 5 minutes. All the responding
temperatures histories including the top disk surface temperature, T1, subsurface
responding temperatures, T2 and T3 (5 mm and 15 mm below mold surface respectively),
are recorded and shown in Figure 5.23. Since both the temperatures of the top mold
surface, Tm, and the interface temperature between disk and mold, Ts/c, as described in

150
Figure 5.13, could be calculated with equations 5.2 and 5.3, their responding
temperatures were also given along with T1 and T2.
100
300
500
700
900
0 500 1000 1500 2000 2500Time S
Res
pond
ing
tem
p. D
eg C
T1
T2
T3
Tm
Ts/c
Figure 5.23. The responding temperatures’ histories in system with 2.2 mm glass disk
With the responding temperatures gradient history in the mold, the in-mold heat flux is
calculated and is presented as the green line in Figure 5.24. Since the heat flux through
the slag disk is equal to that of copper mold once the system reaches steady state, the heat
flux could also be determined via the temperature gradient appearing in slag disk. Thus
the other way to measure heat flux in the system could be obtained by the combination of
equations 5.1 and 5.6 into equation 5.10.
dTT
KXXKKK
KdTT
q cs
cryglass
cryglass
slag
cstot
/1/
)1(1 −
∗−+
•=
−= (5.10)

151
Therefore, the evolvement of heat flux in copper mold in function of time could be
determined by the input of the crystallization kinetics model developed in section 4.7 into
equation 5.10.
dTT
KttkKttkKK
q cs
cryglass
cryglasstot
/133 *)*)))((exp(]*)))((exp(1[
−−−+−−−
•=
(5.11)
With the values derived in section 5.3.1: Kcry = 3.1 W/(Km), Kglass = 3.83 W/(Km),
d=0.0022m, and the estimated Ts/c values in Figure 5.23. The predicted heat flux line
during crystallization is shown as pink in the following Figure 5.24.
200000
300000
400000
500000
600000
700000
800000
0 500 1000 1500 2000 2500
Time S
Mea
sure
d he
at fl
ux W
/m2
measured in-mold heat flux
predicted heat flux
Figure 5.24. The comparison of the measured and predicted heat flux in the experiment

152
Here the nucleation and growth coefficient k was chosen as 0.0035 to fit for the
experimental results, and was in the range of other researchers results [22]. The
incubation time, t*, was around 152 seconds. The disk prior to the crystallization is in a
fully glassy state. Thus, the heat flux at the first stage, during the incubation time could
be calculated by using the inverse heat transfer calculation. The predicted results show a
good fit with the measured experimental heat flux.
With the determined values for k and t* (0.0035 and 152 seconds) from above model, the
kinetics model of the disk crystallization in this case was simulated via the equation 5.12
from section 4.7.
3*))(exp(1 ttkX −−−= (5.12)
The crystallization fraction versus time was plotted in Figure 5.25 where it was observed
that the dark opaque crystal developed exponentially along with the time. The
crystallization initiated once the disk passed incubation time (around 152 seconds); then
the crystal began to grow down to the bottom of this 2.2 mm thick glass disk
exponentially; and finally a fully crystallization was achieved when the disk was heated
for 800 seconds.

153
0
0.2
0.4
0.6
0.8
1
9
179
349
519
689
859
1029
1199
1369
1539
1709
1879
2049
Time S
Crys
talli
zatio
n X
Figure 5.25. The kinetics model of the 2.2 mm glass disk crystallization
Consequently, the complex flux disk temperature profiles are possible to be predicted
with the understanding of the disk thermal conductivity evolvement as well as the slag
crystallization kinetics during the annealing process. Thus, the temperature profile within
the disk was derived as a function of disk thickness and annealing time in following
equation:
}*))(exp(]*))(exp(1{[*
33/ cryglass
cryglass
totcsslag kttkkttk
kkdq
TT −−+−−−∗
+= (5.13)
An example of T1, the temperature of the disk top surface, was predicted according to
equation 5.13, where the thickness d is 0.0022 mm, and t* is 152 seconds. A comparison

154
of the predicted T1 (blue line) and the measured T1 (red line) is given in Figure 5.26. The
predicted value agrees well with the measured one.
500
600
700
800
900
1000
0 500 1000 1500 2000 2500Time S
Res
pond
ing
tem
pera
ture
s of
T1
Figure 5.26. The comparison between the measured and predicted T1
The temperature profiles within the disk when it was heated for 119 seconds prior to
crystallization was predicted along with the disk thickness. The temperature decreases
linearly from 875 to 446 Celsius, as there is no phase transformation in the disk.
--measured T1 --predicted T1

155
400
500
600
700
800
900
2.2 2
1.8
1.6
1.4
1.2 1
0.8
0.6
0.4
0.2 0
Thickness of the disk mm
Res
pond
ing
tem
pertu
re d
egre
e C
Figure 5.27. The temperature profile of the disk at 119 second
Once the crystallization imitated in the disk, there will be a mixture phase appearing in
the disk, i.e. crystalline (top) and glassy (bottom). Thus, the temperature distribution in
these two phases is different due to the different thermal resistance in these two phases.
The temperature gradient in the crystalline phase is larger than that of glassy phase,
because crystalline owns a higher thermal resistance. One example temperature profile of
the disk being heated for 339 seconds during the attenuation stage is given in Figure 5.28.
It can be seen two temperature attenuation rates existing in the disk, and the rate in the
crystalline phase is larger.
t = 119 S

156
400
500
600
700
800
900
2.2 2 1.8 1.6 1.4 1.2 1 0.8 0.6 0.4 0.2 0
Thickness of disk mm
Res
pond
ing
tem
pera
ture
pr
ofile
s de
gree
C
Figure 5.28. The temperature profile of the disk at 339 second
When the disk is finally crystallized, the crystals are fully developed in the sample, and
then the temperature will attenuate linearly across the disk. Figure 5.29 gives three
examples temperature profiles when the disk was heated for different times, i.e. 119
seconds (prior to crystallization), 339 seconds (during crystallization) and 1809 (after
crystallization). The temperature profile of sample 3 (1809 S) is obviously higher than the
two others due to the increased thermal resistance of the mold flux causing by
crystallization.
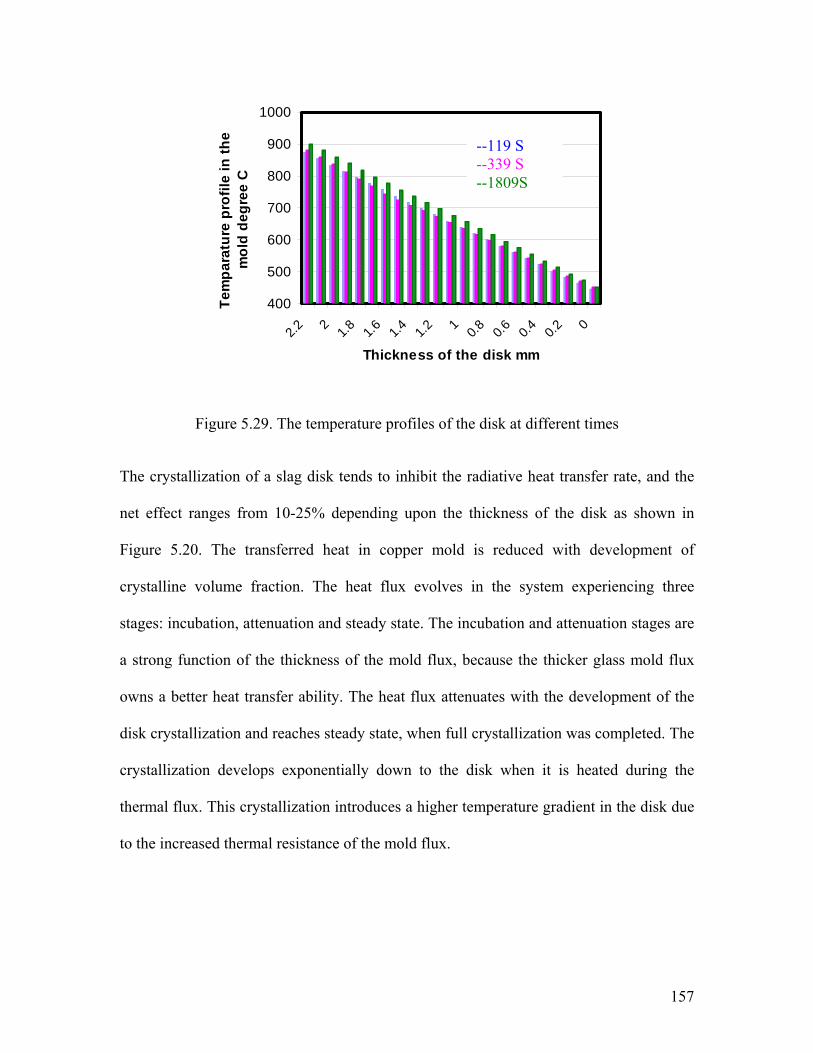
157
400
500
600
700
800
900
1000
2.2 2 1.8 1.6 1.4 1.2 1 0.8 0.6 0.4 0.2 0
Thickness of the disk mm
Tem
para
ture
pro
file
in th
e m
old
degr
ee C
Figure 5.29. The temperature profiles of the disk at different times
The crystallization of a slag disk tends to inhibit the radiative heat transfer rate, and the
net effect ranges from 10-25% depending upon the thickness of the disk as shown in
Figure 5.20. The transferred heat in copper mold is reduced with development of
crystalline volume fraction. The heat flux evolves in the system experiencing three
stages: incubation, attenuation and steady state. The incubation and attenuation stages are
a strong function of the thickness of the mold flux, because the thicker glass mold flux
owns a better heat transfer ability. The heat flux attenuates with the development of the
disk crystallization and reaches steady state, when full crystallization was completed. The
crystallization develops exponentially down to the disk when it is heated during the
thermal flux. This crystallization introduces a higher temperature gradient in the disk due
to the increased thermal resistance of the mold flux.
--119 S --339 S --1809S

158
5.3 The effect of mold flux melting and crystal fraction dissolution on radiative heat transfer rates
The crystallization of a mold flux has been studied and it has been concluded that the
crystallization inhibits 10-25% radiation heat flux. This section will explore how the
melting of mold flux influences the in-mold heat transfer rate.
In order to melt the top of mold flux disk, a high temperature within the slag disk is
required, which means that either a higher heat flux or a larger temperature gradient
through the disk sample should be achieved. As the thicker glass disk could transfer a
higher ratio of energy to the copper mold, the disks thicker than 4 mm were used here.
The copper substrate was drilled to form a tube like shape with depth of 4.5 mm, such
that it could contain the thicker slag disk. The new mold is shown in Figure 5.30.
Figure 5.30. A schematic figure of the re-designed copper mold
10 mm
Thermal couples
Cooling water inlet
Cooling water outlet
Mold Flux
95mm
Chilled surface
8 mm
4.5 mm

159
A 4.0 mm thick glass disk (403) was first placed into this newly designed copper mold
and pre-heated by a 200 KW/m2 thermal radiation. It was then subjected to a high 900
KW/m2 thermal radiation. The two responding temperatures in the mold were shown in
Figure 5.31. It was found that once the T2 thermocouple reached 200 Celsius, the whole
system temperature increased slowly.
0
50
100
150
200
250
300
0 1000 2000 3000 4000 5000
Time S
Res
pond
ing
tem
pera
ture
s C
0
T2
T3
Figure 5.31. The responding temperatures in the mold
The calculated in-mold heat transfer rate is also given in Figure 5.32. The heat flux began
to attenuate with the initiation of disk crystallization when it passed the incubation time
and reached the maximum value (around 530 KW/m2). Then it came to steady state once
the disk crystallization was completed. As there was another radial heat flux introduced
by the rim of the copper mold, the heat transferred from the top surface to copper mold
was reduced. Therefore, it could be observed that the disk was partially crystallized as
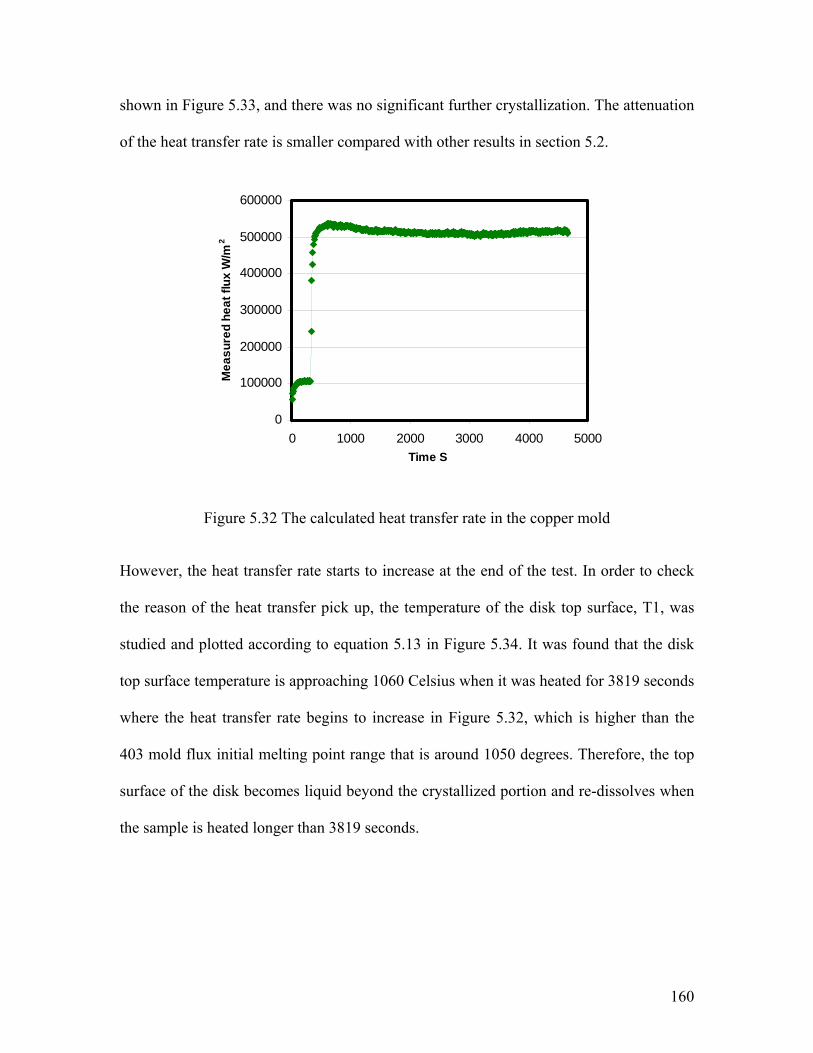
160
shown in Figure 5.33, and there was no significant further crystallization. The attenuation
of the heat transfer rate is smaller compared with other results in section 5.2.
0
100000
200000
300000
400000
500000
600000
0 1000 2000 3000 4000 5000Time S
Mea
sure
d he
at fl
ux W
/m2
Figure 5.32 The calculated heat transfer rate in the copper mold
However, the heat transfer rate starts to increase at the end of the test. In order to check
the reason of the heat transfer pick up, the temperature of the disk top surface, T1, was
studied and plotted according to equation 5.13 in Figure 5.34. It was found that the disk
top surface temperature is approaching 1060 Celsius when it was heated for 3819 seconds
where the heat transfer rate begins to increase in Figure 5.32, which is higher than the
403 mold flux initial melting point range that is around 1050 degrees. Therefore, the top
surface of the disk becomes liquid beyond the crystallized portion and re-dissolves when
the sample is heated longer than 3819 seconds.

161
Figure 5.33. The photo of the 4 mm thick sample
Also the re-solidified part (cream white part as pointed by the pink arrow) of the molten
disk layer can be clearly observed at the top of the sample as shown in Figure 5.33.
Consequently, the melting of the disk would enhance the heat transfer rate through the
mold flux to copper mold and introduce the pick up of the heat flux at the end of the test.
0
200
400
600
800
1000
1200
0 1000 2000 3000 4000 5000Time S
Res
pond
ing
tem
pere
ture
of
slag
top
surfa
ce d
egre
e
Figure 5.34. The responding temperature of disk top surface

162
A similar experiment was conducted by using a thicker glass disk, 5.0 mm. The
calculated heat flux through the copper mold is given in Figure 5.35. It was found that the
heat flux began to increase after a shorter transition time when the disk was melted. Thus,
it was confirmed that the melting of the disk will enhance the radiation heat transfer rate;
because more heat would be transferred down to copper substrate due to the minimization
of the volume fraction of crystallization.
0
50000
100000150000
200000
250000
300000350000
400000
450000
0 1000 2000 3000Time S
Mea
sure
d he
at fl
ux W
/m2
Figure 5.35. The calculated heat flux in copper mold under a 5.0 mm slag disk
In order to achieve a system with three layers, i.e. liquid at the top, glass at the bottom,
then crystals in the middle growing from liquid to bottom, at the steady state and observe
the melting effect on heat transfer rate, a new manufactured powder was prepared with
the addition of CaO and B2O3 to increase its melting point (1210C0). The comparison of
two mold fluxes is listed below.

163
Table 5.4 The chemical composition of slag 403 and a manufactured I
Composition Initial 403 %(wt)
Manufactured I %(wt)
SiO2 35 25 CaO 37.7 41.2 MgO 1.3 0.9 Al2O3 2.6 1.86 Na2O 10.8 7.7 F2 8 5.7 C 5.3 3.6 B2O3 14.3
Then a 5 mm thick glass disk of this new designed mold flux was fabricated and placed
into the copper mold. It was preheated by a 200 KW/m2 thermal radiation and then
subjected to a 1000 W/m2 thermal radiation for the test. The responding in-mold
temperatures T2, T3 were given in Figure 5.36 along with the calculated disk top surface
temperature T1 determined by equation 5.13.
0
200
400
600
800
1000
1200
0 1000 2000 3000 4000 5000Time S
Res
pond
ing
tem
pere
ture
s de
gree
C T2T3
T1
Figure 5.36 The responding temperatures of T1, T2 and T3

164
With the increased applied thermal energy and glass disk thickness, the responding
temperatures in the system are obviously higher than the former systems. The T1 in this
case is around 1200 Celsius which is much higher than the other T1 (Figure 5.34), 1000
degrees. Once T1 passed incubation time and reached first peak, it began to attenuate
with the development of crystallization, because the radiative heat transfer was inhibited
resulting in a lower temperature gradient in the disk. Once the crystallization is
completed, the T1 starts to increase slowly due to the increased disk thermal resistance
and the system heat accumulation, until it reaches the melting point of the disk. Then the
top disk will be melted and the crystals will re-dissolve, when T1 is above its liquidus,
which results in an enhancement of the radiation heat transfer rate in the disk. The
corresponding in-mold heat transfer rate is given in Figure 5.37.
300000
350000
400000
450000
500000
550000
600000
0 1000 2000 3000 4000 5000Time S
Mea
sure
d he
at fl
ux W
/m2
Figure 5.37. The measure heat flux under a 5 mm manufactured I slag disk

165
There are five stages appear in the heat flux history above, i.e.: an incubation time, an
attenuation stage, a period of steady state, a increase and then a final steady state. The
incubation time is rather short due to the very high temperature developed on the top
surface of this disk (around 1200 Celsius). The crystallization occurs right after the
system was heated and the heat flux reaches the maximum value, then it starts to
attenuate with the development of crystallization. Then the heat flux comes to a steady
state once the crystallization of the disk is completed. During this period steady state, the
disk top surface temperature, T1, increases due to the increased thermal resistance and
heat accumulation until it reaches the mold flux liquidus. Then melting and crystal
dissolution is initiated at the disk top surface, the overall heat transfer rate increases as
shown in Figure 5.37. The increased heat flux will improve the temperature gradient
inside the disk, such that the molten layer moves down, and it leads to a reduction of the
crystal volume resulting in a further increase of the heat flux. Eventually, when the
system comes to the final steady state, in other words, when the thickness of the liquid
layer, crystalline lay and glass layer is fixed, the heat transfer rate becomes stable. The re-
crystallized part of the molten layer pointed by the pink arrow is clearly shown in the
following disk photo taken after the experiment in Figure 5.38.

166
Figure 5.38. The photo of 5 mm thick sample
Therefore, the heat transfer from steel strand through mold flux layer to copper mold in
continuous casting could be simulated based on the experimental results in this section. It
could be concluded that the heat transfer rate through the mold flux to copper mold is
increased with the thickness of liquid layer and the reduction the solid mold flux. The
thicker liquid layer will enhance the radiation conduction through the solid mold flux due
to the decreased crystal fraction.
Thus, heat transfer rate will be high at the top of a mold in the continuous caster, where
the mold flux layer is mostly liquid with the solid part of the flux, against the mold wall
is a glass. In this state temperature gradient across the molten layer will be high which
will lead to a high rate of conduction heat transfer and the absolute temperature on the
slag-metal interface will be high and the radiation heat transfer rater will be high
according to equation, )( 42
41 TTqrad −= φ . Consequently, there will be more heat
transferred to the mold.

167
On the other hand, the initiation of crystallization in the flux will reduce the radiative heat
transfer rate cause the overall heat transfer rate to decrease. The solid crystalline layer is
the main resistance to the radiative portion of the heat transfer rate, thus the radiation
effects are most important at the top of the mold in the area of the meniscus during
continuous casting.

168
5.4. Modeling of overall heat transfer in the meniscus area
With the understanding of the mold flux crystallization, melting and crystal fraction
dissolution effects on the radiative heat transfer rates, a model of the overall heat transfer
from steel strand across the mold flux to the copper mold in meniscus area could be
developed. This allows the dramatic effect on radiation heat transfer due to crystallization
of solid mold flux to be considered. A schematic figure of the meniscus area in the caster
mold is shown in Figure 5.39 where it can be observed that a larger ratio of liquid phase
infiltrates between the strand and the solid mold flux. In order to simplify the modeling,
the thickness of the whole mold flux including liquid and solid layer in the meniscus area
is assumed to be 3 mm with the liquid layer ranging from 2 to 1 mm.
Figure 5.39: The schematic figure of meniscus area in caster mold
The total heat flux from the strand passing through mold flux to copper mold is assumed
to consist of two parts according to equation 5.1, i.e., the radiative and conductive heat
Mold
Flux Powder Liquid flux
Steel Shell
Liquid steel
Meniscus
Solid flux

169
flux. Consequently, a term defined as effective thermal conductivity Keff is introduced to
represent the actual thermal conductivity, which is including the sum of conductive part,
Kcry, and radiative part, Krad as shown in equation 5.14.
radcondeff KKK += (5.14)
It is convenient to use the same form as the Fourier law to compute radiative heat transfer
rate, therefore, the radiation heat flux is calculated as equation 5.15.
dTT
Kq csradrad
/1−= (5.15)
Thus, by the combination of equation 5.4, the radiative thermal conductivity Krad of the
molten flux can be determined as equation 5.16 by assuming the molten flux behaves as
gray gas:
cs
csrad TT
dTTK
/1
4/.
41 )(
−−
= φ (5.16)
where ф is the radiative heat transfer coefficient for liquid flux, and it is computed firstly
via equation 5.4, )75.0/( 112 −− ++= cryshellfluxliquiddn εεασφ . With the emissivity values
for steel shell and solid flux 0.8 and 0.7 from literature [85], the calculated radiative heat
transfer coefficient for the molten flux ranges from 7 to 8 x 10⁻⁸ W/(m2 K4) depending on
the thickness of liquid flux, which is consistent with Cho’s values [68]. A comparison of
the ф values between this thesis and Cho’s is given in Figure 5.40 where the small
difference may originate from the specific different boundary conditions.
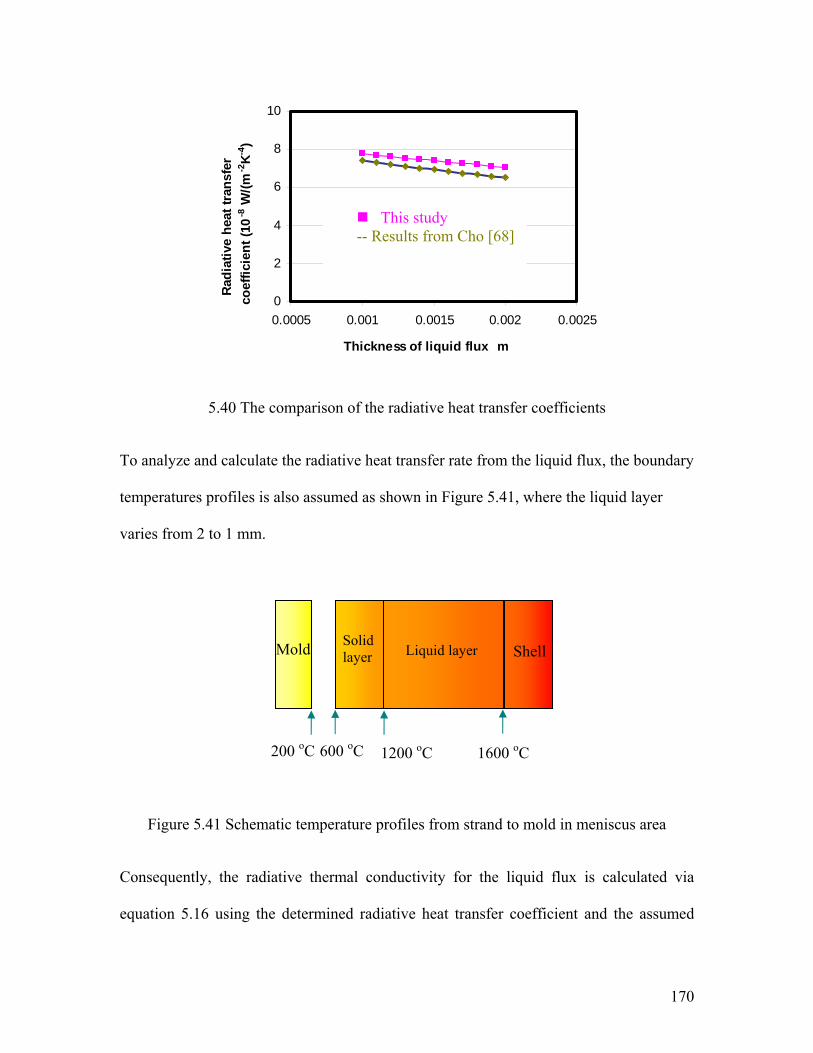
170
0
2
4
6
8
10
0.0005 0.001 0.0015 0.002 0.0025
Thickness of liquid flux m
Radi
ativ
e he
at tr
ansf
er
coef
ficie
nt (1
0-8
W/(m
-2K-4
)
5.40 The comparison of the radiative heat transfer coefficients
To analyze and calculate the radiative heat transfer rate from the liquid flux, the boundary
temperatures profiles is also assumed as shown in Figure 5.41, where the liquid layer
varies from 2 to 1 mm.
Figure 5.41 Schematic temperature profiles from strand to mold in meniscus area
Consequently, the radiative thermal conductivity for the liquid flux is calculated via
equation 5.16 using the determined radiative heat transfer coefficient and the assumed
200 oC 1600 oC
Liquid layer Solid layer Shell
600 oC 1200 oC
Mold
This study -- Results from Cho [68]

171
temperature profile inside the mold and given in Figure 5.42. The calculated Krad values
are from 2.48 to 1.48 W/(mK) depending upon the thickness of the liquid layer. The
thicker the liquid layer, the larger the radiative thermal conductivity would be, and there
will be more radiation emitted from liquid flux, which is consistent with the results in
section 5.3 that the melting of mold flux enhances radiation in the mold.
1
1.5
2
2.5
3
0.0005 0.001 0.0015 0.002 0.0025
Thickness m
Radi
ativ
e th
emal
con
duct
ivity
W
/(mK)
Figure. 5.42 The calculated radiation thermal conductivity for liquid flux
Therefore, the contribution to the overall heat flux from the radiation in liquid flux is
determined from equation 5.14. The conduction thermal conductivity, Kcond, is assumed
to be equal to Kcry due to more than 96% heat transferred in the crystalline layer is
conduction as described in section 5.2. Then, the ratio of the radiation from the liquid
flux, Krad/Keff, is calculated and given in Figure 5.43.

172
0
0.2
0.4
0.6
0.8
1
2 1.9 1.8 1.7 1.6 1.5 1.4 1.3 1.2 1.1 1
Thickness of liquid flux mm
Ratio
of t
he K
r ov
er K
eff
Figure 5.43 The ratio of the radiation to overall heat flux from meniscus
The radiation contribution to the overall heat transfer rate ranges from 47% to 33%
depending upon the thickness of the liquid layer as the red bars shown in above figure.
The blue bar stands for the portion of conduction. The obtained values from this study are
consistent with Ohmiya, Cho and Watanabe’s results [13, 16, 68]. The portion of the
radiative heat flux is then applied to the adjacent solid mold flux, which consists of a
mixture phase of crystalline and glassy. The part of the radiation transferred through the
solid flux to the mold is calculated according to equation 5.9, the heat absorption model
developed in section 4.5, and shown in Figure 5.44

173
0.05
0.1
0.15
0.2
0.25
0.3
0.35
0.5 1 1.5 2 2.5
Thickness of solid mold flux mm
Frac
tion
of h
eat t
rans
ferr
ed to
m
old
Figure 5.44. The fraction of heat transferred versus solid mold flux
It is observed that the transferred radiation part to the mold reduces with the increase of
the solid mold flux. The main reason is due to the dramatic radiation reduction with the
decrease of the liquid flux thickness and the solid flux thermal resistance, although the
thicker glassy phase is able to transfer more radiation. Therefore, the overall radiation
transferred to the mold is decreasing with the increase of solid mold flux thickness (or the
reduction of liquid flux). The full crystallized solid flux transfers less radiation due to its
opaque optical properties. The main heat transferred in crystalline phase is conduction
(up to 96%), as the contribution of radiation in the solid crystalline flux is only around
3.9% as discussed in section 5.2.2. Therefore, there will be a large amount of radiation
blocked by the flux crystallization, and the fraction of the transferred radiation reduces
from original 47-33% to 27-19% depending upon the incident radiation fraction. A
comparison of the incident radiation portion from the liquid flux (red bar) and the
transferred part through the crystallized solid flux (blue bar) is shown in Figure 5.45.
--glassy phase --crystalline phase

174
0.1
0.2
0.3
0.4
0.5
2 1.9 1.8 1.7 1.6 1.5 1.4 1.3 1.2 1.1 1
Thickness of liquid flux mm
Frac
tion
of h
eat f
lux
Figure 5.45. The comparison of the incident and transferred radiation fraction
It is clear that the incident radiation, 47% of the overall heat flux from the liquid mold
flux is blocked by the mold flux crystallization resulting in only 27% of the overall heat
from the radiation transferred to the mold when the liquid layer is around 2mm as
indicated in Figure 5.45. There is around 20% of the overall heat reduction due to the
radiation blockage from liquid mold flux inhibited by the flux crystallization based upon
the difference of the incident and transferred radiation fraction in Figure 5.45. The
fraction of the attenuated heat flux versus liquid flux thickness is given in Figure 5.46,
which indicates that the mold flux crystallization leads to around 20% of the overall heat
reduction.

175
0
0.1
0.2
0.3
2 1.9 1.8 1.7 1.6 1.5 1.4 1.3 1.2 1.1 1
Thickness of liquid mold flux mm
Frac
tion
of a
ttenu
ated
ra
diat
ion
Figure 5.46 The fraction of the attenuated radiation
A new heat transfer simulator was redesigned, such that the three layers as in the real
casting of the mold flux could be achieved with a liquid at the top, a solid glassy close to
the copper substrate and a crystalline layer developed in between. The effect of the solid
flux crystallization from a pure glass slag disk on the radiation has also been observed
and studied. It was obtained that this crystallization could lead to a 10-25% of the overall
heat reduction due to the blockage of incident radiation. A model has been developed to
predict the heat flux evolves along with the crystallization of the solid flux, which is
consistent with the experimental results.
The effect of mold flux melting and crystal fraction dissolution on radiative heat transfer
rates has also been conducted. It was found that the melting of the solid crystalline flux
enhances the incident radiation and results in a higher overall heat transfer rate in the
system due to the minimization of the crystal volume which in turn to reduce the solid
flux thermal resistance.

176
Finally, a general heat transfer model has been developed to allow the study of how the
mold flux crystallization modifies the dramatic radiation transfer in the meniscus area in
the top caster. The contribution of the radiation to the overall heat transfer from the liquid
layer could be high in the range from 33-47% depending upon the molten flux thickness.
The full crystallization of the solid flux would inhibit around 20% of the overall heat
transfer rate from the meniscus due to the blockage of the incident radiation from liquid
flux.

177
6. The Effect of the Fe2O3 and MnO Content of a Mold Flux on Radiative Heat Transfer Rates
6.1 The Effect of transition metal oxides on radiative heat transfer rates
This chapter will study extinction (absorption) coefficient changes with the addition of
transition metal oxides to a mold flux, as the extinction (absorption) coefficient
determines the amount of radiation transmitted mold flux to the mold.
The absorption coefficient of a slag are known to be significantly dependent upon the
concentrations of transition metal oxides present in the slag. Although some research has
been carried out to investigate the absorption coefficients and refractive indices of
synthetic glassy slags containing transition metal oxides by Susa, etc [63, 73], the
absorption coefficient evolvement with the addition of transition metal oxides has not
been directly correlated to radiative heat transfer rate. Therefore, the study of the optical
properties of glassy slag evolves with the addition of transition metal oxides would be
carried out following by the correlation of this evolvement with radiation heat flux. The
effect of the chemical composition of mold fluxes, especially those including different
amounts of transition metal oxides such as manganese oxide, and iron oxide, on the
radiative heat transfer rate will be determined.
The research described in this chapter was carried out in the following manner: (1)
application of infrared radiation onto a copper mold covered with a thin layer of mold
flux disk, which contained different amounts of transition metal oxides; (2) evaluation of

178
the effect of these transition metal oxides on radiative heat transfer rates by analyzing the
in-mold heat transfer rate; and (3) investigation of the thermal properties of each mold
flux disk to determine the behavior of these oxides and how they influence the radiative
heat flux.
6.2 The preparation of mold slag disk
The matrix mold flux used in these experiments was an industrial ultra-low carbon flux
(403) and its chemical composition is listed in section 5.1. The mold slag samples were
prepared as thin disks with the same diameter as the copper substrates that they were
placed upon. Various amounts of manganese oxide (MnO) were fused with the matrix
mold flux to obtain the different manganese oxide compositions within a range from 0 to
10 weight percentage. The major components are listed in Table 6.1 below. Again,
various amounts of iron oxide (Fe2O3) were fused with the mold flux to obtain different
compositions within a range from 0 to 5 percent of iron oxide. The major components
are listed in Table 6.2 below.

179
Table 6.1: Composition of mold flux with MnO from 0 to 10 percent
MnO SiO2 CaO MgO Al2O3 Na2O F-
0 35 37.7 1.3 2.6 10.8 5.3
1 34.7 37.3 1.29 2.57 10.69 5.24
2 34.3 36.9 1.27 2.54 10.52 5.19
3 34 36.6 1.26 2.52 10.47 5.14
5 33.3 35.8 1.24 2.47 10.26 5.0
10 31.5 33.9 1.17 2.34 9.72 4.77
Table 6.2: Composition of mold flux with Fe2O3 from 0 to 5 percent
Fe2O3 SiO2 CaO MgO Al2O3 Na2O F-
0 35 37.7 1.3 2.6 10.8 5.3
0.5 34.83 37.51 1.294 2.587 10.75 5.27
1 34.65 36.32 1.287 2.574 10.69 5.24
2 34.3 36.95 1.274 2.548 10.58 5.19
3 33.95 36.57 1.261 2.522 10.48 5.14
5 33.25 35.82 1.235 2.47 10.26 5.0

180
6.3 Results and discussion
Figure 6.1 shows a series of glass slag disks containing different amounts of MnO
fabricated as described in section 3.2.2. The color of the sample changes from
transparent to green then to brown, and finally to black as the MnO concentration
increases from 0%, to 2%, to 5%, and then to 10%. The original color of pure MnO is
green and its melting point is above 1700oC. The disk exhibits a green color with small
concentrations of MnO (1% to 2%). As the MnO concentration increases (greater than
2%), a brown color becomes apparent in the solidified disk (3%). The brown areas
increase until the disk reaches a 5% MnO concentration where the disks appear fully
brown. It should be noted that these color changes are indicative of precipitation or phase
separation during cooling of the disks. The samples became black as a 10% MnO
concentration level was reached. Again within the predominant black color, small grey
areas can be seen that are indicative of precipitation or phase separation during cooling.
Thus, the addition of MnO leads to a loss of transparency in the solidified disk due to
both chemical effects and the precipitation of second phases within the sample.
Figure 6.1. A series of MnO discs made for this experiment

181
In order to gauge the effect of MnO on radiative heat transfer rate, samples with the same
thickness of 1.8 mm from Figure 6.1 were placed on top of the copper mold individually,
and then were subjected to the same constant 500 KW/m2 thermal radiation. The
measured responding in-mold heat fluxes in each case were shown in Figure 6.2.
Figure 6.2: Measured heat fluxes for MnO glassy disks and crystalline disk
The measured heat fluxes for 0%, 1%, 3%, 5%, and 10% MnO glassy disks and an
opaque crystalline disk (used in section 4.2) with the same thickness. The compositions
of the MnO disks are shown in Table 6.1. There was one experiment in which the disk
was made to stick on top of the copper mold during the casting process. The result of this
experiment was used to observe the effect of the interface contact between the mold flux
and the copper mold. The results shown in Figure 6.2 prove that the interface contact
between the mold flux and the copper mold does not have significant impact on the
0% MnO disk sticks on copper mold
0% MnO
5% MnO
1% MnO
3% MnO
Crystalline
10% MnO

182
measured heat flux (compare 0% MnO to 0% MnO disk sticking on copper mold), and it
can be assumed that the interface resistance of the mold flux is constant in this study.
All of the heat fluxes passing through the system come to steady state within several
hundred seconds, and there is little evidence of significant phase transformation during
the heating due to the lower impinging thermal radiation. Generally it could be observed
that the heat transferred to copper mold reduces with the increase of manganese oxide,
but it is still higher than the crystalline disk sample. In the case of no addition of the
MnO, the heat flux is around 290 KW/m2, once the system comes into steady state.
However, it decreases to 215 KW/m2 when MnO amount is increased to 10%. Figure 6.3
gives the relationship for different mass percentage of MnO versus the responding steady
state heat fluxes corresponding heat fluxes histories in Figure 6.2. The addition of MnO
does retard the radiation heat transfer through copper mold. A detailed explanation of
these phenomena will be addressed later.

183
0
50
100
150
200
250
300
350
0 0.02 0.04 0.06 0.08 0.1 0.12Mass percentage of MnO
Sta
ble
resp
ondi
ng h
eat
tran
sfer
rate
MW
/m2
Figure 6.3: Heat transfer rate versus the mass percentage of MnO
In order to investigate the effect of another transition metal oxide, Fe2O3, on the radiative
heat transfer rate, similar experimental procedures as for manganese oxides were
repeated. Figure 6.4 shows a series of glass mold flux disks with variant amount of
Fe2O3. Their major components are listed in Table 6.2. Similar to that of the MnO disks,
the color of each Fe2O3 disk becomes darker with the increasing Fe2O3 concentration until
it is fully dark at 5% Fe2O3 concentration.
Figure 6.4: A series of Fe2O3 discs made for this experiment

184
Again, all the disks in Figure 6.4 (with different amounts of iron oxide) were placed on
the top surface of the copper mold, and subjected to the same thermal radiation
conditions. Figure 6.5 shows the calculated responding heat fluxes for each Fe2O3 glassy
disk. Similarly, the system reaches steady state quickly (within several hundred seconds).
The addition of Fe2O3 tends to retard the heat transfer rate, and there is no observable
significant phase transformation for the glass mold flux disks.
Figure 6.5: Measured heat fluxes for Fe2O3 glassy discs.
The heat transfer rate is around 290 KW/m2 for the system without iron oxides, and it
reduces to 210 KW/m2 when the concentration of Fe2O3 goes up to 5%. For the 10%
MnO and 5% Fe2O3 disk samples, both of them exhibit a black color and their measured
responding heat transfer rates were similar, around 210 KW/m2. Consequently, systems
0% Fe2O3
5% Fe2O3
1 % Fe2O3 2% Fe2O3
0.5% Fe2O3
50000
100000
150000
200000
250000
300000
350000
0 100 200 300 400 500 600 700 800Time S
Mea
sure
d he
at fl
ux W
/M2

185
with a mold flux disk containing transition metal oxides on top of the copper mold tend to
inhibit radiation transfer introducing less heat flux transferred to the mold. However, all
the responding heat fluxes are still higher than the system with crystalline sample as
indicated by above results.
6.4 Study of thermal properties of glassy slags
A study of the thermal properties of these glassy slags disks containing transition metal
oxides was carried out to investigate why and how these metal oxides inhibit radiative
heat transfer in continuous casting. The main focus was on the disks’ optical properties
and their internal structures. It could be physically observed that the glass disk lost its
transparency when the addition of the MnO/Fe2O3 reached a certain amount, as shown in
Figures 6.1 and 6.4. Therefore, the reflectivity of these glassy disks may increase with the
addition of transient metal oxides.
The disk with 10% percentage (mass) of MnO was scanned by X-ray to determine
whether there was significant crystallization occurring during the making of glass disks
with addition of metal oxides. A scanned X-ray pattern shown in Figure 6.6 confirms that
there is no any phase transformation in the 10% sample and the optical property change is
not due to crystallization of the disk during fabrication.

186
Figure 6.6. The X-ray pattern of 10% MnO slag disk
The microstructures of disks with manganese oxide were studied for the purpose of
understanding how these transition metal oxides influence disks optical properties.
Figures 6.7 (a) to 6.7(d) show a series of optical micrographs for 0%, 3%, 5%, and 10%
MnO disks. As expected from a fully glassy phase disk, the optical micrograph of 0%
MnO disc is transparent and very few second phase crystals can be observed. With the
addition of MnO, very fine dark particles could be observed in the disk as shown in
Figure 6.7(b). This indicates the precipitation of very small crystals during cooling of the
sample.
Position [°2Theta]
10 20 30 40 50 60 70
Counts
0
50
100
10% MnO Sample
Figure 6.7 (a): A close look at the 0% MnO disk from Figure 6.2 in 20X magnification
500μ

187
Figure 6.7 (b): A close look at the 3% MnO disc from Figure 6.2 in 20X magnification
Figure 6.7 (c): A close look at the 5% MnO disc from Figure 6.2 in 20X magnification
Figure 6.7 (d): A close look at the 10% MnO disc from Figure 6.2 in 20X magnification

188
Figure 6.7(c) shows an optical micrograph of the 5% MnO disk. It appears that the MnO
particles precipitation increased. No precipitation could be observed in higher contents,
due to the darkening of the disk which made any precipitation more difficult to observe.
These disks were also placed into a magnetic field to measure their magnetic moment to
check the internal transition metal ions content.
Figure 6.8: The magnetic moment of MnO containing disks
From their magnetic moment curves as shown in Figure 6.8, the maximum values for
each disk’s magnetic moment is improved with the addition of MnO into the slag disks.
Because the maximum of magnetic moment is proportional to the transient metal ions
concentration, the internal manganese ions content increases with the addition of
manganese oxides. Thus although there is visible evidence of small fraction of
precipitation, the X-ray and magnetic moment data suggest the predominant structure is
glassy for all the disks.
- 0.015
- 0.01
- 0.005
0
0.005
0.01
0.015
- 12000 - 7000 - 2000 3000 8000 13000
Magnetic field (Oe)
Mag
etic
mom
ent
(em
u)
10% 5% 3% 2%

189
As the extinction coefficient (for glassy phase, it is usually equal to absorption
coefficient), β, gauges the ability of a glass disk absorb heat, it is also desirable for this
property to be investigated with the addition of transition metal oxides. The disks
containing 10% MnO with different thickness from 0.52 mm to 2.08 mm were placed
onto a copper mold under 500 KW/m2 thermal radiation, and their responding thermal
fluxes are shown in following Figure 6.9.
Figure 6.9. Measured heat flux versus time for MnO discs with different thickness
The measured heat flux increased continuously from 200 KW/m2 to 222 KW/m2 when
the thickness of 0.52 mm MnO disk was increased to 2.1 mm. The thicker the disk is, the
more heat the disk will absorb. Thus, the thickness promotes a larger heat flux to be
transferred to the copper mold. However, the 1.5 mm thickness difference for this 10%
MnO disk only induces a 20 KW/m2 heat transfer variation (from 220 KW/m2 to 200
KW/m2 according to Figure 6.9), which has a minor effect compared with the full glass
disks in Figure 4.12 in section 4.3 under same applied 500 KW/m2 thermal radiation,
2.08mm 1.78mm 1.45mm 0.52mm

190
where the 0.5 mm thickness difference brings about a 60 KW/m2 heat variation (from 295
KW/m2 to 235 KW/m2 according Figure 4.12). The measured absorption coefficient is
around 1800 m-1 with the help of the radiative heat transfer model developed in chapter
4.5. This is much larger than that of the fully glassy disk value of 400 m-1. The absorption
coefficient thus increases with the addition of transient metal oxides, which is consistent
with other researchers’ results, like Susa and Mills [73], who discovered there is linear
increase for the absorption coefficient with the addition of transient metal oxides.
Therefore, more radiation will be scattered resulting in a lower heat flux transferred to the
copper mold as shown in Figures 6.2 and 6.5.
The other important optical property, refractive index, was also studied here to research
how the refractive index changes with the addiction of transition metal oxides.
The method to estimate refractive index is a simple empirical equation [79] as shown
below:
∑=−
i
ii
MNn
100)1(
ρ (6.1)
where n stands for refractive index, ρ means the density (g cm-3) of the slag, and Ni and
Mi are the specific refractive index of the various oxides in the slag, which values are
given in Table 6.3 and mass % respectively.

191
Table 6.3. Specific refractive indices for various oxides Ni
CaO MgO Na2O K2O Fe2O3 MnO Al2O3 SiO2 FeO
0.225 0.200 0.181 0.189 0.308 0.224 0.214 0.207 0.187
The calculated values for refractive indices for MnO containing mold flux are presented
as orange triangles, and for the Fe2O3 containing samples are presented as green dots,
which are shown in Figure 6.10. A series reference data of the refractive indices for
Fe2O3 from Susa’s paper have been adopted as blue squares shown in the following
figure.
Figure 6.10. Refractive index as a function of transient metal oxides concentration
There is a linear increase of refractive index with the addition of transient metal oxides,
and this increase is in the hierarchy Fe2O3 > MnO. It may also be noted that the results of
1.6
1.62
1.64
1.66
1.68
1.7
1.72
1.74
0 5 10 15 20 25Mass percentage of MO
Ref
ract
ive
inde
x
Susa, etc (reference 73)
• Fe2O3
▲MnO

192
the present investigation are in good agreement with those previously studied by Susa et
al, who measured the index, n, of Fe2O3-SiO2-CaO-Al2O3 slags as a function of the Fe2O3.
The slags in their paper were synthesized by adding different amounts of Fe2O3 into the
master 40 mass percentage SiO2-40CaO-20Al2O3.
The increased refractive index of glass slag containing transition metal oxides is also
another contribution to the attenuation of the transferred heat flux in copper mold.
Therefore, the radiative heat transfer coefficients of the glassy solid mold fluxes in the
two extreme circumstances: original transparent glassy phase and the glassy phase
saturated with transition metal ions (10% MnO), are able to be studied based on the
understanding of the absorption coefficient and refractive index evolving with the
addition of transition metal oxides. The determined values for ф, the radiative heat
transfer coefficient, are given in Figure 6.11 according equation 5.4, where the absorption
coefficient and refractive index values for original and 10% MnO are 250 m-1, 1.6 and
1800 m-1, 1.68 respectively. It is obtained that the radiative heat transfer coefficient for
the matrix flux is around 5x10⁻⁸ W/(m2K4), and attenuates to 3-4x10⁻⁸ when the MnO was
added to 10%.

193
1.E-08
2.E-08
3.E-08
4.E-08
5.E-08
6.E-08
0.5 1 1.5 2 2.5
Thickness of solid flux mm
Rad
iativ
e he
at tr
ansf
er
coef
ficie
nt W
/(m2 K
4 )
Figure 6.11 The computed radiative heat transfer coefficient values for two glass disks
A comparison of the radiative thermal conductivities between the matrix flux (pink bar)
and the 10% MnO flux (blue bar) is given in Figure 6.12 when the Krad was calculated
according to equation 5.16.
0
0.1
0.2
0.3
0.4
0.5
0.6
0.7
0.8
2 1.9 1.8 1.7 1.6 1.5 1.4 1.3 1.2 1.1 1
Thickness of flux mm
Radi
atio
n th
erm
al c
ondu
ctiv
ity
W/(m
K)
Figure 6.12 The calculated radiative thermal conductivity for two samples
Original 403 glass disk 10% MnO disk
Original 403 flux 10% MnO flux

194
The radiative thermal conductivity of the original glassy flux is around 0.67 W/(mK)
(pink bar) as indicated in Figure 6.12 when the solid thickness is 2 mm, which
contributes 18% to the overall heat transfer rate in the solid matrix flux as shown in
Figure 6.13 (pink bar) when the fraction is determined by the ratio of the radiation to the
overall heat transfer rate as: Krad/Keff. However, the Krad decreases to 0.42 W/(mk),
leading to a lower radiation contribution to the overall heat transfer, which is 12% (blue
bar) when the MnO is 10% and thickness is 2mm.
0
0.05
0.1
0.15
0.2
Frac
tion
of th
e ra
diat
ion
in
solid
flux
2 1.9 1.8 1.7 1.6 1.5 1.4 1.3 1.2 1.1 1
Thickness of solid flux mm
Figure 6.13 The fraction of the radiation in solid flux
Consequently, the addition of the transition metal oxides could block a portion of
radiation, such that the overall heat transferred to the mold would be lowered to 6-2% (in
Figure 6.14) depending on the thickness of the glass flux based on the difference between
the matrix flux and 10% MnO sample as shown in Figure 6.13. Therefore, it could be
concluded that the transition metal oxides inhibits some portion of radiation passing
through the glass flux resulting in a 2-6% overall heat reduction in the mold. Since the

195
solid flux is a mixture phase of crystalline and glassy, the overall effect would be less
than this value. Thus the methods to reduce heat flux by only changing absorption
coefficient are not very effective.
0
0.01
0.02
0.03
0.04
0.05
0.06
0.07
The
fract
ion
of th
e at
tenu
ated
hea
t
2 1.9 1.8 1.7 1.6 1.5 1.4 1.3 1.2 1.1 1
Thickness of the solid flux mm
Figure 6.14 The fraction of the overall attenuated heat through the glassy flux
As an important factor to modulate radiative heat flux passing through metal mold,
transition metal oxides have been widely used in continuous casting. Although a few
research studies have been carried out to investigate the thermal properties of the slag
containing transition metal oxides; very few correlate the effect of these oxides to real
heat transfer in continuous casting. The experimental results in this study shows that the
addition of these transient metal oxides tends to block radiative heat transfer rate, and has
an ability to influence the heat transfer rate passing through the solid mold flux layer.
The addition of these metal oxides will lead fully glassy mold flux samples to lose their
transparency. Therefore, the surface of the slag disks containing MnO and Fe2O3 changes
from transparent to green, brown, and a final black, as the concentration of the MnO and

196
Fe2O3 increases. Thus, the surface reflectivity increases and there will be more radiation
reflected which will result in less heat being transferred. The addition of MnO and Fe2O3
also leads to a larger value for the absorption coefficient and the refractive index, which
in turn scatters a larger amount of the absorbed energy, when these photons travel inside
the disk. Thus, the transferred heat flux will be inhibited with the addition of these
transition metal oxides.

197
7. A Study of Mold Fluxes Used in the Casting of Trip Steels
As the new generation steel used in automotive manufacture industry, TRIP steels are one
of the newest and most exciting materials being developed by the steel industry. In fact,
the acronym “TRIP” stands for Transformation Induced Plasticity, which exhibits better
ductility at a given strength level compared with other advanced high-strength steels.
This enhanced formability is due to the transformation of retained austenite (ductile) to
martensite (tough) during the plastic deformation. A typical TRIP steel possesses a three-
phase microstructure, i.e., ferrite, bainite and retained austenite. One microstructure of
TRIP steel is shown in Figure 7.1 [80]. Because of the improved formability, TRIP steels
could be used to produce more complicated parts than other high strength steels.
Figure 7.1 A typical microstructure of TRIP steel. [80]

198
In order to increase austenite thermal stability, such that it could be retained upon
thermo-mechanical loading, the addition of aluminum is widely employed as it promotes
the carbon enrichment in austenite, which in turns favors austenite stability [81-83].
Therefore, the content of aluminum is significantly higher than other commercial carbon
steels, and one example chemical composition of TRIP steel is listed in Table 7.1 [84].
Table 7.1 Chemical composition of TRIP 600 steel
Steel C (wt.%) Mn (wt.%) Si (wt.%) Al (wt.%)
TRIP 600 0.14 1.77 0.58 1.05
As with other new generation products, there exist significant challenges in the field of
processing and application of TRIP steels. Because of the addition of aluminum in TRIP
steels, the great challenge of casting TRIP steels is the design of the new mold flux that is
compatible with this steel chemistry. Since little research has been carried out to study
and design the new mold flux for casting TRIP steels, there have been several disastrous
problems in the continuous casting of TRIP steels in steel companies; for example:
sticking of the mold flux to copper mold has lead to difficulties in continuous sequence
casting; increased crack frequency; non-uniform heat transfer across the mold flux, etc.
One mold flux, which has been widely used in steel industry, was adopted in this study,
and its major chemical compositions are listed in Table 7.2. Note the large change in
alumina content and decrease in silica content due to the reaction between aluminum in
the liquid steel and the mold flux.
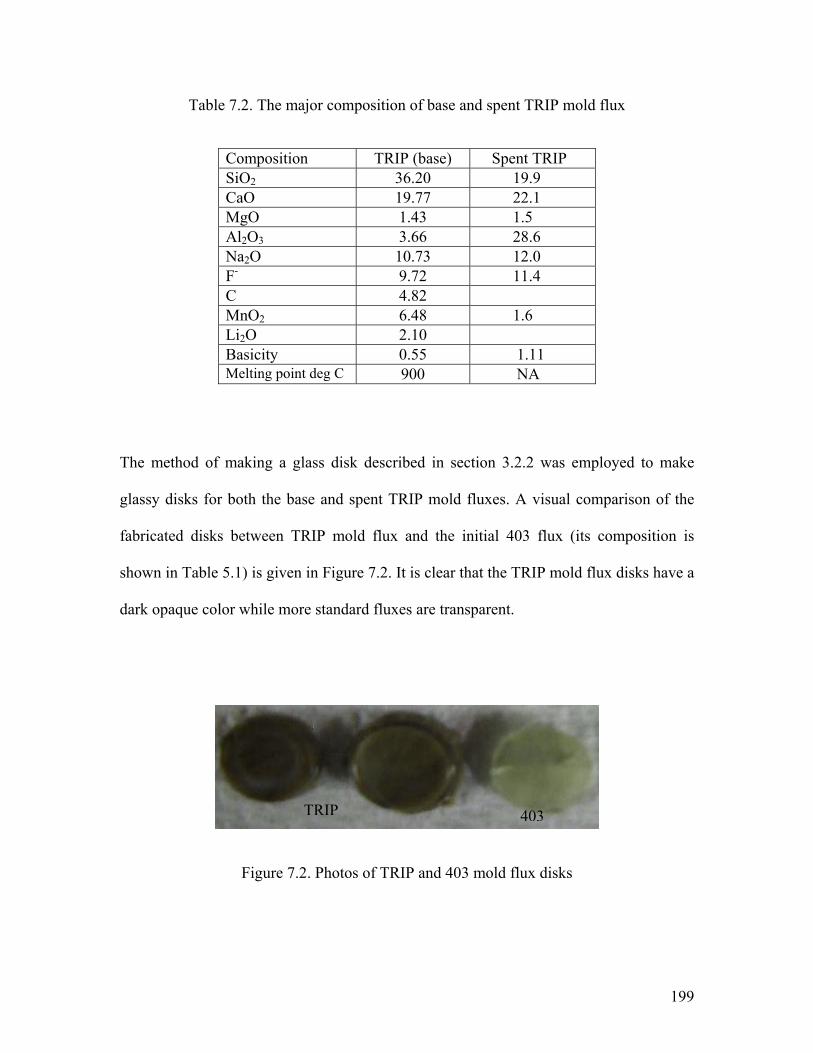
199
Table 7.2. The major composition of base and spent TRIP mold flux
Composition TRIP (base) Spent TRIP SiO2 36.20 19.9 CaO 19.77 22.1 MgO 1.43 1.5 Al2O3 3.66 28.6 Na2O 10.73 12.0 F- 9.72 11.4 C 4.82 MnO2 6.48 1.6 Li2O 2.10 Basicity 0.55 1.11 Melting point deg C 900 NA
The method of making a glass disk described in section 3.2.2 was employed to make
glassy disks for both the base and spent TRIP mold fluxes. A visual comparison of the
fabricated disks between TRIP mold flux and the initial 403 flux (its composition is
shown in Table 5.1) is given in Figure 7.2. It is clear that the TRIP mold flux disks have a
dark opaque color while more standard fluxes are transparent.
Figure 7.2. Photos of TRIP and 403 mold flux disks
TRIP 403

200
In order to check the reason of losing transparency of these samples, both TRIP base and
spent disks were scanned by X-ray and their X-ray patterns are shown in following
Figure 7.3.
Figure 7.3. The X-ray pattern of AL4D mould flux disks
The very striking phenomenon shown in the pattern is that there are same characteristic
peaks appearing in both base and spent TRIP samples. Instead of a fully amorphous curve,
as is common in commercial mold fluxes that are cooled fast enough to form a full glass
phase, glass formation was not possible in the above two TRIP samples even they were
subjected to the same fast cooling rate as other samples in this study. All of these small
crystallized particles precipitated in the disks were clearly observed in their SEM photos
as shown in Figure 7.4.
--TRIP base mold flux --TRIP spent mold flux
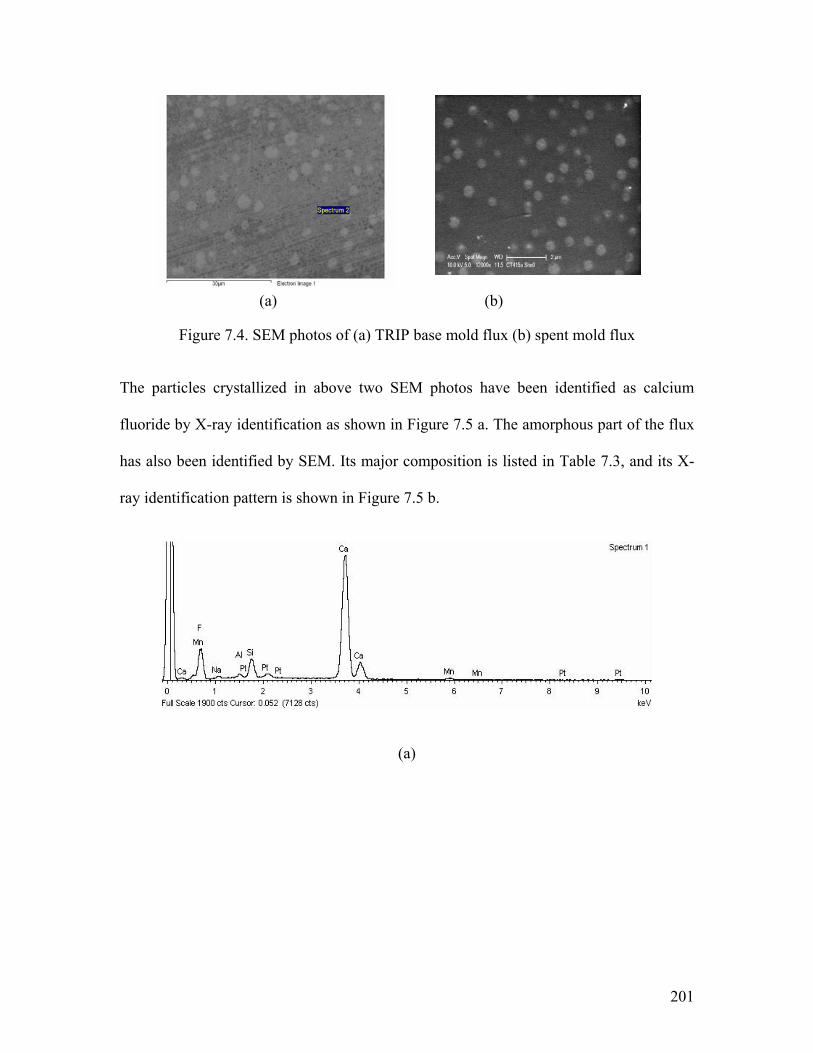
201
(a) (b)
Figure 7.4. SEM photos of (a) TRIP base mold flux (b) spent mold flux
The particles crystallized in above two SEM photos have been identified as calcium
fluoride by X-ray identification as shown in Figure 7.5 a. The amorphous part of the flux
has also been identified by SEM. Its major composition is listed in Table 7.3, and its X-
ray identification pattern is shown in Figure 7.5 b.
(a)

202
(b)
Figure 7.5. (a) X-ray identification of CaF2 and (b) CaSiO4
Table 7.3. Chemical composition of the amorphous phase of TRIP mold flux
Element O Na Mg Al Si Ca Mn Fe
Weight% 40.96 5.66 0.57 3.42 18.23 21.71 4.71 0.61
Atomic% 60.03 5.77 0.55 2.97 15.22 12.70 2.01 0.26
From both Table 7.3 and Figure 7.5 b, the major composition of the amorphous phase is
calcium silicate with some small amounts oxides (Na2O, MnO2), CaSiO4, which is based
on the SiO42- tetrahedron forming as a silicate chain.
The calcium fluoride as a relatively high melting point, 1402 Celsius, is a white (colorless)
crystal, and naturally exists as the mineral fluorite. However, the TRIP mold fluxes have
a lower melting point range from 900 to 1200 Celsius. The liquid slag only appears
transparent when it was heated up to 1500 degrees as it was shown by running Double

203
Hot Thermocouple tests. Therefore, calcium fluoride easily precipitates when the liquid
TRIP mold flux was cooled down due to the crystallization of CaF2 in the disks.
Two TRIP mold fluxes disks with thickness of 2.2 and 3.0 mm were heated by thermal
radiation to study what is the behavior of these fine CaF2 crystals and how they influence
the radiative heat transfer rate. The following Figure 7.6 gives a comparison between the
2.2 mm and 3.0 mm TRIP (AL4D) spent mold flux disks and a 2.3 and 2.47 mm thick
403 mold flux disks when they were heated by same constant 900 KW/m2 thermal
radiation. It could be observed that the heat fluxes in copper mold under the spent TRIP
mold fluxes tend to be constant once they reach steady state. All the final heat fluxes at
steady state are in the same magnitude as when the 403 disks have been fully crystallized
and reached the final steady state. Therefore, it could be concluded that the chemistry in
the crystallized TRIP and 403 mold fluxes has little effect on the radiative heat transfer
rates. Thus, the TRIP fluxes are fully crystallized before the trial.
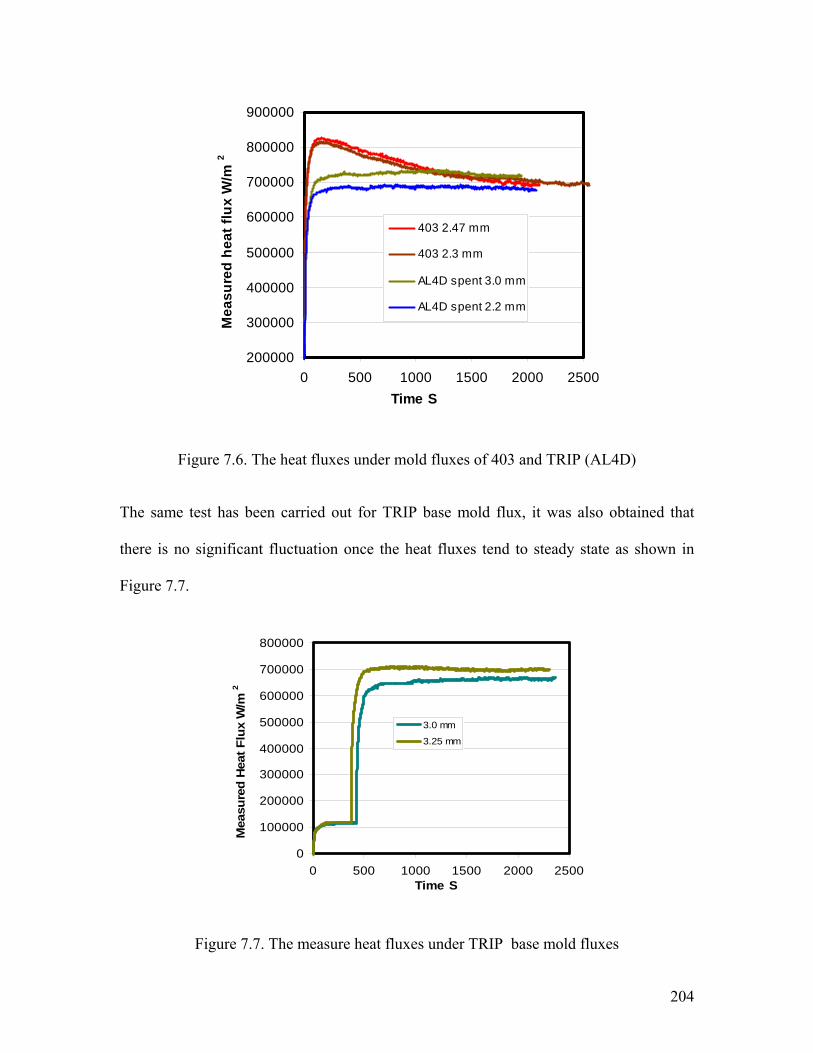
204
200000
300000
400000
500000
600000
700000
800000
900000
0 500 1000 1500 2000 2500Time S
Mea
sure
d he
at fl
ux W
/m2
403 2.47 mm
403 2.3 mm
AL4D spent 3.0 mm
AL4D spent 2.2 mm
Figure 7.6. The heat fluxes under mold fluxes of 403 and TRIP (AL4D)
The same test has been carried out for TRIP base mold flux, it was also obtained that
there is no significant fluctuation once the heat fluxes tend to steady state as shown in
Figure 7.7.
0
100000
200000
300000
400000
500000
600000
700000
800000
0 500 1000 1500 2000 2500Time S
Mea
sure
d H
eat F
lux
W/m
2
3.0 mm
3.25 mm
Figure 7.7. The measure heat fluxes under TRIP base mold fluxes

205
A comparison of X-ray patterns between the original TRIP (AL4D) mold flux disk and
the heated disk (the 3.0 mm thick disk after being heated from Figure 7.7) is shown in
Figure 7.8. It was noticed that there was an other phase crystallized as the green curves
developed along with calcium fluoride (red line) during the experiment in Figure 7.8 a,
and this further crystallization of the original TRIP mold flux has little effect on the
radiative heat transfer rates as shown in Figure 7.7. The new crystallized phase has been
identified Ca(Mn,Fe)Si2O6 (Bustamite, Ferroan).
(a)
(b)
Figure 7.8. (a). A comparison of X-ray patterns between original and final TRIP (AL4D) base mold flux, and (b).The X-ray identification patterns for final AL4D TRIP base mold flux
--Original TRIP base mold flux --TRIP base mold flux after heating

206
For the spent TRIP mold flux, both the original and the heated 3 mm thick mold flux disk
(as shown in the Figure 7.6) were also scanned by X-ray, and its X-ray pattern was given
in Figure 7.9. Similarly, a more complex polycrystal was crystallized (blue line) along
with the red original calcium fluoride. Again, the further crystallization of this spent mold
flux did not have a significant effect on the radiative heat transfer rate as shown in Figure
7.6.
Figure 7.9 X-ray pattern of TRIP spent mold fluxes
A SEM photo of the heated 3 mm thick spent TRIP mold flux was given in Figure 7.10. It
was observed that there were three phases developed in the crystallized disk: a dominant
polycrystal phase, a cream white phase dissipating in the grain boundary, and fine
particles, which were identified as: NaCaAlSi2O7, CaF2 and Al2O3 respectively.
--Original TRIP spent mold flux -- Spent TRIP mold flux after heating

207
Figure 7.10. The SEM photo of the crystallized spent mold flux
The results indicate how easy the calcium fluoride could be crystallized in the sample
disks, even though the disks were under a fast cooling condition. Thus it is difficult to
achieve a full glassy phase in the solid TRIP mold flux layer close to the copper mold.
These crystallized calcium fluoride crystals tend to cause the TRIP mold flux disks to
lose their transparency, thus, the heat reflectivity of disk increases, and the extinction
coefficient is also improved due to the precipitation of the fine calcium fluoride crystals.
Both of these two factors, surface reflectivity and extinction coefficient, increase, such
that the further crystallization of the TRIP mold flux has little effect on radiative heat
transfer rates, and all of the measured stable heat transfer rates are at the same range as
shown in the Figures 7.6 and 7.7. It also could be observed in this work that the
crystallization of the slag is the primary factor to affect the radiation heat transfer rate in
continuous casting; and that the solid crystalline mold flux chemistry when the slag is
crystallized has a only small influence on the radiative heat transfer rate. This result is
1
3
2

208
consistent with Susa and other researchers’ results [68, 73]. Therefore, all of the heat
fluxes at steady state, under crystallized mold flux disks, are at the same magnitude, even
when the crystalline disks exist with large chemistry differences (Figure 7.6 and 7.7).
The second phenomenon is that the second precipitated crystal chemistry changes with an
increase of the alumina content in the spent mold flux. This second crystallized phase in
base mold flux is Ca(Mn,Fe)Si2O6 (Bustamite, Ferroan), when the alumina content is
around 3.66 weight percentage. This crystallized phase transforms into NaCaAlSi2O7
when the alumina content goes up to 28.6% in the spent mold flux. Therefore, the
addition of alumina into the spent mold flux induces the transformation of the crystallized
phase, which may bring a longer transient time for the TRIP mold flux in continuous
casting.
Finally, very fine alumina crystals could be clearly seen in the SEM photos of the spent
mold flux. The precipitation of fine alumina crystals in the spent mold flux is due to the
pick up of the alumina content in the spent mold flux. These precipitated alumina crystals
will greatly increase the viscosity of the flux, and will exacerbate the sticking problem
during continuous casting of these grades.
The solidification path of these fluxes is very complicated. First calcium fluoride
precipitates, followed by a complex oxide followed by alumina when the alumina content
is high. It is of no surprise that these fluxes cause casting difficulties-they are not
chemically stable, are reactive, are poor glass formers and precipitate numerous small
crystals which when combined with the increased alumina content will lead to a very

209
viscous and sticky flux layer against the mold wall. The presence of such a layer will lead
to local “hot spots” and shell sticking as is observed.

210
8. Summary, Conclusions and Future Work
8.1 Summary A mold flux is used to moderate the heat transfer rate in continuous casting and to
achieve excellent slab surface quality. Significant industrial research has been carried out
to study the mechanism of the heat transfer in the caster mold, as well as its variation
with mold flux selection, casting velocity, thickness of flux, and mold design. However,
most of the research was related to conduction heat transfer, and very few studies were
focused only on the radiative heat transfer component of heat transfer due to its
complexity and the extremely harsh casting environment. Since the contribution of the
radiation to the overall heat flux ranges from 20-50% in the meniscus area, where the
initial solidification phenomena occur that determine the final quality of solidified slab, it
is desirable to understand the radiative heat transfer process in the meniscus area, and to
explore methods to modify such radiation. Thus, this thesis focused on the radiative heat
transfer mechanisms in continuous casting and how different phases of a solid mold flux
would affect radiation that transferred across the flux in the mold. The second objective
of this work was to observe solid flux crystallization and to measure its effect on the
radiative heat transfer rate. Thirdly, a general heat transfer model in the meniscus area
was developed to understand how crystallization of mold flux modifies overall heat
transfer rate. Finally, a study of mold fluxes with different amount of transition metal
oxides and a typical mold flux for TRIP steel was conducted.

211
An experimental apparatus capable of producing a high infrared heat flux, on the order of
those seen in continuous casting, was developed to simulate the complex radiative heat
transfer phenomenon in continuous casting, and a mixture of phases of mold flux was
achieved with liquid layer at the top, glass at the bottom and crystalline phase developed
from liquid toward glass. Thus, the complex radiative heat transfer phenomena in the
meniscus area are simulated.
8.2 Significant results and conclusions The following highlights outline the major results of this work:
1. The study of a solid mold flux and its effect on radiative heat transfer
Both crystalline phase and glassy phase mold flux layers enhanced radiative heat transfer
when compared with a bare copper surface and the presence of a flux improves the heat
transfer rate by 20-40%. The glass phase disk displays a stronger radiation transferring
ability than crystalline disk, because the glass phase has an amorphous structure resulting
in a very small absorption coefficient, which is 400 m-1. However, the crystalline phase
has a larger extinction coefficient that is 4500 m-1. Therefore, a large quantity of the
thermal radiation will be scattered at the grain boundaries, defects and surfaces in
crystalline samples leading to a decrease in efficiency in energy transfer. The other
contribution of the radiation inhibition of crystalline flux is its opaque top surface, whose
reflectance is around 0.598, and the glass disk is 0.103 in this study. Thus there will be
more incident radiation reflected for the crystalline sample disk. It is of interest that the
crystalline disks display little effect of thickness on radiation heat transfer rate due to its

212
huge extinction coefficient, a fact that will help moderate local heat transfer fluctuations
due to cast surface irregularities when results are compared to fully glassy samples. This
effect probably accounts for the success of fully crystallized mold slags in the casting of
peritectic steel grades where cast surface wrinkling is observed.
A heat absorption and conduction model was developed in this study to understand the
mechanism of radiative heat transfer across the solid layer to copper mold. With this
model, the importance of radiative heat transfer rates in meniscus area of continuous
casting could be explained.
2. The effect of crystallization and melting of mold flux on radiative heat transfer rate
With the redesigned heat transfer simulator, the effect of the solid flux crystallization
from a pure glass slag disk on the radiation heat transfer rate was also studied. It was
found that this crystallization could lead to a 10-25% overall heat reduction in the heat
transfer rate by radiation due to the blockage of incident radiation. The reason for the
reduction of heat flux across the solid mold flux to the mold during the development of
mold flux crystallization is because the precipitated crystals introduced a larger thermal
resistance in the slag disk causing its thermal conductivity to decrease. A model has also
been developed to predict the heat flux evolution along with the crystallization of the
solid flux, which is consistent with the experimental results.
The effect of mold flux melting and crystal fraction dissolution on radiative heat transfer
rates has also been measured. It was found that the melting of the solid crystalline flux

213
enhances the incident radiation transfer and results in a higher overall heat transfer rate in
the system due to the minimization of the crystal volume which in turn to reduce the solid
flux thermal resistance.
Finally, a general heat transfer model has been developed to allow the study of mold flux
crystallization and the mechanism by which it modifies radiation transfer in the meniscus
area in the caster. The contribution of radiation to the overall heat transfer rate from the
liquid layer could be high in the range from 33-47% depending upon the molten flux
thickness. The full crystallization of the solid flux would inhibit 20% of the overall heat
transfer rate from the meniscus due to the blockage of the incident radiation from liquid
flux.
3. The study of mold flux containing different amount of transition metal oxides and a typical flux of TRIP steel
The addition of transition metal oxides into a commercial mold flux will lead fully glassy
mold flux samples to lose their transparency. Therefore, the surface of the slag disks
containing MnO and Fe2O3 changes from transparent to green, brown, and a final black,
as the concentration of the MnO and Fe2O3 increases. Thus, the surface reflectivity
increases and there will be more radiation reflected which results in less heat being
transferred. The addition of MnO and Fe2O3 also leads to a larger value for the absorption
coefficient and the refractive index, which in turn scatters a larger amount of the
absorbed energy, when these photons travel inside the disk. Thus, the absorbed radiation
will further inhibit the radiation heat transfer rate with the addition of these transition
metal oxides. It has been computed that the part of the radiation being blocked by the

214
addition of the transition metal oxides would lower the overall heat transferred to the
mold from 6% to 2%, depending on the thickness of the glass flux. Since the solid flux is
a mixture of crystalline and glassy phases, the over effect would be less than this value.
Thus the methods to reduce heat flux by only changing absorption coefficient are not
very effective.
A typical mold flux for TRIP steel, AL4D is studied in chapter 7. The results indicate that
calcium fluoride could be crystallized in the sample disks, even though the disks were
under a fast cooling condition. Thus it is difficult to achieve a fully glassy phase in the
solid TRIP mold flux layer close to the copper mold. These crystallized calcium fluoride
crystals tend to cause the TRIP mold flux disks to lose their transparency, thus, the heat
reflectivity of disk increases, and the extinction coefficient is also improved due to the
precipitation of the fine calcium fluoride crystals. Both of these two factors, surface
reflectivity and extinction coefficient, increase, such that the further crystallization of the
TRIP mold flux would have little effect on radiative heat transfer rates. It was also
observed that the crystallization of the slag is the primary factor to affect the radiation
heat transfer rate in continuous casting; and that the solid crystalline mold flux chemistry,
when the slag is crystallized has a only small influence on the radiative heat transfer rate.
The second phenomenon is that the second precipitated crystal chemistry changes with an
increase of the alumina content in the spent mold flux. Therefore, the addition of alumina
into the spent mold flux induces the transformation of the crystallized phase, which may
bring a longer transient time for the TRIP mold flux in continuous casting.

215
Finally, very fine alumina crystals could be clearly seen in the SEM photos of the spent
mold flux. The precipitation of fine alumina crystals in the spent mold flux is due to the
pick up of the alumina content in the spent mold flux. These precipitated alumina crystals
will greatly increase the viscosity of the flux, and will exacerbate the sticking problem
during continuous casting of these grades.
The solidification path of these fluxes is very complicated. First calcium fluoride
precipitates, followed by a complex oxide followed by alumina, when the alumina
content is high. It is of no surprise that these fluxes cause casting difficulties-they are not
chemically stable, are reactive, are poor glass formers and precipitate numerous small
crystals which when combined with the increased alumina content will lead to a very
viscous and sticky flux layer against the mold wall. The presence of such a layer will lead
to local “hot spots” and shell sticking, as is observed.

216
8.3. Future work
This thesis has simulated the radiative heat transfer phenomena, and carried out the effect
of mold flux crystallization on the overall heat transfer rate in meniscus area. With the
developed model and experimental apparatus, the general heat transfer phenomena from
the liquid flux across solid flux could be studied, even the crystallization from the liquid
layer to the glassy phase could be observed and how the heat transfer rate evolves with
this crystallization could be analyzed.
Fluxes with different crystallization temperatures could also be studied. The research of
how the liquid layer changes with the flux chemistry and how the heat transfer rate varies
with the liquid layer development is also desirable to be conducted.

217
9. References 1. P. J. Zasowski and D. J. Sosinski, “ Control of heat removal in the continuous casting mold”
Steelmaking Conference Proceedings, ISS, Vol. 73, 1990, pp. 253-259. 2. W. H. Emling and S. Dawson, “Mold Instrumentation for Breakout Detection and Control”
Steelmaking Conference Proceedings, ISS, Vol. 74, 1991, pp. 197-217. 3. R.B. Mahapatra, J. K. Brimacombe, I.V. Samarasekera, N. Walker, E.A. Patterson, J. D.
Young, “Mold behavior and its influence on quality in the continuous casting of steel slabs: Part I. Industrial trials, mold temperature measurements, and mathematical modeling” Metallurgical Transactions B, Vol. 21B, 1990, pp. 861-874.
4. K.C. Mills et al., “Effect of casting powder on heat transfer in continuous casting”, Continuous Casting ’85, The Metal Society, London England, 1985, paper 57, pp. 57.1-57.7
5. J. Savage, and W. H. Pritchard “The problem of rupture of the billet in the continuous casting of steel”, Journal of the Iron and Steel Institute, Nov. 1954 pp. 269-531.
6. S.N. Singh, and K.E. Blazek, “Heat transfer and solidification kinetics in meniscus zone during casting” Metals Technology, Oct. 1974, pp. 17-27
7. H., P. Tomono, W. Ackermann and W. Heinemann, “Elements of surface mark formation in continuous casting of steel” Proceedings of the International Conference on Solidification Technology in Foundry and Cast House, The Metals Society, Warwick, 1980, pp. 524-531.
8. H. Tomono, , W. Kurz, and W. Heinemann (1981) “The liquid steel meniscus in molds and its relevance to the surface quality of castings”, Metallurgical transactions B Vol. 12B, pp. 409-411.
9. I. Saucedo, J. Beech and G. J. Davies, “Heat transfer and solidification kinetics in meniscus zone during casting” Metals Technology Vol 9, 1982, pp282-291.
10. R. S. Laki, , J. Beech, and G. J. Davies “Curved-boundary heat transfer model and its application to meniscus zone during casting” Iron making and Steel making, Vol. 11, No. 5, 1984, pp. 283-291.
11. E.S. Szekeres, “Overview of mold oscillation in continuous casting” Iron and Steel Engineer, July 1996, pp.29-37.
12. R. J. O’Malley, “Observations of various steady state and dynamic thermal behaviors in a continuous casting mold” 82nd Steelmaking Conference- Iron and Steel Society, March 1999.
13. S. Ohmiya, K.H. Tracke and K. Schwerdtfeger, Iron making Steelmaking, Vol.10, 1983, No. 1, pp24.
14. M. Jenkins, ISS Steelmaking Proceedings, 1995, pp.395. 15. M Susa, K. Mills, M. Richardson and D. Stewart, Ironmaking Steelmaking, Vol. 21, 1994,
pp.623. 16. M. Emi, ISS Steelmaking Proceedings. 1991, pp.623. 17. H. Kyoden, T. Doihara and O. Nomura, ISS Steelmaking Proc., 1986, pp.153. 18. S. Ohmiya, K. H. Tacke and K. Schwerdtfeger, Ironmaking Steelmaking, Vol.10 1983, pp 24. 19. K. Watanabe, M. Suzuki, K. Murakami and T. Shiomi, Tetsu-to-hagane, Vol. 83, 1997, No. 2,
pp. 115 20. Y. Kashiwaya, C. Cicutti, and A. W. Cramb, ISIJ international, Vol.38, 1998, pp348 21. Y. Kashiwaya, C. Cicutti, and A. W. Cramb, ISIJ international, Vol. 38, 1998, pp357. 22. A. B. Badri, and A. W. Cramb, “Heat Flux Calculations From Thermocouples – What Can Be
Measured?” 85th Steelmaking Conference Proceedings, ISS-AIME, 2002, pp. 65-76. 23. A. B. Badri, and A. W. Cramb, “Measurement of Oscillating Temperatures Using Subsurface
Thermocouples” 60th Electric Furnace Steelmaking Conference Proceedings, ISS-AIME, 2002. pp.412
24. A. B. Badri, and A. W. Cramb, “Thermocouples – What temperature are they measuring?” 2001 ISS Electric Furnace Conference Proceedings, 2001, pp. 661-670.

218
25. J. F. King, “Global steel industry analysis-Iron & Steel industry production reports from the ISSB”, ISSB monthly world, I & S review, 2006.
26. D. Ameing, “The pivotal nature of continuous casting in the steel industry”, Dr. Manfred Wolf Symposium—Innovation and Excellence in Continuous Casting, Zurich, Switzerland, May 2002, pp 2-14.
27. B.G. Thomas, “Continuous Casting Modeling”, The Encyclopedia of Advanced Materials, Pergamon Elsevier Science Ltd., Oxford, UK, Vol. 2, 2001, pp8.
28. M.M. Wolf, “History of Continuous Casting”, Steelmaking Conference Proceedings, Vol 75, 1992, pp 83-187.
29. P.V. Ribound, M. Larrecq, “Lubrication and heat transfer in a continuous casting mold”, Steelmaking Conference Proceedings, The Iron and Steel Society, 1979, Warrendale, PA
30. I. Saucedo, J. Beech and G. J. Davies “Heat transfer and solidification kinetics in meniscus zone during casting” Metals Technology, Vol. 9, 1982, pp. 282-291
31. R.B. Mahapatra, J. K. Brimacombe, I. V. Samarasekera, N. Walker, E. A. Paterson, J. D. Young (1990) “Mold behavior and its influence on quality in the continuous casting of steel slabs: Part I. Industrial trials, mold temperature measurements and mathematical modeling” Metallurgical Transactions B Vol. 22B, pp. 861-873
32. E.A. Vladimiroy, (1970) “On the experimental determination of thermal fluxes in the walls of molds used for the continuous casting of metals” Inzhenerno-Fizicheskii Zhurnal, Vol. 18, No. 2, pp. 270-277
33. A.W. Hills, (1964) “Simplified theoretical treatment for the transfer of heat in continuous casting moulds” Journal of the Iron and Steel Institute January 1965 pp. 18-26
34. A. Grill, and J. K. Brimacombe (1976) “Influence of carbon content on rate of heat extraction in the mold of a continuous casting machine” Ironmaking and Steelmaking, 1976 No. 2 pp.76-79
35. P. J. Zasowski and D. J. Sosinski, (1990) “ Control of heat removal in the continuous casting mold” Steelmaking Conference Proceedings, ISS, Vol. 73, 1990, pp. 253-259.
36. W. H. Emling and S. Dawson, “Mold Instrumentation for Breakout Detection and Control” Steelmaking Conference Proceedings, ISS, Vol. 74, 1991, pp. 197-217.
37. Y. Meng, B.G. Thomas, Metallurgical and Materials Transaction B, Vol. 34B, 2003, pp. 685-705
38. R.D. Pehlke, A. Jeyarajan, H. Wada, “Summary of Thermal Properties for Casting Alloys and Mold Materials” Michigan University, Report Number: NSFMEA82028, 1982.
39. J.F. Holzhauser, K.H. Spitzer, “ The influence of casting aids on heat transfer in the mold, the surface quality and incidence of breakouts in the continuous casting of steel, ECSC Contract, 7210 CA/139, Final report, EUR 12198 DE
40. R. Siegel and J.R. Howell, Thermal Radiation Heat Transfer, McGraw-Hill, Kogakusha. 41. H. Shibata, M. Suzuki, T. Emi, ISIJ international, Vol. 36, 1996, Supplément, pp. s179 42. H. Nakato, M. Ozawa, K. Kinoshita, Tetsu-to-Hagane, Vol. 67, 1981, pp 1200 43. A. Yamauchi, T. Sakaraya, T. Emi, Tetsu-to-Hagane, Vol. 79, 1993, pp 167 44. Y. Sugitani, M. Nakamura, Tetsu-to-Hagane, Vol. 81, 1995, pp 971 45. M. Suzuki, H. Shibata, T. Emi, ISIJ international, Vol. 36, 1996, Supplement, pp. S171 46. K.E. Blazek, I.G. Saucedo, H.G. Tsai, “An investigation on mold heat transfer during
continuous casting”, Steelmaking Conference Proceedings, ISS, Warrendale, PA, 1993, pp.411
47. H.L. Gilles, “Development of thermal solidification models for Bethlehem Steel slab casters”, Steelmaking conference Proceedings, ISS, Warrendale, PA, 1993, pp.315
48. C.A. Pinheiro, et al., Mold flux for continuous casting of steel, keeping current I, part I, iron and steelmaker, 1994(October): pp. 55-56.
49. H. Kyoden, et al, “Development of mold powders for high speed continuous casting of steel”,

219
Steelmaking conference proceedings, the iron and steel society: Warrendale, PA, 1987: pp. 45-51.
50. E. Takeuchi, J.K. Brimacombe, “The formation of oscillation marks in the continuous casting of steel slabs”, Metallurgical and Materials Transaction B, Vol. 15B, 1984, pp.493
51. P.V. Larrecq, et al, “Lubrication and heat transfer in a continuous casting mold”, 62nd national open hearth & basic oxygen steel conference proceedings, Detroit, 1979, pp. 78-90.
52. M. Emi, “The mechanism for sticking break-outs and net developments in continuous casting”, Steelmaking conference proceedings, the iron and steel society: Warrendale, PA, 1991, pp. 623-630.
53. E.L. Oriel, Journal of metals, Vol. 26, No. 10, 1974, pp. 37-42. 54. T.A. Ikeda, et al, “Optimization of mold oscillation for high speed casting - new criteria for
mold oscillation”, Canadian metallurgical quarterly, Vol. 38, 2000, pp. 295-300. 55. T. Emi, et al., “Influence of physical and chemical properties of mold powders on the
solidification and occurrence of surface defects of strand cast slabs”, 61st national open hearth and basic oxygen steel conference proceedings, Chicago ,1978, pp. 350-361.
56. C.A.M. Pinheiro, I.V. Samarasikera and B.N. Walker, “Mold heat transfer and continuously cast billet quality with mould flux lubrication:, Ironmaking and Steelmaking, Vol 27, 2000, pp.37
57. J. Cho, H. Shibata, T. Emi and M. Suzuki, ISIJ international, Vol. 38, 1998, pp.440 58. J.F. Chavez, A. Rodriguez, V. H. Tapia , ‘Laboratory and plant studies on thermal proterties
of mold powders’, Steelmaking ConferenceProceedings, Nashville, TN, 1995, Vol. 78, pp.679
59. Y. Nakamori, Y. Fujikake, K. Tokiwa, Tetsu-to-Hagane (J. Iron Steel Ins. Jpn), Vol. 70, 1984, pp. 1262
60. M.M. Wolf, “Review of Mould Friction”, BHM, 2000, Vol. 145, pp. 270 61. W.H. Emling, S. Dawson, “Mold instrumentation for breakout detection and control”, 74th
Steelmaking Conference, Washington, D.C., Vol. 74, 1991, pp.197 62. Y. Meng, B.G. Thomas, Metallurgical and Materials Transaction B, Vol. 34B, 2003, pp.707 63. M. Susa, K.C.M., M.J. Richardson, R. Taylor and D. Stewart, “Thermal properties of slag
films taken from continuous casting mould”, Ironmaking and steelmaking, Vol. 21, 1994, pp. 279-286.
64. J. Cho, H, Toshihiko, T. Emi and M. Suzuki, “Radiative heat transfer through mold flux film during initial solidification in continuous casting of steel”, Transaction of the iron and steel Institute of Japan, Vol. 38, 1998, pp. 268-275.
65. M. D. Rosa, et al, Metallurgical Transactions B, Vol.12B, 1981, pp. 287-298. 66. T. Kanazawa, S. Hiraki, T. Murakami, Tetsu-to-Hanane, Vol. 83, 1997, pp. 701 67. J. Fukuta, T. Kondo, M. Okumura, ISIJ, Tokyo, 1994, pp.68 68. J. Cho, H. Shibata, M. Suzuki, ISIJ international, Vol. 38, 1998, pp. 268 69. J. Cho, H. Shibata, M. Suzuki, ISIJ international, Vol. 38, 1998, pp. 440 70. J. Cho, H. Shibata, M. Suzuki, ISIJ international, Vol. 38, 1998, pp. 834 71. F.M. White, F. M, Heat Transfer, Addison-Wesley, Reading, MA, 1984. pp.563 72. M. F Modest, Radiative Heat Transfer, 2nd Edition, Academic Press, CA, 2003. 73. M. Susa, K. Nagata, K.C. Mills, Ironmaking and steelmaking, Vol. 20, 1993, pp. 372.
74. Wanlin Wang, Alan Cramb. “Model of Radiative Heat Transfer in Solid Mold Flux Phase during Continuous Casting” Proc. of Automation & Control/Advanced Online Metallurgical Models/Sensors MS&T 2005, pp 33-44, 2005
75. Wanlin Wang, Alan Cramb. “The Effect of Mold Flux Crystallization on Radiative Heat Transfer Rates” TMS letters, 2005.
76. Wanlin Wang, Alan Cramb. “The Observation of Mold Flux Crystallization on Radiative Heat Transfer”, ISIJ Vol. 45, no.12, 2005, pp.1864-1870.

220
77. M Susa, F. Li, K. Nagata, Metallurgical Transactions B, Vol. 23B, 1992, pp.331.
78. J. Sengupta, H. Shin, BG Thomas, et al, Acta Mat., Vol. 54, 2006, pp.1165
79. E. S. Larsen and H. Berman, “The microscopical determination of non-opaque minerals”, 2nd edn, US Geological Survey Bull. 1934, Washington, DC, US Government Printing Office, pp. 848
80. M. R. Berrahmoune, S. Berveiller, K. Inal, A. Moulin, E. Patoor, Materials Science and Engineering A, Vol. 378, 2004, pp. 304
81. H.C. Chen, H. Era, M.Shimizu, Metallurgical Transactions A, Vol. 20A, 1989, pp. 437 82. W.C. Jeong, D.K. Matlock, G. Krauss, Materials Science and Engineering A, Vol. 165, 1993,
pp. 9 83. O. Matsumura, Y. Sakuma, H. Takechi, ISIJ, Vol.32, 1992, pp. 1014 84. T. L. Baum, R. J. Fruehan and S. Sridhar, Metallurgical Transactions B, in press. 85. Y. Shiraishi, Handbook of physo-chemical properties at high temperature, ISIJ, Tokyo, 1988,
Ch 10 86. J Park, A. B. Badri, J. T. Wolfe, P. Nolli, A. W. Cramb, ISS Tech 2003 Conference
Proceedings, 2003, pp. 575