Embed Size (px)
Citation preview

Document of
The World Bank
Report No: ICR00003835
IMPLEMENTATION COMPLETION AND RESULTS REPORT
(TF-12163)
ON A
GRANT FROM THE GLOBAL ENVIRONMENT FACILITY TRUST FUND
IN THE AMOUNT OF US$1.82 MILLION
TO THE
REPUBLIC OF ARMENIA
FOR AN
ENERGY EFFICIENCY PROJECT
November 18, 2016
Energy and Extractives Global Practice
South Caucuses Country Department
Europe and Central Asia Region
Pub
lic D
iscl
osur
e A
utho
rized
Pub
lic D
iscl
osur
e A
utho
rized
Pub
lic D
iscl
osur
e A
utho
rized
Pub
lic D
iscl
osur
e A
utho
rized

CURRENCY EQUIVALENTS
(Exchange Rate Effective June 2016)
Currency Unit = Armenian Dram
1.00 AMD = US$ 0.002
US$ 1.00 = AMD 477.53
FISCAL YEAR
January 1 – December 31
ABBREVIATIONS AND ACRONYMS
BOT Board of Trustees
CFL compact fluorescent lamp
CO2 carbon dioxide
EBRD European Bank of Reconstruction and Development
EE energy efficiency
EMP Environmental Management Plan
ESA energy service agreement
GEF Global Environment Facility
GEO global environmental objective
HVEN High Voltage Electric Network
IFI international finance institutions
IFR Interim Financial Report
IP implementation progress
ISR Implementation Status Report
kWh kilowatt hour
LED light emitting diode
MEINR Ministry Energy Infrastructures and Natural Resources
MoF Ministry of Finance
NCB National Competitive Bidding
NEEAP National Energy Efficiency Action Plan
NPV net present value
OM operations manual
PDO project development objective
PSRC Public Services Regulatory Commission
R2E2 Fund Armenia Renewable Resources and Energy Efficiency Fund
RE renewable energy
TA technical assistance
UNDP United National Development Program
USAID United States Agency for International Development

Senior Global Practice Director: Riccardo Piluti
Sector Manager: Ranjit Lamech
Project Team Leader: Ani Balabanyan and Jas Singh
ICR Team Leader: Jas Singh
ICR Author: Pedzisayi Makumbe


ARMENIA
Energy Efficiency Project
CONTENTS
Data Sheet
A. Basic Information
B. Key Dates
C. Ratings Summary
D. Sector and Theme Codes
E. Bank Staff
F. Results Framework Analysis
G. Ratings of Project Performance in ISRs
H. Restructuring
I. Disbursement Graph
1. Project Context, Global Environment Objectives and Design ................................... 1
2. Key Factors Affecting Implementation and Outcomes .............................................. 5
3. Assessment of Outcomes .......................................................................................... 15
4. Assessment of Risk to Development Outcome ......................................................... 21
5. Assessment of Bank and Borrower Performance ..................................................... 22
6. Lessons Learned ....................................................................................................... 23
7. Comments on Issues Raised by Borrower/Implementing Agencies/Partners .......... 24
Annex 1. Project Costs and Financing .......................................................................... 26
Annex 2. Outputs by Component ................................................................................. 27
Annex 3. Economic and Financial Analysis ................................................................. 28
Annex 4. Bank Lending and Implementation Support/Supervision Processes ............ 30
Annex 5. Beneficiary Survey Results ........................................................................... 32
Annex 6. Stakeholder Workshop Report and Results ................................................... 34
Annex 7. Summary of Borrower's ICR and/or Comments on Draft ICR ..................... 35
Annex 8. Comments of Cofinanciers and Other Partners/Stakeholders ....................... 36
Annex 9. List of Supporting Documents ...................................................................... 37
MAP


A. Basic Information
Country: Armenia Project Name: Energy Efficiency
Project
Project ID: P116680 L/C/TF Number(s): TF-12163
ICR Date: 11/14/2016 ICR Type: Core ICR
Lending Instrument: SIL Borrower: REPUBLIC OF
ARMENIA
Original Total
Commitment: USD 1.82M Disbursed Amount: USD 1.82M
Revised Amount: USD 1.82M
Environmental Category: B Global Focal Area: C
Implementing Agencies:
Armenia Renewable Resources and Energy Efficiency Fund
Cofinanciers and Other External Partners:
B. Key Dates
Process Date Process Original Date Revised / Actual
Date(s)
Concept Review: 02/18/2010 Effectiveness: 08/10/2012
Appraisal: 04/04/2011 Restructuring(s): 03/16/2015
Approval: 03/27/2012 Mid-term Review: 07/09/2014 01/31/2014
Closing: 06/30/2015 06/30/2016
C. Ratings Summary
C.1 Performance Rating by ICR
Outcomes: Highly Satisfactory
Risk to Global Environment Outcome Low or Negligible
Bank Performance: Satisfactory
Borrower Performance: Satisfactory
C.2 Detailed Ratings of Bank and Borrower Performance
Bank Ratings Borrower Ratings
Quality at Entry: Highly Satisfactory RA Government: Satisfactory
Quality of Supervision: Satisfactory Implementing
Agency/Agencies: Highly Satisfactory
Overall Bank
Performance: Satisfactory
Overall Borrower
Performance: Satisfactory

C.3 Quality at Entry and Implementation Performance Indicators
Implementation
Performance Indicators
QAG Assessments
(if any) Rating
Potential Problem
Project at any time
(Yes/No):
No Quality at Entry
(QEA): None
Problem Project at any
time (Yes/No): No
Quality of
Supervision (QSA): None
GEO rating before
Closing/Inactive status Highly Satisfactory
D. Sector and Theme Codes
Original Actual
Sector Code (as % of total Bank financing)
Energy efficiency in Heat and Power 100 100
Theme Code (as % of total Bank financing)
Climate change 100 100
E. Bank Staff
Positions At ICR At Approval
Vice President: Cyril E. Muller Philippe H. Le Houerou
Country Director: Mercy Miyang Tembon Asad Alam
Practice
Manager/Manager: Ranjit J. Lamech Ranjit J. Lamech
Project Team Leader: Ani Balabanyan Ani Balabanyan
ICR Team Leader: Jasneet Singh
ICR Primary Author: Pedzisayi Makumbe

F. Results Framework Analysis Global Environment Objectives (GEO) and Key Indicators(as approved) The project development objective is to reduce energy consumption of social and other
public facilities. The global environmental objective is to decrease greenhouse gas
emissions through the removal of barriers to the implementation of energy efficiency
investments in the public sector.
Revised Global Environment Objectives (as approved by original approving authority)
and Key Indicators and reasons/justifications
(a) GEO Indicator(s)
Indicator Baseline Value
Original Target
Values (from
approval
documents)
Formally
Revised
Target
Values
Actual Value
Achieved at
Completion or
Target Years
Indicator 1 : Energy savings in retrofitted social and other public facilities (kWh)
Value
(quantitative or
Qualitative)
0
215,692,640
215,692,640
540,240,000
Date achieved 07/31/2012 06/30/2015 06/30/2016 06/30/2016
Comments
(incl. %
achievement)
Estimates were based on previous projects which used conventional
procurement. The Project used NPV-based procurement, and other
innovations which resulted in more savings per dollar invested. Thus the
Project achieved 250% of the original target.
Indicator 2 : CO2 emission reductions in retrofitted social and other public facilities
through energy efficiency investments (tons of CO2 equivalent)
Value
(quantitative or
Qualitative)
0
50,549
50,549
145,739
Date achieved 07/31/2012 06/30/2015 06/30/2016 06/30/2016
Comments
(incl. %
achievement)
See above. The Project achieved 288% of its target CO2.
(b) Intermediate Outcome Indicator(s)
Indicator Baseline Value
Original Target
Values (from
approval
documents)
Formally
Revised
Target Values
Actual Value
Achieved at
Completion or
Target Years
Indicator 1 : Cumulative investments in social and other public facilities (USD)

Value
(quantitative or
Qualitative)
0
8,700,000
6,000,000
10,197,863
Date achieved 07/31/2013 06/30/2015 06/30/2016 06/30/2016
Comments
(incl. %
achievement)
The original target was downgraded at MTR due to slow progress.
However, after MTR, the subproject pipeline improved, along with a
focus on larger subprojects and one-year extension. Thus the final
investments exceeded the revised target by 70%, and the original target by
17%.
Indicator 2 : Number of public sector projects commissioned
Value
(quantitative or
Qualitative)
0
85
85
124
Date achieved 07/31/2013 06/30/2015 06/30/2016 06/30/2016
Comments
(incl. %
achievement)
At MTR, the number of projects was defined as the number of buildings
to avoid confusion. The Project achieved 146% of the target value as
several subprojects included multiple buildings, and the Project exceeded
its original investment target.
Indicator 3 : Regulations, legislative amendments, guidelines to further promote energy
efficiency (yes/no)
Value
(quantitative or
Qualitative)
No
Yes
Yes
Yes
Date achieved 07/31/2013 06/30/2015 06/30/2016 06/30/2016
Comments
(incl. %
achievement)
The R2E2 Fund completed analysis of the first National Energy
Efficiency Action Plan (NEEAP), and the Ministry of Energy
Infrastructures and Natural Resources (MEINR), based on this analysis,
has prepared the draft Protocol Decision "On approving the second phase
of the Republic of Armenia 2016-2018 Energy Efficiency Action Plan"
and submitted to the RA Government for consideration.
G. Ratings of Project Performance in ISRs
No. Date ISR
Archived GEO IP
Actual
Disbursements
(USD millions)
1 08/10/2012 Satisfactory Satisfactory 0.00
2 01/26/2013 Moderately Satisfactory Moderately Satisfactory 0.15
3 09/04/2013 Moderately Satisfactory Moderately Satisfactory 0.36
4 04/04/2014 Satisfactory Satisfactory 0.62
5 11/02/2014 Moderately Satisfactory Moderately Satisfactory 1.08
6 04/08/2015 Satisfactory Satisfactory 1.14
7 10/27/2015 Satisfactory Satisfactory 1.48
8 06/09/2016 Highly Satisfactory Highly Satisfactory 1.72

H. Restructuring (if any)
Restructuring
Date(s)
Board
Approved
GEO Change
ISR Ratings at
Restructuring
Amount
Disbursed at
Restructuring
in USD
millions
Reason for Restructuring &
Key Changes Made GEO IP
03/16/2015 N MS MS 1.14
Project restructuring to
extend the Project closing
date by one year, and revise
investment IR end target
based on progress at MTR.
I. Disbursement Profile


1
1. Project Context, Global Environment Objectives and Design
1.1 Context at Appraisal
Country Background: At the time of appraisal, utilities (energy, water and gas supply)
accounted for around 3.5 percent of the country’s GDP and the energy sector contributed
the largest share of about 3 percent. Energy and infrastructure reforms had contributed
significantly to Armenia’s success through the 2000s, directly via investments, and
indirectly through increased reliability of energy supply and elimination of large quasi-
fiscal deficit. The energy sector was essential for the sustainable economic development
of the country and investments in the energy sector underpinned growth prospects.
Sectoral and Institutional Context: Despite successes in the sector evidenced by strong
payment discipline, absence of explicit or implicit subsidies, and a competent regulatory
agency, the energy sector faced a number of challenges: (a) emerging power supply gap;
(b) threatened energy security; and (c) increasingly unaffordable energy tariffs.
(a) Emerging power supply gap: A shortage of 800-1100 MW to meet peak demand
was expected to emerge after the planned shut-down of the nuclear power plant
and phasing out of inefficient and old (>40 years) thermal power plants.
(b) Threatened energy security: Armenia was dependent on imports for all of its
transport fuel, all gas used for heating and cooking, and gas and nuclear fuel
used to generate over two-third of the country’s electricity. More than 90
percent of the country’s energy was imported. This heavy reliance on imported
fuels, and the under-maintained transmission and distribution assets put
Armenia at risk of supply interruptions, price fluctuations, and possible outages.
(c) Unaffordable energy tariffs: Rising fuel prices and the need for new, more
expensive generating units made the energy tariffs less affordable for the poor.
In 2009, the poor Armenian households spent roughly 8 percent of their total
household budgets on electricity and gas.
The Energy Sector Strategy and the Sustainable Development Program of the RA
Government recognized these challenges, and the RA Government prioritized realization
of economically viable energy efficiency (EE) potential as one of the ways of solving the
challenges. A 2008 World Bank Study had also found that Armenia could save 4.3 percent
of its 2009 GDP through EE investments, and EE investments in public facilities had the
highest returns with paybacks between two and ten years. Thus, the RA Government
requested the Bank to support the improvement of EE in public facilities, in partnership
with the Renewable Resources and Energy Efficiency Fund (R2E2 Fund). The R2E2 Fund
was established by the RA Government in 2005 as a non-profit organization with a mandate
to promote the development of renewable energy (RE) and EE markets in Armenia, and to
facilitate investments in these sectors. The R2E2 Fund is governed by a Board of Trustees
(BOT) which is chaired by the Minister of Energy Infrastructures and Natural Resources,
and has Ministry of Finance (MoF), Ministry of Nature Protection, Ministry of Urban
Development, Ministry of Territorial Administration and Development, and the Central
Bank of Armenia represented. The R2E2 Fund administers a number of RA Government
and donor-funded programs in the area of RE and EE.

2
Rational for Bank assistance: The rational for Bank’s assistance was rooted in the
Bank’s: (i) knowledge and experience with EE projects globally, (ii) long history of
successful engagement in the energy sector in Armenia, and (iii) important role in
reforming the sector in Armenia. In addition, the Bank had significant experience
implementing GEF-supported projects. Specifically, the Bank implemented the
International Development Association (IDA) financed Urban Heating and IDA-GEF
Renewable Energy Projects, and was implementing the GeoFund 2 - Geothermal Project
supported by the GEF as well. The Bank’s comparative advantage also lay in its strong
operational capacity, which was built on fiduciary standards, environmental and social
safeguards, and portfolio quality assurance and monitoring system.
GEF involvement in the Project was critical to help remove some of the barriers to realizing
economically and financially viable EE potential. Without GEF participation, the RA
Government and the private sector would not have been able to make sustainable
investments in EE that would bring benefits to public facilities and the country at large.
The barriers included limited incentives to implement EE projects, restrictive public
budgetary and procurement rules, and limited borrowing capacity of public sector
organizations. Also, without the GEF involvement, there would be lack of resources to
build knowledge about EE among various stakeholders, including policy-makers, financial
institutions, public, residential and private sector energy consumers and other stakeholders.
The Project was also consistent with the GEF Climate Change Focal Area, in particular
with GEF Operational Program 5 – Energy Efficiency, and strategic programs under GEF-
4: SP1 “Promoting EE Technologies and Practices in Appliances and Buildings.” The GEF
incremental financing would not only create national benefits, but also global
environmental benefits in the form of reduced GHG emissions.
Preparation of the Energy Efficiency Project was originally initiated in April 2009 under
the Electricity Supply Reliability and Energy Efficiency (ESREE) Project. Unfortunately,
in 2011, the transmission component of the ESREE Project required more financing than
originally budgeted, so the EE component was dropped. In late 2011, the RA Government
and the Bank decided to resurrect the EE Component as a stand-alone GEF Project, with
cofinancing from reflows from earlier Bank investment projects with the R2E2 Fund.
Higher Level Objectives to which the Project Contributes: The Project addressed the
high level objectives of reducing energy consumption and increasing the country’s energy
security, outlined in the Energy Sector Strategy of Armenia. The Project was also in line
with the Sustainable Development Program of the RA Government, which prioritized
increasing EE in all sectors of the economy. Lastly, the Project was consistent with the FY
2009-2013 Country Partnership Strategy (CPS) for Armenia as it centered on the second
pillar of the CPS to “Support economic competitiveness and growth through improvement
of energy efficiency.”
1.2 Original Global Environment Objectives (GEO) and Key Indicators

3
The project development objective (PDO) was to reduce energy consumption of social
and other public facilities. The global environmental objective (GEO) was to decrease
greenhouse gas emissions through the removal of barriers to the implementation of EE
investments in the public sector.
The key indicators linked to the PDO/GEO were:
Energy savings (in kWh) in the retrofitted social and other public facilities; and
CO2 emission reductions (in tCO2) in retrofitted social and other public facilities
through EE investments.
1.3 Revised GEO (as approved by original approving authority) and Key Indicators,
and reasons/justification
The PDO/GEO were not revised.
Because the Project’s Closing Date was extended by one year, the PDO and IR indicators
were revised accordingly. The “cumulative investments in social and other public facilities”
indicator target was revised at the Mid-Term Review from US$8.7 million to US$6.0
million based on the slow implementation progress and projected investments for the
remaining Project period. However, this change did not impact the PDO indicators for
energy savings and emission reductions since the energy savings per dollar invested were
higher than the estimated at value at Appraisal.
1.4 Main Beneficiaries
The direct beneficiaries of the Project were students, patients in hospitals, employees in
administrative buildings, and prison staff and occupants. These groups particularly
benefited from improved comfort, lighting and general conditions of their facilities. They
also benefited from financial (budgetary) savings.
A beneficiary survey was conducted towards the end of the Project. 69 percent of the
beneficiaries surveyed, representing 4,317 staff and users of public facilities, were women,
and 31 percent were men. Except for branch offices of “High Voltage Electric Networks”
(HVEN), there were more women beneficiaries in the institutions that participated in the
Project. This aspect of the Project contributed to the Bank’s gender inclusion goals.
The RA Government benefitted from reduced energy demand, and the successful piloting
and demonstration of a new mechanism for capturing the energy cost savings, thus creating
a sustainable EE financing mechanism in Armenia. This was achieved using a new scheme
called energy service agreements (ESAs) and net present value-based (NPV) procurement
in the public sector (see descriptions of both in next section). The Project resulted in lower
energy demand, reduced the volume of imports, and delayed the need for new investments
in power generation. The Project also reduced RA Government expenditure, both for
energy bills and rehabilitation in public facilities, as the public facilities paid for their
refurbishments from energy cost savings. Additionally the technical assistance (TA)
component helped the RA Government by supporting the EE policy framework, including

4
an assessment of the implementation progress of the first National Energy Efficiency
Action Plan or NEEAP (2010 -2013), and developing the Second NEEAP (2016-18).
The general public benefitted from the availability of better public service facilities -
schools, administrative offices and hospitals through renovated facilities, and improved
comfort and functionality. They also benefited from positive environmental impacts from
reduced energy use, and reduced CO2 emissions as originally designed.
Beneficiaries of the investments also included private construction companies and
equipment suppliers who benefitted from increased demand for their goods and services.
20 different contractors participated in the Project, and they hired 3,000-4,000 temporary
workers. The staff also benefitted from improved skills which were necessary for the
successful Project implementation. The market also benefitted from the development of a
local ESCO industry that can continue to provide EE services in all sectors going forward.
1.5 Original Components
Component 1: EE investments in public facilities (estimated cost of US$8.7 million,
including US$8.0 RA Government funding and US$0.7 million GEF grant). This
component supported EE investments in social and other public facilities, e.g. schools,
kindergartens, hospitals, administrative buildings, street lighting. Client eligibility criteria
include: (a) confirmation of public ownership of facility; (b) structural soundness of the
facility (absence of major structural damages that may jeopardize integral stability of the
building); (c) absence of plans for closure, downsizing or privatization of the facility; and
(d) comfort level of more than 50%1.
Subproject criteria involve: (i) at least 20% energy savings; (ii) simple payment period less
than 10 years; (iii) investment size should be US$50,000-500,000, and (iv) the borrowers
should be in good financial standing. The Project primarily financed insulation of walls,
basements and attics, repair/replacement of external doors and windows, window
optimization2, reflective surfacing of walls behind radiators, as well as improvements/
replacement of boilers and heating systems, replacement of mercury vapor lamps with
high-pressure sodium vapor lamps (or light emitting diodes, LEDs) and of incandescent
bulbs with compact fluorescent lamps (CFLs).The portfolio of subprojects financed is
shown in Table 1.
Table 1: Subproject portfolio
Number of subprojects Total investments (US$) Schools/universities 25 2,391,987 Hospitals/Medical centers 6 1,683,734
1 The comfort level ratio is defined as the actual energy consumption over the estimated energy
consumption required to meet all heating/lighting national norms. 2 Window optimization involves partial replacement of existing windows with walls while complying with
day-lighting requirements.

5
Penitentiary institutions 11 3,879,827 Kindergarten 2 456,126 Street lighting 9 501,932 Other (offices, theater, etc.) 10 614,790 Total 63 9,585,545
Under the project, the R2E2 Fund provided turn-key services (energy audit, procurement,
detailed design, financing, construction and monitoring) for EE upgrades in eligible
public buildings. The project was designed to develop, test and disseminate replicable
and sustainable models for EE service provision through the use of a new instrument, an
energy service agreement, or ESA (Box 1).
Box 1. Energy Service Agreements
Under the ESA, the R2E2 Fund offers a full package of services to identify, finance, procure, implement and monitor EE projects for clients. The client is only asked to pay what it is currently paying for energy, i.e., its baseline energy costs, from which the Fund uses to make the new (lower) energy payments and recover its investment cost and associated fees until the contract period ends.
The figure on the right illustrates the basic idea of a client’s cash flows under the ESA, with payments equal to their baseline energy bill. This allows them to maintain a constant cash flow while retaining their energy cost savings for the duration of the ESA. In some cases, the contract duration is fixed; in other cases, the contract is terminated after an agreed level of payment has been made, which encourages the client to save more energy.
For public clients, ESAs were not classified as debt, but rather long-term service contracts, thereby allowing financing of central RA Government entities that are typically not allowed to borrow, and municipalities that may have already reached their debt limits or otherwise have borrowing restrictions. This provides a dual advantage to the client of being relatively simple to implement with very little risk.
Under Component 1, the GEF grant was used to finance the first five ESAs GEF
financing of the first ESAs allowed the R2E2 Fund to pilot the innovative ESA and refine
their processes and documents without shouldering all the risks of failure to receive the
funds back from the clients. However, in all cases, the ESAs supported by the GEF grant
required full repayment. It was agreed that all repayments from the GEF-supported ESAs
would be converted to R2E2 Fund equity, which it would use to finance further EE
investments, thereby revolving in perpetuity.
Component 2: Technical assistance (estimated cost of US$1.96 million, including
US$1.12 million GEF grant, US$0.54 million R2E2 Fund, (the project implementing
entity) co-financing, and US$0.3 million RA Government co-financing). This component
helped remove existing barriers to realizing EE potential by supporting the enabling
environment for EE in the public sector. The component primarily financed: (a) capacity
building of the R2E2 Fund, including training and basic audit and monitoring equipment;
(b) pipeline development and capacity building of participating public agencies, to address
knowledge gaps on EE, build the demand for program financing, and improve the prospects

6
for the sustainability of energy savings generated under the project; (c) policy development
support, including efforts to support budgeting, procurement and financing of EE projects
in the public sector, as well as select policy measures and energy statistics; (d) for analysis
of progress of implementation of the Energy Efficiency Action Plan or EEAP 1 (2010-
2013) and elaboration of the second EEAP (2016-2018); (e)market development and
capacity building of various market actors, including ESCOs, banks, construction firms;
and (f) project management, including monitoring, reporting and financial audits.
1.6 Revised Components
Components were not revised.
1.7 Other Significant Changes
There were no significant changes in design and scope. However, the GEF Grant closing
date was extended by one year from June 30, 2015 to June 30, 2016 due to a slower than
expected start.
2. Key Factors Affecting Implementation and Outcomes
2.1 Project Preparation, Design and Quality at Entry
Adequacy of RA Government commitment. The RA Government was strongly
committed to the Project from the beginning. The request for the Project came from
Ministry of Finance (MoF), and the Board of Trustees (BOT, which governed the R2E2
Fund) was chaired by the Minister of Energy and Natural Resources, and had the following
ministries represented: MoF, Ministry of Nature Protection, Ministry of Urban
Development, Ministry of Territorial Administration, and the Central Bank of Armenia.
The RA Government also agreed to US$8.0million in co-financing for the Project, the
majority of EE investments financing, from reflows from previous World Bank projects
with the R2E2 Fund.
Lessons from earlier operations. The Project design incorporated lessons learned from
various Bank-financed EE projects in Armenia and elsewhere. The projects included Serbia
EE Project (2004), the Montenegro EE Project (2008), Belarus Social Sector EE Project
(2001), Croatia EE Project (2003), and the Armenia Urban Heating Project (2006). The
design also included lessons learned from the World Bank’s Energy Sector Management
Assistance Program (ESMAP) work on EE in the public sector. Specifically:
Robust pipeline development mechanisms were put in place to ensure the existence
of a strong and high quality subproject pipeline.
Effective monitoring and evaluation was designed to assess the impact of EE
improvements in targeted buildings.
TA was included in the Project design in order to help create an enabling
environment for EE, to ensure Project sustainability.
TA also supported ongoing policy dialogue in order to address emerging budgeting,
procurement, legal and other issues.

7
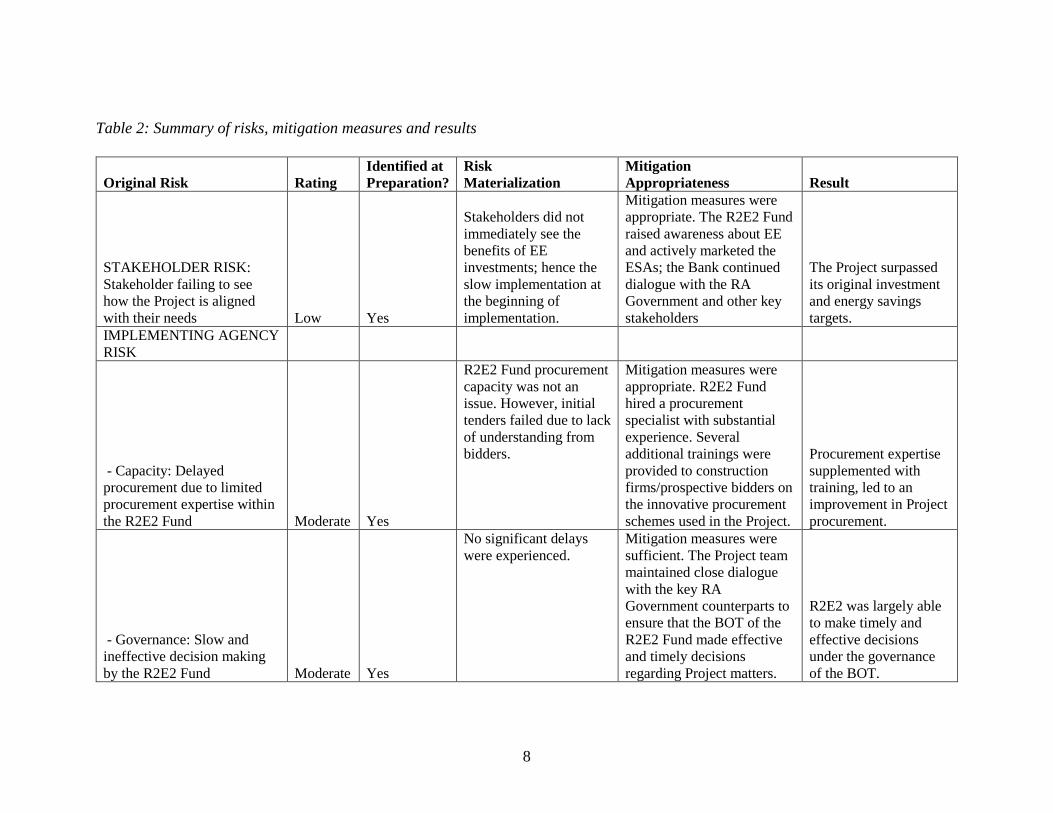
Risks and mitigation measures. Table 2 summarizes risks which were identified in the
project appraisal document, their mitigation measures and the result of the mitigation. No
other risks emerged during Project implementation.
8
Table 2: Summary of risks, mitigation measures and results
Original Risk Rating
Identified at
Preparation?
Risk
Materialization
Mitigation
Appropriateness Result
STAKEHOLDER RISK:
Stakeholder failing to see
how the Project is aligned
with their needs Low Yes
Stakeholders did not
immediately see the
benefits of EE
investments; hence the
slow implementation at
the beginning of
implementation.
Mitigation measures were
appropriate. The R2E2 Fund
raised awareness about EE
and actively marketed the
ESAs; the Bank continued
dialogue with the RA
Government and other key
stakeholders
The Project surpassed
its original investment
and energy savings
targets.
IMPLEMENTING AGENCY
RISK
- Capacity: Delayed
procurement due to limited
procurement expertise within
the R2E2 Fund Moderate Yes
R2E2 Fund procurement
capacity was not an
issue. However, initial
tenders failed due to lack
of understanding from
bidders.
Mitigation measures were
appropriate. R2E2 Fund
hired a procurement
specialist with substantial
experience. Several
additional trainings were
provided to construction
firms/prospective bidders on
the innovative procurement
schemes used in the Project.
Procurement expertise
supplemented with
training, led to an
improvement in Project
procurement.
- Governance: Slow and
ineffective decision making
by the R2E2 Fund Moderate Yes
No significant delays
were experienced.
Mitigation measures were
sufficient. The Project team
maintained close dialogue
with the key RA
Government counterparts to
ensure that the BOT of the
R2E2 Fund made effective
and timely decisions
regarding Project matters.
R2E2 was largely able
to make timely and
effective decisions
under the governance
of the BOT.

9
PROJECT RISK
- Design: Public sector
potential clients not interested
in the EE investments Moderate Yes
Potential clients were
not interested in EE
investments at the
beginning of the Project
or preferred grant/budget
support for EE rather
than ESAs. This resulted
in the slow progress
during the first 18
months of Project
implementation.
Investments for only 15
clients were initiated
during the first year of
Project implementation.
Mitigation measures were
appropriate. The R2E2 Fund
conducted public awareness
activities, intensive
marketing, publicized early
successes, highlighted
benefits and co-benefits to
potential clients, and
supported the RA
Government in creating a
more supportive policy
environment.
The Project surpassed
its original investment
and energy savings
targets.
- Social and Environmental:
Minimal environmental
impacts resulting from noise,
dust, vehicle emissions; and
from disposal of mercury
vapor lamps Low Yes
There were a few cases
of noise and dust
mentioned during the
beneficiary survey.
Mitigation measures were
appropriate. Impacts were
managed with the “Checklist
Environmental Management
Plan (EMP).”
There were no
significant social and
environmental impacts.
Replaced mercury
vapor lamps were put
to safe storage by
municipal authorities
until in-country
facilities are available
for their recycling.
- Program and donor: EE
projects financed by multiple
donors might lack
coordination Low Yes
Risk was higher than
anticipated. Some
donors had some grant
programs for EE, which
competed with the R2E2
Fund.
The Project team, and R2E2
maintained dialogue with all
donors to agree on target
markets and minimize
competition. Since most
grants were partial,
cofinancing was still
Grant financing was
limited, and dialogue
among donors worked
to segment market and
avoid competition
where possible.

10
needed, so fewer grants
disbursed than planned.
- Delivery, monitoring and
sustainability: Energy
savings in retrofitted social
and other public facilities
may not be sustained. Moderate Yes
All subprojects under
the Project were able to
sustain their energy
savings at Project
closing.
Measures were appropriate.
ESAs included one-year
O&M to ensure persistence
of savings and proper
training of O&M practices.
The Fund monitors energy
bills for the life of the ESA.
Fund monitoring
reports show sustained
savings.

11
Overall, risk assessment at Project appraisal was largely accurate and the risk mitigation
measures proved to be adequate. The flexibility in the project design allowed the R2E2
Fund and the Bank to implement the mitigation measures and, ultimately, exceed the
original performance targets.
Innovations in design. Because the RA Government did not have the opportunity to
continue with grant or budget financing for EE investments in the public sector, and there
was no appetite for private or commercial financing for such investments, the Project
introduced several innovative design features which increased the risks but were also
important for its success:
Energy service agreements (ESAs). In order to allow the public clients to finance EE
investments without taking loans, given the debt restrictions for budget entities and
municipalities, and retain their energy cost savings for the duration of the contracts, the
Bank and R2E2 Fund teams developed the ESA (see Section 1.5).
NPV-based, performance-based procurement. The ESAs did introduce additional risks
to the R2E2 Fund, in terms of subproject design and technical performance risk. To
mitigate this, the Project introduced the use of modified National Competitive Bidding
(NCB) design/works contracts with three modifications: (i) it specified the minimum
energy savings but allowed bidders to propose their best technical solutions in order to
maximize energy savings and value to the client; (ii) selection was based on the highest
NPV rather than the lowest cost; and (iii) a commissioning test was performed and
linked to the contractor payment, thus introducing a performance-based approach.
NPV-based procurement had the benefit of encouraging bidders to be innovative in
their technical solutions while maximizing the EE benefits per dollar invested as it
factored both investment cost and energy savings. This procurement approach resulted
in the introduction of new, improved technologies such as the condensing boiler used
at the State University of Economics and light emitting diodes (LEDs) at the Yerevan
State Puppet Theater.
Repayment obligations. The absence of grant funding for EE subprojects required the
Project to introduce repayment obligations based on energy savings. The use of ESAs
helped minimize negative feedback from the introduction of repayments, since clients
were only asked to pay their baseline energy bills. These repayment obligations were
critical for Project sustainability. At Project closing in June 2016, repayments to the
R2E2 Fund were being made in a timely manner, and 20 clients (40%) had made one
or more early payment. Only 10 clients had some minor payment delays (all under 15
days) due to timing of budget allocations from the central RA Government.
2.2 Implementation
While the Project identified an initial subproject pipeline during Appraisal, of about five
subprojects, delays in the finalization and signing of the ESAs along with early setbacks
on procurement (first five tenders failed, with one or fewer responsive bids) were
experienced. Since the Fund had intended to use its initial subproject successes in its
marketing efforts, and wanted to wait to disseminate them as successes until one full
heating season had passed, these delays proved costly. As a result, subproject pipeline
development remained very slow through the first 18 months. The Mid-Term Review
(MTR) was conducted in January 2014, and both ‘progress towards achievement of Global

12
Environmental Objective’, and ‘implementation progress’ (IP) were rated as Satisfactory.
However, based on progress, the Project was restructured to extend the grant Closing Date
by one year and adjust the investment target (IR1). Once the initial subprojects were
disseminated, combined with increasing awareness about EE and increased energy tariffs,
demand for EE investments grew and the R2E2 Fund was ultimately able to surpass its
PDO indicator targets and even its original investment target. The Fund’s marketing
included more focused marketing campaigns to target clients, lobbying through line
ministries, television and radio advertisements, and other media outlets, Project
implementation improved significantly. During the first two years with limited marketing,
signed ESAs totaled only US$3.54 million (34 projects) but investments almost doubled to
US$6.18 million (29 projects) in the last two years.
A key design element, the ESA, was instrumental in the Project’s success, although it had
to be adjusted to reflect implementation realities. While the initial design involved the use
of an escrow account to capture the baseline payments and then make the beneficiary’s
new energy payments and remit the rest to the Fund, the R2ER2 Fund amended the design
given the high transaction costs of using escrow accounts in Armenia. First, the Fund
proposed having the client pay its new energy bills and paying the Fund the difference
between the baseline and new bills. However, most clients found this to be complex and
wanted to have fixed payments to the Fund, so they could properly budget for them in the
subsequent budget years. So it was agreed that clients would just make fixed payments to
the Fund once the subproject was implemented and the investment costs and savings were
confirmed. While this transferred some of the risks back to the beneficiary, it was much
easier for all parties. Still, the R2E2 Fund continued to monitor energy bills and the client
could consult with the Fund in the event their energy bills and fixed repayments to the Fund
rose above the agreed levels (i.e., the original baseline energy payments). At the time of
the Project’s closing, there were no issues with repayments or complaints about the
repayment scheme.
The following factors affected Project implementation:
Strong RA Government commitment. The RA Government was strongly committed to
the Project as described in Section 2.1. Additionally, the RA Government enhanced its
EE legal framework as described in Section 2.5.
Tariff increase. The substantial increase in gas and electricity tariffs, 18.2% and 26.7%
respectively, in 2014 increased the financial viability of EE investments, and helped
improve the pipeline of EE investments.
Availability of EE grants. While there were no EE grant programs when the Project
began, some donors started offering partial grants for EE investments in the public
sector. This affected the R2ER2 Fund’s subproject pipeline in the early period.
However, the available grant funds were limited and many potential clients struggled
to mobilize the required co-financing needed for the grants; hence the competition was
limited in scope.
High rejection rates. The R2E2 Fund received 326 applications of which 209, or about
64%, were rejected due to not meeting the eligibility criteria, mostly in relation to low
baseline energy use (i.e., underheating). The high rejection rate increased the
transaction costs for the Project, as the R2E2 Fund spent a lot of time assessing

13
subprojects that were deemed ineligible. However, as this requirement became better
understood by potential clients, the rejection rate fell. During the last year of the
Project, the rejection rates dropped to about 30%.
Inadequate construction firm capacity. The Project was also negatively affected by low
capacity of the construction firms, particularly during the first year of implementation,
to deal with the new procurement approach. The R2E2 Fund had to put significant
effort into capacity building of construction firms on the more flexible but complex
NPV, performance-based procurement.
2.3 Monitoring and Evaluation (M&E) Design, Implementation and Utilization
M&E design. M&E was critical for this Project, particularly as the Project was the first of
its kind in Armenia. Investment repayments and contractor payments were dependent on
energy savings, thus the M&E systems (and measurement and verification, or M&V,
systems) had to be well-developed. The R2E2 Fund developed systems for collecting,
monitoring and reporting on Project progress and impacts; the BOT monitored Project
outcomes. In addition, the Bank developed a results framework which the R2E2 Fund used
for reporting purposes. During Project preparation and throughout implementation, the
R2E2 Fund developed its internal M&E capacity and systems and was able to track the
pipeline of subprojects; subproject screening and audits; disbursed, committed and
invested amounts; energy savings and CO2 reductions; repayment progress and
delays/defaults; etc.
The M&E design adequately allowed the team to evaluate progress towards both the PDO
and the GEO using both key and intermediate indicators (see Section 1.2). The successful
realization of energy savings through the use of sustainable financing mechanisms such as
the ESA, and sustainability of EE investments by the R2E2 Fund (see Section 2.5),
demonstrate the removal of barriers to the implementation of EE.
M&E implementation. At the subproject level, data for M&V was collected by the R2E2
Fund, the beneficiary and the contractor in order to monitor, verify and evaluate progress
towards outcome indicators. The R2E2 Fund first collected ex-ante energy consumption
and comfort data in order to develop a clear subproject baseline. This included electricity
and gas payments, indoor temperature and humidity, lighting intensity, operating
conditions and utilization of facility, outdoor temperatures, etc. Once a subproject was
completed, the R2E2 Fund, together with the beneficiary and contractor conducted a 2-
week commissioning test, where the actual energy performance was measured against the
energy savings proposed by the bidder to achieve their promised NPV. This test compared
the “normalized” baseline (adjusted to take into account full heating and lighting norms)
with the ex-post energy consumption, taking into account external temperatures and other
factors. The R2E2 Fund also monitored energy use and indoor conditions for a full heating
season to ensure that the quality of service and energy savings persisted. If any anomalies
were identified, the R2E2 Fund, together with the beneficiary and contractor, would discuss
and jointly resolve any issues. The R2E2 Fund also conducted a beneficiary survey at the
end of the Project to document social impacts and client satisfaction with the investments.

14
M&E utilization. The data was used to monitor progress towards meeting project
indicators, make payments to contractors and adjust implementation plans as necessary.
For instance, from monitoring the pipeline, the Bank and the R2E2 Fund agreed to intensify
marketing efforts.
2.4 Safeguard and Fiduciary Compliance
Safeguards. The Project triggered OP/BP 4.01 Environmental Assessment and was
classified as environmental Category B. According to the framework, an Environmental
Management Plan (EMP) was developed as part of the Project preparation, and site-specific
EMPs were drafted and shared with the Bank for approval and publicly disclosed in
Armenian and English languages for each individual investment. Stakeholders were given
sufficient time and opportunity to share their comments, if any, on the draft EMPs.
Environmental risks of the investments were minor, and the applied mitigation measures
were confined to proper handling of construction waste and adherence to workplace safety
rules. Amounts of construction waste were minimal and got disposed at the municipal
landfills. Mercury-containing street light bulbs that were replaced with energy-efficient
and non-toxic bulbs went to adequate municipal storage until relevant facilities for safe
destruction/disposal of such waste are available in the country.
The Project retained Satisfactory rating on safeguards performance throughout its life.
R2E2 Fund’s environmental performance was excellent: EMPs were produced on time and
were of high quality. All agreements/permits required for specific types of works were
obtained from the national authorities. Field supervision of works was performed on
regular basis and good record or environmental monitoring outcomes was kept. No damage
to the natural environment has been recorded.
Procurement. The Project used the innovative NPV-based procurement (see Section 2.1),
and there were no major procurement issues during implementation. Procurement was
rated Satisfactory in all the Implementation Status Reports (ISR) throughout the Project.
Post reviews were conducted during the life of the Project. The compliance risk rating was
initially moderately satisfactory due to some minor deviations. However, the last post
review conducted earlier this year, which included site visits, was rated low risk.
Unlike traditional procurement, which is based on lowest cost, the R2E2 Fund used an
output-based, performance-based contract. Under this scheme, the Fund conducted a walk-
through energy audit to identify typical EE measures and estimate energy savings. A
modified works (design and build) tender was issued (following the Bank’s NCB
procedures) with a required minimum energy savings level without requiring specific EE
measures or technologies. Bids were required to include preliminary designs to show their
proposed measures, technologies, costs and expected energy savings; all bids were required
to meet or exceed the minimum energy savings level, which was usually around 30 percent.
The Fund evaluated bids and awards the contract to the bidder with a technically viable
solution and the highest NPV (combining investment, energy cost savings and equipment
lifetimes). Payments were then made based on both milestones and performance. An
indicative payment schedule was as follows: 10% advance payment, 10% after approved
final design, 50% approved after delivery of project per design, 20% after a commissioning
test to verify the actual energy savings (against the promised savings/NPV in the contractor

15
bid), and 10% after a 12-month defects and liability period (to allow for performance
monitoring over one full heating season).
Financial management (FM). The FM arrangements under the Project (including
planning and budgeting, accounting, reporting, funds flow, staffing and external audits)
were rated as Satisfactory during first two FM missions. However, the FM rating was
subsequently downgraded from Satisfactory to Moderately Satisfactory due to the
deterioration of the contract management and transaction processing system. Although the
R2E2 Fund undertook steps to improve the internal controls, results of the last FM missions
indicated that they still needed improvement. The level and timeliness of RA Government
co-financing was satisfactory throughout the Project implementation. The R2E2 Fund
prepared semi-annual interim financial reports (IFRs), which were always received on time,
and in general were found to be acceptable. The auditors issued unmodified (clean)
opinions on annual financial statements of the Project, which were received by the due date.
The R2E2 Fund complied with public disclosure requirement for the audited financial
statements of the project.
2.5 Post-completion Operation/Next Phase
Transition and post completion. During the final supervision mission, the R2E2 Fund
was finalizing a new operations manual (OM) for the next 3-5 years. The OM covered the
2016-2020 period, in order to ensure sustainability of the business model developed under
the Project. This included identification of target markets, client eligibility criteria,
indicative investment plan, financing requirements and potential sources, revisions to its
financing and implementation modalities, fee structure, and staffing needs. It also included
necessary revisions to its ESAs, repayment schedules, and proposed revisions to existing
legislation/regulations that would enable operations beyond the expiry of the GEF Grant
Agreement. The R2E2’s own financial projections showed that the Fund could be
sustainable over this period by investing US$1.3-1.5 million per year without additional
capital infusion. For longer-term growth, additional capital into the Fund was required
since ESAs tied up the capital for a long period. If the funds were not available, the Fund
would need to limit itself to its current public building and street lighting target market.
Given that only 5% of the estimated 5,800 public buildings in Armenia had applied to
participate in the Project, there was significant potential for the R2E2 Fund to continue its
business model within its current target market. However, there was also interest by the
RA Government to expand the scope to include private social buildings, structural
improvements, seismic safety and comfort improvements, although such investments may
have to be done with grant/budget financing since these investments would not result in
any repayable cash flows. Thus the RA Government had entered into a framework
agreement with KfW to borrow €18 million for school renovation, and KfW had applied
for partial grant funding from E5P (€3-5 million) to allow beneficiaries with lower comfort
and/or structural renovations to participate in the program. Discussions with the Asian
Development Bank and European Investment Bank were also ongoing.
Sustaining reforms and institutional capacity. The RA Government made significant
progress in developing the EE regulatory framework. Key development milestones
included: passing of the Law on Energy Savings and Renewable Energy in 2004, the

16
adoption of the National Program on Energy Savings and Renewable Energy, and the
adoption of a time-bound 1st NEEAP (for 2010-2013) which prioritized EE measures for
various sectors. During the Project, the RA Government made changes to 13 provisions of
the Law on Energy Savings and Renewable Energy which further supported EE, and
developed the 2nd NEEAP. The RA Government also issued Decree No. 728N, dated 25
June 2015, which formalized the adoption of ESAs as sample agreements for EE
procurement. At the same time, it also adopted quality-based procurement (e.g. stipulating
minimum savings, maximum consumption). However, the NPV procurement approach had
not been formally adopted at Project Closing. The Fund itself had developed capacity to
operate in a sustainable manor, and the MEINR had confirmed its very strong support for
the Fund to continue the investment program. Thus there appears to be institutional
capacity to sustain the reforms.
3. Assessment of Outcomes
3.1 Relevance of Objectives, Design and Implementation
Rating: Substantial
The objectives were substantially relevant for Armenia given that the country was facing:
(a) an emerging power supply gap; (b) threatened energy security; and (c) increasingly
unaffordable energy tariffs. The Energy Sector Strategy of Armenia prioritized solving
these challenges, and the PDO, reducing energy consumption of social and other public
facilities, directly contributed towards the objective. Likewise, the GEO, decreasing
greenhouse gas emissions through the removal of barriers to the implementation of energy
efficiency investments in the public sector, contributed towards the same objective. This fit
well with the Bank’s CPS (see Section 1.1), and global priorities as other global
organizations such as European Bank of Reconstruction and Development (EBRD),
USAID, UNDP, and the International Finance Corporation (IFC) were supporting EE in
Armenia.
The design was relevant as well as it provided a delivery model for EE in public and social
facilities. Before the Project, similar investments would have required grant or budget
funding from the RA Government which was limited. Thus the Project developed a
sustainable mechanism for delivering reduction in energy costs, reducing CO2 emissions,
and improving comfort levels without additional investment from the RA Government.
Project implementation was slow at the beginning (see Section 2.2), and this necessitated
Project closing date extension, and a change in intermediate indicator 1, but did not affect
the key indicators as the investments were yielding higher savings per invested dollar than
estimated at appraisal (see Section 3.3).
3.2 Achievement of Global Environmental Objectives
Rating: High
The Project exceeded its performance targets substantially by reaching 250% of the energy
savings target, and 288% of the CO2 emission reductions target, as summarized in Table 3.
47 subprojects (or signed ESAs) were completed and commissioned, and 16 were ongoing
at Project closure. Collectively, these 63 subprojects (representing 124 buildings) were

17
estimated to result in lifetime energy savings of about 540.2 million kWh and CO2 emission
reduction of about 145.7 thousand tons (see details in Annex 2).
The original performance targets were estimated at Project appraisal based on similar
World Bank projects implemented in the Europe and Central Asia region and past building
renovations undertaken by the R2E2 Fund in Armenia. One reason behind the Project
exceeding the targets was the use of NPV-based procurement. While other projects in the
region relied on conventional procurement which use the lowest-priced bids based on an
agreed design, this Project incentivized bidders to present the best technically viable
solution and maximize the NPV. This had the effect of encouraging suppliers and
contractors to propose the most cost-effective EE investments for the lowest price. In
addition, because the focus was on repayable investments, less funding was allocated to
structural improvements than is typical for building renovation programs. Also, the
requirement for full repayment ensured cost discipline on the part of the beneficiaries and
the avoidance of unnecessary measures.
Table 3: Summary of indicators and Project performance
Indicators End Target End Actual Achievement
Energy savings in retrofitted
social and other public
facilities
(million kWh equivalent)3 215.7 540.2
250%
CO2 emission reductions in
retrofitted social and other
public facilities through EE
investments
(thousand tons CO2)4 50.5 145.7
288%
Likewise the Project exceeded both IR 1 and 2. The original target for IR 1 (investment)
had been downgraded at the MTR stage due to the slow progress at the time (see Section
1.3). However, the subproject pipeline improved after the MTR, and the R2E2 Fund shifted
focus to larger subprojects. Thus the final cumulative investments exceeded the revised
target by 70%, and the original target by 17% (see Data Sheet).
Additional Project achievements from both EE investments and the TA include:
Improved EE policy and regulatory framework. (see Section 2.5)
Development of EE market and industry. The Project helped develop the EE market
and industry in three key ways: (a) it demonstrated EE technologies such as LED
lighting, condensing boilers, heat pumps, and more cost-efficient insulation such as
perlite, which were not widely used. Likewise it introduced new services and financing
mechanisms in the market; (b) the financing and delivery methodologies pioneered by
the Project with GEF funding became the norm for implementing EE in Armenia. For
3 Cumulative energy savings over 20-year useful life of investments. 4 Cumulative CO2 reductions over 20-year useful life of investments.

18
example, the MEINR has since requested other international finance institutions (IFIs)
to use similar schemes in all RA Government-supported EE projects; and, (c) the
Project demonstrated the viability of the public sector and social facilities as a new
market for EE financing with full cost recovery. Before the Project, many services
providers were not keen to serve the public sector clients who could not borrow or
easily raise financing.
Improved EE capacity in the industry. The GEF-funded TA provided capacity
development for the RA Government, R2E2 Fund, design/construction firms and
beneficiaries involved in the Project. The NPV procurement encouraged firms to be
adept at cost-effective designs that maximize NPVs in order to develop more
competitive bids. The RA Government understood the benefits of EE and the need to
sustain its implementation. The beneficiaries gained capacity in working with service
providers to implement EE investments, and make payments from energy savings.
Feedback from the service providers also indicated that 3,000-4,000 temporary workers
were hired to implement the investments under the Project. Thus there is a sizable
trained workforce which gathered experience under the Project.
Satisfied end users. Beneficiaries were satisfied with the outcome of the EE investment.
Those who participated in the survey at the end of Project reported significant
improvements in temperature, outlook and comfort levels of the facilities. Many
beneficiaries also realized financial savings as a result of the investments. They
reported lower energy and operations and maintenance (O&M) cost, and many used
the savings to invest in internal repairs and renovations not included in the EE
investments under the Project.
3.3 Efficiency
Rating: High
The Project investments were highly cost effective. The 47 completed and commissioned
subprojects had impressive results. Specifically, the payback period for all these
subprojects was less than nine years (ranging from 2.6 to 8.8 years), and energy savings
ranged from 27 to 80%, with an average of 50.9% (Table 4). Further, due to the requirement
for full repayment and special NPV-based procurement, the investment cost required to
achieve these savings were very low—at only about US$24.4/m2 (in the buildings sector -
about one-half the investment required for Bank projects in other countries)—and at an
impressively low cost of only 1.94 US¢/kW (for all subprojects). However, due to the
relatively low grid emission factor5 and baseline heating fuel (natural gas), the cost per ton
of CO2 emissions reduction was somewhat higher than other projects (US$72.2/ton CO2)
although the cost per ton of CO2 for the GEF Grant was lower, at only US$29.8/ton CO2.
Table 4: Key Aggregate Data for Completed and Commissioned Subprojects
Amount Units
Total investment 4,354,438 US$
Number of projects 47 Number
Average investment 92,647 US$
5 The grid emissions factor for Armenia is 0.234 kgCO2/kWh.

19
Average energy savings 50.9 %
Average payback period 6.6 # of years
Average investment per square meter* 24.4 US$/m2
Energy savings* 71.2 kWh/m2
Cost of energy savings (lifetime) 0.0194 US$/kWh
Cost of CO2 savings (lifetime) 72.2 US$/ton CO2
Average building energy use (before) 138.8 kWh/m2
Average building energy use (after) 67.6 kWh/m2
*These subprojects exclude all lighting projects
Results of the economic and financial analysis of representative facilities were impressive
as well. While these were improved with the tariff increases during the Project period, they
decreased somewhat in USD terms due to the local currency devaluation by 26 percent.
The results at Project appraisal are shown in Table 5 and the ICR results are shown in Table
6. The realized EIRRs of the representative facilities ranged from 22 to 57 percent while
the realized FIRRs ranged from 10 to 38 percent. The realized economic payback periods
ranged from 2 to 5 years, and the realized financial payback periods ranged from 3 to 7
years.
The actual results were better than the estimated results. For instance, the average estimated
financial payback period was 6.2 years while the average realized financial payback period
was 5.2 years (16% better). The School N2 of Masis was used as representative facility at
Project appraisal, and after the EE investments were implemented. Its realized economic
NPV was 13 percent higher than the estimated economic NPV, and the economic payback
period was 19 percent lower (better). However, the economic and financial analysis results
of the Dilijan street lighting subproject were lower than was estimated at appraisal. This is
mostly because the subproject realized 45 percent energy savings compared to the
estimated 56 percent.
Table 5: Results of economic and financial analysis of EE investments at appraisal
Economic
NPV
(US$)
EIRR
(%)
Payback
(years)
Financial
NPV (US$)
FIRR
(%)
Payback
(years)
Hospital* 170,330 36 3.8 14,479 14 7.7
School** 68,860 37 3.7 6,992 14 7.7
Kindergarten*** 23,969 31 4.3 8,075 17 6.6
Street lighting**** 76,929 77 2.3 24,048 24 5.0
Municipality
building*****
23,666 66 2.5 12,869 32 4.2
*Martuny Hospital; **School N2 of Masis; ***Nor Norq Kindergarten; ****Dilijan street lighting*****
Vedy Municipality Building

20
Table 6: Results of economic and financial analysis of EE investments at ICR
Economic
NPV
(US$)
EIRR
(%)
Payback
(years)
Financial
NPV (US$)
FIRR
(%)
Payback
(years)
Hospital* 95,972 22 5 192,223 29 4
School** 77,667 50 3 822 10 6
Kindergarten*** 10,711 22 5 5,476 15 7
Street lighting**** 58,066 57 2 47,464 38 3
Prison***** 248,171 24 5 142,813 16 6 * Masis Medical Center CJSC; **School N2 of Masis; ***Kindergarten N3 of Vayk; **** Dilijan street
lighting***** Erebuni penitentiary institution
3.4 Justification of Overall Outcome Rating
Rating: Highly Satisfactory
The overall outcome rating of the Project is highly satisfactory. Both the GEO and the PDO
were substantially relevant, the Project exceeded its target performance by over 200% at
half the typical investment cost per square meter. The Project also introduced several
innovative aspects, was implemented well, helped improve the EE policy and regulatory
framework, provided a number of additional benefits and has a high likelihood of being
sustained.
3.5 Overarching Themes, Other Outcomes and Impacts
(a) Poverty Impacts, Gender Aspects, and Social Development Gender aspects. The Project contributed to the gender inclusion aspects of development
as 69 percent of the beneficiaries were women. The women worked in hospitals, schools,
kindergartens, administrative buildings and scientific and cultural facilities. According to
the beneficiary survey, the increased comfort levels improved their work environment and
enabled them to work more efficiently. Public lighting studies by ESMAP have shown that
better lighting improves the sense of safety and security, and allows more women to
participate in economic or social activities in the evenings. As identified in the beneficiary
survey, the same applied to the nine street lighting subprojects.
Social impacts. The social benefits of the investments in schools, hospitals, and street
lighting projects were substantial. The facilities that participated in the Project ended up
with more comfortable temperature, hot water, and better lighting. These improvements
contributed to the increased use of the facilities. Three public service facilities increased
the area they used to serve clients; one school increased the number of classrooms used
during the winter, and six communities increased the number of illuminated streets. The
educational beneficiaries reported an increase in the number of students attending the
renovated schools or kindergartens, and the hospitals reported an increase in the number of
patients. Additionally, more than half of the respondents mentioned that the EE
investments improved the image/perception of their facilities.

21
(b) Institutional Change/Strengthening
Enhancement of the R2E2 Fund. Prior to the Project, the R2E2 Fund effectively served
as a RA Government project implementation unit (PIU). However, with the introduction
of repayments, etc. the Fund has evolved into a more commercial service provider,
marketing its services, taking on repayment and performance risks, and charging fees. The
institutional development of the Fund under the Project was substantial.
Long-term industry capacity development. (see Section 3.2).
EE regulatory framework. By analyzing the implementation progress of the 1st NEEAP
(2010-2013), submitting the 2nd NEEAP by the MEINR to the RA Government for
approval, supporting changes to the provisions of the EE Law, and supporting the formal
adoption of ESA works and contracts, the Project contributed towards strengthening the
EE regulatory framework for the long term.
(c) Other Unintended Outcomes and Impacts
Additional investments. Beneficiaries tended to do more non-EE improvements after the
renovations by the R2E2 Fund. Money for these investments came from resources that they
previously used to temporarily improve comfort e.g. by using temporary insulation such as
transparent taps or thin sponges, during the winter. They also invested in buildings that
were not covered by the Project.
Access to finance. The Project facilitated access to finance provided by local banks for
clients that could legally borrow. Local banks were able to appreciate EE investments made
by clients through the Project, and the clients developed a better appreciation of the benefits
of EE investments. The history of repayments under the Project also demonstrated that
institutions can make credit repayments; hence availed financing opportunities for some.
After Project Closing, one of the local banks offered to collaborate with the R2E2 Fund to
finance municipal EE investments using its financial resources.
3.6 Summary of Findings of Beneficiary Survey and/or Stakeholder Workshops
A non-scientific beneficiary survey was conducted in April 2016, a few months before the
Closing Date. About 136 people participated in the survey of which 43 were representatives
of social facilities, 82 were staff members and recipients of services offered by the facilities,
and 11 were contractors. The respondents scored the Project highly on a variety of
categories as shown in Figure 1. The beneficiaries were particularly pleased with the
improvement in comfort levels, and in particular the improvement in temperature inside
the facilities. Financial efficiency was scored highly as well. However, tariff increases
implemented in the 2013-14 heating season reduced the financial savings slightly as the
RA Government did not adequately compensate the facilities for the increase.
The beneficiaries also gave the R2E2 Fund - which was the ‘face’ of the Project to many –
high scores. For instance, “Fund’s expertise, support and training” was scored at 4.6 out of
5, and “Supervision by the R2E2 Fund of construction works” was scored at 4.5 out of 5

22
Figure 2. Similarly, contractors gave the R2E2 Fund high scores. For instance, “Process of
raising awareness of the tender” was scored at 4.7 out of 5, and this can be attributed to the
targetted marketing implemented by the R2E2 Fund.
Figure 1: Scoring of the Project on a scale of 1 (very poor) to 5 (excellent) by beneficiary
survey respondents
Figure 2: Scoring of the R2E2 Fund on a scale of 1 (very poor) to 5 (excellent) by
beneficiary survey respondents
The majority of beneficiary employees and visitors (73%) did not report any problems with
the Project. However, 7 percent experienced disruption of normal work routines, and a few
experienced noise, relocation during construction, and switching to two-shift educational
system when classes were being renovated. These were necessary measures to facilitate the
renovation process.
4. Assessment of Risk to Development Outcome
Rating: Low
4.5
4.3
4.3
4.5
4.7
4.7
4.5
Equipment installed
Materials used
Financial efficiency
Sustainability ofResults
Improving ofComfortability
Improving of thermalConditions
Generally
4.3
4.7
4.7
4.64.5
4.6
4.5
Process of awareness-raising about the…
Process of filing ofapplication
Deadline for filing ofapplication
Technical requirementsSupervision by the Fund
of construction works
Fund's expertisesupport and training
Process of energyefficiency review (audit)

23
The energy savings and reduction in CO2 emissions are likely to last through the lifetime
of the technology; hence there is negligible risk to the achievement of the development
outcomes. At an institutional level, the R2E2 Fund is expected to be sustainable over the
next 3-5 years, even without additional capital, making investments of US$1.3-1.5 million
per year based on their new OM. These strong prospects for sustainability mitigate the risk
to additional development outcomes such as EE market developed, industry capacity built,
access to financing enhanced, and EE policies further enhanced. Additionally, the RA
Government strongly supported the implementation mechanisms developed under the
Project, particularly ESAs, and is requiring other IFIs to use the ‘pay from savings’
approach. It also adopted the use of ESAs on June 25, 2016, but has not yet adopted the
use of NPV-based procurement. Overall, the ICR team rates the risk to the development
outcomes as low.
5. Assessment of Bank and Borrower Performance
5.1 Bank
(a) Bank Performance in Ensuring Quality at Entry
Rating: Highly Satisfactory
The Bank’s performance at entry was highly satisfactory. The Bank effectively worked
with the RA Government, the R2E2 Fund, and other key stakeholders to deliver an
innovative Project, utilizing experience with similar Projects in the region. However, this
Project is distinguished from previous projects by introducing several innovative features
– including ESAs and NPV-based procurement. The Project also represented the first
energy saving performance contract using World Bank procurement guidelines, and
involved extensive discussions with the Regional Procurement Advisor. Therefore, it has
set an important precedent. The risks associated with the innovative nature of Project were
analyzed and appropriate mitigation measures put in place. Nevertheless, there was an
under-estimation of the slow start-up period, which necessitated an extension of the GEF
Grant’s Closing Date.
(b) Quality of Supervision
Rating: Satisfactory
The Bank’s performance during supervision was satisfactory. Having delivered a high
quality Project at entry, the Bank worked closely with the RA Government and the R2E2
Fund to ensure successful implementation of the Project. The Bank conducted periodic
implementation support missions and provided operational advice and technical support
when needed. When issues materialized, the Bank supported the R2E2 Fund in resolving
them.
The Project was in compliance with fiduciary and safeguard policies. The risks were
moderate and low respectively throughout Project implementation, and the Bank staff
appropriately advised the client when requested.
(c) Justification of Rating for Overall Bank Performance

24
Rating: Satisfactory
The Bank’s overall performance was satisfactory based on its performance in ensuring
quality at entry, and supervision phases of the project. The Bank’s guidance was critical in
assisting the client to overcome challenges encountered during the design and supervision
of the innovative Project which was able to exceed its PDO indicators.
5.2 Borrower
(a) RA Government Performance Rating: Satisfactory
The RA Government demonstrated strong commitment to the Project by: (i) pledging the
reflows from the investments of two closed World Bank projects as co-financing to the
GEF grant; (ii) ensuring that the R2E2 Fund had highly qualified staff; (iii) participating
in the BOT; (iv) supporting line ministries and other public facilities that participated in
the Project; and (v) strengthening the EE regulatory framework (see Section 2.2). However,
the RA Government could have adopted the NPV-based procurement scheme pioneered
under Project in its Public Procurement Law and draft 2nd NEEAP developed under the
Project.
(b) Implementing Agency or Agencies Performance Rating: Highly Satisfactory
The performance of the R2E2 Fund was highly satisfactory. Highlights of the R2E2 Fund’s
accomplishments include: (i) successful introduction and implementation of ESAs; (ii)
demonstration of NPV-based procurement in an industry accustomed to least-cost
procurement; (iii) introduction of repayment obligations among clients accustomed to
grant-based financing and ensuring full and timely repayment; (iv) establishment of
performance-based payments for contractors who were used to output-based payments; and
(v) exceeding all of the Project indicator targets. The R2E2 Fund also succeeded in
providing capacity building to contractors, helping the RA Government strengthen the EE
institutional and regulatory framework, and helping to develop the EE market in Armenia.
While Project implementation lagged during the first two years, the R2E2 Fund was able
to implement aggressive marketing campaigns and accelerate implementation progress
which enabled it to ultimately exceed the PDO and GEO indicator targets.
(c) Justification of Rating for Overall Borrower Performance Rating: Satisfactory
The overall borrower performance was satisfactory. The RA Government was committed
to the Project and enhanced its success. The R2E2 Fund was effective at collaborating with
the Bank in designing and implementing innovative mechanisms for EE implementation.
All PDO/GEO indicators and intermediate indicators were exceeded. However, the Project
Closing Date had to be extended to meet the investment target, and some of the policy and
regulatory measures proposed under the Project had not been adopted prior to the Project’s
Closing Date.
6. Lessons Learned

25
The Project introduced several innovations in EE financing and implementation in Armenia.
Given its success, there are a number of lessons that can be applied for EE projects in
Armenia and beyond.
Project design and eligibility criteria
The Project developed, tested and demonstrated the use of ESAs (see Section 1.5) and NPV-
based procurement (see Section 2.1) to introduce and help scale-up sustainable financing
for EE in the public sector. The ESA allows public institutions to finance EE without
incurring debt, retain energy cost savings for the duration of the ESA, and outsources
procurement, management and risks to a third party. NPV-based procurement encourages
innovation and new technologies to be deployed, and contributed significantly to the cost
efficiency of the Project. Other design elements that helped ensure the Project’s success
and sustainability included: (i) the demand-based approach, which assured commitment of
clients to the Project; (ii) repayments obligations which increased ownership, cost
efficiency, accountability and quality of energy management by the client; (iii) the use of
grant financing, which helped reduce the risks to the R2E2 Fund in the use of new
instruments; and (iv) the provision of policy support to help the RA Government improve
its EE policy and regulatory framework.
Eligibility criteria (e.g. 10-year payback period, structural soundness, 50% comfort level,
see Section 1.5 for details) were important aspects of the design as well. The 10-year simple
payback period for EE investments, for example, was critical to ensuring that the energy
cost savings would be sufficient for beneficiaries to fully repay the investment costs within
the duration of the ESA. When the R2E2 Fund negotiated the ESAs, they did allow some
non-EE investments requested by the beneficiary as long as the ESA could be fully repaid
from energy cost savings within the 10-year limit. Given that there are over 5,800 public
buildings in Armenia, and only 327 applied to be funded under the Project, the eligible
market remains vastly untapped. However, 64% of the applications received in the first
two years were deemed ineligible, mostly due to low baseline comfort or heating levels.
For these applications, some grant funding may be necessary. However, even 20-30% grant
or budgetary funding (with cofinancing from the Fund under an ESA) would be more
efficient use of public funding than having the RA Government cover 100% of the
investment cost as is currently the case.
RA Government/institutional commitment and strength
The RA Government/institutional commitment to the Project was critical for its success.
The RA Government set-up the R2E2 Fund, governed it through the BOT (see Section 2.1),
ensured it was properly staffed for the Project, co-financed the Project with US$9.8 million
from previous project reflows (see Annex 1), and strengthened the EE regulatory and
policy framework (see Section 2.5). The relative independence and strong management of
the R2E2 Fund, along with its willingness to try new approaches and determination to make
them succeed, cannot be over-emphasized as a critical success factor.
Marketing and pipeline development

26
Early marketing and pipeline development are always critical for such demand-driven
programs. Due to the early dropping of this Project and initial delays, the R2E2 Fund was
reluctant to market the program until the funding was in place. Also, given the innovative
financing mechanisms, many clients were reluctant to move forward until some initial
successes had been achieved. Given the very long lead time to fully complete these early
subprojects (from signing of the ESA through commissioning and one full heating season),
some of the most critical content of the marketing was substantially delayed. With limited
marketing in the first 18 months of Project implementation, signed ESAs totaled only
US$3.54 million (34 projects) but investments almost doubled to US$6.18 million (29
projects) in the last two years. One option could have been to implement 1-2 subprojects
on a pilot basis during preparation, so the Project could have begun with these experiences
and successes already gained.
Value of strong procurement and capacity building
Due to the new performance-based contractor payment scheme, and NPV-based
procurement, strong procurement capacity of the R2E2 Fund and support by the Bank team
were critical for the Project’s success (see Section 2.4 for details on Project procurement).
The first five tenders failed because there was one or fewer responsive bids. However, once
the R2E2 Fund more broadly advertised, and held workshops to explain and train potential
contractors on the new procurement methods, these issues were remedied. The capacity
buildings included technical assistance on determining NPVs, finding design company
partners, and mobilizing working capital. The capacity building was effective to the extent
that 20 different construction companies had participated and won contracts under the
Project. It will be important for the RA Government to adopt this procurement method
within its new Public Procurement Law in order to further benefit from this procurement
option. If not, this capacity building benefit may be lost.
Need for strong M&E/M&V plans and implementation
The Project developed and implemented a comprehensive M&V plan (see Section 2.3)
which was essential for the ESA and NPV-based procurement mechanisms to work
effectively. The M&V was important for the proper baseline determination, investment
repayments (under ESA), NPV assessments, and payments to contractors. The R2E2 Fund,
beneficiary and contractor all monitored subproject performance indicators (indoor
temperature, lighting intensity, energy bills, etc.), which helped minimize disputes among
the stakeholders. It also helped build credibility of the Project and transparency to all.
Sustainability
The Project demonstrated that EE financing through a revolving fund structure was
possible on a sustainable basis, even in social institutions that have budgetary constraints
and are fully budget-dependent (see Section 2.5). This had done been done before. The
Fund invested over $US9.8 million and showed full and timely beneficiary repayments
including the fees necessary for the Fund to fully cover its financing and administrative
costs. The R2E2 Fund’s overall projections showed that the Fund could be sustainable over
the next 3-5 years by investing USD 1.3-1.5 million per year without additional funding.

27
The next step now is for the Fund to implement EE at scale. To do this, there is a need to
seek additional financial resources in order to grow, and the R2E2 Fund was in discussions
with other donors at the time of ICR completion. While the methodologies pioneered
during the Project were likely be sustained, it would have been better to secure financing
before the Project closing. The period of uncertainty before securing another source of
financing may impact pipeline development and thus future revenues.

28
7. Comments on Issues Raised by Borrower/Implementing Agencies/Partners
(a) Borrower/implementing agencies Comments from the R2E2 Fund have been incorporated into the ICR.
(b) Cofinanciers Not applicable.
(c) Other partners and stakeholders (e.g. NGOs/private sector/civil society)
No issues were raised by other partners or stakeholders.

29
Annex 1. Project Costs and Financing
(a) Project Cost by Component (in USD Million equivalent)
Components
Appraisal
Estimate (USD
millions)
Actual/Latest
Estimate (USD
millions)
Percentage of
Appraisal
1. Energy efficiency
1.1. Energy efficiency investments 9.40 9.83 104.57%
1.2. Technical assistance 3.08 1.49 48.38%
Total Baseline Cost 12.48 11.32 90.71%
Physical Contingencies 0.00 0.00
Price Contingencies 0.00 0.00
Total Project Costs 12.48 11.32 90.71%
Project Preparation Facility (PPF) 0.00 0.00
Front-end fee IBRD 0.00 0.00
Total Financing Required
12.48 11.32 90.71%
(b) Financing
Source of Funds Type of
Cofinancing
Appraisal
Estimate
(USD
millions)
Actual/Late
st Estimate
(USD
millions)
Percentage
of Appraisal
Borrower 8.84 9.50 107.46%
Global Environment Facility
(GEF) 1.82 1.82 100.00%

30
Annex 2. Outputs by Component
INDICATOR Unit of Measure
Baseline
Cumulative Target Value
Y 1 target Y1
actual Y 2 Y2 actual Y 3 Y3 actual Y4
Actual by 30.06.2016
Indicator One: Energy savings in retrofitted social and other public facilities
kWh equivalent
0
13,250,672 -
66,028,350
85,802,174
215,692,640
415,688,463
215,692,640
540,240,000
Indicator Two: CO2 emission reductions in retrofitted social and other public facilities through energy efficiency investments
tCO2 0
3,095 -
15,474
19,159
50,549
103,741
50,549
145,739
INTERMEDIATE RESULTS
Intermediate Result indicator One: Cumulative investments in social and other public facilities
USD 0
1,500,000
532,513
3,500,000
2,973,680
6,000,000
7,897,044
6,000,000
10,197,863
Intermediate Result indicator Two: Regulations, legislative amendments, guidelines to further promote energy efficiency
N/A Diagnostic
study completed
-
The relevant
package is prepared
Diagnostic study
completed
The package is submitted
for enactment
Diagnostic study
completed
The package is submitted
for enactment
NEEAP, ESA exemplary agreement
Intermediate Result indicator Two: Number of public sector projects commissioned
Number 0
21 -
49
27
85
69
85
124

31
Annex 3. Economic and Financial Analysis
Ex-post economic and financial analyses of the Project were conducted on select completed
and commissioned subprojects. The economic costs and benefits of the Project were
calculated exclusive of taxes and subsidies, and the assessment of the financial costs and
benefits was done inclusive of taxes. The economic and financial analyses rely on the
following key assumptions:
Table 7: Key assumption of economic and financial appraisal
At appraisal At ICR
AMD/US$ exchange rate 380.0 477.3
Long-run marginal cost of power
supply
AMD 40/kWh AMD 45.5/kWh
Long-run marginal cost of power
supply
US$ 0.079/kWh US$ 0.095/kWh
Estimated effective electricity
tariff
AMD 30/kWh AMD 43/kWh
Estimated effective electricity
tariff
US$ 0.079/kWh US$ 0.090/kWh
Assessment period 20 years 20 years
VAT rate 20% 20%
Discount rate 10% 10% All data was obtained from team updates of Armenia Power Sector Policy Note, World Bank, 2014. The
tariffs are average effective tariffs.
Results of the economic and financial analysis of each type of public facility (a hospital,
school, kindergarten, municipality building and street lighting) at appraisal are shown in in
Table 8. The main quantifiable economic benefit from EE investments in public facilities
was the economic value of saved energy. The energy savings were valued at the estimated
long-run marginal cost of electricity supply and/ or gas supply, depending on the facility
and the heating option used before implementation of the EE measures. The main economic
costs of the Project were the capital investments. The main financial benefit of the EE
investments was the reduction of the energy bills. The energy bill savings from EE
investments were valued at the current effective electricity and gas tariffs, depending on
the type of the facility and the heating option utilized by the facility. The financial costs of
EE investments were the capital investments and incremental O&M costs.
Table 8: Results of economic and financial analysis of EE investments at appraisal
Economic
NPV
(US$)
EIRR
(%)
Payback
(years)
Financial
NPV
(US$)
FIRR
(%)
Payback
(years)
Hospital* 170,330 36 3.8 14,479 14 7.7
School** 68,860 37 3.7 6,992 14 7.7
Kindergarten*** 23,969 31 4.3 8,075 17 6.6

32
Municipality
building****
23,666 66 2.5 12,869 32 4.2
Street lighting***** 76,929 77 2.3 24,048 24 5.0 *Martuny Hospital; **School N2 of Masis; ***Nor Norq Kindergarten; ****Vedy Municipality Building;
***** Dilijan street lighting
The ex-post economic and financial analysis results are shown in Table 9. In general, the
investments were all economically and financially attractive. The EIRRs of the
representative facilities ranged from 22 to 57 percent while the FIRRs ranged from 10 to
38 percent. The economic payback periods ranged from 2 to 5 years, and the financial
payback periods ranged from 3 to 7 years. The actual results were also better than the
estimated results at appraisal. For instance, the average estimated financial payback period
was 6.2 years while the average realized financial payback period was 5.2 years (16%
better).
Though representative tariffs increased by17 percent during the Project, the local currency
was devalued by 26 percent. Therefore, the overall impact in US dollar terms was not as
significant. The School N2 of Masis was used as representative facility at appraisal, and
after the EE investments were implemented. The ex-post economic NPV is 13 percent
higher than the appraisal estimate, and the economic payback period is 19 percent better.
These findings are congruent with the finding that innovations implemented significantly
enhanced the success of the Project. However, the economic and financial analysis results
of the Dilijan street lighting subproject are lower than those estimated at appraisal. This is
mostly because the actual subproject 45 percent energy savings was lower than the
appraisal estimate of 56 percent.
Table 9: Results of economic and financial analysis of EE investments after EE investments
Economic
NPV
(US$)
EIRR
(%)
Payback
(years)
Financial
NPV (US$)
FIRR
(%)
Payback
(years)
Hospital* 95,972 22 5 192,223 29 4
School** 77,667 50 3 822 10 6
Kindergarten*** 10,711 22 5 5,476 15 7
Street lighting**** 58,066 57 2 47,464 38 3
Prison***** 248,171 24 5 142,813 16 6 * Masis Medical Center CJSC; **School N2 of Masis; ***Kindergarten N3 of Vayk; **** Dilijan street
lighting***** Erebuni penitentiary institution

33
Annex 4. Bank Lending and Implementation Support/Supervision Processes
(a) Task Team members
Names Title Unit Responsibility/
Specialty
Lending
Ani Balabanyan Operations Officer CFPTO Task team leader
Arthur Kochnakyan Energy Economist ECSS2 Energy economics
Jas Singh Sr. Energy Specialist ECSS2 Energy efficiency
Anke Meyer Consultant ECSSD Energy efficiency
Wolfhart Pohl Sr. Environmental Specialist ECSS3 Environment
Expert
Arman Vatyan Sr. Financial Management
Specialist
ECSO3 Financial
management
Garik Sergeyan Consultant ECSO3 Financial
management
Alexander Astvatsatryan Procurement Officer ECSO2 Procurement
Armine Aydinyan Procurement consultant ECSO2 Procurement
Gevorg Sargsyan Program Coordinator ETWEN Program
Coordination
Anarkan Akerova Legal Counsel LEGES Legal
Joseph Formoso Sr. Finance Officer CTRLA Finance officer
Irina Tevosyan Program Assistant ECCAR Program
Assistance
Josephine A. Kida Program Assistant ECSSD Program
Assistance
Supervision/ICR
Ani Balabanyan Sr. Energy Specialist GEE03 Task team leader
Jas Singh Sr. Energy Specialist GEE03 Task team leader
Pedzisayi Makumbe Energy Specialist GEEES Primary author
Darejan Kapanadze Senior Environmental Specialist GEN03 Environment
expert
Benedicta T. Oliveros Procurement Analyst GGO03 Procurement
Lusine Grigoryan Consultant GGO21 Financial
Management
Irina Tevosyan Program Assistant ECCAR Program
assistance
(b) Staff Time and Cost

34
Stage of Project Cycle
Staff Time and Cost (Bank Budget Only)
No. of staff weeks
USD Thousands
(including travel and
consultant costs)
Lending
2010 6.12 54,797
2011 6.91 27,742
2012 6.39 26,044
Total: 19.42 108,583
Supervision/ICR
2012 2.93 16,460
2013 1.91 45,824
2014 3.18 51,968
2015 1.44 14,383
2016 3.85 28,000
2017 0.32 39,000 (WPA Plan)
Total: 13.63 195,635

35
Annex 5. Beneficiary Survey Results
A beneficiary survey was conducted in April 2016, two months prior to the Project’s
Closing Date, using a qualitative, in-depth interview methodology. 136 interviews were
conducted: 43 with the representatives of beneficiary facilities; 82 with staff members and
visitors of the facilities (students, patients, community members, etc., depending on the
type of facility), and 11 with the representatives of the contractors. The facilities had 4317
staff members of whom 69% were women and 31% were men. 33 of the 43 facilities
predominantly conducted EE investments in buildings, and 10 in lighting retrofits.
Facility staff and their clients. 60.5% of the respondents cited the improvement in
comfort levels as the most significant benefit of the Project as shown in Figure 3. This
included improvements in indoor temperature (32.6%), and in general comfort levels (e.g.,
better illumination, safety, noise insulation etc.) (27.9%). A significant number of the
respondents also cited financial savings as a key benefit of the Project. 25 facilities realized
energy saving in both energy consumed and cost of the energy despite an increase in heated
and lit area in three of the facilities. Ten facilities realized savings of energy consumed but
not cost of the energy due to the increase in tariffs. Four of these also increased the heated
and lit areas in their facilities. In five of the communities that conducted street lighting
works, the number streets illuminated increased.
Figure 3: Responses to “Which is the most important benefit of the EE Project for your
facility (%)”
Many empolyees of facilities indicated that the improvement in comfort levels and
convinience enabled them to work more efficiently. Beneficiaries of the street lighting
investments mentioned that they were able to freely walk and drive in the evening: “…We
can go to shops without flashlights…”, and “…Formerly it was very hard to drive, there
were holes with water on the road, the road was degradated, so we did not know how and
where to go, nothing could be seen…”
Contractors. The 11 contractors (out of 20) that participated in the survey had 162
employees of whom 86% were male. Within the Project, these contractors had performed
works which included installation of doors and windows, thermo-insulation of walls and
2.3
4.7
9.3
9.3
14.0
27.9
32.6
Increase of the number of visitors
Raising the quality of servicesof the facility
Other
Increasing the area of illumination
Financial savings
Improved comfort
Improving of thermal conditions
Percentage (%)
Be
ne
fits
of
the
Pro
ject
(%
)

36
roofs, modernization of lighting, installation of EE equipment, etc. One contractor had
implemented a lighting modernization subproject.
80% of the contractors scored the capacity building provided under the Project as
“excellent” or “good”, and the overall rating for the support provided by the R2E2 Fund
was given a high score as shown Figure 4. One contractor mentioned the following: “…We
have obtained knowledge of ESAs, which [we] currently apply for ourselves…” The
contractors also gave the M&V processes a high score. However, the average score of the
performance-based payment model was a 4.2, which is lower compared to other aspects of
the Project. The contractors were concerned that the model did not allow them to receive
advance payments to cover expenses for materials and equipment. The model also delayed
the last 10% payment until a year after completion. Nonetheless, one contractor
mentioned: “…We have become more responsible, we think of not only assuring quality
results, but also of assuring savings…”
Figure 4: Scoring of collaboration with the Fund by the contractors
(average rating, 1 – very poor, 5 - excellent)
4.94.4
4.3
4.8
4.2
4.7
5.0
5.0
Format of collaboration
Merging construction, designand one year of operation in one
contract
Opportunity to propose EEactivities
Deadlines for implementation
Payment Model
Expertise support and training byR2E2 Fund
Process of monitoring inmetering and certification phase
Process of monitoring inoperation and maintenance
phase

37
Annex 6. Stakeholder Workshop Report and Results
No stakeholder workshop was undertaken.

38
Annex 7. Summary of Borrower's ICR and/or Comments on Draft ICR
Summary of Borrower’s ICR
The Armenia Energy Efficiency Project was a joint WB-Armenia initiative with objective
to reduce energy consumption of social and other public facilities thus contributing to
strategic objectives of reducing energy consumption and increasing Armenia’s energy
security, outlined in the Energy Sector Strategy of Armenia.
The Project was implemented successfully and fully achieved its development objective as
evidenced by the over-achievement of all outcome indicators and intermediate result
indicators. At the end of the Project the actual indicators exceeded targets by 114 to 272
percent. This is significant success for such kind of project and it should be noted that the
initial budget of the project was not changed.
The Project progress was rather slow during the first 1.5 years of operations due to
innovative approaches in procurement and financing, particularly output based payments
to contractors and obligatory repayments by beneficiaries. The R2E2 Fund, the Bank and
the Borrower took necessary measures to settle the situation and ensure achievement of
planned results and indicators. First of all, given the demand-based nature of the project,
R2E2 implemented wide-scale awareness raising campaign to foster understanding of the
benefits of the project, thus increasing number of applications. Secondly, the Fund
conducted a number of trainings and pre-bid conferences for potential bidders/contractors
to increase competitiveness. These actions, as well as the successful completion of first
subprojects led to further increase of interest among potential beneficiaries and contractors.
The closing date of the Project was also extended by an additional year to allow Project
Implementing Entity fully utilize Project resources.
R2E2 conducted a beneficiary survey among clients and contractors of the Project to gauge
their opinion on Project results and operation, as well as to understand whether the Project
met their expectations. The results of the survey showed that the expectations of project
clients were fully met. Moreover, contractors feel comfortable working with R2E2 Fund
during all stages of project implementation. A number of side benefits were reported, such
as increase of number of pupils in renovated schools, increase of number of patients in
renovated hospitals, etc. In addition, the Project contributed to development of construction
companies and now a number of construction companies have necessary capacities to
provide ESCO services.
Plan for Sustainability of Fund Operations The EE Project implementation process, as well as final results proves that applied
procurement scheme and payment arrangements are workable, effective and result oriented.
Within the framework of the EE project, the R2E2 Fund procured a consultancy for
elaboration of a new Operations Manual, as well as Fund Development Strategy for the
upcoming 10 years and Project Concepts. The Strategy is accompanied with the Activity
Plan.

39
The Strategy includes Project Concepts for financing of EE reconstruction in public
buildings directly by the Fund, as well as via financial institutions using Revolving Funds
or other financial sources. Implementation of those project concepts will ensure
sustainability of Funds operations. There are about 5,800 public buildings in Armenia and
only about 326 have applied at the end of the EE Project, so significant market potential
remains. The Fund has finalized a new Operations Manual which will allow it to continue
signing ESAs in the years ahead. In terms of the Fund’s overall finances, projections show
the Fund can be sustainable over the next 3-5 years by investing USD 1.3-1.5 million per
year. At the same time the Fund should seek possibilities for increasing financing via
addition financial resources. To ensure sustainability of Fund operations and to create
possibilities for continuation of EE project the Fund should concentrate its activities on the
following:
1. The Fund should implement active steps for involvement of new financial
resources from foreign financing institutions as continuation of EE Project
operations in the upcoming 2-3 years,
2. The Fund should advocate and lobby adoption of ESA exemplary contract by
the RA Government to use this contract for EE reconstruction works,
3. The Fund should advocate and lobby inclusion of ESCO procurement that could
be done without competitive public procurement if the ESCO works under
public offer (including financing opportunities). This will increase competition
among ESCOs and will contribute to setting lower prices for EE reconstruction
works,
4. The Fund should actively work with financial institutions to continue EE project
via financial institutions. Currently, the Fund negotiates with ACBA Agricole
Bank Armenia to initiate project aimed at financing of EE reconstructions in
public buildings,
5. The Fund should actively work on development of its services to public and
private clients. The most feasible services are already identified in the Fund
Strategy; the Project Concept is developed. The Fund should actively work on
development of its Client database, Client coverage and marketing of its
services.
Lessons Learned
1. The innovated procurement scheme introduced by the Project ensured selection of
most effective proposal which ensured the highest level of energy savings.
2. Nevertheless, capacities of construction companies to work within the framework
of new procurement scheme was inadequate and capacity building/training
activities were necessary for construction companies to ensure effective
procurement process.
3. Procurement based on highest NPV encouraged deployment of innovation and new
technologies; introduction of performance based payments contributed to highest
quality of works and accountability of contractors.

40
4. The demand-based approach introduced by the Project ensured the highest
commitment level of Clients. Repayments increased ownership, accountability and
quality of energy management of Clients.
5. Strong and targeted marketing campaigns and availability of exemplary EE sub-
project are will contribute to high level of interest on EE works and increased trust
of potential clients, which in its turn will result in high demand of EE works.
6. Strong, dedicated institution (R2E2 Fund) which has a clear mandate, well trained
and motivated staff with adequate compensation, and a strong marketing plan was
critical for Project success and achievement of planned results and targets.
7. From one hand the demand is already rather high, but from the other hand large
number public buildings does not comply with selection requirements. Introduction
of grant/subsidy mechanisms will be necessary for inclusion of those building in
the Project in future, since the savings in such buildings will not cover repayment
amounts.
8. Close cooperation between the Borrower, the Bank and Implementing Entity is
necessary for smooth and successful implementation of similar Projects.
Recommendations
1. The R2E2 should continue using new procurement scheme in its future operations.
This system should be applied for donor funded and state funded project to ensure
the highest level of effectiveness and good results.
2. The R2E2 should continue capacity building of construction companies to ensure
that more construction companies capable to participate in similar tenders.
Moreover, this will contribute to competition also.
3. R2E2 should continue advocating energy efficiency works and continue awareness
raising targeted campaigns.
4. The results of the Project should be taken into account during programming of
similar projects, especially for defining results, indicators and objectives. The
experience showed that the targets, indicators and results could be more ambitious.
5. Experience of EE project could be duplicated in other countries, including project
design and innovative procurement and repayment schemes.
6. The Fund and the Borrower should seek possibilities to implement sub-project in
public buildings which do not meet selection criteria set by the Project.
7. The Fund should actively work on attraction of new and cheap financial resources
for continuation of EE project. This should be done during the upcoming 2-3 years
to ensure financial sustainability of the Fund also.

41
Comments from the RA Government

42

43

44

45

46

47
Annex 8. Comments of Cofinanciers and Other Partners/Stakeholders
Not applicable.

48
Annex 9. List of Supporting Documents
Project Appraisal Document
Project Legal Agreements
Aide Memoires dated:
o May 2, 2016
o October 23, 2015
o February 04, 2015
o October 4, 2014
o August 12, 2014
o March 10, 2014
o February 20, 2014
o August 13, 2013
o July 15, 2013
o December 20, 2012
o July 05, 2012
o November 25, 2009
Implementation Status Reports dated:
o June 9, 2016
o October 27, 2015
o April 8, 2015
o November 2, 2015
o April 4, 2014
o March 23, 2014
o September 4, 2013
o January 26, 2013
o August 10, 2012
Borrower Implementation Completion Report; October 24, 2016
Survey of Opinion of Beneficiaries of Energy Efficiency Project; June 16, 2016
R2E2 Post-Project Completion Operations Manual; June 30, 2016
Armenia - Power sector policy note, December 1, 2014
Subprojects technical data sheets
Procurement plan; May 2, 2016
M&V summary report
Monthly Status Reports from August 2014 to June 30, 2016

35
Map of Armenia