Embed Size (px)
Citation preview

Do IMF Programs Improve Economic Governance?
Jiro Honda
WP/08/114


© 2008 International Monetary Fund WP/08/114 IMF Working Paper African Department
Do IMF Programs Improve Economic Governance?
Prepared by Jiro Honda1
Authorized for distribution by Dhaneshwar Ghura
May 2008
Abstract
This Working Paper should not be reported as representing the views of the IMF.
The views expressed in this Working Paper are those of the author and do not necessarily represent those of the IMF or IMF policy. Working Papers describe research in progress by the authors and are published to elicit comments and to further debate.
This paper examines the effects of IMF financial assistance on economic governance in developing countries, based on panel data analyses of perceived governance indicators. It uses a two-stage approach to address possible endogeneity issues. The results show that successful implementation of IMF programs is associated with improvements in the quality of economic governance. Specifically, the paper finds statistically robust results that IMF concessional programs through the Poverty Reduction and Growth Facility tend to enhance the rule of law and strengthen control of corruption. Through this exercise, however, no statistically significant effect is observed for assistances under the General Resource Account. JEL Classification Numbers: Keywords: Economic governance, IMF program Author’s E-Mail Address: [email protected]
1 I thank my colleagues Dhaneshwar Ghura, Aart Kraay, Anton A. F. Op de Beke, Bernardin Akitoby, Hans Weisfeld, Kenji Moriyama, Louis D. Dicks-Mireaux, Mohammed A. Tareen, Markus Haacker, Rodney Ramcharan, and Saji Thomas for helpful comments, and am also grateful for editorial support by Anne Grant.

2
Table of Contents
I. Background............................................................................................................................ 3
II. The IMF’s Approach to Economic Governance .................................................................. 5 A. The Approach.................................................................................................... 5 B. Literature Review.............................................................................................. 7
III. Stylized Facts About Economic Governance in Developing Countries ............................. 8
IV. Empirical Framework ....................................................................................................... 10 A. Model .............................................................................................................. 10 B. Data ................................................................................................................. 12 C. Results ............................................................................................................. 15
V. Concluding Remarks .......................................................................................................... 20

3
I. BACKGROUND
Recently, the importance of governance for economic development has been attracting more attention. The Africa Commission stated in its joint report in May 2005 that “Unless there are improvements in capacity, accountability, and reducing corruption, other reforms will have a limited impact.”2 The issue has also been discussed in terms of foreign aid effectiveness. In discussing a debt relief initiative by multilateral institutions, the London G8 Meeting in June 2005 also emphasized the importance of economic governance.3
A number of studies have revealed the centrality of governance to economic development. Particularly with recent progress in collecting data on governance, many empirical works have explored how governance affects economic outcomes.4 Many argue that better governance leads to positive outcomes, such as faster growth (Mauro, 1995; Kaufmann, Kraay, and Zoido-Lobaton, 1999) and higher productivity (Hall and Jones, 1999). Lambsdorff (2003) finds that government stability, bureaucratic quality, and civil liberties have a significant impact on productivity in terms of the ratio of GDP to capital stock. Mauro (1995), Gymiah-Brempong (2002), and Brunetti and Weder (1998) report that corruption deters investment.5, 6
These findings help explain why many multilateral institutions have been increasingly concerned with governance.7 At the IMF, enhanced attention to it was first declared by the IMF Interim Committee in 1996 and by Managing Director Camdessus in a 1997 speech.8,
2 The full report is available at http://www.commissionforafrica.org/english/report/introduction.html. 3 The G8 Communiqué said that “good governance, accountability, and transparency are crucial to releasing the benefits of the debt cancellation” (available at http://www.g8.utoronto.ca/finance/fm050611_dev.htm). 4 See Abed and Davoodi (2002), Brunetti and Weder (1998), Ciocchini, Durbin, and Ng (2003), Gymiah-Brempong (2002), Knack and Keefer (1995), Lambsdorff (2003), Mauro (1997), Mo (2001), and Poirson (1998). The results of these studies are summarized in Gupta, Powell, and Yang (2006). 5 Similarly, Lambsdorff (2003) and Wei (2000) show that corruption discourages both capital inflows and foreign direct investment. Furthermore, Ciocchini, Drubin, and Ng (2003) show that when more corrupt countries issue bonds, they pay a higher risk premium. 6 Weak governance associated with high corruption could also affect fiscal performance by opening up loopholes in tax collection and encouraging abuse of public funds. Ghura (1998), based on an analysis of 39 African countries, finds that an increase in corruption lowers the tax revenue-to-GDP ratio. Johnson, Kaufman, and Zoido-Lobaton (1998) argue that tax evasion offers a competitive advantage for companies in the unofficial economy but disadvantages companies in the official economy; it even drives some of the latter out of the market, further reducing the tax base. 7 Strategies to address governance issues are well-described on their web-sites, e.g., UNDP (http://www.undp.org/governance/) and the World Bank (http://www1.worldbank.org/publicsector/index.cfm). 8 At the High-Level Meeting of the UN Economic and Social Council, he stated that “Good governance is important for countries at all stages of development. . . . Our approach is to concentrate on those aspects of good governance that are most closely related to our surveillance over macroeconomic policies—namely, the transparency of government accounts, the effectiveness of public resource management, and the stability and transparency of the economic and regulatory environment for private sector activity.” This speech was made in July 1997 (http://www.imf.org/external/np/speeches/1997/MDS9710.HTM).

4
9 Since then, the IMF has been dealing intensively with economic governance problems in member countries, often incorporating governance-related measures as conditionalities of an IMF program. The IMF also actively promotes good governance through its bilateral surveillance, policy advice, technical assistance, and data dissemination standards and codes (especially the Reports on the Observance of Standards and Codes). These efforts often help facilitate specific reforms, build the capacity of government officials, and enhance the transparency of economic management—all of which are expected to strengthen economic governance in recipient countries.
It is not clear, however, whether these efforts have helped improve the quality of economic governance. After a decade of experience in dealing with this issue, and with recent progress in collecting data on governance, it is now time to take stock of what the assistance has accomplished. The relevant questions are:
• Do IMF efforts indeed contribute to good governance? and
• Which aspects of governance benefit most?
This paper, based on panel data analyses, attempts to answer these questions in terms of how IMF financial assistance relates to the perceived quality of economic governance, using the Worldwide Governance Research Indicators (WGI) (Box).10
To anticipate the findings: the analysis shows that some elements of economic governance are perceived to improve shortly after IMF financial assistance is provided. Specifically the Poverty Reduction and Growth Facility (PRGF) has a positive influence on rule of law and control of corruption. However, no statistically significant effect is found for nonconcessional lending from the General Resource Account (GRA).
In what follows, the IMF approach to economic governance is summarized, and some stylized facts about economic governance in developing countries are laid out. In section IV, the empirical framework and the main results are described. Section V draws conclusions.
9 For details, see http://www.imf.org/external/np/gov/guide/eng/index.htm. 10 The 2006 Global Monitoring Report briefly summarizes the relative merits and interpretation of available governance indicators, including the WGI http://www.imf.org/external/pubs/cat/longres.cfm?sk=19155.0.

5
Box. Worldwide Governance Research Indicators
Kaufmann, Kraay, and Mastruzzi (2007) present new estimates of six dimensions of governance covering 209 countries for 1996–2006. The indicators are based on several hundred variables that measure perceptions of governance, drawn from 37 separate data sources constructed by 31 different organizations. They are measured in units ranging from –2.5 to 2.5, with higher values corresponding to better governance.
The six dimensions of governance:
• Voice and Accountability measures political, civil, and human rights. It incorporates indicators measuring aspects of the political process, civil liberties, and political and human rights.
• Political Stability and Absence of Violence measures the likelihood of violent threats to, or a change in, government, including domestic violence and terrorism.
• Government Effectiveness measures the competence of the bureaucracy, the quality of public service, the independence of civil servants from political pressures, and the credibility of the government’s commitment to such policies.
• Regulatory Quality measures the incidence of market-unfriendly policies. It focuses more on policies themselves, measuring, e.g., the incidence of price controls or inadequate bank supervision, but it also looks at perceptions of the burdens imposed by excessive regulation in such areas as foreign trade and business development.
• Rule of Law measures the extent to which agents have confidence in and abide by the rules of society, including perceptions of the incidence of crime, the effectiveness and predictability of the judiciary, and contract enforcement.
• Control of Corruption measures the extent of corruption, conventionally defined as the exercise of public power for private gain. It is based on scores of variables drawn from surveys and polls of experts.
Source: World Bank (http://info.worldbank.org/governance/kkz2004/q&a.htm#4)
II. THE IMF’S APPROACH TO ECONOMIC GOVERNANCE
A. The Approach
The IMF promotes better economic governance in its member countries by encouraging borrowing countries to implement structural reforms (as a part of program conditionality)

6
when it gives financial assistance and providing policy advice and technical assistance in economic governance-related areas.11 Unlike the World Bank, which engages directly with governance issues in its projects, IMF involvement is more limited; the IMF looks into governance issues in a member country only when they have a significant current or potential impact on the country’s macroeconomy. Furthermore, it lends only to countries experiencing balance-of-payments problems, and it supports policies designed to restore the conditions for sustainable economic growth.12 Policies considered critical to the success of the program, some of them related to economic governance, can be formal conditions for disbursement of IMF loans. IMF policy advice to member countries often covers economic governance issues, as does technical assistance.
The IMF contributes to good governance in two spheres:13, 14
• improving the management of public resources through reforms of public institutions (e.g., the treasury, central bank, state-owned enterprises, civil service, and the official statistics function), including administrative procedures (e.g., expenditure control, budget management, and revenue collection); and
• supporting the development and maintenance of a transparent and stable economic and regulatory environment conducive to efficient private sector activities (e.g., price systems, exchange and trade regimes, and banking systems).
In recent years many countries with IMF-supported programs have successfully reformed economic governance in areas like financial discipline in state-owned enterprises; revenue administration; expenditure management; and occasionally anticorruption measures and auditing of the government.15
The effectiveness of IMF program conditionality and policy advice does not necessarily depend on the size of the loan, particularly for some arrangements from the Poverty Reduction and Growth Facility (PRGF). For a number of low-income countries, the IMF provides low-access PRGF arrangements dealing in relatively small amounts.16 These 11 According to the IMF (http://www.imf.org/external/np/exr/facts/gov.htm), when seeking financial support from the IMF, country authorities describe their economic policies in a letter of intent. Governance and/or corruption are mentioned explicitly in over two thirds of the letters of intent published since 2002.
12 The 1997 Guidance Note describes the role of the IMF in strengthening governance and also indicates the limits of this role. The most important limit is that the IMF should get involved in governance issues only when they have a significant current or potential impact on macroeconomic performance. For details, see http://www.imf.org/external/np/gov/2001/eng/gov.pdf 13 See http://www.imf.org/external/pubs/ft/exrp/govern/govern.pdf. 14 Based on the IMF's Approach to Promoting Good Governance and Combating Corruption—A Guide (http://www.imf.org/external/np/gov/guide/eng/index.htm#P17_850). 15 According to the IMF staff reports of countries with IMF programs. 16 For more details, see “Operational Guidance Note on Access Under the PRGF (2004)” (http://www.imf.org/external/np/prgf/2004/110904.htm).

7
countries may have limited financing needs, but engagement with the IMF through its lending arrangements is deemed desirable to provide guidance for policy implementation, address potential vulnerabilities, or send signals to donors and creditors about macroeconomic stabilization and structural policies within the IMF's areas of expertise. This fact has implications for formulating an empirical model because some earlier studies on IMF contributions to economic governance employed the size of IMF loans (in terms of GDP) as a dependent variable, even though it appears to have little relevance to the effectiveness of the program conditionality.
B. Literature Review
Several analyses look at the effects of conditioning aid on policy and governance reforms. Knack (2001) argues, based on cross-country analysis, that higher aid levels erode the quality of governance as measured by bureaucratic quality, corruption, and the rule of law. Stiglitz (1999) and Kapur and Webb (2000) raise similar doubts about whether donors enhance the quality of governance by imposing conditions on aid.
Previous empirical studies are not supportive of IMF contributions to these areas, either. Boockmann and Dreher (2003) investigate whether policies of the World Bank and the IMF have contributed to economic freedom, using panel data for 85 countries for 1970–97. They not only find that World Bank projects are more likely to improve economic freedom than IMF programs, they also claim that there is no clear relationship between IMF programs and an economic freedom index. They therefore endorse recent demands that the IMF scale back its mandate, restrict its activities to its areas of expertise, and let the World Bank deal with development goals (Meltzer Commission Report, 2000).
Barro and Lee (2005), using panel data of 135 countries, find that loans from the IMF have a significantly negative effect on the rule of law. Referring to the results of similar exercises on aid and its negative implication for control of corruption (Svensson, 2000; Alesina and Weder 1999), they argue that IMF lending and foreign aid foster rent-seeking by interest groups and government officials.
These empirical studies, however, could be refined:
1. Their focus has been limited to a few elements of economic governance (such as economic freedom, corruption, or the rule of law). With the recent accumulation of governance–related indicators, an attempt can be made to cover a wider spectrum of economic governance.
2. These studies often use the amount of IMF loans (in terms of GDP), approvals of IMF programs, or period in IMF programs as explanatory variables. Dreher and Ramada-Srasola (2006) argue for the use of program dummies to capture the

8
impact of international organizations on policy and outcome measures.17 Such dummies would better reflect the impacts of program conditionality and policy advice than the size of the program does.
3. Finally, program failures, where conditionalities were not fully met and thus desired results could not be achieved, should also be considered.
III. STYLIZED FACTS ABOUT ECONOMIC GOVERNANCE IN DEVELOPING COUNTRIES
Figure 1 shows each of the world governance indicators (WWGI) for 135 developing countries, calculated for an average of groups allocated by per capita income. All indicators of a group with lower per capita income are considerably lower than those of the other two groups. This is not surprising. Income level, as many previous studies have argued, can influence the quality of governance for a variety of reasons:18 Richer countries can afford better institutions because they may be better able to deliver services and optimally allocate resources than poorer ones (Islam and Montenegro, 2002), and also because their economies are often better managed (Chong and Zanforlin, 2000).
-1.0 -0.5 0.0 0.5 1.0
Voice and accountability
Government effectiveness
Regulatory quality
Rule of law
Control of corruption
Countries with per capita income of US$0–1,000Countries with per capita income of US$1,001–5,000Countries with per capita income of US$5,001 and up
Figure 1. Governance Indicators by Per Capita Income (2006)
Data: Worldwide Governance Research Indicators
One puzzling fact is that, despite the recent efforts by the IMF and also by other international institutions (e.g., the World Bank), the indicators for low-income countries have been generally deteriorating, compared with those for high-income countries. From 1996 to 2006, while the average of countries with relatively high income increased by 0.03 points, that of low-income countries fell by 0.09 points (Table 1). This raises questions about whether those efforts have led to any desired outcomes and whether other factors
17 For instance, Atoyan and Conway (2005) and Dreher (2004). 18For instance, Islam and Montenegro (2002), Treisman (2000), and Chong and Zanforlin (2000).

9
may be affecting economic governance in these countries.19 This issue will be examined in the analyses below.
Voice and Accountability
Government Effectiveness
Regulatory Quality Rule of Law Control of
Corruption AveragePolitical Stability
Countries with per capita income of US$0–1,000 1 -0.06 -0.15 -0.13 -0.01 -0.07 -0.09 -0.11Countries with per capita income of US$1,001–5,000 1 -0.04 0.15 -0.11 0.03 0.13 0.03 0.05Countries with per capita income of US$5,001 and up 1 0.11 -0.02 0.14 -0.07 0.00 0.03 0.06
Total (median) 0.00 0.02 -0.02 -0.04 -0.02 -0.01 -0.03Data: World Governance Research Indicators1 From WDI in PPP-based 2000 price.
Table 1. Changes in Governance Indicators by Level of Income for 1996–2006
Table 2 reports the median values of each governance indictor by region for 1996–2006. Of the 135 developing countries, the WGI for sub-Saharan Africa as a whole is the lowest, likely reflecting the low income level. Not only is sub-Saharan Africa the lowest in all indicators, it shows a decline in some governance indicators (government effectiveness, regulatory quality, and control of corruption). Bräutigam and Knack (2004) point out that poor governance in Africa may be associated with (i) weak state capacity associated with low education; (ii) political instability; (iii) economic downturn; and (iv) long-term aid dependence. They find a robust statistical relationship between high aid levels and deterioration in governance and argue that large amounts of aid over long periods of time can weaken institutions and establish perverse incentives.
19 Another possibility is that, given the nature of the WGI (whose average value across all countries is always 1), the decline in low-income countries may merely reflect improvement in the WGI in higher-income countries relative to low-income countries.

10
Sub-Sahara Africa
Asia and Pacific Europe Middle East West
HemisphereVoice and accountability 1996 -0.65 -0.17 -0.36 -1.03 0.25
2006 -0.54 -0.35 -0.06 -0.78 0.32Change 0.11 -0.18 0.29 0.25 0.07
Government effectiveness 1996 -0.63 -0.19 -0.40 0.21 -0.272006 -0.74 -0.38 -0.10 -0.28 -0.05
Change -0.11 -0.19 0.30 -0.49 0.22
Regulatory quality 1996 -0.39 -0.12 0.14 0.08 0.392006 -0.63 -0.31 0.08 -0.02 0.12
Change -0.23 -0.19 -0.06 -0.10 -0.27
Rule of law 1996 -0.69 -0.19 -0.14 0.16 -0.342006 -0.64 -0.40 -0.32 0.17 -0.50
Change 0.05 -0.21 -0.18 0.01 -0.16
Control of corruption 1996 -0.50 -0.43 -0.42 -0.15 -0.372006 -0.71 -0.54 -0.25 0.18 -0.32
Change -0.22 -0.11 0.17 0.33 0.05
Number of countries 45 19 30 11 30
Table 2. WGI by Region(Median for each region)
IV. EMPIRICAL FRAMEWORK
A. Model
Despite all the studies on governance, there has been no convenient framework to empirically examine the relationship between economic governance and its determinants. Here two factors that affect the quality of a country’s governance are considered: (i) the policies that influence governance; and (ii) factors inherent in the country (cultural, social, and historical). The policy factors are further split into policies that would be implemented even if there were no IMF assistances, and those that are introduced as a consequence of the assistances.
Basic model specification in this paper takes the form below (1). The governance indicators for the country i at time t (G it) are explained by four factors: (i) policies that would have been observed without an IMF program (x it); (ii) the existence of an IMF program (IMF it); (iii) external factors (C it); and (iv) unobserved random disturbances (ε it).
G it = β 0 + β k x it + β j IMF it + β h C i t-1 + ε it (1)
Among these factors, policies adopted without an IMF program (x it) are directly observable only for nonprogram periods. Following the generalized evaluation estimator (GEE) approach of Goldstein and Montiel (1986), a counterfactual for policies during programs is constructed. This counterfactual is based on a policy reaction function that links changes in the policy instrument to the deviation of the observed lagged value for

11
governance indicators from its desired value (Gdit). The policy reaction function is
described by
Δx it = γ (2)[G dit – G i (t-1) ] + η it
where ηit is a zero mean, fixed variance, serially uncorrelated error term assumed to be uncorrelated with εit ,and Δ is the difference operator. The parameter γ indicates the extent to which the policy instrument is adjusted in response to disequilibrium in the target variable. Substituting (2) into (1) and subsuming the desired governance quality into the vector of fixed-effect constant terms for each country (B’0) gives:
ΔG it = β' 0 - β k γ G i (t-1) + β k x it-1 + β j IMF it + β h C i t-1 + (ε it + B k η it ) (3)
Unlike macroeconomic policies, however, policies on economic governance are not easily comparable. The model therefore assumes that such policies are associated with the degree of economic development (per capita income), political stability, and other country-specific factors (such as cultural background and legal origins). The income level would reflect the level of education as well as economic infrastructure, both of which would be critical to implement policies for economic governance. Political stability is also critical to reform. Should political systems be unstable, it would be difficult to formulate medium- and long-term strategies to address governance issues consistently over time.20
The model (3) is estimated using panel data drawn from countries and periods in which IMF supports were provided and those in which they were not. The aim is to get consistent estimates for Bj—the effect of IMF programs on the governance indicators.21 To better reflect variations in the nature of IMF programs, three-year concessional loans (PRGF) are differentiated from nonconcessional arrangements (financed from the General Resource Account [GRA]). Since PRGF-supported programs are often designed to address protracted balance-of-payments needs and structural issues (such as economic governance) for low-income countries, assistance through this facility is expected to have greater impact on the WGI.22 From the GRA, programs under Stand-by Arrangements (SBA) and
20 Previous studies found the significance of these variables for economic governance. Bräutigam and Knack (2004), for instance, show that increases in GDP per capita tend to be associated with improvements in governance and political violence is associated with declines in governance. 21 There may be a question about a possible multicolinearity problem for IMF and World Bank assistance because the World Bank’s development policy loans are often coupled with IMF programs. Correlation among these variables was therefore examined (Appendix I-B). The correlations of the dummy variables for IMF PRGF and GRA arrangements and World Bank assistance are not high; even the correlation between PRGF and IDA assistance is lower than 60 percent. 22 PRGF programs often focus on strengthening governance to assist country efforts to design targeted and well-prioritized spending. Of particular importance are measures to improve public resource management, transparency, and accountability (for more details, see measures.measures.http://www.imf.org/external/np/exr/facts/prgf.htm).

12
the Extended Fund Facility (EFF) are the main vehicles of financing, often, for short-term balance-of-payments needs.
This model specification, however, could raise the issue of endogeneity if estimated by a simple OLS. Obviously, IMF assistance usually goes to countries facing macroeconomic imbalances, and/or other structural problems. Thus, estimated effects for IMF variables may reflect not the consequences of IMF assistance but the underlying problems. To address this issue, a two-stage approach is employed here. First, the probability of receiving financial assistance from the IMF in a two-year period is estimated using a probit model. Then the estimated probabilities will be used as an explanatory variable for the model to analyze economic governance.
B. Data
Dependent Variables
The analysis is based on data for 135 developing countries for 1996–2006 for which data are available on all WGI. As dependent variables, it uses the changes for two-year periods of five dimensions of the WGI, (i) voice and accountability; (ii) government effectiveness; (iii) regulatory quality; (iv) rule of law; and (v) control of corruption. Setting aside political stability and absence of violence, the analysis uses the other five dimensions as a dependent variable to highlight the economic perspectives of governance. Not surprisingly, these governance indicators are highly correlated (Appendix II). The correlations between government effectiveness, rule of law, and control of corruption are especially high (there is less correlation for voice and accountability with the other indicators), which suggests some synergy effects through which an improvement in one factor may eventually enhance another. According to the 2006 Global Monitoring Report, corruption can be a consequence of the failure of any of a number of accountability relationships that characterize a national governance system—from failure of the citizen-politician relationship to failure of bureaucratic and checks and balances institutions.23
The use of perception indexes like the WGI is often challenged on the ground that they do not necessarily represent actual conditions of economic governance. Their use can be justified because
• For many dimensions of governance, more objective data are almost by definition impossible to obtain, so there are few alternatives to the subjective data on which we rely (Kaufmann, Kraay, and Mastruzzi, 2004).24
23 For the report, see http://www.imf.org/external/pubs/cat/longres.cfm?sk=19155.0. 24 For their views, see http://info.worldbank.org/governance/kkz2002/q&a.htm.

13
• Some empirical studies do find a significant correlation between perception indexes and objective data.25
• Public perception of economic governance is itself often important and may have significant economic consequences. Investor perceptions of economic governance, for instance, would likely influence the country risk premium and affect investment decisions.
Explanatory Variables
As measures of IMF programs, the probability of receiving financial assistance from the IMF is estimated, based on a probit model. For this estimate, dummy variables for IMF assistance are used as a dependent variable. The dummies take a value of 1 for a country that has received financial resources during the previous two years and 0 for one that did not. With this specification, the paper focuses on cases where program review was completed and the associated conditionality met.26 Consequently, it eliminates cases that failed to complete review and received no financial resources from the IMF. Subsequently, for comparative purposes, other variables such as size of the program and number of reviews are also examined.
• To find plausible variables, several explanatory variables were initially considered, based on the results of previous studies.27 Among them were real GDP growth, current account balances, private capital flows, official aid inflows, terms of trade; real effective exchange rate, international reserves, per capita income, and some country-fixed variables (e.g., PRGF eligibility, regions, and legal origins). Only determinants significant at least at the 10 percent level are retained.28 All variables are lagged one period to avoid simultaneity.
• Several statistically significant variables are found on the likelihood of receiving the financial resources from the IMF (column 1, Appendix I Table). To summarize briefly, the estimated coefficients on initial GDP per capita, current account balances, and private capital flows are significantly negative for the PRGF variable,
25 For instance, Fisman and Wei (2007), based on panel data analyses, show that the percentage underrecording of exports of cultural objects is highly correlated with the exporting country’s level of corruption as measured by a commonly used subjective index. They argue that survey-based corruption indices contain useful information. 26 Some GRA programs were “precautionary”; a country accepted IMF’ monitoring without necessarily receiving the financial resources. Though such programs may affect economic governance, they are omitted from the dummy variable for the GRA because no resources are transferred. 27 Conway (1994), Vreland (2004), Knight and Santaella (1997), Bird and Rowlands (2001), Barro and Lee (2005), and Cerutti (2007) 28 This is a standard approach adopted in Sturm, Berger, and de Haan (2005) and Dreher (2004)).

14
and those on international reserves and economic growth are also negative for GRA assistance. The explanatory power of these variables was relatively weak for GRA assistance, though the model for PRGF arrangements had higher explanatory power. In part, the difficulty of explaining GRA assistance in a two-year time horizon may reflect rapid changes in the economic environment; PRGF arrangements are often designed to address more structural, longer-term problems that would be captured relatively easily.
Several other variables for economic governance are also considered in light of the setting of IMF programs and the results of previous studies. Those variables are World Bank assistance, trade openness, and official development assistance. For the last decade, the World Bank has significantly increased assistance for improving governance and fighting corruption in client countries.29 Its support to anticorruption efforts through strengthening institutions has become a component of the World Bank Country Assistance Strategies (CAS) for almost all countries. A number of projects and programs have already addressed corruption through reforms in governance institutions—making public financial management more transparent, strengthening tax and customs administration, enhancing civil service performance, reforming the legal system, and enabling local and central governments to deliver services more effectively and with greater accountability to local communities.30 To account for a possible endogeneity problem, the likely amount of World Bank assistance as well as the likelihood of receiving it are estimated, following the same approach employed for IMF variables.31
In previous studies trade openness is often cited as an important factor in economic governance. Wei (2000) and Laffont and N’Guessan (1999) show that more open countries have better institutions. Ades and Di Tella (1994) discuss how the openness of an economy is associated with corruption, arguing that more open economies tend to have less corruption because the greater competition in markets would reduce the attraction of rent- seeking. Al-Marhubi (2004), based on analysis of 86 countries, argues that rising levels of economic development and greater integration into the world economy tend to give rise to
29 The World Bank has also heightened its focus on governance and anticorruption since 1996. At the 1996 Annual Meetings, World Bank President Wolfensohn spoke of the “cancer of corruption” placing the issue squarely on the development agenda. A Bank report released in 2000 noted that poorly functioning public institutions and weak governance are major constraints to growth and equitable development in many developing countries; it called for further efforts in this area, especially to ensure that institutional and governance concerns are reflected in country assistance strategies and lending programs. See “Strengthening World Bank Group Engagement on Governance and Anticorruption” (March 21, 2007) for details. 30 As a result, in FY2006, almost half of the new lending operations included support for strengthening governance, rule of law, and public sector reform. See the World Bank website for more information (http://web.worldbank.org/WBSITE/EXTERNAL/NEWS/0,,contentMDK:20040922%7emenuPK:34480%7epagePK:34370%7etheSitePK:4607,00.html). 31 Several explanatory variables were initially considered, but only those significant at least at the 10 percent level are retained. They include lagged dependent variables, per capita income, per capita aid, population, IDA eligibility, and fuel-exporting countries. All variables are lagged one period to avoid simultaneity.

15
social and cultural patterns that support better governance. To measure openness, the value of imports and exports as a share of GDP is used.
Aid could also influence economic governance in several ways. Knack (2001) offers a good summary of influences of aid. On the one hand, aid might be associated with improved governance because it is often used for training bureaucrats and reinforcing the legal system and public financial management. On the other hand, it could weaken government accountability by retarding the development of a healthy civil society to underpin democracy and the rule of law. Worse, aid may be a potential source of rents, with adverse effects on the quality of the public sector and the incidence of corruption.
Other studies have explored a variety of other variables, including historical, legal, social, and economic factors that might influence economic governance. Specifically, Ades and DiTella (1999) and Leite and Weidemann (1999) find that a natural resources variable—a country’s exports of fuels and minerals as a share of GNP—significantly increases corruption. Montinola and Jackman (2002), in employing a dummy variable for OPEC members as a measurer of abundance of oil, find that it increases corruption.32 Furthermore, Chong and Zanforlin (2000), using dummy variables for countries adopting French, German, or Nordic civil codes or British common law, show that a country’s legal tradition is associated with the quality of its institutions. Al-Marhubi (2004) also finds that Western European influence, legal origins, and religious affiliation have significant impacts on governance. On the other hand, Islam and Montenegro (2002) find that social variables, such as income inequality and ethnic diversity, are not associated with institutional quality.
Though these country-specific factors may be important for economic governance, the paper does not attempt to cover them in the basic model specification, given the primary focus of this paper on the contributions of IMF assistance. Instead, a fixed effect model controls unobservable country effects that result in a missing-variable bias in cross-sectional studies. Legal and social dimensions or natural resource abundance are subsumed into a fixed-effect variable because they change rather slowly or are time-invariant. Time dummies are also included to account for possible time-specific effects.
C. Results
To identify specific impacts on various governance elements, each of the five WGI indicators is regressed using a set of explanatory variables; IMF programs, the ratio of World Bank assistance to GDP, GNI per capita, political stability, and other control
32 The argument is that the availability of external resources could offer great potential gain to officials who have the authority to determine rights associated with natural resource exploitation, or may affect the citizen’s interest in government transparency and accountability.

16
variables. The results are mixed, with PRGF assistance contributing to some elements of economic governance and GRA arrangements not contributing to any (Table 3).33
Explanatory variablesIMF PRGF assistance 0.02 0.09 0.09 0.21 *** 0.17 ***IMF GRA assistance 0.09 -0.07 -0.16 ** 0.02 -0.02World Bank assistance (IBRD) -0.11 0.10 -0.20 -0.08 -0.25World Bank assistance (IDA) -4.67 -0.03 -0.78 -2.77 -5.17 **GNI per capita (t-1) -0.13 0.05 0.09 0.08 -0.01Political stability (t-1) 0.08 *** 0.08 *** 0.01 0.07 *** 0.08 ***Governance indicator (t-1) -0.72 *** -0.93 *** -0.67 *** -0.77 *** -0.83 ***
ObservationsNumber of countriesR2
*** Significant at 1 percent level; ** significant at 5 percent level.
Rule of Law
126 126 126
Voice and Accountability
Government Effectiveness
Regulatory Quality
0.58 0.45
Control of Corruption
590
Coefficient
126609 602
0.54 0.56
Table 3. Results of Explanatory Variables on Changes in Economic Governance
Model 1 Model 2 Model 3 Model 4 Model 5 (Fixed-effect, two-stage approach)
Coefficient Coefficient Coefficient Coefficient
1260.40
609 609
• PRGF variables have significant positive coefficients on rule of law and control of corruption. Though the IMF would not directly deal with the judicial systems of its member countries, apparently the programs have an indirect positive effect. One possible explanation is that, with successful completion of program reviews, the credibility of the government’s commitment to policies is appraised, raising confidence in the rules of society. Another possibility is that the PRGF coefficients include the effects of aid from donors that condition their aid on completion of IMF program reviews. That aid may go to areas associated with rule of law and control of corruption.
• The GRA coefficient, in contrast, shows no statistically positive effect for any element of economic governance. On the contrary, there are negative signs for government effectiveness, control of corruption, and regulatory quality (for which the coefficient is significantly negative). One potential reason for this is that most GRA assistance is provided through Stand-By Arrangements (SBA), which are designed to help countries address short-term balance of payments problems rather than structural issues.
• No significantly positive effect is found for IDA and IBRD assistance. These results may be associated with failure to correctly capture the World Bank’s efforts
33 The Hausman specification test was performed and confirmed that the null hypothesis of no correlation between the effects and the error term is rejected. Therefore, a fixed effect model should be used rather than a random effect model.

17
on economic governance. Given the variety of World Bank projects at any point, merely using overall financial assistance as a variable may cover up the effects of specific efforts on economic governance.
• Among other variables, political stability has a positive sign for most elements of the governance indicators (voice and accountability; government effectiveness; rule of law; and control of corruption) that is statistically significant at 1 percent. Political conditions have robust influence on the quality of economic governance.
These results show the positive influence of PRGF programs, but the effects could be transitory and might even reverse after two years. To investigate sustainability of the effects, a lagged IMF variable—the probability of receiving financial assistance from the IMF with a time lag of three to four years after the provision of assistance—is estimated, using the results of the probit model. Because the PRGF is a three-year program, however, merely using two variables on PRGF assistance over two periods may cause a multicolinearity problem. Therefore analysis is explored by first using two variables simultaneously (column 3, Table 4) and then omitting the variable within two years after the assistance (column 2) to search out any impact of multicolinearity.
In the regression results the lagged PRGF variable has a positive and statistically significant coefficient for government effectiveness, rule of law, and control of corruption. For rule of law and control of corruption, the significantly positive effects are observed both within the first two years and also three to four years after the assistance, suggesting that these effects are sustainable. Also, the lagged PRGF variable has significant positive coefficients on government effectiveness. As for the influence of GRA assistance, it seems to have an adverse effect on regulatory quality within the first two years but then the effect tapers off.
(1) (2) (3) (1) (2) (3) (1) (2) (3) (1) (2) (3) (1) (2) (3)
Explanatory variablesPRGF (within two years) 0.02 0.02 0.09 0.08 0.09 0.08 0.21 0.20 0.17 0.17
(***) (***) (***) (***)
PRGF (3-4 years after) 0.03 0.04 0.16 0.14 0.08 0.05 0.11 0.09 0.13 0.11(*) (**) (*) (***) (*) (***) (*)
GRA (within two years) 0.09 0.08 -0.07 -0.06 -0.16 -0.13 0.02 0.04 -0.02 0.00(**)
GRA (3-4 years after) 0.12 0.12 0.07 0.07 -0.12 -0.12 -0.04 -0.05 0.00 0.00(*)
ObservationsNumber of countries
*** Significant at 1 percent level; ** significant at 5 percent level; * significant at 10 percent level.
583
Table 4. Results of Key Explanatory Variables on Economic Governance (Fixed-effect, two-step approach)
Voice and Accountability
Government Effectiveness Regulatory Quality Rule of Law Control of Corruption
126126 126 126 126602 602 602 595

18
Robustness
To examine robustness, first alternative variables for IMF assistance are explored, using (i) the ratio of the amount of IMF assistance to GDP (columns 7, Appendixes III–VII); (ii) the number of reviews of the IMF programs that were completed within two years (column 8); and (iii) an alternative probit model to estimate the likelihood of IMF resources (column 6). Using the GDP ratio, the PRGF coefficients for rule of law and control of corruption turn statistically insignificant. This is not surprising: the effects of program conditionalities are likely to be associated, not with the size of the program, but with successful completion of program reviews. The results for the number of reviews completed support this view. Using the number as a dependent variable, PRGF coefficients are significantly positive for voice and accountability, government effectiveness, rule of law, and control of corruption. As more program reviews are completed, the quality of economic governance is perceived to improve.
A different model to estimate the likelihood of receiving IMF assistance is also tested. The original probit model, while having some exogenous variables (such as current account balances, private capital flows, international reserves, and economic growth), includes variables used in the primary equation on economic governance (including per capita income and aid). In the alternative model, all such variables are omitted, and only those that seem to have no direct influence on economic governance are used (column 2, Appendix I).34 This change in the model does not affect the results (columns 6, Appendixes III–VII).
Then different model specifications are tested (Appendixes III–VII), through (i) omitting some control variables (columns 1–2); (ii) not using a two-stage approach (column 3); (iii) using alternative variables for IBRD and IDA assistances (the estimated probabilities of receiving the assistances) (column 4). In addition, a Tobit specification is also tested (column 5). Since the dependent variables (changes in the WGI) are bounded numerically, a linear model may not be appropriate. As a fixed-effect model can hardly be incorporated into a Tobit model, additional fixed-factor variables are used to control unobservable country-specific effects that could result in a missing-variable bias in cross- sectional studies. Those variables are dummies for regions, legal and social dimensions, and natural resource abundance. The results of PRGF coefficients on rule of law and control of corruption are robust in most of the specifications, as is the negative coefficient of GRA assistance on regulatory quality (Appendixes III–VII).
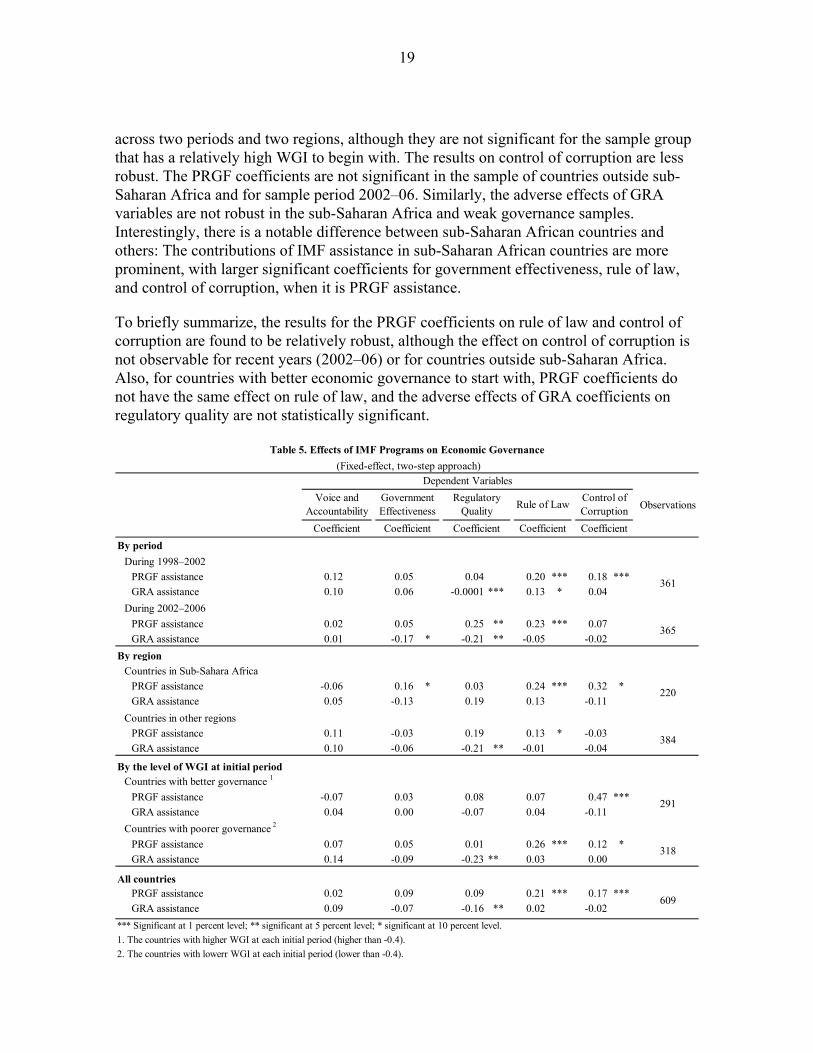
Furthermore, different sampling is considered, sorted by period, region, and the level of WGI at each initial period. Table 5 reports the results of PRGF and GRA coefficients on each WGI in each sample. The results are robust for PRGF coefficients on rule of law
34 The variables of legal origins and abundance of natural resources (fuel) are also omitted; their relevance foe economic governance has already been demonstrated by Ades and Di Tella (1999), Leite and Weidemann (2002), Montinola and Jackman (2002), Chong and Zanforlin (2000), Al-Marhubi (2004), and Islam and Montenegro (2002).
19
across two periods and two regions, although they are not significant for the sample group that has a relatively high WGI to begin with. The results on control of corruption are less robust. The PRGF coefficients are not significant in the sample of countries outside sub-Saharan Africa and for sample period 2002–06. Similarly, the adverse effects of GRA variables are not robust in the sub-Saharan Africa and weak governance samples. Interestingly, there is a notable difference between sub-Saharan African countries and others: The contributions of IMF assistance in sub-Saharan African countries are more prominent, with larger significant coefficients for government effectiveness, rule of law, and control of corruption, when it is PRGF assistance.
To briefly summarize, the results for the PRGF coefficients on rule of law and control of corruption are found to be relatively robust, although the effect on control of corruption is not observable for recent years (2002–06) or for countries outside sub-Saharan Africa. Also, for countries with better economic governance to start with, PRGF coefficients do not have the same effect on rule of law, and the adverse effects of GRA coefficients on regulatory quality are not statistically significant.
Observations
By periodDuring 1998–2002
PRGF assistance 0.12 0.05 0.04 0.20 *** 0.18 ***GRA assistance 0.10 0.06 -0.0001 *** 0.13 * 0.04
During 2002–2006PRGF assistance 0.02 0.05 0.25 ** 0.23 *** 0.07GRA assistance 0.01 -0.17 * -0.21 ** -0.05 -0.02
By regionCountries in Sub-Sahara Africa
PRGF assistance -0.06 0.16 * 0.03 0.24 *** 0.32 *GRA assistance 0.05 -0.13 0.19 0.13 -0.11
Countries in other regionsPRGF assistance 0.11 -0.03 0.19 0.13 * -0.03GRA assistance 0.10 -0.06 -0.21 ** -0.01 -0.04
By the level of WGI at initial periodCountries with better governance 1
PRGF assistance -0.07 0.03 0.08 0.07 0.47 ***GRA assistance 0.04 0.00 -0.07 0.04 -0.11
Countries with poorer governance 2
PRGF assistance 0.07 0.05 0.01 0.26 *** 0.12 *GRA assistance 0.14 -0.09 -0.23 ** 0.03 0.00
All countriesPRGF assistance 0.02 0.09 0.09 0.21 *** 0.17 ***GRA assistance 0.09 -0.07 -0.16 ** 0.02 -0.02
*** Significant at 1 percent level; ** significant at 5 percent level; * significant at 10 percent level.1. The countries with higher WGI at each initial period (higher than -0.4). 2. The countries with lowerr WGI at each initial period (lower than -0.4).
Dependent Variables
Table 5. Effects of IMF Programs on Economic Governance
Voice and Accountability
Government Effectiveness
Regulatory Quality Rule of Law Control of
Corruption
(Fixed-effect, two-step approach)
Coefficient Coefficient Coefficient Coefficient Coefficient
609
220
384
291
318
365
361

20
Finally, a question might be raised about causality: does governance somehow improve performance on IMF programs, rather than the IMF program improving governance? Though this model specification does not fully address the question, the paper supports the likelihood that IMF programs are influencing economic governance, for the following reasons:
• Economic governance of a recipient country may improve even before the IMF disburses any financial resources. If, however, efforts have been made in anticipation for receiving the resources or to meet prior conditions for programs, those efforts should be recognized as among the contributions of the programs.
• The results presented in Table 4 show the almost equally positive and significant results for lagged PRGF variables on the rule of law and control of corruption, and they are significant for government effectiveness.
V. CONCLUDING REMARKS
This paper examines whether IMF financial assistance has been associated with improvement in economic governance in recipient countries. The panel analyses, while accounting for possible endogeneity problems, find that some elements of economic governance improve when IMF programs stay on track. Specifically, PRGF assistance tends to reinforce rule of law and enhance control of corruption. GRA arrangements, however, not only do not carry the same effects, they may even have adverse effects on regulatory quality.
The analyses also indicate that the effects of PRGF programs on rule of law and control of corruption are sustainable. The positive effects are statistically significant for both the initial two years and three to four years after assistance is provided.
This paper, however, may not clarify the mechanisms by which IMF programs achieve these effects, particularly in the areas of which the IMF has not directly engaged in (such as rule of law and control of corruption). One possible explanation is that, once program reviews are successfully completed, the government’s commitment to policies seems more credible, which raises public confidence that the rules of society will be enforced. Another is that the PRGF coefficients include the effects of aid from donors that condition aid on completion of IMF program reviews. That aid may go to areas associated with rule of law and control of corruption.
The analysis here also shows that program size does not matter to achievement of economic governance effects. The IMF loan-to-GDP ratio was not statistically significant for any economic governance indicator. The effects of the program are thus likely to be associated with successful completion of program reviews, not the size of the program.
The empirical analyses find a significant role for political stability in determining some elements of economic governance (voice and accountability; government effectiveness;

21
rule of law; control of corruption). Given the recent erosion of the political stability indicator in low-income countries, the decline in economic governance indicators in those countries can probably be explained by political factors.
Finally, the econometric results in this paper should be treated with caution because the model may not fully capture all the efforts of the IMF and the World Bank. Specifically, the IMF also actively promotes good governance through bilateral surveillance, policy advice, technical assistance, and data dissemination standards and codes, especially ROSCs. Such efforts could help bring about specific reforms and build the capacity of government officials, indirectly strengthening economic governance. Similarly, though the paper fails to find robust contributions from World Bank assistance, the model probably does not capture its efforts in specific areas of economic governance.

22
Coeff
icien
tz-
statis
tics
Coeff
icien
tz-
statis
tics
Coeff
icien
tz-
statis
tics
Coeff
icien
tz-
statis
tics
Lagg
ed d
epen
dent
varia
ble1.
47**
*1.
10**
*2.
06**
*1.
24**
*Cu
rrent
acco
unt b
alanc
e (t-1
)-2
.10
***
-2.9
6**
*Pr
ivate
capit
al flo
w (t-
1)-0
.93
*-2
.94
***
PRGF
eligi
bility
-0.8
7**
*Fu
el ex
porti
ng co
untri
es
0.22
***
Per c
apita
inco
me (t
-1)
-1.8
2**
*Ai
d pe
r cap
ita (t
-1)
0.62
**Li
fe ex
pecta
ncy (
t-1)
-0.0
3**
*In
terna
tiona
l res
erve
s (t-1
)-1
.20
***
-0.7
2**
-0.9
9**
*Ec
onom
ic gr
owth
(t-1
)-0
.06
***
-0.0
6**
*Tr
ansit
ion e
cono
mies
0.62
***
1.27
**Br
itish
lega
l sys
tem1.
07*
Fren
ch le
gal s
ystem
1.45
**Af
rica d
ummy
-0.2
8*
Numb
er o
f cou
ntrie
sPs
eudo
R2
*** S
ignifi
cant
at 1
per
cent
leve
l: **
Sign
ifica
nt at
5 p
erce
nt le
vel:
*Sign
ifica
nt at
10
perc
ent l
evel.
(1)
0.29
PRGF
GRA
768
0.51
0.26
Appe
ndix
I. De
termi
nant
s of R
eceip
ts of
IMF
Reso
urce
s (Pr
obit
Mod
el)
(2)
PRGF
GRA
776
791
0.59
751

23
Var
iabl
eO
bser
vatio
nsM
ean
Std.
Dev
.M
inM
axD
ata
Sour
ces
Voi
ce a
nd a
ccou
ntab
ility
810
-0.2
80.
81-2
.00
1.35
WG
IPo
litic
al st
abili
ty80
0-0
.27
0.87
-2.5
91.
52W
GI
Gov
ernm
ent e
ffect
iven
ess
809
-0.3
30.
65-1
.76
1.48
WG
IR
egul
ator
y qu
ality
809
-0.2
30.
75-2
.71
1.48
WG
IR
ule
of la
w79
9-0
.36
0.70
-1.8
91.
47W
GI
Con
trol o
f cor
rupt
ion
785
-0.3
60.
65-1
.74
1.47
WG
ILo
g G
NI p
er c
apita
791
8.14
0.92
6.10
10.1
0W
orld
Ban
k, W
DI
Trad
e op
enne
ss80
80.
860.
400.
112.
40IM
F, W
EOG
RA
arr
ange
men
ts81
00.
290.
450.
001.
00IM
F, IF
SPR
GF
arra
ngem
ents
810
0.19
0.39
0.00
1.00
IMF,
IFS
Wor
ld B
ank
assis
tanc
e (I
BR
D)
810
0.03
0.16
0.00
2.83
Wor
ld B
ank,
GD
FW
orld
Ban
k as
sista
nce
(ID
A)
810
0.01
0.01
0.00
0.10
Wor
ld B
ank,
GD
F
App
endi
x II
-A. S
umm
ary
Stat
istic
s
Voi
ce a
nd
acco
unta
bilit
yG
over
nmen
t ef
fect
iven
ess
Reg
ulat
ory
qual
ityR
ule
of
law
Con
trol o
f co
rrup
tion
PRG
F as
sista
nce
GR
A
assis
tanc
eIB
RD
as
sista
nce
IDA
as
sista
nce
Polit
ical
st
abili
tyG
NI p
er
capi
taTr
ade
open
ess
Voi
ce a
nd a
ccou
ntab
ility
0.69
0.71
0.68
0.62
-0.1
9-0
.01
0.11
-0.2
10.
670.
490.
19G
over
nmen
t effe
ctiv
enes
s0.
690.
840.
880.
85-0
.26
-0.1
00.
14-0
.31
0.65
0.70
0.29
Reg
ulat
ory
qual
ity0.
710.
840.
780.
74-0
.18
-0.0
30.
12-0
.26
0.55
0.60
0.19
Rul
e of
law
0.68
0.88
0.78
0.89
-0.3
0-0
.12
0.19
-0.2
80.
740.
680.
34C
ontro
l of c
orru
ptio
n0.
620.
850.
740.
89-0
.30
-0.1
40.
19-0
.25
0.66
0.66
0.29
PRG
F as
sista
nce
(dum
my)
-0.1
9-0
.26
-0.1
8-0
.30
-0.3
0-0
.11
-0.0
50.
58-0
.20
-0.5
8-0
.21
GR
A a
ssist
ance
(dum
my)
-0.0
1-0
.10
-0.0
3-0
.12
-0.1
4-0
.11
-0.0
5-0
.06
-0.1
30.
01-0
.10
IBR
D a
ssist
ance
(in
perc
ent o
f GD
P)0.
110.
140.
120.
190.
19-0
.05
-0.0
5-0
.05
0.16
0.10
0.17
IDA
ass
istan
ce (i
n pe
rcen
t of G
DP)
-0.2
1-0
.31
-0.2
6-0
.28
-0.2
50.
58-0
.06
-0.0
5-0
.16
-0.6
4-0
.19
Polit
ical
stab
ility
0.67
0.65
0.55
0.74
0.66
-0.2
0-0
.13
0.16
-0.1
60.
510.
41Lo
g G
NI p
er c
apita
0.49
0.70
0.60
0.68
0.66
-0.5
80.
010.
10-0
.64
0.51
0.39
Trad
e op
enes
s0.
230.
290.
190.
340.
29-0
.21
-0.1
00.
17-0
.19
0.41
0.39
App
endi
x I-
B, C
orre
latio
n M
atrix

24
Expl
anat
ory
varia
bles
IMF
PRG
F as
sista
nce
2-0
.04
-0.0
5-0
.05
-0.0
20.
02IM
F G
RA
ass
istan
ce 2
0.08
0.08
0.07
0.05
0.09
IMF
PRG
F as
sista
nce
(Dum
my)
0.03
IMF
GR
A a
ssist
ance
(Dum
my)
0.03
IMF
PRG
F as
sista
nce
30.
018
IMF
GR
A a
ssist
ance
30.
051
IMF
PRG
F as
sista
nce
(GD
P ra
tio)
-60.
18IM
F G
RA
ass
istan
ce (G
DP
ratio
)1.
83IM
F PR
GF
assis
tanc
e (n
umbe
r of r
evie
ws)
0.07
**IM
F G
RA
ass
istan
ce (n
umbe
r of r
evie
ws)
0.01
IBR
D a
ssist
ance
(GD
P ra
tio)
-0.1
10.
06-0
.12
-0.1
2-0
.11
-0.1
1ID
A a
ssist
ance
(GD
P ra
tio)
-0.6
4-1
.15
-4.5
7*
-4.0
7-5
.34
*-4
.67
IBR
D a
ssist
ance
40.
17ID
A a
ssist
ance
4-0
.20
GN
I per
cap
ita (t
-1)
-0.1
2-0
.11
-0.1
1-0
.12
0.02
-0.1
3-0
.15
-0.1
3-0
.13
Trad
e op
enne
ss (t
-1)
0.06
0.09
0.06
-0.0
20.
060.
070.
080.
06O
ffici
al a
id (t
-1)
0.00
20.
001
0.00
20.
001
0.00
30.
004
*0.
003
0.00
3Po
litic
al st
abili
ty (t
-1)
0.08
***
0.08
***
0.08
***
0.07
***
0.02
0.07
***
0.07
***
0.08
***
0.08
***
Lagg
ed g
over
nanc
e in
dica
tor
-0.7
2**
*-0
.73
***
-0.7
2**
*-0
.72
***
-0.0
8**
*-0
.72
***
-0.7
1**
*-0
.73
***
-0.7
2**
*Tr
ansit
ion
econ
omie
s (du
mm
y)0.
02B
ritish
lega
l orig
in (d
umm
y)0.
04Fr
ench
lega
l orig
in (d
umm
y)0.
00Ex
porte
rs o
f non
fuel
prim
ary
prod
ucts
(dum
my)
-0.0
3Ex
porte
rs o
f fue
ls (m
ainl
y oi
l, du
mm
y)-0
.07
**
Obs
erva
tions
608
Num
ber o
f cou
ntrie
s12
6
R2
0.41
0.40
App
endi
x II
I. R
esul
ts o
f Pan
el R
egre
ssio
n M
odel
on
Cha
nges
in E
cono
mic
Gov
erna
nce
(Voi
ce a
nd A
ccou
ntab
ility
)
126
Coe
ffici
ent
609
FE, 2
-Sta
ge
(8)
(9)
0.39
0.40
FE, 2
-Sta
ge
Coe
ffici
ent
Coe
ffici
ent
Coe
ffici
ent
597
593
125
122
(6)
(7)
FE, 2
-Sta
geFE
, 2-S
tage
(5) 1
Tobi
t, R
E, 2
-Sta
ge
Coe
ffici
ent
609
126
Coe
ffici
ent
Coe
ffici
ent
Coe
ffici
ent
Coe
ffici
ent
602
126
126
651
126
133
1. D
umm
y va
riabl
es fo
r reg
ions
are
also
em
ploy
ed.
(1)
(2)
(3)
(4)
609
609
0.40
0.39
0.39
***
Sign
ifica
nt a
t 1 p
erce
nt le
vel:
** S
igni
fican
t at 5
per
cent
leve
l.
3. T
he e
stim
ated
like
lihoo
d of
rece
ivin
g IM
F re
sour
ces.
Var
iabl
es e
xclu
de th
ose
are
used
in th
e pr
imar
y m
odel
or l
ikel
y to
affe
ct e
cono
mic
gov
erna
nce
dire
ctly
(bas
ed o
n pr
evio
us st
udie
s).
4. T
he e
stim
ated
like
lihoo
d of
rece
ivin
g W
orld
Ban
k re
sour
ces w
ith d
eter
min
ants
sign
ifica
nt a
t lea
st a
t the
10
perc
ent l
evel
.
2. T
he e
stim
ated
like
lihoo
d of
rece
ivin
g IM
F re
sour
ces w
ith d
eter
min
ants
sign
ifica
nt a
t lea
st a
t the
10
perc
ent l
evel
.
FE, 2
-Sta
geFE
, 2-S
tage
FEFE
, 2-S
tage
0.40

25
Expl
anat
ory
varia
bles
IMF
PRG
F as
sista
nce
20.
100.
100.
080.
13*
0.09
IMF
GR
A a
ssist
ance
2-0
.07
-0.0
7-0
.07
-0.0
3-0
.07
IMF
PRG
F as
sista
nce
(Dum
my)
0.07
**IM
F G
RA
ass
istan
ce (D
umm
y)-0
.04
IMF
PRG
F as
sista
nce
30.
06IM
F G
RA
ass
istan
ce 3
-0.0
6IM
F PR
GF
assis
tanc
e (G
DP
ratio
)-1
2.71
IMF
GR
A a
ssist
ance
(GD
P ra
tio)
-36.
64IM
F PR
GF
assis
tanc
e (n
umbe
r of r
evie
ws)
0.07
***
IMF
GR
A a
ssist
ance
(num
ber o
f rev
iew
s)-0
.02
IBR
D a
ssist
ance
(GD
P ra
tio)
0.08
0.04
0.11
0.07
0.10
0.10
IDA
ass
istan
ce (G
DP
ratio
)2.
60**
*0.
41**
-0.1
3-0
.46
-0.3
9-0
.03
***
IBR
D a
ssist
ance
4-0
.64
**ID
A a
ssist
ance
40.
81**
GN
I per
cap
ita (t
-1)
0.05
0.05
0.09
0.09
0.24
***
0.05
0.08
0.05
0.05
Trad
e op
enne
ss (t
-1)
-0.1
6**
-0.0
60.
00**
-0.0
5-0
.16
**0.
000.
00-0
.16
**O
ffici
al a
id (t
-1)
0.00
02-0
.000
20.
09-0
.000
50.
001
0.07
0.08
0.00
05Po
litic
al st
abili
ty (t
-1)
0.08
***
0.08
***
0.06
**-0
.91
***
0.09
***
0.08
***
-0.9
2**
*-0
.92
***
0.08
***
Lagg
ed g
over
nanc
e in
dica
tor
-0.9
2**
-0.9
3**
*-0
.92
***
0.03
***
-0.7
0**
*-0
.91
***
0.06
***
0.04
***
-0.9
3**
*Tr
ansit
ion
econ
omie
s (du
mm
y)-0
.48
**Br
itish
lega
l orig
in (d
umm
y)0.
08Fr
ench
lega
l orig
in (d
umm
y)-0
.17
Expo
rters
of n
onfu
el p
rimar
y pr
oduc
ts (d
umm
y)-0
.08
Expo
rters
of f
uels
(mai
nly
oil,
dum
my)
-0.2
3**
*
Obs
erva
tions
Num
ber o
f cou
ntrie
s
R2
608
125
0.58
0.55
0.60
643
133
0.58
597
593
App
endi
x IV
. Res
ults
of P
anel
Reg
ress
ion
Mod
el o
n C
hang
es in
Eco
nom
ic G
over
nanc
e (G
over
nmen
t Effe
ctiv
enes
s)
(9)
FE, 2
-Ste
p
Coef
ficie
nt
(8)
FE, 2
-Sta
ge
Coe
ffici
ent
FE, 2
-Sta
geFE
, 2-S
tage
Coe
ffici
ent
125
122
Coe
ffici
ent
(6)
(7)
Coe
ffici
ent
(5) 1
Tobi
t, R
E, 2
-Sta
ge
608
608
651
Coe
ffici
ent
Coe
ffici
ent
Coe
ffici
ent
0.57602
126
608
126
126
133
126
1. D
umm
y va
riabl
es fo
r reg
ions
are
also
em
ploy
ed.
0.57
0.58
0.58
***
Sign
ifica
nt a
t 1 p
erce
nt le
vel:
** S
igni
fican
t at 5
per
cent
leve
l.
Coe
ffici
ent
FE, 2
-Sta
ge
(1)
(2)
(3)
(4)
FE, 2
-Sta
ge
3. T
he e
stim
ated
like
lihoo
d of
rece
ivin
g IM
F re
sour
ces.
Var
iabl
es e
xclu
de th
ose
used
in th
e pr
imar
y m
odel
or l
ikel
y to
affe
ct e
cono
mic
gov
erna
nce
dire
ctly
(bas
ed o
n pr
evio
us st
udie
s).
4. T
he e
stim
ated
like
lihoo
d of
rece
ivin
g W
orld
Ban
k re
sour
ces w
ith d
eter
min
ants
sign
ifica
nt a
t lea
st a
t the
10
perc
ent l
evel
.
2. T
he e
stim
ated
like
lihoo
d of
rece
ivin
g IM
F re
sour
ces w
ith d
eter
min
ants
sign
ifica
nt a
t lea
st a
t the
10
perc
ent l
evel
.
FE, 2
-Sta
geFE

26
Expl
anat
ory
varia
bles
IMF
PRG
F as
sista
nce
20.
100.
080.
060.
11*
0.09
IMF
GR
A a
ssist
ance
2-0
.15
*-0
.15
**-0
.17
**-0
.07
-0.1
6**
IMF
PRG
F as
sista
nce
(Dum
my)
-0.0
1IM
F G
RA
ass
istan
ce (D
umm
y)-0
.04
IMF
PRG
F as
sista
nce
30.
04IM
F G
RA
ass
istan
ce 3
-0.1
4*
IMF
PRG
F as
sista
nce
(GD
P ra
tio)
152.
25**
IMF
GR
A a
ssist
ance
(GD
P ra
tio)
-88.
70*
IMF
PRG
F as
sista
nce
(num
ber o
f rev
iew
s)0.
05IM
F G
RA
ass
istan
ce (n
umbe
r of r
evie
ws)
-0.0
4*
IBR
D a
ssist
ance
(GD
P ra
tio)
0.05
-0.0
4-0
.22
-0.2
0-0
.20
IDA
ass
istan
ce (G
DP
ratio
)-0
.40
2.25
-2.5
1-0
.86
-0.7
8IB
RD
ass
istan
ce 4
-0.5
0-0
.20
IDA
ass
istan
ce 4
0.65
-0.5
2G
NI p
er c
apita
(t-1
)0.
070.
090.
100.
120.
12**
*0.
080.
17*
0.08
*0.
09Tr
ade
open
ness
(t-1
)-0
.26
***
-0.1
7*
-0.2
6**
*-0
.001
-0.2
6**
*-0
.23
**-0
.25
**-0
.25
***
Offi
cial
aid
(t-1
)0.
003
0.00
10.
003
-0.0
003
0.00
40.
003
0.00
30.
003
Polit
ical
stab
ility
(t-1
)0.
010.
02-0
.000
10.
020.
04*
0.02
-0.0
10.
010.
01La
gged
gov
erna
nce
indi
cato
r-0
.66
***
-0.6
7**
*-0
.62
***
-0.6
7**
*-0
.23
***
-0.6
7**
*-0
.66
***
-0.6
7**
*-0
.67
***
Tran
sitio
n ec
onom
ies (
dum
my)
-0.0
6B
ritish
lega
l orig
in (d
umm
y)0.
06Fr
ench
lega
l orig
in (d
umm
y)-0
.04
Expo
rters
of n
onfu
el p
rimar
y pr
oduc
ts (d
umm
y)-0
.08
Expo
rters
of f
uels
(mai
nly
oil,
dum
my)
-0.0
7**
Obs
erva
tions
Num
ber o
f cou
ntrie
s
R2
App
endi
x V
. Res
ults
of P
anel
Reg
ress
ion
Mod
el o
n C
hang
es in
Eco
nom
ic G
over
nanc
e (R
egul
ator
y Q
ualit
y)
0.45
0.45
0.45
0.45
125
122
126
126
597
593
608
608
Coe
ffici
ent
Coe
ffici
ent
Coe
ffici
ent
Coe
ffici
ent
FE, 2
-Sta
geFE
, 2-S
tage
FE, 2
-Sta
geFE
, 2-S
tep
(6)
(7)
(8)
(9)
(5) 1
Tobi
t, R
E, 2
-Sta
ge
Coe
ffici
ent
***
Sign
ifica
nt a
t 1 p
erce
nt le
vel:
** S
igni
fican
t at 5
per
cent
leve
l.1.
Dum
my
varia
bles
for r
egio
ns a
re a
lso e
mpl
oyed
.
608
126
0.45
0.42
0.45
126
126
133
126
Coe
ffici
ent
Coe
ffici
ent
Coe
ffici
ent
Coe
ffici
ent
(1)
(2)
(3)
(4)
FE, 2
-Sta
geFE
, 2-S
tage
FEFE
, 2-S
tage
609
609
651
602
2. T
he e
stim
ated
like
lihoo
d of
rece
ivin
g IM
F re
sour
ces w
ith d
eter
min
ants
sign
ifica
nt a
t lea
st a
t the
10
perc
ent l
evel
.3.
The
est
imat
ed li
kelih
ood
of re
ceiv
ing
IMF
reso
urce
s. V
aria
bles
exc
lude
thos
e us
ed in
the
prim
ary
mod
el o
r lik
ely
to a
ffect
eco
nom
ic g
over
nanc
e di
rect
ly (b
ased
on
prev
ious
stud
ies)
.4.
The
est
imat
ed li
kelih
ood
of re
ceiv
ing
Wor
ld B
ank
reso
urce
s with
det
erm
inan
ts si
gnifi
cant
at l
east
at t
he 1
0 pe
rcen
t lev
el.
0.44

27
Expl
anat
ory
varia
bles
IMF
PRG
F as
sista
nce
20.
22**
*0.
22**
*0.
21**
*0.
22**
*0.
21**
*IM
F G
RA
ass
istan
ce 2
0.02
0.02
0.02
-0.0
20.
02IM
F PR
GF
assis
tanc
e (D
umm
y)0.
06**
IMF
GR
A a
ssist
ance
(Dum
my)
-0.0
2IM
F PR
GF
assis
tanc
e 3
0.14
***
IMF
GR
A a
ssist
ance
30.
02IM
F PR
GF
assis
tanc
e (G
DP
ratio
)0.
46IM
F G
RA
ass
istan
ce (G
DP
ratio
)-0
.70
IMF
PRG
F as
sista
nce
(num
ber o
f rev
iew
s)0.
09**
*IM
F G
RA
ass
istan
ce (n
umbe
r of r
evie
ws)
0.00
3IB
RD
ass
istan
ce (G
DP
ratio
)-0
.03
0.07
-0.0
8-0
.09
-0.0
8-0
.08
IDA
ass
istan
ce (G
DP
ratio
)-0
.83
-0.3
8-2
.57
-1.7
1-2
.53
-2.7
7IB
RD
ass
istan
ce 4
-0.0
5ID
A a
ssist
ance
40.
09G
NI p
er c
apita
(t-1
)0.
080.
080.
050.
090.
23**
*0.
070.
070.
090.
08Tr
ade
open
ness
(t-1
)-0
.13
-0.0
6-0
.13
-0.0
1-0
.13
**-0
.14
-0.1
5**
-0.1
3*
Offi
cial
aid
(t-1
)0.
0001
-0.0
002
0.00
010.
001
0.00
20.
002
0.00
20.
002
Polit
ical
stab
ility
(t-1
)0.
07**
*0.
07**
*0.
06**
*0.
07**
*0.
09**
*0.
07**
*0.
08**
*0.
07**
*0.
07**
*La
gged
gov
erna
nce
indi
cato
r-0
.78
***
-0.7
8**
*-0
.75
***
-0.7
8**
*-0
.47
***
-0.7
7**
*-0
.78
***
-0.7
8**
*-0
.77
***
Tran
sitio
n ec
onom
ies (
dum
my)
-0.3
7**
Brit
ish le
gal o
rigin
(dum
my)
0.13
Fren
ch le
gal o
rigin
(dum
my)
-0.0
2Ex
porte
rs o
f non
fuel
prim
ary
prod
ucts
(dum
my)
-0.1
1**
Expo
rters
of f
uels
(mai
nly
oil,
dum
my)
-0.1
1
Obs
erva
tions
Num
ber o
f cou
ntrie
s
R2
App
endi
x V
I. R
esul
ts o
f Pan
el R
egre
ssio
n M
odel
on
Cha
nges
in E
cono
mic
Gov
erna
nce
(Rul
e of
Law
)
0.52
0.51
0.54
0.55
125
122
126
126
591
588
601
601
Coe
ffici
ent
Coe
ffici
ent
Coe
ffici
ent
Coe
ffici
ent
FE, 2
-Sta
geFE
, 2-S
tage
FE, 2
-Sta
geFE
, 2-S
tep
(6)
(7)
(8)
(9)
601
126
(5) 1
Tobi
t, R
E, 2
-Sta
ge
Coe
ffici
ent
(1)
(2)
(3)
(4)
FE, 2
-Sta
geFE
, 2-S
tage
FEFE
, 2-S
tage
Coe
ffici
ent
Coe
ffici
ent
Coe
ffici
ent
Coe
ffici
ent
601
601
644
601
126
126
133
126
3. T
he e
stim
ated
like
lihoo
d of
rece
ivin
g IM
F re
sour
ces.
Var
iabl
es e
xclu
de th
ose
used
in th
e pr
imar
y m
odel
or l
ikel
y to
affe
ct e
cono
mic
gov
erna
nce
dire
ctly
(bas
ed o
n pr
evio
us st
udie
s).
0.55
0.55
0.53
0.55
4. T
he e
stim
ated
like
lihoo
d of
rece
ivin
g W
orld
Ban
k re
sour
ces w
ith d
eter
min
ants
sign
ifica
nt a
t lea
st a
t the
10
perc
ent l
evel
.
2. T
he e
stim
ated
like
lihoo
d of
rece
ivin
g IM
F re
sour
ces w
ith d
eter
min
ants
sign
ifica
nt a
t lea
st a
t the
10
perc
ent l
evel
.
***
Sign
ifica
nt a
t 1 p
erce
nt le
vel:
** S
igni
fican
t at 5
per
cent
leve
l.1.
Dum
my
varia
bles
for r
egio
ns a
re a
lso e
mpl
oyed
.

28
Expl
anat
ory
varia
bles
IMF
PRG
F as
sista
nce
20.
19**
*0.
18**
*0.
17**
*0.
21**
*0.
17**
*IM
F G
RA
ass
istan
ce 2
0.00
0.00
0.00
-0.0
2-0
.02
IMF
PRG
F as
sista
nce
(Dum
my)
0.04
IMF
GR
A a
ssist
ance
(Dum
my)
-0.0
1IM
F PR
GF
assis
tanc
e 3
0.12
***
IMF
GR
A a
ssist
ance
3-0
.02
IMF
PRG
F as
sista
nce
(GD
P ra
tio)
-0.8
5IM
F G
RA
ass
istan
ce (G
DP
ratio
)-1
2.93
IMF
PRG
F as
sista
nce
(num
ber o
f rev
iew
s)0.
06*
IMF
GR
A a
ssist
ance
(num
ber o
f rev
iew
s)-0
.01
IBR
D a
ssist
ance
(GD
P ra
tio)
-0.2
6**
0.01
*-0
.25
-0.2
7**
*-0
.25
-0.2
5**
IDA
ass
istan
ce (G
DP
ratio
)-0
.59
-3.2
7-5
.04
**-4
.71
-4.9
5*
-5.1
7IB
RD
ass
istan
ce 4
-0.1
0**
IDA
ass
istan
ce 4
0.23
GN
I per
cap
ita (t
-1)
0.01
0.01
0.02
0.02
0.22
***
-0.0
2-0
.001
-0.0
1-0
.01
Trad
e op
enne
ss (t
-1)
-0.1
7**
-0.0
7-0
.17
**-0
.02
-0.1
4*
-0.1
2-0
.17
**-0
.14
*O
ffici
al a
id (t
-1)
0.00
10.
0002
0.00
10.
002
0.00
4*
0.00
50.
004
*0.
003
Polit
ical
stab
ility
(t-1
)0.
08**
*0.
08**
*0.
06**
*0.
08**
*0.
09**
*0.
08**
*0.
08**
*0.
08**
*0.
08**
*La
gged
gov
erna
nce
indi
cato
r-0
.82
***
-0.8
3**
*-0
.79
***
-0.8
3**
*-0
.57
***
-0.8
3**
*-0
.83
***
-0.8
2**
*-0
.83
***
Tran
sitio
n ec
onom
ies (
dum
my)
-0.4
0**
Brit
ish le
gal o
rigin
(dum
my)
0.07
Fren
ch le
gal o
rigin
(dum
my)
-0.1
1Ex
porte
rs o
f non
fuel
prim
ary
prod
ucts
(dum
my)
-0.0
9*
Expo
rters
of f
uels
(mai
nly
oil,
dum
my)
-0.1
3
Obs
erva
tions
Num
ber o
f cou
ntrie
s
R2
App
endi
x V
II. R
esul
ts o
f Pan
el R
egre
ssio
n M
odel
on
Cha
nges
in E
cono
mic
Gov
erna
nce
(Con
trol
of C
orru
ptio
n)
0.56
0.57
0.56
0.57
125
126
126
126
579
576
589
589
Coe
ffici
ent
Coe
ffici
ent
Coe
ffici
ent
Coe
ffici
ent
FE, 2
-Sta
geFE
, 2-S
tage
FE, 2
-Sta
geFE
, 2-S
tep
(6)
(7)
(8)
(9)
Coe
ffici
ent
(5) 1
Tobi
t, R
E, 2
-Sta
ge
126
***
Sign
ifica
nt a
t 1 p
erce
nt le
vel:
** S
igni
fican
t at 5
per
cent
leve
l.
589
631
589
126
1. D
umm
y va
riabl
es fo
r reg
ions
are
also
em
ploy
ed.
589
589
126
133
Coe
ffici
ent
0.56
0.56
0.55
0.57
Coe
ffici
ent
Coe
ffici
ent
Coe
ffici
ent
(1)
(2)
(3)
(4)
FE, 2
-Sta
geFE
, 2-S
tage
FEFE
, 2-S
tage
3. T
he e
stim
ated
like
lihoo
d of
rece
ivin
g IM
F re
sour
ces.
Var
iabl
es e
xclu
de th
ose
used
in th
e pr
imar
y m
odel
or l
ikel
y to
affe
ct e
cono
mic
gov
erna
nce
dire
ctly
(bas
ed o
n pr
evio
us st
udie
s).
4. T
he e
stim
ated
like
lihoo
d of
rece
ivin
g W
orld
Ban
k re
sour
ces w
ith d
eter
min
ants
sign
ifica
nt a
t lea
st a
t the
10
perc
ent l
evel
.
2. T
he e
stim
ated
like
lihoo
d of
rece
ivin
g IM
F re
sour
ces w
ith d
eter
min
ants
sign
ifica
nt a
t lea
st a
t the
10
perc
ent l
evel
.
126
29
References
Abed, George T., and Hamid R. Davoodi, 2002, “Corruption, Structural Reforms, and Economic Performance in the Transition Economies,” in Governance, Corruption and Economic Performance, ed. by George Abed and Sanjeev Gupta (Washington: International Monetary Fund).
Ades, Alberto Ades, and Rafael Di Tella, 1999, “Rents, Competition, and Corruption,” American Economic Review, Vol. 89, No. 4, pp. 982–93.
__________, 1994, “Competition and Corruption,” Institute of Economics and Statistics Discussion Papers 169 (Oxford, United Kingdom: Oxford University).
Al-Marhubi, Fahim, 2004, “The Determinants of Governance: A Cross-Country Analysis.” Contemporary Economic Policy, Vol. 22, issue 3, pp. 394–406.
Alesina, Alberto, and Beatrice Weder, 1999, “Do Corrupt Governments Receive Less Foreign Aid?” NBER Working Papers 7108 (Cambridge, MA: National Bureau of Economic Research, Inc.)
Atoyan, R., and P. Conway, 2005, “Evaluating the Impact of IMF Programs: A Comparison of Matching and Instrumental-Variable Estimators,” Review of International Organizations, Vol. 1, No. 2, pp. 99–124.
Bräutigam, Deborah A. and Stephen Knack, 2004, “Foreign Aid, Institutions, and Governance in Sub-Saharan Africa,” Economic Development and Cultural Change, 2004, Vol. 52, pages 255–285.
Bagci, P., and W. Perraudin, 1997, “Do IMF Programs Work?” Global Economic Institutions Working Paper (London: Economic and Social Research Council).
Barro, Robert J., and Jong-Wha Lee, 2005, “IMF-Programs: Who Is Chosen and What Are the Effects?” Journal of Monetary Economics, Vol. 52, pp. 1245–69.
Bird, G., and D. Rowlands, 2001, “IMF Lending: How Is It Affected by Economic, Political, and Institutional Factors?” Policy Reform, Vol. 4, pp. 243–70.
Boockmann, Bernhard, and Axel Dreher, 2003, “The Contribution of the IMF and the World Bank to Economic Freedom,” European Journal of Political Economy, Vol. 19, pp. 633–649.
Brunetti, Aymo, and Beatrice Weder, 1998, “Investment and Institutional Uncertainty: A Comparative Study of Different Uncertainty Measures,” World Bank Technical Paper (Washington: World Bank).
Cerruti, Eugenio, 2007, “IMF Drawing Programs: Participation Determinants and Forecasting,” IMF Working Paper 07/152 (Washington: International Monetary Fund).
Chong, Alberto, and Luisa Zanforlin, 2000, “Law, Tradition and Institutional Quality: Some Empirical Evidence,” Journal of International Development, Vol. 12, No. 8, pp. 1057–68.

30
Ciocchini, Francisco, Erik Durbin, and David T.C. Ng, 2003, “Does Corruption Increase Emerging Market Bonds Spread?” Journal of Economics and Business, Vol. 55, pp. 503–28.
Conway, P., 1994, “IMF Lending Programs: Participation and Impact,” Journal of Development Economics, vol. 45, pp. 365–91.
Dreher, Axel, 2004, “IMF and Economic Growth: The Effects of Programs, Loans, and Compliance with Conditionality,” International Finance 0404004, EconWPA, revised 25 Apr 2004.
__________, and Magdalena Ramada-Sarasola, 2006, “The Impact of International Organizations on the Environment: An Empirical Analysis,” Working Paper 06-131, (Zurich: KOF Swiss Economic Institute.
Dicks-Mireaux, L., M. Mecagni, and S. Schdler, 2000, “Evaluating the Effect of IMF Lending to Low-Income Countries,” Journal of Development Economics, Vol. 61 (April), pp. 495–525.
Fisman, Raymond J., and Shang-Jin Wei, 2007, “The Smuggling of Art, and the Art of Smuggling: Uncovering the Illicit Trade in Cultural Property and Antiques” NBER Working Paper No. W13446 (Cambridge, MA: National Bureau of Economic Research).
Ghura, Dhaneshwar, 1998, “Tax Revenue in Sub-Saharan Africa: Effects of Economic Policies and Corruption”, IMF Working Paper 98/135 (Washington: International Monetary Fund).
Goldstein, M., and P. Montiel, 1986, “Evaluating Fund Stabilization Programs with Multicountry Data: Some Methodological Pitfalls,” IMF Staff Papers, Vol. 33 (June), pp. 304–44.
Gyimah-Brempong, Kwabena, 2002, “Corruption, Economic Growth, and Income Inequality in Africa,” Economics of Governance, Vol. 3, No. 3, pp. 183–209.
Gylfason, T., 1987, “Credit Policy and Economic Activity in Developing Countries with IMF Stabilization Programs,” Princeton Studies in International Finance, Vol. 60.
Gupta, Sanjeev, Robert Powell, and Yongzheng Yang, 2005, “The Macroeconomic Challenges of Scaling Up Aid to Africa” (September 2005), IMF Working Paper No. 05/179 (Washington: International Monetary Fund).
Hall, Robert, and Charles I. Jones, 1999, “Why Do Some Countries Produce So Much More Output Per Worker Than Others?” Quarterly Journal of Economies, Vol. 114, iss. 1, pp. 83-116.
Haque, Il Nadeem, and Mohsin S. Khan, 1998, “Do IMF-Supported Program Work?” A Survey of the Cross-Country Empirical Evidence,” IMF Working Paper 98/169 (Washington: International Monetary Fund).
International Financial Institutions Advisory Commission, 2000, Meltzer Commission Report (Washington: US Congress).

31
Islam, Roumeen, and Claudia Montenegro, 2002, “What Determines the Quality of Institutions?” World Bank Policy Research Working Paper (Washington: World Bank).
Kapur, Devesh, and Richard Webb. 2000, “Governance-Related Conditionalities of the International Financial Institutions” (New York and Geneva: UNCTAD, G-24 Discussion Paper Series 6).
Kaufmann, Daniel, Aart Kraay, and Pablo Zoido-Lobaton, 1999, “Governance Matters,” World Bank Working Paper No. 2196, (Washington: World Bank).
Kaufmann, Daniel, Aart Kraay, and Massimo Mastruzzi, 2004, “Governance Matters III: Governance Indicators for 1996–2002,” World Bank Working Paper (Washington: World Bank).
__________, 2005, “Governance Matters IV: Governance Indicators for 1996–2004,” World Bank Working Paper (Washington: World Bank).
__________, 2007, “Governance Matters VI: Governance Indicators for 1996–2006,” World Bank Policy Research Working Paper No. 4280 (Washington: World Bank)
Killick, T., M. Malik, and M. Manuel, 1995, “What Can We Know About the Effects of IMF Programmes?” World Economy, Vol. 15 (September), pp. 575–97.
Knack, Stephen, and Philip Keefer, 1995, “Institutions and Economic Performance: Cross-Country Tests Using Alternative Institutional Measures,” Economics and Politics, Vol. 7, pp. 207–27.
Knack, Stephen, and Omar Azfar, 2000, “Are Larger Countries Really More Corrupt? Sample Selection, Country Size and the Quality of Governance” (unpublished, Washington: World Bank, and College Park: IRIS, University of Maryland).
Knight, M., and J. Santaella (1997), “Economic Determinants of IMF Financial Arrangements,” Journal of Development Economics, Vol. 54, pp. 495–526.
Laffont, Jean-Jacques, and Tchetche N'Guessan, 1999, “Competition and Corruption in an Agency Relationship,” Journal of Development Economics, Vol. 60, pp. 271–95.
Lambsforff J., 2003, “How Corruption Affects Productivity,” Kyklos, Vol. 56, pp. 457–74.
Leite, Carlos, and Jens Weidemann, 1999, “Does Mother Nature Corrupt? Natural Resources, Corruption, and Economic Growth,” IMF Working Paper 99/85, (Washington: International Monetary Fund).
Loxley, John, 1984, “The IMF and the Poorest Countries” (Ottawa, Canada: North-South Institute).
Mauro, Paolo, 1995, “Corruption and Growth,” Quarterly Journal of Economics, Vol. 110, pp. 681–712.
__________, 1997, “The Effect of Corruption on Growth, Investment, and Government Expenditure: A Cross-Country Analysis,” Corruption and the Global Economy, pp. 83–107.

32
Mocan, H. and H. Naci, 2004, “What Determines Corruption? International Evidence from Micro Data” NBER Working Paper No. W10460 (Cambridge, MA: National Bureau of Economic Research).
Montinola, Gabriella, and Robert Jackman, 2002, “Sources of Corruption: A Cross-Country Study,” British Journal of Political Science, Vol. 32, pp. 147-70.
Mo, Pak Hung, 2001, “Corruption and Economic Growth,” Journal of Comparative Economics, Vol. 29, pp. 66–79.
Pastor, Manuel, Jr., 1987, “The Effects of IMF Programs in the Third World: Debate and Evidence from Latin America,” World Development, Vol. 15 (February ), pp. 249–62.
Poirson, Helene, 1998, “Economic Security, Private Investment, and Growth in Developing Countries,” IMF Working Paper 98/4 (Washington: International Monetary Fund)
Schadler, S., F. Rozwadowski, S. Tiwari, and D. Robinson, 1993, “Economic Adjustment in Low-Income Countries—Experience Under the Enhanced Structural Adjustment Facility,” IMF Occasional Paper 106 (Washington: International Monetary Fund).
Sturm, Jan-Egbert, Berger, Helge and Jakob de Haan, 2005, “Which Variables Explain Decision on IMF Credit? An Extreme Bounds Analysis, Economics & Politics, 17, 2, 177-213.
Schadler, S., F. Rozwadowski, S. Tiwari, and D. Robinson, 1993, “Economic Adjustment in Low-Income Countries—Experience Under the Enhanced Structural Adjustment Facility,” IMF Occasional Paper 106 (Washington: International Monetary Fund).
Stiglitz, Joseph. 1999. “The World Bank at the Millennium,” The Economic Journal, Vol. 109 (November).
Svensson, Jacob, 2000, “Foreign Aid and Rent-Seeking,” Journal of International Economics, Vol. 51, No. 2, pp. 437–61.
Treisman, D., 2000, “The Causes of Corruption: A Cross-National Study,” Journal of Public Economics, Vol. 76, pp. 399–457.
Vreelans, J. R., 2004, “Institutional Determinants of IMF Arrangements,” Global Fellows Working Paper (Los Angeles: UCLA).
Wei, Shang-Lin, 2000, “Natural Openness and Good Government,” NBER Working Paper 7765 (Cambridge, MA: National Bureau of Economic Research).


![The Future of Global Economic Governance and the IMF ... · (Intergovernmental Group of Twenty-Four [G-24]), Thomas Krueger (IMF Finance Department) and Robert Heinbücher (Deutsche](https://img.dokumen.tips/doc/110x75/5e8beba072781f3fd4292b80/the-future-of-global-economic-governance-and-the-imf-intergovernmental-group.jpg)


