Embed Size (px)
Citation preview
Faculty of Natural Resources and
Agricultural Sciences
DNA based analyses of microbiota in
fat fraction of raw milk
DNA- baserad analys av mikrobiota i råmjölkens
fettfraktion
Caroline Blänning
Department of Molecular Sciences
Master´s thesis • 30 hec • Second cycle, A2E
Agriculture Programme - Food Science
Molecular Sciences, 2017:9
Uppsala 2017

DNA based analyses of microbiota in fat fraction of raw milk DNA- baserad analys av mikrobiota i råmjölkens fettfraktion
Caroline Blänning
Supervisor: Monika Johansson, Swedish University of Agricultural
Sciences, Department of Molecular Sciences
Assistant Supervisor: Li Sun, Swedish University of Agricultural Sciences,
Department of Molecular Sciences
Examiner: Åse Lundh, Swedish University of Agricultural Sciences,
Department of Molecular Sciences
Credits: 30 hec
Level: Second cycle, A2E
Course title: Independent project/degree project in Food Science - Master's thesis
Course code: EX0425
Programme/education: Agriculture Programme - Food Science
Place of publication: Uppsala
Year of publication: 2017
Title of series: Molecular Sciences
Part number: 2017:9
Online publication: http://stud.epsilon.slu.se
Keywords: Raw milk, microbiota, whole milk, DNA T-RFLP, PCR
Sveriges lantbruksuniversitet
Swedish University of Agricultural Sciences
Faculty of Natural Resources and Agricultural Sciences
Department of Molecular Sciences

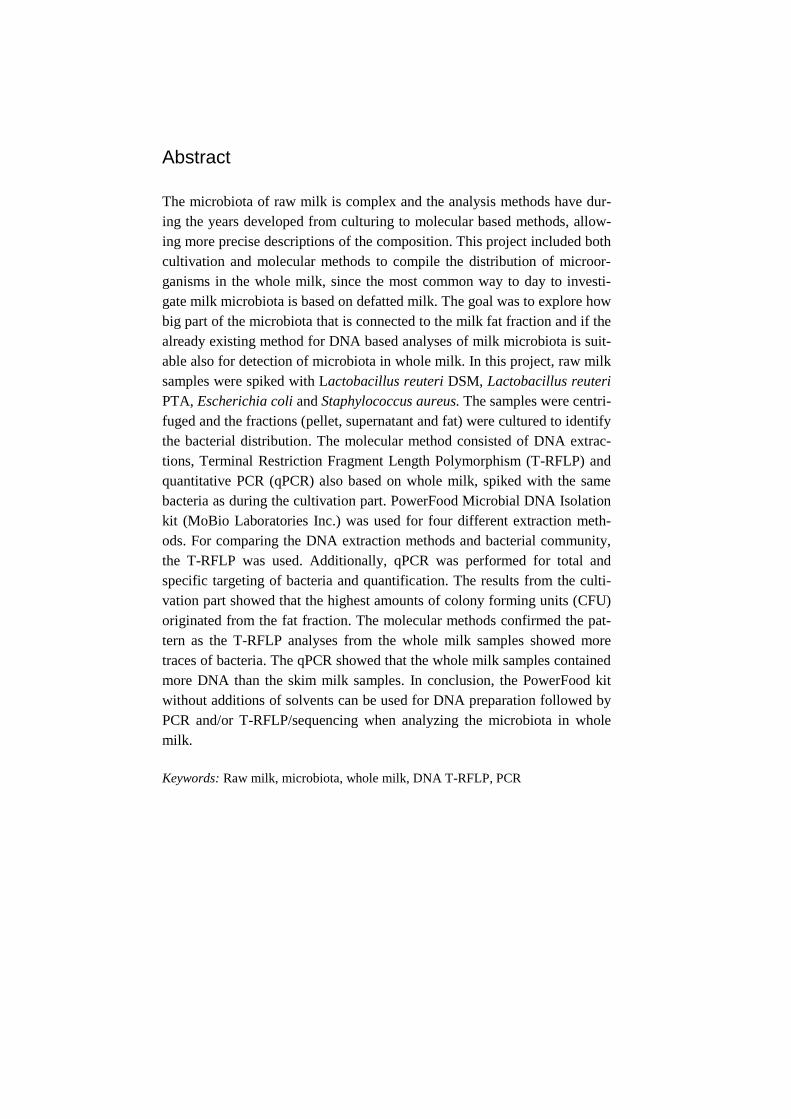
Abstract
The microbiota of raw milk is complex and the analysis methods have dur-
ing the years developed from culturing to molecular based methods, allow-
ing more precise descriptions of the composition. This project included both
cultivation and molecular methods to compile the distribution of microor-
ganisms in the whole milk, since the most common way to day to investi-
gate milk microbiota is based on defatted milk. The goal was to explore how
big part of the microbiota that is connected to the milk fat fraction and if the
already existing method for DNA based analyses of milk microbiota is suit-
able also for detection of microbiota in whole milk. In this project, raw milk
samples were spiked with Lactobacillus reuteri DSM, Lactobacillus reuteri
PTA, Escherichia coli and Staphylococcus aureus. The samples were centri-
fuged and the fractions (pellet, supernatant and fat) were cultured to identify
the bacterial distribution. The molecular method consisted of DNA extrac-
tions, Terminal Restriction Fragment Length Polymorphism (T-RFLP) and
quantitative PCR (qPCR) also based on whole milk, spiked with the same
bacteria as during the cultivation part. PowerFood Microbial DNA Isolation
kit (MoBio Laboratories Inc.) was used for four different extraction meth-
ods. For comparing the DNA extraction methods and bacterial community,
the T-RFLP was used. Additionally, qPCR was performed for total and
specific targeting of bacteria and quantification. The results from the culti-
vation part showed that the highest amounts of colony forming units (CFU)
originated from the fat fraction. The molecular methods confirmed the pat-
tern as the T-RFLP analyses from the whole milk samples showed more
traces of bacteria. The qPCR showed that the whole milk samples contained
more DNA than the skim milk samples. In conclusion, the PowerFood kit
without additions of solvents can be used for DNA preparation followed by
PCR and/or T-RFLP/sequencing when analyzing the microbiota in whole
milk.
Keywords: Raw milk, microbiota, whole milk, DNA T-RFLP, PCR

Sammanfattning
Mjölkråvarans mikrobiota är komplex och genom åren har analysmetoderna
utvecklats från odling på agarplattor till molekylära metoder, vilket resulte-
rat i en tydligare bild av de förekommande bakterierna. Detta projekt har
inkluderat både odling och molekylära metoder för att jämföra distribution-
en av bakterier i helmjölk, eftersom dagens analyser är baserade på avfettad
mjölk. Syftet med detta projekt är att undersöka hur stor del av mikrobiotan
som binder till fettet och om befintliga metoder för DNA-analyser av mjölk
även går att applicera för analyser av mjölkfettets mikrobiota. Första delen
av projektet innebar att undersöka hur bakterierna fördelades i pellet-,
supernatant- eller fettfraktionerna efter centrifugering. Detta gjordes genom
att inokulera mjölkprover separat med Lactobacillus reuteri DSM, Lacto-
bacillus reuteri PTA, Escherichia coli and Stafylococcus aureus och däref-
ter gjordes spädningar som odlades på selektiva agarplattor. Nästa del best-
od av DNA-extrahering med hjälp av PowerFood Microbial DNA Isolation
kit (MoBio Laboratories Inc.) med några avvikelser from tillverkarens pro-
tokoll, vilket resulterade i fyra metoder. Tre av dessa användes för vidare
analys med metoden Terminal Restriction Fragment Length Polymorphism
(T-RFLP) för att jämföra mikrobiotan i proverna och om det förekom fler
typer av bakterier i helmjölkproverna. För undersökning av de specifika
bakterierna och kvantifiering av dem utfördes även kvantitativ PCR (qPCR).
Odlingen på agarplattorna resulterade i att flest kolonibildande enheter
(CFU) bildades från fettfraktionerna, vilket betyder att mjölkfettet innehål-
ler en stor del bakterier som annars kan förbises vid analyser då avfettad
mjölk används. För T-RFLP analysen visade det sig att det inte var någon
större skillnad i extraheringsmetoderna, men vid analys med metoder base-
rade på helmjölk tenderade proverna att innehålla högre antal bakterier.
Som slutsats kan det konstateras att PowerFood kittet går att använda utan
att ursprungsprotokollet modifieras för DNA-isolering, PCR och T-
RFLP/sekvensering för att analysera bakterier även i helmjölk.
Nyckelord: Mjölkråvara, mikrobiota, helmjölk, DNA, T-RFLP, PCR

Table of contents
List of Tables 6
List of Figures 7
Abbreviations 9
1 Introduction 10 1.1 Aim 10
2 Literature review 11
2.1 Composition of milk 11 2.2 Milk fat 11 2.3 Microbiota in milk 12 2.4 Microbiota and its impact on cheeses 13 2.5 Methods and problems for detecting microbes in milk 14 2.6 Polymerase chain reaction (PCR) methods 15 2.7 Terminal restriction fragment length polymorphism (T-RFLP) 16
3 Materials and methods 18 3.1 Milk samples 18 3.2 Bacteria and strains 18 3.3 Growth mediums and solutions 19
3.3.1 Broths 19
3.3.2 Agar plates 19 3.3.3 Saline solution 19
3.4 Culturing of bacteria 19
3.4.1 Overnight cultures and bacteria calculations 19 3.4.2 Culturing on agar plates 19
3.5 PCR amplification and T-RFLP 20 3.5.1 Sample preparation 20 3.5.2 DNA extraction 20 3.5.3 PCR 22 3.5.4 PCR purification 23 3.5.5 Digestion of PCR product 23 3.5.6 T-RFLP 24
3.6 qPCR 24

4 Results 26
4.1 Culturing of bacteria 26 4.2 DNA extraction and concentration 27
4.2.1 Gel electrophoresis 29 4.3 T-RFLP 31 4.4 qPCR 34
5 Discussion 36 5.1 Culturing of bacteria 36 5.2 DNA extraction 38 5.3 T-RFLP 39 5.4 qPCR 40 5.5 Conclusion 41
Acknowledgements 42
References 43
Appendix 1. Culture controls of unspiked milk 46
Appendix 2. Popular summary 47
6
List of Tables
Table 1. General bacterial primers used for PCR amplification 22
Table 2. Primers used for the qPCR amplification. 25 Table 3. Colony distribution in the milk fractions (fat, supernatant, pellet) of the four
bacteria species detected on selective agar plates 26 Table 4. Fat fraction (mg) and amounts of spiked bacteria in 5 ml milk 27 Table 5. Results from culturing unspiked milk on agar plates used for the tested
bacterium species. Controls for LAB were spread on MRS, S. aureus on
MS and E.coli on VRB 46 Table 6. Results from culturing the broths containing the bacteria on agar plates.
LAB were spread on MRS, S. aureus on MS and E.coli on VRB 46
7
List of Figures
Figure 1. The percentage of bacteria colonies originating from different fractions
after culturing on agar plats. The results are based on milk samples spiked
with 105 bacteria cells. Number of colony forming units (CFU) of each
fraction is indicated in the bars. 27 Figure 2. DNA concentrations based on three different methods (A, B and n-A) in the
spiked milk samples. 28 Figure 3. The DNA concentration in the milk controls. CA = control for method A, CB
= control for method B and n-CA = control for method n-A. 29 Figure 4. Gel electrophoresis showing products after DNA purification. 5 μl from
purified PCR sample is loaded and GeneRuler 1 kb Plus DNA ladder is
used in every of the 1th well. The products are between 1000 and 700 BP.
(A): well 2-7: samples with E. coli and wells 8-13: controls. (C): well 2-7:
samples with L. reuteri DSM, well 8-13: controls and a negative control, K
(well 14). (B): wells 2-7: samples with S. aureus, wells 8 and 9: controls
only for n-A method. (D): wells 2-7: samples with L. reuteri PTA, wells 8
and 9: controls only for n-A method, well 10: negative control. 30
Figure 5. Gel electrophoresis showing the results after digestion with restriction
enzymes. The gels were loaded with GeneRuler1 kb Plus DNA ladder in
every of the first well and loaded with 5 μl from each purified PCR sample.
Bands from samples were between lanes of 700 and 300 BP. (A) and (C):
gel loaded with samples from, E. coli, L. reuteri DSM, S. aureus and
controls but the gel is probably contaminated. (B): well 2-3: controls for n-A
method, well 4-9 samples with L. reuteri PTA, well 10-11: controls only for
n-A method. 30
Figure 6. T-RFLP results based on three different methods (A, B, n-A) from the
samples spiked with L. reuteri DSM. 31 Figure 7. T-RFLP results based on three different methods (A, B, n-A) from the
samples spiked with S. aureus. 32
Figure 8. T-RFLP results based on three different methods (A, B, n-A) from the
samples spiked with L. reuteri PTA. 32 Figure 9. T-RFLP results based on three different methods (A, B, n-A) from the
samples spiked with E. coli. 33 Figure 10. The results for controls based on three different methods (A, B, n-A) of
the T-RFLP. 33
Figure 11. Mean values of the spiked bacteria obtained after three different
extraction methods (A,B and n-A), using primers for each specific
bacterium. 35 Figure 12. Mean values of the controls and spiked bacteria obtained after three
different extraction methods (A, B and n-A). 35

8

9
Abbreviations
BHI Brain heart infusion
BP Base pair
CFU Colony forming units
LAB Lactic acid bacteria
MRS de Man Ragosa Sharpe
MS Mannitol salt
NTC No template control (negative control)
PCR Polymerase chain reaction
qPCR Quantity polymerase chain reaction
SC Somatic cells
SLU Swedish University of Agricultural Sciences
SSU Small subunit
T-RF Terminal restriction fragment
T-RFLP Terminal restriction fragment length polymorphism
VRB Violet red bile

10
1 Introduction Milk is tested on daily bases worldwide to verify good quality and safe milk for
consumption and further processing (Rodrigues et al., 2017). Since the 1990s,
bulk tank milk has been used to diagnose problems in dairy herds related to quali-
ty and mastitis (Jayarao et al., 2004). There are many factors that influence the
milk and the composition of microbiota is in turn directly influencing the subse-
quent development of dairy products (Quingley, et al., 2013b). Through the years,
many methods have been established for different milk analyses and in recent
years, DNA based methods have become an important tool for microbial food
constituents. However, since milk is a complex media, it makes it difficult to ana-
lyze in order to get a high quantity and quality of DNA. PCR inhibitors like fat,
protein and calcium reduce the ability to generate a successful amplification of the
DNA. A usual step in these molecular based methods is discarding the fat fraction
during DNA extraction. This can result in underestimation of bacteria, partitioned
in the fat fraction, or that they will not be detected at all (Quingley, et al., 2012;
Poms, Glössl & Foissy, 2001). Since these existing methods used for analysing
microbiota in milk are based on defatted sample, there is still room for
improvement for methods analysing the microbiota in whole milk samples.
This thesis is a part of a big on-going survey where the overall objective is to
increase the long-term profitability of the Swedish dairy sector by improving
quality management in the dairy value chain.
1.1 Aim
The aim of this project is to explore the proportion of the microbiota associated to
the milk fat fraction and if the already existing method for DNA based analyses of
milk microbiota is suitable also for detection of microbiota in whole milk.

11
2 Literature review
2.1 Composition of milk
Milk is a highly nutritious food and includes all the nutrients in a good balance
that newborns need; proteins, fats, carbohydrates, vitamins and minerals. The pH
of milk is near neutral and at a high water activity and in combination with all the
nutrients it makes an ideal environment for microorganisms (Quigley et al., 2013;
Smoczynski, Staniewski & Kielczewska, 2012). Bovine milk consists of water
(87%), lactose (4.6%), protein (3.4%), fat (4.2%), minerals (0.8%) and vitamins
(0.1%). The composition is influenced by factors like breed, feeding strategies,
management of the cow, lactation stage and seasonal changes. Since these factors
can vary between farmers and the facts that there is always on going development
for e.g. feed, milk composition continuously undergoes changes (Lindmark Måns-
son, 2008). According to FAO (2013), milk can for example be classified accord-
ing to its fat content: whole milk, skimmed milk, semi-skimmed milk, low-fat
milk and standardized milk etc. Processing of the milk is another kind of classifi-
cation, like pasteurized and extended shelf-life milk. FAOSTAT definition (FAO,
2013) for skim milk of cows is “milk from which most of the fat has been re-
moved” and the definition for whole milk is:
”Cow milk, whole, fresh: Production data refer to raw milk containing all its
constituents. Trade data normally cover milk from any animal, and refer to
milk that is not concentrated, pasteurized, sterilized or other-wise preserved,
homogenized or peptonized.”
2.2 Milk fat
Milk is produced in the mammary gland of mammals and the fat consists of lipids
present in fat globules. These are formed at the endoplasmatic reticulum located in
12
the epithelial cells in the alveoli. During the secretion, they are enveloped by the
plasma membrane of the cell, so that each fat globule contains residues from it.
The composition and structure of the membrane is mainly composed of polar li-
pids and membrane-bound and associated proteins. The lipid fraction of mem-
brane material in the dry matter constitutes of 30% where 25% consist of phospho-
lipids, 3% of cerebrosides and 2% of cholesterol (Lindmark Månsson, 2008;
Smoczynski, Staniewski & Kielczewska, 2012).
For processes and analyses, fat is often separated from milk through centri-
fugation, based on differences in density between the fat particles and the dispers-
ing phase or plasma. Since fat has lower density than plasma it will form a layer
on the top during centrifugation that can be removed. Other particles like dirt par-
ticles, somatic cells (SC) and microorganisms, will also be removed during the
centrifugation. Moreover, the fat globules readily agglutinates at lower tempera-
tures and even more so in raw milk than in homogenized milk, since the fat glob-
ules exist in more diverse sizes in raw milk. In cold agglutination, also SC and
several bacteria readily participate. At 37°C, no agglutination occurs but with
temperatures falling below 35°C, an increasing number of cells will be lost within
the cream fraction with declining temperature (Walstra, Wouters & Geurts, 2006;
Griffiths, 2010).
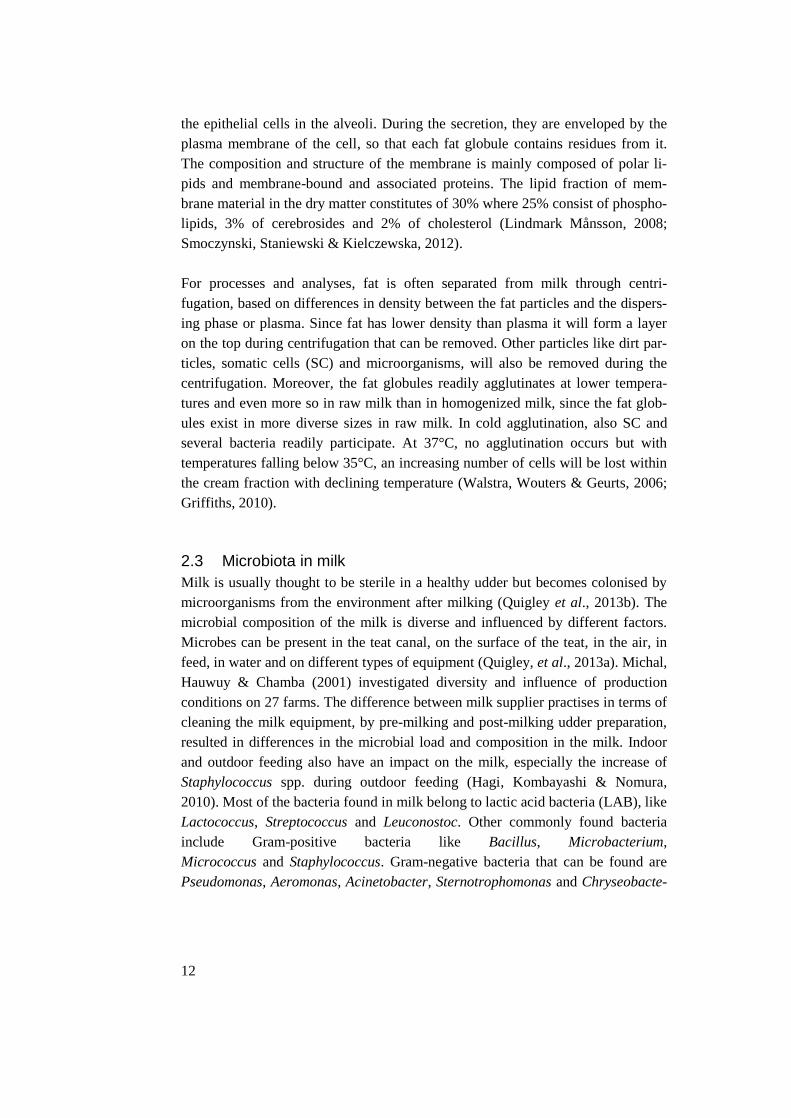
2.3 Microbiota in milk
Milk is usually thought to be sterile in a healthy udder but becomes colonised by
microorganisms from the environment after milking (Quigley et al., 2013b). The
microbial composition of the milk is diverse and influenced by different factors.
Microbes can be present in the teat canal, on the surface of the teat, in the air, in
feed, in water and on different types of equipment (Quigley, et al., 2013a). Michal,
Hauwuy & Chamba (2001) investigated diversity and influence of production
conditions on 27 farms. The difference between milk supplier practises in terms of
cleaning the milk equipment, by pre-milking and post-milking udder preparation,
resulted in differences in the microbial load and composition in the milk. Indoor
and outdoor feeding also have an impact on the milk, especially the increase of
Staphylococcus spp. during outdoor feeding (Hagi, Kombayashi & Nomura,
2010). Most of the bacteria found in milk belong to lactic acid bacteria (LAB), like
Lactococcus, Streptococcus and Leuconostoc. Other commonly found bacteria
include Gram-positive bacteria like Bacillus, Microbacterium,
Micrococcus and Staphylococcus. Gram-negative bacteria that can be found are
Pseudomonas, Aeromonas, Acinetobacter, Sternotrophomonas and Chryseobacte-
13
rium as well as some Enterobacteriaceae such as Enterobacter, Hafnia and
Klebsiella (von Neubeck et al., 2015). However, the research on raw milk micro-
biota has mainly been focusing on pathogens and therefore is the knowledge about
the natural occurring microbiota in raw milk still limited (Fricker et al. 2011).
In addition to all the nutrients in milk, SC are also natural presented components.
They mainly consist of milk-secreting epithelial cells and white blood cells, and
are used as a measure of the milk quality and the state of udder health, since it is
involved in the innate immune system. High number of SC is associated with ud-
der inflammation and leads to bacteriological problems. Therefore, alteration of
milk composition leads to major variation of dairy products characteristics com-
pared to normal values. In healthy quarters of dairy cows the somatic cell count in
1 ml is 2 104 to 2 105 and in an infected quarter it ranges from 3 105 to 9
107 cells/ml. Levels above 4 105 is considered to be unfit for human consump-
tion (Pokorska, 2016; Usman et al., 2014; Li et al., 2014).
A heating process, i.e. pasteurization is used for elimination of pathogens in the
raw milk and for eliminating a large proportion of potential spoilage
organisms. However, thermoduric organisms like spore formers and some gram-
positive vegetative species in the genera Enterococcus, Microbacterium and Ar-
throbacter can survive pasteurization (Adams & Moss, 2008) and can therefore
influence a product in a negative manner.
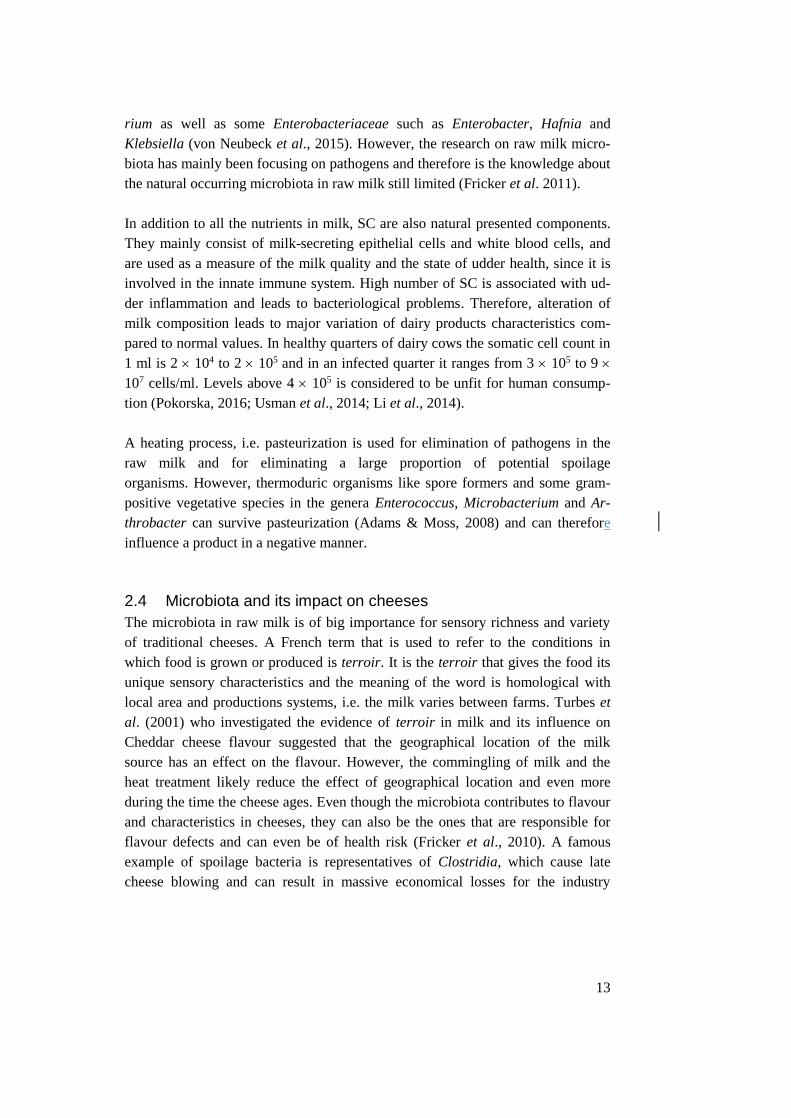
2.4 Microbiota and its impact on cheeses
The microbiota in raw milk is of big importance for sensory richness and variety
of traditional cheeses. A French term that is used to refer to the conditions in
which food is grown or produced is terroir. It is the terroir that gives the food its
unique sensory characteristics and the meaning of the word is homological with
local area and productions systems, i.e. the milk varies between farms. Turbes et
al. (2001) who investigated the evidence of terroir in milk and its influence on
Cheddar cheese flavour suggested that the geographical location of the milk
source has an effect on the flavour. However, the commingling of milk and the
heat treatment likely reduce the effect of geographical location and even more
during the time the cheese ages. Even though the microbiota contributes to flavour
and characteristics in cheeses, they can also be the ones that are responsible for
flavour defects and can even be of health risk (Fricker et al., 2010). A famous
example of spoilage bacteria is representatives of Clostridia, which cause late
cheese blowing and can result in massive economical losses for the industry
14
(Quigley et al., 2011). Coliforms and yeasts can also cause gas formation and Ba-
cillus spores and Pseudomonas species can produce proteolytic and lipolytic en-
zymes that mainly affect hard and semi-hard cheeses. Staphylococcus aureus, a
pathogenic bacterium, can also contaminate milk. The variety of microorganisms
is an important factor, which the cheese-maker has to contend (Griffiths, 2010).
2.5 Methods and problems for detecting microbes in milk
Testing of the microbiological status of both raw and pasteurized milk occurs on a
daily basis with different methods in order to maintain quality and safe products.
Many of the techniques that have been used for identifying and quantification
involve culturing on agar plates, which makes bacteria not easily cultured hard to
detect or not detected at all. More recently, DNA based methods have been used
for the purpose, since it is a way to examine the bacteria without introducing cul-
tured-based biases (Quigley et al., 2012). Despite the positive aspects of DNA
methods, there are also negative ones. They can over- or underestimate specific
bacterial groups due to certain biases caused by different levels of DNA extraction
efficiencies, preferential PCR amplification of certain species or interspecies 16S
rRNA operon copy number heterogeneity (Fricker et al. 2011). DNA based
methods also detect dead cells and extracellular DNA, e.g. DNA from SC (Weber
et al., 2014). According to Fricker et al. (2011), a combination of the two types of
methods are preferred for more accurate results on the microflora of the raw milk
due to the benefits and disadvantages of both of them.
Unfortunately, due to the milk fat, milk is a difficult source for extracting high
quality and quantity DNA. The fat and protein play roles as inhibitors and interfere
with most of the DNA extraction methods (Usman et al., 2014; Mertens et al.,
2014). Phenol-chloroform is a classical extraction method, which has been used
for DNA extraction from different tissues, but today there are also several kits
used; Nucleospin Blood, modified TianGen, PowerFood, MasterPure Gram Posi-
tive and UltraClean e.g. (Usman et al. 2014; Rodrigues et al. 2017; Thomas et al.,
2013). The problem to obtain high quantity and quality genomic DNA from milk
still exists, but through the years, the analyses have improved and with extraction
kits the extracted DNA amounts have increased (Usman et al. 2014). The kits that
are used for DNA extraction though are often designed for extractions from pure
cultures with highly concentrated cells and are not necessarily optimized for sce-
narios requiring high sensitivity (Thomas et al., 2013). Even though milk
analyses are performed as routines in the dairy industry, fat and proteins is still a

15
problem for high quantity and quality DNA and there is still not a kit that is
optimized for DNA extractions from milk (Usman et al. 2014).
The extraction methods normally start with cell disruption by chemical or physical
methods and thereafter separation of membrane lipids and cell debris using deter-
gents and centrifugation (Mertens et al., 2014). After centrifugation, the superna-
tants are discarded. In the protocol followed with the PowerFood kit, used in this
project, it is also specially mentioned to remove as much fat as possible. By dis-
carding the supernatant and fat, however, there is loss of bacteria. In fact, it has
been known for long time that high proportions of bacteria exist in the milk fat
fraction (Anderson, 1909). Nevertheless, there seems to be researchers that are
unaware of this and therefore also the effect of removing the fat fraction on assay
sensitivity. According to Poms, Glössl & Foissy (2001), free DNA is in fact also
in the highest concentration in the cream layer. By discarding the fat layer during
extraction procedures, there can be a great loss of DNA and this could be of signif-
icant importance if there are small amounts of target DNA present in the sample.
Brewster & Moushumi (2016) investigated the recovery of bacteria in pellet after
centrifugation, which in raw milk with spiked bacteria was only 2.2-6.1%. In ho-
mogenized and pasteurized samples however, there were much higher recoveries,
with average values between 52.2-100%. The partitioning of bacteria was also
very rapid; 80% of added inoculated bacteria partitioned into the cream layer with-
in 5 minutes and over 95% partitioned after 45 minutes. Furthermore, the cream
layer also exhibited a high capacity for bacteria, reaching half-saturation at a bac-
terial load of ca 5×10⁸ CFU/ml. It would therefore require very high levels of non-
target bacteria to saturate the cream layer and fully release the target bacterium for
centrifugal recovery. The binding mechanism of bacteria to milk fat is mainly due
to antibody-mediated binding, but there are also other mechanisms suggested, like
hydrophobic, lectin-sugar and lymphocyte mediated mechanisms (Brewster &
Paul 2016).
2.6 Polymerase chain reaction (PCR) methods
Polymerase chain reaction (PCR) is a rapid, sensitive and specific molecular
method. The 16s rRNA gene (16srDNA) has frequently been used as a target due
to its structural characteristics. Through evolution, some parts of the sequences of
16sr DNA have been highly conserved, which therefore can be used for all bacte-
rial species. Regions that have species-specific variable sequences can in turn be
used for identification of unique bacterial species (Maeda et al., 2003).

16
Another version of PCR is quantitative PCR (qPCR), also called Real-time PCR.
It is also a fast method, has a high sensitivity and specificity, low contamination
risk and is easy to perform (Wang et al., 2014). As the name reveals, qPCR is a
quantitative method and makes it possible to determine the amount of bacteria,
both of specific and unspecific bacteria depending on what the target is. To be able
to quantify them, there must be a standard curve for every run, with known
amounts of DNA in a number of dilutions. As the PCR products (also called
amplicons) increase exponentially, a signal of fluorescence is obtained after every
cycle, caused by a fluorescent-labelled probe that binds to DNA. The increase of
fluorescence is plotted against the cycle number and generates an amplification
curve, from which a quantification cycle (Cq) value can be determined. This value
can in turn be linked to the initial concentration of the target nucleic acid. qPCR
has become a method of choice when quantifying genes (Postollec et al., 2011).
PCR inhibitors like fat, enzymes and minerals have been identified in milk. Ac-
cording to Bickley et al. (1996) however, fat have only minor influence on PCR
and the inhibition is mainly due to the concentration of calcium. Plasmin was sug-
gested by Powell et al. (1994) as a naturally occurring inhibitor in milk that de-
grades Taq polymerase. Due to the importance of removing PCR inhibitors, there
have been a number of techniques developed to overcome this problem, e.g. by the
use of silica columns (Kemp et al., 2006).
2.7 Terminal restriction fragment length polymorphism (T-RFLP)
Terminal restriction fragment length polymorphism (T-RFLP) analysis is a meth-
odology that makes it possible to assess the diversity of a complex mix of bacteria.
The distribution of microorganisms also includes uncultivable organisms and can
be divided into clusters or groups (Andoh et al., 2008). The method is an inexpen-
sive, robust, reproducible and rapid (Parkash et al. 2014). When the technique was
firstly introduced, it was by using the small subunit (SSU) rRNA gene for identifi-
cation, specifically the 16s rRNA gene. The methodology has primarily been used
in analysis of the genetic diversity, change and composition of complex microbio-
ta communities within environmental samples, even though it is also utilized for
marine denitrifiers, ammonia-oxidisers and methanogens among others (Elliot et
al., 2012). The T-RFLP method starts with extraction of DNA. The 16s rRNAs
present in the community are PCR amplified using primers, which can be designed
to be non-discriminating, amplifying almost all 16s rRNAs, or selective, targeting
specific domains or groups. The 5’ primer is fluorescently labelled to tag the prod-
ucts. The products are thereafter digested with restriction enzymes, normally 4-
base cutters, and the digested products obtained are visualised with gel electropho-

17
resis. The output for a given sample will be detected as series of peaks based on
the size and amount of the fragments (Marsh et al., 2000, Andoh et al., 2008).
18
3 Materials and methods The method was divided in two procedures and the first part consisted of cultiva-
tion on selective agar plates. The distribution of four chosen bacteria species
where examined in the three milk fractions after centrifugation; fat, supernatant or
pellet. The second part consisted of the molecular based methods, starting with
DNA extraction. Also for this part, the three milk fractions and the same bacteria
species were used in order to investigate the distribution of microbiota. By using a
commercial kit with some deviations from the instructions of manufacturer’s, dif-
ferent methods were tested to see which one of them resulted in highest yield of
extracted DNA. The steps following DNA extraction were PCR amplification for
T-RFLP analysis and qPCR for identification and quantification of bacteria in the
milk.
3.1 Milk samples
The milk used in this project was whole milk obtained from Lövsta, the
Swedish livestock research centre on the 5th of December 2016. It was stored
in -20°C until use.
3.2 Bacteria and strains
Bacteria used for spiking of milk samples: Staphylococcus aureus ATCC 25923,
Escherichia coli ATCC 25922, Lactobacillus reuteri PTA 4659 (hydrophobic) and
L. reuteri DSM 17938 (hydrophilic).
19
3.3 Growth mediums and solutions
3.3.1 Broths
Broths for overnight cultures of LAB were de Man Rogosa Sharpe (MRS; VWR
Chemicals) and for S. aureus and E. coli Brain heart infusion (BHI; OXOID),
prepared according to the manufacturer´s instructions. The solutions were divided
between four bottles containing 50 ml each. The broth was autoclaved (121°C for
30 min) and stored at 2°C.
3.3.2 Agar plates
Agar plates used for culturing LAB were de Man Rogosa Sharpe MRS (from Na-
tional veterinary institute), E. coli were on Violet red bile (VRB) (OXOID) and S.
aureus on Mannitol salt (MS) (US Biological), prepared according to the manu-
facturer´s instructions.
3.3.3 Saline solution
NaCl solution with the concentration 9 mg/ml was made at a total volume of 500
ml, autoclaved and stored at 2°C.
3.4 Culturing of bacteria
3.4.1 Overnight cultures and bacteria calculations
An overnight culture for each bacterium species was made with 9 ml of broth in-
oculated from a stock that had been stored at -80°C. The culture was incubated for
24 h at 37°C, shaking. Thereafter, a new overnight culture for each bacterium spe-
cies was made by taking 500 μl from the first overnight culture to new tubes con-
taining 5 ml broth, incubated for 24 h at 37°C, shaking. The number of bacteria in
the second overnight culture was calculated using a haemocytometer (Petroff-
Hausser Counting Chamber). Dilutions of the overnight culture were made to
count the bacteria with the equation:
𝐶𝑒𝑙𝑙𝑠 𝑚𝑙 = 𝑛𝑢𝑚𝑏𝑒𝑟 𝑜𝑓 𝑐𝑒𝑙𝑙𝑠 𝑐𝑜𝑢𝑛𝑡𝑒𝑑 × 0.00005 × (1000 × 𝑑𝑖𝑙𝑢𝑡𝑖𝑜𝑛 𝑓𝑎𝑐𝑡𝑜𝑟)⁄
where 0.0005 is the volume of the smallest square of the chamber and 1000 is to
get the amount in ml.
3.4.2 Culturing on agar plates
Frozen whole milk was heated in a water bath at 37°C for 20 minutes. A milk
sample of 5 ml was spiked with approximately 107 bacteria cells. The spiked milk

20
was incubated for one hour at 4°C during shaking. After the cold incubation, 1 ml
of the spiked milk was pipetted to a 1.5 ml eppendorf tube and centrifuged for 4
minutes, 13000 x g at 4°C (EppendorfTM 5424R Microcentrifuge). The fat fraction
was removed to a new eppendorf tube using a spatula. The fat was weighed and
the tube was filled with saline solution to a total volume of 1 ml (equal to 1 g).
Thereafter, the tube was incubated in a water bath at 37°C for 15 minutes to re-
solve the fat. Dilutions were made and the ones with concentration 10-2, 10-4 and
10-6 were spread on agar plates. The serum fraction was removed with a pipette to
a new eppendorf tube. After vortexing, 100 μl was pipetted to a tube with 900 μl
saline solution. Dilutions were made and the ones with concentration 10-2, 10-4 and
10-6 were spread on agar plates. The remaining micelle fraction located in the pel-
let was suspended with 50 μl saline solution. The volume of pellet was measured
by pipetting the total volume and subtracted by 50 (saline solution). The tube was
adjusted to 1 ml with saline solution. Dilutions were made and the ones with
concentration 10-2, 10-4 and 10-6 were spread on agar plates. All plates with LAB
were put in anaerobic jars with Microbiology Anaerocult® A (Merck) and Mikro-
biologie Anaerotest® (Merck) for generation and detection of an anaerobic atmos-
phere.
Controls were made by spreading 100 μl of unspiked whole milk (100) and dilu-
tions with concentration 10-1 and 10-2 were spread on each type of agar plate used
for the four bacteria. Controls of the dilutions 101 and 103 from the overnight cul-
tures (100 μl) were also spread on the four different agar plates.
3.5 PCR amplification and T-RFLP
3.5.1 Sample preparation
Sample preparation was made for each bacterium species by spiking 1.8 ml whole
milk with 200 μl saline solution containing 107 cells of bacteria. Petroff-Hausser
Counting Chamber was used in order to calculate cells. Controls of 2 ml milk was
prepared and treated in the same way as the spiked samples. Each sample was
made in replicates of two. The skim milk controls were defatted through centrifu-
gation (EppendorfTM 5424R Microcentrifuge) in 13 000 x g in 4 minutes. The
samples were stored at -20°C until further analysis.
3.5.2 DNA extraction
Before beginning, the hood and all equipment were cleaned with 70% ethanol.
Tips, solutions and tubes provided with the kit were subjected to UV light for 15-
30 minutes before use. Aliquots of PF1 and PF3 solutions provided by the DNA

21
kit were pipetted into separate tubes for each milk sample. After the UV treatment,
tubes with solutions of PF1 and PF3 were placed in a heating block at 55°C.
Gloves were used during the whole procedure, including preparations.
DNA was isolated from the milk samples using PowerFood DNA isolation kit
(MoBio Laboratories, Immuno diagnostics OY #21000-50) according to the man-
ufacturer´s instructions but with some deviations in order to try to optimize the
bacteria DNA yield from the fat fraction, resulting in four methods (see below).
The milk samples prepared during the DNA preparation step were thawed and
vortexed for homogenization. An aliquot of 1 ml of every sample was pipetted
into a new 2 ml tube and centrifuged at 13000 x g for 5 minutes. The following
steps were different for each of the tested methods:
i. A method: (whole milk) after centrifugation, the supernatant was discard-
ed. Cell pellet and the fat fraction were re-suspended by adding 450 μl
warm PF1 solution (lysing reagent that includes a detergent to break cell
walls).
ii. B method: (skim milk) fat and the supernatant were discarded and cell pel-
let was re-suspended by adding 450 μl warm PF1 solution (method ac-
cording to PowerFoods protocol).
iii. n-A method: (whole milk) the supernatant was discarded. Cell pellet and
the fat fraction were treated with 30 μl of n-hexane, vortexed and heated
in a heating block at 65°C for 10 minutes. Thereafter, the sample were re-
suspended by adding 450 μl warm PF1 solution.
iv. m-A method: (whole milk) the supernatant was discarded. Cell pellet and
the fat fraction were treated with 30 μl of methanol, vortexed and heated
in a heating block at 65°C for 10 minutes. Thereafter, the sample were re-
suspended by adding 450 μl warm PF1 solution.
The re-suspended cells were transferred to Bead Beating tubes and placed in a
bead beater machine (FastPrep-24, Bio medicals) at speed 5 for 1 minute, paused
for 1 minute and run for 1 minute again. Thereafter, the samples were centrifuged
at 13000 x g for 1 minute. All of the supernatant (approximately 400 μl) and fat
from the whole milk samples were carefully transferred to a new 2 ml tube using a
200 μl pipette. 100 μl of PF2 (inhibitor removal reagent) was added and vortexed

22
briefly and the tubes were incubated at 4°C for 5 minutes. After the cold incuba-
tion, the tubes were centrifuged at 13000 x g for 1 minute. Supernatant, and fat
fraction from the whole milk samples, were transferred to a new 2 ml collection
tube. The pellet was discarded. Furthermore, 900 μl of warm PF3 solution
(a highly-concentrated salt solution) was added and the tubes were vortexed. The
supernatant was transferred through taking 660 μl at each time onto a Spin filter
and centrifuged at 13000 x g for 1 minute. The flow through was discarded and the
procedure was repeated until all of the supernatant were centrifuged. The filter
baskets were placed into new clean 2 ml tubes. The PF4 solution (alcohol based
wash solution) was shaken and 650 μl was added to the tubes, which thereafter
were centrifuged at 13000 x g for 1 minute. The flow through was discarded and
650 μl of PF5 (solution used for complete removal of PF4) were added and the
tubes were centrifuged again at 13000 x g for 1 minute. The flow through was
discarded and the tubes were centrifuged dry at 13000 x g for 2 minutes. The Spin
filter baskets were placed into clean 1.5 ml tubes and 50 μl of PF6 (sterile elution
buffer) was added to the centre of the Spin filters and incubated in room tempera-
ture for 5 minutes. The tubes were centrifuged at 13000 x g for 1 minute. The spin
filter baskets were discarded. The DNA was stored in -20°C for further analysis.
Quantification of DNA was examined after the DNA extraction using Qubit 3.0
Flourometer (Thermo Fisher Scientific) according to the manufacturer´s instruc-
tions. Amounts of 2 μl of each extracted DNA sample was used for quantification.
3.5.3 PCR
The PCR product was based on the 16S rRNA genes from each DNA extract using
the general bacteria primers Bact-8FAM (forward) end-labelled with 6-
carboxyfluorescein and BAct-926r (reverse), see table 1. Samples were analysed
in two technical replicates from each DNA replicate. The total reaction volume
was 25 μl containing 12.5 μl master mix, 9.5 μl sterile water, 1 μl forward primer,
1 μl reverse primer and 1 μl DNA template.
Table 1. General bacterial primers used for PCR amplification
Target gene Primer Sequence (5’3’) Reference
16S rRNA Bact-8FAM F AGAGTTTGATCCTGGCTCAG
Dicksved et al., 2008 BAct-926r R CCGTCAATTCCTTTRAGTTT
The PCR amplification (using CFX96 Real-Time System, Bio Rad) started with
an initialization step at 95°C for 3 minutes followed by 30 cycles consisting of 20

23
seconds at 95°C (denaturation), 20 seconds at 49°C (annealing), 30 seconds at
72°C (elongation) and a final elongation at 72°C for 5 minutes.
After PCR amplification, the DNA products were confirmed by agarose gel (1%)
electrophoresis using GeneRuler 1 kb Plus DNA ladder, ready-to-use (Thermo
Fisher Scientific) as a size marker. The gel was made by mixing 3 g agarose and
300 ml TBE (0.5x). Electrophoresis was carried out at 110 V for approximately
one hour. 5 μl of each PCR product was mixed with 2 μl DNA loading dye (6X)
(Thermo Fisher Scientific).
3.5.4 PCR purification
The technical replicates obtained from the PCR amplification were pooled togeth-
er by taking 18 μl from each one into a 2 ml tube. To each tube, 29 μl of Agen-
court AMPure beads was added (0.8 VPCR) followed by vortexing for 10 seconds
and incubation in room temperature for 5 minutes. Thereafter, the tubes were
placed onto Agencourt SPRIPlate for 5 minutes to separate beads. The pure solu-
tion was discarded and 200 μl of 70% ethanol was added and incubated for 30
seconds in room temperature. The ethanol was aspirated and the wash was repeat-
ed once again. The tubes were placed on a rack without magnetism and air dried
for 10 minutes. 38 μl of nuclease free H2O was added to each tube, vortexed and
placed onto the SPRIPrack again for 2 minutes. The eluted PCR product was
transferred to new tubes and stored in a freezer. After purification, DNA concen-
trations were examined with Qubit according to the manufacturer´s instructions by
using 5 μl from each purified PCR sample. Gel electrophoresis was made to verify
the purification, in the same way as previous gel electrophoresis.
3.5.5 Digestion of PCR product
After purification of DNA, the PCR products were digested with the restriction
enzyme HaelII 10U/μl (Thermo Fisher Scientific) (Recognition sequence
CC/GG). The total reaction volume was 30 μl containing 27 μl PCR reaction mix-
ture, 0.5 μl HaeIII and 3 μl 10x Buffer R. The mixture was incubated at 37°C for
2 hours followed by a thermal inactivation by incubation at 80°C for 20 minutes.
The PCR reaction mixture was based on the results from DNA concentration
(CPCR) after purification. The needed volume of PCR product (VPCR) for every
sample was calculated by the equation:
𝑉𝑃𝐶𝑅
30 (μl) × 7.14 (ng/μl)
𝐶𝑃𝐶𝑅 (ng/μl)
24
and the needed volume of nuclease free water by the equation:
𝑉𝐻2𝑂 = 30 (μl) − 𝑉𝑃𝐶𝑅 (μl)
Together, these two volumes made up PCR reaction mixture, containing 200 ng of
DNA in each sample.
3.5.6 T-RFLP
T-RFLP analysis was prepared by making dilutions of 1:20 and 1:100 of digested
PCR products with ultra-pure water. The samples were submitted in a 96-well
plate covered by small lids. The plate was put into a freezer and thereafter sent to
Uppsala Genome Center for T-RFLP analysis. The resulting T-RFLP profiles were
thereafter processed by Peak Scanner software (Applied Biosystems). The relative
abundance of the individual T-RFs was calculated by dividing the peak area by the
total area of all peaks, using Excel. Peaks shorter than 30 base pairs (BP) were
excluded as noise.
3.6 qPCR
For assessment of the bacterial load by quantification of the samples, a standard
curve was made using TOPO TA kit for sequencing (Thermo Fisher Scientific)
according to the manufacturers protocol and TOP10 cells were used. The plasmids
were purified with plasmid purification kit (Quiagen). Triplicate measurements of
the DNA concentration was made with Qubit. Vplasmid were calculated and 10 dilu-
tions from 108 down to 100 were made in small PCR tubes. The standard curve
was included in each qPCR assay in duplicates and with 3 negative controls (no
template controls, NTC). The program started with an initialization step at 95°C
for 5 minutes followed by 50 cycles consisting of 45 seconds at 95°C (denatura-
tion), 20 seconds at 60°C (annealing) and 30 seconds at 72°C (elongation). After
the PCR, a melting curve was constructed in the range of 55°C to 95°C. The aver-
age values of the cycle thresholds were used for calculation of the bacterial load.
Five procedures of qPCR with different targets were run using forward and
reverse primers (table 2). Before each analysis, a 96-well plate, empty Eppendorf
tubes, tubes with ultrapure water and filter tips were treated by UV light for 15
minutes. A reaction mixture was prepared with 730 μl SYBR Green qPCR master
mix No ROX (Thermo Fisher Scientific), 36.5 μl of each forward and reverse pri-
mer (Thermo Fisher Scientific, see table 2) and 438 μl ultrapure water. The total
reaction volume in each well was 20 μl, consisting of 17 μl of reaction mixture

25
and 3 μl of template. Two replicates for standard curves were run, ranging from
108-100 and additionally three NTC were included in each run. qPCR amplifica-
tion program was run in the same way as the standard curves. At each cycle and
end of the run, accumulation of PCR products was detected by fluorescence of the
reporter dye of SYBR Green.
Table 2. Primers used for the qPCR amplification.
Target Primer Sequence (5’3’) Reference
E. coli 395 F CATGCCGCGTGTATGAAGAA
Huijsdens et al., 2002 490 R CGGGTAACGTCAATGAGCAAA
L. reuteri DSM
1694 F TTAAGGATGCAAACCCGAAC Protocol made by
Department of Micro-
biology, SLU 1694 R CCTTGTCACCTGGAACCACT
L. reuteri PTA
0733 F GACAGTGGCTAAACGCCTTC Protocol made by
Department of Micro-
biology, SLU 0733 R AATTCCACTTGCCATCTTCG
S. aureus 472 F AGTGATGAAGGTCTTCGGATCGTAAA
Wang et al., 2014 575 R CGTGGCTTTCTGATTAGGTACCGTC
Total bacteria U1048 F GTGSTGCAYGGYTGTCGTCA
Maeda et al., 2003 U1371 R ACGTCRTCCMCACCTTCCTC
SLU = Swedish University of Agricultural Sciences

26
4 Results
4.1 Culturing of bacteria
The four cultured species of bacteria resulted in numbers of colony forming units
(CFU) as shown in table 3. The highest amounts of CFU were presented in the
samples containing 10-2 bacteria cells; the other dilutions seemed to be too low for
culturing. Furthermore, the highest number of bacteria originated from the fat
fraction compared to the supernatant and pellet. Looking at figure 1, both of the
LABs were present in the highest amounts in the fat fraction, even though L. reu-
teri DSM is hydrophilic. There are even more bacteria from the samples spiked
with S. aureus and E. coli in the fat fractions, which clearly shows where the bac-
teria partitioned when centrifuged.
Table 3. Colony distribution in the milk fractions (fat, supernatant, pellet) of the four bacteria spe-
cies detected on selective agar plates
CFU = Colony forming units
Fraction Dilution L. reuteri PTA
(CFU)
L. reuteri DSM
(CFU)
S. aureus
(CFU)
E. coli
(CFU)
Fat 10-6 0 0 0 0
10-4 2 3 3 1
10-2 666 190 750 210
Supernatant 10-6 0 0 0 0
10-4 0 0 0 1
10-2 268 68 188 72
Pellet 10-6 0 0 0 0
10-4 1 3 0 1
10-2 613 143 166 93

27
Figure 1. The percentage of bacteria colonies originating from different fractions after culturing on
agar plats. The results are based on milk samples spiked with 105 bacteria cells. Number of colony
forming units (CFU) of each fraction is indicated in the bars.
The amounts of fat removed from the centrifuged tubes and the number of bacteria
calculated back to the original spiked 5 ml whole milk are shown in table 4. The
highest amount of fat was in the sample spiked with E. coli, probably due to better
technique when removing the fat. Controls are shown in table 5 and 6 (Appendix
1). The spiked number of cells (table 4) were lower than 107 as it was supposed to
be.
Table 4. Fat fraction (mg) and amounts of spiked bacteria in 5 ml milk
*Based on results obtained from culturing the fractions with dilutions 10-2.
4.2 DNA extraction and concentration
DNA was extracted with the MoBio PowerFood kit with some deviations from the
manufacturer´s instructions. The method that included methanol was excluded
since it made the fat difficult to transfer between tubes; it got stuck to the walls of
the tubes and inside the pipettes. Concentration of extracted DNA was measured
Bacterium Fat (mg) Total bacteria in 5 ml milk*
L. reuteri PTA 71.6 7 106
L. reuteri DSM 67.4 2 106
E. coli 62.5 5 106
S. aureus 85.5 2 10 6
Figure 1
666 190
750210
26868
188
72
613 143
16693
0%
10%
20%
30%
40%
50%
60%
70%
80%
90%
100%
L. Reuteri PTA L. Reuteri DSM S. aureus E. coli
Pellet
Supernatant
Fat fraction
28
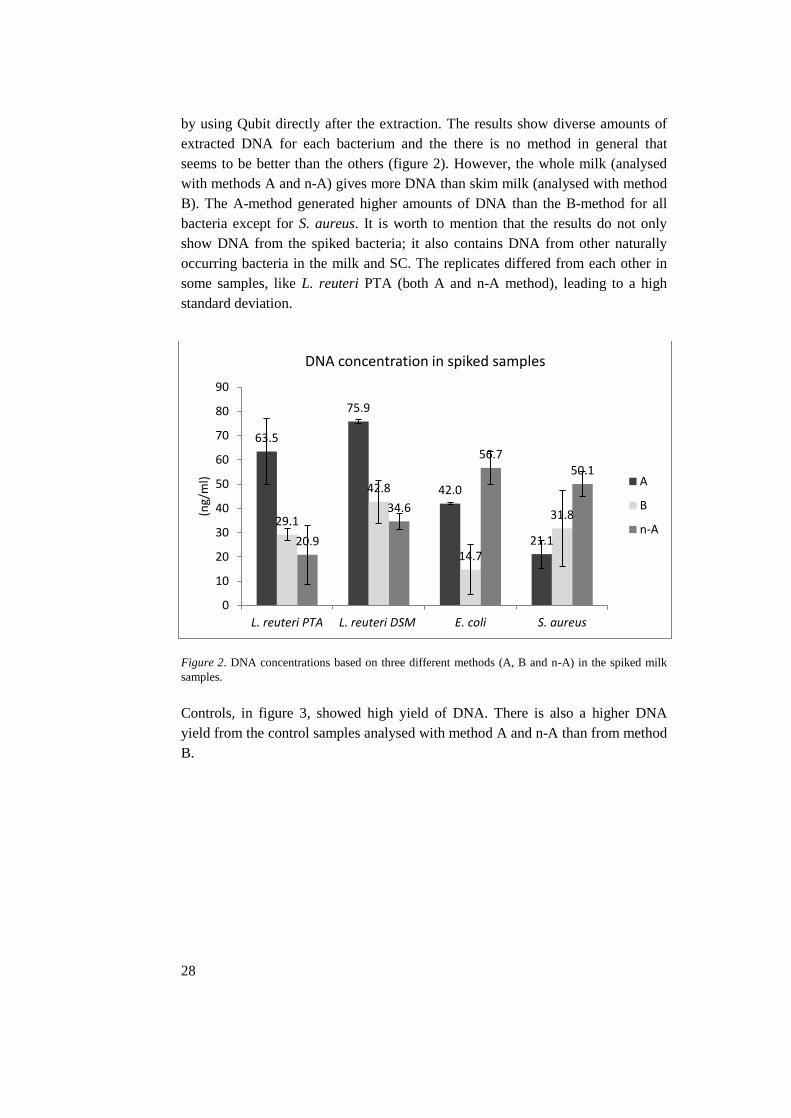
by using Qubit directly after the extraction. The results show diverse amounts of
extracted DNA for each bacterium and the there is no method in general that
seems to be better than the others (figure 2). However, the whole milk (analysed
with methods A and n-A) gives more DNA than skim milk (analysed with method
B). The A-method generated higher amounts of DNA than the B-method for all
bacteria except for S. aureus. It is worth to mention that the results do not only
show DNA from the spiked bacteria; it also contains DNA from other naturally
occurring bacteria in the milk and SC. The replicates differed from each other in
some samples, like L. reuteri PTA (both A and n-A method), leading to a high
standard deviation.
Figure 2. DNA concentrations based on three different methods (A, B and n-A) in the spiked milk
samples.
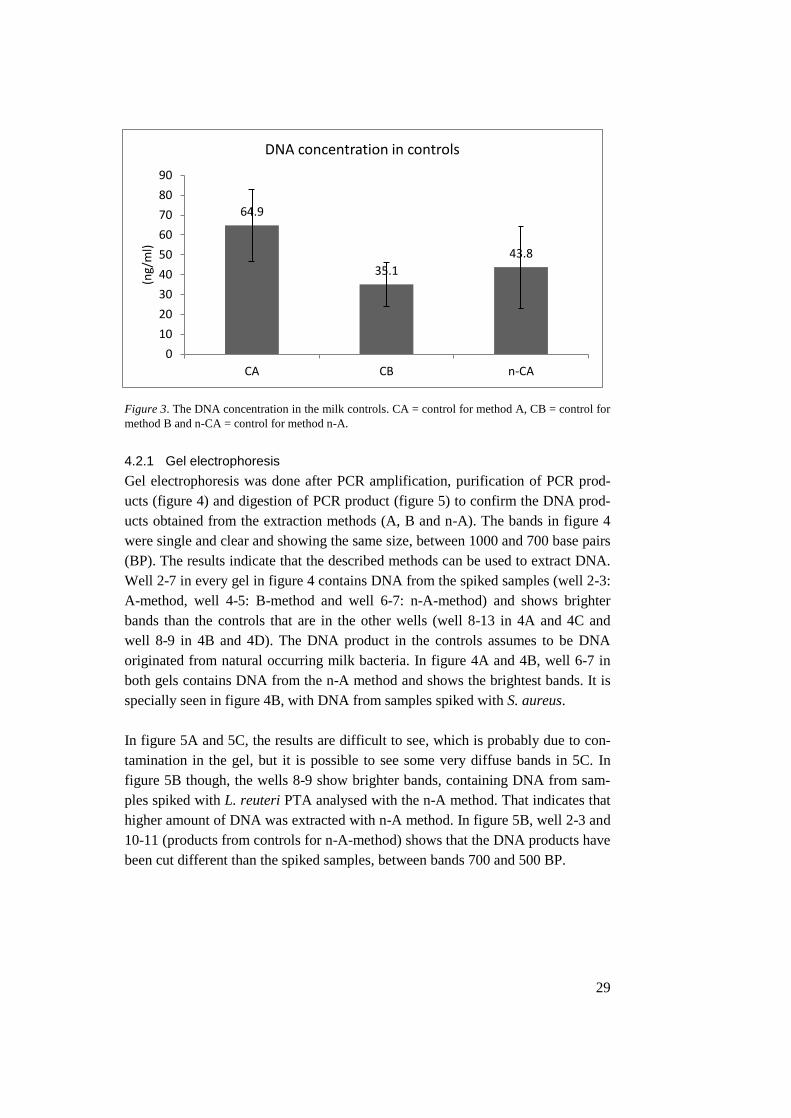
Controls, in figure 3, showed high yield of DNA. There is also a higher DNA
yield from the control samples analysed with method A and n-A than from method
B.
63.5
75.9
42.0
21.1
29.1
42.8
14.7
31.8
20.9
34.6
56.750.1
0
10
20
30
40
50
60
70
80
90
L. reuteri PTA L. reuteri DSM E. coli S. aureus
(ng/
ml)
DNA concentration in spiked samples
A
B
n-A
29
Figure 3. The DNA concentration in the milk controls. CA = control for method A, CB = control for
method B and n-CA = control for method n-A.
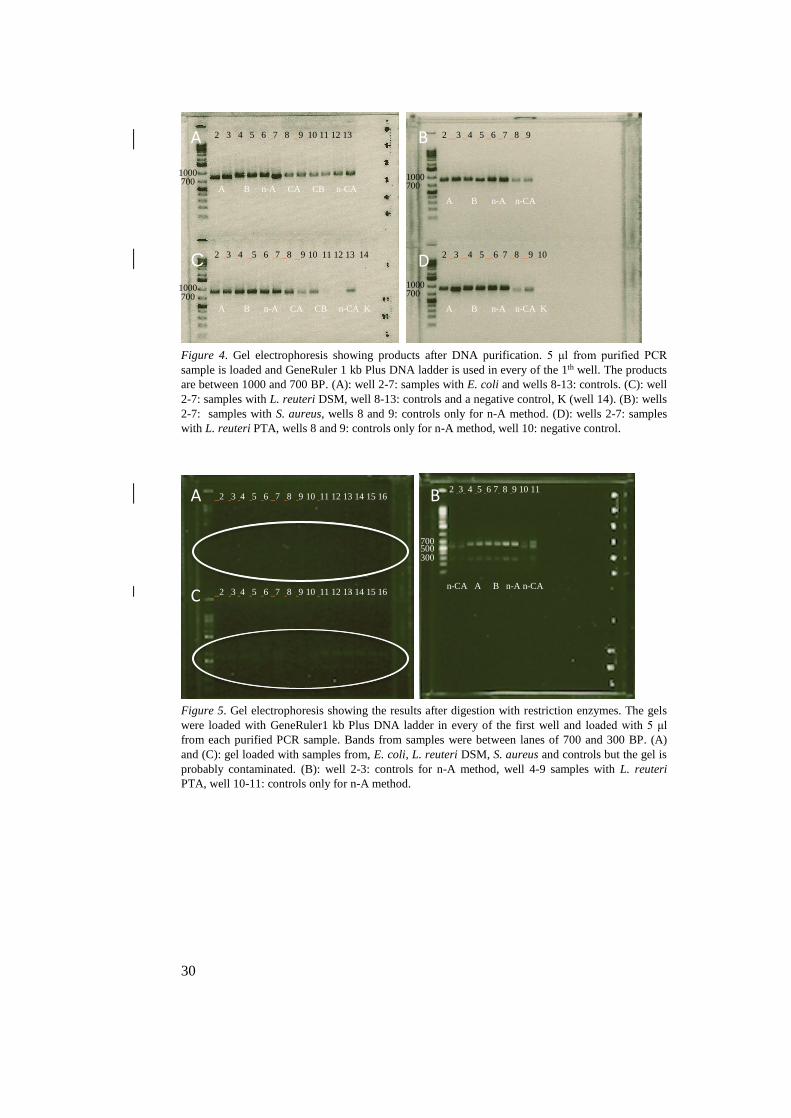
4.2.1 Gel electrophoresis
Gel electrophoresis was done after PCR amplification, purification of PCR prod-
ucts (figure 4) and digestion of PCR product (figure 5) to confirm the DNA prod-
ucts obtained from the extraction methods (A, B and n-A). The bands in figure 4
were single and clear and showing the same size, between 1000 and 700 base pairs
(BP). The results indicate that the described methods can be used to extract DNA.
Well 2-7 in every gel in figure 4 contains DNA from the spiked samples (well 2-3:
A-method, well 4-5: B-method and well 6-7: n-A-method) and shows brighter
bands than the controls that are in the other wells (well 8-13 in 4A and 4C and
well 8-9 in 4B and 4D). The DNA product in the controls assumes to be DNA
originated from natural occurring milk bacteria. In figure 4A and 4B, well 6-7 in
both gels contains DNA from the n-A method and shows the brightest bands. It is
specially seen in figure 4B, with DNA from samples spiked with S. aureus.
In figure 5A and 5C, the results are difficult to see, which is probably due to con-
tamination in the gel, but it is possible to see some very diffuse bands in 5C. In
figure 5B though, the wells 8-9 show brighter bands, containing DNA from sam-
ples spiked with L. reuteri PTA analysed with the n-A method. That indicates that
higher amount of DNA was extracted with n-A method. In figure 5B, well 2-3 and
10-11 (products from controls for n-A-method) shows that the DNA products have
been cut different than the spiked samples, between bands 700 and 500 BP.
64.9
35.1
43.8
0
10
20
30
40
50
60
70
80
90
CA CB n-CA
(ng/
ml)
DNA concentration in controls
30
Figure 4. Gel electrophoresis showing products after DNA purification. 5 μl from purified PCR
sample is loaded and GeneRuler 1 kb Plus DNA ladder is used in every of the 1th well. The products
are between 1000 and 700 BP. (A): well 2-7: samples with E. coli and wells 8-13: controls. (C): well
2-7: samples with L. reuteri DSM, well 8-13: controls and a negative control, K (well 14). (B): wells
2-7: samples with S. aureus, wells 8 and 9: controls only for n-A method. (D): wells 2-7: samples
with L. reuteri PTA, wells 8 and 9: controls only for n-A method, well 10: negative control.
Figure 5. Gel electrophoresis showing the results after digestion with restriction enzymes. The gels
were loaded with GeneRuler1 kb Plus DNA ladder in every of the first well and loaded with 5 μl
from each purified PCR sample. Bands from samples were between lanes of 700 and 300 BP. (A)
and (C): gel loaded with samples from, E. coli, L. reuteri DSM, S. aureus and controls but the gel is
probably contaminated. (B): well 2-3: controls for n-A method, well 4-9 samples with L. reuteri
PTA, well 10-11: controls only for n-A method.
2 3 4 5 6 7 8 9 10 11 12 13 14 15 16
2 3 4 5 6 7 8 9 10 11
A B
A B
2 3 4 5 6 7 8 9
2 3 4 5 6 7 8 9 10 2 3 4 5 6 7 8 9 10 11 12 13 14
2 3 4 5 6 7 8 9 10 11 12 13
C D
C
2 3 4 5 6 7 8 9 10 11 12 13 14 15 16
700
700
1000
700
1000
700
1000
700
1000
500
A B n-A CA CB n-CA
A B n-A CA CB n-CA K
A B n-A n-CA
A B n-A n-CA K
n-CA A B n-A n-CA
300

31
4.3 T-RFLP
The results obtained from the T-RFLP analyses were diverse and the most domi-
nant T-RF in all samples consisted of 24 BP, but was considered as “noise” and
was therefore excluded. The results are only showed for dilution 1:20 since con-
centration 1:100 was too diluted.
The result for the samples spiked with L. reuteri DSM (figure 6) showed that the
methods where the fat was kept (methods A and n-A) showed more traces of bac-
teria than the B-method. The most abundant T-RF was 63 BP, which is the T-RF
for LAB when using the restriction enzyme HaeIII. Other T-RFs that are shown,
like T-RF 32, 199, 275, 307 and 317 BP can also be seen in figure 10, showing the
microbiota in the unspiked controls for each method. One T-RF that cannot be
seen in the controls is 335 BP, which is high in comparison to the other in the
spiked samples (figure 6 and 8).
Figure 6. T-RFLP results based on three different methods (A, B, n-A) from the samples spiked with
L. reuteri DSM.
Results obtained in the samples spiked with S. aureus are shown in figure 7. The
most abundant T-RF is 309 BP; the one showing the presence of S. aureus. There
are also small amounts of T-RF 32 and 308 BP, which are present in the controls
(figure 10).
0
20
40
60
80
3262
6364
199254
275307317318335
Rel
ativ
e ab
un
dan
ce (
%)
L. reuteri DSM A L. reuteri DSM B L. reuteri DSM n-A

32
Figure 7. T-RFLP results based on three different methods (A, B, n-A) from the samples spiked with
S. aureus.
The results obtained for L. reuteri PTA (figure 8) resulted in most T-RFs 63 BP
for methods A and n-A but only T-RF 30 BP in the samples analysed with B-
method, which might be due to some error. The T-RFs 62 and 65 BP can be con-
sidered as T-RF 63 BP, since 5 BP can differ from the site that HaeIII cuts. Like
the results in figure 6, T-RF 335 Bp can be seen in figure 8 as well.
Figure 8. T-RFLP results based on three different methods (A, B, n-A) from the samples spiked with
L. reuteri PTA.
0
50
100
3032
5191161196199266275308309317
Rel
ativ
e ab
un
dan
ce (
%)
S. aureus A S. aureus B S. aureus n-A
0
50
100
3062
6365
307335 R
elat
ive
abu
nd
ance
(%
)
L. reuteri PTA A L. reuteri PTA B L. reuteri PTA n-A

33
In the analysis for E. coli (figure 9), there appears to be some error as well, since
no T-RF of 32 BP was obtained in the samples analysed with method A. Instead
there were only T-RFs 118 and 67 BP presented. In the other two methods howev-
er, there are quite equal result, with the exception of T-RF 63 BP that indicate
presence of LAB and T-RF 30 BP, which probably is a fragment belonging to
E. coli.
Figure 9. T-RFLP results based on three different methods (A, B, n-A) from the samples spiked with
E. coli.
In result from the T-RFLP for the controls (figure 10) the most dominated T-RFs
are especially 275 BP but also T-RFs 32, 199, 307 and 317 BP. The A and B
method give equal results, but the n-A method generates more T-RFs. The T-RF
indicates that the milk contains some naturally occurring E. coli (T-RF 32 BP) and
some LAB (T-RF 307 BP).
Figure 10. The results for controls based on three different methods (A, B, n-A) of the T-RFLP.
0
10
20
30
40
50
3032363863161199236256272275287289307316318
Rel
ativ
e ab
un
dan
ce (
%)
A control B control n-A control
0
50
100
3032
6367
118
Rel
ativ
e ab
un
dan
ce (
%)
E. coli A E. coli B E. coli n-A

34
4.4 qPCR
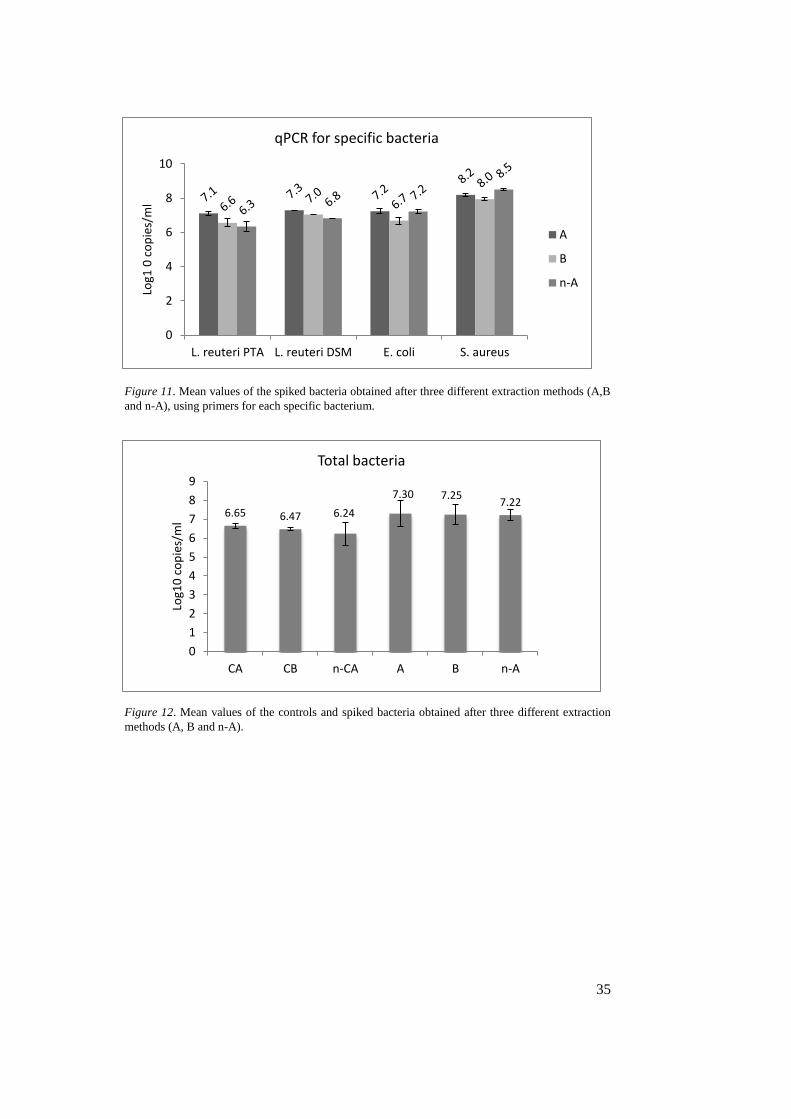
The results from the qPCR for specific bacteria and total bacteria are shown in
figure 11 and 12. The reaction efficiency (E) varied between 97.1% and 98.7%
(except for L. reuteri PTA: 78.9%) and the linear correlation (R2) is between 0.914
and 0.997. The melt curves (not shown) did not show only single melt peaks for all
PCR runs, which indicate multiple PCR products in some samples. For the E. coli
samples, the melt curve showed products at the same Tm for all samples, including
NTC, even though the samples unspiked with E. coli showed results at Cq around
30. L. reuteri DSM showed a sharp melt curve for the spiked samples with L. reu-
teri DSM. All the other spiked samples and controls (but not the NTC), resulted in
a melt curve earlier than L. reuteri DSM samples and standards. This indicates that
another gene was amplified and would probably show shorter fragments if they
would be run in a gel electrophoresis. L. reuteri PTA showed results with a melt
curve at the expected peak for the samples spiked with L. reuteri PTA and the
NTC were clean. A few of the samples gave results with high Cq values around
36-45, which probably can be distinguished. The samples spiked with S. aureus
gave results for every sample including the controls but not the NTC. However,
the other samples showed a very low content. Therefore, the qPCR results should
be interpreted by caution. The procedure was not repeated because of too low
amount of DNA template left. Nevertheless, the A-method resulted in highest
DNA copies/ml for samples spiked with LAB, followed by B- and n-A-method
(figure 11). For E. coli and S. aureus however, the n-A-method is equal or better
compare to the A-method. When comparing these results with the Qubit results in
figure 2, there are similarities, except for E. coli, where the A-method is better
than the B-method.
The results for the total bacteria (figure 12) are based on a standard curve of E
value 98.1% and R2 0.914 which therefore is not very reliable. The R2 value
should be 0.985 and E value should be between 90-110%, where 100% implies
perfect doubling of amplicon each cycle (Agilent Technologies, n.d.). The Cq
values were around 30 for both spiked samples and controls. qPCR for total bacte-
ria were therefore lower than the runs for specific bacteria but the controls showed
relatively high values in comparison, even though they were unspiked. The total
bacteria amount show higher results in both spiked samples and controls for A-
method. In contrast to the specific qPCR, the B-method is in between the other
two methods. Looking at the total bacteria (figure 12), there are almost equal re-
sults within the methods and also for the controls.
35
Figure 11. Mean values of the spiked bacteria obtained after three different extraction methods (A,B
and n-A), using primers for each specific bacterium.
Figure 12. Mean values of the controls and spiked bacteria obtained after three different extraction
methods (A, B and n-A).
6.65 6.47 6.24
7.30 7.257.22
0
1
2
3
4
5
6
7
8
9
CA CB n-CA A B n-A
Log1
0 c
op
ies/
ml
Total bacteria
0
2
4
6
8
10
L. reuteri PTA L. reuteri DSM E. coli S. aureus
Log1
0 c
op
ies/
ml
qPCR for specific bacteria
A
B
n-A

36
5 Discussion The aim of this project was to explore the proportion of the microbiota which is
connected to the milk fat fraction and also to investigate if an already existing
method for DNA based analyses of microbiota in defatted milk is suitable for de-
tection of microbiota in whole milk. This work is important since bacteria that
bind to the fat can be underestimated or not detected at all in the currently used
methods.
5.1 Culturing of bacteria
The first task during the laboratory part was to examine by cultivation the distribu-
tion of four spiked bacteria species in three different milk fractions. The results
showed that all of the tested bacteria were in higher amounts in the fat fraction,
which is in line with previous findings (Anderson, 1909; Poms, Glössl & Foissy,
2001). Between 43-68% of the cultured bacteria originated from the fat, 17-19%
originated from the supernatant and 15-40% from the pellet. Unfortunately, the
only results from the culturing were obtained from the samples of the dilution 10-2.
A possible reason for this can be that there were lower amounts of spiked bacteria
than expected. Based on the CFU, the amounts of bacteria in 5 ml (table 4) showed
lower values than 107. This was probably due to the difficulties to calculate the
exact number of bacteria using a counting chamber. Counting bacteria in broth and
thereafter spiking milk is not a fully reliable method in order to get the exact
amount of 107 bacteria cells in the milk samples. Both S. aureus and E.coli were
difficult to count in the heamocytometer and no staining was used in order to sepa-
rate dead cells from alive. There is a risk that the spiked amount of bacteria varied
between the samples. There is an even higher risk for differences in bacteria num-
bers for L. reuteri PTA, since samples analysed using the n-A-method were spiked
on a different day than the samples spiked with L. reuteri PTA. Tables 5 and 6
(Appendix 1) show the results from the controls; unspiked milk cultured on the
agar plates used after enrichment in broth. In the original milk (concentration 100)
37
LAB, but not E. coli or S. aureus were detected. This is in agreement with the fact
that LAB can naturally be found in fresh milk (von Neubeck et al., 2015). Since
there was no colony of S. aureus in unspiked milk (100), but 61 colonies from milk
dilution 102, it might be due to contamination caused by bad handling of equip-
ment and materials or that the spreading of 100 concentration failed. The cultiva-
tion could benefit from including multiple agar plates for each bacterium species
to strengthen the results.
Furthermore, it was difficult to remove all of the fat from the tube and it requires
training to use a spatula with a good technique. The fat readily sticks to plastic
materials, whereas a plastic spatula is difficult to use. A metallic spatula is to pre-
fer, but since every sample needs a sterile one, there is important to have sterile
spatulas prepared for every sample. The results obtained for S. aureus spiked sam-
ples showed that there was even more bacteria in the fat in contrast to the results
obtained for the other spiked bacteria samples, probably due to better technique
when the fat was removed in the S. aureus sample (table 4). Therefore, a good
standardized method needs to be practised before determination and by keeping
the sample on ice the fat will be more solid and improve the conditions to succeed.
It is interesting that distribution of bacteria in the different milk fractions has been
known for more than a century (Anderson, 1909) but surprisingly few seems to
take this into account when analysing bacteria in whole milk. Brewster &
Moushumi (2016) who was unaware of this until they observed it, tried to over-
come it by developing an agitation treatment. They added this step before centrif-
ugation of the milk in the extraction procedure and it took 2-8 minutes, depending
on the amount of milk. The aim was to reproduce the effects of homogenization in
the laboratory by agitation of the raw milk with a high-shear mixer. This was done
since homogenised samples give a higher recovery of bacteria in the pellet. The
treatment with agitation disrupted the bacteria binding to the fat layer and resulted
in more than 95% recovery, without affecting the bacteria viability. This could be
an additional step for optimizing the protocol used in this thesis.
Since fat interfere with most of the DNA extracting methods (Mertens et al.,
2014), it is understandable that discarding of supernatant containing fat is recom-
mended. But considering the fact that it contains high levels of bacteria, it might
be time to take this into account during analyses and develop existing methods.

38
5.2 DNA extraction
In this project, the protocol obtained with MoBio PowerFood kit was used with
some additional steps, resulting in methods called A, B, n-A and m-A, were B was
the same as the manufacturer´s protocol. Quigley et al. (2012) investigated seven
different methods for DNA extractions and concluded that the PowerFood micro-
bial DNA kit (MoBio Laboratories Inc.) was the best for the extraction of total
DNA from both raw skim milk and raw milk cheese. Furthermore, Thomas et al.
(2013) evaluated nine commercial DNA extraction kits for Bacillus anthracis
spores from different media, including milk, and concluded that the PowerFood kit
was as one of three kits that yielded the most consistent DNA extraction from the
spores. The Pre-treating of fat and pellet with hexane in this projects, the n-A
method, was based on the findings of Poms, Glössl & Foissey (2001). Hexane
removes fat, allowing dispersion in an aqueous phase, and can therefore improve
the extraction in the samples containing fat (Terry et al., 2002). The method called
m-A, where methanol was used, was not successful, since the fat became very
difficult to transfer into new tubes and got stuck into the pipette tips. When using
as small amounts as 1 ml of each sample, it is important to be able to get as much
of the fat as possible. In the beginning of the project, the plan was to remove the
fat after centrifugation, add solvents (hexane or methanol) only to the fat and then
transfer back to the tube with the pellet. Since the problem was almost the same
for the n-A as with m-A method, the decision to treat both pellet and fat fraction
was decided, to minimize the risk of loosing fat and thereby bacteria. It is favoura-
ble to use methods that are manageable and easily worked since the milk fat readi-
ly stick to the plastic surface of materials. A good sample preparation technique
for routine analysis should be simple, safe, inexpensive and have a good reproduc-
ibility that results in sufficient DNA quality and yield (Terry et al., 2002).
The results for the DNA concentration (figure 2) are in general low (between 14.7
ng/ml and 76.5 ng/ml), compare to Quingley et al. (2012) using the same Power-
Food kit for raw milk and raw milk cheese with the results of 909.53 6.0 ng/ml
and 6756.14 16.47 ng/ml respectively. Furthermore, Usman et al. (2014) com-
pared three methods how to extract genomic DNA in bovine milk but with the use
of 50 ml for each method. The tested methods were Nucleospin Blood Kit,
TianGen Kit and the classical and cheaper Phenol-Chloroform method. The results
were 170.5 113.9 ng/μl, 139.9 92.7 ng/μl and 105.9 55.6 ng/μl respectively.
In the DNA extraction, the A-method give a higher amount of DNA for the two
samples spiked with LAB (figure 2), but for E. coli and S. aureus it was the
n-A method that yielded the highest DNA concentration. This is similar to the
results obtained from the qPCR (figure 11) and also to the results obtained from
39
the gel electrophoresis, even though there is bigger variation between the methods
for each bacteria species in figure 2. When comparing the methods for the controls
(figure 3), B-method resulted in the lowest results. Undoubtedly, methods A and
n-A give the highest extracted DNA.
What the low amounts of extracted DNA in this project depend on is not known,
also considering that the B-method was performed according to the protocol pro-
vided with the PowerFood kit. However, since the extracted DNA can stem also
from SC, results can vary largely between the milk used in different projects and
Swedish milk is known for its low levels of SC compared to other countries1. An-
other contributing reason can be that the quantity of DNA was measured with dif-
ferent methods; Qubit in this project instead of a nanodrop flourospectrometer as
in the studies made by Quigley et al. (2012) and Usman et al. (2014). One option
to improve the yield of DNA is to add a second elution as a last step in the DNA
extraction method. According to Thomas et al. (2013), kits using silica columns
(e.g. PowerFood) or magnetic/ silica-based magnetic beads often requires the use
of a large buffer volume (50-100 μl) for efficient elution of DNA. Therefore, a
second elution could be incorporated in the protocol. Even though it is said that fat
interfere with most extraction methods (Mertens et al., 2014), there were higher
amounts of DNA in almost all of the whole milk samples compared to the skim
milk samples (figure 2). This can be seen in both in spiked and unspiked samples
except for S. aureus.
5.3 T-RFLP
The results obtained from the T-RFLP showed that the spiked bacteria could be
identified through the analysis, but the microbial traces from other types of bacte-
ria varied between the methods. The higher amounts of bacterial traces in the
controls for the n-A method (figure 10) could depend on that the results were
based on more replicates than the controls for the other two extraction methods.
The replicates also varied within method and all traces of bacteria were not present
in each replicate. This means that the controls for the other methods might have
shown more microbial traces, more equal to the result of the control for the n-A
method, if they would have been performed in the same amounts of replicates. The
differences between replicates can also be applied to the spiked samples. It can be
difficult to determine which type of extraction that is the best and most correct
when looking at the T-RFLP profiles, since the DNA extraction methods can give
different results without saying that one them is wrong. According to other studies,
the use of a single DNA extraction can underestimate the total number of bacteria,
whereas a combination of DNA extractions can be used for a more accurate evalu-
1Monica Johansson, Researcher at SLU, meeting 2:nd of may 2017

40
ation of bacterial communities (LaMontagne et al., 2002; Inceoglu et al., 2010;
Willner et al., 2012; Prakash et al., 2014). However, results observed in this pro-
ject indicate that there were no big differences between the samples (including the
controls), suggesting that the microbiota in the whole milk samples can be studied
regardless extraction method used in the this work. Nevertheless, the A and n-A
methods are to prefer for the analysis due to their higher amounts of extracted
DNA compared to B-method.
5.4 qPCR
In the cultivation part, there were high amounts of bacteria that originated from the
fat fraction. Figure 2 showed that method A for LAB and n-A for E. coli and S.
aureus gave higher amounts of DNA compared to method B. These results gave
an expectation that it could be bigger differences between whole milk and the skim
milk samples also in the molecular determination. However, since this was not
clearly seen in T-RFLP or qPCR, it is difficult to determine how big part of the
microbiota that originated from the milk fat fraction. qPCR was performed in or-
der to quantify the bacteria and compare the extraction methods (A, B and n-A)
and if there were higher DNA yield in the whole milk samples (A and n-A). The
results varied between the qPCR assays. Fully optimized assays should contain
only single melting products in samples with the targeted sequence, showing one
melting temperature (Tm), which not all of the runs in this project did. Another
problem during the qPCR analysis in this project was that the standard curves did
not turn out well for all five qPCR runs. Standard curved were run in duplicates
but should favourably be run in triplicates in order determine precision of pipet-
ting, reproducibility and the overall sensitivity of the assay (Agilent Technologies,
n.d.).
Even though qPCR is supposed to have a low contamination risk (Wang et al.,
2014) this appears to be the reason for some of the results in this project. The high
values of the controls in the run for total bacteria could be due to contamination or
false positive results. The products in NTC for the E. coli samples could also be
due to contamination but also due to non-specific PCR product formation or non-
specific probe degradation (Agilent Technologies, n.d.). Even though the qPCR
results are uncertain, the results can be compared with the results in the previous
sections. The whole milk samples resulted in higher yield of DNA, indicating that
there are bacteria in the fat fraction. qPCR results also confirmed that the samples
spiked with L. reuteri PTA analysed with method B, and samples spiked with E.
coli analysed with method A, contained DNA from these bacteria, even though
they were not seen in the T-RFLP analyses (figure 8 and 9).
41
5.5 Conclusion
This project investigated the proportion of the microbiota in whole milk associated
to the milk fat fraction and if the existing method for DNA based analyses on milk
microbiota is suitable also for detection of microbiota in whole milk. The cultiva-
tion part showed that highest numbers of CFU originated from the fat fraction.
This means that existing methods risks that some bacteria can be ignored during
analyses. During the molecular part of the project, the extracted DNA yield rose in
the whole milk samples compared to the skim milk samples. The T-RFLP analysis
showed that it can be used for investigation of the milk microbiota, and that the
extraction method had limited impact on that type of analysis. Since the fat was
difficult to transfer after addition of hexane and it was easy to loose fat within
pipette tips, method A was recommended for the analysis of the microbiota in
whole milk.

42
Acknowledgements I would like to thank my supervisors Monika Johansson and Li Sun for their ex-
pertise and support during the whole project. I am very grateful that I got the
opportunity to do this project and hope that the findings contribute to the
continued work. It has been a pleasure to be a part of your group.
I also want to thank Hans Jonsson and Anton Pallin, Simon Isaksson, Johan
Dicksved and Bettina Müller for sometimes small but for me important questions
during the project and also for contribution to a nice working environment.
43
References Adams, R.M. & Moss, M.O. (2008). Food microbiology. 3ed. Cambridge: The royal society of
Chemistry
Agilent Technologies. (No date). Introduction to quantitative PCR brochure. Available at:
http://cn.agilent.com/cs/library/brochures/Brochure_Guide%20to%20QPCR_
IN70200C.pdf. 2017-05-03
Anderson, J.F. (1909). The relative proportion of bacteria in top milk (cream layer) and bottom milk
(skim milk), and its bearing on infant-feeding. The Journal of Infectious Diseases. 6(3), pp. 392-
400.
Andoh A., Tsujikawa T., Sasaki M., Mitsuyama K. & Suzuki Y. (2008). Faecal microbiota profile of
Crohn’s disease determined by terminal restriction fragment length polymorphism analysis. Ali-
mentary Pharmacology and Therapeutics. 29, pp. 75-82.
Bickley, J., Short, J.K., McDowell, D.G. and Parkes, H.C. (1996). Polymerase chain reaction (PCR)
detection of Listeria monocytogenes in diluted milk and reversal of PCR inhibition caused by
calcium ions. Letters in Applied Microbioly. 22, pp. 153-158.
Elliott, G.N., Thomas, N., Macrae, M., Campbell, C.D., Ogden, I.D. & Singh, B.K. (2012). Multi-
plex T-RFLP allows for increased target number and specificity: detection of Salmonella enterica
and six species of Listeria in a single test. PLoS ONE. 7(8), pp. 1-11.
FAO. (2013). Milk and milk products in human nutrition. Available at:
http://www.fao.org/docrep/018/i3396e/i3396e.pdf [2017-03-01]
Fricker, M., Skånseng, B., Rudi, K., Stessl, B., & Ehling-Schultz, M. (2011). Shift from farm to
dairy tank milk microbiota revealed by a polyphasic approach is independent from geographical
origin. International Journal of Food Microbiology. 145, pp. 24-30.
Griffiths, M.W. (2010). Improving the Safety and Quality of Milk, Volume 1 - Milk Production and
Processing. Woodhead Publishing. Available at:
http://app.knovel.com/hotlink/toc/id:kpISQMVMP3/improving-safety-quality/improving-safety-
quality [2017-03-24]
Huijsdens, X.W., Kinskens, R.K., Mak, M., Meuwissen, S.G.M., Vandernbroucke-Grauls, C.M.J.E.
& Savelkoul, P.H.M. (2002). Quantification of bacteria adherent to gastrointestinal mucosa by re-
al-time PCR. Journal of Clinical Microbiology. 40(12), pp. 4423-4427.
Inceoglu, O., Hoogwout, E.F., Hill, P. & van Elsas, J.D. (2010). Effect of DNA extraction method on
the apparent microbial diversity of soil. Applied and Environmental Microbiology. 76(10), pp.
3378-3382.

44
Jayarao, B.M., Pillai, S.R. Sawant, A.A., Wolfgang, D.R. & Hegde, N.V. (2004). Guidelines for
monitoring bulk tank milk somatic cell and bacterial counts. Journal of Dairy Science. 87, pp.
3561-3573.
Kemp, B.M., Monroe, C. and Smith, D.G. (2006). Repeat silica extraction: a simple technique for the
removal of PCR inhibitors from DNA extracts. Journal of Archaeological Science. 33, pp. 1680-
1689.
LaMontagne, M.G., Michel, F.C. Jr., Holden, P.A. & Reddy, C.A. (2002). Evaluation of extraction
and purification methods for obtaining PCR-amplifiable DNA from compost for microbial com-
munity analysis. Journal of Microbiological Methods. 49(3), pp. 255-264.
Li, N., Richoux, R., Boutinaud, M., Martion, P. & Gagnaire, V. (2014). Role of somatic cells on
dairy processes and products: a review. Dairy Science & Technology. 94, pp. 517-538. Lindmark Mansson, H. (2008). Fatty acids in bovine milk fat. Food & Nutrition Research. 52.
Maeda, H., Fujimoto, C., Haruki, Y., Maeda, T., Kokeguchi, S., Petelin, M., Arai, H., Tanimoto, I.,
Nishimura, F. & Takashiba, S. (2003). Quantitative real-time PCR using TaqMan and SYBR
green for actibacillus actinomycetemcomitans, porphyromonas gingivalis, prevotella intermedia,
tetQ gene and total bacteria. FEMS Immonology and Medical Microbiology. 39, pp. 81-86. Marsh, T.L., Saxman, P., Cole, J. & Tiedje, J. (2000). Terminal restriction fragment length polymor-
phism program, a web-based research tool for microbial community analysis. Applied and Envi-
ronmental Microbiology. 66(8), pp. 3616–3620.
Mertens, K., Freund, L., Schmoock, G., Hänsel, C., Melzer, F. & Elschner, M.C. (2014). Compara-
tive evaluation of eleven commercial DNA extraction kits for real-time PCR detection ofBacillus
anthracis spores in spiked dairy samples. International Journal of Food Microbiology. 170, pp.
29-37.
Prakash O., Pandey P. K., Kulkarni G. J., Mahale K. N. & Shouche Y. S. (2014). Technicalities and
Glitches of Terminal Restriction Fragment Length Polymorphism (T-RFLP). Indian journal of
microbiology 54(3), pp. 255-261.
Poms, R.E., Glössl, J. & Foissy, H. (2001). Increased sensitivity for detection of specific target DNA
in milk by concentration in milk fat. European Food Research and Technology. 2013, pp. 361-
365.
Postollec, F., Falentin, H., Pavan, S., Combrisson, J. & Sohier, D. (2011). Recent advances in quanti-
tative PCR (qPCR) applications in food microbiology. Food Microbiology. 28, pp. 848-861.
Powell, H.A., Gooding, C.M., Garrett, S.D., Lund, B.M. and McKee, R.A. (1994). Protease inhibi-
tion of the detection of Listeria monocytogenes in milk using the polymerase chain reaction. Let-
ters in Applied Microbioly. 18, pp. 59-61.
Quingley, L., McCarthy, R., O’Sullivan, O., Beresford, T.P., , Fitzgerald, G.F., Paul Ross, R., Stan-
ton, C. & Cotter, P.D. (2013 a). The microbial content of raw and pasteurized cow milk as deter-
mined by molecular approaches. Journal of Dairy Science. 96, pp. 4928-4937.
Quigley, L., O’Sullivan, O., Stanton, C., Beresford., T.P., Paul Ross, R., Fitzgerald, G.f. & Cotter,
P.D. (2013 b). The complex microbiota of raw milk. FEMS Microbiology Reviews. 37, pp. 664-
698.
Quigley, L., O’Sullivan, O., Beresford., T.P., Paul Ross, R., Fitzgerald, G.f. & Cotter. (2011). Mo-
lecular approaches to analysing the microbial composition of rawmilk and raw milk cheese. In-
ternational Journal of Food Microbiology. 150(2), pp. 81-94.
Quigley, L., O’Sullivan, O., Beresford., T.P., Paul Ross, R., Fitzgerald, G.f. & Cotter. (2012). A
comparison of methods used to extract bacterial DNA from raw milk and raw milk cheese. Jour-
nal of applied Microbiology. 113, pp. 96-105.
45
Smoczynski, M., Staniewski, B. & Kielczewska, K. (2012). Composition and structure of the bovine
milk fat globule membrane – some nutritional and technological implications. Food Reviews In-
ternational. 28(2), pp. 188-202.
Hagi, T., Kobayashi, M. & Nomura, M. (2010). Molecular-based analysis of changes in indigenous
milk microflora during the grazing period. Bioscience, Biotechnoly, and Biochemistry. 74(3), pp.
484-487.
Terry, C.F., Harris, N. & Parkes, H. (2002). Detection of Genetically Modified Crops and Their
Derivatives: Critical Steps in Sample Preparation and Extraction. Journal of AOAC International.
85(3), pp. 768-774.
Thomas, M.C., Shields, M.J., Hahn, K.R., Janzen, T.W., Goji, N. & Amoako, K.k. (2013). Evalua-
tion of DNA extraction methods for Bacillus anthracis spores isolated from spiked food samples.
Journal of Applied Microbiology. 115, pp. 156-162.
Turbes, G., Linscott, T.D., Tomasino, E., Waite-Cusic, J., Kim, J. & Meunier-Goddik, L. (2016).
Evidence of terroir in milk sourcing and its influence on Cheddar cheese. Journal of Dairy Sci-
ence. 99(7), pp. 5093-5103.
Usman, T., Yu, Y., Liu, C., Fam, Z. & Wang, Y. (2014). Comparison of methods for high quantity
and quality genomic DNA extraction from raw cow milk. Genetics and Molecular Research.
13(2), pp. 3319-3328.
von Neubeck, M., Baur, C., Krewinkel, M., Stoeckel, M., Kranz, B., Stressler, T., Fischer, L., Hin-
richs, J., Schrerer, S. & Wenning, M. (2015). Biodiversity of refrigerated raw milk microbiota
and their enzymatic spoilage potential. International Journal of Food Microbiology. 211, pp. 57-
65.
Walstra, P., Wouters, J.T.M. & Geurts, T.J. (2006) Dairy Science and Technology. 2. ed. Florida:
Taylor & Francis Group.
Wang, H-Y., Kim, S., Kim, J., Park, S-D., Uh, Y. & Lee, H. (2014). Multiplex real-rime PCR assay
for rapid detection of methicillin resistant staphylococci directly from positive blood cultures.
Journal of Clinical Microbiology. 52(6), pp. 1911-1920. Weber, M., Geißert, J., Kruse, M. & Lipski, A. (2014). Comparative analysis of bacterial community
composition in bulk tank raw milk by culture-dependent and culture-independent methods using
the viability dye propidium monoazide. Journal of Dairy Science. 97, pp. 6761-6776.
Willner, D., Daly, J., Whiley, D., Grimwood, K., Wainwright, C.E. & Hugenholtz, P. (2012). Com-
parison of DNA extraction methods for microbial community profiling with an application to pe-
diatric bronchoalveolar lavage samples. PLoS ONE. 7(4), pp. 1-12.

46
Appendix 1. Culture controls of unspiked milk
Table 5. Results from culturing unspiked milk on agar plates used for the tested bacterium species.
Controls for LAB were spread on MRS, S. aureus on MS and E.coli on VRB
Dilution of
milk control
Amounts of CFU on controls
L. reuteri PTA
(CFU)
L. reuteri DSM
(CFU)
S. aureus
(CFU)
E. coli
(CFU)
100 15 22 0 0
10-1 9 147 7 0 (1)
10-2 0 15 61 0 (1)
(1) = Colony that probably originates from another bacterium species.
CFU = Colony forming units
Table 6. Results from culturing the broths containing the bacteria on agar plates. LAB were spread
on MRS, S. aureus on MS and E.coli on VRB
Bacteria
cells L. reuteri PTA (CFU) L. reuteri DSM (CFU) S. aureus (CFU) E. coli (CFU)
101 0 0 0 0
103 1 3 2 7
CFU = Colony forming units

47
Appendix 2. Popular summary
Microbiota in the milk fat of whole milk – do we mistakenly overlook bacteria species and if so, how can they be de-tected?
Whole milk and its complex microbiota have a large impact on the quality of
cheese and the bacteria can be both positive and negative for the final prod-
uct. The analytical methods to study these bacteria have during the years
developed. However, there are still question marks regarding the identity of
the existing bacteria and their association with different fractions of the
whole milk. Current analytical methods are based on defatted milk samples,
meaning that there is a risk that some of the bacteria binding to the fat frac-
tion will not be identified.
The microbiota was in the early analyses studied through culture-dependent meth-
ods using mediums like agar and broths. Today, these techniques have developed;
giving new possibilities through molecular methods like Polymerase Chain Reac-
tion (PCR), Gel electrophoresis and Terminal Restriction Fragment Length Poly-
morphism (T-RFLP). However, there are still methods that need further develop-
ment since the molecular methods can be sensitive to the presence of interfering
substances and results can for different reasons give the wrong picture. Substances
in milk that may interfere with the analysis include proteins, calcium and fat. To
overcome the problem with the inhibitors, different methods have been applied.
Centrifugation is a common technique during the extraction of DNA that is used
to get rid of the fat. A problem with this though, is that some of the bacteria in the
milk prefer to stick to the fat and will therefore be discarded, resulting in underes-
timation of the bacteria content.
This project was carried out to investigate if the existing methods for bacteria in
de-fatted milk also can be used for analysing bacteria in the whole milk and how
big part of the microbiota that is connected to the milk fat fraction. Milk was
spiked with four different bacteria that normally occur in milk; two types of Lac-
tobacillus reuteri, Escherichia coli and Staphylococcus aureus. With the use of a
DNA extraction kit, modifications of the original protocol were evaluated and the
microbiota was studied through culturing, T-RFLP and qPCR. This resulted in an
overview of the microbiota in the samples of whole milk and how well the extrac-
tion methods had proceeded. The project is a part of a big on-going survey where

48
the overall objective is to increase the long-term profitability of the Swedish dairy
sector by improving quality management in the dairy value chain. It will contrib-
ute to the investigation of the best-suited milk for the huge varieties of cheeses.


![Case Study LiverLab...echo VIBE Dixon [2] produces inline parameter maps of fat signal percent-age (proton density fat fraction, PDFF) and effective R2*, with over-lays of the liver](https://img.dokumen.tips/doc/110x75/60a78f8d608a4770672430d5/case-study-liverlab-echo-vibe-dixon-2-produces-inline-parameter-maps-of-fat.jpg)