Embed Size (px)
Citation preview

Dixons R
etail plc Annual R
eport and Accounts 2010/11
Dixons Retail plc Maylands AvenueHemel HempsteadHertfordshireHP2 7TG
Tel 0844 800 2030www.dixonsretail.com
Dixons Retail plc Annual Report and Accounts 2010/11
Bringing life to technology

Dixons Retail plcAnnual Report and Accounts 2010/11
Dixons Retail plc is a specialist electrical retailer and services company which sells consumer electronics, personal computers, domestic appliances, photographic equipment, communication products and related services.
We are one of Europe’s leading specialist electrical retailing groups. We trade through over 1,200 stores and online, spanning 28 countries and we employ 38,000 people.
www.dixonsretail.com
Designed and produced by MerchantCantos www.merchantcantos.com
Photography by Dennis Davis: Dennis Davis Photography and Dixons Retail plc Digital Studio.
Printed at St Ives Westerham Press Ltd, ISO9001, ISO14001, FSC certified and CarbonNeutral
The papers used in this report are Revive 50:50 Silk and Revive 50:50 Offset. They are produced from 50% recycled fibre from both pre- and post-consumer waste sources, together with 50% Elemental Chlorine Free fibre from well-managed forests independently certified according to the rules of the Forest Stewardship Council. The inks used are all vegetable oil based.
Dixons Retail plc 01 Annual Report and Accounts 2010/11
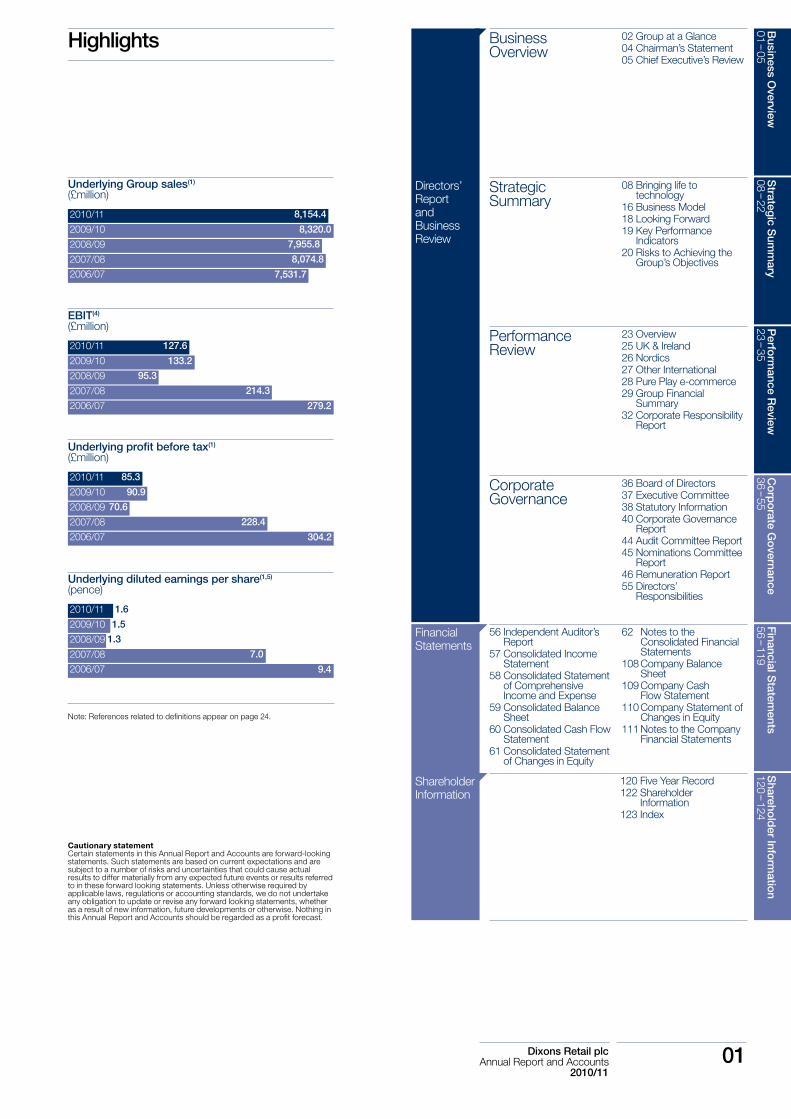
EBIT(4)
(£million)
2010/11 127.6
133.2
95.3
214.3
279.2
2009/10
2008/09
2007/08
2006/07
Underlying diluted earnings per share(1,5)
(pence)
2010/11 1.6
1.5
1.3
7.0
9.4
2009/10
2008/09
2007/08
2006/07
Underlying profit before tax(1)
(£million)
2010/11 85.3
90.9
70.6
228.4
304.2
2009/10
2008/09
2007/08
2006/07
Underlying Group sales(1)
(£million)
8,154.4
8,320.0
7,955.8
8,074.8
7,531.7
2010/11
2009/10
2008/09
2007/08
2006/07
Highlights
FinancialStatements
Shareholder Information
Directors’ Report and Business Review
CorporateGovernance
36 Board of Directors37 Executive Committee38 Statutory Information40 Corporate Governance
Report44 Audit Committee Report45 Nominations Committee
Report46 Remuneration Report55 Directors’
Responsibilities
56 Independent Auditor’s Report
57 Consolidated Income Statement
58 Consolidated Statement of Comprehensive Income and Expense
59 Consolidated Balance Sheet
60 Consolidated Cash Flow Statement
61 Consolidated Statement of Changes in Equity
62 Notes to the Consolidated Financial Statements
108 Company Balance Sheet
109 Company Cash Flow Statement
110 Company Statement of Changes in Equity
111 Notes to the Company Financial Statements
120 Five Year Record122 Shareholder
Information123 Index
Performance Review
23 Overview25 UK & Ireland26 Nordics27 Other International28 Pure Play e-commerce29 Group Financial
Summary32 Corporate Responsibility
Report
Strategic Summary
08 Bringing life to technology
16 Business Model18 Looking Forward19 Key Performance
Indicators20 Risks to Achieving the
Group’s Objectives
BusinessOverview
02 Group at a Glance04 Chairman’s Statement05 Chief Executive’s Review
Note: References related to definitions appear on page 24.
Cautionary statement Certain statements in this Annual Report and Accounts are forward-looking statements. Such statements are based on current expectations and are subject to a number of risks and uncertainties that could cause actual results to differ materially from any expected future events or results referred to in these forward looking statements. Unless otherwise required by applicable laws, regulations or accounting standards, we do not undertake any obligation to update or revise any forward looking statements, whether as a result of new information, future developments or otherwise. Nothing in this Annual Report and Accounts should be regarded as a profit forecast.
Business O
verview01 -- 05
Strategic S
umm
ary08 -- 22
Perform
ance Review
23 -- 35C
orporate G
overnance36 -- 55
Financial Statem
ents56 -- 119
Sharehold
er Information
120 -- 124
02 Dixons Retail plcAnnual Report and Accounts 2010/11
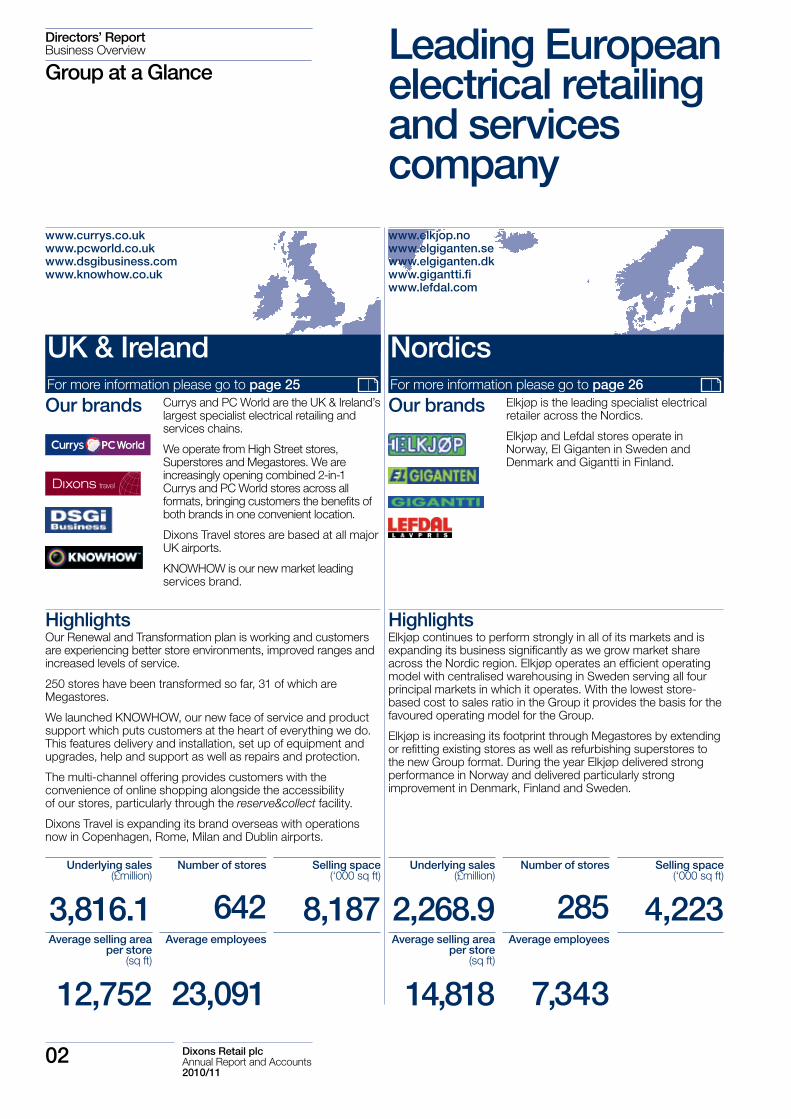
UK & IrelandFor more information please go to page 25
NordicsFor more information please go to page 26
Directors’ ReportBusiness Overview
Group at a GlanceLeading European electrical retailing and services company
Currys and PC World are the UK & Ireland’s largest specialist electrical retailing and services chains.
We operate from High Street stores, Superstores and Megastores. We are increasingly opening combined 2-in-1 Currys and PC World stores across all formats, bringing customers the benefits of both brands in one convenient location.
Dixons Travel stores are based at all major UK airports.
KNOWHOW is our new market leading services brand.
Elkjøp is the leading specialist electrical retailer across the Nordics.
Elkjøp and Lefdal stores operate in Norway, El Giganten in Sweden and Denmark and Gigantti in Finland.
www.currys.co.ukwww.pcworld.co.ukwww.dsgibusiness.comwww.knowhow.co.uk
HighlightsOur Renewal and Transformation plan is working and customers are experiencing better store environments, improved ranges and increased levels of service.
250 stores have been transformed so far, 31 of which are Megastores.
We launched KNOWHOW, our new face of service and product support which puts customers at the heart of everything we do. This features delivery and installation, set up of equipment and upgrades, help and support as well as repairs and protection.
The multi-channel offering provides customers with the convenience of online shopping alongside the accessibility of our stores, particularly through the reserve&collect facility.
Dixons Travel is expanding its brand overseas with operations now in Copenhagen, Rome, Milan and Dublin airports.
HighlightsElkjøp continues to perform strongly in all of its markets and is expanding its business significantly as we grow market share across the Nordic region. Elkjøp operates an efficient operating model with centralised warehousing in Sweden serving all four principal markets in which it operates. With the lowest store-based cost to sales ratio in the Group it provides the basis for the favoured operating model for the Group.
Elkjøp is increasing its footprint through Megastores by extending or refitting existing stores as well as refurbishing superstores to the new Group format. During the year Elkjøp delivered strong performance in Norway and delivered particularly strong improvement in Denmark, Finland and Sweden.
Underlying sales(£million)
2,268.9
Underlying sales(£million)
3,816.1Average selling area
per store(sq ft)
12,752
Average selling area per store
(sq ft)
14,818
Number of stores
285
Number of stores
642Average employees
23,091
Average employees
7,343
Selling space(‘000 sq ft)
4,223
Selling space(‘000 sq ft)
8,187
Our brandsOur brands
www.elkjop.nowww.elgiganten.sewww.elgiganten.dkwww.gigantti.fiwww.lefdal.com

Dixons Retail plc 03 Annual Report and Accounts 2010/11
Other InternationalFor more information please go to page 27
Pure play e-commerceFor more information please go to page 28
Underlying sales by division(£million)
12 34
UK & Ireland £3,816.1mNordics £2,268.9m Other International £1,226.7m Pure play e-commerce £842.7m
1
2
3
4Directors’ ReportBusiness Overview
Kotsovolos is Greece’s leading specialist electrical retailer.
In Italy, we operate Unieuro electrical stores with some as combined 2-in-1 Unieuro and PC City stores.
In the Czech Republic and Slovakia, we operate under the Electro World brand.
In Turkey, we operate the Electro World brand with a local joint venture partner.
PIXmania is one of the largest pure play electrical retailers in Europe operating in 26 countries.
Dixons.co.uk is one of the leading UK online electrical retail brands.
www.kotsovolos.grwww.unieuro.itwww.electroworld.czwww.electroworld.grwww.electroworld.com.tr
www.pixmania.comwww.dixons.co.uk
HighlightsThe turnaround in Italy remains on track and the business delivered a positive EBITDA performance in the year, the first for several years.
Trading conditions in Greece remain difficult, however, Kotsovolos continues to generate cash and as market leader is well positioned to gain further market share.
Electro World in Central Europe is already a leading brand and is well positioned for the development of the Czech and Slovakian markets in the medium term.
Electro World in Turkey remains a long term opportunity for the Group with our joint venture partner.
HighlightsOur pure play brands work together with our store based multi-channel brands to provide our customers with the shopping trip that suits their needs.
Overall the Group continues to see strong growth in the multi-channel operations.
The functionality of PIXmania’s e-merchant platform was developed further for Dixons.co.uk to provide an improved online shopping experience.
Underlying sales(£million)
1,226.7
Underlying sales(£million)
842.7Average selling area
per store(sq ft)
14,380
Average selling area per store
(sq ft)
1,412
Number of stores
308
Number of stores
17Average employees
6,191
Average employees
1,398
Selling space(‘000 sq ft)
4,429
Selling space(‘000 sq ft)
24
Our brands Our brands
Business O
verview01 -- 05

04 Dixons Retail plcAnnual Report and Accounts 2010/11
Directors’ ReportBusiness Overview
Chairman’s StatementJohn Allan
This has been a year when the economic environment has remained particularly challenging in many of the markets in which we operate. The Group has, however, remained focused on delivering a better experience for customers, which will position the business for significant progress when the economic environment improves.
I am conscious that the Group has made only limited progress in financial returns year on year, but I can assure you that the Board is alive to the need to improve returns for shareholders. The work under the Renewal and Transformation plan has continued which will make the business better for our customers, simpler for our colleagues to manage and cheaper to run. This has started to show encouraging developments with improvements in customer satisfaction measures; we have maintained gross margins over the last two years in the face of competitive and challenging markets; our operations in the Nordics continue to go from strength to strength with sales up eight per cent. over the last year; we have taken decisive action in Spain to close our operations in a market where we saw little opportunity for short to medium term profitable recovery; and we have reduced costs by £50 million in the year.
Delivering a better experience for customers will position the Group for significant progress when the economic environment recovers
In March this year we launched the KNOWHOW brand in the UK which encompasses all our after-sales services. KNOWHOW clearly puts the customer at the heart of everything we do and empowers all our colleagues to focus determinedly on our customers. Our KNOWHOW distribution and repair centre in Newark is world class. The logistics, distribution, repair and services areas are far better than many of our competitors. The efficient operation illustrates how far we have progressed in getting it right for customers first time.
During the early part of the financial year we successfully issued a £150 million bond due 2015, which enabled us to repurchase just under half of the Group’s existing 2012 Bonds as well as extend the maturity of the Group’s working capital facility to 2013. This gives the Group a much more appropriate maturity profile on its debt facilities.
We have made significant progress in transforming our stores with over 360 stores now in the Group’s new format, including 65 Megastores across the Group. With a solid base of stores now transformed and significant improvements having been made to the Group’s operational processes we can now manage our capital expenditure carefully to ensure the Group has adequate capital to repay the remaining 2012 Bonds irrespective of the trading environment.
Recognising challenging conditions in some of our markets, and the ongoing business restructuring under the Renewal and Transformation plan, we have reviewed the balance sheet and made impairment and other non-underlying charges totalling £309.4 million. The additional cash impact of these charges is estimated as £39 million, of which approximately £8 million was incurred in 2010/11.
This year, the Group selected two national charities to support, Lifelites and the e-Learning Foundation, which help to provide access to technology for disadvantaged children or those with disabilities. I am very proud of our colleagues, who have organised so many fundraising activities throughout the year for both these charities as well as a number of charities local to the communities in which our stores operate.
This year we welcomed Dharmash Mistry to the Board as a non-executive director, who has substantial retail experience in consumer-facing and internet businesses.
The year ahead remains a challenging one, particularly in the UK, Greece and Italy. Your Board is confident that the changes that have been, and are being, made to the Group will enable it to navigate the difficult environment ahead in a better shape than it has ever been. I would like to thank the management team led by John Browett, and in addition all of our colleagues across the Group, for their persistent hard work. I am convinced that we will emerge increasingly as a winner in the electricals and services market as the economy recovers.
John AllanChairman

Dixons Retail plc 05 Annual Report and Accounts 2010/11
Business O
verview01 -- 05
Directors’ ReportBusiness Overview
Chief Executive’s ReviewJohn Browett
The tough economic backdrop in many of our markets has made this a difficult year. Nonetheless, we have been able to balance improving our offer for customers whilst maintaining profitability. The shopping trip we provide to customers is more competitive and we see the impact on our business as we make our offer even better. Customers come to our stores because they are looking for great new products; however, they need a complete solution to get the best out of the latest technology. It is our job to make sure they leave our stores with the right products and services to meet all their needs. Increasingly, we are seeing the benefits of selling services effectively, particularly with the launch of KNOWHOW in the UK.
Our Customer Plan is at the heart of the business and a key element of delivering on our core purpose of bringing life to technology, so I thought I would again lay out our progress in the last year under the plan. As ever, our objective is to make the business better for customers, easier for colleagues and cheaper to operate.
They’re interested in working out what’s right for meOur unique FIVES training programme has formed the basis of ensuring all our colleagues across Europe are equipped with the right tools to understand and meet customers’ needs. This year we have continued to refine and develop FIVES training, with colleagues attending many refresher courses. Alongside this we have introduced better product learning tools under our web
based Product Learning Centre. We have also worked with suppliers in the UK to hold over 900 workshops, enabling our colleagues to immerse themselves in fully understanding the features and benefits of a wide range of products, ensuring they can explain the exciting technology we sell to our customers.We have also introduced a new colleague scheduling tool to all our shops in the UK to better ensure colleague availability meets our customer footfall patterns. This has already improved the measure of our colleague availability to our customers’ footfall in our stores by 20%.
Our objective is to be famous for great service. Our operations in the Nordics are already famed for excellent customer service and we can take many learnings from them and make further improvements as we roll out our vision to our other businesses. Through the actions so far we have made great progress with customer satisfaction metrics improving significantly since we started the Renewal and Transformation plan. In the year ahead there is much more we can do. Our new KNOWHOW services brand, launched in the UK at the beginning of 2011, embodies the behavioural attitudes that deliver a fantastic experience for our customers. Improved services and enhanced training plans will give our colleagues further tools to ensure every customer gets the right solution for their needs.
It’s an exciting place to beWe continue to develop our stores, making them exciting places to experience technology and find the right solutions for our customers’ needs. During the year we transformed over 130 stores across the Group, which included 32 Megastores. In Italy the combined 2-in-1 format of Unieuro and PC City is now open in 19 locations and is proving to be a format that is as popular with Italian customers as it is in the UK. This to me proves that a well designed store and customer offer works across many markets. In the Nordics we now have 20 Megastores and will continue to transform stores to the larger Megastore format there in the years ahead. In the UK we now operate 31 Megastores and 56 combined 2-in-1 Currys and PC World superstores. We have also introduced the 2-in-1 format to the High Street with great initial results. These new store formats are consistently delivering gross profit uplifts of between 15% and 20% and in some cases higher in the first year versus the unrefurbished estate. Encouragingly they are maintaining these uplifts into the second year.
Our objective is to make the business better for customers, easier for colleagues and cheaper to operate
Customer plan
It’s easy to shop
It’s an exciting place to be
They’re interested
in working out what’s right
for meThey deal with queries and complaints brilliantly
They make things work and keep
them working
The prices are good
I can get what I want
when I want it

06 Dixons Retail plcAnnual Report and Accounts 2010/11
Chief Executive’s Reviewcontinued
Directors’ ReportBusiness Overview
A significant validation of the changes we are making manifested itself in the fact that we were a key partner for Apple’s launch of the iPad in the UK. The fact that our stores are great places for new technology where products can be demonstrated and their features explained fully is why Apple chose to partner with us on this important product launch. In October 2010 we launched an exciting new advertising campaign around the Megastore format in the UK, featuring R2D2 and C3PO from the Star Wars films, which was hugely popular with customers. It is testament to the work we are doing that Lucas Films allowed their iconic Star Wars characters to be used to advertise ‘the greatest technology stores in our universe’. We have also started to implement in-store demonstrations which bring the features and benefits of kitchen appliances to life in our stores with the introduction of live kitchens.
Having integrated PIXmania’s market leading e-merchant platform into our UK sites we have now been able to improve the customer offer on both the pure play internet business of dixons.co.uk and our multi-channel businesses such as currys.co.uk and pcworld.co.uk.
We are also looking at ways to raise the bar in our store formats even higher and during the year we opened a trial store in Birmingham called Black. The aim is to trial new ways of merchandising and demonstrating high end technology products as well as integrating our new KNOWHOW services into the proposition. During 2011 we will learn from this trial and will be using the elements that customers like the most in all our store transformations.
It’s easy to shopOur new store layout and improved websites make it easier than ever before for our customers to choose the right product. We have made great progress this year in helping customers choose the right product for their needs through clearer signage and better information at point of sale, helping to untangle technology for our customers.
Our reserve&collect facility is proving to be a great success with our customers, giving them the ease of the internet combined with the convenience of our stores. In the last year we have seen our multi-channel internet sales, driven by reserve&collect, rise by 13% across the Group.
In the year ahead we will make further improvements to our multi-channel offering providing customers with improved information on our websites as well as access to a wider range of products online and in-store through our websites.
I can get what I want when I want itWe have launched our own label brands of Currys and PC World essentials, Logik, Advent, Goji and Sandstrøm. Having had over 70 different own brands previously, this simplified our offering and gives customers a clear good-better-best range of products from which to choose.
With our partner, Phones4U, we opened 57 shop in shops, giving our customers access to the latest smartphones and networks from one of the UK’s largest mobile phone retailers.
We must ensure that we provide excellent service to our customers every time we come into contact with them. Through our ‘At home with FIVES’ training we can ensure that a customer has everything they need when we visit their homes, reducing the need for a further call out by 52%.
Having made significant progress in managing our stock in the warehouse and in-store across the Group, this year we plan to simplify processes still further which will improve availability online and in-store while freeing up more time for our colleagues to spend with customers.
As a part of the KNOWHOW rollout to our home services team we have introduced Personal Digital Assistants (PDAs) to the team which will help improve customer feedback and time management of our colleagues.

Dixons Retail plc 07 Annual Report and Accounts 2010/11
Business O
verview01 -- 05
The prices are goodOur scale across Europe means that we are continually able to give our customers the latest products at the best prices. We monitor prices against our competitors regularly with, for example, over 300,000 products checked every week in the UK, so we know we are offering real value to our customers every day. All this is backed up by our market leading price promise to refund 110% of the difference if a customer finds the same product cheaper elsewhere.
There are further changes we plan to make in the year ahead. By simplifying our promotions processes, for example, we can give customers better deals on new products by making our own brand products even better value through cost reductions and giving customers good, better and best choices across our ranges. We are also conscious that not all of our customers are aware of the significant value we offer compared to our competitors, so we will start to improve the communication of that messaging in the year ahead.
They make things work and keep them workingThis was a significant year for our support services. We brought the majority of the service operations in house in the UK. We know we can only improve the service we offer by owning and being directly responsible for all contacts with our customers. That enabled us to launch the KNOWHOW brand bringing together the home services, distribution, contact centre and repair operations. With all these services now operating as one clear customer focused brand we have already started to see the benefits for our customers. I am immensely proud of our colleagues’ enthusiasm for the KNOWHOW brand, but more importantly their desire to really help customers as much as possible every step of the way through the lifecycle of the technology they use. Our turnaround times for repair products is faster, with 93% being returned at a pre-booked time. Our right first time delivery is one of the highest in the industry and our customer satisfaction levels are continually improving.
Under the KNOWHOW brand we will make further improvements to the services our customers receive by, for example, shortening the repair times even further; enabling customers to track their product while it is being repaired; and a ‘no lemons’ policy which means that, under our support agreements, if we fail to fix the product properly after three attempts a customer can request a replacement. We will also start to roll out the KNOWHOW services to our international businesses. This is a multi-year project which will require tailoring to each market, but our customers need our help with their products wherever they are, so this presents a major opportunity for our customers and our shareholders.
They deal with queries and complaints brilliantlyThis year we consolidated our UK call centres into one location in Sheffield as well as enabled many of our call centre colleagues to work from home, increasing the ability to match colleague availability with customer calls. By analysing the reasons why customers call us and providing them with better information to reduce the need to call us, we have reduced the number of calls we receive by 11%. Together with increased cross skilling we have increased the availability and ability of our colleagues to resolve customers’ issues. As a result we have seen increased customer satisfaction and reduced repeat calls. We have also made the processes for stores dealing with customers’ issues easier for our colleagues and better for our customers. In the year ahead we will improve our systems further so that customers and their products can be identified more easily when they call. We will continue to identify the root cause of customer calls and eliminate the need for customers to call in the first place.
As you can see, the volume of work on our Renewal and Transformation plan is still very high. Our reward is improving customer satisfaction and higher share in many of our markets. We are starting to stand out for customers and we have much more to deliver to make our customers’ shopping trip even better. These achievements would not be possible without the enthusiasm, dedication and hard work of our 38,000 colleagues across the business and I would like to thank them all for their contribution to making Dixons Retail a great business.
OutlookThe economic backdrop remains challenging, particularly in the first half as we anniversary the World Cup and iPad launch. However the Group is well prepared for this environment. We are creating a market leading differentiated customer offer, leaving us well set to emerge from the current climate ahead of the competition.
John BrowettChief Executive

08 Dixons Retail plcAnnual Report and Accounts 2010/11
“Point and shoot and the moment’s captured. Transferred over to my iPad 2 and my photos are ready to edit, print or upload to the internet to share with my mates. The guys at Currys helped me find the right camera, lens and memory card too. They explained how to use KNOWHOW online storage solutions where I can save my precious photos, music and videos. It’s amazing. It’s exactly what I need. Shoot, save and share!”
‘‘ I love to capture the moment’’
Technology at your fingertips with the iPad 2. Games, maps, apps, reading, films and photos have all been made faster and easier. Talk to your friends face to face using FaceTime and instantly upload photos and films for sharing online. Tablets are revolutonising the way we interact with our digital content.
The Nikon D5100 Digital SLR Camera delivers crystal clear images. It boasts Full HD 1080p video recording options with a 3” vari-angle LCD monitor making it easy to look back at photos and films.
Have fun taking perspective shots with the Nikon 10.5mm SLR Fisheye Lens. The 8GB Kodak High Speed Memory Card means you can take action shots in quick succession and has plenty of space for storing photos and films.

Dixons Retail plc 09 Annual Report and Accounts 2010/11
Strategic S
umm
ary08 -- 22

10 Dixons Retail plcAnnual Report and Accounts 2010/11

Dixons Retail plc 11 Annual Report and Accounts 2010/11
“You don’t need to use a controller with XBox Kinect™, just your body and voice. It’s magic! We jump, dance, drive and play and the Kinect™ senses it all. It’s even better when Mum and Dad or even Gran and Grandad join in. We can watch movies too. They look amazing on the 3DTV which the KNOWHOW man put on the wall. He even set up Mum and Dad’s Bose DVD home entertainment system and connected the Kinect™ to the internet. Our family has so much fun, I can’t wait for the weekends!”
‘‘ We just want to have fun’’
For a premium home cinema surround sound experience, connect a Bose Lifestyle® 38 DVD home entertainment system to your TV. The HD viewing quality brings your films to life. Audio can be shared in up to 14 rooms, even outdoors. It can also store up to 340 hours of digital music.
The Xbox Kinect sensor puts you into the heart of the gaming action like never before. Your body is the game controller. You don’t have to hold controllers or struggle with wires. Just jump in front of the sensor and start playing.
Put on your 3D glasses and experience breathtaking 3D films and TV programmes on the Samsung 55” HD LED 3D Smart TV with integrated Freeview. Its Smart Hub provides access to the internet with features and apps. Watch films through a connected games console or stream them through the internet.
Strategic S
umm
ary08 -- 22

12 Dixons Retail plcAnnual Report and Accounts 2010/11
“A new baby boy, a football mad son, and a tap dancing daughter equates to a mountain of washing alone. I needed a large, high performance energy-efficient washing machine. The team at Currys suggested the LG Direct Drive – the answer to my prayers!It can take a huge 11kg wash load and is packed with features such as allergen sanitisation and Scrub motion – perfect for the kids’ clothes. It’s even got a Baby care wash programme and it’s so quiet. With KNOWHOW’s WHATEVER HAPPENS Kitchen Cover, I’ve got peace of mind too.”
‘‘ That’s a load off my mind’’
Steam irons take the strain out of ironing, cutting through the pile of ironing in no time. The ceramic soleplate and variable steam settings mean you can use the GV8360 Pro Express Turbo Steam Iron as a dry iron too.
Washing larger loads is light work with the 11kg load LG Direct Drive Washing Machine. Inverter Technology means it effectively removes the dirt and bacteria that can aggravate allergies and has an A++ rating for energy efficiency.
We will deliver your appliance at a time to suit you and we’ll even recycle your old product for free. If you want us to install it, we KNOWHOW. If it needs a minor or major repair, we’ll fix it....and if we can’t, we’ll replace it. If you simply need a bit more help to get the most out of your purchase or even want an upgrade, we KNOWHOW to help you.

Dixons Retail plc 13 Annual Report and Accounts 2010/11
Strategic S
umm
ary08 -- 22

14 Dixons Retail plcAnnual Report and Accounts 2010/11

Dixons Retail plc 15 Annual Report and Accounts 2010/11
“Just bought myself a state of the art TV from Currys. Lovely stuff. Slimline LED screen, Hi Def and 3D ready to watch the footie with the lads. Trouble is, I said to the bloke who served me at Currys that I knew how to install it and set it up. Thought it would be easy. Turns out it’s pretty technical stuff and I can’t work out what goes where. I needed someone with KNOWHOW . Luckily, I called Currys and they said they will arrange for someone from the KNOWHOW team to come over and install it for me. Now all we need to worry about is keeping the beer chilled!”
‘‘ I need someone withKNOWHOW ’’
Help & SupportNeed data transferring to a new PC, help with getting rid of a virus on your laptop or help restoring missing data? We’re here to support you so you KNOWHOW to do it next time. Or, simply call us and we’ll help you 24/7 – again and again.
Deliver & InstallOur KNOWHOW team can deliver and install your new product on a day and time to suit you, seven days a week. We’ll even text you the night before to remind you we’re coming.
Set Up & UpgradeLaptops, cameras, tablets, home networks.... we KNOWHOW to set them up for you. If your PC needs more memory or you simply need us to help with a software upgrade, we can visit you at home or you can just pop into a store.
Repair & ProtectTV on the blink? Games console isn’t working quite right? We can repair your faulty PC, TV, games console and more in our state of the art repair lab and keep you up to date with its repair progress. We KNOWHOW to fix it for you.
Strategic S
umm
ary08 -- 22

16 Dixons Retail plcAnnual Report and Accounts 2010/11
Store Internet Products After-salesservice
Support
Value
Low cost operating model
Choice Service
Customer insight
Sales advice Easy to shop Playtables 2-in-1 store offering
Multi-channel Pure play reserve&collect Specialist
Great brands Wide range Exclusivity Own brand product
Delivery & installation Set up & upgrade Help & support Repair & protect
Directors’ ReportStrategic Summary
Business Model
Bringing life to technologyOur customers are at the centre of an increasingly digitised world which they can access and utilise in numerous different ways. Whether this be social media, online gaming, downloading movies, sharing pictures, cloud computing or energy efficient products, customers do not just come into our stores to buy products, but to find a solution to a need. It is our job to help find the right solution for our customers, ensuring they get the most out of the products they buy. As such we put our customers at the heart of everything we do. Our core purpose of bringing life to technology embodies our belief that in this increasingly complex world our customers need solutions and help. From this core purpose we have built our customer plan which is discussed in more detail in the Chief Executive’s Review on pages 5 to 7.
As one of Europe’s leading specialist electrical retailing and services companies we operate a business model that supports delivery of our Customer Plan.
Customer insightIn order to ensure we understand what our customers want, how they use the products they buy from us, and what they think of the service they get from us, we use extensive customer insight. This includes discussions at customer panels, interviews, home visits and other research. This is supported by mystery shopping in our own and competitors’ stores, exit surveys and customer feedback. We use this information to build our ranges, improve our stores and services as well as help us with other business decisions.
Stores and internetConvenience and ease of navigation are key in attracting customers to shop with us. Through the Renewal and Transformation plan (more detail of which can be found at www.dixonsretail.com) we are improving our stores, making them easier to shop with, for example, improved navigation, better signage, playtables to allow customers to interact with products before they buy, as well as good advice on features and benefits from our colleagues. We are also combining our PC World and Currys stores into 2-in-1 stores which give our customers greater access to our specialist computing offer combined with our market leading mixed electrical offering, and enables us to improve our sales densities and rent to space mix. We favour the combined store format and we are implementing this in our stores across the Nordics and Other International businesses.
Our FIVES sales training programme combined with our Product Learning Centres provides our colleagues with the right tools to really understand customers’ needs and to provide them with the complete solution to properly meet those needs. We will continue to improve the training of our colleagues and the ways in which we can help them be experts in the products we sell.
Many of our customers research products online before coming in to store to buy, so ease of navigation, clear descriptions of products and related information are important for our websites. We are increasingly seeing customers combining the ease of the internet with the convenience of our stores by using our reserve&collect service. In the UK, we have implemented the market leading e-merchant platform from PIXmania which enables us to continually evolve and improve our online offer to ensure customers are engaged with our internet operations.
ProductsCombining our customer insight with our market strength across Europe we can make sure we have the right range of products in our stores to suit customers’ needs. Our scale means that we can work with suppliers to showcase the latest technology and products in our stores, with areas dedicated to key suppliers’ products. This also enables us to get products exclusively in our stores, such as the iPad on launch in 2010.
Own brand products enable us to offer customers a greater range and choice of products at competitive prices. We have defined a clear good-better-best brand range of: Currys and PC World essentials; Logik; Advent; Goji; and Sandstrøm brands.
Customers are at the heart of everything we do

Dixons Retail plc 17 Annual Report and Accounts 2010/11
Directors’ ReportStrategic Summary
After-sales services and supportMany of our customers need help with their products, whether it be delivery and installation, keeping their products up and running or repairing them when things go wrong. Our business in the UK & Ireland sets the benchmark for our services infrastructure. In May 2011 we relaunched our services under the new KNOWHOW brand with four clear pillars of support for customers to choose from.
We operate the largest network of two man deliveries in the UK with around 60,000 deliveries per week enabling us to provide customers with the convenience of next day delivery in a three hour time slot or the value of a free delivery later. Our KNOWHOW team in store, in our call centre and out in the field can provide set up and upgrade services as well as online fix and back up services. Our market leading range of help and support services help ensure a customer has the backing of expertise and support that keeps their technology up and running. In the event that a customer has a problem with their product we fix it. For example our state of the art repair facility in Newark repairs 600,000 laptops and televisions each year and is able to repair and return a laptop in six days. We offer customers a choice of support agreements such as ‘Premier’ which provides them with a loan TV, for example, if theirs needs to be taken in for repair.
Business Modelcontinued
Our low cost operating model drives continuous improvement in our processes and services. This continuous improvement enables us to re-invest back into providing better value products and services to our customers.
Direct ownership of the service infrastructure from end to end means we can ensure the best service at all touch points with our customers. We believe this gives us a unique operating model for a specialist electrical retailer and a significant competitive advantage in meeting the needs of our customers.
While much of the improvement work has been focused on the UK, core elements of the business model exist in our businesses in the Nordics and Other International divisions. Further services under the KNOWHOW brand will be rolled out to these divisions over the medium term.
Low cost operating modelDixons Retail operates in a highly competitive market. In order to deliver an unbeatable customer offer we need to have a low cost to sales ratio relative to the service based business we run. This means we have to:
have sufficient scale economics in each market – usually number one or two by market share;
lean business processes – minimising wasteful activity;
design our business processes end to end to minimise cost and deliver a high quality of service; and
find new ways to continually improve what we do.
We use a technique called Lean Six Sigma to re-engineer our business processes to make them better for customers, easier for colleagues to operate and therefore cheaper to run.
Through this low cost operating model we can deliver an unbeatable offer for customers meaning that they reward us with increased market share and improved returns for our shareholders.
WEH = Whateverhappens customer support agreements
Delivery & Recycling
Built-in Cooker Installation
Cooker Installation
Washer and Dishwasher Installation
Fridge Freezer Installation
TV Set Up & Demo
TV Wallmount & Demo
Integrated Appliance Install
Home Theatre Set Up & Demo
Aerial Install & Tune
Aerial Multiroom Install and Tune
Freesat Setup & Demo
Freesat Install & Demo
Freesat + Install & Demo
Set up and Support
Store & Protect
Virus & Spyware Removal
24 7 Help and Advice
Store & Share
PC Tune Up
System Reset & Restore
Infinity
Data Transfer & Check
Data Wipe & Check
Data Rescue & Protect
Computer Set up & Personalise
Software Install & Check
Operating System Upgrade & Check
Camera Set up & Personalise
Component Install & Check
Network Set up & Secure
Memory Install & Check
Tablet Set up & Tutorial
Tablet Set up Tutorial & Internet Protection
Netbook Set up
Knowhow Appcentre
Network Fault & Fix
Aerial Fault & Fix
WEH - Computing
WEH Premier -Computing
WEH - TV
WEH Premier- TV
WEH - Kitchen
WEH Premier - Kitchen
WEH - Technology
Instant Replacement
Games Console Fault & Fix
Desktop PC Fault & Fix
Digibox Fault & Fix
Laptop Fault & Fix
TV Fault & Fix
Strategic S
umm
ary08 -- 22

18 Dixons Retail plcAnnual Report and Accounts 2010/11
Directors’ ReportStrategic Summary
Looking Forward
The Group is making significant progress under the Renewal and Transformation plan. The operational processes across the business are on a firmer foundation, the customer offer is better than it has ever been and costs are under control.
Our offer for customers must continually improve. Here we set out just some of the innovations in the business which will enable us to remain one step ahead of the competition and firmly focused on customer needs in every market in which we operate.
This year we opened an exciting new concept store called Black in Birmingham. This is a 15,000 sq ft high street store on three floors, totally new in design and positioned as the ultimate place to get up close with the most wanted gadgets around. It is a must-visit store, appealing to customers who love their brands and how their kit looks. We are using Black to conduct a variety of trials, exploring new ways of making the shopping trip and the presentation of our exciting technology and services even better for customers. A totally new store layout, department style disciplines in categories, interactive displays and new ways of merchandising are all being explored in this store. We have embedded the new KNOWHOW services brand in the store, providing areas for customers to use the services we can provide in a more interactive and relaxed environment. Our colleagues have been encouraged to explore new ways of excelling at providing high levels of services and better solutions for customers. The customer feedback has been very encouraging and we are already taking learnings from this format into the rest of the store portfolio across the Group.
Simplifying the shopping trip for our customers is key to helping them buy the right solution as well as getting the best out of the technology they buy. This is why we created the customer journey in each category. We have trialled new ways of doing this in Black and elsewhere in our portfolio. We have now developed an improved customer journey around a vision which not only simplifies the technology for customers, but also helps them choose other products and services to get the complete solution. Trials of this have proved to be very successful and set the groundwork for improved customer journeys in other categories.
Added value services are a key differentiator in our business model (as discussed on page 17) and we will continue to innovate in this area. For example, having introduced PDAs for our delivery and installation team we are looking at other ways to use this technology, such as dynamic routing of our colleagues out in the field to make sure we meet and even exceed customers’ needs, the ability to provide customers with added value services while in their homes rather than on a second call out and use of the data provided by the PDAs to improve processes.
A lot of exciting things are going on, but we won’t sit still. We will continue to innovate to deliver a better shopping trip for our customers.
Keeping ahead of the competition

Dixons Retail plc 19 Annual Report and Accounts 2010/11
Directors’ ReportStrategic Summary
Key Performance Indicators
Financial and operational
Definition PerformanceTotal underlying sales
Growth in total underlying sales. The ability to grow sales is an important measure of a brand’s appeal to customers and its competitive position.
Like for like sales
The Board measures like for like sales as sales in stores that have been open for a full financial year both at the beginning and end of the financial period and are calculated using constant exchange rates. Customer support agreement sales are excluded from all UK like for like calculations. Operations that are subject to closure have sales excluded as of the announcement date. Stores subject to a refurbishment are excluded during the period of refurbishment. All e-commerce pick-up store sales are included in like for like sales. Sales targets and growth are set relative to the market and expected economic conditions.
Market position In line with the Group’s strategy to be the leading specialist electrical retailer in Europe, this is an important measure of how well customers are being engaged by the Group’s brands in each market. Retailing operations should be, or be capable of becoming, the number one or number two specialist electrical retailer in their market, measured by market share.
No.1 market positions in:
UK & Ireland Nordics Greece Czech Republic
Underlying operating profit
Continued growth of underlying operating profit enables the Group to invest in its future and provide a return for shareholders. Targets are set relative to expected market performance.
Underlying profit before tax
Continued growth of underlying profit before tax represents a measure of Group performance to external investors and shareholders. Targets are set relative to expected market performance.
Free Cash Flow The Group defines Free Cash Flow as net cash generated from operations, less net finance costs, taxation and net capital expenditure and excluding certain discrete items such as special pension contributions. The management of cash usage, in particular working capital employed in the business, optimises resources available for the Group to invest in its future growth and to generate shareholder value.
(£million)
8,154.4
8,320.0
7,955.8
8,074.8
7,531.7
2010/11
2009/10
2008/09
2007/08
2006/07
(£million)
127.6
133.2
7,955.8
8,074.8
7,531.7
2010/11
2009/10
2008/09
2007/08
2006/07
(£million)
85.3
90.9
7,955.8
8,074.8
7,531.7
2010/11
2009/10
2008/09
2007/08
2006/07
2010/11: (2)%2009/10: +2%
2010/11: £10.0m2009/10: £(17.6)m
Shareholder
Underlying diluted earnings per share (EPS)
The level of growth in EPS provides a suitable measure of the financial health of the Group and its ability to deliver returns to shareholders each year. The Group targets growth in EPS commensurate with growth in earnings.
Total Shareholder Return (TSR)
This metric provides a relative performance measure over the longer term of the Group’s ability to deliver returns for shareholders. For 2009/10, the base which the Group used was to outperform a bespoke weighted average index of UK and European Retailers over a three year period. From 2010/11, the base has been to measure against the FTSE 250 Index (comprising FTSE 101-350 companies), excluding investment trusts, over a three year period.
See graph on page 50
2010/11: 1.6p2009/10: 1.5p
For more information on our Corporate Responsibility KPI’s see pages 32 to 35.
Strategic S
umm
ary08 -- 22
20 Dixons Retail plcAnnual Report and Accounts 2010/11
Directors’ ReportStrategic Summary
Risks to Achieving the Group’s Objectives
1.Macro-economic risks
Risk Examples of mitigating actionEconomic environmentRisk that the economic downturn is prolonged through 2011, particularly in the UK
Ongoing monitoring by Finance and the Executive Committee, including review of portfolio of the businesses Renewal and Transformation plan to improve our business performance irrespective of macro economic factors Strategy and business planning which takes into account varying economic scenarios
Market specific characteristics Seasonality – A substantial proportion of revenue and operating profit is generated during the third financial quarter, which includes the Christmas and New Year season. Adverse trading in this relatively short period is likely to impact significantly the full year’s results
Price deflation – Price deflation has been a common feature across most electrical goods categories for a number of years, primarily driven by technological advances and improved production efficiencies
Financial planning takes into account expected peaks and troughs during the year and the business is run accordingly Increasing the proportion of services related business, which offers a regular stream of income over the course of the year
Effective launches of new technology as it becomes available to the market Growth of services related business to increase the number and value of non-product sales Improve gross profit uplifts in transformed stores Control of stock and strong management over clearance and exit routes
2.Competitor and market place risks
Risk Examples of mitigating actionCompetition Competitors reduce the Group’s market share and/or drive down margins in specific markets
Renewal and Transformation plan is improving our stores, cost structure and service proposition Continuing development of strong online brands, notably PIXmania and Dixons.co.uk Ensuring our prices offer good value, including a customer price index Continuing to take money out of our cost base, and leveraging group-wide benefits where opportunities arise Building ever stronger relationships with suppliers
Risk management is an integral part of business management and it is something that Dixons Retail takes seriously. The Group has continued to develop its approach during the past year and has taken steps to integrate risk management into business decision making. In addition, the Board and Group Executive have invested time to identify and assess the key risks facing the business. The principal risks and uncertainties are set out below along with an illustration of what is being done to mitigate them:

Dixons Retail plc 21 Annual Report and Accounts 2010/11
2.Competitor and market place risks continued
Risk Examples of mitigating actionChanging technology/consumer preferencesRisk that we fail to capitalise on new technology or emerging trends to maximise revenues
Our retail brands fail to meet the expectations of customers
Strong supplier relationships (e.g. UK launch partner of Apple iPad) Delivery of Customer Plan to respond to identified changes in technology Store transformations to take into account emerging trends in store layouts Exciting product launches to make our stores the destination for the latest technology (e.g. 3D TVs)
Understanding our customers and monitoring our levels of service through mystery shopping, customer exit surveys and analysis of purchase data Continued focus on ensuring we have an excellent range acrossall price points, including own label brands Renewal and Transformation plan improving the quality and optimising the location of our stores across the Group FIVES customer service training for all colleagues and product workshops to improve product knowledge Implementation of the Customer Plan in the UK to improve the customer journey – a clear and focused plan at the heart of the business Innovations in service propositions and improved customer service levels across the Group Clearer and easier navigation of our e-commerce websites
Legislative, contractual, reputational and regulatory risksRisk that as a result of a change in legislation, a decision by a regulatory authority, or exposure in our compliance activities, the Group’s business is impacted by reputational or financial damage or a need to adapt the Group’s business and processes (e.g. competition, consumer rights, intellectual property, contractual obligations, health and safety or compromise of confidential customer data)
In-house legal teams communicate on a frequent basis and legal reports are submitted to the Board Launch of Group Ethical Conduct policy, supported by annual declaration of compliance by colleagues Monitoring changes in legislation/regulation Corporate Responsibility Committee meets regularly to discuss reputational and regulatory risks Quality checks and factory audits for own-branded product assembly Compliance Committee approves activity that may impact the terms of Group credit facilities Contact with regulatory authorities, such as in relation to the Office of Fair Trading’s (OFT) market study into extended warranties
3.Operational risks
Risk Examples of mitigating actionEmployeesRisk that we fail to attract, develop and retain the necessary talent for our business
Group-wide standardised performance management Talent reviews across the business Store structures which provide a clear career path for all employees Improved quality of training courses and development programmes with specialist focus on service, product, commercial and technical Bonus plans, which include a component relating to individual performance and business performance Reward strategy aligned to retain the best talent
Directors’ ReportStrategic Summary
Strategic S
umm
ary08 -- 22

22 Dixons Retail plcAnnual Report and Accounts 2010/11
Directors’ ReportStrategic Summary
3.Operational risks continued
Risk Examples of mitigating actionSystems failure and damage to property and consequential business interruptionRisk that a key system becomes unavailable for a period of time
The Group’s ability to distribute merchandise to its stores and to sell and distribute merchandise to its customers is reliant on its operational infrastructure, particularly the efficient functioning of its distribution centres and distribution network
Contingency plans developed that are tested regularly Evaluation, planning and implementation analysis carried out before updating or introducing new systems that have an impact on critical functions Ongoing systems implementation in key areas of the business
Disaster recovery plans are in place Insurance is purchased to mitigate against business interruption Preventative measures are constantly being updated to reduce the likelihood of an incident
Project deliveryRisk that a project delivering an element of our Renewal and Transformation plan does not deliver its anticipated benefits
The portfolio plan is clearly defined and is managed and governed through clear processes and regular meetings Post-investment analysis and performance tracking is in place including financial and customer measures Projects under the Customer Plan are aligned to our UK budget
InternetRisk we fail to build a successful internet business, both in its own right and as part of a multi-channel retailing model
Execution of online strategy Investment in site functionality and user friendliness Roll-out of our e-merchant platform across our businesses Successful marketing campaigns to raise the profile of online brands
4.Financial risks
Risk Examples of mitigating actionChanges in supplier creditRisk that credit insurance is no longer available to electrical and computing suppliers
Ongoing engagement with suppliers and credit insurers Improvements in stock management Innovations in and close scrutiny of working capital together with regular monitoring and review
Finance and treasuryRisk that the Group’s exposure to exchange rate, interest rate, liquidity and credit risks have an adverse or unexpected impact on results, funding requirements or purchasing ability
Detailed Group hedging policies reviewed through a separate Tax and Treasury Committee Balance sheet management and reviews Strong cash management Regular monitoring of receivables balances Strong pre and post investment appraisal processes Central control of treasury activity
Pensions risk and policiesRisk that the pension funding policy fails to react to or address deficits, which may arise on the Group’s pension schemes
Deficit reduction activities in place Defined benefit section of UK scheme closed to future accrual
Risks to Achieving the Group’s Objectivescontinued

Dixons Retail plc 23 Annual Report and Accounts 2010/11
Directors’ ReportPerformance Review
Business highlights Renewal and Transformation plan delivering a market leading
offer for customers.
Store transformation programme on track:
– 360 stores reformatted at the year end;
– 70 Megastores now open with average annual sales of £20 million;
– Over 80 Megastores across the Group, including 40 in the UK and 25 in the Nordics will have been reformatted by Peak 2011;
– Newly reformatted stores continue to deliver gross profit uplifts of 20% versus the unreformatted stores in the UK and 15% in the Nordics; and
– Second year trading for reformatted stores maintained.
Elkjøp performed strongly in all of its markets, gaining significant market share.
New customer services brand KNOWHOW launched in the UK encompassing all after sales and support services.
Multi-channel internet sales up 13% across the Group, reflecting the continued shift of sales to the multi-channel brands.
Closure of loss making PC City operations in Spain ahead of plan.
Cost savings on track:
– £50 million savings delivered in the financial year; and
– £50 million of additional cost savings expected in each of the next three years.
Impairment and restructuringRecognising challenging conditions in some of our markets, and the ongoing business restructuring under the Renewal and Transformation plan, we have reviewed the balance sheet and made impairment and other non underlying charges totalling £309.4 million. The additional cash impact of these charges is estimated as £39 million, of which approximately £8 million was incurred in 2010/11. The impairments primarily relate to the closure of operations in Spain (£70.6 million), the impairment of acquired goodwill in relation to Kotsovolos in Greece (£53.2 million) and PIXmania (£106.3 million).
Overview
Key highlights Margins and underlying profit before tax, at £85.3 million,
maintained in challenging market conditions.
Investment in the customer offer through the Renewal and Transformation plan is delivering.
Increasing market share across most markets and sectors, particularly in the UK and Nordics.
Step change to the customer focused business model, differentiating the offer for customers.
Further benefits to come through rolling out refurbished and Megastore formats, the transformation of the services offer through KNOWHOW, upgraded websites and a leaner operating model.
Financial highlights Total underlying Group sales(1)(2) down 2% to £8,154.4 million
(2009/10 £8,320.0 million) and down 1% on a constant currency basis.
Total Group sales, including those from businesses to be closed and closed businesses, were £8,341.8 million (2009/10 £8,532.5 million).
Group like for like sales(3) down 4% in the second half and down 2% in the full year.
Underlying Group gross margins were flat in the second half of the year and up 0.1% in the full year.
EBIT(4) of £127.6 million (2009/10 £133.2 million).
Underlying pre-tax profit(1) of £85.3 million (2009/10 £90.9 million).
Underlying diluted earnings per share(1) of 1.6 pence (2009/10(5) 1.5 pence). Basic loss per share for continuing operations of (6.6) pence (2009/10 earnings per share of 2.0 pence).
Total loss before tax, after deducting non-underlying items of £(309.4) million, was £(224.1) million (2009/10 profit before tax of £112.7 million).
Free Cash Flow(6) of £38.9 million before restructuring charges (2009/10 £28.1 million).
As at 30 April 2011 the Group had net debt of £(206.8) million (2009/10 £(220.6) million).
Rephased debt profile following issue of new 2015 Bonds and part repurchase of existing 2012 Bonds in July 2010.
Perform
ance Review
23 -- 35

24 Dixons Retail plcAnnual Report and Accounts 2010/11
Directors’ ReportPerformance Review
Underlying sales and profit analysisUnderlying sales Underlying profit/(loss)
52 weeks ended
30 April 2011 £million
52 weeks ended
1 May 2010 £million
Currency neutral (7)
% changeLike for like(3)
% change
52 weeks ended
30 April 2011 £million
52 weeks ended
1 May 2010 £million
UK & Ireland(8) 3,816.1 4,013.5 (5)% (3)% 71.3 71.1
Nordics(9) 2,268.9 2,093.7 +7% +5% 105.6 97.4
Other International(10) 1,226.7 1,291.6 (2)% (5)% (21.6) (8.3)
Pure play e-commerce(11) 842.7 921.2 (5)% (5)% 0.9 11.3
Central costs – – (15.8) (19.5)
Total Group Retail 8,154.4 8,320.0 (1)% (2)% 140.4 152.0
Property losses (12.8) (18.8)
EBIT 127.6 133.2
Underlying net finance costs (42.3) (42.3)
Group underlying profit before tax 85.3 90.9
Notes
(1) Throughout this report, references are made to underlying performance measures. Underlying results are defined as excluding trading results from the business to be closed, closed businesses, the amortisation of acquired intangibles, net restructuring and business impairment charges and other one off non-recurring items, profit on sale of investments, net fair value remeasurements of financial instruments and, where applicable, discontinued operations. These excluded items are described as ‘non-underlying’. The financial effect of these items is shown in the analyses on the face of the income statement and in note 4 to the financial statements.
(2) Business to be closed comprises PC City Spain. Closed businesses comprise the operations of PC City Sweden and Markantalo in Finland. Discontinued operations comprise operations in Poland and Hungary.
(3) Like for like sales are calculated based on stores that have been open for a full financial year both at the beginning and end of the financial period and are calculated using constant exchange rates. Customer support agreement sales are excluded from all UK like for like calculations. Operations that are subject to closure have sales excluded as of the announcement date. Stores subject to a refurbishment are excluded during the period of refurbishment. All e-commerce pick-up store sales are included in like for like sales.
(4) Underlying Earnings Before Interest and Tax (EBIT) equates to underlying operating profit and is defined as underlying earnings from retail operations, after property losses, before deduction of net finance costs and tax.
(5) The weighted average number of shares used in the calculation of earnings per share for the period prior to the rights issue, which completed on 9 June 2009, has been multiplied by an adjustment factor to reflect the bonus element of the shares issued under the terms of the rights issue (as described in note 8 to the financial statements). The adjustment factor used was 1.2138.
(6) Free Cash Flow relates to continuing operations and comprises net cash flow from operating activities before special pension contributions, less net finance costs, less income tax paid and net capital expenditure.
(7) Currency neutral change percentage reflects the year on year growth or decline in underlying sales, calculated excluding the effect of currency movements.
(8) UK & Ireland comprises Currys, CurrysDigital, Dixons Travel, PC World, operations in Ireland, DSGi Business and KNOWHOW. Like for like sales exclude DSGi Business.
(9) Nordics comprises the Elkjøp group and Dixons Travel Denmark.
(10) Other International comprises Greece (Kotsovolos), Italy (Unieuro, combined 2-in-1 Unieuro and PC City stores and Dixons Travel Italy), Czech Republic (Electro World), Slovakia
(Electro World) and Turkey (Electro World).
(11) Pure play e-commerce division comprises Dixons.co.uk and PIXmania.
(12) Unless otherwise noted, throughout this statement figures relate to continuing operations, excluding the results of the business to be closed / closed businesses. Total revenue including discontinued operations and business to be closed / closed businesses was £8,341.8 million (2009/10 £8,543.4 million).
Business performanceUnderlying Group sales (excluding discontinued operations and the business to be closed / closed businesses) were down 2% to £8,154.4 million (2009/10 £8,320.0 million) and down 2% on a like for like basis. Underlying Group sales were down 1% at constant exchange rates. Total Group sales (including the business to be closed / closed businesses) were down 2% to £8,341.8 million (2009/10 £8,532.5 million). Group gross margins were up 0.1% across the year.
Group EBIT (underlying profit before interest and tax) was £127.6 million (2009/10 £133.2 million). Group underlying profit before tax was £85.3 million (2009/10 £90.9 million). Total loss before tax, after deducting non-underlying items of £309.4 million, was £(224.1) million (2009/10 profit before tax £112.7 million).
Overview continued

Dixons Retail plc 25 Annual Report and Accounts 2010/11
Underlying sales(£million)
2010/11 3,816.1
4,013.52009/10
Underlying operating profit(£million)
2010/11 71.3
71.12009/10
Directors’ ReportPerformance Review
Dixons Travel continues to go from strength to strength with all stores now operating in the new format which allows for more customer focused ranges, with a particular focus on portable items and accessories. The demographic of its customer base in airports has meant the business has been less impacted by the consumer downturn. In addition to the UK, Dixons Travel now operates in Copenhagen, Dublin, Rome and Milan airports with further opportunities in other airports across Europe.
Internet sales continue to be driven by the shift of consumers and manufacturers to multi-channel retail outlets with significant growth in reserve&collect. At the start of the financial year, the PIXmania e-merchant platform was implemented across the UK websites significantly improving the navigation, operation and customer experience. Further work to improve the offer and extended ranges online are planned for the new financial year.
Gross margins in the UK & Ireland were up throughout the year as a result of a number of factors:
Improvements in stock control, enabling the business to exit the year with lower inventory levels than last year despite the very weak markets. This has included improved processes for exiting aged stock, limiting the need for excessive discounting;
Introduction of better promotional planning, enabling better support from suppliers, particularly as they increasingly favour multi-channel operators; and
Cost saving initiatives in the distribution and services infrastructure.
The division made good progress on the Renewal and Transformation plan through the year with 250 stores now refitted in the UK & Ireland, including 31 Megastores. The preferred format for customers and for the business is the combined 2-in-1 Currys and PC World format. All High Street and out of town Superstores will be in this format. The majority of the 70 Megastores the Group is targeting will also be in this format, with a small number of standalone Currys Megastores in larger catchments. The Group’s planned store base for the UK & Ireland is 450 stores, comprising 70 High Street stores, 310 Superstores and 70 Megastores. The portfolio will be managed to this size as existing leases expire and stores in each catchment are refitted.
The Group operates the most comprehensive end to end service offering in electrical retailing in the UK, giving the Group a unique services model versus the competition. In the spring of 2011 the new services brand of KNOWHOW was launched. This follows an intensive period of investment and significant improvement in our service offering for customers. The new brand was introduced into stores in May 2011 with roll out to all stores being completed by the autumn. The KNOWHOW brand provides customers with clear easily identifiable value for money services under four distinct categories; Deliver & Install; Set up & Upgrade; Help & Support; and Repair & Protect. Through growth and continuous process improvements the unit costs can be reduced, enabling further investment in the services offer.
UK & Ireland
Profit and margins maintained despite challenging markets.
Performing ahead of our competitors.
Launch of KNOWHOW services.
Total sales in the UK & Ireland were down 5% to £3,816.1 million (2009/10 £4,013.5 million) and like for like sales were down 3% across the year. Underlying operating profit for the full year was flat year on year at £71.3 million (2009/10 £71.1 million).
This is an encouraging performance in the context of a weak market. During the first half we benefitted from sales of TVs in the lead up to the World Cup. The ‘cash for goals’ promotion caught customers’ imagination and enabled the business to capture more than its market share of the uplift in sales of TVs. The work being done under the Renewal and Transformation plan to improve the store environment and the shopping trip for customers was recognised by Apple when they chose us as their key partner for the launch of the iPad. Trade continued to be robust in the lead up to Christmas and in the early sale period, interrupted only by very poor weather conditions in the two week period preceding Christmas. However, like for like sales in the second half were down 7% as the consumer environment weakened in the fourth quarter. Against this environment Currys and PC World traded ahead of the competition and gained market share. During the year, white goods held up well and computing has been supported by iPads and tablets, with the new iPad 2 selling very strongly. Television sales benefitted from a strong World Cup, but have been particularly weak since January.
Perform
ance Review
23 -- 35
26 Dixons Retail plcAnnual Report and Accounts 2010/11
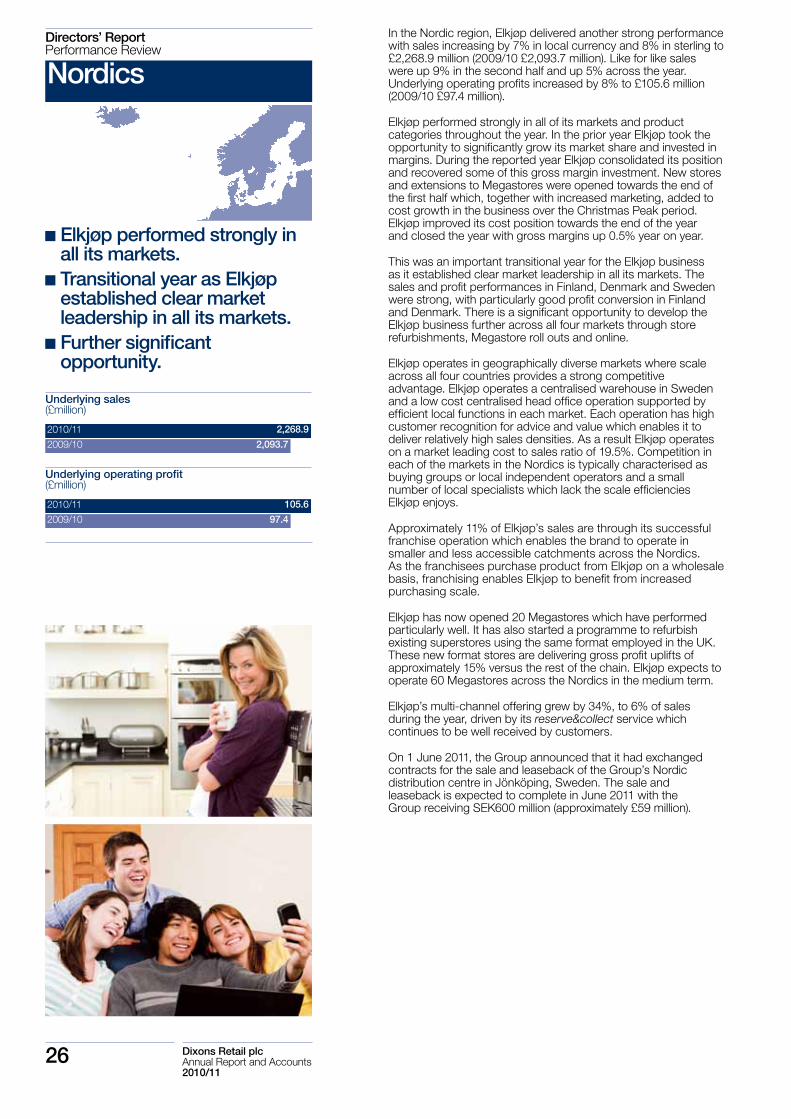
Underlying sales(£million)
2010/11 2,268.9
2,093.72009/10
Underlying operating profit(£million)
2010/11 105.6
97.42009/10
Directors’ ReportPerformance Review
In the Nordic region, Elkjøp delivered another strong performance with sales increasing by 7% in local currency and 8% in sterling to £2,268.9 million (2009/10 £2,093.7 million). Like for like sales were up 9% in the second half and up 5% across the year. Underlying operating profits increased by 8% to £105.6 million (2009/10 £97.4 million).
Elkjøp performed strongly in all of its markets and product categories throughout the year. In the prior year Elkjøp took the opportunity to significantly grow its market share and invested in margins. During the reported year Elkjøp consolidated its position and recovered some of this gross margin investment. New stores and extensions to Megastores were opened towards the end of the first half which, together with increased marketing, added to cost growth in the business over the Christmas Peak period. Elkjøp improved its cost position towards the end of the year and closed the year with gross margins up 0.5% year on year.
This was an important transitional year for the Elkjøp business as it established clear market leadership in all its markets. The sales and profit performances in Finland, Denmark and Sweden were strong, with particularly good profit conversion in Finland and Denmark. There is a significant opportunity to develop the Elkjøp business further across all four markets through store refurbishments, Megastore roll outs and online.
Elkjøp operates in geographically diverse markets where scale across all four countries provides a strong competitive advantage. Elkjøp operates a centralised warehouse in Sweden and a low cost centralised head office operation supported by efficient local functions in each market. Each operation has high customer recognition for advice and value which enables it to deliver relatively high sales densities. As a result Elkjøp operates on a market leading cost to sales ratio of 19.5%. Competition in each of the markets in the Nordics is typically characterised as buying groups or local independent operators and a small number of local specialists which lack the scale efficiencies Elkjøp enjoys.
Approximately 11% of Elkjøp’s sales are through its successful franchise operation which enables the brand to operate in smaller and less accessible catchments across the Nordics. As the franchisees purchase product from Elkjøp on a wholesale basis, franchising enables Elkjøp to benefit from increased purchasing scale.
Elkjøp has now opened 20 Megastores which have performed particularly well. It has also started a programme to refurbish existing superstores using the same format employed in the UK. These new format stores are delivering gross profit uplifts of approximately 15% versus the rest of the chain. Elkjøp expects to operate 60 Megastores across the Nordics in the medium term.
Elkjøp’s multi-channel offering grew by 34%, to 6% of sales during the year, driven by its reserve&collect service which continues to be well received by customers.
On 1 June 2011, the Group announced that it had exchanged contracts for the sale and leaseback of the Group’s Nordic distribution centre in Jönköping, Sweden. The sale and leaseback is expected to complete in June 2011 with the Group receiving SEK600 million (approximately £59 million).
Nordics
Elkjøp performed strongly in all its markets.
Transitional year as Elkjøp established clear market leadership in all its markets.
Further significant opportunity.

Dixons Retail plc 27 Annual Report and Accounts 2010/11
Underlying sales(£million)
2010/11 1,226.7
1,291.62009/10
Underlying operating loss(£million)
2010/11 (21.6)
(8.3)2009/10
Directors’ ReportPerformance Review
This division comprises operations in Italy, Greece, the Czech Republic, Slovakia and Turkey. Total sales were down 2% at constant exchange rates and by 5% in sterling to £1,226.7 million (2009/10 £1,291.6 million). Underlying operating losses were £(21.6) million (2009/10 loss of £(8.3) million). Towards the end of the financial year the Group announced that it was closing its PC City operations in Spain. The closure programme is on track, with all stores now closed and a net cash cost of closure of approximately £30 million across the 2010/11 and 2011/12 financial years. Underlying financials are reported excluding these PC City operations.
ItalyThis comprises Unieuro, combined 2-in-1 Unieuro and PC City stores and Dixons Travel Italy operating in the airports in Rome and Milan. The business has progressed well against the turnaround plan, with a positive EBITDA delivered for the first time in several years, ahead of plan. The turnaround plan has involved considerable work to improve the ranges in-store, as well as availability for customers. Significant progress has been made in improving the stock turn to improve working capital, helping cash generation. Using the same Six Sigma principles as have been employed in the UK & Ireland division, Unieuro has reduced costs. In addition the store network is being upgraded, including store reformatting, again using the work done in the UK & Ireland division, which provides a better, easier to navigate store environment for customers.
A strong first quarter driven by the World Cup was followed by a weaker sales environment as the business anniversaried the first stages of the regional digital switchover. The consumer environment remained subdued in the second half, but Unieuro continued to outperform the market as it benefitted from a further stage of the digital switchover. As the business becomes cash generative it will start to add Megastores as well as refurbish existing stores to the 2-in-1 Unieuro and PC City format that is proving to be the favoured format for customers. The business is well positioned to make further gains in the years ahead.
GreeceKotsovolos is the market leading specialist electrical retailer in Greece. As a result of the economic situation in Greece the competitive environment is changing and with its strong market position Kotsovolos is increasingly being favoured by both customers and suppliers, enabling it to trade ahead of the markets, gaining two to three percentage points of share in the last six months of the financial year. However, because the market has been down approximately 25% across the financial year, it has impacted profitability. Management have partially offset this impact by reducing costs, enabling the business to deliver a positive EBITDA result in the year. The business has also focused on delivering for customers, improving its relative proposition in the market and expanding its channels in e-commerce and franchising.
During the year Kotsovolos refurbished seven stores including two Megastores, with 35% of sales now being through new format stores.
Czech Republic and Slovakia Operations in the Czech Republic have performed well in their markets, despite the weak consumer environments. The Group now operates 20 stores and a multi-channel internet operation in the Czech Republic and three stores in Slovakia which are trading in line with expectations.
TurkeyWe operate 19 stores in Turkey, including four franchises, under the Electro World brand with our local joint venture partner. These stores are based on the Group’s new large space format, providing a greater product range and exciting retail environments for customers. The business continues to deliver good sales growth as the operations there benefit from the Group’s scale, store formats, in-store service and operating model.
Turnaround plan in Italy is improving performance.
Kotsovolos gaining share in a tough market.
Medium term opportunities in Czech Republic, Slovakia and Turkey as markets develop.
Other International
Perform
ance Review
23 -- 35

28 Dixons Retail plcAnnual Report and Accounts 2010/11
Underlying sales(£million)
2010/11 842.7
921.22009/10
Underlying operating profit(£million)
2010/11 0.9
11.32009/10
Directors’ ReportPerformance Review
PIXmania traded well in its core markets.
dixons.co.uk benefits from the UK & Ireland operating platform.
Investments being made in future e-commerce operations.
Pure play e-commerce
This division comprises PIXmania and dixons.co.uk. Total sales were down 5% in local currency and down 9% in sterling at £842.7 million (2009/10 £921.2 million). Underlying operating profit was £0.9 million (2009/10 £11.3 million). The Pure play e-commerce business forms a core and integrated part of the Group’s overall internet strategy, alongside the multi-channel operations of the other main business divisions. Internet sales across the Group represent 16% of total sales.
Several factors have reduced the sales and profits of our Pure play e-commerce operations. First, we have been making significant investments in developing the operation. We have implemented a new platform in the UK to support all of our websites, which has caused disruption while being integrated into the UK systems and trading platforms. We have also been investing in e-merchant which supplies IT services to the Group and other retailers. Second, while it delivered a solid performance in France, PIXmania has strong market positions in Southern Europe which have been adversely impacted by reduced consumer demand. Third, in several markets we have had increased competition from store based brands expanding their e-commerce business. Finally there has been a significant shift of suppliers and customers in favouring multi-channel brands and away from pure play internet operators.
In the UK the Group operates the dixons.co.uk business alongside the multi-channel brands of currys.co.uk and pcworld.co.uk. During the year management directed internet sales activity through the more profitable multi-channel brands, particularly as these are becoming the favoured route for customers and suppliers. As a pure play business dixons.co.uk competes on price and is an important tool in enabling management to understand and compete in the pure play electricals retail section of the market. The implementation of the e-merchant platform and further improvements to the offer have incurred additional costs. However, as dixons.co.uk is fulfilled from the UK & Ireland’s main warehouse and stock files, its cost to serve is relatively low. While the dixons.co.uk operation is now on a much stronger footing, it has been impacted by the weak consumer environment, impacting profitability of the Pure play e-commerce division.
PIXmania now operates a total of 17 stores. These stores, with an average space of approximately 1,400 sq ft per store, combine the ease and value of the internet and the convenience of stores to collect products. It is expected that PIXmania will open further stores as they achieve high sales densities driven by internet pricing in high footfall shopping centre locations.
PIXmania also operates PIXplace which provides a platform for third party resellers under the PIXmania brand. This also enables PIXmania to extend its offer for customers while benefitting from a charge for third party transactions.
In addition, PIXmania is able to provide its proprietary and market leading e-merchant platform and IT services to third party operators. As well as dixons.co.uk, currys.co.uk and pcworld.co.uk, PIXmania provides these services to Bouygues Telecom. The Group considers that there are further opportunities in this area over the medium term.

Dixons Retail plc 29 Annual Report and Accounts 2010/11
Perform
ance Review
23 -- 35Directors’ ReportPerformance Review
Financial positionThe year has seen very challenging markets with pressure on sales and margins as well as cost inflation. In spite of these challenges we have delivered a robust trading performance against the financial priorities of profitability and strengthening the balance sheet:
Group Gross Margins were up 0.1% in the year, the second year of flat or growing gross margins in a market where competitors have seen gross margins erode;
EBIT held at £127.6 million (2009/10 £133.2 million); Costs reduced by £50 million in the year and a further
£50 million being targeted in each of the next three financial years;
Exit of loss making operations of PC City in Spain announced; Completion of sale and leaseback of Swedish warehouse
expected in June, raising £59 million; Rephased debt profile following issue of new 2015 Bonds and
part repurchase of existing 2012 Bonds in July 2010; Significant headroom maintained on the Group’s revolving
credit facility (the “RCF”) throughout the year, with the RCF extended to August 2013;
Agreement in principle reached with the trustee of the UK defined benefit scheme following the triennial valuation which showed a shortfall of assets compared to liabilities of £239 million;
Positive Free Cash Flow, before restructuring items, of £38.9 million was generated; and
Net debt at year end of £206.8 million (2009/10 £220.6 million).
Adjustments to underlying resultsThe weak consumer environment impacted the financial performance of certain of the Group’s businesses, with the outlook in Southern Europe, in particular, remaining uncertain. This has resulted in an impairment in the value of goodwill acquired with PIXmania and Kotsovolos in 2006 and 2004, respectively. There is also a non-underlying charge relating to the closure of the PC City business in Spain. Under the Renewal and Transformation plan, a number of re-organisation charges continue to be incurred and as in prior years, these have also been treated as non-underlying charges. The total non-underlying charge is £309.4 million. The additional cash impact of this charge is estimated as £39 million, of which approximately £8 million was incurred in 2010/11. Further details of the non-underlying charges are set out below:
52 weeks ended
30 April 2011
£million
52 weeks ended
1 May 2010 £million
Underlying profit before tax 85.3 90.9Non underlying (charges) / gains:
Trading results – Business to be closed / closed businesses (8.5) (0.6)
Other non-underlying items:Amortisation of acquired
intangibles (4.5) (4.6)Net restructuring charges:
Strategic reorganisation (17.1) (5.6)Business impairments (251.6) –Other items (24.9) – Change in pension benefits – 33.4Financing items:
Net fair value remeasurements (2.8) (0.8)Accelerated amortisation of
facility fees (7.8) –Net 2012 Bond redemption
gains 7.8 –
Other non-underlying items – total (300.9) 22.4
Total net non-underlying charges to add back (309.4) 21.8
(Loss) / profit before tax (224.1) 112.7
In April the Group announced the closure of PC City Spain, and in the prior year completed the closure of PC City in Sweden and Markantalo in Finland. Trading results from the business to be closed / closed businesses comprise the pre-tax losses from these operations, excluding closure costs which are provided for separately below as part of the business impairment.
Amortisation of acquired intangibles of £4.5 million predominantly comprises brand names.
Strategic reorganisation costs of £17.1 million relate predominantly to the UK business transformation and primarily comprise redundancy costs and additional lease liabilities on a vacant head office building following the UK restructuring.
Business impairments include: – costs of £70.6 million relating to the closure of PC City
operations in Spain. This comprises goodwill and other asset write offs together with provisions for onerous lease costs and employee severance;
– £106.3 million impairment of goodwill acquired with PIXmania in 2006. PIXmania’s profit performance is behind that envisaged at the time of the acquisition as a result of:
– weakness in the Southern European economies in which it operates;
– investment in the e-merchant platform;
– changes in the internet retailing market, with the switch in growth to multi-channel.
– £53.2 million impairment of goodwill relating to Kotsovolos, the Group’s Greek business. Despite gaining market share during the period and remaining cash generative, this follows a period of economic difficulty and uncertainty in the Greek market; and
Group Financial Summary

30 Dixons Retail plcAnnual Report and Accounts 2010/11
Directors’ ReportPerformance Review
Group Financial Summarycontinued
– £21.5 million impairment in respect of the Group’s 40% stake in a Danish associate, F-Group. F-Group has experienced a prolonged period of declining results due to the weak underlying Danish economic environment.
Other items of £24.9 million mainly comprise: – the impairment of capitalised development costs in respect
of the Group’s systems in the UK following the decision to defer the project in order to focus on existing process improvements; and
– the write off in PIXmania of supplier receivables, dating back to 2008/09 and prior years. This write off has arisen due to the implementation of new systems highlighting the extent of the receivables outstanding and a detailed review of the Group’s ability to recover these balances.
The financing charge comprises the following elements: – £2.8 million of net fair value remeasurement losses on
revaluation of financial instruments as required by IAS 32 and 39;
– accelerated amortisation of facility fees which relate to the refinancing activities and comprise the write off of fees relating to the now cancelled credit facility which were previously being amortised over the life of that facility. Equivalent fees relating to the current RCF are being amortised into underlying interest in the same manner as the historical facility fees were; and
– net 2012 Bond redemption gains which arise on the notional cancellation of interest rate swaps used to hedge the £140 million redeemed portion of the 2012 Bonds, offset mainly by the redemption premium paid.
The 2009/10 credit of £33.4 million in respect of the change in pension benefits arose from the curtailment of the defined benefit section of the UK pension scheme whereby this section was closed to future accrual on 30 April 2010.
Free Cash FlowFree Cash Flow, before restructuring items, at £38.9 million (2009/10 £28.1 million) improved on the prior year despite the significant increase in capital invested in the Renewal and Transformation programme. This was driven mainly through improved working capital management and reduced hedge cash outflows. Total free cash flow after restructuring items was £10.0 million (2009/10 outflow of £(17.6) million).
52 weeks ended 30 April 2011
£million
52 weeks ended
1 May 2010 £million
Underlying profit before tax 85.3 90.9Business to be closed / closed
businesses loss before tax (8.5) (0.6)Depreciation and amortisation 139.4 128.6Working capital 40.4 39.7Taxation (26.2) (31.9)Capital expenditure (223.2) (165.3)Proceeds from sale of property(i) 2.0 0.7Other cash items 29.7 (34.0)
Free Cash Flow before restructuring items 38.9 28.1
Net restructuring and impairment(i) (ii) (28.9) (45.7)
Free Cash Flow 10.0 (17.6)
(i) Proceeds from sale of property in the prior year excludes £9.0 million relating to the sale of the Group’s former warehouse in Stevenage. These sale proceeds are shown within net restructuring and impairment.
(ii) Net restructuring and impairment includes £2.0 million of cash recoveries made in the current year, mainly in relation to closed businesses.
As previously announced, it should be noted that the year end working capital and cash position benefited due to the additional bank holiday at the end of the financial year and the timing of trading cash flows associated with the closure of operations in Spain. This benefit is estimated as approximately £30 million, of which approximately half was as a result of the timing of closing the operations in Spain across the year end. The Group continues to anticipate net closure costs of PC City Spain of approximately £30 million. This represents an incremental cost of £20 million.
Capital expenditure was £223.2 million (2009/10 £165.3 million), up £57.9 million reflecting the increased investment associated with the Renewal and Transformation plan, particularly in the UK and Nordics.
Other cash items of £29.7 million (2009/10 £(34.0) million) mainly comprise the add back of non-cash costs included in profit, such as pension interest, share option charges, and property loss provision charges, and in addition reflect other cash movements such as settlements of certain hedge contracts. The improvement year on year of £63.7 million is primarily due to the £62.2 million of hedge outflows reported in 2009/10.
As previously disclosed, the Group has in place certain historical hedging agreements. The principal outstanding agreements relate primarily to foreign exchange and interest hedges. The majority of these were put in place at the time the Group issued its Bonds in 2002, and in relation to overseas investments. The remaining hedges at year end rates would imply a net future cash outflow of approximately £65 million, primarily payable in 2012.
Net restructuring and impairment mainly reflects the cash outflows relating to the strategic reorganisation activities as announced in previous years. These primarily comprise lease and other property related payments and employee severance costs.
The Group’s priority is to ensure that cash flow is managed to meet the repayment of the 6.125% Bonds due in November 2012 and associated hedge maturities. Alongside the proceeds from the sale and leaseback of the warehouse in Sweden, and further cash generation from operations, management will retain flexibility in the level of capital expenditure in the 2011/12 and 2012/13 financial years. As previously announced, capital expenditure will be limited to a maximum of £160 million in the 2011/12 financial year. To date approximately £100 million of capital has been committed for 2011/12, with further commitments to be reviewed against the economic environment and the Group’s performance.
FundingNet debtAt 30 April 2011 the Group had net debt of £(206.8) million, compared with net debt of £(220.6) million at the end of the previous year.

Dixons Retail plc 31 Annual Report and Accounts 2010/11
Perform
ance Review
23 -- 35Directors’ ReportPerformance Review
52 weeks ended
30 April 2011
£million
52 weeks ended
1 May 2010 £million
Opening net debt (220.6) (477.5)Free Cash Flow 10.0 (17.6)
Equity Placing and Rights Issue – 291.3
Acquisitions and disposals – (7.0)Discontinued operations (0.1) (8.6)Special pension contribution (12.0) (12.0)Other items 15.9 10.8
Other movements in net debt 3.8 274.5
Closing net debt (206.8) (220.6)
Since the start of the previous financial year, the Group has improved its financial position significantly through refinancing actions. In the prior year, the proceeds received from the Placing and Rights Issue were used to reduce debt and finance the Renewal and Transformation plan. In July 2010 the Group rephased its debt with the issue of £150 million 8.75% Guaranteed Notes repayable in August 2015 (the “2015 Bonds”). The net proceeds of the 2015 Bonds were used to repurchase £140 million of the Group’s existing £300 million 6.125% Bonds (the “2012 Bonds”). The transaction also enabled the extension of the maturity of the Group’s Revolving Credit Facility (RCF) to August 2013.
The rephasing of debt maturity, coupled with actions to generate funds to reduce net debt, ensures that the Group has an appropriate repayment profile on its debt facilities and has suitable working capital facilities with sufficient headroom to enable it to continue to execute the Renewal and Transformation plan.
On 1 June 2011 the Group announced the exchange of contracts for the sale and leaseback of its Jönköping distribution facility for SEK600 million (approximately £59 million). Completion of the transaction is expected in June 2011.
The gain on other items in the current year includes a £10.2 million gain arising on the notional cancellation of interest rate swaps, which were previously in a designated hedge relationship on the portion of the 2012 Bonds which has now been redeemed.
Net debt is stated inclusive of restricted funds of £120.3 million (Full Year 2009/10 £78.9 million, Interim 2010/11 £118.4 million), which predominantly comprise funds held under trust for potential customer support agreement liabilities. As previously reported in our interim results, the increase year on year is primarily as a result of cancellation of letter of credit facilities as part of the refinancing of the RCF in July 2010.
Underlying net finance costsUnderlying net finance costs were £(42.3) million (2009/10 £(42.3) million). Although the overall cost has remained unchanged year on year, there have been offsetting impacts from the following key areas:
Net reductions in borrowing costs, arising from lower borrowing levels following the Placing and Rights Issue in the prior year, as well as from lower borrowing and amortisation costs following the refinancing of the revolving credit facility, partly offset by increased costs resulting from the higher coupon on the 2015 Bonds;
Lower net pension interest costs, set at the beginning of the financial year, largely as a result of higher asset values compared to the beginning of the previous financial year; and
Reduced interest income, predominantly due to one-off interest earned in the prior year relating to overpayments of tax in earlier years.
Property lossesProperty losses decreased to £12.8 million (2009/10 £18.8 million loss). They primarily relate to closure or refit of stores as part of the Renewal and Transformation plan in the UK and Nordics. In the prior year costs were also incurred in Greece through store closures and refits, including rebranding of the Electro World chain to Kotsovolos.
DividendsThe Board believes that Dixons Retail’s existing financial resources should be used to invest in the Renewal and Transformation plan, which is showing encouraging signs of delivering changes in the Group’s performance, as well as repayment of the existing 2012 Bond due in November 2012.
Subject to an assessment of whether certain conditions have been met, and the progress of the Renewal and Transformation plan, the Board aims to resume dividend payments when appropriate, consistent with a sustained recovery in Dixons Retail’s operational and financial performance.
Tax The Group’s tax rate on underlying profit before tax was 37% (2009/10: 45%). The high effective tax rate is affected by the proportion of loss making businesses where tax benefits are not fully utilised.
PensionsAt 30 April 2011, the IAS 19 accounting deficit of the defined benefit section of the UK pension scheme amounted to £244.0 million (1 May 2010 £263.5 million). The assumptions used for determining the accounting valuation use a consistent basis to that adopted in prior periods but build from the most recent triennial valuation as at 31 March 2010.
The overall decrease is a result of an increase in the assets of the scheme which have continued to recover year on year. This increase has partially been offset by an overall increase in liabilities which are affected by a lower discount rate, reflecting corporate bond yields, and the fact that liabilities are one year closer to crystallising.
A full triennial actuarial valuation of the UK defined benefit pension scheme as at 31 March 2010 was recently completed and shows a shortfall of assets compared with liabilities of £239.0 million. This shortfall and the associated recovery plan have been agreed in principle with the trustee, with formal agreement expected shortly. The proposed recovery plan based on this valuation commenced in 2010/11 with payments of £12 million which rise to £16 million in 2011/12, £20 million in 2012/13 and 2013/14 and rising thereafter to £35 million by 2020/21. The next triennial valuation is expected to commence in March 2013.

32 Dixons Retail plcAnnual Report and Accounts 2010/11
Directors’ ReportPerformance Review
Corporate Responsibility Report
Our business has relationships with many stakeholders and with society at large, and we recognise that our business performance could be affected if we neglected these relationships. Accordingly, we take our responsibilities to our stakeholders seriously. We aim to have policies and procedures in place, which balance the expectations of our customers, shareholders, employees and the wider community.
Corporate responsibility management frameworkThe Group Finance Director, Nicholas Cadbury, is the Board member responsible for corporate responsibility matters at Dixons Retail. He is supported in this task by the Corporate Responsibility Committee, which comprises senior executives from key business areas and is chaired by Helen Grantham, the Company Secretary and General Counsel. The Corporate Responsibility Committee met four times during the period under review and a summary of some of the key matters discussed are listed below:
Ongoing evaluation of the Group’s risks and opportunities and identification of areas where the Corporate Responsibility Committee needs to enhance reporting or control mechanisms already in place;
Assessing the reporting structures in place and determining changes to be implemented when gathering information in respect of the key performance indicators;
Reviewing the Group Health and Safety Policy; Reviewing the impact of the Carbon Reduction Commitment
upon the UK business and the internal reporting mechanisms to ensure compliance.
Our approach to corporate responsibilityThe Group recognises that the most significant responsibility issues concern its core business activities and follows the Association of British Insurer’s guidelines in its approach to corporate responsibility. Accordingly, Dixons Retail seeks to identify the risks and opportunities which are most significant to its business rather than addressing a standardised agenda. The Corporate Responsibility Committee maps onto a matrix the risks and opportunities that are specific to the Dixons Retail business and the retail sector. This allows us to identify our main exposures and most significant opportunities, and address how to deal with these issues. During the period under review, our priorities included the following:
to provide a safe and healthy environment for customers, colleagues and visitors to our stores and other locations;
to engage colleagues through the provision of rewarding workplace environments and careers, whilst assisting in the ongoing improvement of customer service levels;
to improve operational energy efficiency and forward planning; to reduce our impact on the environment and to reduce costs
and raise revenue through improved waste recycling; the provision of safe and reliable own-brand products,
achieved as a result of our expert technical knowledge with products sourced from manufacturers who are audited against our ethical requirements;
to add to and promote the customer proposition in relation to product reuse and recycling; and
an appropriate community giving policy, which complements our interaction with the communities in which we work.
A member of the Corporate Responsibility Committee has been identified as accountable for each of these priorities.
Dixons Retail operates in different countries, each with differing stakeholder needs. Accordingly, the Group’s corporate responsibility efforts are largely organised on a local level. The Corporate Responsibility Committee is aware of the good responsibility work carried out by the Group’s overseas businesses and is working towards improving reporting initiatives with a view to reporting its Group-wide responsibility efforts going forward.
The Corporate Responsibility Committee has established the following key performance indicators, which enables it to monitor performance against the priorities that it has set:
Colleague diversity – age, gender and ethnicity of its employees Health and Safety – employee and customer accidents
and injuries Ethical supply chain audits Customer satisfaction Waste electrical equipment collected and recycled Business waste recycled Group carbon emissions Contributions to the community
Business ethics The way we do business at Dixons Retail is important to us and forms a part of our corporate responsibility objectives. Our shared values are to:
operate with honesty and integrity; give outstanding service to our customers; respect our colleagues; continually seek ways to improve performance; and work together to beat our competition.
We operate an Ethical Conduct Policy, which applies to all employees.
Customer services At Dixons Retail, we are proud to serve thousands of customers every year in our stores and online. In the tough economic environment of the last few years, our customers have looked to us to provide greater value, choice and service and we have reinvigorated our business model accordingly. Our customers have told us what a great shopping experience feels like and we have integrated this into our Customer Plan. The Customer Plan (discussed in more detail in the Chief Executive’s Review on pages 5 to 7) is a series of programmes with the objective of improving the shopping and post-shopping experience of our customers. During the period under review, these programmes have involved training of our store colleagues in FIVES, Dixons Retail’s five point customer engagement tool, continuing to transform our store layouts, simplifying our shopping websites and increasing our product range. Great customer service is key to the success of our business and is measured through regular mystery shopping and exit surveys as well as customer feedback received via our call centre and service colleagues. Key performance indicators on customer satisfaction are combined on a monthly basis into a customer dashboard, which is regularly reviewed by the Corporate Responsibility Committee, as well as the Executive Committee and the Board.
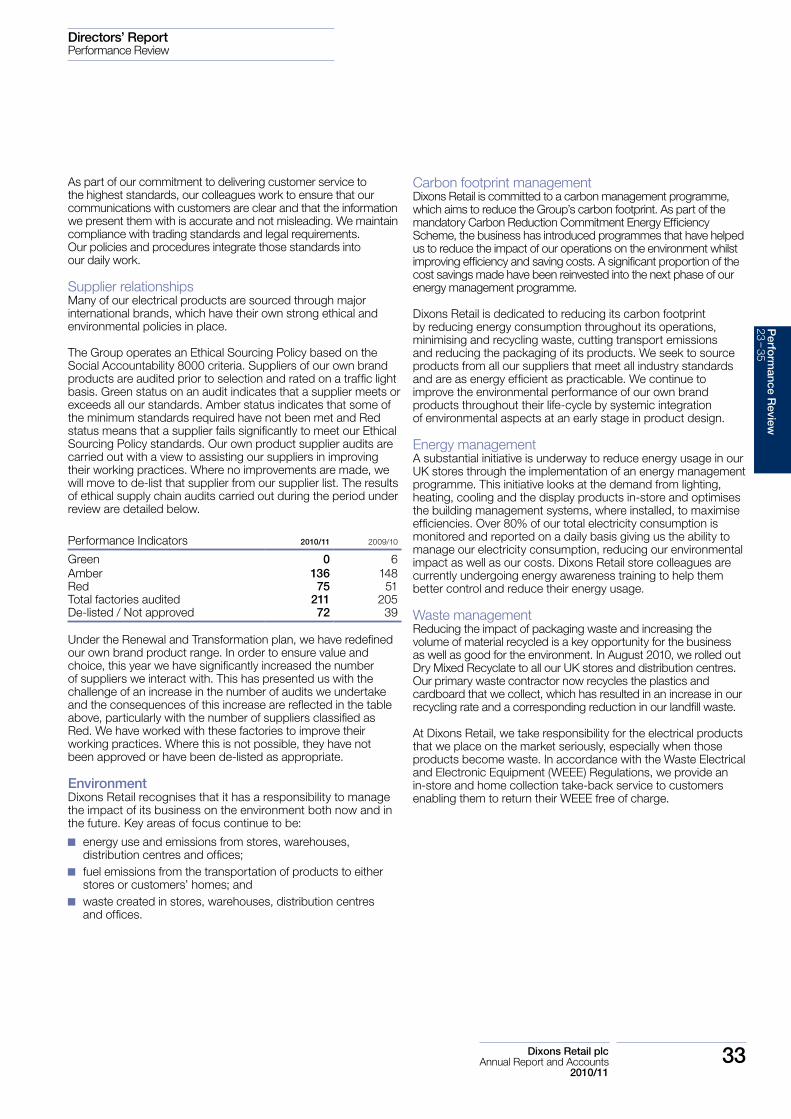
Dixons Retail plc 33 Annual Report and Accounts 2010/11
Directors’ ReportPerformance Review
As part of our commitment to delivering customer service to the highest standards, our colleagues work to ensure that our communications with customers are clear and that the information we present them with is accurate and not misleading. We maintain compliance with trading standards and legal requirements. Our policies and procedures integrate those standards into our daily work.
Supplier relationships Many of our electrical products are sourced through major international brands, which have their own strong ethical and environmental policies in place.
The Group operates an Ethical Sourcing Policy based on the Social Accountability 8000 criteria. Suppliers of our own brand products are audited prior to selection and rated on a traffic light basis. Green status on an audit indicates that a supplier meets or exceeds all our standards. Amber status indicates that some of the minimum standards required have not been met and Red status means that a supplier fails significantly to meet our Ethical Sourcing Policy standards. Our own product supplier audits are carried out with a view to assisting our suppliers in improving their working practices. Where no improvements are made, we will move to de-list that supplier from our supplier list. The results of ethical supply chain audits carried out during the period under review are detailed below.
Performance Indicators 2010/11 2009/10
Green 0 6Amber 136 148Red 75 51Total factories audited 211 205De-listed / Not approved 72 39
Under the Renewal and Transformation plan, we have redefined our own brand product range. In order to ensure value and choice, this year we have significantly increased the number of suppliers we interact with. This has presented us with the challenge of an increase in the number of audits we undertake and the consequences of this increase are reflected in the table above, particularly with the number of suppliers classified as Red. We have worked with these factories to improve their working practices. Where this is not possible, they have not been approved or have been de-listed as appropriate.
EnvironmentDixons Retail recognises that it has a responsibility to manage the impact of its business on the environment both now and in the future. Key areas of focus continue to be:
energy use and emissions from stores, warehouses, distribution centres and offices;
fuel emissions from the transportation of products to either stores or customers’ homes; and
waste created in stores, warehouses, distribution centres and offices.
Carbon footprint managementDixons Retail is committed to a carbon management programme, which aims to reduce the Group’s carbon footprint. As part of the mandatory Carbon Reduction Commitment Energy Efficiency Scheme, the business has introduced programmes that have helped us to reduce the impact of our operations on the environment whilst improving efficiency and saving costs. A significant proportion of the cost savings made have been reinvested into the next phase of our energy management programme.
Dixons Retail is dedicated to reducing its carbon footprint by reducing energy consumption throughout its operations, minimising and recycling waste, cutting transport emissions and reducing the packaging of its products. We seek to source products from all our suppliers that meet all industry standards and are as energy efficient as practicable. We continue to improve the environmental performance of our own brand products throughout their life-cycle by systemic integration of environmental aspects at an early stage in product design.
Energy management A substantial initiative is underway to reduce energy usage in our UK stores through the implementation of an energy management programme. This initiative looks at the demand from lighting, heating, cooling and the display products in-store and optimises the building management systems, where installed, to maximise efficiencies. Over 80% of our total electricity consumption is monitored and reported on a daily basis giving us the ability to manage our electricity consumption, reducing our environmental impact as well as our costs. Dixons Retail store colleagues are currently undergoing energy awareness training to help them better control and reduce their energy usage.
Waste management Reducing the impact of packaging waste and increasing the volume of material recycled is a key opportunity for the business as well as good for the environment. In August 2010, we rolled out Dry Mixed Recyclate to all our UK stores and distribution centres. Our primary waste contractor now recycles the plastics and cardboard that we collect, which has resulted in an increase in our recycling rate and a corresponding reduction in our landfill waste.
At Dixons Retail, we take responsibility for the electrical products that we place on the market seriously, especially when those products become waste. In accordance with the Waste Electrical and Electronic Equipment (WEEE) Regulations, we provide an in-store and home collection take-back service to customers enabling them to return their WEEE free of charge.
Perform
ance Review
23 -- 35

34 Dixons Retail plcAnnual Report and Accounts 2010/11
Directors’ ReportPerformance Review
Waste recycled as a percentage of total waste*
2010/11 2009/10
UK 73% 67%Nordics** 91% 91%* Not including WEEE.** Data for Denmark, Sweden and Norway only.
Transport and distribution Keeping our stores stocked with the thousands of products we sell means our fleet of commercial vehicles is constantly transporting products around the country. The Group seeks to reduce the environmental impact of delivering its products by efficient route planning to avoid unnecessary mileage, using rail freight where appropriate, increasing vehicle load and making use of empty vehicles on return journeys.
Fleet carbon emissionsTonnes of CO2 produced 2010/11 2009/10
UK home delivery fleet 7,830 8,250UK retail fleet 15,088 15,750Nordics delivery fleet 11,267 8,942
Total 34,185 32,942
Workplace Our employeesAt Dixons Retail, we recognise that our people are the key to delivering customer service. We value and respect them and endeavour to engage their talents and abilities to the fullest extent. We want to be recognised as a good employer aiming to reward people fairly, to provide equality of opportunity, personal development and training. Our culture supports the discovery of new and better ways of working, two-way communication and the speedy resolution of any concerns or queries.
Pay and benefits at Dixons are attractive and conducive to the recruitment and retention of talented people. Through a range of share plans, we encourage all employees to build a personal stake in the business.
At Dixons Retail, we work to achieve high standards in employment practices. We have a comprehensive suite of employee policies and procedures, in which we set out our responsibilities and obligations to our colleagues. These policies include procedures covering grievance resolution, bullying and harassment, diversity and equal opportunities. The UK & Ireland business group’s policy on Equal Opportunities states that no employee should suffer discrimination in respect of disability, gender, sexual orientation, age, religious belief, race, colour, nationality, marital status or any other reason. These policies apply to the recruitment, training and career development of all colleagues. Colleague diversity in terms of age, gender and ethnicity remains a key performance indicator of ours and we report on these below.
Corporate Responsibility Report continued
Employee diversity
2010/11 2009/10
Female 28% 33%Male 72% 67%Full-time 65% 67%Part-time 35% 33%Ethnic minority/non national 26% 27%*Aged over 50 11% 7%* Data for those countries within the Group that are either required by law or voluntarily record
this information.
Training and developmentOur personal and career development processes are designed to ensure all our people have the skills to meet the requirements of their roles and to thereby contribute to our Customer Plan. Our store colleagues have all been trained in FIVES, our bespoke sales training programme, and have received further training on service under our KNOWHOW brand. Each employee has a personal appraisal and development plan, including an assessment of their performance together with their line manager on at least an annual basis.
Employee communicationsDixons Retail uses a variety of internal communication channels to ensure that all colleagues are kept informed of operational developments. These include regular town-hall meetings, intranet postings, executive blogs and e-mail communications. We have a great way of keeping our colleagues involved in the development of our business by informing and consulting with them through our Employee Forums. Each major business unit in the UK has its own Employee Forum composed of independently elected employee representatives. The topics covered are wide ranging and include customer service, business efficiency and re-organisation, and performance improvement.
Health and Safety Dixons Retail maintains a strong commitment to health and safety. The Group’s objective is to manage all aspects of its business in a safe manner and take practical measures to ensure that its activities do not harm our customers or our colleagues. Dixons Retail operates a Health and Safety Policy and each area of the business routinely carries out risk assessments and audits to ensure continuous update of the Policy and adherence to it.
During the period under review, we undertook a complete review of operational safety and processes with a particular emphasis on training and management control. Aligned with the use of accident data and root cause analysis, this has made a significant contribution towards the reduction of high risk/high cost accidents throughout the business and a 10% reduction in customer and employee accidents in stores. Plans are in place for further accident reduction and cost saving measures for 2011/12.
Our key performance indicator for health and safety issues is the number of injuries and accidents sustained by our customers and colleagues, progress against which is reported to the Corporate Responsibility Committee on a quarterly basis.

Dixons Retail plc 35 Annual Report and Accounts 2010/11
Directors’ ReportPerformance Review
Health and Safety: employee accidents and injuries
2010/11 2009/10
Number of accidents or injuries reported 985 945Rate of accidents per 1,000 employees 46 41Data for UK and Ireland.
Community Community involvement Given the difficult economic environment experienced across Europe, the charitable activities in the UK were refocused in 2009 to reflect lower levels of fund raising activity. The programme continues the theme of improving access to technology for disadvantaged and disabled children, while encouraging colleagues to engage with their local communities by supporting local charities.
While colleagues can support a charity of their choice, the Group has selected two national charities that colleagues can choose to support, Lifelites and the e-Learning Foundation, who are working locally with colleagues to support their fundraising efforts.
Under the new programme our colleagues have participated in many local and national activities, including the Phone Pledge Evening for Red Nose Day at our KNOWHOW Customer Contact Centre at Sheffield where over 100 colleagues took part in raising over £118,000. Colleagues are also invited to apply for a grant from the DSG international Foundation (the Group’s registered charitable trust) to support their fund raising activities, subject to certain criteria.
Charitable donations made by the Foundation
Amount given
2010/11 £5,0002009/10 £12,000
Key performance indicators The performance criteria reported above are largely focused on the Group’s UK and Nordic businesses. The Committee recognises that it needs to work towards extending the use and monitoring of these performance criteria throughout the rest of the Group, with a view to improving the reporting of the Group’s corporate responsibility efforts going forward.
Nicholas CadburyExecutive Director with responsibility for Corporate Responsibility
Perform
ance Review
23 -- 35

36 Dixons Retail plcAnnual Report and Accounts 2010/11
1
5
2
6
3
7
4
8
Directors’ ReportCorporate Governance
Board of Directors
1 John Allan Chairman (Age 62)Appointment to the Board: 23 June 2009 and was appointed Chairman on 2 September 2009Committee Membership: Nominations (Chairman) and RemunerationExternal Appointments: Chairman of WorldPay Limited and Care UK Health & Social Care Holdings Limited. Non-Executive Director of National Grid plc and ISS A/S. Member of the University of Edinburgh Campaign Board, Director of Natakate Ltd and non-executive member of the Home Office supervisory board.Previous Experience: John Allan was previously Chief Executive of Exel PLC and following its acquisition by Deutsche Post, a member of its Management Board and subsequently Chief Financial Officer of Deutsche Post. Prior to this, he was a director of BET Plc. His early career was with Lever Brothers, Bristol-Myers Company Ltd and Fine Fare Ltd. John Allan has extensive Board experience having been Chairman of Samsonite Corporation and a non-executive director of PHS Group plc, Wolseley plc, Hamleys plc, 3i plc and Connell plc. He has also served on the supervisory Boards of both Lufthansa AG and Deutsche Postbank.
2 John BrowettChief Executive (Age 47)Appointment to the Board: 5 December 2007Committee Membership: ExecutiveExternal Appointments: Non-Executive Director of easyJet PLCPrevious Experience: John Browett joined the Group following a successful career at Tesco PLC, where he held a series of senior roles including Operations Development Director, Chief Executive of Tesco.com and Group Strategy Director. His early career was with Boston Consulting Group, where he advised a series of retail and consumer goods clients.
3 Nicholas CadburyGroup Finance Director (Age 45)Appointment to the Board: 17 July 2008Committee Membership: ExecutiveExternal Appointments: NonePrevious Experience: Nicholas Cadbury joined the Group in 1993 after qualifying as a Chartered Accountant with PricewaterhouseCoopers. He has extensive experience of the Group’s business and has held a range of senior positions including Group International Finance Director, Finance Director and Commercial Director of PC World and Managing Director of Dixons Travel.
4 Andrew LynchSenior Independent Non-Executive Director (Age 54)Appointment to the Board: 20 May 2003Committee Membership: Audit (Chairman), Nominations and RemunerationExternal Appointments: Chief Executive of SSP GroupPrevious Experience: Andrew Lynch is a former Director and Group Finance Director of Compass Group PLC. He led SSP, a food service group, through its divestment from Compass Group PLC and was involved in the management buy-out of Travellers Fare from British Rail prior to its acquisition by Compass Group PLC. Andrew Lynch started his career at KPMG, after which he joined Prudential Corporation plc, where he held a series of corporate finance and financial management positions.
5 Rita CliftonIndependent Non-Executive Director (Age 53)Appointment to the Board: 1 September 2003Committee Membership: Audit, Nominations and RemunerationExternal Appointments: Chairman of Interbrand U.K. Limited and Populus Limited, Non-Executive Director of Bupa, President of the Market Research Society, Director of Henley Festival Limited, Visiting Professor at Henley Management College, Trustee of the WWF and Member of the Assurance and Advisory Board of BP p.l.c.’s carbon offset programme. Most recently she has taken up the Chairmanship of BTCV, the social enterprise group.Previous Experience: Rita Clifton was formerly Vice Chairman and Executive Planning Director at Saatchi and Saatchi. She has had a successful 18 year advertising career with both Saatchi and Saatchi and J Walter Thompson. Rita Clifton was previously a Non-Executive Director of Emap plc and a member of the Sustainable Development Commission.
6 Prof. Dr. Utho CreusenIndependent Non-Executive Director (Age 55)Appointment to the Board: 1 February 2010Committee Membership: Audit, Nominations and RemunerationExternal Appointments: Owner of Positive Leadership (a management consultancy) and co-owner of Grid-International and Alpha tecc (the German consumer electronics chain), Non-Executive Director of M.Video (the leading Russian electronic retailer), Chairman of the Jury of the European Retail Institute, Vice-President of Modern Market-Methods Association in Germany, Advisor to Boston Consulting Group, and Honorary Professor at both Westfälische Wilhelms-Universität Münster and the Catholic University, Eichstätt-Ingolstadt.Previous Experience: Utho Creusen has extensive international retail experience. He was previously Human Resources Director of Media-Saturn Holding GmbH (an electronics retail chain). Utho Creusen spent 22 years with OBI AG, a leading European DIY retailer, where he rose to become a member of its Executive Board and Chairman of OBI Franchise GmbH.
7 Tim HowIndependent Non-Executive Director (Age 60)Appointment to the Board: 8 September 2009 Committee Membership: Audit, Nominations and Remuneration (Chairman)External Appointments: Chairman of Rayner and Keeler Limited and Woburn Enterprises Limited. Non-Executive Director of Henderson Group plc and Framlington AIM VCT plc, Director of Enotria Group Ltd, Wine and Spirit Education Trust and a Governor of the Peabody Trust.Previous Experience: Tim How was formerly Chief Executive of Majestic Wine PLC, where he led the management buy-out of the business and subsequent Alternative Investment Market (AIM) flotation. Prior to this, Tim How was Managing Director of Bejam Group plc.
8 Dharmash MistryIndependent Non-Executive Director (Age 40)Appointment to the Board: 27 September 2010Committee Membership: Audit, Nominations and RemunerationExternal Appointments: Partner at Balderton Capital Management (UK) LLP, Investor Director and Board member of Sulake (Habbo Hotel), my-wardrobe.com, MOG, eWise and KupiVIP.ru.Previous Experience: Prior to joining Balderton Capital Management (UK) LLP, Dharmash Mistry was part of the executive team at Emap PLC, most recently as Group Managing Director of Emap Consumer Media and Emap Performance. Prior to this, Dharmash was at Boston Consulting Group and started his career as a Brand Manager at Procter & Gamble.
Dixons Retail plc 37 Annual Report and Accounts 2010/11
Directors’ ReportCorporate Governance
The Executive Committee comprises the senior leaders of the Company from various business functions and regions. It is tasked with the day-to-day management of the Company.
Steve AgerCommercial Director (Age 51)Steve Ager joined the Group following a successful career with Tesco PLC, where he held several UK and international commercial and buying roles. His achievements include setting up Tesco’s operations in Asia and Central Europe, creating the Tesco Express format and masterminding the Tesco Finest range.
Katie BickerstaffeGroup People, Marketing and Property Director (Age 44)Katie Bickerstaffe has extensive retail experience, having joined the Group from Kwik Save where she was Managing Director. She will be joining the Board of Scottish and Southern Energy plc as a Non-Executive Director on 1 July 2011. Prior to joining Dixons Retail, she was Group Retail Director and Group HR Director of Somerfield plc. Her early career was with Dyson, PepsiCo and Unilever.
John BrowettChief ExecutiveSee Board of Directors on opposite page for biography.
Nicholas CadburyGroup Finance DirectorSee Board of Directors on opposite page for biography.
Ronny BlomsethManaging Director, Nordic Region (Age 42)Ronny Blomseth has had a 20 year career with Elkjøp, Dixons Retail's Nordics business. Following various store positions, he rose through the business to hold the roles of Sales Manager at Elkjøp, Norway and subsequently Elkjøp Group Managing Director.
Helen GranthamCompany Secretary and General Counsel (Age 46)Helen Grantham qualified as a Solicitor with Hammonds and then worked as an in-house lawyer with Boots. She went on to serve as Company Secretary of Chubb plc and Hepworth PLC. Helen Grantham joined the Group from William Hill PLC, where she was both Company Secretary and General Counsel.
Executive Committee
Sebastian JamesGroup Operations Director (Age 44)Sebastian James joined the Group as Development Director in January 2010. Prior to this, he was Chief Executive of Synergy Insurance Services Limited and Strategy Director at Mothercare plc. Sebastian James started his career at Boston Consulting Group.
Mario MaiocchiManaging Director, Southern Europe (Age 55)Mario Maiocchi joined the Group in February 2008 as Managing Director of Unieuro, the Group’s Italian business. Prior to this, he held a range of senior leadership roles including President and General Manager of Metro Italia, Chief Financial Officer of Metro France and Managing Director of EMI Financial Services.
Steve RosenblumPresident, PIXmania (Age 37)Steve Rosenblum has been President of PIXmania since buying out the business with his brother in 2001. PIXmania became a part of the Dixons Retail Group in 2006.
Jean-Emile RosenblumVice President, PIXmania (Age 33)Jean-Emile Rosenblum has been Vice President of PIXmania since buying out the business with his brother in 2001. PIXmania became a part of the Dixons Retail Group in 2006.
Corp
orate Governance
36 -- 55

38 Dixons Retail plcAnnual Report and Accounts 2010/11
Directors’ ReportCorporate Governance
Statutory Information
The directors present their report and audited financial statements for the 52 week period ended 30 April 2011.
The Business Review, which provides a comprehensive review of the development, performance and future prospects of the Group’s operations for the 52 weeks ended 30 April 2011, includes the following:
Business Overview, including principal activities Strategic Summary Performance Review, including Corporate Responsibility Report Corporate Governance
These sections are incorporated by reference and are deemed to form part of this report.
Changes in composition of the GroupAfter having considered the Group’s options for PC City Spain, the Board confirmed plans to exit operations in Spain on 14 April 2011. The decision was made due to the continuing weak consumer environment and continuing losses of the business, together with the Group’s plans to focus on combined electrical and computing stores. All 34 stores and the online operations of PC City Spain will be closed or transferred to third parties.
Post balance sheet eventsParticulars of any important events affecting the Group since 30 April 2011 are described in note 33 of the Financial Statements.
DirectorsThe names, biographies and dates of appointment of the directors serving during the period under review are provided on page 36.
In line with best practice, all directors retired and being eligible offered themselves for reappointment at the 2010 AGM. The Board has decided to follow the same procedure at the 2011 AGM and accordingly, all directors will retire and seek reappointment. The Remuneration Report on page 49 provides details of applicable service agreements for executive directors and terms of appointment for non-executive directors. The Board is satisfied that each director is qualified for reappointment by virtue of their skills, experience and contribution to the Board.
During the year, no director had any material interest in any contract of significance to the Group’s business. Their interests, including those of any connected persons, in the shares of the Company are outlined in sections (V), (IX) and (X) of the Remuneration Report.
With regard to the appointment and replacement of directors, the Company is governed by its Articles of Association, the Combined Code, the Companies Act and related legislation. The Articles themselves may be amended by special resolution of the shareholders.
In accordance with the Company’s Articles of Association and to the extent permitted by law, the Company may indemnify its directors out of its own funds to cover liabilities incurred as a result of their office. The Group has purchased directors’ and officers’ liability insurance cover for any claim brought against directors or officers for wrongful acts in connection with their positions. The insurance provided does not extend to claims arising from fraud or dishonesty.
Subject to the Company’s Memorandum and Articles of Association, the Companies Acts and any directions given by the Company by special resolution, the business of the Company will be managed by the Board, who may exercise all the powers of the Company, whether relating to the management of the business of the Company or not. The powers of the Board are detailed in a specific schedule, details of which are provided in the Corporate Governance Report.
Directors’ responsibilitiesThe directors’ responsibilities for the financial statements contained within this Annual Report and the directors’ confirmations required under Disclosure and Transparency Rule 4.1.12 are set out on page 55.
Employees and employee share schemesA commentary on the Group’s role as an employer is included in the Corporate Responsibility Report and details of employee involvement through share participation are contained in the Remuneration Report.
Details of the Group’s employee share plans and long-term incentive plans are contained in the Remuneration Report and note 25 to the Financial Statements.
Share capitalThe authorised and issued share capital of the Company, together with any shares issued during the period are set out in note 23 to the Financial Statements. The voting rights of all Dixons Retail plc shares are identical, with each share carrying the rights to one vote. Dixons Retail plc holds no ordinary shares in Treasury and did not make any market purchases of its own shares during the period under review. The Company does not have any class of share other than its ordinary shares.
Restrictions on transfer of securities of the CompanyThere are no specific restrictions on the size of a holding nor on the transfer of shares, which are both governed by the general provisions of the Articles of Association and prevailing legislation. The directors are not aware of any agreements between holders of the Company’s shares that may result in restrictions on the transfer of securities or on voting rights.
No person has any special rights of control over the Company’s share capital and all issued shares are fully paid.
Change of control – significant agreementsThe Company does not have any significant agreements which contain change of control clauses other than for its borrowings – further details are disclosed in note 17 to the Financial Statements.
In addition, provisions under the rules of the Company’s share incentive schemes may cause options and awards granted under these schemes to vest and become exercisable in the event of a change of control.

Dixons Retail plc 39 Annual Report and Accounts 2010/11
Directors’ ReportCorporate Governance
Major shareholdersAs at 23 June 2011, the Company has been notified in accordance with the Financial Service Authority’s Disclosure and Transparency Rules, of the following interests in the voting rights of the Company:
Direct/indirect No. of shares %
Schroders Plc Indirect 400,893,720 11.1%UBS Global Asset Management Direct and Indirect 368,082,813 10.2%Standard Life Investments Ltd Direct and Indirect 343,988,634 9.5%Capital Research & Management Company Indirect 227,424,267 6.3%Tameside MBC Greater Manchester Pension Fund Direct 219,899,644 6.1%Invesco Limited Indirect 180,788,477 5.0%Letko, Brosseau & Associates Inc. Indirect 179,918,108 5.0%Capital Group International, Inc. Indirect 175,204,174 4.9%Skagen AS Direct 148,902,954 4.1%Legal & General Group Plc Direct 115,471,857 3.2%
Issue of sharesAt the 2010 Annual General Meeting, shareholders approved a resolution to give the directors authority to allot shares up to an aggregate nominal value of £30,083,043. The directors have no present intention to issue ordinary shares, other than pursuant to employee share schemes. This resolution remains valid until the conclusion of this year’s Annual General Meeting when a resolution will be proposed to renew these authorities.
Related party transactionsDetails of related party transactions undertaken during the year are contained in note 32 to the Financial Statements.
Political and charitable donationsThe Group engages in various charitable activities as set out in the Corporate Responsibility Report on page 35. During the period under review, the Group made donations of £211,000 (2009/10 £136,000) to local charities serving the communities in which Dixons Retail operates.
At the 2010 Annual General Meeting, the shareholders of the Company adopted a resolution authorising the Board to incur political expenditure up to an aggregate amount not exceeding £25,000 during 2010/11. Notwithstanding this, the Company made no political donations during the period (2009/10 £nil).
Payment of suppliersIt is the Group’s policy to agree terms of payment with its suppliers on a case by case basis prior to commencing trade with them. Payments are made in accordance with these terms provided the supplier has complied with relevant contractual obligations. Trade creditors as at 30 April 2011 represent 53 days of annual purchases made during the period (1 May 2010 49 days).
Audit informationSo far as each person who is a director at the date of approving this report is aware, there is no relevant audit information, being information needed by the auditors in connection with their report, of which the auditors are unaware. Having made enquiries of fellow directors, each director has taken all the steps that he/she is obliged to take as a director in order to make himself/herself aware of any relevant audit information and to establish that the auditors are aware of that information. This information is given and should be interpreted in accordance with the provisions of Section 418 of the Companies Act 2006.
Going concern In considering the going concern basis for preparing the financial statements, the directors have considered the Company’s objectives and strategy, risks and uncertainties in achieving its objectives and its review of business performance which are all set out in the Business Overview, Strategic Summary and Performance Review sections of this Annual Report and Accounts. The Group’s liquidity and funding arrangements are described in notes 17 and 22(f) to the financial statements as well as in the funding section of the Performance Review and the directors consider that the Group has significant covenant and liquidity headroom in its borrowing facilities for the foreseeable future.
Accordingly, after reviewing the Company’s expenditure commitments, current financial projections and expected future cash flows, together with the available cash resources and undrawn committed borrowing facilities, the directors have considered that adequate resources exist for the Company to continue in operational existence for the foreseeable future. Accordingly, the directors continue to adopt the going concern basis in preparing the financial statements.
Corporate governance complianceThe statement on compliance with the Combined Code for the reporting period is contained on page 40 of this report.
Annual General MeetingThe Annual General Meeting will be held on 7 September 2011 at Holiday Inn London - Bloomsbury, Coram Street, Russell Square, London WC1N 1HT at 10.00am. The Notice of Meeting, together with full details of the business to be conducted, will be included in a separate letter accompanying this report.
AuditorsDeloitte LLP have expressed their willingness to be reappointed as auditors of the Company. Upon the recommendation of the Audit Committee, resolutions to reappoint them as auditors and to authorise the directors to determine their remuneration will be proposed at the forthcoming Annual General Meeting.
Helen GranthamCompany Secretary 23 June 2011
Corp
orate Governance
36 -- 55

40 Dixons Retail plcAnnual Report and Accounts 2010/11
Directors’ ReportCorporate Governance
Corporate Governance Report
IntroductionThe Board recognises the importance of good corporate governance and maintains high standards of corporate governance for which the directors are collectively accountable to shareholders. The Board confirms that during the 52 weeks ended 30 April 2011, and as at the date of this Annual Report, the Company has been in compliance with the Code provisions set out in Section 1 of the UK Financial Reporting Council’s 2008 Combined Code on Corporate Governance (the “Code”), which continues to apply for this financial year. This report together with the Statutory Information on pages 38 to 39, the Audit Committee Report on page 44, the Nominations Committee Report on page 45, and the Remuneration Report on pages 46 to 54 provides details of how the Company has applied the principles and complied with the provisions of the Code.
The UK Corporate Governance Code was published on 28 May 2010 (the “New Code”). The New Code applies to the Company for the financial year commencing 1 May 2011. The Board has identified two principles which it has voluntarily chosen to adopt in advance of the requirement to do so. All directors stood for re-election at the Company’s Annual General Meeting (AGM) in 2010 and will also all stand for re-election at the AGM in 2011. In addition, the Board has decided that the performance evaluation for 2011/12 will be facilitated by an external service provider.
The BoardAs at 30 April 2011 and the date of this report, the Board of Directors was made up of eight members, comprising the Chairman, two executive directors and five non-executive directors. All of the non-executive directors are considered by the Board to be independent and each brings their own senior level of experience. The Chairman was deemed to be independent on appointment.
The division of responsibility between the Chairman and Chief Executive is formally defined, set out in writing and reviewed by the Board on a regular basis. The Chairman is responsible for the overall operation, leadership and governance of the Board. The Chief Executive is responsible for the executive management of the Group’s business and for implementing the Group’s strategic and commercial objectives.
Andrew Lynch, as the Senior Independent Director, supports the Chairman and is available for approach or representation from shareholders who feel they are unable to raise issues with the Chairman. He also discusses, on an individual basis, the performance of the Chairman with each director and provides feedback on these discussions to the Chairman.
The Board has a formal schedule of matters reserved for its decision. This schedule is reviewed periodically and includes, but is not limited to, the following matters:
approval of Group strategy and the annual budget; oversight of the Group’s operations and review of
its performance; changes relating to the Company’s share capital or
corporate structure; communications with shareholders including approval of
the Interim Statement, Annual Report and Accounts (including the review of critical accounting policies and judgements and assessment of going concern) and other major public announcements;
maintaining and monitoring the Group’s system of internal control and risk management;
approval of major capital expenditure, material acquisitions and divestments and material contracts; and
the appointment and remuneration of the external auditors on the recommendation of the Audit Committee.
Helen Grantham, the Company Secretary and General Counsel, acts as Secretary to the Board and its Committees. She is also responsible for ensuring that correct Board procedures are followed and advises the Board on legal and corporate governance matters. All directors have access to the advice and services of the Company Secretary and may also take independent professional advice at the expense of the Company in the furtherance of their duties. The appointment and removal of the Company Secretary is one of the matters reserved for the Board.
The Board meets regularly during the year and during the 52 weeks ended 30 April 2011, 13 meetings were held including nine scheduled meetings and four ad-hoc meetings convened to deal with specific matters requiring Board consideration or approval. Due to the ad-hoc meetings being called at short notice, not all the directors were available to attend due to other commitments. The Board also held a Strategy Day during the period.

Dixons Retail plc 41 Annual Report and Accounts 2010/11
Directors’ ReportCorporate Governance
Board and committee attendanceThe table below shows attendance at scheduled Board and Committee meetings during the 52 weeks ended 30 April 2011, expressed as the number of meetings attended compared to the number entitled to attend.
BoardAudit
CommitteeNominations
CommitteeRemuneration
Committee
John Allan 9 of 9 – 4 of 4 4 of 4John Browett 9 of 9 – – –Nicholas Cadbury 9 of 9 – – –Rita Clifton 9 of 9 4 of 4 4 of 4 4 of 4Prof. Dr. Utho Creusen 8 of 9 3 of 4 4 of 4 3 of 4Tim How 8 of 9 4 of 4 4 of 4 4 of 4Andrew Lynch 9 of 9 4 of 4 4 of 4 4 of 4Dharmash Mistry* 5 of 5 2 of 2 1 of 1 3 of 3*appointed on 27 September 2010
Committees of the BoardThe Board has four main Committees; the Executive, Audit, Nominations and Remuneration Committees. Individual reports on the work of the Audit, Nominations and Remuneration Committees and their membership are set out on pages 44 to 54.
Dixons Retail is dependent on its senior management to operate its business and execute its strategies. Dixons Retail has a decentralised management structure with many high-level management decisions delegated to regional or country management.
The Executive Committee is the key management committee and is chaired by the Chief Executive. In addition it comprises the Group Finance Director, the Commercial Director, the Group People, Marketing and Property Director, the Group Operations Director, the Company Secretary and General Counsel, the Managing Directors of the Nordics and Southern Europe and the President and Vice-President of PIXmania. Biographical details of the Executive Committee are provided on page 37. The Committee meets on a four to six weekly basis and is responsible for reviewing and making recommendations to the Board on:
formulation and implementation of the Group’s strategy; capital expenditure and investment budgets; delivery of financial results and other business performance
objectives; optimal utilisation of business opportunities; and risks arising from competitive and economic changes.
Board information and developmentThe Chairman is responsible for ensuring that all directors are properly briefed on issues arising at Board meetings and that they have full and timely access to relevant information. The quality and supply of information provided to the Board is reviewed as part of the Board evaluation exercise. The Chairman also holds occasional meetings with the non-executive directors without the executive directors being present to discuss, amongst other matters, corporate strategy and performance and the performance of the executive team. There is frequent contact between directors outside formal meetings to progress the Group’s business and to promote open communication and team working.
The Board holds meetings at a variety of Group business locations to help all Board members gain a deeper understanding of the business. This also provides senior managers from across the Group with the opportunity to present to the Board as well as to meet the directors on more informal occasions. All directors are encouraged to attend external seminars relevant to the retail industry and corporate governance matters in order to refresh and update their knowledge. The Board also receives bi-monthly updates on legal and corporate governance matters.
New directors appointed to the Board receive a tailored induction programme into the Group together with guidance and training appropriate to their level of previous experience. Each director is given the opportunity to meet with the Executive Committee, other members of senior management and store colleagues, and to visit the Group’s sites both in the UK and overseas in order to familiarise themselves with the Group’s businesses and the markets in which they operate. New directors are also encouraged to meet with the Group’s auditors and other advisors.
Board evaluationDuring the year the Board undertook a formal evaluation of the performance of the Board, its committees and of individual director performance. The evaluation was conducted internally by the Chairman with the assistance of the Company Secretary. Each director held a one-to-one meeting with the Company Secretary who summarised the discussions on an anonymous basis for the Chairman who then held a further one-to-one meeting with each director to review the feedback, individual director performance and any necessary training and development needs. Key issues and action areas are then reported to and monitored by the Board. Each Committee also considered a detailed questionnaire relating to the areas of responsibility for that particular Committee and feedback provided. Following the review in 2010/11, the Board agreed that the balance of skills and experience was felt to be appropriate. The Board also agreed that the evaluation process in 2011/12 would be conducted with the assistance of an external service provider.
Corp
orate Governance
36 -- 55

42 Dixons Retail plcAnnual Report and Accounts 2010/11
Directors’ ReportCorporate Governance
Authorisation of conflicts of interestThe Company has procedures in place to identify, authorise and manage conflicts of interest and these procedures have operated effectively during the year. Authorisation of conflicts is handled by the Board and the Audit Committee reviews them on an annual basis. A register of directors’ conflicts is maintained.
Internal control The Board has overall responsibility for the Group’s system of internal control and for reviewing its effectiveness, whilst senior management is responsible and accountable for internal control and effective risk management at an operational level.
The Board confirms that the Group has established and maintained a process for identifying, evaluating and managing the significant risks faced by the Group and this has been in place throughout the 52 weeks ended 30 April 2011, up to the date of approval of the financial statements, and accords with the Turnbull guidance and the Code. This process is designed to manage rather than eliminate the risk of failure to achieve the Company’s business objectives and can only provide reasonable and not absolute assurance against material misstatement or loss.
Certain of the Board’s responsibilities have been delegated to the Audit Committee, which has reviewed the effectiveness of the system of internal control (including financial, operational and compliance controls) and risk management. The Audit Committee has ensured that any required remedial action has or is being taken. This has included a review of the proposed actions and revised processes to address historical weaknesses in controls over supplier receivables in PIXmania, which gave rise to a significant write-off during the period.
The system of internal control and the process for managing risk include the following elements:
discussion and approval by the Board of the Group’s strategic direction, plans and objectives and the risks to achieving them;
the Board and management committees meet regularly to monitor progress against the targets set out in the Group’s budget and strategic five year plan;
the defined levels of authority established by the Board ensure that significant decisions are taken at an appropriate level;
each business function has established procedures and controls to minimise the risk of fraud and to safeguard the Group’s assets;
appropriate controls and procedures have been established over the security of data held on, and functionality provided by, the Group’s business systems. These include disaster recovery arrangements;
the Group appoints individuals who are of a calibre to enable them to discharge the duties and responsibilities of the roles assigned to them;
the Group has implemented appropriate strategies to deal with each significant risk that has been identified. These strategies include insurance, treasury statements and common standards of internal control;
Corporate Governance Reportcontinued
local management at each business unit and in those functions of the Group requiring greater overview has responsibility for identification and evaluation of significant risks to their business areas together with design of mitigating controls; and
post completion assessments are carried out following major acquisitions.
The Group’s approach to managing risk is reviewed regularly to identify ways in which it can be improved.
There are clear processes for monitoring the system of internal control and reporting any significant corrective control weaknesses, together with corrective action. These include reports to the Audit Committee from assurance providers, periodic certification from business units, reviews by Group and regional management, whistleblowing facilities and independent assurance from both internal and external audit. Some of these are described in more detail below.
Internal auditThe Internal Audit department is fully independent of business operations and has a Group-wide mandate. Its work is driven by a risk-based methodology ensuring that the controls to mitigate the Group’s key risks are audited on a regular basis. Its plans are approved by the Audit Committee, which also receives regular reports on its findings and progress of related actions. The department also works with the businesses to promote and further develop effective risk management within their operations. The Group Director for Internal Audit and Risk Management attends all Audit Committee meetings.
External auditorsThe external auditors provide further independent observations of certain elements of the internal financial controls as part of their audit of the financial statements. Their findings are presented to the Audit Committee with updates on progress against the recommendations being made throughout the year.
Whistleblowing policyThe Group operates a whistleblowing policy and has a confidential helpline operated by a third party. This can be used to report, anonymously if so wished, on matters of concern to employees. This can range from unethical behaviour, such as fraud, to practices that might endanger the health of customers and employees.
Bribery ActThe Bribery Act is due to come into force on 1 July 2011. The Group has taken steps to enhance policies and procedures that it deems will be adequate to meet the requirements of the Act and will help to prevent individuals associated with the Group from committing acts of bribery.
Dixons Retail plc 43 Annual Report and Accounts 2010/11
Directors’ ReportCorporate Governance
Relations with shareholdersThe Company is committed to effective communication with all shareholders, whether institutional investors, private or employee shareholders. The Company reports formally to shareholders when its full year and half year results are published. These results are posted on the Company’s corporate website www.dixonsretail.com. Regular trading updates are also posted on the Company’s website. Formal notification of the Company’s AGM is sent to shareholders at least 20 working days in advance of the meeting. The directors, including the respective Chairmen of the Audit, Remuneration and Nominations Committees, are available for questions formally during the AGM and informally afterwards. Details of the 2011 AGM are set out in the Notice of Meeting accompanying this Annual Report.
Effective two-way communication with institutional investors, brokers and analysts is established through regular presentations and meetings in the UK and overseas, usually by the Chief Executive, Group Finance Director and Group Communications Director. The Chairman holds occasional meetings with major shareholders to discuss matters of mutual interest including corporate strategy and governance. Where appropriate, the Chairman of the Remuneration Committee communicates with major shareholders to canvass opinion when deciding remuneration policy. The Senior Independent Director and other non-executive directors are also available to attend meetings with major shareholders if requested. Matters arising from these presentations and meetings are communicated to the Board. The Board receives an Investor Relations report at each of its scheduled meetings.
Corp
orate Governance
36 -- 55

44 Dixons Retail plcAnnual Report and Accounts 2010/11
Directors’ ReportCorporate Governance
Membership and processThe Committee comprises Andrew Lynch (as Chairman), Rita Clifton, Prof. Dr. Utho Creusen, Tim How and Dharmash Mistry, all of whom are independent non-executive directors. Dharmash Mistry was appointed to the Committee on 27 September 2010.
The biographical details of the members of the Committee are set out on page 36. The Board is satisfied that the Chairman of the Committee meets the requirement for recent and relevant financial experience. The Company Secretary acts as Secretary to the Committee.
The Committee met on four occasions during the period under review, and the members’ attendance record is set out on page 41. The Chairman of the Committee reports the Committee’s deliberations to the following Board meeting and the minutes of each meeting of the Committee are circulated to all members of the Board.
RoleThe Committee assists the Board to fulfil its oversight responsibilities. Its primary functions are to:
monitor the integrity of the financial statements and any formal announcements relating to the Group’s financial performance;
review critical accounting policies and financial reporting judgements;
review the integrity of the Group’s system of internal control and risk management;
monitor and review the effectiveness of the Group’s internal audit function;
review and approve the annual audit plan of both the internal and external audit functions including principal areas of focus;
review the Group’s risk and insurance programmes; carry out an annual assessment of the external auditors,
review and monitor their independence and objectivity taking into consideration relevant UK professional and regulatory requirements, assess the effectiveness of the external audit process, approve the external auditors’ remuneration and terms of engagement and make recommendations in respect of their reappointment or removal;
review the directors’ conflicts of interest register and to agree any amendments to previously approved conflicts;
review regularly the Group’s policy on the supply of non-audit services by the external auditors, such that relevant ethical guidance regarding the provision of non-audit services, when taken as a proportion of the audit fee, is considered in addition to the nature of such services in order to preserve the external auditors’ independence and objectivity; and
monitor the results and effectiveness of arrangements under which employees can raise in confidence issues of concern relating to financial matters and internal controls.
The terms of reference for the Committee are reviewed annually by the Committee and then by the Board. A copy of the terms of reference is available on the Group’s corporate website.
Audit Committee Report
Attendance at meetingsThe Chairman of the Board, Chief Executive, Group Finance Director, Group Financial Controller, Group Chief Accountant, Director of Internal Audit and Risk, Deputy Company Secretary and external auditors were invited by the Chairman of the Committee to attend all meetings of the Committee. The Group Treasurer and Group Tax Director also attended meetings at the Committee’s request. Each time the Committee convenes, it also meets with external auditors without the presence of management.
In undertaking its duties, the Committee has access to the services of the Group Finance Director and the Company Secretary, as well as access to external professional advice.
Key matters consideredDuring the period, the Committee reviewed the following:
significant issues arising from reports of both the internal and external audits;
measures adopted to ensure compliance with the Group’s credit facilities;
systems and controls in place at PIXmania following the identification of historical under-estimated purchase accruals;
the working capital position of the Group and the management of its cash flow;
the carrying value of certain assets in the Group; tax matters; recommendations from the Nominations Committee
concerning the composition of the Committee; a review of the Committee’s performance and terms of reference; the role and resources of Internal Audit; a review of the Group’s Delegation of Authority Policy; developments in corporate governance; and the annual audit fee, which is set out in note 3 to the Financial
Statements, with due regard to the balance between audit and non-audit fees and the policy for approval of non-audit fees paid to the Group’s auditors.
External auditorsThe Committee, having considered the policies and procedures applied by the Group and the internal policies and representations of Deloitte LLP, including the regular rotation of audit partner, remains satisfied with the auditors’ objectivity and independence and the effectiveness of the audit process. Accordingly, the Committee has recommended to the Board that a resolution for their reappointment be proposed at the AGM.
Andrew LynchChairman of the Audit Committee 23 June 2011
Dixons Retail plc 45 Annual Report and Accounts 2010/11
Directors’ ReportCorporate Governance
Membership and processThe Committee comprises John Allan (as Chairman), Rita Clifton, Prof. Dr. Utho Creusen, Tim How, Andrew Lynch and Dharmash Mistry, all of whom are non-executive directors. Dharmash Mistry was appointed to the Committee on 27 September 2010.
The biographical details of the members of the Committee are set out on page 36. The Company Secretary acts as Secretary to the Committee.
The Committee met on four occasions during the period under review, and the members’ attendance record is set out on page 41. The Chairman of the Committee reports the Committee’s deliberations to the following Board meeting and the minutes of each meeting of the Committee are circulated to all members of the Board.
RoleThe principal duties of the Committee are to:
keep under review the structure, size and composition of the Board and its principal committees and to recommend changes deemed necessary;
to be responsible for the succession planning for Board members, in particular, the Chairman and Chief Executive;
to identify, evaluate and nominate candidates to fill vacancies on the Board; and
to make recommendations to the Board regarding the continuation in office of a director upon the expiry of any specified terms of appointment.
The terms of reference for the Committee are reviewed annually by the Committee. A copy of the terms of reference is available on the Group’s corporate website.
Key matters consideredDuring the year, the principal matters considered by the Committee were as follows:
consideration of the succession planning process for the directors;
an evaluation of the size, composition and structure of the Board and its Committees;
the appointment of Dharmash Mistry to the Board and its Committees; and
a review of the Committee’s performance and terms of reference.
Nominations Committee Report
The Nominations Committee keeps itself abreast of best practice through a combination of private research and briefing by internal and external advisors on key developments relevant to the Company.
In considering the appointment of Dharmash Mistry as a non-executive director, the Committee engaged the services of The Zygos Partnership, an external agency, to assist with the search process. The search process involved meeting with potential candidates, taking up references and assessing their skills, experience and suitable fit with the Board.
The terms of reference of the Nominations Committee were updated during the year in line with guidance issued by the Institute of Chartered Secretaries and Administrators. In doing so, it was resolved that succession planning for senior executives (other than Board members) continue to be dealt with by the full Board.
The Board and the Nominations Committee are mindful of the fact that the Company has a number of long-serving directors and is looking at succession and refreshment in this context. In line with Lord Davis’ recent Report on Women on Boards, the diversity of our Board will also be reviewed.
In line with best practice, each director will retire this year and offer themselves for re-election by shareholders at the 2011 AGM. The Committee considers it appropriate that each of them be re-elected because of their individual experience and knowledge within the retail sector and wider management and industry experience. After performance evaluation, it was concluded that each director continues to be effective and committed to their role.
The executive directors’ service contracts and non-executive directors’ letters of appointment are available for inspection by prior arrangement during normal business hours at the Company’s registered office. They will also be available for inspection at the venue, prior to the AGM, details of which are contained in the Notice of Meeting.
John AllanChairman of the Nominations Committee 23 June 2011
Corp
orate Governance
36 -- 55

46 Dixons Retail plcAnnual Report and Accounts 2010/11
Directors’ ReportCorporate Governance
Remuneration Report
This report, approved by the Board, has been prepared in accordance with the Companies Act 2006, Schedule 8 of the Large and Medium sized Companies and Groups (Accounts and Reports) Regulations 2008 (“Schedule 8”) and the Listing Rules of the Financial Services Authority. This report is divided into two sections:
remuneration policy (not subject to audit and as set out in sections (I) to (VI)) which details the role of the Committee, the principles of remuneration and other matters; and
remuneration review (audited and as set out in sections (VII) to (XI)) which details directors’ and former directors’ emoluments, share awards, share options and pension arrangements.
The purpose of this report is to inform shareholders of the Company’s policies on directors’ remuneration for the financial period ended 30 April 2011 and, so far as practicable, for subsequent years as well; and to provide details of the remuneration of individual directors as determined by the Remuneration Committee. Shareholders will be asked to approve the report at the AGM on 7 September 2011.
Remuneration policy (not subject to audit)
(I) Role of the Remuneration CommitteeThe Board has delegated to the Remuneration Committee responsibility for determining policy in relation to, and approval of, remuneration packages for senior management. This includes the terms and conditions of employment of each of the executive directors of the Company and for other senior management of the Group; and policy in relation to the operation of the Group’s share-based employee incentive schemes.
The membership of the Committee currently comprises the five independent non-executive directors and the Chairman of the Company. Their biographies and qualifications are set out on page 36. Dharmash Mistry joined the Committee upon his appointment to the Board on 27 September 2010. The Chairman has joined the Committee in accordance with the provision of the Combined Code permitting a company Chairman to be a member, but not Chairman, of the Remuneration Committee. The remaining members of the Committee served throughout the period under review. The Committee’s terms of reference are shown on the corporate responsibility section of the corporate website. The Committee met four times during the period, and the members’ attendance record is set out on page 41.
The Chief Executive, the Group Finance Director and the Group People, Marketing and Property Director attended meetings of the Committee by invitation in an advisory capacity. Meetings are also attended by the Company Secretary (who acts as secretary to the Committee) and by the Group Reward Director.
Nobody attends any part of a meeting at which their own remuneration is discussed. During the period under review the Committee obtained advice from Hewitt New Bridge Street (a subsidiary of Aon Hewitt Limited) (HNBS) for which they received fees of £60,000. HNBS provided no other services to the Company.
(II) Remuneration principlesIn setting its policies, the Committee has regard to several factors including the benefits arrangements which apply below senior management level and competitor benchmarking.
In implementing this policy, the Remuneration Committee takes account of information and surveys from internal and independent sources and the remuneration paid for comparable positions in other companies. It reviews data and surveys provided by remuneration consultants and market research companies with particular reference to the scale and composition of the total remuneration packages payable to people with like responsibilities, qualifications, skills and experience in businesses of similar size and structure.
In setting the remuneration of the directors and senior management, the Committee takes into account the economic environment and financial performance of the Group, along with pay and employment conditions of employees elsewhere in the Group.
Executive directorsThe objectives of the remuneration policy are to:
ensure that the remuneration structure motivates the directors and senior management to succeed and appropriately rewards them for their contribution to the attainment of the Group’s short and long term results;
maintain, particularly through reward schemes based on performance, a competitive package of pay and benefits which provides the motivation for future achievement;
facilitate the building and retention of a high calibre and focused team which will work effectively to achieve the Group’s longer term strategic objectives;
align the directors’ interests with those of shareholders by offering participation in schemes which provide opportunities to build shareholdings in the Company; and
facilitate effective succession planning.
The Committee is satisfied that the incentive structure for senior management does not raise governance risks by inadvertently motivating irresponsible or reckless behaviour.
In deciding the appropriate remuneration strategy for 2011/12 the Remuneration Committee has taken into account the Company’s performance over the last year which despite the continued delivery of the Renewal and Transformation plan has been affected by a marked deterioration in consumer confidence across a number of the Group’s markets, particularly in the UK & Ireland.
For 2011/12 the Committee has reviewed its long term remuneration arrangements in light of the fall in the Company’s share price. In doing so it has also taken into account heightened external interest in the senior management population and the need to ensure they are appropriately incentivised and ‘locked in’ to the Company to deliver the Renewal and Transformation plan.
As a result for 2011/12 the Committee has decided to simplify its previous approach of granting share options under the Executive Share Option Plan (ESOP) and awards under the Performance Share Plan (PSP). Therefore, for 2011/12 the Remuneration Committee proposes to deliver long-term incentive awards via the less dilutive PSP awards only.
It is proposed that 50% of the PSP awards to executive directors will be based on relative Total Shareholder Return (TSR) and the remaining 50% of the award on achieving earnings per share targets. This is to address concerns that the change in award mechanism de-emphasises earnings per share as, to date, the primary performance condition for PSP awards has been a relative total shareholder return condition.

Dixons Retail plc 47 Annual Report and Accounts 2010/11
Directors’ ReportCorporate Governance
In determining the quantum of awards for 2011, the Committee has also taken into account falls in the Company’s share price to ensure awards remain appropriate and proportionate.
These changes have been made to ensure that the remuneration structure motivates and rewards the directors for their contribution to the attainment of the Group’s long term results as well as ensuring that the long-term incentive provision is appropriate in terms of share dilution and cost. PSP awards were felt to better achieve this as they instil a greater sense of longer term ownership compared to share options. During 2011/12, the Committee will consider whether this approach should be adopted for future years.
(a) Base salariesAs a general policy, base salaries reflect the Committee’s assessment of the mid-market rate for relevant positions and levels of responsibility and the individual executive’s experience, performance and value to the business. The Committee also assesses pay and employment conditions of employees of the Group when determining the executive directors’ remuneration.
For the period under review, an increase to base salaries across the whole UK work force of 1.5% was applied. This policy was also applied to the executive directors. For 2011/12 the Committee has approved an overall increase to base salaries across the whole UK work force of 2% with individual increases varying between 0% and 4% based on individual performance. This policy will also be applied to both the executive directors.
Accordingly, the Chief Executive’s salary will be increased by 2.75% to £698,750 and the Group Finance Director’s salary by 2.75% to £417,200 for 2011/12.
(b) Performance-related remunerationThe performance based elements of remuneration are designed to drive performance and to strengthen the alignment between the interests of the Company’s shareholders and its senior management, whilst encouraging management retention. The components of performance-related remuneration are as follows:
(i) Annual cash bonusDuring 2010/11, performance based remuneration for the executive directors comprised an annual cash bonus plan based on the achievement of the Group’s targets and personal objectives.
For 2010/11 the maximum potential bonus for the Chief Executive was 100% of basic salary and for the Group Finance Director was 85% of basic salary. Payment was dependent on underlying Group operating profit (55% of bonus), Group Free Cash Flow (25% of bonus) and achievement of personal objectives (20% of bonus), which included an element related to non-financial objectives.
For 2010/11, no bonus was payable in respect of performance against the Group operating profit or Group Free Cash Flow targets. In respect of their performance against personal objectives, bonuses of £122,409 and £62,118 were awarded to the Chief Executive and the Group Finance Director, respectively.
For 2011/12 there will be no change in the existing bonus potential for the executive directors; 100% of salary for the Chief Executive and 85% of salary for the Group Finance Director. The bonus paid will be dependent on underlying Group operating profit (55% of bonus), Group Free Cash Flow (25% of bonus) and achievement of personal objectives (20% of bonus). When setting the objectives of the executive directors, the Committee has considered corporate performance on environmental and social governance matters; the Committee is satisfied that the remuneration structure put in place for the executive directors does not raise environmental and social governance risks by inadvertently motivating irresponsible behaviour.
Bonus targets for 2011/12 have been set at levels using benchmarks that reflect both internal business objectives and external expectations and the Committee is satisfied that the targets are sufficiently challenging relative to underlying Group operating profit performance in 2010/11.
(ii) Long Term Incentive Plan (LTIP) and Performance Share Plan (PSP)Starting in 2009/10, the Company awarded incentives under a new plan (the PSP), which replaced the Long Term Incentive Plan (LTIP). The rules of the PSP permit awards to be made over shares worth up to 100% of salary per annum (200% of salary in exceptional circumstances).
As explained earlier in this report, for 2011/12 it is intended that executive directors only receive PSP awards. These will have a face value of 100% of salary determined by reference to the share price averaged over the period 1 April 2011 to 30 June 2011. This compares to PSP awards in 2010/11 with a face value of 87% of salary and share option grants with a face value of 174% of salary.
In determining the level of award the Remuneration Committee was conscious that awarding the executive directors the same value of shares as in 2010/11 might result in a significant increase in the number of shares awarded. Accordingly, the Committee determined that the number of shares awarded should be based on awarding the same number of shares as in 2010/11, but with an appropriate reduction to recognise the award of full value shares compared to share options.
Corp
orate Governance
36 -- 55

48 Dixons Retail plcAnnual Report and Accounts 2010/11
Directors’ ReportCorporate Governance
It is proposed that for awards to be made to the executive directors in 2011/12, vesting of 50% of the awards will be subject to relative TSR performance and 50% of the awards will be subject to achieving specified levels of EPS for the year ending 3 May 2014.
For 2011/12 TSR performance will continue to be measured relative to the constituents of the FTSE 250 Index (comprising FTSE 101-350 companies), excluding investment trusts, at the start of the performance period. Full vesting will occur for upper quartile performance reducing on a straight-line basis to 25% of the award at median. No award will vest for below median performance. Additionally, prior to vesting the Remuneration Committee will satisfy itself that the TSR performance achieved reasonably reflects the underlying financial performance of the Group and reserves the right to vary awards accordingly.
The 2011/12 EPS targets will be set at the time of grant and will incorporate the same vesting schedule as for share option grants in prior years for equivalent levels of performance, which are shown on page 54 of this report.
Details of awards made in 2009/10 and 2010/11 to Nicholas Cadbury and John Browett are contained in section (IX) of this report.
(iii) Share option plansThe Remuneration Committee approves the basis on which options are granted to executive directors and other employees under the Company’s discretionary share option schemes and other performance plans. Options have normally been granted annually to the executive directors under the Group’s ESOP. The plan permits making an award with a market value on the date of grant of not more than twice the recipient’s basic salary. However, in exceptional circumstances (for instance to facilitate recruitment or to retain key executives) this limit can be exceeded. As in previous years, executive directors were granted share options during the year, details of which are shown in section (X) of this report. The Remuneration Committee does not intend to grant share options under the ESOP in 2011/12.
Executive directors and senior management are also entitled to participate in the Sharesave plan on the same conditions as other employees. The Company will be inviting UK employees to participate in a Sharesave plan in July 2011.
All share options, other than those under the Sharesave scheme, are exercisable between three and ten years from the date of grant and for those options subject to a performance target, only if the Committee determines that the performance conditions have been met. Such determination is made once EPS figures are known for the relevant financial year. Since 2004, targets are tested only once. All share options lapse on the earlier of ten years from the date of grant or, where performance conditions apply, on the date on which the Remuneration Committee determines that the performance conditions have not been met.
(iv) DilutionA combination of both newly issued shares and shares bought in the market are to be used to satisfy awards under the Group’s employee share incentive arrangements.
The Remuneration Committee is aware of, and supports, the ABI guidelines regarding dilution and regularly monitors compliance with these requirements. The Remuneration Committee included provisions in the scheme rules adopted at the 2008 AGM which limit the number of newly issued shares which can be granted to 10% of the issued share capital in 10 years under all employee share schemes and 5% for the executive directors and senior management under the discretionary share plans.
As at the date of this report, the Company’s usage of shares against the limits detailed above in respect of all employees in the all employee schemes was 6.64% of the issued capital and in respect of grants to executive directors and senior management under the discretionary plans was 1.82% of issued capital. Shares relating to a portion of the potential obligations are held in a trust (the Trust) and if required, it is the Committee’s intention to make purchases of shares, taking into account the number of awards vesting and those options to be satisfied either from the Trust or by new issue together with the likelihood of any performance targets being met and also potential lapsing of awards when employees leave the Group.
(c) Taxable benefitsEach of the executive directors receives a cash payment in lieu of a company car and is a member of the non-contributory Dixons medical expenses plan which provides benefits similar to those applicable in comparable companies.
Further information on employee costs and those relating to senior management is given in notes 6 and 32, respectively, to the Financial Statements.
(d) Pensions and related benefitsUntil 30 April 2010 Nicholas Cadbury accrued benefits under the defined benefit section of the Dixons Retirement & Employee Security Scheme (DRESS). This is a funded, HMRC registered contributory pension scheme which provides a pension at a normal retirement age of 65 accrued at a rate of 1/60th of pensionable salary per annum up to a maximum of 40 years. Part of this pension may be exchanged for cash at the date of retirement. Following a consultation with affected employees across the UK, the Group closed the defined benefit section of DRESS to future accrual for all active members effective 30 April 2010. As a result, since that date Nicholas Cadbury has accrued pension benefits within the defined contribution section of DRESS (pensionbuilder) with a Company contribution of 20% of salary. Membership of the defined benefit section of DRESS provides the option for the provision of dependants’ pensions and also an insured lump sum on death in service. The insured lump sum is four times basic salary, however, for a period of two years commencing on 1 May 2010 this was increased to six times in recognition of the fact that members’ individual defined benefit accounts under the defined contribution section of DRESS will be relatively small during this period. This two year provision applies equally to all members of the defined benefit section of DRESS who were transferred to the defined contribution section.
Notwithstanding the abolition of the statutory earnings cap for pension purposes on 6 April 2006, an equivalent cap, adjusted annually for inflation, was introduced for the purposes of
Remuneration Reportcontinued

Dixons Retail plc 49 Annual Report and Accounts 2010/11
Directors’ ReportCorporate Governance
DRESS. From 2 May 2010 the cap was £123,600 and from 1 May 2011 it will be £129,600. Nicholas Cadbury is also provided with a salary supplement at the annual rate of 30% of the difference between his basic salary and the scheme earnings cap as set by the Company from time to time.
John Browett has chosen not to become a member of any Dixons Retail pension plan. However, he receives a contribution of 32.1% of basic salary to fund his own retirement arrangements. John Browett is also entitled to receive life assurance cover equal to four times basic salary and personal accident cover at the level of £2,000,000.
New externally recruited executive directors will be offered membership of pensionbuilder and the Remuneration Committee may exercise its discretion regarding the level of award of any salary supplement or enhanced contributions.
(e) Service agreementsJohn Browett and Nicholas Cadbury have service agreements with Dixons Retail plc which may be terminated at any time by 12 months’ notice. Service agreements contain neither a liquidated damages nor a change of control clause. It is the Company’s policy to ensure that any payments made to a director in the event of the early termination of a service agreement reflect the circumstances giving rise to termination and, where considered appropriate, the obligation of the outgoing director to mitigate his loss. Accordingly, consideration is given to making compensation payments in instalments and is conditional on the leaver’s employment and earnings status.
The service agreements of the executive directors who served during the financial period were entered into on the following dates:
Date
John Browett 6 Jun 2007Nicholas Cadbury 13 Apr 2009
The service agreements of the directors are available for inspection at the registered office of the Company during normal business hours on each business day.
(f) External directorshipsExecutive directors are permitted to accept non-executive directorships in external companies and to retain the fees which they receive in such roles. Normally only one such appointment will be authorised for each director. John Browett is a non-executive director of easyJet plc and was paid a fee at the rate of £55,000 per annum.
(III) Wider senior executive remuneration policyAll senior executives participate in an annual cash bonus plan which rewards executives for the delivery of operating profit and Free Cash Flow targets and the achievement of personal objectives. The top 90 executives plus other eligible employees including Regional and Store Managers are also conditionally awarded shares. This helps to retain key executives and ensure that there is alignment with shareholders’ interests. The Company also offers all UK & Ireland employees (including executive directors and senior management) the opportunity to participate in the Sharesave plan. The Company will be inviting employees to participate in a Sharesave plan in July 2011.
(IV) Non-executive directorsNon-executive directors are normally appointed for three year terms, although appointments vary depending on length of service and succession planning considerations.
Their current terms expire as follows:Date
John Allan 1 Jul 2012Prof. Dr. Utho Creusen 1 Feb 2013Rita Clifton 1 Sep 2012Tim How 7 Sep 2012Andrew Lynch 24 May 2012Dharmash Mistry 26 Sep 2013
The remuneration of non-executive directors is determined by the Board upon the recommendation of the Chief Executive and the Group Finance Director.
John Allan’s fee is £254,000 per annum. The other non-executive directors receive a fee of £49,000 per annum or euro equivalent. The fee is reviewed annually and is due to be reviewed later in 2011.
The Chairmen of the Audit and Remuneration Committees receive an additional fee of £10,000 per annum. Andrew Lynch has been designated Senior Independent Director for which he receives a further fee of £5,000 per annum. Non-executive directors derive no other benefits from their office and are not eligible to participate in the Group’s pension scheme. It is Company policy not to grant share options to non-executive directors or to require part of their fees to be paid in the form of shares.
Letters of appointment of the non-executive directors are available on application to the Company Secretary.
(V) Directors’ share interests The Committee implemented a policy in the 2008/09 financial year of encouraging executive directors to build shareholdings in the Company. The policy is that executive directors are required to retain 50% of the net of tax out-turn from the vesting of future awards or share options under the Company’s share plans until a shareholding with a minimum value equivalent to their basic salary is achieved.
Unrestricted beneficial and family interests 30 April 2011 1 May 2010*
Executive directorsJohn Browett 737,519 214,285Nicholas Cadbury 40,625 40,625Non-executive directorsJohn Allan 271,428 271,428Rita Clifton 24,903 24,903Prof. Dr. Utho Creusen 97,071 –Tim How 80,000 80,000Andrew Lynch 181,428 81,428Dharmash Mistry – –* or date of appointment if later.
In addition to the share interests disclosed above, John Allan holds £479,000 6.125% 2012 Guaranteed Bonds (the 2012 Bonds) and £502,000 8.75% 2015 Guaranteed Notes (the 2015 Notes) issued by the Company. Andrew Lynch also holds £50,000 of the 2015 Notes. Full details of the 2012 Bonds and the 2015 Notes are shown in note 17 to the Financial Statements.
Corp
orate Governance
36 -- 55

50 Dixons Retail plcAnnual Report and Accounts 2010/11
29 April 2006
28 April 2007
3 May 2008
2 May2009
1 May 2010
30 April 2011
Dixons Retail plc FTSE 350
0
20
40
60
80
100
120
140
£
Directors’ ReportCorporate Governance
Remuneration Reportcontinued
There were no changes in the Directors’ restricted or unrestricted share interests between 30 April 2011 and the date of this report.
(VI) Total Shareholder Return (TSR) The graph set out on this page shows the Company’s performance measured by TSR on a holding of £100 in the Company’s shares over the five years since 30 April 2006 measured against the same amount invested in the FTSE 350 Index. The other points plotted are the values at intervening financial year ends.
This index has been selected as the Company has been a constituent of it throughout the five year period shown.
Remuneration review (audited)
(VII) Directors’ remuneration The following table shows an analysis of the emoluments of individual directors:
Basic salary and fees
£’000
Pension contributions
£’000
Cash bonus £’000
Taxable benefits
£’000
52 weeks ended
30 April 2011 Total £’000
Basic salary and fees
£’000
Pension contributions
£’000
Cash bonus £’000
Taxable benefits
£’000
52 weeks ended
1 May 2010 Total £’000
ExecutiveJohn Browett(1) 676 217(2) 122 15 1,030 670(1) 215(2) 670 15 1,570Nicholas Cadbury(1) 404 84(3) 62 14 564 400(1) 83(3) 340 16 839
1,080 301 184 29 1,594 1,070 298 1,010 31 2,409
Non-executiveCurrent directorsJohn Allan 253 – – – 253 184(4) – – – 184Rita Clifton 49 – – – 49 48 – – – 48Prof. Dr. Utho Creusen 49 – – – 49 12(5) – – – 12Tim How 59 – – – 59 31(6) – – – 31Andrew Lynch 64 – – – 64 63 – – – 63Dharmash Mistry(7) 29 – – – 29 – – – – –Former directorsSir John Collins(8) – – – – – 125 – – – 125Count Emmanuel d’André(9) – – – – – 16 – – – 16John Whybrow(10) – – – – – 53 – – – 53
503 – – – 503 532 – – – 532
1,583 301 184 29 2,097 1,602 298 1,010 31 2,941(1) John Browett and Nicholas Cadbury elected to take up the opportunity to sacrifice a portion of their salaries under the Reward Sacrifice Scheme. Amounts sacrificed were £116,000 (2009/10
£52,000) for John Browett and £nil (2009/10 £40,000) for Nicholas Cadbury making their basic salaries after the sacrificed amounts £560,000 and £404,000, respectively (2009/10 £618,000 and £360,000, respectively).
(2) John Browett’s pension contribution payable to him represented an amount calculated as a percentage of basic salary to fund his own retirement arrangements.(3) Nicholas Cadbury’s pension contributions represent 30% of the difference between his basic salary and the scheme earnings cap set by the Company.(4) Amounts shown relate to John Allan’s period in office as a director (23 June 2009 to 1 May 2010).(5) Amounts shown relate to Prof. Dr. Utho Creusen’s period in office as a director (1 February 2010 to 1 May 2010).(6) Amounts shown relate to Tim How’s period in office as a director (9 September 2009 to 1 May 2010).(7) Amounts shown relate to Dharmash Mistry’s period in office as a director (27 September 2010 to 30 April 2011).(8) Sir John Collins retired as a director with effect from 2 September 2009.(9) Count Emmanuel d’André retired as a director with effect from 2 September 2009.(10) John Whybrow retired as a director with effect from 31 March 2010.
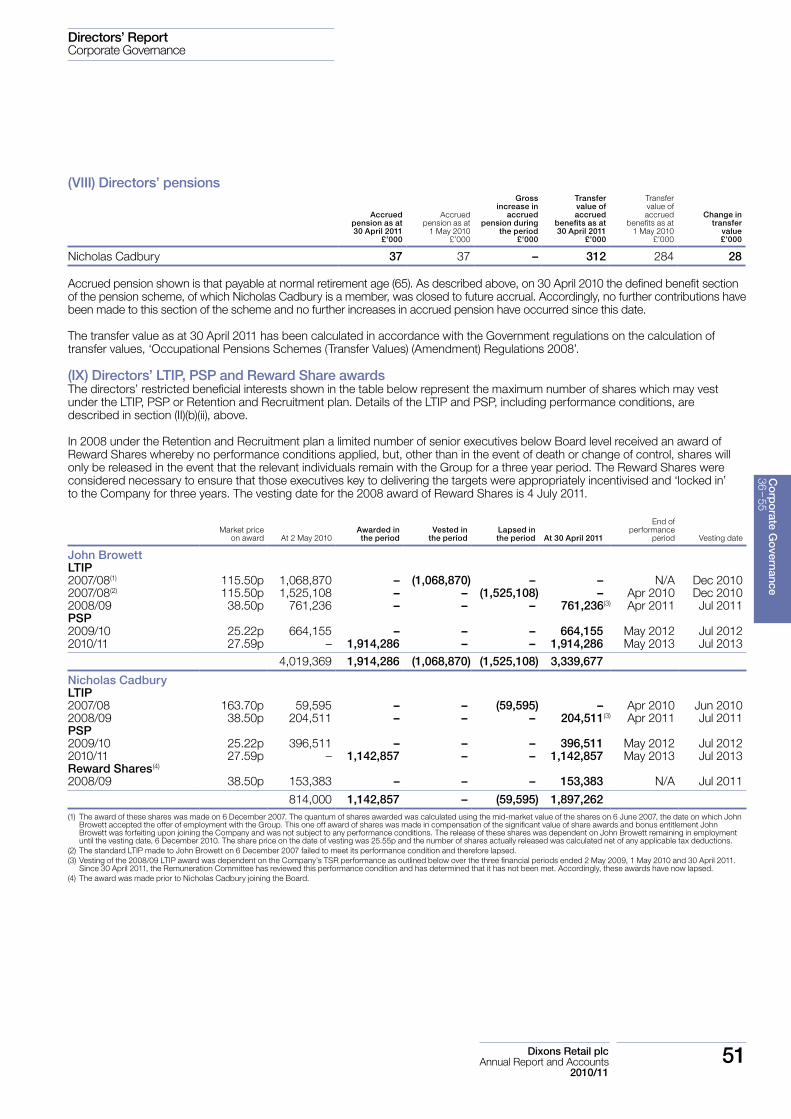
Dixons Retail plc 51 Annual Report and Accounts 2010/11
Directors’ ReportCorporate Governance
(VIII) Directors’ pensions
Accrued pension as at 30 April 2011
£’000
Accrued pension as at
1 May 2010 £’000
Gross increase in
accrued pension during
the period £’000
Transfer value of accrued
benefits as at 30 April 2011
£’000
Transfer value of accrued
benefits as at 1 May 2010
£’000
Change in transfer
value £’000
Nicholas Cadbury 37 37 – 312 284 28
Accrued pension shown is that payable at normal retirement age (65). As described above, on 30 April 2010 the defined benefit section of the pension scheme, of which Nicholas Cadbury is a member, was closed to future accrual. Accordingly, no further contributions have been made to this section of the scheme and no further increases in accrued pension have occurred since this date.
The transfer value as at 30 April 2011 has been calculated in accordance with the Government regulations on the calculation of transfer values, ‘Occupational Pensions Schemes (Transfer Values) (Amendment) Regulations 2008’.
(IX) Directors’ LTIP, PSP and Reward Share awards The directors’ restricted beneficial interests shown in the table below represent the maximum number of shares which may vest under the LTIP, PSP or Retention and Recruitment plan. Details of the LTIP and PSP, including performance conditions, are described in section (II)(b)(ii), above.
In 2008 under the Retention and Recruitment plan a limited number of senior executives below Board level received an award of Reward Shares whereby no performance conditions applied, but, other than in the event of death or change of control, shares will only be released in the event that the relevant individuals remain with the Group for a three year period. The Reward Shares were considered necessary to ensure that those executives key to delivering the targets were appropriately incentivised and ‘locked in’ to the Company for three years. The vesting date for the 2008 award of Reward Shares is 4 July 2011.
Market price on award At 2 May 2010
Awarded in the period
Vested in the period
Lapsed in the period At 30 April 2011
End of performance
period Vesting date
John BrowettLTIP2007/08(1) 115.50p 1,068,870 – (1,068,870) – – N/A Dec 20102007/08(2) 115.50p 1,525,108 – – (1,525,108) – Apr 2010 Dec 20102008/09 38.50p 761,236 – – – 761,236(3) Apr 2011 Jul 2011PSP2009/10 25.22p 664,155 – – – 664,155 May 2012 Jul 20122010/11 27.59p – 1,914,286 – – 1,914,286 May 2013 Jul 2013
4,019,369 1,914,286 (1,068,870) (1,525,108) 3,339,677
Nicholas Cadbury LTIP2007/08 163.70p 59,595 – – (59,595) – Apr 2010 Jun 20102008/09 38.50p 204,511 – – – 204,511(3) Apr 2011 Jul 2011PSP2009/10 25.22p 396,511 – – – 396,511 May 2012 Jul 20122010/11 27.59p – 1,142,857 – – 1,142,857 May 2013 Jul 2013Reward Shares(4)
2008/09 38.50p 153,383 – – – 153,383 N/A Jul 2011
814,000 1,142,857 – (59,595) 1,897,262(1) The award of these shares was made on 6 December 2007. The quantum of shares awarded was calculated using the mid-market value of the shares on 6 June 2007, the date on which John
Browett accepted the offer of employment with the Group. This one off award of shares was made in compensation of the significant value of share awards and bonus entitlement John Browett was forfeiting upon joining the Company and was not subject to any performance conditions. The release of these shares was dependent on John Browett remaining in employment until the vesting date, 6 December 2010. The share price on the date of vesting was 25.55p and the number of shares actually released was calculated net of any applicable tax deductions.
(2) The standard LTIP made to John Browett on 6 December 2007 failed to meet its performance condition and therefore lapsed.(3) Vesting of the 2008/09 LTIP award was dependent on the Company’s TSR performance as outlined below over the three financial periods ended 2 May 2009, 1 May 2010 and 30 April 2011.
Since 30 April 2011, the Remuneration Committee has reviewed this performance condition and has determined that it has not been met. Accordingly, these awards have now lapsed.(4) The award was made prior to Nicholas Cadbury joining the Board.
Corp
orate Governance
36 -- 55

52 Dixons Retail plcAnnual Report and Accounts 2010/11
Directors’ ReportCorporate Governance
For 2008/09 LTIP awards and 2009/10 PSP awards TSR performance is compared to that of a bespoke weighted index comprising UK and European retailers. This group comprised:
Brown (N) Group(1) HMV Group(1) Kesa Electricals Praktiker
Carphone Warehouse Group(1) Home Retail Group Kingfisher PPR
Debenhams Inchcape Marks and Spencer Group Sports Direct International
Game Group(1) Signet Group Metro Group Tesco
Halfords Jelmoli(2) Next WH Smith Group(1)
(1) 2009/10 award only.(2) 2008/09 award only.
All companies have equal weighting within the group other than Kesa Electricals and Metro Group, who have greater competitive relevance and therefore have double weighting. Under this condition full vesting occurs for performance equivalent to the upper quartile over the three year performance period, reducing to 25% of an award vesting for performance equivalent to median (with no vesting below this level). Vesting between these targets will occur on a straight-line basis.
PSP awards made in 2010/11 are subject to TSR performance relative to the constituents of the FTSE 250 Index (comprising FTSE 101-350 companies), excluding investment trusts, at the start of the performance period. Full vesting will occur for upper quartile performance reducing on a straight-line basis to 25% of the award at median. No award vests for below median performance. Additionally, awards made to the executive directors contain an EPS (defined on page 19) underpin requiring total EPS growth of RPI plus 2% per annum for the performance period.
The status of the provisional awards under the LTIP and PSP are reviewed regularly and as at the last review in May 2011, the status of the awards as at 30 April 2011 is as follows:
Period in which provisional award made Status Award if status maintained
2008/09 TSR below index – lapsed* No award2009/10 TSR below index No award2010/11 TSR below median No award
* lapsing occurred subsequent to the period end following review by the Remuneration Committee.
It is intended that any releases of shares under the LTIP will be satisfied by shares held in trust by Halifax EES Trustees International Limited, the trustee of the employee share ownership trust.
Remuneration Reportcontinued
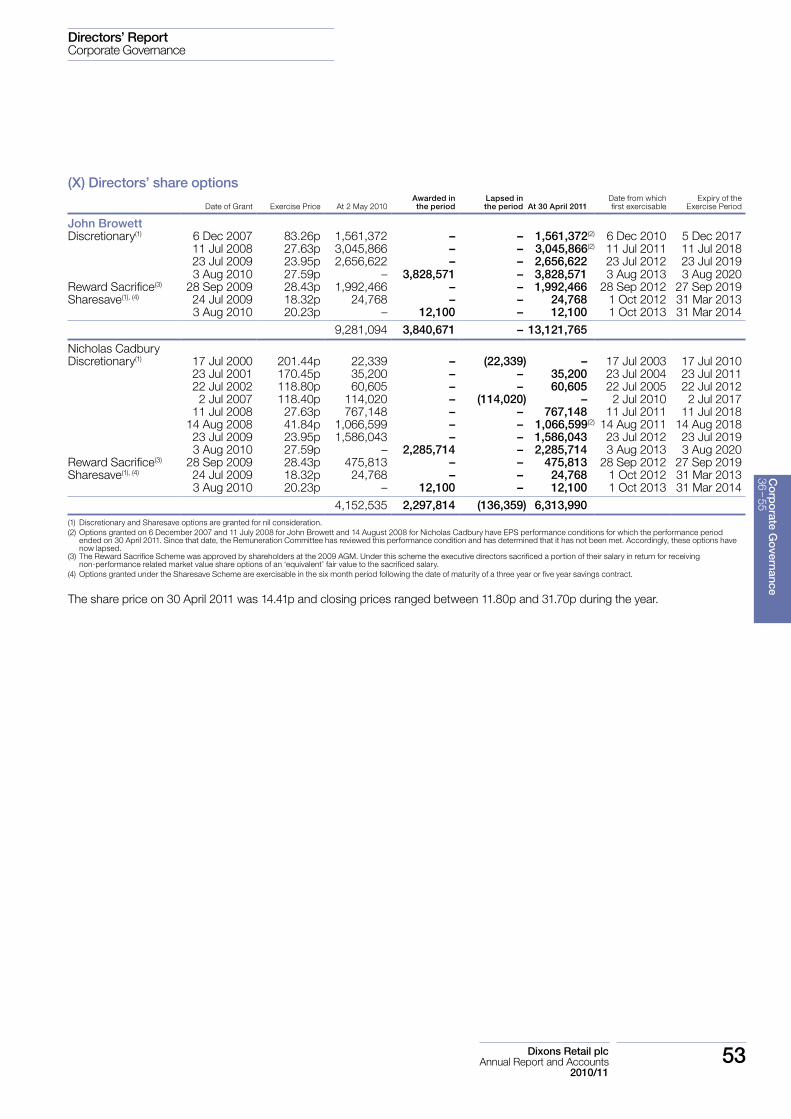
Dixons Retail plc 53 Annual Report and Accounts 2010/11
Directors’ ReportCorporate Governance
(X) Directors’ share options
Date of Grant Exercise Price At 2 May 2010Awarded in the period
Lapsed in the period At 30 April 2011
Date from which first exercisable
Expiry of the Exercise Period
John BrowettDiscretionary(1) 6 Dec 2007 83.26p 1,561,372 – – 1,561,372(2) 6 Dec 2010 5 Dec 2017
11 Jul 2008 27.63p 3,045,866 – – 3,045,866(2) 11 Jul 2011 11 Jul 201823 Jul 2009 23.95p 2,656,622 – – 2,656,622 23 Jul 2012 23 Jul 20193 Aug 2010 27.59p – 3,828,571 – 3,828,571 3 Aug 2013 3 Aug 2020
Reward Sacrifice(3) 28 Sep 2009 28.43p 1,992,466 – – 1,992,466 28 Sep 2012 27 Sep 2019Sharesave(1), (4) 24 Jul 2009 18.32p 24,768 – – 24,768 1 Oct 2012 31 Mar 2013
3 Aug 2010 20.23p – 12,100 – 12,100 1 Oct 2013 31 Mar 20149,281,094 3,840,671 – 13,121,765
Nicholas CadburyDiscretionary(1) 17 Jul 2000 201.44p 22,339 – (22,339) – 17 Jul 2003 17 Jul 2010
23 Jul 2001 170.45p 35,200 – – 35,200 23 Jul 2004 23 Jul 201122 Jul 2002 118.80p 60,605 – – 60,605 22 Jul 2005 22 Jul 20122 Jul 2007 118.40p 114,020 – (114,020) – 2 Jul 2010 2 Jul 2017
11 Jul 2008 27.63p 767,148 – – 767,148 11 Jul 2011 11 Jul 201814 Aug 2008 41.84p 1,066,599 – – 1,066,599(2) 14 Aug 2011 14 Aug 201823 Jul 2009 23.95p 1,586,043 – – 1,586,043 23 Jul 2012 23 Jul 20193 Aug 2010 27.59p – 2,285,714 – 2,285,714 3 Aug 2013 3 Aug 2020
Reward Sacrifice(3) 28 Sep 2009 28.43p 475,813 – – 475,813 28 Sep 2012 27 Sep 2019Sharesave(1), (4) 24 Jul 2009 18.32p 24,768 – – 24,768 1 Oct 2012 31 Mar 2013
3 Aug 2010 20.23p – 12,100 – 12,100 1 Oct 2013 31 Mar 20144,152,535 2,297,814 (136,359) 6,313,990
(1) Discretionary and Sharesave options are granted for nil consideration. (2) Options granted on 6 December 2007 and 11 July 2008 for John Browett and 14 August 2008 for Nicholas Cadbury have EPS performance conditions for which the performance period
ended on 30 April 2011. Since that date, the Remuneration Committee has reviewed this performance condition and has determined that it has not been met. Accordingly, these options have now lapsed.
(3) The Reward Sacrifice Scheme was approved by shareholders at the 2009 AGM. Under this scheme the executive directors sacrificed a portion of their salary in return for receiving non-performance related market value share options of an ‘equivalent’ fair value to the sacrificed salary.
(4) Options granted under the Sharesave Scheme are exercisable in the six month period following the date of maturity of a three year or five year savings contract.
The share price on 30 April 2011 was 14.41p and closing prices ranged between 11.80p and 31.70p during the year.
Corp
orate Governance
36 -- 55

54 Dixons Retail plcAnnual Report and Accounts 2010/11
Directors’ ReportCorporate Governance
Options are exercisable between three and ten years from the date of grant, subject to the performance conditions being met. The following table summarises the performance conditions applicable to the executive directors’ and senior management’s discretionary options (excluding Reward Sacrifice Options which do not have a performance condition) outstanding as at 30 April 2011.
Performance conditions Re-testing
Grants made before 1 Jul 2003 The market price on the date of exercise is at least 20% higher than the option price, assuming exercise takes place between three and four years after the date of grant. For later exercises, the rate of share growth is adjusted in line with the Retail Price Index (RPI). Exercise is also conditional upon EPS having increased by not less than 3% above the annual RPI over any consecutive period of three years during the life of the option.
During the life of the option
Grants made between 11 Oct 2004 and 11 Jul 2008
Over the three year performance period, EPS growth is equal to or greater than annual RPI plus 5% per annum. Where EPS growth is between annual RPI plus 3% and RPI plus 5%, options will vest on a straight-line basis between 50% and 100% of the award.
No re-testing
Grants made between 12 Jul 2008 and 23 Jul 2009
Over the three year performance period, EPS growth is equal to or greater than annual RPI plus 4% per annum. For an award of 200% of salary where EPS growth is between annual RPI plus 4% and RPI plus 7% per annum, options will vest on a straight-line basis between 50% and 100% of the award. For an award of 300% of salary where EPS growth is between annual RPI plus 4% and RPI plus 10% per annum, options will vest on a straight-line basis between 33% and 100% of the award.
No re-testing
Grants made between 23 Jul 2009 and 7 Dec 2009
25% of the options vest for an EPS in 2011/12 of 2p. 100% of the options vest for an EPS in 2011/12 of 4p, options will vest on a straight-line basis between 25% and 100% of the award.
No re-testing
Grants made between 3 Aug 2010 and 10 Dec 2010
25% of the options vest for an EPS in 2012/13 of 4p. 100% of the options vest for an EPS in 2012/13 of 6p, options will vest on a straight-line basis between 25% and 100% of the award.
No re-testing
Prior to 2005/06, share options were granted to other employees in the UK and overseas on the basis of management grade and to employees with more than three years’ service. Since 2005/06 and until 2007/08, employees below executive level have either participated in cash settled performance share plans or in a few selected cases have been granted share options, both of which were linked in most cases to the attainment of three year EPS targets. In 2008/09, share options were granted to other employees in the UK and overseas on the basis of management grade; these options were granted with no performance conditions for those employees below the top three management grades at the date of grant. In 2009/10 and 2010/11 share options were granted to other employees in the UK and overseas including all store managers on the basis of management grade; these options were granted with the same performance conditions as the executive directors.
(XI) Former executive directorPursuant to an agreement dated 1 October 2002, Lord Kalms, the former Chairman, was appointed President of the Company for an initial period ending on 16 September 2012. He received £31,564 for his services as President during the year. His remuneration is subject to annual review in line with RPI. He was provided with benefits amounting to £29,699 comprising membership of the Group’s medical expenses plan and a car in addition to office facilities. He is not eligible to participate in discretionary share schemes or in any bonus arrangements.
Approved by the Board and signed on its behalf by
Tim HowChairman of the Remuneration Committee 23 June 2011
Remuneration Reportcontinued
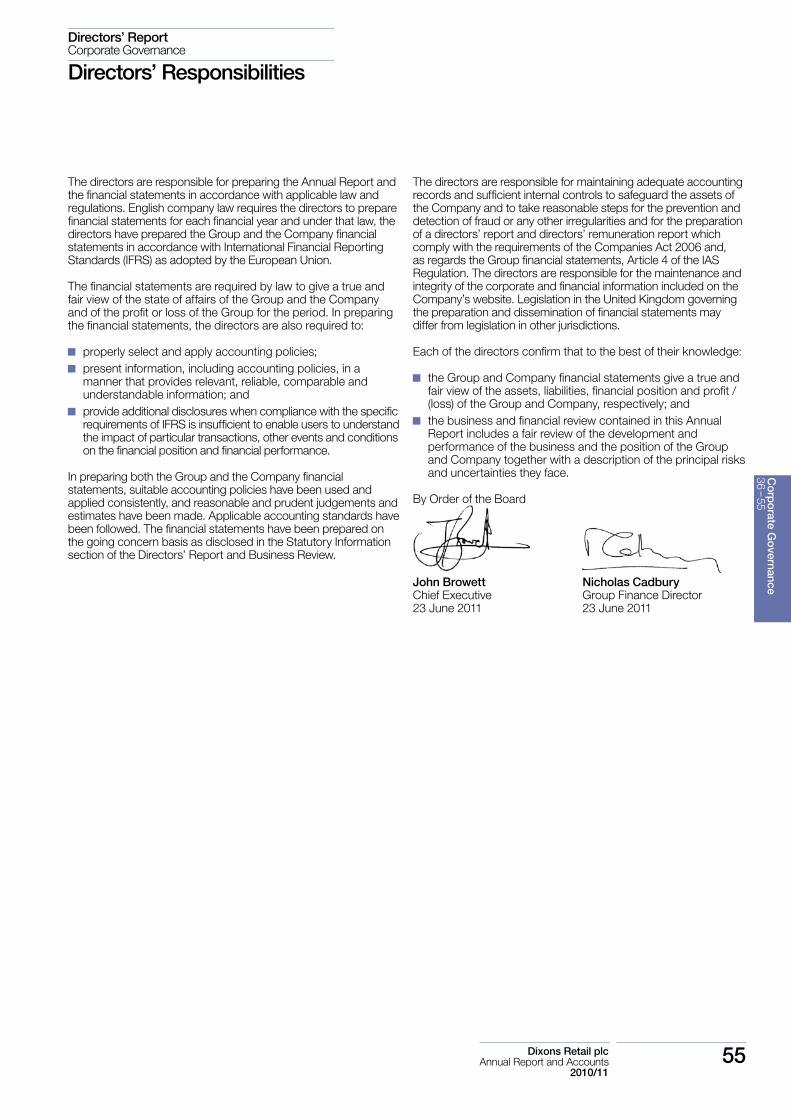
Dixons Retail plc 55 Annual Report and Accounts 2010/11
The directors are responsible for preparing the Annual Report and the financial statements in accordance with applicable law and regulations. English company law requires the directors to prepare financial statements for each financial year and under that law, the directors have prepared the Group and the Company financial statements in accordance with International Financial Reporting Standards (IFRS) as adopted by the European Union.
The financial statements are required by law to give a true and fair view of the state of affairs of the Group and the Company and of the profit or loss of the Group for the period. In preparing the financial statements, the directors are also required to:
properly select and apply accounting policies; present information, including accounting policies, in a
manner that provides relevant, reliable, comparable and understandable information; and
provide additional disclosures when compliance with the specific requirements of IFRS is insufficient to enable users to understand the impact of particular transactions, other events and conditions on the financial position and financial performance.
In preparing both the Group and the Company financial statements, suitable accounting policies have been used and applied consistently, and reasonable and prudent judgements and estimates have been made. Applicable accounting standards have been followed. The financial statements have been prepared on the going concern basis as disclosed in the Statutory Information section of the Directors’ Report and Business Review.
Directors’ Responsibilities
The directors are responsible for maintaining adequate accounting records and sufficient internal controls to safeguard the assets of the Company and to take reasonable steps for the prevention and detection of fraud or any other irregularities and for the preparation of a directors’ report and directors’ remuneration report which comply with the requirements of the Companies Act 2006 and, as regards the Group financial statements, Article 4 of the IAS Regulation. The directors are responsible for the maintenance and integrity of the corporate and financial information included on the Company’s website. Legislation in the United Kingdom governing the preparation and dissemination of financial statements may differ from legislation in other jurisdictions.
Each of the directors confirm that to the best of their knowledge:
the Group and Company financial statements give a true and fair view of the assets, liabilities, financial position and profit / (loss) of the Group and Company, respectively; and
the business and financial review contained in this Annual Report includes a fair review of the development and performance of the business and the position of the Group and Company together with a description of the principal risks and uncertainties they face.
By Order of the Board
John Browett Nicholas CadburyChief Executive Group Finance Director23 June 2011 23 June 2011
Directors’ ReportCorporate Governance
Corp
orate Governance
36 -- 55

56 Dixons Retail plcAnnual Report and Accounts 2010/11
Financial Statements
Independent Auditor’s Report
We have audited the consolidated and the company financial statements of Dixons Retail plc for the 52 weeks ended 30 April 2011 which comprise the consolidated income statement, the consolidated statement of comprehensive income and expense, the consolidated and company balance sheets, the consolidated and company cash flow statements, the consolidated and company statement of changes in equity and the related notes 1 to 33 and C1 to C16. The financial reporting framework that has been applied in their preparation is applicable law and International Financial Reporting Standards (IFRSs) as adopted by the European Union and as regards the Company financial statements as applied in accordance with the provisions of the Companies Act 2006.
This report is made solely to the Company’s members, as a body, in accordance with Chapter 3 of Part 16 of the Companies Act 2006. Our audit work has been undertaken so that we might state to the Company’s members those matters we are required to state to them in an auditor’s report and for no other purpose. To the fullest extent permitted by law, we do not accept or assume responsibility to anyone other than the Company and the Company’s members as a body, for our audit work, for this report, or for the opinions we have formed.
Respective responsibilities of directors and auditorsAs explained more fully in the Statement of Directors’ Responsibilities, the directors are responsible for the preparation of the financial statements and for being satisfied that they give a true and fair view. Our responsibility is to audit and express an opinion on the financial statements in accordance with applicable law and International Standards on Auditing (UK and Ireland). Those standards require us to comply with the Auditing Practices Board’s Ethical Standards for Auditors.
Scope of the audit of the financial statementsAn audit involves obtaining evidence about the amounts and disclosures in the financial statements sufficient to give reasonable assurance that the financial statements are free from material misstatement, whether caused by fraud or error. This includes an assessment of: whether the accounting policies are appropriate to the Group’s and the Company’s circumstances and have been consistently applied and adequately disclosed; the reasonableness of significant accounting estimates made by the directors; and the overall presentation of the financial statements. In addition, we read all the financial and non-financial information in the Annual Report and Accounts to identify material inconsistencies with the audited financial statements. If we become aware of any apparent material inconsistencies, we consider the implications for our report.
OpinionsFinancial statements In our opinion the financial statements:
give a true and fair view of the state of the Group’s and of the Company’s affairs as at 30 April 2011 and of the Group’s loss for the 52 weeks then ended;
have been properly prepared in accordance with IFRSs as adopted by the European Union; and
have been prepared in accordance with the requirements of the Companies Act 2006 and as regards the Group financial statements, Article 4 of the IAS Regulation.
IFRSs issued by the IASBAs explained in note 1.1 to the Group financial statements, the Group and Company in addition to complying with its legal obligation to apply IFRSs as adopted by the European Union, has also applied IFRSs as issued by the International Accounting Standards Board (IASB). In our opinion the financial statements comply with IFRSs as issued by the IASB.
Other matters prescribed by the Companies Act 2006In our opinion:
the information given in the Directors’ Report for the financial year for which the financial statements are prepared is consistent with the financial statements; and
the part of the Remuneration Report to be audited has been properly prepared in accordance with the Companies Act 2006.
Matters on which we are required to report by exceptionWe have nothing to report upon in respect of the following:
Under the Companies Act 2006 we are required to report to you if, in our opinion:
adequate accounting records have not been kept by the Company, or returns adequate for our audit have not been received from branches visited by us; or
the Company financial statements and the part of the Directors’ Remuneration Report to be audited are not in agreement with the accounting records and returns; or
certain disclosures of directors’ remuneration specified by law are not made; and
we have not received all the information and explanations we require for our audit.
Under the Listing Rules we are required to review: the directors’ statement contained within the Directors’ Report
and Business Review in relation to going concern; the part of the Corporate Governance Statement relating to
the company’s compliance with the nine provisions of the June 2008 Combined Code specified for our review; and
certain elements of the report to shareholders by the Board on directors’ remuneration.
Nicola Mitchell FCA (Senior Statutory Auditor)for and on behalf of Deloitte LLPChartered Accountants and Statutory Auditor London, United Kingdom23 June 2011

Dixons Retail plc 57 Annual Report and Accounts 2010/11
Financial Statements
Consolidated Income Statement
52 weeks ended 30 April 2011 52 weeks ended 1 May 2010
Non-underlying * Non-underlying *
Note Underlying* £million
Business to be closed** £million
Other £million
Total £million
Underlying* £million
Business to be closed / closed businesses** £million
Other £million
Total £million
Continuing operationsRevenue 2,3 8,154.4 187.4 – 8,341.8 8,320.0 212.5 – 8,532.5
Profit / (loss) from operations before associates 128.0 (7.7) (298.1) (177.8) 131.6 (0.2) 23.2 154.6
Share of post-tax results of associates 12 (0.4) – – (0.4) 1.6 – – 1.6
Operating profit / (loss) 2,3 127.6 (7.7) (298.1) (178.2) 133.2 (0.2) 23.2 156.2
Finance income 58.9 – 12.5 71.4 58.2 – 1.1 59.3Finance costs (101.2) (0.8) (15.3) (117.3) (100.5) (0.4) (1.9) (102.8)
Net finance costs 5 (42.3) (0.8) (2.8) (45.9) (42.3) (0.4) (0.8) (43.5)
Profit / (loss) before tax 85.3 (8.5) (300.9) (224.1) 90.9 (0.6) 22.4 112.7
Income tax (expense) / credit 7 (31.4) – 12.3 (19.1) (40.7) 0.1 (6.1) (46.7)
Profit / (loss) after tax – continuing operations 53.9 (8.5) (288.6) (243.2) 50.2 (0.5) 16.3 66.0
Loss after tax – discontinued operations 28 – – (2.1) (2.1) – – (8.7) (8.7)
Profit / (loss) for the period 53.9 (8.5) (290.7) (245.3) 50.2 (0.5) 7.6 57.3
Attributable to:
Equity shareholders of the parent company 58.8 (8.5) (289.3) (239.0) 52.7 (0.5) 7.6 59.8
Non-controlling interests (4.9) – (1.4) (6.3) (2.5) – – (2.5)
53.9 (8.5) (290.7) (245.3) 50.2 (0.5) 7.6 57.3
(Loss) / earnings per share (pence) 8
Basic – total (6.6)p 1.7pDiluted – total (6.6)p 1.7pBasic – continuing operations (6.6)p 2.0pDiluted – continuing operations (6.6)p 1.9p
Underlying earnings per share (pence) 1,8
Basic – continuing operations 1.6p 1.5pDiluted – continuing operations 1.6p 1.5p
* Underlying profit and earnings per share measures exclude the trading results of business to be closed / closed businesses, amortisation of acquired intangibles, net restructuring and business impairment charges and other one off, non-recurring items, profit on sale of investments, fair value remeasurements of financial instruments and, where applicable, discontinued operations. Such excluded items are described as ‘Non-underlying’. Further information on these items is shown in notes 1, 4, 5, 7 and 28.
** Business to be closed / closed businesses comprise PC City Spain for which plans for its closure were announced on 14 April 2011 and Markantalo and PC City Sweden whereby these store based businesses were closed on 10 May 2009 and 20 May 2009, respectively. These operations do not meet the definition of discontinued operations as stipulated by IFRS 5 and accordingly the disclosures within non-underlying items differ from those for applicable discontinued operations.
Financial Statem
ents56 -- 119

58 Dixons Retail plcAnnual Report and Accounts 2010/11
Financial Statements
Note
52 weeks ended
30 April 2011 £million
52 weeks ended
1 May 2010 £million
(Loss) / profit for the period (245.3) 57.3
Actuarial gains/(losses) on defined benefit pension schemes – UK 21 13.1 (156.0) – Nordics (0.3) 1.5Cash flow hedges 22
Fair value remeasurement losses (8.0) (18.4) Losses transferred to carrying amount of inventories 7.4 15.1 Losses / (gains) transferred to income statement (within cost of sales) 6.7 (3.8)Net investment hedges 22
Fair value remeasurement (losses) / gains (4.9) 2.7Investments Fair value remeasurement gains 0.2 0.8Tax on items taken directly to equity (8.5) 44.2Currency translation movements 31.7 45.3
Net income / (expense) recognised directly in equity 37.4 (68.6)
Total comprehensive expense for the period (207.9) (11.3)
Attributable to:Equity shareholders of the parent company (201.2) (8.9)Non-controlling interests (6.7) (2.4)
(207.9) (11.3)
Consolidated Statement of Comprehensive Income and Expense

Dixons Retail plc 59 Annual Report and Accounts 2010/11
Financial Statements
Consolidated Balance Sheet
Note30 April 2011
£million1 May 2010
£million
Non-current assetsGoodwill 9 970.8 1,116.5Intangible assets 10 113.1 130.7Property, plant & equipment 11 583.7 541.0Investments in associates 12 3.4 26.4Trade and other receivables 14 49.6 58.0Deferred tax assets 7 163.4 169.4
1,884.0 2,042.0
Current assetsInventories 13 960.9 972.6Trade and other receivables 14 383.2 395.1Income tax receivable 4.1 1.9Short term investments 15 10.5 8.5Cash and cash equivalents 16 334.7 295.7
1,693.4 1,673.8
Total assets 3,577.4 3,715.8
Current liabilitiesBank overdrafts 17 (5.6) (4.9)Borrowings 17 (130.0) (98.5)Obligations under finance leases 18 (3.1) (2.4)Trade and other payables 19 (1,644.2) (1,605.9)Income tax payable (48.5) (47.0)Provisions 20 (44.4) (22.3)
(1,875.8) (1,781.0)
Net current liabilities (182.4) (107.2)
Non-current liabilitiesBorrowings 17 (315.3) (321.4)Obligations under finance leases 18 (98.0) (97.6)Retirement benefit obligations 21 (247.3) (266.8)Other payables 19 (331.0) (325.7)Deferred tax liabilities 7 (17.6) (18.7)Provisions 20 (15.9) (29.5)
(1,025.1) (1,059.7)
Total liabilities (2,900.9) (2,840.7)
Net assets 676.5 875.1
Capital and reservesCalled up share capital 23 90.3 90.2Share premium account 169.5 169.4Other reserves 23 (537.7) (537.5)Retained earnings 931.4 1,124.4
Equity attributable to equity holders of the parent company 653.5 846.5Equity non-controlling interests 23.0 28.6
Total equity 676.5 875.1
The financial statements were approved by the directors on 23 June 2011 and signed on their behalf by:
John Browett Nicholas CadburyChief Executive Group Finance Director
Financial Statem
ents56 -- 119

60 Dixons Retail plcAnnual Report and Accounts 2010/11
Financial Statements
Consolidated Cash Flow Statement
Note
52 weeks ended
30 April 2011 £million
52 weeks ended
1 May 2010 £million
Operating activities – continuing operationsCash generated from operations * 26 292.8 270.3Special contributions to defined benefit pension scheme 21 (12.0) (12.0)Income tax paid * (26.2) (31.9)
Net cash flows from operating activities 254.6 226.4
Investing activities – continuing operationsPurchase of property, plant & equipment and other intangibles * (223.2) (165.3)Purchase of subsidiaries 27 – (7.0)Interest received * 17.9 25.5(Increase) / decrease in short term investments (1.8) 1.3Disposals of property, plant & equipment and other intangibles * 2.0 9.7Dividend received from associate 1.1 4.0
Net cash flows from investing activities (204.0) (131.8)
Financing activities – continuing operationsIssue of ordinary share capital 0.2 291.3Additions to finance leases 2.4 –Capital element of finance lease payments (1.5) (1.7)Interest element of finance lease payments * (7.0) (7.1)Increase / (decrease) in borrowings due within one year 31.8 (151.6)Increase in borrowings due after more than one year 5.4 –Interest paid * (46.3) (118.8)Investment from minority shareholder 1.1 5.0
Net cash flows from financing activities (13.9) 17.1
Increase / (decrease) in cash and cash equivalents (i)
Continuing operations 36.7 111.7Discontinued operations 28 (0.1) (8.6)
36.6 103.1
Cash and cash equivalents at beginning of period (i) 26 290.8 187.8Currency translation differences 1.7 (0.1)
Cash and cash equivalents at end of period (i) 26 329.1 290.8
Free Cash Flow (ii) 10.0 (17.6)
(i) For the purposes of this cash flow statement, cash and cash equivalents comprise those items disclosed as ‘cash and cash equivalents’ on the face of the balance sheet, less overdrafts, which are classified within current liabilities on the face of the balance sheet. A reconciliation to the balance sheet amounts is shown in note 26.
(ii) Free Cash Flow comprises those items marked * and comprises cash generated from / (utilised by) continuing operations before special pension contributions, less net finance expense, less income tax paid and net capital expenditure. The directors consider that ‘Free Cash Flow’ provides additional useful information to shareholders in respect of cash generation and is consistent with how business performance is measured internally.
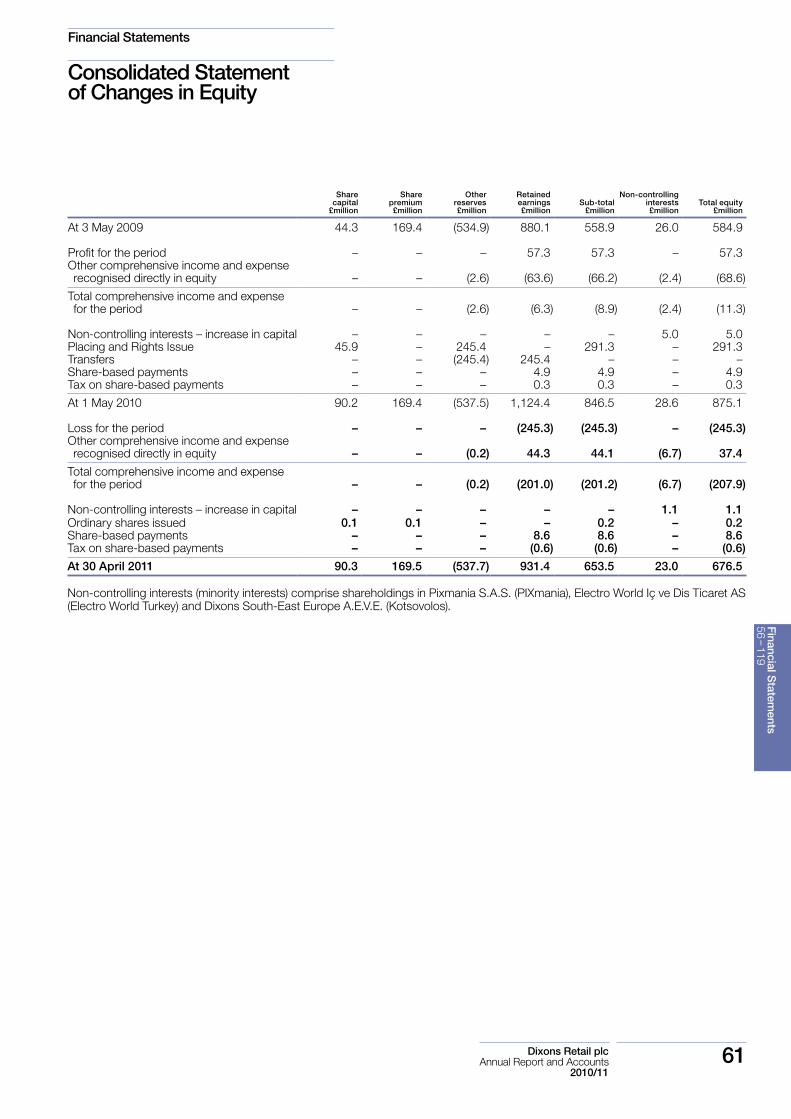
Dixons Retail plc 61 Annual Report and Accounts 2010/11
Financial Statements
Consolidated Statement of Changes in Equity
Share capital
£million
Share premium £million
Other reserves
£million
Retained earnings £million
Sub-total £million
Non-controlling interests £million
Total equity £million
At 3 May 2009 44.3 169.4 (534.9) 880.1 558.9 26.0 584.9
Profit for the period – – – 57.3 57.3 – 57.3Other comprehensive income and expense recognised directly in equity – – (2.6) (63.6) (66.2) (2.4) (68.6)
Total comprehensive income and expense for the period – – (2.6) (6.3) (8.9) (2.4) (11.3)
Non-controlling interests – increase in capital – – – – – 5.0 5.0Placing and Rights Issue 45.9 – 245.4 – 291.3 – 291.3Transfers – – (245.4) 245.4 – – –Share-based payments – – – 4.9 4.9 – 4.9Tax on share-based payments – – – 0.3 0.3 – 0.3
At 1 May 2010 90.2 169.4 (537.5) 1,124.4 846.5 28.6 875.1
Loss for the period – – – (245.3) (245.3) – (245.3)Other comprehensive income and expense recognised directly in equity – – (0.2) 44.3 44.1 (6.7) 37.4
Total comprehensive income and expense for the period – – (0.2) (201.0) (201.2) (6.7) (207.9)
Non-controlling interests – increase in capital – – – – – 1.1 1.1Ordinary shares issued 0.1 0.1 – – 0.2 – 0.2Share-based payments – – – 8.6 8.6 – 8.6Tax on share-based payments – – – (0.6) (0.6) – (0.6)
At 30 April 2011 90.3 169.5 (537.7) 931.4 653.5 23.0 676.5
Non-controlling interests (minority interests) comprise shareholdings in Pixmania S.A.S. (PIXmania), Electro World Iç ve Dis Ticaret AS (Electro World Turkey) and Dixons South-East Europe A.E.V.E. (Kotsovolos).
Financial Statem
ents56 -- 119

62 Dixons Retail plcAnnual Report and Accounts 2010/11
Financial Statements
Notes to the Consolidated Financial Statements
1 Accounting policies1.1 Basis of preparationThe consolidated financial statements have been prepared in accordance with International Financial Reporting Standards (IFRS) as adopted by the EU, IFRS issued by the International Accounting Standards Board and those parts of the Companies Act 2006 applicable to those companies reporting under IFRS, and have been prepared on a going concern basis as disclosed in the going concern statement in the Statutory Information section of the Directors’ Report on page 39.
The Group’s income statement and segmental analysis identify separately underlying performance measures and non-underlying items. Underlying performance measures reflect an adjustment to total performance measures to exclude the impact of business to be closed / closed businesses and other non-underlying items. Underlying performance measures comprise profits and losses incurred as part of the day-to-day ongoing retail activities of the Company and include profits and losses incurred on the disposal and closure of owned or leased properties that occur as part of the Group’s annual retail churn. The profits or losses incurred on disposal or closure of owned or leased properties as part of a one off restructuring programme are excluded from underlying performance measures and are therefore included, among other items, within non-underlying items as described below. The directors consider ‘underlying’ performance measures to be a more accurate reflection of the ongoing trading performance of the Group and believe that these measures provide additional useful information for shareholders on the Group’s performance and are consistent with how business performance is measured internally.
Non-underlying items comprise trading results of business to be closed / closed businesses, amortisation of acquired intangibles, net restructuring and business impairment charges and other one off, non-recurring items, profit on sale of investments, fair value remeasurements of financial instruments and, where applicable, discontinued operations. Business to be closed / closed businesses are those which do not meet the definition of discontinued operations as stipulated by IFRS 5. Items excluded from underlying results can evolve from one financial year to the next depending on the nature of re-organisation or one-off type activities described above.
Underlying performance measures may not be directly comparable with other similarly titled measures or ‘adjusted’ revenue or profit measures used by other companies.
The following new accounting pronouncements became applicable during the period:
IFRS 3 Revised – Business Combinations IAS 27 – Revised Consolidated and Separate
Financial Statements
Neither has had an impact on either the net results or net assets of the Group for the current or preceding periods, however, may impact acquisitions in the future. Other new standards, amendments to standards and IFRIC interpretations are effective for the Group during the current financial period but are either not relevant or have had no impact on the Group’s results or net assets.
The principal accounting policies are set out below:
1.2 Accounting convention and basis of consolidationThe consolidated financial statements incorporate the financial statements of the Company and entities controlled by the Company. Control is achieved where the Company has the power to control the financial and operating policies of an entity so as to obtain benefits from its activities. The results of subsidiaries acquired are included from the date on which power to control passes. The net assets of subsidiaries acquired are recorded at their fair values. The results of subsidiaries disposed of are included up to the effective date of disposal.
Associates are accounted for using the equity method of accounting from the date on which the power to exercise significant influence passes.
All intra-group transactions, balances, income and expenses are eliminated on consolidation.
1.3 Revenue Revenue comprises sales of goods and services excluding sales taxes. Revenue from sales of goods is recognised at the point of sale or, where later, upon delivery to the customer and is stated net of returns. Revenue earned from customer support agreements is recognised as such over the life of the agreement by reference to the stage of completion of the transaction at the balance sheet date.
1.4 Other income, including non-operating income Other income, which is incidental to the Group’s principal activities of selling goods and services and accordingly is not recorded as part of revenue, is recognised when the Group obtains the right to consideration by performance of its contractual obligations. Interest income is accrued on a time basis, by reference to the principal outstanding and at the effective interest rate applicable. Dividend income from investments is recognised when the right to receive payment has been established.
Dixons Retail plc 63 Annual Report and Accounts 2010/11
Financial Statements
1.5 Discontinued operations A discontinued operation is a component of the Group which represents a significant separate line of business which has been sold. Classification as a discontinued operation occurs upon disposal or earlier if beneficial title and risk has transferred to the purchaser and in the case of a business acquired exclusively with a view to subsequent disposal, on the date of acquisition.
Where the sale of a component of the Group is considered highly probable and the business is available for immediate sale in its present condition, it is classified as held for sale. Assets and liabilities held for sale are measured at the lower of carrying amount and fair value less costs to sell.
1.6 LeasesLeases are classified as finance leases whenever the terms of the lease transfer substantially all the risks and rewards of ownership to the lessee. The determination of the classification of property leases is made by reference to the land and buildings elements separately. All leases not classified as finance leases are operating leases.
Finance leasesAssets held under finance leases are capitalised at their fair value on acquisition or, if lower, at the present value of the minimum lease payments, each determined at the inception of the lease and depreciated over their estimated useful lives or the lease term if shorter. The corresponding obligation to the lessor is included in the balance sheet as a liability. Lease payments are apportioned between finance charges and reduction of the lease obligation. Finance charges are charged to the income statement over the period of the lease in proportion to the capital element outstanding.
Operating leasesRentals payable under operating property leases are charged to the income statement on a straight-line basis over the fixed term of the lease. At the end of the fixed term of leases, rental payments are reset to market rates, typically on an upwards only basis.
Benefits received and receivable as an incentive to enter into an operating lease are also spread on a straight-line basis over the lease term.
Where a lease forms part of a separate cash generating unit (CGU), such as a store or group of stores, and business indicators exist which could lead to the conclusion that the carrying value of the CGU is not supportable, the recoverable amount of the CGU is determined by calculating its value in use. The value in use is calculated by applying discounted cash flow modelling to management’s projection of future profitability. If an impairment of a CGU has been identified such that the value in use is negative and a lease exists in that CGU, a provision for the onerous portion of the lease is made equal to the lower of the outstanding lease commitment and the negative present value of the CGU.
1.7 Translation of foreign currenciesTransactions in foreign currencies are initially recorded at the rate of exchange prevailing at the transaction date. Monetary assets and liabilities denominated in foreign currencies are retranslated at the rates of exchange ruling at the balance sheet date. Exchange gains and losses arising on settlement or retranslation of monetary assets and liabilities are included in the income statement.
Assets and liabilities of overseas subsidiaries are translated at the rate of exchange ruling at the balance sheet date. The results of overseas subsidiary undertakings are translated into sterling at the average rates of exchange during the period. Exchange differences resulting from the translation of the results and balance sheets of overseas subsidiary undertakings are charged or credited directly to retained earnings. Such translation differences become recognised in the income statement in the period in which the subsidiary undertaking is disposed.
As the cumulative translation differences for all foreign subsidiaries were deemed to be zero at the transition date to IFRS on 2 May 2004, upon disposal of a foreign subsidiary, any gain or loss arising will include only those foreign exchange gains or losses attributable to periods after that date.
1.8 GoodwillOn acquisition of a subsidiary or associate, the fair value of the consideration is allocated between the identifiable net tangible and intangible assets / liabilities on a fair value basis, with any excess consideration representing goodwill. Goodwill in respect of subsidiaries is capitalised as goodwill on the balance sheet; goodwill relating to associates is capitalised in investments in associates as part of the carrying value of the associate.
Goodwill is not amortised, but instead is reviewed annually for impairment. Any impairment is recognised immediately in the income statement and is not subsequently reversed.
On disposal of a subsidiary or associate the attributable amount of goodwill is included in the determination of the gain or loss on disposal.
1.9 Intangible assets Acquired intangiblesAcquired intangibles comprise brands and customer lists purchased as part of acquisitions of businesses and are capitalised and amortised over their useful economic lives on a straight-line basis. Acquired intangibles are stated at cost less accumulated amortisation and, where appropriate, provision for impairment in value or estimated loss on disposal. Amortisation is provided to write off the cost of assets on a straight-line basis between three and 30 years.
Financial Statem
ents56 -- 119

64 Dixons Retail plcAnnual Report and Accounts 2010/11
Financial Statements
Notes to the Consolidated Financial Statements continued
1 Accounting policies continued Other intangible assets: computer softwareComputer software is capitalised on the basis of the costs incurred both to acquire and bring into use the specific software. Amortisation is provided to write off the cost of assets on a straight-line basis over their estimated useful lives of between three and seven years. Costs associated with developing or maintaining computer software are recognised as an expense as incurred unless they increase the future economic benefits of the asset, in which case they are capitalised.
Internally generated computer software is capitalised at cost if the project is technically and commercially feasible and the economic benefits which are expected to be generated exceed one year. The expenditure capitalised includes the cost of materials, direct labour and an appropriate proportion of overheads. Subsequent expenditure is capitalised only when it increases the future economic benefits embodied in the specific asset to which it relates. Amortisation is provided to write off the cost of assets on a straight-line basis between three and seven years.
Computer software is stated at cost less accumulated amortisation and, where appropriate, provision for impairment in value or estimated loss on disposal.
1.10 Property, plant & equipmentProperty, plant & equipment are stated at cost less accumulated depreciation and, where appropriate, provision for impairment in value or estimated loss on disposal. Depreciation is provided to write off the cost of the assets by equal instalments over their estimated useful lives. The rates used are:
Short leasehold property – over the term of the leaseFreehold and long leasehold buildings – between 12/3% and 2½% per annumFixtures, fittings and equipment – between 10% and 331/3% per annum
No depreciation is provided on freehold and long leasehold land or on assets in the course of construction.
Property, plant & equipment are assessed on an ongoing basis to determine whether circumstances exist that could lead to the conclusion that the net book value is not supportable. Where assets are to be taken out of use, an impairment charge is levied. Where assets useful lives are shortened, an estimate is made of their new lives and an accelerated depreciation charge is levied. Where the property, plant & equipment form part of a separate cash generating unit (CGU), such as a store or group of stores, and business indicators exist which could lead to the conclusions that the net book value is not supportable, the recoverable amount of the CGU is determined by calculating its value in use. The value in use is calculated by applying discounted cash flow modelling to management’s projection of future profitability and any impairment is determined by comparing the net book value with the value in use.
1.11 Investments and other financial assetsThe Group’s financial assets comprise cash and cash equivalents, short term investments and those receivables which involve a contractual right to receive cash from external parties. Financial assets comprise all items shown in notes 14, 15 and 16 with the exception of prepayments and derivatives. Under the classifications stipulated by IAS 39, short term investments and trade and other receivables (excluding derivative financial assets) are classified as ‘available for sale’ and ‘loans and receivables’, respectively. Cash and cash equivalents and derivative financial instruments, which are further described in notes 1.14 and 1.16, are classified as ‘loans and receivables’ and ‘held for trading unless designated in a hedge relationship’, respectively.
All purchases and sales of investments and other financial assets are recognised on the date that the Group becomes committed to make such purchase or sale (‘the trade date’).
Investment in associatesAssociates are accounted for using the equity method of accounting from the date on which the power to exercise significant influence passes and are stated net of any impairment charges.
Short term investmentsInvestments are initially measured at fair value and then subsequently remeasured to fair value at each balance sheet date owing to occasional sales of such investments. The fair value of unlisted investments is estimated either by comparing recent arm’s length transactions or by using discounted cash flow analysis or other modelling techniques. Gains and losses arising from revaluation at the balance sheet date are recognised directly in equity. For unlisted investments a significant or prolonged decline in the fair value of the investment below its cost is considered evidence of impairment.
To the extent that any fair value losses are deemed permanent, such impairment is recognised in the income statement. Upon sale or impairment of the investments, any cumulative gains or losses held in equity are transferred to the income statement.
Trade and other receivablesTrade and other receivables (excluding derivative financial assets) are recorded at cost less an allowance for estimated irrecoverable amounts and any other adjustments required to align cost to fair value. The carrying amount of trade receivables is reduced through the use of a provision account. A provision for bad and doubtful debts is made for specific receivables when there is objective evidence that the Group will not be able to collect all of the amounts due under the original terms of the invoice. Receivables that are not assessed individually for impairment are assessed for impairment on a collective basis using ageing analysis to determine the required provision. Bad debts are written off when identified.

Dixons Retail plc 65 Annual Report and Accounts 2010/11
Financial Statements
1.12 Taxation Current taxationCurrent taxation is the expected tax payable on the taxable income for the period, using prevailing tax rates and adjusted for any tax payable in respect of previous periods.
Deferred taxationDeferred tax liabilities are recognised for all taxable temporary differences and deferred tax assets are recognised to the extent that it is probable that taxable profits will be available against which deductible temporary differences can be utilised. Such assets and liabilities are not recognised if the temporary difference arises from goodwill or from the initial recognition (other than in a business combination) of other assets and liabilities in a transaction that affects neither the tax profit nor the accounting profit.
Deferred tax liabilities are recognised for taxable temporary differences arising on investments in subsidiaries, except where the Group is able to control the reversal of the temporary difference and it is probable that the temporary difference will not reverse in the foreseeable future. No provision is made for tax which would have been payable on the distribution of retained profits of overseas subsidiaries or associated undertakings where it has been determined that these profits will not be distributed in the foreseeable future.
Deferred tax assets and liabilities are offset against each other when they relate to income taxes levied by the same tax jurisdiction and when the Group intends to settle its current tax assets and liabilities on a net basis.
Deferred tax is charged or credited in the income statement, except when it relates to items charged or credited directly to equity, in which case the deferred tax is also dealt with in equity.
Deferred tax is measured at the average tax rates that are expected to apply in the periods in which the timing differences are expected to reverse, based on tax rates and laws that have been enacted, or substantially enacted by the balance sheet date. Deferred tax balances are not discounted.
1.13 InventoriesInventories are stated at the lower of average cost and net realisable value. Cost comprises direct purchase cost and those overheads that have been incurred in bringing the inventories to their present location and condition, both types of cost being measured using a weighted average cost formula. Net realisable value represents the estimated selling price less all estimated and directly attributable costs of completion and costs to be incurred in marketing, selling and distribution.
1.14 Cash and cash equivalentsCash and cash equivalents comprise cash at bank and in hand, bank overdrafts and short term highly liquid deposits with a maturity of three months or less and which are subject to an insignificant risk of changes in value. Bank overdrafts, which form part of cash and cash equivalents for the purpose of the cash flow statement, are shown under current liabilities.
1.15 Borrowings and other financial liabilitiesThe Group’s financial liabilities are those which involve a contractual obligation to deliver cash to external parties at a future date. Financial liabilities comprise all items shown in notes 17, 18 and 19 with the exception of other taxation and social security, deferred income from customer support agreements, other deferred income and other non-financial creditors. Under the classifications stipulated by IAS 39, borrowings, finance lease obligations and trade and other payables (excluding derivative financial liabilities) are classified as ‘financial liabilities measured at amortised cost’. Derivative financial instruments, which are described further in note 1.16 below, are classified as ‘held for trading unless designated in a hedge relationship’.
BorrowingsBorrowings are initially recorded at the consideration received less directly attributable transaction costs. Transaction costs are amortised through the income statement using the effective interest method and the unamortised balance is included as part of the related borrowing at the balance sheet date. A fair value adjustment is made to the borrowing where hedge accounting, as described in note 1.16 below, has been applied.
Trade and other payablesTrade and other payables (excluding derivative financial liabilities) are recorded at cost. Derivative financial instruments, which includes put options over equity held by minority shareholders, are initially recorded at fair value and then subsequently remeasured to fair value at each balance sheet date and are held within assets or liabilities as appropriate. Gains and losses arising from revaluation at the balance sheet date are recognised in the income statement unless the derivatives are designated as hedges and such hedges are proved to be effective.
1.16 Derivative financial instruments and hedge accountingDerivative financial instruments held by the Group are initially recognised in the balance sheet at fair value within assets or liabilities as appropriate and then subsequently remeasured to fair value at each balance sheet date. Gains and losses arising from revaluation at the balance sheet date are recognised in the income statement unless the derivatives are designated as hedges and such hedges are proved to be effective.
Derivatives are classified as non-current assets or liabilities where a hedge relationship is identified and the remaining maturity of the hedged item is greater than 12 months from the balance sheet date. Derivatives are classified as current assets or liabilities in all other circumstances.
Fair values are derived from market values. The fair value of financial instruments traded in active markets is based on quoted market prices at the balance sheet date.
Financial Statem
ents56 -- 119

66 Dixons Retail plcAnnual Report and Accounts 2010/11
Financial Statements
Notes to the Consolidated Financial Statements continued
1 Accounting policies continued Hedge accountingThe Group’s activities expose it primarily to the financial risks associated with changes in interest rates and foreign currency exchange rates. The Group uses derivative financial instruments such as interest rate swaps, options, cross currency swaps and forward currency contracts to hedge these risks. The Group does not use derivative financial instruments for speculative purposes.
Where hedge accounting is to be applied, the Group formally designates and documents the hedge relationship to which the Group wishes to apply hedge accounting and the risk management objective and strategy for undertaking the hedge.
Hedge accounting is discontinued when the hedging instrument expires or is sold, terminated or exercised, or no longer meets the criteria for hedge accounting.
The accounting treatment of derivatives that qualify for hedge accounting is dependent on how they are designated. The different designations and accounting treatments are explained below:
Fair value hedgesThe Group uses interest rate swaps to hedge the exposure to changes in the fair value of recognised assets and liabilities.
Derivative financial instruments that meet the ‘fair value’ hedging requirements are recognised in the balance sheet at fair value with corresponding fair value movements recognised within finance income / costs in the income statement. For an effective fair value hedge, the hedged item is adjusted for changes in fair value attributable to the risk being hedged with the corresponding entry in the income statement. To the extent that the designated hedge relationship is effective, such amounts in the income statement offset each other. As a result, only the ineffective element of any designated hedging relationship impacts the income statement. If the hedge no longer meets the criteria for hedge accounting, the adjustment to the carrying amount of the hedged item for which the effective interest method is used, is amortised to the income statement over the period to maturity.
Cash flow hedgesThe Group uses forward foreign exchange contracts to hedge the foreign currency exposure on inventory ordered and purchased and certain sales of inventory. It is Group policy to hedge between 80% and 100% of committed purchase orders and sales. At any point in time the Group also hedges up to 80% of its estimated foreign currency exposure in respect of forecast purchases and sales for the subsequent 12 months. Orders and purchases as well as sales are each considered to be separately hedged transactions.
Derivative financial instruments that qualify for such cash flow hedging are initially recognised on the balance sheet with gains and losses relating to the remeasurement of the effective portion of the hedge being deferred in equity. To the extent that such items are ineffectively hedged, gains or losses relating to the ineffective portion are recognised in the income statement. Amounts taken to equity are transferred to the income statement when the hedged transaction affects profit or loss (i.e. when a purchase or sale is made). For inventory purchases, the associated gains or losses on the derivative that had previously been recognised in equity are included in the initial measurement of inventory. For sales, the gains or losses on the derivative that had previously been recognised in equity are included in the income statement in the period in which the sale is made.
Net investment hedgesThe Group uses currency forward contracts and currency swaps to hedge its currency risk on the translation of net investments in foreign entities. Gains and losses arising on the retranslation of the investments and the related derivatives are recognised in equity. However, this is on the basis that the hedging requirements of IAS 39 are met and the hedging relationship is effective. To the extent that such items are ineffectively hedged, gains or losses relating to the ineffective portion are recognised within the income statement.
1.17 Retirement benefit obligationsCompany contributions to defined contribution pension schemes and contributions made to state pension schemes for certain overseas employees are charged to the income statement on an accruals basis as contributions become payable.
For defined benefit pension schemes, the regular service cost of providing retirement benefits to employees during the period, together with the cost of any benefits relating to past service is charged to operating results in the period. A credit representing the expected return on assets of the retirement benefit schemes during the period is included within other finance income. This is based on the market value of the assets of the schemes at the start of the financial period. A charge is included within other finance costs, representing the expected increase in the liabilities of the retirement benefit schemes during the period. The difference between the market value of the assets and the present value of the accrued pension liabilities is shown as an asset or liability in the balance sheet. Differences between the actual and expected returns on assets during the period are recognised in the consolidated statement of comprehensive income and expense, together with differences arising from changes in actuarial assumptions.

Dixons Retail plc 67 Annual Report and Accounts 2010/11
Financial Statements
1.18 Share-based payments The Group issues equity settled share-based payments to certain employees which are measured at fair value at the date of grant. This fair value is expensed in the income statement on a straight-line basis over the vesting period, based on an estimate of the number of shares that will eventually vest as adjusted for any non-market conditions.
A liability equal to the portion of services received from employees is recognised at the current fair value determined at each balance sheet date for cash settled share-based payments.
1.19 Estimates, judgements and critical accounting policiesThe preparation of financial statements in conformity with generally accepted accounting principles requires management to make estimates and assumptions that affect the reported amounts of assets and liabilities and the disclosure of contingent assets and liabilities. Significant items subject to such assumptions and estimates include the useful lives of assets; the measurement and recognition of provisions; the recognition of deferred tax assets; and liabilities for potential corporation tax. Actual results could differ from these estimates and any subsequent changes are accounted for with an effect on income at the time such updated information becomes available. The most critical accounting policies in determining the financial condition and results of the Group are those requiring the greatest degree of subjective or complex judgements. These relate to revenue recognition, inventory valuation, onerous lease costs, the valuation of goodwill, acquired intangible assets and property, plant & equipment, share-based payments, post-retirement benefits and taxation, and are set out below.
Revenue recognitionRevenue earned from the sale of customer support agreements is recognised over the term of the contracts when the Group obtains the right to consideration as a result of performance of its contractual obligations. Revenue in any one year is therefore recognised to match the proportion of the expected costs of fulfilling the Group’s total obligations under the agreements. An estimate of the degree of performance of these contractual obligations is determined by reference to extensive historical claims data. Reliance on historical data assumes that current and future experience will follow past trends. The directors consider that the quantity and quality of data available provides an appropriate proxy for current trends.
Inventory valuationInventories are valued at the lower of average cost and net realisable value. Cost comprises direct purchase cost and those overheads that have been incurred in bringing the inventories to their present location and condition, both types of cost being measures using a weighted average cost formula. Net realisable value represents the estimated selling price less all estimated and directly attributable costs of completion and costs to be incurred in the marketing, selling and distribution. Net realisable value includes, where necessary, provisions for slow moving and damaged inventory. The provision represents the difference between the cost of stock and its estimated net realisable value, based on ageing. Calculation of these provisions requires judgements to be made which include forecast consumer demand, the promotional, competitive and economic environment and inventory loss trends.
Provisions and accruals for onerous leases If the Group vacates a store or other property prior to the expiry of the related lease, or a lease forms part of a separate CGU whereby the carrying value of that CGU is not considered supportable, it records a provision or accrual for the expected lease payments that the Group will incur prior to assignment or sublease of the property. Such a calculation requires a judgement as to the timing and duration of the expected vacant periods and the amount and timing of future potential sublease income. When making these judgements, the directors consider a number of factors, including the landlord, the location and condition of the property, the terms of the lease, the specific marketplace demand and the economic environment.
Goodwill, property, plant & equipment and associate impairment reviewsGoodwill is required to be valued annually to assess the requirement for potential impairment. Other assets are assessed on an ongoing basis to determine whether circumstances exist that could lead to the conclusion that the net book value of such assets is not supportable. Impairment testing on goodwill and associates is carried out in accordance with the methodology described in note 9. Such calculations require judgement relating to the appropriate discount factors and long term growth prevalent in a particular market as well as short and medium term business plans. The directors draw upon experience as well as external resources in making these judgements.
In assessing impairment of property, plant and equipment, discounted cash flow methods are used as described in note 1.10. Judgement is required in determining the appropriate discount factors as well as the short and medium term business plans. As for goodwill, the directors draw upon experience and external resources in making these judgements.
Share-based paymentsThe charge for share-based payments is calculated by estimating the fair value of the award at the date of grant using either the Binomial or Black-Scholes option pricing model or the Monte Carlo simulation. The option valuation models used require highly subjective assumptions to be made including the future volatility of the Company’s share price, expected dividend yields, risk-free interest rates and expected staff turnover. The directors draw upon a variety of external sources to aid in the determination of the appropriate data to use in such calculations.
Defined benefit pension schemesThe surplus or deficit in the UK defined benefit scheme that is recognised through the statement of recognised income and expense is subject to a number of assumptions and uncertainties. The calculated liabilities of the scheme are based on assumptions regarding salary increases, inflation rates, discount rates, the long term expected return on the scheme’s assets and member longevity. Such assumptions are based on actuarial advice and are benchmarked against similar pension schemes.
Financial Statem
ents56 -- 119

68 Dixons Retail plcAnnual Report and Accounts 2010/11
Financial Statements
Notes to the Consolidated Financial Statements continued
1 Accounting policies continued TaxationTax laws that apply to the Group’s businesses may be amended by the relevant authorities, for example as a result of changes in fiscal circumstances or priorities. Such potential amendments and their application to the Group are monitored regularly and the requirement for recognition of any liabilities assessed where necessary. The Group is subject to income taxes in a number of different jurisdictions and judgement is required in determining the appropriate provision for transactions where the ultimate tax determination is uncertain. In such circumstances, the Group recognises liabilities for anticipated taxes due based on best information available and where the anticipated liability is probable and estimable. Where the final outcome of such matters differs from the amounts initially recorded, any differences will impact the income tax and deferred tax provisions in the period to which such determination is made. Where the potential liabilities are not considered probable, the amount at risk is disclosed unless an adverse outcome is considered remote.
Deferred tax is recognised on taxable losses based on the expected ability to utilise such losses. This ability takes account of the business plans for the relevant companies, potential uncertainties around the longer term aspects of these business plans, any expiry of taxable benefits and potential future volatility in the local tax regimes.
1.20 New accounting standards and interpretationsDuring the period, the following new standards, and amendments to existing standards, which are applicable to the Group were published, but do not become effective until future accounting periods:
The following will become effective for 2011/12: IAS 24 Related Party Disclosures. IAS 24 Revised clarifies
and simplifies the definition of a related party and also requires disclosure of any transactions between subsidiaries and associates.
The following will become effective for 2013/14: IFRS 9 Financial Instruments. This standard is the first step
in the process to replace IAS 39, ‘Financial instruments: recognition and measurement’. IFRS 9 introduces new requirements for classifying and measuring financial assets and is likely to affect the Group’s accounting for its financial assets.
Certain other amendments to existing standards and interpretations were issued during the period which either do not apply to the Group or are not expected to have any material effect.
2 Segmental analysis The Group’s operating segments have been determined based on the information reported to the Board. This information is predominantly based on geographical areas which are either managed separately or have similar trading characteristics such that they can be aggregated together into one segment and in the case of e-commerce, as a business area with geographical territories aggregated. Accounting policies for each operating segment are the same as those for the Group as described in note 1. The Group evaluates each operating segment based on underlying operating profits which excludes those items described in note 1.1.
All segments are involved in the multi-channel sale of high technology consumer electronics, personal computers, domestic appliances, photographic equipment, communication products and related financial and after-sales services. The principal categories of customer are retail, business to business and online.
During 2009/10, the Group disposed of its operations in Hungary and Poland, both of which have been classified as discontinued operations. Further information is provided in note 28.
The Group’s reportable segments have been identified as follows: UK & Ireland comprises electrical and computing retail chains
as well as business to business (B2B) activities. The division is engaged predominantly in multi-channel retail sales, associated peripherals and services and related financial and after sales services and also in business to business sales of computer hardware and software.
Nordics operates in Norway, Sweden, Finland, Denmark, Iceland, Greenland and the Faroe Islands. The division engages in multi-channel retail sales and provided related product support services to its customers. It also engages in B2B sales of computer hardware, software and services. Across the region, the division operates a successful franchise business, typically in smaller markets.
Other International comprises operations in Italy, Greece, the Czech Republic, Slovakia, Turkey and the business to be closed in Spain which is excluded from underlying results. The Other International division engages in retail sales (including multi-channel sales in some countries) and provides related product support services to its customers in all of its markets. It also engages in B2B sales of computer hardware, software and services in Italy, Spain and Greece and has franchise operations in Italy, Greece, the Czech Republic and Turkey.
Pure play e-commerce comprises pure play online retailers and operates in all of the countries in which the other divisions operate and across Europe.
Business to be closed / closed businesses comprise PC City Spain whereby its closure was announced on 14 April 2011 and Markantalo and PC City Sweden whereby these store operations were closed on 10 May 2009 and 20 May 2009, respectively. Owing to their closure rather than disposal, these operations do not meet the definition of discontinued operations as stipulated by IFRS 5.

Dixons Retail plc 69 Annual Report and Accounts 2010/11
Financial Statements
(a) Income statement 2010/11
External revenue £million
Inter-segmental
revenue £million
Revenue £million
Underlying profit / (loss)
£million
Total profit / (loss)
£million
UK & Ireland 3,816.1 57.8 3,873.9 71.3 50.4Nordics 2,268.9 3.8 2,272.7 106.0 85.3Other International 1,414.1 0.6 1,414.7 (21.6) (153.8)Pure play e-commerce 842.7 5.0 847.7 0.9 (120.8)Eliminations – (67.2) (67.2) – –
8,341.8 – 8,341.8 156.6 (138.9)Share of post-tax results of associates (0.4) (0.4)
Operating profit / (loss) before central costs and property losses 156.2 (139.3)Central costs (15.8) (26.1)Property losses (12.8) (12.8)
Operating profit / (loss) 127.6 (178.2)Finance income 58.9 71.4Finance costs (101.2) (117.3)
Profit / (loss) before tax for the period 85.3 (224.1)
External revenue for Other International includes £187.4 million relating to business to be closed.
Reconciliation of underlying profit / (loss) to total profit / (loss)2010/11
Underlying profit / (loss)
£million
Business to be closed
£million
Amortisation of acquired intangibles
£million
Net restructuring
charges £million
Business impairment
charges £million
Other items £million
Other non-
underlying financing
items £million
Total profit / (loss)
£million
UK & Ireland 71.3 – (0.4) (5.6) – (14.9) – 50.4Nordics 106.0 – – – (21.5) 0.8 – 85.3Other International (21.6) (7.7) (0.7) – (123.8) – – (153.8)Pure play e-commerce 0.9 – (3.4) – (106.3) (12.0) – (120.8)
156.6 (7.7) (4.5) (5.6) (251.6) (26.1) – (138.9)Share of post-tax results of associates (0.4) – – – – – – (0.4)
Operating profit / (loss) before central costs and property losses 156.2 (7.7) (4.5) (5.6) (251.6) (26.1) – (139.3)
Central costs (15.8) – – (11.5) – 1.2 – (26.1)Property losses (12.8) – – – – – – (12.8)
Operating profit / (loss) 127.6 (7.7) (4.5) (17.1) (251.6) (24.9) – (178.2)Finance income 58.9 – – – – – 12.5 71.4Finance costs (101.2) (0.8) – – – – (15.3) (117.3)
Profit / (loss) before tax for the period 85.3 (8.5) (4.5) (17.1) (251.6) (24.9) (2.8) (224.1)
Share of post-tax results of associates relates to the Nordics.
Financial Statem
ents56 -- 119

70 Dixons Retail plcAnnual Report and Accounts 2010/11
Financial Statements
Notes to the Consolidated Financial Statements continued
2 Segmental analysis continued2009/10
External revenue £million
Inter-segmental revenue £million
Revenue £million
Underlying profit / (loss)
£million
Total profit / (loss)
£million
UK & Ireland 4,013.5 101.7 4,115.2 71.1 93.7Nordics 2,094.6 1.7 2,096.3 95.8 95.6Other International 1,503.2 1.5 1,504.7 (8.3) (9.0)Pure play e-commerce 921.2 3.8 925.0 11.3 7.9Eliminations – (108.7) (108.7) – –
8,532.5 – 8,532.5 169.9 188.2Share of post-tax results of associates 1.6 1.6
Operating profit before central costs and property losses 171.5 189.8Central costs (19.5) (14.8)Property losses (18.8) (18.8)
Operating profit 133.2 156.2Finance income 58.2 59.3Finance costs (100.5) (102.8)
Profit before tax for the period 90.9 112.7
External revenue for the Nordics and Other International includes £0.9 million and £211.6 million relating to closed businesses and the business to be closed, respectively.
Reconciliation of underlying profit / (loss) to total profit / (loss)2009/10
Underlying profit / (loss)
£million
Business to be closed /
closed businesses
£million
Amortisation of acquired intangibles
£million
Net restructuring
charges £million
Change in pension benefits £million
Net fair value remeasure-
ments £million
Total profit / (loss)
£million
UK & Ireland 71.1 – (0.5) (5.6) 28.7 – 93.7Nordics 95.8 (0.2) – – – – 95.6Other International (8.3) – (0.7) – – – (9.0)Pure play e-commerce 11.3 – (3.4) – – – 7.9
169.9 (0.2) (4.6) (5.6) 28.7 – 188.2Share of post-tax results of associates 1.6 – – – – – 1.6
Operating profit / (loss) before central costs and property losses 171.5 (0.2) (4.6) (5.6) 28.7 – 189.8
Central costs (19.5) – – – 4.7 – (14.8)Property losses (18.8) – – – – – (18.8)
Operating profit / (loss) 133.2 (0.2) (4.6) (5.6) 33.4 – 156.2Finance income 58.2 – – – – 1.1 59.3Finance costs (100.5) (0.4) – – – (1.9) (102.8)
Profit / (loss) before tax for the period 90.9 (0.6) (4.6) (5.6) 33.4 (0.8) 112.7
Share of post-tax results of associates relates to the Nordics.

Dixons Retail plc 71 Annual Report and Accounts 2010/11
Financial Statements
(b) Geographical analysis Revenues are allocated to countries according to the entity’s country of domicile. Revenue generated by the UK business was £3,800.9 million (2009/10 £4,028.2 million). Revenue by destination is not materially different to that shown by domicile. Revenue from discontinued operations is shown in note 28.
Non-current assets comprise property, plant & equipment, goodwill, intangible assets, investments in associates and non-current trade and other receivables. Non-current assets held by the UK, Italy and PIXmania were £402.0 million (2010 £327.4 million), £185.3 million (2010 £180.8 million), and £135.5 million (2010 £236.7 million), respectively. Non-current assets held by the Nordics were £814.4 million (2010 £799.3 million) and predominantly comprised goodwill (as disclosed in note 9) which has not been allocated to individual countries.
(c) Balance sheet 2010/11
Segment assets
£million
Investment in associates
£million
Total segment assets
£million
Segment liabilities £million
Net assets £million
UK & Ireland 1,989.3 – 1,989.3 (1,227.3) 762.0Nordics 1,132.2 3.4 1,135.6 (502.6) 633.0Other International 563.5 – 563.5 (1,402.2) (838.7)Pure play e-commerce 278.3 – 278.3 (358.3) (80.0)Central 1,861.0 – 1,861.0 (1,657.8) 203.2Eliminations (2,250.3) – (2,250.3) 2,250.3 –
Continuing operations 3,574.0 3.4 3,577.4 (2,897.9) 679.5Discontinued operations – – – (3.0) (3.0)
3,574.0 3.4 3,577.4 (2,900.9) 676.5
2009/10
Segment assets
£million
Investment in associates
£million
Total segment
assets £million
Segment liabilities £million
Net assets £million
UK & Ireland 1,543.1 – 1,543.1 (1,087.4) 455.7Nordics 1,054.3 26.4 1,080.7 (467.2) 613.5Other International 696.8 – 696.8 (1,351.6) (654.8)Pure play e-commerce 373.3 – 373.3 (335.3) 38.0Central 1,411.3 – 1,411.3 (987.5) 423.8Eliminations (1,389.4) – (1,389.4) 1,389.4 –
Continuing operations 3,689.4 26.4 3,715.8 (2,839.6) 876.2Discontinued operations – – – (1.1) (1.1)
3,689.4 26.4 3,715.8 (2,840.7) 875.1
Central assets and liabilities predominantly comprise intersegment balances, cash and cash equivalents, borrowings, net retirement benefit obligations, derivative financial instruments and tax assets and liabilities.
Financial Statem
ents56 -- 119

72 Dixons Retail plcAnnual Report and Accounts 2010/11
Financial Statements
Notes to the Consolidated Financial Statements continued
2 Segmental analysis continued(d) Other information
2010/11
Capital expenditure
Intangible assets
£million
Property, plant &
equipment £million
Depreciation £million
Amortisation £million
Share-based payments
£million
UK & Ireland 14.1 118.9 65.2 13.8 3.9Nordics 4.6 40.5 24.8 4.5 0.9Other International 2.8 28.7 24.0 2.9 1.3Pure play e-commerce 2.9 6.0 4.5 6.1 0.1Central – – 0.2 – 1.8
Continuing operations 24.4 194.1 118.7 27.3 8.0Discontinued operations – – – – –
24.4 194.1 118.7 27.3 8.0
2009/10
Capital expenditure
Intangible assets
£million
Property, plant &
equipment £million
Depreciation £million
Amortisation £million
Share-based payments
£million
UK & Ireland 7.3 95.8 58.7 15.5 3.2Nordics 2.6 29.9 21.1 4.7 0.6Other International 2.8 26.6 21.4 3.8 0.6Pure play e-commerce 1.4 2.4 3.0 6.1 0.1Central – 5.4 1.6 0.6 1.2
Continuing operations 14.1 160.1 105.8 30.7 5.7Discontinued operations – – 0.1 – –
14.1 160.1 105.9 30.7 5.7
3 Revenue and operating profit / (loss)
2010/11 2009/10
Non-underlying Non-underlying
Underlying £million
Business to be closed
£millionOther
£millionTotal
£millionUnderlying
£million
Business to be closed / closed
businesses £million
Other £million
Total £million
Revenue 8,154.4 187.4 – 8,341.8 8,320.0 212.5 – 8,532.5Cost of sales (7,579.4) (185.3) (83.8) (7,848.5) (7,682.1) (202.9) (5.6) (7,890.6)
Gross profit / (loss) 575.0 2.1 (83.8) 493.3 637.9 9.6 (5.6) 641.9Distribution costs (186.2) (3.6) (2.1) (191.9) (182.8) (3.9) – (186.7)Administrative expenses (247.2) (6.2) (212.2) (465.6) (303.9) (5.9) 28.8 (281.0)Other operating charge (13.6) – – (13.6) (19.6) – – (19.6)
Profit / (loss) from operations before associates 128.0 (7.7) (298.1) (177.8) 131.6 (0.2) 23.2 154.6
Share of post-tax results of associates (0.4) – – (0.4) 1.6 – – 1.6
Total operating profit / (loss) 127.6 (7.7) (298.1) (178.2) 133.2 (0.2) 23.2 156.2
Non-underlying items comprise amortisation of acquired intangibles of £4.5 million (2009/10 £4.6 million), included within administrative expenses, net restructuring and business impairment charges and other one off items. Such items are described further in note 4. Included within underlying cost of sales, distribution costs and administrative expenses is amortisation of other intangibles of £12.5 million, £2.4 million and £7.5 million, respectively (2009/10 £14.2 million, £2.8 million and £8.6 million, respectively).

Dixons Retail plc 73 Annual Report and Accounts 2010/11
Financial Statements
2010/11 2009/10
Underlying £million
Business to be closed
£million Total
£million Underlying
£million
Business to be closed / closed
businesses £million
Total £million
Sale of goods 7,689.7 172.9 7,862.6 7,815.1 196.5 8,011.6Revenue from services 464.7 14.5 479.2 504.9 16.0 520.9
8,154.4 187.4 8,341.8 8,320.0 212.5 8,532.5
Revenue from services predominantly comprises those relating to customer support agreements, delivery and installation, product repairs and product support.
2010/11 2009/10
Underlying £million
Business to be closed
£millionTotal
£millionUnderlying
£million
Business to be closed /
closed businesses
£millionTotal
£million
Inventories recognised as an expense 6,204.1 153.0 6,357.1 6,039.8 157.6 6,197.4Cost of inventory write-down 25.4 0.4 25.8 35.2 0.5 35.7Rentals paid under operating leases: Plant and machinery 8.5 – 8.5 5.5 – 5.5 Property – non-contingent rent 359.4 10.1 369.5 357.8 7.9 365.7 Property – contingent rent 5.4 – 5.4 13.4 0.1 13.5Rentals received under operating leases: Property – subleases (7.3) – (7.3) (5.5) – (5.5)
2010/11 £million
2009/10 £million
Auditors’ remuneration Audit services – Group financial statements 0.5 0.5 – Subsidiary financial statements 0.6 0.7
Total audit fees 1.1 1.2 Non audit services pursuant to legislation 0.2 0.2 Corporate finance services – 0.1 Other – 0.1
Total fees paid to the auditors 1.3 1.6
Financial Statem
ents56 -- 119

74 Dixons Retail plcAnnual Report and Accounts 2010/11
Financial Statements
Notes to the Consolidated Financial Statements continued
4 Non-underlying items 2010/11 2009/10
Note
Business to be closed
£million Other
£million Total
£million
Business to be closed / closed
businesses £million
Other £million
Total £million
Included in operating profit / (loss): Business to be closed / closed businesses (i) (7.7) – (7.7) (0.2) – (0.2) Amortisation of acquired intangibles – (4.5) (4.5) – (4.6) (4.6) Net restructuring charges (ii) – (17.1) (17.1) – (5.6) (5.6) Business impairment charges (iii) – (251.6) (251.6) – – – Change in pension benefits (iv) – – – – 33.4 33.4 Other items (v) – (24.9) (24.9) – – –
(7.7) (298.1) (305.8) (0.2) 23.2 23.0
Included in net finance costs: Business to be closed (i) (0.8) – (0.8) (0.4) – (0.4) Net fair value remeasurements of financial instruments (vi) – (2.8) (2.8) – (0.8) (0.8)
Accelerated amortisation of facility fees (vii) – (7.8) (7.8) – – – Net 2012 Bond redemption gains (viii) – 7.8 7.8 – – –
(0.8) (2.8) (3.6) (0.4) (0.8) (1.2)
Total impact on profit / (loss) before tax (8.5) (300.9) (309.4) (0.6) 22.4 21.8
Included in income tax expense: Business to be closed / closed businesses – – – 0.1 – 0.1 Other non-underlying items – 12.3 12.3 – (6.1) (6.1)
– 12.3 12.3 0.1 (6.1) (6.0)
Total impact on profit / (loss) after tax (8.5) (288.6) (297.1) (0.5) 16.3 15.8
(i) Business to be closed / closed businesses: comprises the operating activities of PC City Spain whereby its closure was announced on 14 April 2011 and Markantalo and PC City Sweden which were closed on 10 May 2009 and 20 May 2009, respectively.
(ii) Net restructuring charges – strategic reorganisation:2010/11
£million2009/10 £million
Asset impairments (1.6) (3.3)Property charges (7.4) (2.3)Other charges (8.1) –
(17.1) (5.6)
Net restructuring charges relate predominantly to the renewal and transformation of the UK & Ireland business which has been focused mainly on the reformatting and re-organisation of the UK & Ireland store portfolio and the reorganisation of the service offering.
Asset impairments relate to intangible assets and items of property, plant & equipment which are to be eliminated from the business over a shorter period than their current useful expected lives and arise from restructuring initiatives which commenced in 2007/08. Such impairments comprise incremental accelerated depreciation charges associated with the economic useful life of these assets being shortened. Property charges comprise onerous lease costs and charges related to vacating properties. Other charges predominantly comprise employee severance.
(iii) Net business impairment charges:
Goodwill impairment
£million
Other assets impairment
£milion
Property charges £million
Other charges £million
Total £million
Business to be closed (15.1) (31.8) (6.1) (17.6) (70.6)PIXmania (106.3) – – – (106.3)Greek business (53.2) – – – (53.2)Associate – (21.5) – – (21.5)
(174.6) (53.3) (6.1) (17.6) (251.6)

Dixons Retail plc 75 Annual Report and Accounts 2010/11
Financial Statements
Business to be closed relates to PC City Spain following the announcement of the closure of the store operations of this business and comprises the full impairment of goodwill as well as other asset impairments which include other intangible assets, property, plant & equipment and inventory. Property charges comprise onerous lease costs and charges related to vacating properties. Other charges relate predominantly to employee severance.
PIXmania: Weakness in the Southern European economies, investment in developing new web platforms and changes in the internet retailing market have caused profit performance to be behind that envisaged at the time of the acquisition of the business and this has therefore led to an impairment to the goodwill being charged as described further in note 9.
Greek business: Following an extended period of economic difficulty and the expectation that a full recovery will be prolonged, an impairment to the goodwill has been charged as described further in note 9.
Associate: Relates to a long period of decline in the results of F-Group leading to the conclusion that the carrying value of the investment (which incorporates prior year dividends received) is impaired. Further information is provided in note 12.
(iv) The change in pension benefits in 2009/10 arose from the closure to future accrual of the defined benefit section of the UK pension scheme which occurred on 30 April 2010.
(v) Other items comprise the following:
2010/11 £million
2009/10 £million
Impairment of other intangibles work in progress (14.9) –Exceptional supplier balance write offs (12.0) –Credits in respect of prior restructurings 2.0 –
(24.9) –
Write off of other intangibles work in progress relates to capitalised system costs in the UK from 2008 following the decision to defer the project in order to focus on existing process improvements. This has caused the conclusion that the as yet unamortised work in progress is impaired.
The exceptional supplier balance write offs relate to supplier receivables in PIXmania, dating back to 2008/09 and prior years. This write off has arisen due to the culmination of a reconciliation process following the implementation of new systems highlighting the extent of the receivables outstanding and a detailed review of the Group’s ability to recover these balances. Owing to historical nature of the origin of the amounts, coupled with their only recent quantification, the write off has been treated as a non-underlying item.
Credits relate mainly to closed businesses and represent cash recoveries from third parties which due to their contingent nature had not previously been recognised.
(vi) Net fair value remeasurement gains and losses on revaluation of financial instruments: Items excluded from underlying finance income and expense represent the gains and losses arising from the revaluation of derivative financial instruments under methodologies stipulated by IAS 39 compared with those on an accruals basis (the basis upon which all other items in the financial statements are prepared). Such a treatment is a form of revaluation gain or loss created by an assumption that the derivatives will be settled before their maturity.
Such gains and losses are unrealised and in the directors’ view also conflict with both the commercial reasons for entering into such arrangements as well as Group Treasury policy whereby early settlement in the majority of cases would amount to speculative use of derivatives.
(vii) On 12 May 2010, the Group signed a new £360 million Revolving Credit Facility (the £360 million Facility) which came into effect on 9 July 2010 when the Group’s pre-existing £400 million Sterling Committed Facility (the £400 million Facility) was cancelled. This cancellation triggered the acceleration of the amortisation of fees from the £400 million Facility which would otherwise have been charged evenly over the period to the pre-existing facility’s maturity in October 2011.
(viii) On 23 July 2010, the Group conditionally accepted tenders to repurchase £140 million in nominal amount of its £300 million 6.125% Guaranteed Bonds due November 2012 (the 2012 Bonds), subject to the successful completion of appropriate financing to fund the repurchase. This repurchase was financed by a new issue of £150 million 8.75% Guaranteed Notes due 3 August 2015 and for which proceeds were received on 30 July 2010. As a result of the repurchase, charges relating to the acceleration of the amortisation of fees from the 2012 Bonds which would otherwise have been charged evenly over the period to the 2012 Bonds’ maturity in November 2012 has occurred together with a redemption premium. These have been more than offset by gains arising on the notional cancellation of interest rate swaps which were in place on the portion of the 2012 Bonds which have now been redeemed.
Financial Statem
ents56 -- 119
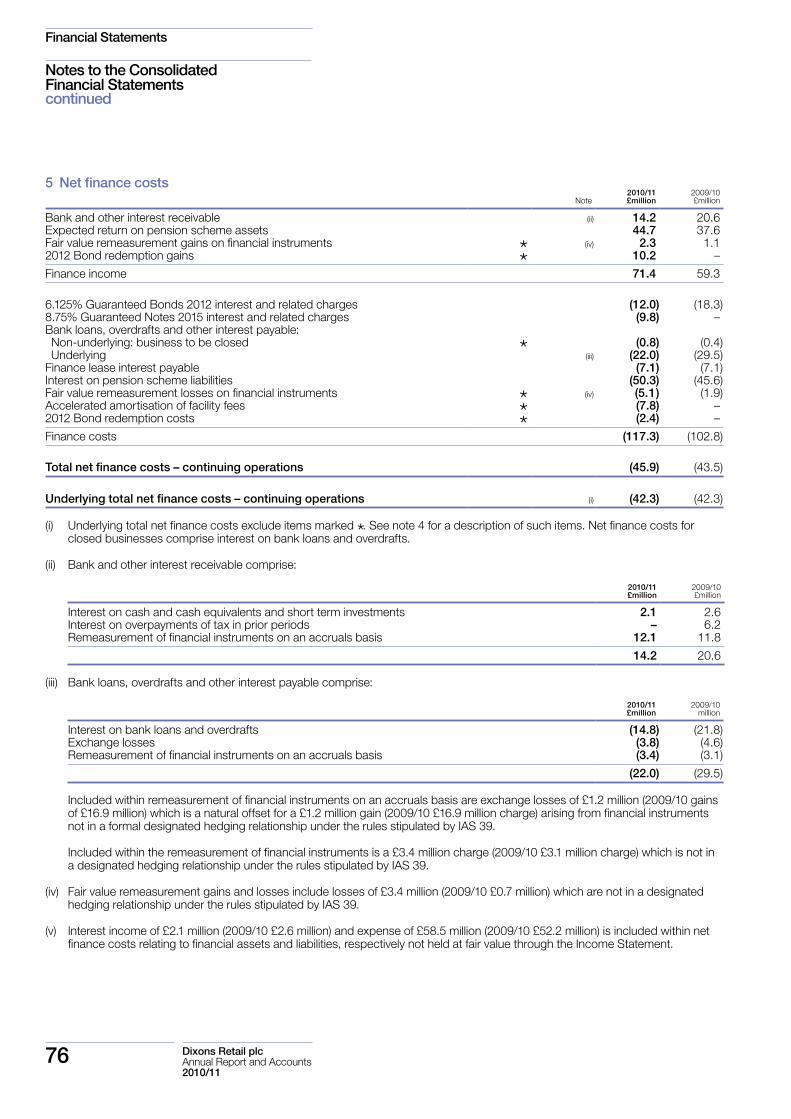
76 Dixons Retail plcAnnual Report and Accounts 2010/11
Financial Statements
Notes to the Consolidated Financial Statements continued
5 Net finance costsNote
2010/11 £million
2009/10 £million
Bank and other interest receivable (ii) 14.2 20.6Expected return on pension scheme assets 44.7 37.6Fair value remeasurement gains on financial instruments * (iv) 2.3 1.12012 Bond redemption gains * 10.2 –
Finance income 71.4 59.3
6.125% Guaranteed Bonds 2012 interest and related charges (12.0) (18.3)8.75% Guaranteed Notes 2015 interest and related charges (9.8) –Bank loans, overdrafts and other interest payable: Non-underlying: business to be closed * (0.8) (0.4) Underlying (iii) (22.0) (29.5)Finance lease interest payable (7.1) (7.1)Interest on pension scheme liabilities (50.3) (45.6)Fair value remeasurement losses on financial instruments * (iv) (5.1) (1.9)Accelerated amortisation of facility fees * (7.8) –2012 Bond redemption costs * (2.4) –
Finance costs (117.3) (102.8)
Total net finance costs – continuing operations (45.9) (43.5)
Underlying total net finance costs – continuing operations (i) (42.3) (42.3)
(i) Underlying total net finance costs exclude items marked *. See note 4 for a description of such items. Net finance costs for closed businesses comprise interest on bank loans and overdrafts.
(ii) Bank and other interest receivable comprise:
2010/11 £million
2009/10 £million
Interest on cash and cash equivalents and short term investments 2.1 2.6Interest on overpayments of tax in prior periods – 6.2Remeasurement of financial instruments on an accruals basis 12.1 11.8
14.2 20.6
(iii) Bank loans, overdrafts and other interest payable comprise:
2010/11 £million
2009/10 million
Interest on bank loans and overdrafts (14.8) (21.8)Exchange losses (3.8) (4.6)Remeasurement of financial instruments on an accruals basis (3.4) (3.1)
(22.0) (29.5)
Included within remeasurement of financial instruments on an accruals basis are exchange losses of £1.2 million (2009/10 gains of £16.9 million) which is a natural offset for a £1.2 million gain (2009/10 £16.9 million charge) arising from financial instruments not in a formal designated hedging relationship under the rules stipulated by IAS 39.
Included within the remeasurement of financial instruments is a £3.4 million charge (2009/10 £3.1 million charge) which is not in a designated hedging relationship under the rules stipulated by IAS 39.
(iv) Fair value remeasurement gains and losses include losses of £3.4 million (2009/10 £0.7 million) which are not in a designated hedging relationship under the rules stipulated by IAS 39.
(v) Interest income of £2.1 million (2009/10 £2.6 million) and expense of £58.5 million (2009/10 £52.2 million) is included within net finance costs relating to financial assets and liabilities, respectively not held at fair value through the Income Statement.
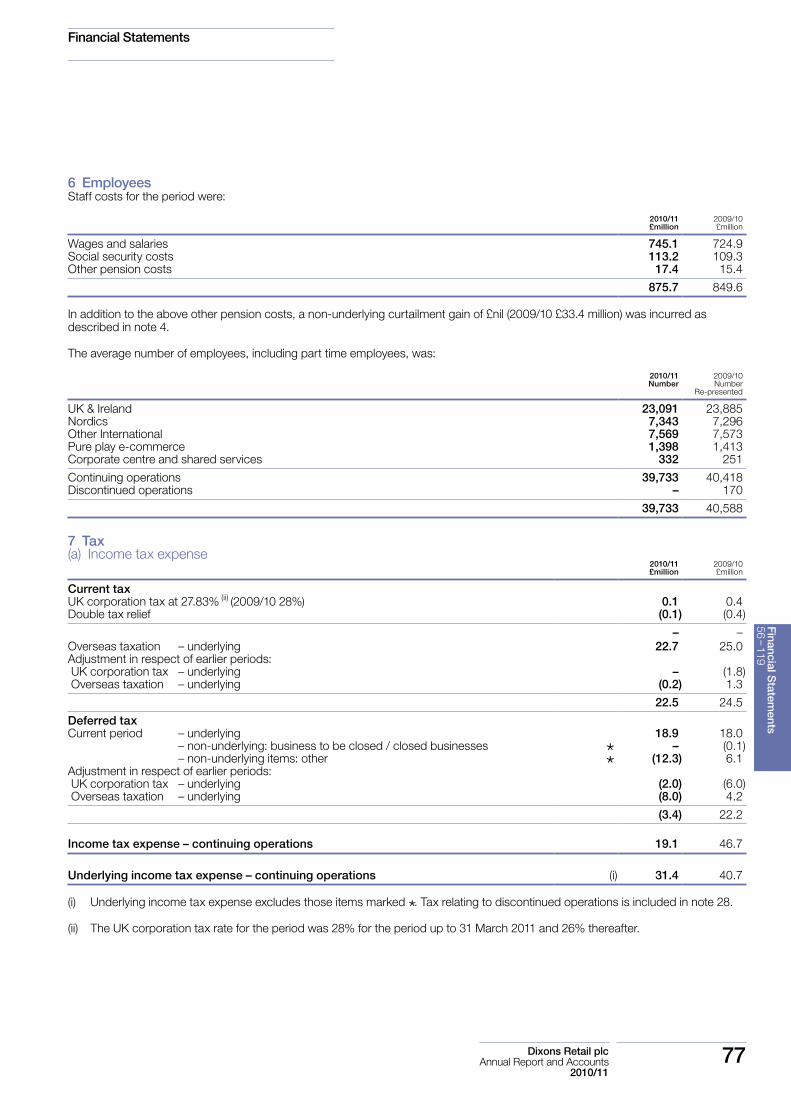
Dixons Retail plc 77 Annual Report and Accounts 2010/11
Financial Statements
6 EmployeesStaff costs for the period were:
2010/11 £million
2009/10 £million
Wages and salaries 745.1 724.9Social security costs 113.2 109.3Other pension costs 17.4 15.4
875.7 849.6
In addition to the above other pension costs, a non-underlying curtailment gain of £nil (2009/10 £33.4 million) was incurred as described in note 4.
The average number of employees, including part time employees, was:
2010/11 Number
2009/10 Number
Re-presented
UK & Ireland 23,091 23,885Nordics 7,343 7,296Other International 7,569 7,573Pure play e-commerce 1,398 1,413Corporate centre and shared services 332 251
Continuing operations 39,733 40,418Discontinued operations – 170
39,733 40,588
7 Tax (a) Income tax expense
2010/11 £million
2009/10 £million
Current tax UK corporation tax at 27.83% (ii) (2009/10 28%) 0.1 0.4Double tax relief (0.1) (0.4)
– –Overseas taxation – underlying 22.7 25.0Adjustment in respect of earlier periods: UK corporation tax – underlying – (1.8) Overseas taxation – underlying (0.2) 1.3
22.5 24.5
Deferred tax Current period – underlying 18.9 18.0 – non-underlying: business to be closed / closed businesses * – (0.1) – non-underlying items: other * (12.3) 6.1Adjustment in respect of earlier periods: UK corporation tax – underlying (2.0) (6.0) Overseas taxation – underlying (8.0) 4.2
(3.4) 22.2
Income tax expense – continuing operations 19.1 46.7
Underlying income tax expense – continuing operations (i) 31.4 40.7
(i) Underlying income tax expense excludes those items marked *. Tax relating to discontinued operations is included in note 28.
(ii) The UK corporation tax rate for the period was 28% for the period up to 31 March 2011 and 26% thereafter.
Financial Statem
ents56 -- 119

78 Dixons Retail plcAnnual Report and Accounts 2010/11
Financial Statements
Notes to the Consolidated Financial Statements continued
7 Tax continuedA reconciliation of the notional to the actual income tax expense is set out below:
Note2010/11
£million2009/10 £million
(Loss) / profit before tax – continuing operations (224.1) 112.7Loss before tax – discontinued operations 28 (2.1) (8.7)
(226.2) 104.0
Tax on (loss) / profit at UK statutory rate of 27.83% (2009/10 28%) (63.0) 29.1Non-qualifying depreciation 3.3 1.9Differences in effective overseas taxation rates (1.0) 3.5Non deductible charges 1.9 1.6Non taxable losses on property disposals 1.1 1.2Non taxable other gains – underlying – (0.2)Non deductible losses – non-underlying 71.4 (0.1)Overseas deferred tax not recognised – continuing operations 3.7 5.3 – discontinued operations – 0.8Adjustment in respect of earlier periods – underlying (10.2) (2.3)Non deductible loss on discontinued operations 1.0 1.6Effect of change in UK statutory tax rate 6.0 –Other differences 4.9 4.3
Income tax expense – total 19.1 46.7
Income tax attributable to discontinued operations 28 – –
Income tax expense – continuing operations 19.1 46.7
The effective tax rate on underlying earnings of 37% (2009/10 45%) has fallen due to decreases in effective UK and overseas tax rates, and unrecognised losses starting to form a lower proportion of net profits. The Group has total unrecognised deferred tax assets relating to tax losses of £126.1 million (2009/10 £105.8 million) of which £0.9 million (2009/10 £0.9 million) have no time restriction over when they can be utilised. The Group has unrecognised deferred tax assets relating to time restricted tax losses of £125.2 million (2009/10 £104.5 million) for which the weighted average period over which they can be utilised is five years (2009/10 five years).
(b) Deferred tax Accelerated
capital allowances
£million
Retirement benefit
obligations £million
Losses carried
forward £million
Other timing
differences £million
Total £million
At 3 May 2009 18.4 45.2 29.9 34.1 127.6Credited / (charged) to income statement 14.6 (13.5) (2.1) (21.2) (22.2)Acquisitions 0.2 – – 0.1 0.3Credited directly to equity – 43.2 – 1.3 44.5Currency retranslation (0.2) 0.1 (0.3) 0.9 0.5
At 1 May 2010 33.0 75.0 27.5 15.2 150.7Credited / (charged) to income statement 14.0 (3.2) (3.6) (3.8) 3.4Charged directly to equity – (7.0) – (2.1) (9.1)Currency retranslation 0.2 – 0.4 0.2 0.8
At 30 April 2011 47.2 64.8 24.3 9.5 145.8

Dixons Retail plc 79 Annual Report and Accounts 2010/11
Financial Statements
Summary of assets and liabilities as disclosed:
2011 £million
2010 £million
Deferred tax assets 163.4 169.4Deferred tax liabilities (17.6) (18.7)
145.8 150.7
Analysis of deferred tax relating to items credited / (charged) directly to equity in the period:
2010/11 £million
2009/10 £million
Actuarial losses on defined benefit pension schemes (7.0) 43.2Net losses on revaluation of cash flow hedges (1.9) 2.0Net gains on hedges of net investments 0.4 (0.8)Unrealised gains on investments – (0.2)
(Charged) / credited to comprehensive expense (8.5) 44.2Share-based payments (0.6) 0.3
(9.1) 44.5
The recognition of trading losses carried forward is considered supportable due to the ability to offset losses against future profits.
As a result of share disposals, allowable losses have been incurred which are available for offset against certain future chargeable gains. A deferred tax asset has not been recognised in respect of these losses as it is considered that there is insufficient evidence that chargeable gains will arise. The deferred tax asset not recognised, measured at the standard rate of 26%, is not less than £327.0 million (2009/10 £352.0 million). Where permitted, certain deferred tax assets and liabilities have been offset for financial reporting purposes.
Financial Statem
ents56 -- 119

80 Dixons Retail plcAnnual Report and Accounts 2010/11
Financial Statements
Notes to the Consolidated Financial Statements continued
8 Earnings per share Note
2010/11 £million
2009/10 £million
Basic and diluted earnings Total (continuing and discontinued operations) (239.0) 59.8Discontinued operations – loss after tax 28 2.1 8.7
Continuing operations (236.9) 68.5
Adjustments Business to be closed / closed businesses 8.5 0.6Amortisation of acquired intangibles 4.5 4.6Net restructuring charges 17.1 5.6Business impairment charges 251.6 –Other items 24.9 –Change in pension benefits – (33.4)Net fair value remeasurements of financial instruments 2.8 0.8Accelerated amortisation of facility fees 7.8 –2012 Bond redemption gains (7.8) –
309.4 (21.8)Attributable to non-controlling interests (3.6) –
Attributable to equity shareholders of the parent company 305.8 (21.8)
Tax on adjustments (12.3) 6.0Attributable to non-controlling interests 2.2 –
Tax on adjustments attributable to equity shareholders of the parent company (10.1) 6.0
Total adjustments (net of taxation) 295.7 (15.8)
Underlying basic and diluted earnings 58.8 52.7
Million Million
Basic weighted average number of shares 3,606.6 3,495.6Employee share option and ownership schemes 12.3 23.9
Diluted weighted average number of shares 3,618.9 3,519.5
Pence Pence
Basic (loss) / earnings per share Total (continuing and discontinued operations) (6.6) 1.7Discontinued operations – 0.3
Continuing operations (6.6) 2.0Adjustments (net of taxation) 8.2 (0.5)
Underlying basic earnings per share 1.6 1.5
Diluted (loss) / earnings per shareTotal (continuing and discontinued operations) (6.6) 1.7Discontinued operations – 0.2
Continuing operations (6.6) 1.9Adjustments (net of taxation) 8.2 (0.4)
Underlying diluted earnings per share 1.6 1.5
The weighted average number of shares used in the calculation for earnings per share information for the periods prior to the rights issue, which completed on 9 June 2009, has been multiplied by an adjustment factor to reflect the bonus element in the shares issued under the terms of the rights issue. The adjustment factor used was 1.2138.
Basic and diluted earnings per share are based on the profit for the period attributable to equity shareholders. Underlying earnings per share are presented in order to show the underlying performance of the Group. Adjustments used to determine underlying earnings are described further in note 4.

Dixons Retail plc 81 Annual Report and Accounts 2010/11
Financial Statements
9 Goodwill2011
£million2010
£million
Cost At beginning of period 1,516.5 1,502.7Additions 2.6 7.3Disposals (15.1) (28.7)Currency retranslation 34.1 35.2
At end of period 1,538.1 1,516.5
Impairment At beginning of period 400.0 433.6Non-underlying impairment 174.6 –Disposals (15.1) (28.1)Currency retranslation 7.8 (5.5)
At end of period 567.3 400.0
Net book value at the end of period 970.8 1,116.5
(a) Carrying valueThe carrying value of goodwill is made up of the following businesses:
2011 £million
2010 £million
Elkjøp Nordic AS (Elkjøp) 686.6 667.4Unieuro S.p.A. (Unieuro) 146.9 144.3PIXmania S.A.S. (PIXmania) 80.8 181.7Dixons South East Europe A.E.V.E (Kotsovolos) 39.4 91.2Others 17.1 31.9
970.8 1,116.5
The non-underlying impairment charges which form part of non-underlying operating profit comprise: PIXmania: £106.3 million – For PIXmania, weakness in the European economy combined with lower than anticipated profitability in
2010/11 has caused the directors to revise their five year projections; Kotsovolos in Greece: £53.2 million – In the case of Kotsovolos, weakness in the Greek economy highlighted by poor trading in
the current period, coupled with management’s expectations that economic recovery may be prolonged, has caused the directors to revise projections for the five year period referred to below significantly downwards when compared to prior periods thereby giving rise to an impairment charge; and
the business to be closed (PC City Spain): £15.1 million – In the case of PC City Spain, the impairment arises as a result of the closure of the store operations of this business which was announced on 14 April 2011 with the amount representing the entire goodwill attributable to this business.
Further details of these charges is shown in note 4 and the methodology used in their calculation is set out below.
Disposals relate to the business to be closed (2009/10 mainly related to closed businesses) resulting from there being no ongoing business attaching to the goodwill.
(b) Impairment testingAs required by IAS 36, goodwill is subject to annual impairment reviews. These reviews are carried out using the following criteria:
business acquisitions generate an attributed amount of goodwill; the manner in which these businesses are run and managed is used to determine the ‘Cash Generating Unit’ (CGU) grouping as
defined in IAS 36 ‘Impairment of Assets’; the recoverable amount of each CGU group is determined based on calculating its value in use (VIU); the VIU is calculated by applying discounted cash flow modelling to management’s own projections covering a five year period; cash flows beyond the five year period are extrapolated using a long term growth rate equivalent to the relevant market’s Gross
Domestic Product (GDP); and the VIU is then compared to the carrying amount in order to determine whether impairment has occurred.
The key assumptions used in calculating value in use are: management’s five year projections; the growth rate beyond five years; and the pre-tax adjusted discount rate.
Financial Statem
ents56 -- 119

82 Dixons Retail plcAnnual Report and Accounts 2010/11
Financial Statements
Notes to the Consolidated Financial Statements continued
9 Goodwill continuedThe five year projections, which have been approved by management, have been prepared using risk adjusted strategic plans which have regard to the relative performance of competitors and knowledge of the current market together with management’s views on the future achievable growth in market share and impact of the committed initiatives under the Renewal and Transformation plan (which includes upgrade of the store network). The cash flows which derive from these five year projections include ongoing capital expenditure required to develop and upgrade the store network in order to maintain and operate the businesses and to compete in their markets. In forming the five year projections, management draws on past experience as a measure to forecast future performance.
Key assumptions used in determining the five year projections comprise the growth in sales and costs over this period. These, when combined, accordingly drive the resulting profit margins and the profit in year five of the projections which is in turn used to calculate the terminal value in the VIU calculation. Historical amounts for both the businesses under impairment review as well as from other parts of the Group are used to generate the values attributed to these assumptions.
The growth rate beyond five years is based on the GDP for the territories in which these businesses operate. The discount rates applied to cash flows are based on the Group’s weighted average cost of capital having regard to the strategic five year plans themselves already being risk adjusted to take account of specific risks in the relevant market or region.
The values attributed to these assumptions is as follows:
2011 2010
Compound annual growth
in sales
Compound annual growth
in costs
Growth rate beyond five
yearsPre-tax
discount rate
Compound annual growth
in sales
Compound annual growth
in costs
Growth rate beyond five
yearsPre-tax
discount rate
Elkjøp 4.3% 4.4% 2.6% 11.7% 6.4% 6.3% 3.0% 10.9%Unieuro 11.8% 11.1% 0.9% 12.5% 9.8% 8.7% 1.0% 12.3%PIXmania 8.7% 8.3% 1.8% 12.7% 14.2% 13.5% 1.8% 13.0%Kotsovolos 1.8% 0.9% 2.0% 11.7% 1.9% 1.6% 2.1% 12.1%
(c) SensitivitiesA sensitivity analysis had been performed on each of the base case assumptions used for assessing the goodwill with other variables held constant. Consideration of sensitivities to key assumptions can evolve from one financial year to the next. For 2010/11, the presentation of sensitivities to the compound annual growth rate in sales and costs represents such a change from the sensitivity to the operating profit in year five of the five year projections which was presented in 2009/10.
The directors have concluded that in the case of Elkjøp there are no reasonably possible changes in any key assumption which would cause the carrying amount of goodwill to exceed its value in use. In the case of Unieuro, despite the continuing success of the turnaround referred to in the Performance Review section of the Directors’ Report, it is reasonably possible that a change in a key assumption could occur. Similarly, in the case of PIXmania and Kotsovolos, it is also reasonably possible that a change in a key assumption could occur and because the value in use equals the respective carrying value after impairment, any adverse change in a key assumption would, in isolation, cause a further impairment loss to be recognised. The following sensitivities are therefore presented, which are calculated leaving all other variables constant:
decrease in the compound annual growth rate in sales; increase in the compound annual growth rate in costs; decrease in the growth rate beyond five years; and increase in the pre-tax discount rate.
In addition to the above, a further sensitivity is presented which shows the effect of a decrease in the compound annual growth rate in sales combined with an equivalent reduction in the compound annual growth rate in costs in order to reflect how sales and costs are interconnected.
2011
Change required for surplus of value in use over carrying value to erode to £nil
Surplus of value in use over
carrying value£million
Decrease in compound
annual growth in sales
Increase in compound
annual growth in costs
Decrease in compound
annual growth in sales and
costs
Decrease in growth rate beyond five
years
Increase in post-tax
discount rate
Unieuro 20.5 (0.05)% 0.05% (2.8)% (1.7)% 1.1%

Dixons Retail plc 83 Annual Report and Accounts 2010/11
Financial Statements
2011
Amount of further impairment determined by further changes in key assumptions
Surplus of value in use over
carrying value
Decrease in compound
annual growth in sales
Increase in compound
annual growth in costs
Decrease in compound
annual growth in sales and
costs
Decrease in growth rate beyond five
years
Increase in post-tax
discount rate
Percentage change (0.05)% 0.05% (1.0)% (0.1)% 0.5%
£million £million £million £million £million £million
PIXmania – 17.7 17.7 6.7 1.0 7.1Kotsovolos – 8.3 8.2 4.0 0.8 5.5
2010
Change required for surplus of value in use over carrying value to erode to £nil
Surplus of value in use over
carrying value£million
Decrease in compound
annual growth in sales
Increase in compound
annual growth in costs
Decrease in compound
annual growth in sales and costs
Decrease in growth rate beyond five
years
Increase in post-tax
discount rate
Unieuro 13.1 (0.03)% 0.03% (1.9)% (1.0)%† 0.6%PIXmania 30.0 (0.08)% 0.08% (2.4)% (1.8)% 1.1%Kotsovolos 16.9 (0.09)% 0.09% (2.2)% (1.7)% 1.1%
† The sensitivity to a decrease in the growth rate beyond five years of (1.0)% for 2009/10 represents a correction from the figure of (1.9)% which was previously disclosed in the 2009/10 financial statements.
10 Intangible assetsOther intangibles
Acquired intangibles
£million
Software (externally acquired)
£million
Software (internally
generated) £million
Sub-total £million
Total £million
CostAt 3 May 2009 88.1 133.4 67.1 200.5 288.6Additions – – 14.1 14.1 14.1Disposals – (14.0) (11.3) (25.3) (25.3)Currency retranslation (0.8) 1.6 (0.2) 1.4 0.6
At 1 May 2010 87.3 121.0 69.7 190.7 278.0Additions – 19.2 5.2 24.4 24.4Disposals – (2.0) (0.7) (2.7) (2.7)Currency retranslation 1.5 1.2 0.4 1.6 3.1
At 30 April 2011 88.8 139.4 74.6 214.0 302.8
AmortisationAt 3 May 2009 26.1 69.5 44.6 114.1 140.2Charge for the period – regular 4.6 15.1 10.7 25.8 30.4 – accelerated – 0.3 – 0.3 0.3Disposals – (13.6) (11.2) (24.8) (24.8)Currency retranslation 0.4 0.9 (0.1) 0.8 1.2
At 1 May 2010 31.1 72.2 44.0 116.2 147.3Charge for the period – regular 4.5 12.6 10.1 22.7 27.2 – accelerated – 0.1 – 0.1 0.1Non-underlying impairment – 15.6 – 15.6 15.6Disposals – (1.7) (0.7) (2.4) (2.4)Currency retranslation 0.7 1.0 0.2 1.2 1.9
At 30 April 2011 36.3 99.8 53.6 153.4 189.7
Net book valueAt 30 April 2011 52.5 39.6 21.0 60.6 113.1
At 1 May 2010 56.2 48.8 25.7 74.5 130.7
Acquired intangibles predominantly comprise brand names. Amortisation of intangibles relates to continuing operations.
Included within the carrying amount of brand names are £32.8 million and £16.5 million (2009 £35.4 million and £17.0 million) relating to the euro denominated PIXmania and Kotsovolos brand names, respectively and for which the remaining life of these assets is 10 years and 23 years, respectively. Included in net book value of other intangibles are assets under construction of £18.6 million (2009/10 £26.8 million).
Financial Statem
ents56 -- 119

Financial Statements
84 Dixons Retail plcAnnual Report and Accounts 2010/11
Notes to the Consolidated Financial Statements continued
11 Property, plant & equipment2011 2010
Land and buildings
£million
Fixtures, fittings and equipment
£millionTotal
£million
Land and buildings £million
Fixtures, fittings and equipment
£million Total
£million
CostAt beginning of period 205.8 1,250.0 1,455.8 205.0 1,207.0 1,412.0Additions 4.9 189.2 194.1 0.3 159.8 160.1Acquisitions – – – – 0.8 0.8Disposals (4.8) (127.8) (132.6) (1.3) (124.8) (126.1)Currency retranslation 3.7 16.5 20.2 1.8 7.2 9.0
At end of period 209.6 1,327.9 1,537.5 205.8 1,250.0 1,455.8
DepreciationAt beginning of period 57.8 857.0 914.8 49.4 873.0 922.4Charge for the period – regular 7.7 109.0 116.7 8.2 94.7 102.9 – accelerated – 2.0 2.0 – 3.0 3.0Non-underlying impairment – 25.0 25.0 – – –Disposals (2.3) (115.6) (117.9) (0.4) (119.0) (119.4)Currency retranslation 1.2 12.0 13.2 0.6 5.3 5.9
At end of period 64.4 889.4 953.8 57.8 857.0 914.8
Net book value at end of period 145.2 438.5 583.7 148.0 393.0 541.0
Included in net book valueLand not depreciated 19.7 – 19.7 16.2 – 16.2Assets in the course of construction 0.1 9.7 9.8 0.5 5.9 6.4Assets held under finance leases 67.9 3.3 71.2 71.4 1.9 73.3
2009/10 depreciation comprised £105.8 million and £0.1 million relating to continuing and discontinued operations, respectively.
£2.4 million of additions related to finance leases (2009/10 £nil). The leased assets are pledged as security for the related finance lease liabilities.
In 2009/10 £1.3 million of disposals of fixtures and fittings related to the disposal of Poland as described in note 28.
12 Investments in associates2011
£million2010
£million
At beginning of period 26.4 29.8Share of (loss) / profit after tax (0.4) 1.6Acquisitions – 0.6Disposals – (1.9)Non-underlying impairment (21.5) –Dividends (1.1) (4.2)Currency retranslation – 0.5
At end of period 3.4 26.4
Comprising:F-Group (40%) 2.9 25.8Other 0.5 0.6
3.4 26.4

Financial Statements
Dixons Retail plc 85 Annual Report and Accounts 2010/11
The Group’s share of post-tax results of associates is recorded as a single line in the income statement within operating results. Additional information for selected income statement and balance sheet headings for F-Group, which is incorporated in Denmark, and to which the Group’s share of 40% is applied are as follows:
2010/11 £million
2009/10 £million
Income statementRevenue 227.7 227.6(Loss) / profit after tax (1.7) 5.9
2011 £million
2010 £million
Balance sheetAssets 68.1 61.4Liabilities (35.9) (25.2)
Net assets 32.2 36.2
The non-underlying impairment relates to continued weakness in the results of F-Group which have given rise to a revision in expectations of future profitability such that the directors have concluded that an impairment charge is required. The impairment has been calculated by comparing the carrying value of the investment with the Group’s share of the value in use, which has been calculated using principles described in note 9 and using a pre-tax discount rate of 12.2%.
Investments in other associates comprise shareholdings in several different enterprises in the Nordic region, none of which are significant.
13 Inventories2011
£million2010
£million
Finished goods and goods for resale 1,002.5 1,017.5Provision for obsolete and slow moving goods (41.6) (44.9)
960.9 972.6
14 Trade and other receivables 2011 2010
NoteCurrent £million
Non-current £million
Current £million
Non-current £million
Trade debtors 243.7 9.4 259.6 7.2Provision for bad and doubtful debts (24.2) (1.7) (28.0) (0.2)
219.5 7.7 231.6 7.0Derivative financial instruments 22 3.5 18.3 3.0 25.0Other debtors 68.3 12.7 61.1 9.9Prepayments 60.6 2.8 57.7 5.0Accrued income 31.3 8.1 41.7 11.1
383.2 49.6 395.1 58.0
The majority of trade and other receivables are non-interest bearing and are generally on 30 to 90 day terms. The balance comprises both business to business receivables and consumer credit receivables with no material individual balances. The total financial assets included within trade and other receivables are £347.6 million (2010 £362.4 million). The carrying amount of trade and other receivables approximates fair value with no concentration of credit risk.
Financial Statem
ents56 -- 119

Financial Statements
86 Dixons Retail plcAnnual Report and Accounts 2010/11
Notes to the Consolidated Financial Statements continued
14 Trade and other receivables continuedThe Group’s trade debtors included the following amounts which are past due at the end of the period and for which the Group has not provided for owing to the amounts being considered recoverable:
2011 £million
2010 £million
Up to six months past due 42.9 42.4Six to 12 months past due 0.8 5.0Over 12 months past due 1.7 5.9
45.4 53.3
Movements on the provision for bad and doubtful debts are as follows:
2011 £million
2010 £million
At beginning of period 28.2 26.1Charge for the year 9.4 17.8Utilisation of provision (11.8) (16.1)Currency retranslation 0.1 0.4
At end of period 25.9 28.2
The Group does not hold any collateral as security over receivables balances.
15 Short term investments2011
£million2010
£million
Floating rate notes 2.6 3.2Money market deposits 7.9 5.3
10.5 8.5
Floating rate notes have a nominal value of £3.1 million (2010 £3.8 million) and have an average expected maturity of 9.5 years (2010 2.6 years). Money market deposits are made for varying periods of 90 to 180 days with an average maturity of 90 days (2010 104 days). The carrying amount of money market deposits approximates their fair value.
Short term investments include £7.4 million (2010 £nil) which, together with certain cash and cash equivalents, are held under trust to fund customer support agreement liabilities as disclosed in note 26.
16 Cash and cash equivalents2011
£million2010
£million
Cash at bank 195.3 161.3Money market deposits 139.4 134.4
334.7 295.7
Cash at bank earns interest at floating rates based either on daily bank deposit rates or central bank lending rates. Money market deposits are made for varying periods of up to 90 days with an average maturity of 31 days (2010 18 days). The carrying amount of money market deposits approximates their fair value.

Financial Statements
Dixons Retail plc 87 Annual Report and Accounts 2010/11
17 Borrowings2011
£million2010
£million
Current Bank overdrafts 5.6 4.9Other borrowing 130.0 98.5
135.6 103.4
Non-current 6.125% Guaranteed Bonds 2012 168.2 321.48.75% Guaranteed Notes 2015 147.1 –
315.3 321.4
Bank overdrafts are repayable on demand.
On 12 May 2010, the Group signed a new revolving credit facility agreement (the New Facility) for £360 million. The £360 million Facility came into effect on 9 July 2010 at which time it replaced the previous £400 million Sterling Committed Facility (the Old Facility) which was cancelled. The terms and covenants attaching to the New Facility are substantially the same as that for the Old Facility except that the guarantee structure comprises UK and Irish companies only, thereby aligning it more closely to the arrangements under the 6.125% Guaranteed Bonds 2012 (the 2012 Bonds). In the event of a change of control, the syndicated banks have the option to terminate the £360 million Facility.
Current borrowings include £130.0 million which was drawn down under the New Facility (2010 £95.0 million under the Old Facility) at a weighted average effective yield of 4.35% (2010 4.30%). These borrowings have an average maturity of five days (2010 nine days) and are eligible for renewal under the terms of the £360 million Facility. The New Facility has a maturity date of August 2013.
At 30 April 2011, the available undrawn amount of the New Facility was £230 million (2010 £305 million under the Old Facility). The carrying amount of current borrowings and overdrafts approximates their fair value.
On 23 July 2010, the Group conditionally accepted tenders to repurchase £140 million in nominal amount of the £300 million 2012 Bonds, subject to the successful completion of appropriate financing to fund the repurchase. This repurchase was financed by a new issue of £150 million 8.75% Guaranteed Notes due 3 August 2015 (the 2015 Notes) and for which proceeds were received on 30 July 2010.
The remaining 2012 Bonds are denominated in sterling with a nominal value of £160 million, paying interest annually, are unsecured, are guaranteed by DSG Retail Limited, a subsidiary undertaking, and are listed on the London Stock Exchange. Unless previously redeemed or purchased and cancelled they will be redeemed at par on 15 November 2012. The 2012 Bonds may be redeemed in whole or in part at their principal amount plus accrued interest by providing 30 to 60 days’ notice to the bondholder. The 2012 Bonds may also be purchased in the open market by any company within the Group. In either circumstance, the 2012 Bonds and any unmatured coupons will be cancelled and may not be re-issued or re-sold. In the event of a change of control, if the rating of the Bonds were to have fallen below a specified level, bondholders would have the right to redemption. The value of the 2012 Bonds excludes accrued interest of £4.5 million (2010 £8.4 million), included in trade and other payables.
The 2015 Notes are denominated in sterling with a nominal value of £150 million, paying interest semi-annually, and are guaranteed by a number of UK and Irish subsidiary undertakings of the Group, including DSG Retail Limited. The 2015 Notes are listed on the London Stock Exchange. Unless previously redeemed or purchased and cancelled the Notes will be redeemed at par on 3 August 2015. The 2015 Notes may be redeemed in whole or in part at their principal amount plus accrued interest by providing 30 to 60 days’ notice to the Noteholders. The 2015 Notes may also be purchased in the open market by any company within the Group. In either circumstance, the 2015 Notes and any unmatured coupons will be cancelled and may not be re-issued or re-sold. In the event of a specific change of control event, each Noteholder has an option to require Dixons Retail plc to redeem or, at the option of Dixons Retail plc, purchase (or procure the purchase of) any of the Notes held by such Noteholder at a cash price equal to 101% of their principal amount together with interest accrued. The value of the Notes excludes accrued interest of £3.2 million included in trade and other payables.
Further information concerning fair value, hedging and ensuing interest rate and currency profiles relating to the 2012 Bonds and the 2015 Notes is included in note 22.
Financial Statem
ents56 -- 119

Financial Statements
88 Dixons Retail plcAnnual Report and Accounts 2010/11
Notes to the Consolidated Financial Statements continued
18 Obligations under finance leases2011 2010
Minimum lease payments
£million
Present value of minimum
lease payments
£million
Minimum lease
payments £million
Present value of minimum
lease payments
£million
Amounts due: Within one year 9.4 8.5 8.3 7.1 In more than one year and not more than five years 33.7 28.5 33.8 26.1 In more than five years 132.9 64.1 139.7 66.8
176.0 101.1 181.8 100.0Less future finance charges (74.9) – (81.8) –
Present value of lease obligations 101.1 101.1 100.0 100.0Less amounts due within one year (3.1) (3.1) (2.4) (2.4)
Amounts due after more than one year 98.0 98.0 97.6 97.6
The majority of finance leases relate to properties in the UK where obligations are denominated in sterling and lease terms vary between 14 and 25 years. The effective borrowing rate on individual leases ranged between 4.57% and 8.15% (2010 between 4.57% and 8.15%). Interest rates are fixed at the contract date. All leases are on a fixed repayment basis and no arrangements have been entered into for contingent rental payments.
The total value of minimum sub-lease payments expected to be received under non-cancellable sub-leases was £2.7 million (2010 £nil).
The fair value of the Group’s lease obligations approximates their carrying amount.
19 Trade and other payables2011 2010
NoteCurrent
£millionNon-current
£millionCurrent £million
Non-current £million
Trade creditors 1,055.3 5.2 1,001.4 6.5Other taxation and social security 132.6 – 103.2 –Derivative financial instruments 22 6.5 78.9 9.6 74.8Other creditors 61.1 16.0 53.8 15.8Accruals 236.4 81.5 293.7 73.1Deferred income – customer support agreements 122.3 148.6 133.2 153.5Deferred income – other 30.0 0.8 11.0 2.0
1,644.2 331.0 1,605.9 325.7
Included in other creditors and accruals is £61.0 million (2010 £66.1 million) relating to other non-financial liabilities. The total financial liabilities included in trade and other payables are £1,394.5 million (2010 £1,378.2 million). The carrying amount of trade and other payables approximates their fair value.

Financial Statements
Dixons Retail plc 89 Annual Report and Accounts 2010/11
20 Provisions 2011 2010
Property related
£million
Severance and other
£million Total
£million
Property related
£million
Severance and other
£million Total
£million
At beginning of period 45.8 6.0 51.8 91.9 20.6 112.5Additions 13.5 25.7 39.2 2.3 – 2.3Utilisation (21.0) (9.9) (30.9) (41.3) (14.2) (55.5)Disposals – – – (6.1) – (6.1)Currency retranslation 0.1 0.1 0.2 (1.0) (0.4) (1.4)
At end of period 38.4 21.9 60.3 45.8 6.0 51.8
Analysed as:Current 22.5 21.9 44.4 16.3 6.0 22.3Non-current 15.9 – 15.9 29.5 – 29.5
38.4 21.9 60.3 45.8 6.0 51.8
Additions during the period relate to restructuring charges which are described further in note 4. Property related provisions mainly comprise onerous lease contracts. In 2009/10 disposals and £0.8 million of utilisation related to the Group’s Polish operations which were disposed of in that period.
Of the amounts included within non-current liabilities remaining at 30 April 2011, the majority are expected to be utilised within the next four years.
21 Retirement and other post-employment benefit obligationsNote
2011 £million
2010 £million
Retirement benefit obligations – UK 21 (b) – (d) (244.0) (263.5) – Nordics (3.3) (3.3)
(247.3) (266.8)
The Group operates a number of defined contribution and defined benefit pension schemes.
The principal scheme which operates in the UK includes a funded defined benefit section whose assets are held in a separate trustee administered fund. The scheme is valued by a qualified actuary at least every three years and contributions are assessed in accordance with the actuary’s advice so as to spread the pension cost over the normal expected service lives of members. Since 1 September 2002, the defined benefit section of the scheme has been closed to new entrants and on 30 April 2010 was closed to future accrual with automatic entry into the defined contribution section being offered to those active members of the defined benefit section at that time. Membership of the defined contribution section is offered to eligible employees.
In the Nordic region, the Group operates two funded secured defined benefit pension schemes with assets held by a life insurance company as well as an unsecured pension arrangement. In addition, contributions are made to a state pension scheme. The net movement in the obligation comprises a charge to operating profit of £0.8 million (2009/10 £1.0 million) with the remaining movements relating to the benefits paid in the period, actuarial gains / (losses) and currency retranslation.
In other territories, the Group also provides other post-employment benefits which are largely governed by statute, in particular in Italy and Greece. These benefits are unfunded.
(a) Defined contribution pension schemesThe pension charge in respect of defined contribution schemes was £12.3 million (2009/10 £5.5 million).
Financial Statem
ents56 -- 119

Financial Statements
90 Dixons Retail plcAnnual Report and Accounts 2010/11
Notes to the Consolidated Financial Statements continued
21 Retirement and other post-employment benefit obligations continued(b) UK Defined benefit pension scheme – actuarial valuation and assumptionsA full actuarial valuation of the scheme was last carried out as at 31 March 2010 and showed a shortfall of assets compared with liabilities of £239.0 million. This shortfall and the associated ‘recovery plan’ have been agreed in principle with the trustee of the scheme with formal agreement expected shortly. The proposed recovery plan based on this valuation commenced in 2010/11 with special contributions of £12.0 million which rise to £16.0 million in 2011/12, £20.0 million for 2012/13 and 2013/14 and rising approximately annually thereafter to £35.0 million by 2020/21. The next triennial valuation will be as at 31 March 2013. The Group’s regular contribution rate for 2009/10 was 12.4%, which ceased on 30 April 2010 following the closure of the scheme to future accrual as described above.
The principal actuarial assumptions as at 31 March 2010 were:
Rate per annum
Discount rate for accrued benefits – Pre retirement 6.4% – Post-retirement 5.1% – 5.3%
Rate of increase to pensions – Guaranteed Minimum Pension 0% – 2.8% – Pension in excess of Guaranteed Minimum Pension 2.4% – 4.1%
Inflation 3.7% Expected return on assets 6.6%
At 31 March 2010, the market value of the scheme’s investments was £672.0 million and, based on the above assumptions, the value of the assets was sufficient to cover 74% of the benefits accrued to members with the liabilities amounting to £911.0 million.
(c) UK Defined benefit pension scheme – IAS 19 The following summarises the components of net benefit expense recognised in the consolidated income statement, the funded status and amounts recognised in the consolidated balance sheet. The methodologies set out in IAS 19 are different from those used by the scheme actuaries in determining funding arrangements.
(i) Principal assumptions adoptedThe assumptions used in calculating the expenses and obligations are set by the directors after consultation with the independent actuaries.
Rates per annum 2011 2010
Discount rate 5.4% 5.5%Rate of increase in pensionable salaries n/a 3.6%Rate of increase in pensions in payment / deferred pensions (pre / post April 2006 accrual) 3.3% / 2.2% 3.5% / 2.3%Inflation 3.4% 3.6%
The Group uses certain demographic assumptions when calculating scheme obligations which are those underlying the last formal actuarial valuation of the scheme as at 31 March 2010. In particular, post-retirement mortality has been assumed to follow the standard mortality tables “S1” All Pensioners tables, based on the experience of Self-Administered Pension Schemes (SAPS) from 2000 to 2006 with medium cohort improvements up to 2009 and multipliers of 105% for males and 110% for females. In addition, an allowance has been made for future improvements in longevity by using the new CMI 2009 Core projections with a long term rate of improvement of 1.5% per annum for men and 1.0% per annum for women. Applying such tables results in an average expected longevity of between 87.2 years and 89.5 years for men and between 88.6 years and 90.2 years for women (2010 between 87.1 years and 87.9 years for men and between 90 years and 90.7 years for women) for those becoming 65 at the measurement date.
(ii) Amounts recognised in consolidated income statement
2010/11 £million
2009/10 £million
Current service cost (charged to underlying operating profit) – (4.7)Non-underlying curtailment – 33.4
Total operating credit – 28.7
Expected return on plan assets 44.7 37.6Interest cost on benefit obligations (50.3) (45.6)
Net other finance costs (5.6) (8.0)
Total (charged) / credited to profit before tax (5.6) 20.7
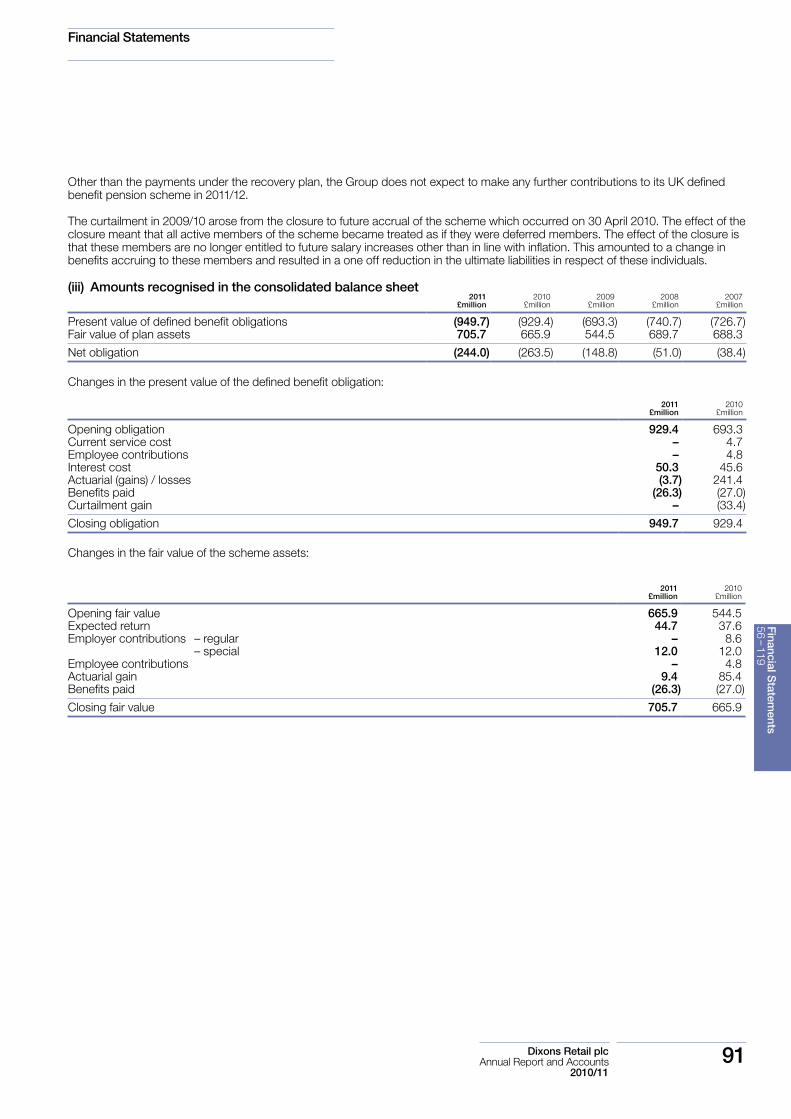
Financial Statements
Dixons Retail plc 91 Annual Report and Accounts 2010/11
Other than the payments under the recovery plan, the Group does not expect to make any further contributions to its UK defined benefit pension scheme in 2011/12.
The curtailment in 2009/10 arose from the closure to future accrual of the scheme which occurred on 30 April 2010. The effect of the closure meant that all active members of the scheme became treated as if they were deferred members. The effect of the closure is that these members are no longer entitled to future salary increases other than in line with inflation. This amounted to a change in benefits accruing to these members and resulted in a one off reduction in the ultimate liabilities in respect of these individuals.
(iii) Amounts recognised in the consolidated balance sheet2011
£million2010
£million2009
£million2008
£million2007
£million
Present value of defined benefit obligations (949.7) (929.4) (693.3) (740.7) (726.7)Fair value of plan assets 705.7 665.9 544.5 689.7 688.3
Net obligation (244.0) (263.5) (148.8) (51.0) (38.4)
Changes in the present value of the defined benefit obligation:
2011 £million
2010 £million
Opening obligation 929.4 693.3Current service cost – 4.7Employee contributions – 4.8Interest cost 50.3 45.6Actuarial (gains) / losses (3.7) 241.4Benefits paid (26.3) (27.0)Curtailment gain – (33.4)
Closing obligation 949.7 929.4
Changes in the fair value of the scheme assets:
2011
£million2010
£million
Opening fair value 665.9 544.5Expected return 44.7 37.6Employer contributions – regular – 8.6 – special 12.0 12.0Employee contributions – 4.8Actuarial gain 9.4 85.4Benefits paid (26.3) (27.0)
Closing fair value 705.7 665.9
Financial Statem
ents56 -- 119
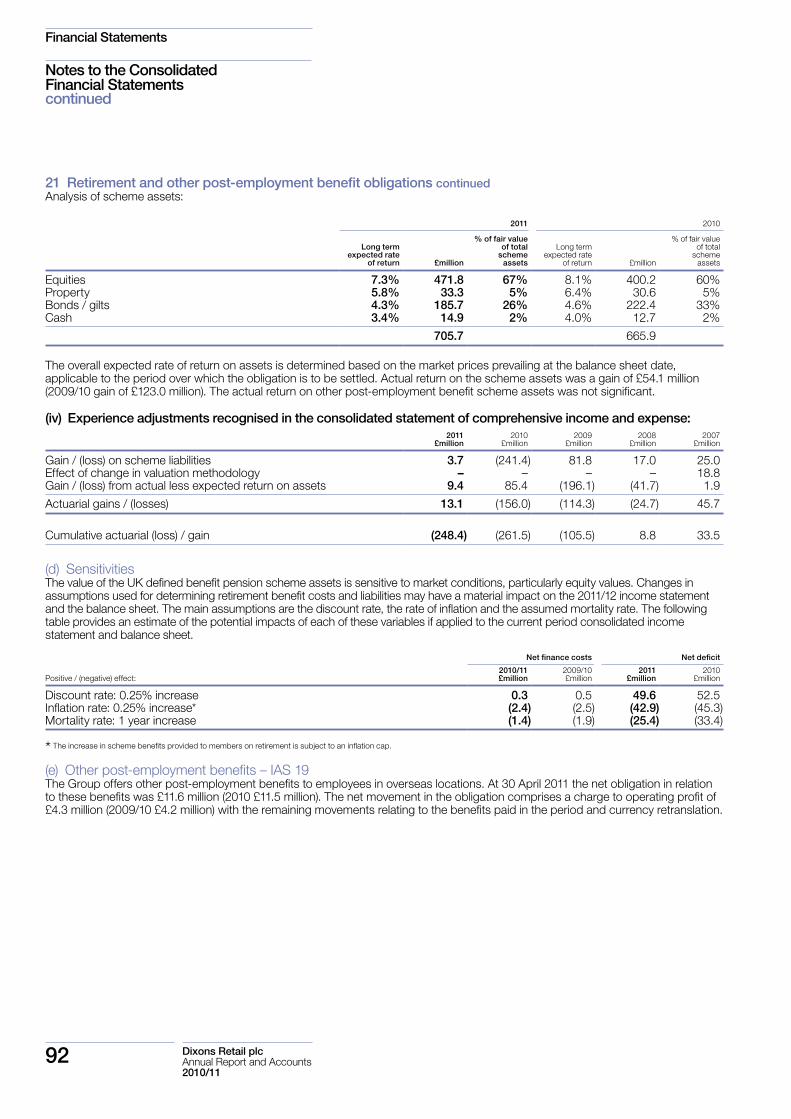
Financial Statements
92 Dixons Retail plcAnnual Report and Accounts 2010/11
Notes to the Consolidated Financial Statements continued
21 Retirement and other post-employment benefit obligations continuedAnalysis of scheme assets:
2011 2010
Long term expected rate
of return £million
% of fair value of total
scheme assets
Long term expected rate
of return £million
% of fair value of total
scheme assets
Equities 7.3% 471.8 67% 8.1% 400.2 60%Property 5.8% 33.3 5% 6.4% 30.6 5%Bonds / gilts 4.3% 185.7 26% 4.6% 222.4 33%Cash 3.4% 14.9 2% 4.0% 12.7 2%
705.7 665.9
The overall expected rate of return on assets is determined based on the market prices prevailing at the balance sheet date, applicable to the period over which the obligation is to be settled. Actual return on the scheme assets was a gain of £54.1 million (2009/10 gain of £123.0 million). The actual return on other post-employment benefit scheme assets was not significant.
(iv) Experience adjustments recognised in the consolidated statement of comprehensive income and expense:2011
£million2010
£million2009
£million2008
£million2007
£million
Gain / (loss) on scheme liabilities 3.7 (241.4) 81.8 17.0 25.0Effect of change in valuation methodology – – – – 18.8Gain / (loss) from actual less expected return on assets 9.4 85.4 (196.1) (41.7) 1.9
Actuarial gains / (losses) 13.1 (156.0) (114.3) (24.7) 45.7
Cumulative actuarial (loss) / gain (248.4) (261.5) (105.5) 8.8 33.5
(d) Sensitivities The value of the UK defined benefit pension scheme assets is sensitive to market conditions, particularly equity values. Changes in assumptions used for determining retirement benefit costs and liabilities may have a material impact on the 2011/12 income statement and the balance sheet. The main assumptions are the discount rate, the rate of inflation and the assumed mortality rate. The following table provides an estimate of the potential impacts of each of these variables if applied to the current period consolidated income statement and balance sheet.
Net finance costs Net deficit
Positive / (negative) effect:2010/11
£million2009/10 £million
2011 £million
2010 £million
Discount rate: 0.25% increase 0.3 0.5 49.6 52.5Inflation rate: 0.25% increase* (2.4) (2.5) (42.9) (45.3)Mortality rate: 1 year increase (1.4) (1.9) (25.4) (33.4)
* The increase in scheme benefits provided to members on retirement is subject to an inflation cap.
(e) Other post-employment benefits – IAS 19The Group offers other post-employment benefits to employees in overseas locations. At 30 April 2011 the net obligation in relation to these benefits was £11.6 million (2010 £11.5 million). The net movement in the obligation comprises a charge to operating profit of £4.3 million (2009/10 £4.2 million) with the remaining movements relating to the benefits paid in the period and currency retranslation.

Financial Statements
Dixons Retail plc 93 Annual Report and Accounts 2010/11
22 Financial instruments(a) Financial risk management objectives and policies Treasury operations are managed centrally within policies approved by the Board and are subject to periodic independent internal and external reviews. Group Treasury reports regularly to the Audit Committee and the Tax & Treasury Committee. The major treasury risks to which the Group is exposed relate to market risks (movements in foreign exchange and interest rates), liquidity risk and credit risk. Areas where risks are most likely to occur are evaluated regularly. The Group uses financial instruments and derivatives to manage these risks in accordance with defined policies. Throughout the period under review, in accordance with Group policy, no speculative use of derivatives, foreign exchange or other instruments was permitted.
The Group’s accounting policies in relation to derivatives are set out in note 1.16.
Exchange rate riskThe Group is exposed to exchange movements on recognised assets and liabilities, overseas earnings and translated values of foreign currency assets and liabilities. The Group’s principal translation currency exposures are the euro and Norwegian krone. Taking into account the cost of hedging, the Group’s policy is to match, in whole or in part, currency earnings with related currency costs and currency assets with currency liabilities through the use of appropriate hedging instruments.
The Group is also exposed to certain transactional currency exposures. Such exposures arise from purchases in currencies other than in the functional currency of the entity. The Group’s principal transactional currency exposures are the US dollar and euro. It is Group policy to minimise the currency exposures on such purchases through the use of appropriate hedging instruments such as forward exchange contracts. Such contracts are designed to cover exposures ranging from one month to one year.
Interest rate riskThe principal interest rate risks of the Group arise in respect of sterling cash, investments and euro and sterling borrowings. Potential exposure to interest rate movements is mitigated by the Group’s policy to match to the extent possible the profile of interest payments with that of its interest receipts. Taking into account the cost of hedging, further mitigation is achieved with interest based credit commissions received and through the use of interest based hedging instruments. Such matching is evaluated regularly to ensure that risks are minimised.
Liquidity riskIt is Group policy to maintain a balance of funds, borrowings, committed bank and other facilities sufficient to meet anticipated short term and long term financial requirements. In applying this policy the Group continuously monitors forecast and actual cash flows against the maturity profiles of financial assets and liabilities. Uncommitted facilities are used if available on advantageous terms. It is Group treasury policy to ensure that a specific level of committed facilities is always available based on forecast working capital requirements.
Cash forecasts identifying the Group’s liquidity requirements are produced and are stress tested for different scenarios including, but not limited to, reasonably possible decreases in profit margins and increases in interest rates on the Group’s borrowing facilities and the weakening of sterling against other functional currencies within the Group.
Credit riskThe Group’s exposure to credit risk on liquid funds, investments (mainly bank deposits and floating rate notes) and derivative financial instruments arises from the risk of non-performance of counterparties, with a maximum exposure equal to the book value of these assets. The Group limits its exposure to credit risk through application of Group treasury policy which restricts counterparties to those with a minimum Moody’s long term credit rating of A1, bank financial strength rating of C and short term credit rating of P1. The Group also has policies that limit the amount of credit exposure to any single financial institution. The Group continuously reviews the credit quality of counterparties, the limits placed on individual credit exposures and categories of investments. The Group does not anticipate non-performance of counterparties and believes it is not subject to material concentration of credit risk given the policies in place.
The Group’s receivable balances comprise a large number of individually small amounts from unrelated customers, spread across diverse industries and geographical areas. Concentration of risk is therefore limited and maximum exposure is equal to the book value of receivables. Sales to retail customers are made predominantly in cash or via major credit cards. It is Group policy that all customers who wish to trade on credit terms are subject to credit verification procedures. New credit customers are assessed using an external rating report which is used to establish a credit limit. Such limits are reviewed periodically on both a proactive and reactive basis, for example, when a customer wishes to place an order in excess of their existing credit limit. Receivable balances are monitored regularly with the result that the Group’s exposure to bad debts is not significant. Management therefore believe that there is no further credit risk provision required in excess of the normal provision for doubtful receivables.
Financial Statem
ents56 -- 119

Financial Statements
94 Dixons Retail plcAnnual Report and Accounts 2010/11
Notes to the Consolidated Financial Statements continued
22 Financial instruments continuedCapital risk managementIt is the Group’s policy to maintain a strong capital base so as to maintain investor, creditor and market confidence and to sustain the future development of the business. The Group is subject to certain externally imposed capital requirements in the form of banking covenants involving borrowing ratios which it met throughout the period.
The Board has delegated responsibility for routine capital expenditure to a Capital Committee, which has approval responsibility for: Group long term and budgeted capital spend, setting capital assessment criteria, new store capital approval, subsidiary company funding, business acquisitions, business disposals and contingent liabilities such as guarantees. The Committee also approves routine statutory and internal delegated powers of authority in relation to capital expenditure.
The Group considers the manner in which funds are distributed to shareholders by assessing the performance of the business, the level of available net funds and the short to medium term strategic plans concerning future capital spend as well as the need to meet banking covenants and borrowing ratios. Such assessment will influence the level of dividends payable as well as consideration from time to time of market purchases of the Group’s own shares.
The Group monitors available net funds on a regular basis and this is affected by Free Cash Flow, one of the Group’s key performance indicators as defined further in the Strategic Summary section of the Directors’ Report.
(b) Fair values of financial assets and liabilities For receivables and payables classified as financial assets and liabilities in accordance with IAS 32, fair value is estimated to be equivalent to book value. These values are shown in notes 14 and 19, respectively. The categories of financial assets and liabilities and their related accounting policy are set out in notes 1.11 and 1.15.
For those financial assets and liabilities which bear either a floating rate of interest or no interest, fair value is estimated to be equivalent to book value. These values are shown in note 22(d).
The fair value of the 2012 Bonds is £154.4 million (2010 £297.0 million). The 2012 Bonds are carried at amortised cost, plus a fair value adjustment, as a result of the fair value hedge discussed below. Excluded from the fair value is £4.5 million (2010 £8.4 million) of accrued interest which is included in trade and other payables.
The fair value of the 2015 notes is £129.8 million. The 2015 Notes are carried at amortised cost. Excluded from the fair value is £3.2 million of accrued interest which is included in trade and other payables.
Fair value of derivatives is predominantly determined using observable market data such as interest rates and foreign exchange rates. As such, derivatives are classified as ‘Level 2’ under the requirements of IFRS 7 ‘Financial Instruments: Disclosures’.
Fair values of derivatives by designation 2011
Trade and other receivables Trade and other payables
Derivatives held to:Current £million
Non-current £million
Current £million
Non-current £million
Total £million
Hedge interest rate risk – 18.3 – – 18.3Manage the currency exposure of: Financial assets and liabilities 0.6 – (2.4) – (1.8) Net investments in overseas subsidiaries – – – (78.9) (78.9) Future transactions occurring within one year 2.9 – (4.1) – (1.2)
Total derivatives 3.5 18.3 (6.5) (78.9) (63.6)
2010
Trade and other receivables Trade and other payables
Derivatives held to:Current £million
Non-current £million
Current £million
Non-current £million
Total £million
Hedge fair value interest rate risk – 25.0 – – 25.0Manage the currency exposure of: Financial assets and liabilities 1.6 – (1.2) – 0.4 Net investments in overseas subsidiaries – – – (74.8) (74.8) Future transactions occurring within one year 1.4 – (8.4) – (7.0)
Total derivatives 3.0 25.0 (9.6) (74.8) (56.4)
Included in derivative financial instruments are forward foreign currency contracts, options, interest rate swaps and currency swaps.

Financial Statements
Dixons Retail plc 95 Annual Report and Accounts 2010/11
(c) Hedging activitiesThe Group manages exposures that arise on purchases and sales denominated in foreign currencies predominantly by entering into forward foreign exchange currency contracts. It also uses swaps and options to manage its interest rate and foreign exchange translation exposure.
At 30 April 2011 the Group had interest rate swaps designated as fair value hedges for the 2012 Bonds with a notional amount of £125 million (2010 £250 million) whereby it receives a fixed interest rate of 6.125% and pays a floating rate of interest based on LIBOR.
At 30 April 2011 the Group also had interest rate swaps in place with a notional amount of £125 million (2010 £nil) whereby the Group receives a fixed interest rate of 6.125% and pays a floating rate of interest based on LIBOR, and which act as a hedge for the 2015 Notes until August 2012. These swaps are not designated as hedges under IAS 39.
In order to provide a hedge against certain euro denominated fixed asset investments and to finance working capital £200 million (2010 £200 million) has been swapped into floating rate euro borrowings bearing interest based on EURIBOR.
The Group designates financial instruments as hedges under IAS 39 as follows:
Cash flow hedgesAt 30 April 2011 the Group had forward foreign exchange contracts in place with a notional value of £415.5 million (2010 £435.6 million) that are designated and effective as cash flow hedges. These contracts are expected to cover exposures ranging from one month to one year. The fair value of these currency derivatives which have been deferred in equity amounts to a £0.9 million loss (2009/10 £7.0 million loss). In respect of contracts which matured during the period, losses of £7.4 million and losses of £6.7 million have been transferred out of equity into inventory and out of equity into operating profit, respectively (2009/10 losses of £15.1 million and gains of £3.8 million).
Hedge ineffectiveness of £0.2 million loss was recorded in the income statement (2009/10 £0.9 million loss).
Fair value hedgesAs mentioned above the Group had interest rate swaps in place for the 2012 Bonds whereby it receives a fixed interest rate of 6.125% and pays a floating rate of interest based on LIBOR. The interest rate swaps are used to hedge the exposure to changes in the fair value of £125 million (2010 £250 million) of the 2012 Bonds and have the same critical terms. The fair value of interest rate swaps entered into as fair value hedges is an asset of £9.9 million (2010 an asset of £25.0 million).
A fair value loss on the interest rate swaps of £1.3 million (2009/10 loss of £1.2 million) has been recognised in the income statement and offset by an equivalent fair value gain on the 2012 Bonds. Hedge ineffectiveness of £0.4 million loss was recorded in the income statement (2010 £nil).
Hedge of net investments in foreign operationsAt 30 April 2011 the Group had forward foreign exchange contracts and cross currency swaps in place with a notional value of £200 million (2010 £200 million) which have been designated as a hedge of the net investments in foreign operations. Gains and losses on the retranslation of these derivatives are transferred to equity to offset any gains or losses on translation of the net investments in the foreign operations. The fair value of currency derivatives entered into as net investment hedges is a £78.9 million loss (2009/10 £74.8 million loss).
No hedge ineffectiveness was recorded in the income statement (2009/10 £nil).
Financial Statem
ents56 -- 119
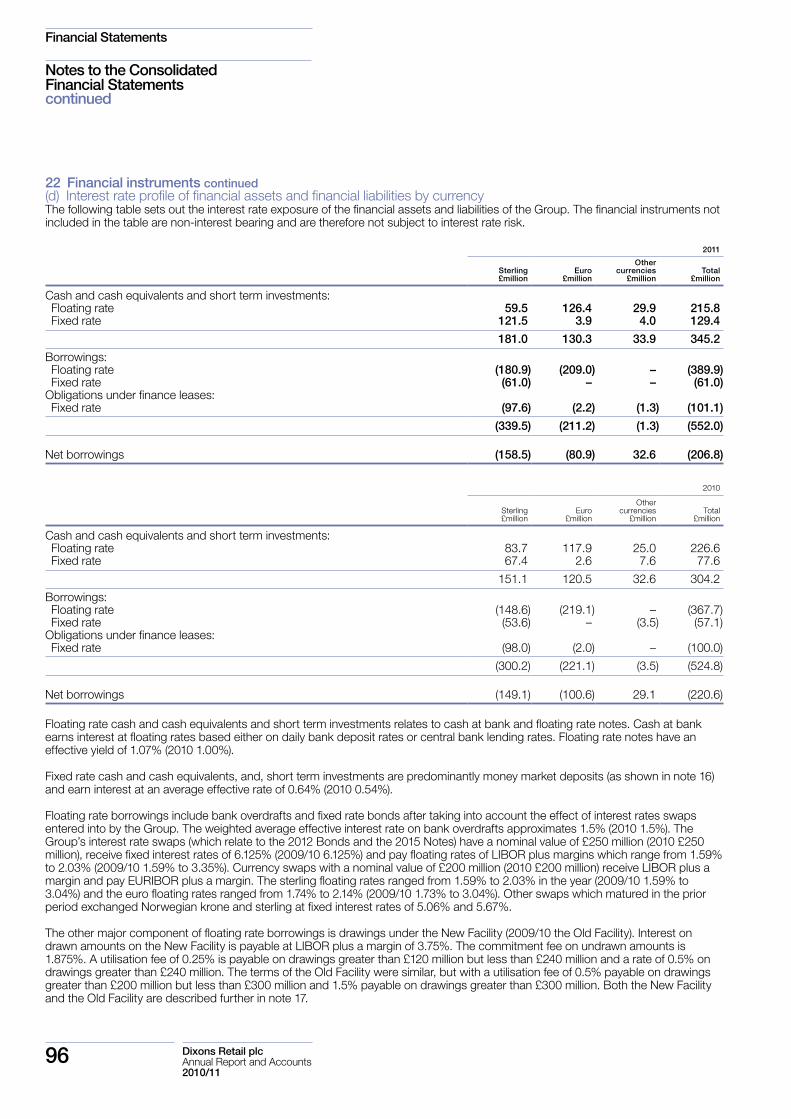
Financial Statements
96 Dixons Retail plcAnnual Report and Accounts 2010/11
Notes to the Consolidated Financial Statements continued
22 Financial instruments continued(d) Interest rate profile of financial assets and financial liabilities by currencyThe following table sets out the interest rate exposure of the financial assets and liabilities of the Group. The financial instruments not included in the table are non-interest bearing and are therefore not subject to interest rate risk.
2011
Sterling £million
Euro £million
Other currencies
£million Total
£million
Cash and cash equivalents and short term investments: Floating rate 59.5 126.4 29.9 215.8 Fixed rate 121.5 3.9 4.0 129.4
181.0 130.3 33.9 345.2
Borrowings: Floating rate (180.9) (209.0) – (389.9) Fixed rate (61.0) – – (61.0)Obligations under finance leases: Fixed rate (97.6) (2.2) (1.3) (101.1)
(339.5) (211.2) (1.3) (552.0)
Net borrowings (158.5) (80.9) 32.6 (206.8)
2010
Sterling £million
Euro £million
Other currencies
£million Total
£million
Cash and cash equivalents and short term investments: Floating rate 83.7 117.9 25.0 226.6 Fixed rate 67.4 2.6 7.6 77.6
151.1 120.5 32.6 304.2
Borrowings: Floating rate (148.6) (219.1) – (367.7) Fixed rate (53.6) – (3.5) (57.1)Obligations under finance leases: Fixed rate (98.0) (2.0) – (100.0)
(300.2) (221.1) (3.5) (524.8)
Net borrowings (149.1) (100.6) 29.1 (220.6)
Floating rate cash and cash equivalents and short term investments relates to cash at bank and floating rate notes. Cash at bank earns interest at floating rates based either on daily bank deposit rates or central bank lending rates. Floating rate notes have an effective yield of 1.07% (2010 1.00%).
Fixed rate cash and cash equivalents, and, short term investments are predominantly money market deposits (as shown in note 16) and earn interest at an average effective rate of 0.64% (2010 0.54%).
Floating rate borrowings include bank overdrafts and fixed rate bonds after taking into account the effect of interest rates swaps entered into by the Group. The weighted average effective interest rate on bank overdrafts approximates 1.5% (2010 1.5%). The Group’s interest rate swaps (which relate to the 2012 Bonds and the 2015 Notes) have a nominal value of £250 million (2010 £250 million), receive fixed interest rates of 6.125% (2009/10 6.125%) and pay floating rates of LIBOR plus margins which range from 1.59% to 2.03% (2009/10 1.59% to 3.35%). Currency swaps with a nominal value of £200 million (2010 £200 million) receive LIBOR plus a margin and pay EURIBOR plus a margin. The sterling floating rates ranged from 1.59% to 2.03% in the year (2009/10 1.59% to 3.04%) and the euro floating rates ranged from 1.74% to 2.14% (2009/10 1.73% to 3.04%). Other swaps which matured in the prior period exchanged Norwegian krone and sterling at fixed interest rates of 5.06% and 5.67%.
The other major component of floating rate borrowings is drawings under the New Facility (2009/10 the Old Facility). Interest on drawn amounts on the New Facility is payable at LIBOR plus a margin of 3.75%. The commitment fee on undrawn amounts is 1.875%. A utilisation fee of 0.25% is payable on drawings greater than £120 million but less than £240 million and a rate of 0.5% on drawings greater than £240 million. The terms of the Old Facility were similar, but with a utilisation fee of 0.5% payable on drawings greater than £200 million but less than £300 million and 1.5% payable on drawings greater than £300 million. Both the New Facility and the Old Facility are described further in note 17.
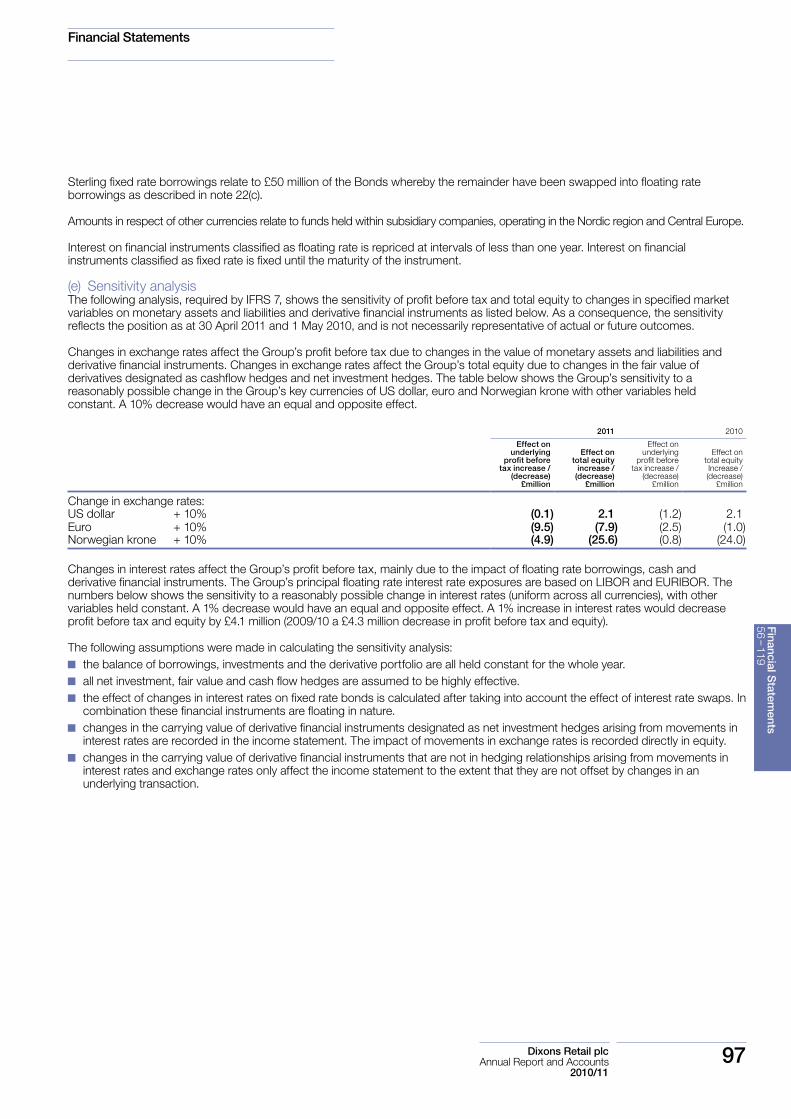
Financial Statements
Dixons Retail plc 97 Annual Report and Accounts 2010/11
Sterling fixed rate borrowings relate to £50 million of the Bonds whereby the remainder have been swapped into floating rate borrowings as described in note 22(c).
Amounts in respect of other currencies relate to funds held within subsidiary companies, operating in the Nordic region and Central Europe.
Interest on financial instruments classified as floating rate is repriced at intervals of less than one year. Interest on financial instruments classified as fixed rate is fixed until the maturity of the instrument.
(e) Sensitivity analysisThe following analysis, required by IFRS 7, shows the sensitivity of profit before tax and total equity to changes in specified market variables on monetary assets and liabilities and derivative financial instruments as listed below. As a consequence, the sensitivity reflects the position as at 30 April 2011 and 1 May 2010, and is not necessarily representative of actual or future outcomes.
Changes in exchange rates affect the Group’s profit before tax due to changes in the value of monetary assets and liabilities and derivative financial instruments. Changes in exchange rates affect the Group’s total equity due to changes in the fair value of derivatives designated as cashflow hedges and net investment hedges. The table below shows the Group’s sensitivity to a reasonably possible change in the Group’s key currencies of US dollar, euro and Norwegian krone with other variables held constant. A 10% decrease would have an equal and opposite effect.
2011 2010
Effect on underlying
profit before tax increase /
(decrease) £million
Effect on total equity
increase / (decrease)
£million
Effect on underlying
profit before tax increase /
(decrease) £million
Effect on total equity
Increase /(decrease)
£million
Change in exchange rates:US dollar + 10% (0.1) 2.1 (1.2) 2.1Euro + 10% (9.5) (7.9) (2.5) (1.0)Norwegian krone + 10% (4.9) (25.6) (0.8) (24.0)
Changes in interest rates affect the Group’s profit before tax, mainly due to the impact of floating rate borrowings, cash and derivative financial instruments. The Group’s principal floating rate interest rate exposures are based on LIBOR and EURIBOR. The numbers below shows the sensitivity to a reasonably possible change in interest rates (uniform across all currencies), with other variables held constant. A 1% decrease would have an equal and opposite effect. A 1% increase in interest rates would decrease profit before tax and equity by £4.1 million (2009/10 a £4.3 million decrease in profit before tax and equity).
The following assumptions were made in calculating the sensitivity analysis: the balance of borrowings, investments and the derivative portfolio are all held constant for the whole year. all net investment, fair value and cash flow hedges are assumed to be highly effective. the effect of changes in interest rates on fixed rate bonds is calculated after taking into account the effect of interest rate swaps. In
combination these financial instruments are floating in nature. changes in the carrying value of derivative financial instruments designated as net investment hedges arising from movements in
interest rates are recorded in the income statement. The impact of movements in exchange rates is recorded directly in equity. changes in the carrying value of derivative financial instruments that are not in hedging relationships arising from movements in
interest rates and exchange rates only affect the income statement to the extent that they are not offset by changes in an underlying transaction.
Financial Statem
ents56 -- 119

Financial Statements
98 Dixons Retail plcAnnual Report and Accounts 2010/11
Notes to the Consolidated Financial Statements continued
22 Financial instruments continued(f) Liquidity riskThe table below analyses the Group’s contractual undiscounted cash flows payable under financial liabilities (excluding finance lease liabilities, which are shown in note 18) and derivative assets and liabilities into their maturity groupings. The table includes both principal and interest flows.
2011
Contractual undiscounted cash flows
Within one year £million
In more than one year but
not more than five years
£million
In more than five years
£million Total
£million
Carrying value
£million
Non derivative financial liabilitiesBank overdrafts (5.6) – – (5.6) (5.6)Other borrowings (131.6) – – (131.6) (130.0)Trade and other payables (1,327.4) (37.0) (20.7) (1,385.1) (1,394.5)6.125% Guaranteed Bonds 2012 (9.8) (169.8) – (179.6) (168.2)8.75% Guaranteed Notes 2015 (13.1) (195.9) – (209.0) (147.1)
(1,487.5) (402.7) (20.7) (1,910.9) (1,845.4)
Derivative contracts Inflows 1,072.0 464.6 – 1,536.6 1,532.4 Outflows (1,068.4) (535.5) – (1,603.9) (1,596.0)
3.6 (70.9) – (67.3) (63.6)
2010
Contractual undiscounted cash flows
Within one year £million
In more than one year but
not more than five years
£million
In more than five years £million
Total £million
Carrying value
£million
Non derivative financial liabilitiesBank overdrafts (4.9) – – (4.9) (4.9)Other borrowings (98.6) – – (98.6) (98.5)Trade and other payables (1,317.5) (30.1) (22.1) (1,369.7) (1,378.2)6.125% Guaranteed Bonds 2012 (18.4) (337.0) – (355.4) (321.4)
(1,439.4) (367.1) (22.1) (1,828.6) (1,803.0)
Derivative contracts Inflows 892.0 242.7 – 1,134.7 1,135.9 Outflows (889.5) (301.9) – (1,191.4) (1,192.3)
2.5 (59.2) – (56.7) (56.4)
The carrying value of trade and other payables includes accrued interest on the 2012 Bonds of £4.5 million (2010 £8.4 million), interest on the 2015 Notes of £3.2 million (2010 £nil) and interest on other borrowings of £0.1 million (2010 £0.4 million).
The Group reviews regularly its available cash resources and undrawn committed borrowing facilities required to fulfil its objectives and strategy. Cash flow forecasts are prepared covering a five year period and these are updated annually. Shorter term forecasts are reviewed and monitored on a regular basis in varying degrees of granularity including, in some cases, daily review. These forecasts are used in determining both the level of borrowings required for funding purposes as well as planning for repayments of borrowings either at their maturity or sooner where practical. An appropriate level of headroom is maintained to provide against unexpected outflows or an unforeseen downturn in trading.
Further details of committed borrowing facilities are shown in note 17.

Financial Statements
Dixons Retail plc 99 Annual Report and Accounts 2010/11
23 Share capital and reserves(a) Called up share capital
2011
£million2010
£million
Authorised 4,980,252,496 (2010 4,980,252,496) ordinary shares of 2.5p each 124.5 124.5 Allotted and fully paid 3,610,350,075 (2010 3,609,937,433) ordinary shares of 2.5p each 90.3 90.2
During the period 412,642 shares (2009/10 36,403) were issued in respect of options exercised under employee share option and ownership schemes.
On 9 June 2009 the Group completed a Placing and Rights Issue which raised gross proceeds of £310.6 million, of which £100 million was raised by the Placing. The Placing comprised in aggregate 333,333,333 Placing Shares available for subscription at an issue price of 30 pence per Placing Share. The Rights Issue was made on the basis of 5 new shares for each 7 eligible shares at 14 pence per new share and comprised 1,504,125,429 shares. Aggregate issue costs of the Placing and Rights Issue were £19.3 million.
(b) Other reservesMerger
reserve £million
Capital redemption
reserve £million
Investment in own shares
£million
Hedging reserve £million
Revaluation reserve
£millionTotal
£million
At 3 May 2009 (386.1) 5.0 (2.3) (148.5) (3.0) (534.9)Other comprehensive income and expense recognised directly in equity – – – (3.2) 0.6 (2.6)
Placing and Rights Issue 245.4 – – – – 245.4Transfer (245.4) – – – – (245.4)
At 1 May 2010 (386.1) 5.0 (2.3) (151.7) (2.4) (537.5)Other comprehensive income and expense recognised directly in equity – – – (0.3) 0.1 (0.2)
At 30 April 2011 (386.1) 5.0 (2.3) (152.0) (2.3) (537.7)
The balance shown on the merger reserve arose on the group reconstruction which occurred during 1999/00. The group reconstruction took the form of introducing a new parent company above the existing group and the merger reserve represents the difference between the capital structure of the new parent company and that of the former parent company.
The Placing and Rights Issue was effected through a structure which resulted in a merger reserve arising under section 612 of the Companies Act 2006. Following receipt of the cash proceeds through the structure, the excess of the net proceeds over the nominal value of the share capital issued was transferred from the merger reserve to retained earnings.
Own shares held by the Group represent shares in the Company held by Halifax EES Trustees International Limited, further details of which are given in note 24. The 2,948,718 shares held at 30 April 2011 had a market value of £0.4 million (2010 3,579,476 shares held had a market value of £1.2 million) and their nominal value was £0.1 million (2010 £0.1 million).
(c) Cumulative foreign exchange reserves within retained earningsIncluded within retained earnings are exchange differences resulting from the translation of the results and balance sheets of overseas subsidiary undertakings, which have been charged or credited directly to equity. The following table shows a reconciliation of such amounts.
2011 £million
2010 £million
At beginning of period 333.9 288.7Currency translation movements 32.1 43.4Cumulative foreign exchange differences transferred to income statement on disposals – 1.8
At end of period 366.0 333.9
Financial Statem
ents56 -- 119

Financial Statements
100 Dixons Retail plcAnnual Report and Accounts 2010/11
Notes to the Consolidated Financial Statements continued
24 Employee share ownership trustsHalifax EES Trustees International Limited is the trustee of an employee share ownership trust (the Trust). At 30 April 2011, the Trust held shares in the Company for the purposes of satisfying potential awards to specified executive directors and senior employees under the Long Term Incentive Plan (LTIP), Performance Share Plan (PSP) and Retention and Recruitment Plan (Reward Shares) share schemes. Details of the LTIP, PSP and Reward Shares are given in the Remuneration Report in section (II) (b) (ii) of the Remuneration Report. The number of shares held by the Trust is shown in the table below.
The Company’s aim is to hedge in part its obligations under the LTIP, PSP and Reward Shares by buying shares through the Trust to meet the anticipated future liability. The anticipated liability is regularly re-assessed during the relevant performance period and additional shares are purchased when required to meet an increase in this liability. The costs of funding and administering the Trust are charged to the income statement in the period to which they relate. Shareholders’ funds are reduced by the net book value of shares held in the Trust which have not vested unconditionally.
2011 Number
2010 Number
Investment in own shares 2,948,718 3,579,476
Halifax EES Trustees International Limited has waived all dividends except for a total payment of 1 penny at the time each dividend is paid. The mid-market price of a share as at 30 April 2011 was 14.4 pence (2010 33.1 pence).
25 Share-based paymentsNote
2010/11 £million
2009/10 £million
Amounts charged / (credited) to operating profitShare-based payments – equity settled (a) 8.6 4.8 – cash settled (b) (0.6) 0.9
8.0 5.7
(a) Equity settledFollowing the Placing and Rights Issue, the exercise price and the number of outstanding equity settled share-based payments were adjusted to reflect the dilutive effect of the Rights Issue.
Share option plansEmployee Share Option Scheme (ESOS) and Executive Share Option Plan (ESOP)Options are normally granted annually to executive directors and other senior executives. In September 2008, the Group adopted a new share option plan (ESOP) which replaced the existing ESOS. Options granted after this date have only been granted under the new ESOP. The ESOS and ESOP permit making awards with a market value on the date of grant of not more than twice the recipients’ salary. Options are also granted to other employees in the UK and overseas on the basis of management grade. Vesting of options is based upon remaining in service with the Group over a three year period, unless specific circumstances apply to a participant as determined by the Remuneration Committee. Depending on grade, vesting is also dependent on the level of growth in underlying diluted earnings per share (EPS) over a three year period. Options may be exercised up to seven years after the vesting date.
Save As You Earn (SAYE)The Group offers to all of its UK and Irish employees having completed the relevant period of service, share-based savings plans whereby amounts may be contributed up to a specified limit per plan and per employee. Three year and five year plans have been offered annually, with exercise prices set at a 20% discount to the market share price on the date of grant. Exercise is conditional upon employees remaining employed by the Group for the full term of the plan unless specific circumstances apply to a participant as determined by the Remuneration Committee. Employees can choose to withdraw their contributions in full from the plan at any time, together with any interest earned.

Financial Statements
Dixons Retail plc 101 Annual Report and Accounts 2010/11
Details of equity settled share option plans outstanding during the year are as follows:
2010/11 2009/10
Note NumberWeighted average
exercise price NumberWeighted average
exercise price
At beginning of period 236,377,764 £0.31 100,219,236 £0.70Adjustment for Placing & Rights Issue – – 34,516,309 –Granted during the period (i) 106,073,741 £0.25 137,783,431 £0.22Forfeited during the period (32,658,128) £0.35 (33,028,107) £0.49Exercised during the period (ii) (412,642) £0.18 (37,385) £0.18Expired during the period (2,467,718) £2.01 (3,075,720) £3.35
At end of period (iii),(iv) 306,913,017 £0.28 236,377,764 £0.31
No options were exercisable at 30 April 2011 (2010 none).
2011 2010
(i) weighted average fair value of options granted during the period £0.16 £0.13(ii) weighted average share price at the date of exercise £0.24 £0.36(iii) weighted average remaining contractual life for options outstanding 6.4 years 5.8 years(iv) range of exercise prices for options outstanding £0.09 – £1.70 £0.09 – £2.01
The fair value of equity settled share option plans granted is estimated as at the date of grant using the Binomial or Black-Scholes option pricing models taking into account the terms and conditions upon which the instruments were granted. The following table lists the inputs to the models used for the periods ended 30 April 2011 and 1 May 2010 based on information prevailing at the date of grant.
2011 2010
Dividend yield 0% 0%Historical and expected volatility 86.2% – 87.5% 78.3% – 81.2%Risk-free interest rate 1.5% – 1.6% 2.6% – 2.7%Expected remaining life of options 3.0 – 3.25 years 3.0 yearsWeighted average share price £0.28 £0.25
The expected remaining life of the options is based on historical data and is not necessarily indicative of the actual exercise patterns that may occur. The expected volatility reflects the assumption that the historical volatility is indicative of future trends. Actual outcome may differ from this assumption.
Other equity settled share plansExecutive directors’ and senior executives’ LTIP, PSP, Reward Sacrifice and Reward Shares LTIP and PSP shares are provisionally awarded to executive directors, members of the Executive Committee and other participating senior executives and are based upon performance measured in terms of the Total Shareholder Return (TSR) achieved by the Company. Prior to 2008/09 TSR performance was based on performance over a three year period relative to the companies comprising the FTSE 100 Index. For 2008/09 and 2009/10 TSR performance has been based on a bespoke weighted index comprising UK and European retailers. For 2010/11 onwards, TSR performance has been based on constituents of the FTSE 250 Index (comprising FTSE 101-350 companies) excluding investment trusts.
Financial Statem
ents56 -- 119
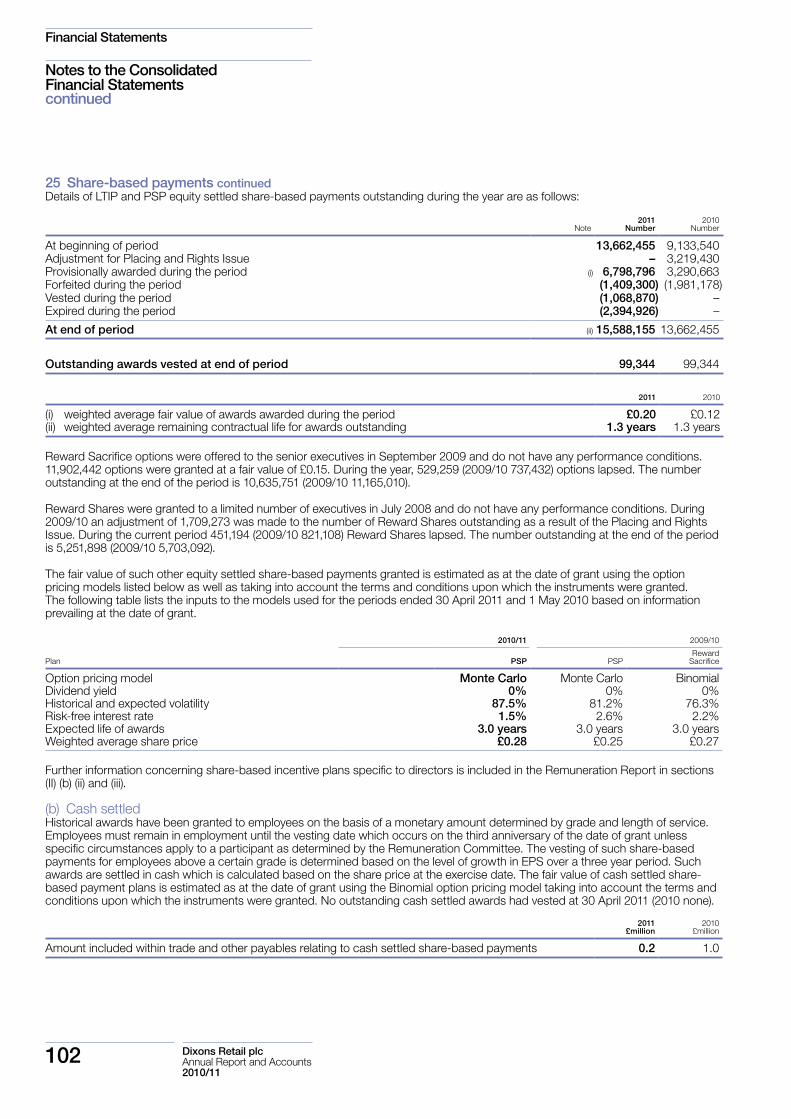
Financial Statements
102 Dixons Retail plcAnnual Report and Accounts 2010/11
Notes to the Consolidated Financial Statements continued
25 Share-based payments continuedDetails of LTIP and PSP equity settled share-based payments outstanding during the year are as follows:
Note2011
Number2010
Number
At beginning of period 13,662,455 9,133,540Adjustment for Placing and Rights Issue – 3,219,430Provisionally awarded during the period (i) 6,798,796 3,290,663Forfeited during the period (1,409,300) (1,981,178)Vested during the period (1,068,870) –Expired during the period (2,394,926) –
At end of period (ii) 15,588,155 13,662,455
Outstanding awards vested at end of period 99,344 99,344
2011 2010
(i) weighted average fair value of awards awarded during the period £0.20 £0.12(ii) weighted average remaining contractual life for awards outstanding 1.3 years 1.3 years
Reward Sacrifice options were offered to the senior executives in September 2009 and do not have any performance conditions. 11,902,442 options were granted at a fair value of £0.15. During the year, 529,259 (2009/10 737,432) options lapsed. The number outstanding at the end of the period is 10,635,751 (2009/10 11,165,010).
Reward Shares were granted to a limited number of executives in July 2008 and do not have any performance conditions. During 2009/10 an adjustment of 1,709,273 was made to the number of Reward Shares outstanding as a result of the Placing and Rights Issue. During the current period 451,194 (2009/10 821,108) Reward Shares lapsed. The number outstanding at the end of the period is 5,251,898 (2009/10 5,703,092).
The fair value of such other equity settled share-based payments granted is estimated as at the date of grant using the option pricing models listed below as well as taking into account the terms and conditions upon which the instruments were granted. The following table lists the inputs to the models used for the periods ended 30 April 2011 and 1 May 2010 based on information prevailing at the date of grant.
2010/11 2009/10
Plan PSP PSPReward
Sacrifice
Option pricing model Monte Carlo Monte Carlo BinomialDividend yield 0% 0% 0%Historical and expected volatility 87.5% 81.2% 76.3%Risk-free interest rate 1.5% 2.6% 2.2%Expected life of awards 3.0 years 3.0 years 3.0 years Weighted average share price £0.28 £0.25 £0.27
Further information concerning share-based incentive plans specific to directors is included in the Remuneration Report in sections (II) (b) (ii) and (iii).
(b) Cash settled Historical awards have been granted to employees on the basis of a monetary amount determined by grade and length of service. Employees must remain in employment until the vesting date which occurs on the third anniversary of the date of grant unless specific circumstances apply to a participant as determined by the Remuneration Committee. The vesting of such share-based payments for employees above a certain grade is determined based on the level of growth in EPS over a three year period. Such awards are settled in cash which is calculated based on the share price at the exercise date. The fair value of cash settled share-based payment plans is estimated as at the date of grant using the Binomial option pricing model taking into account the terms and conditions upon which the instruments were granted. No outstanding cash settled awards had vested at 30 April 2011 (2010 none).
2011 £million
2010 £million
Amount included within trade and other payables relating to cash settled share-based payments 0.2 1.0

Financial Statements
Dixons Retail plc 103 Annual Report and Accounts 2010/11
(c) Additional SAYE, ESOS and ESOP informationDuring the period the 106,073,741 options under the employee share option scheme were granted to 4,794 employees at exercise prices ranging between £0.20 and £0.28. At 30 April 2011 options outstanding for accounting purposes amounted to 306,913,017 shares (2010 236,377,764) analysed as follows:
SAYE ESOS & ESOP
Date of grantExercise price
Pence Number Date of grantExercise price
Pence Number
27 Feb 2006 103.54 169,717 23 Jul 2001 170.45 2,992,31026 Feb 2007 99.52 229,280 15 Feb 2002 168.23 18,49426 Feb 2008 44.54 5,273,045 22 Jul 2002 118.80 3,146,47723 Jul 2009 18.32 38,561,829 7 Feb 2003 75.59 40,6603 Aug 2010 20.23 25,898,414 11 Jul 2008 27.63 73,573,135
14 Aug 2008 41.84 1,066,59916 Dec 2008 9.20 – 10.85 6,792,00023 Jul 2009 23.95 58,929,520
28 Sep 2009 28.43 11,902,43907 Dec 2009 36.88 3,908,3333 Aug 2010 27.59 70,590,7658 Dec 2010 25.51 3,820,000
70,132,285 236,780,732
Options granted under the ESOS and ESOP can vest between three to ten years subject to performance conditions, where applicable, being met. The performance conditions applicable to these schemes are set out in section (II)(b) (iii) of the unaudited section of the Remuneration Report.
26 Notes to the cash flow statement (a) Reconciliation of operating profit to net cash inflow from operating activities
2010/11 £million
2009/10 £million
Operating (loss) / profit (180.3) 153.2Operating loss – discontinued operations 2.1 3.0
Operating (loss) / profit – continuing operations (178.2) 156.2Amortisation of acquired intangibles 4.5 4.6Amortisation of other intangibles 22.7 25.8Depreciation 116.7 102.8Share-based payment charge 8.0 5.7Share of post-tax results of associates 0.4 (1.6)Loss on disposal of property, plant & equipment 13.6 19.6Increase in non-underlying provisions 39.2 2.3Impairment and accelerated depreciation / amortisation 238.8 3.3Other non-underlying impairments and charges 17.6 –Change in pension benefits – (33.4)Utilisation of non-underlying provisions (30.9) (54.7)
Operating cash flows before movements in working capital 252.4 230.6
Movements in working capital: Decrease in inventories 16.2 14.1 Decrease in trade and other receivables 9.1 117.6 Increase / (decrease) in trade and other payables 15.1 (92.0)
40.4 39.7
Cash generated from operations – continuing operations 292.8 270.3
Financial Statem
ents56 -- 119

Financial Statements
104 Dixons Retail plcAnnual Report and Accounts 2010/11
Notes to the Consolidated Financial Statements continued
26 Notes to the cash flow statement continued(b) Analysis of net debt
2 May 2010 £million
Cash flow £million
Other non-cash movements
£million
Currency translation
£million30 April 2011
£million
Cash and cash equivalents† 295.7 37.3 – 1.7 334.7Bank overdrafts (4.9) (0.7) – – (5.6)
290.8 36.6 – 1.7 329.1
Short term investments 8.5 1.8 0.2 – 10.5
Borrowings due within one year (98.5) (31.8) – 0.3 (130.0)Borrowings due after more than one year (321.4) (5.4) 11.5 – (315.3)Obligations under finance leases (100.0) 1.5 (2.4) (0.2) (101.1)
(519.9) (35.7) 9.1 0.1 (546.4)
Net debt (220.6) 2.7 9.3 1.8 (206.8)
3 May 2009 £million
Cash flow £million
Other non-cash
movements £million
Currency translation
£million 1 May 2010
£million
Cash and cash equivalents† 192.6 102.8 – 0.3 295.7Bank overdrafts (4.8) 0.3 – (0.4) (4.9)
187.8 103.1 – (0.1) 290.8
Short term investments 9.0 (1.3) 0.8 – 8.5
Borrowings due within one year (250.1) 151.6 – – (98.5)Borrowings due after more than one year (322.5) – 1.1 – (321.4)Obligations under finance leases (101.7) 1.7 – – (100.0)
(674.3) 153.3 1.1 – (519.9)
Net debt (477.5) 255.1 1.9 (0.1) (220.6)
Restricted funds, which predominantly comprise funds held under trust to fund potential customer support agreement liabilities were £120.3 million (2010 £78.9 million). Net debt excluding restricted funds totalled £327.1 million (2010 £299.5 million).
† Cash and cash equivalents are presented as a single class of assets on the face of the consolidated balance sheet. For the purposes of the consolidated cash flow, cash and cash equivalents comprise those amounts presented on the consolidated balance sheet as cash and cash equivalents, less bank overdrafts (which are disclosed separately on the consolidated balance sheet and as disclosed in note 17).

Financial Statements
Dixons Retail plc 105 Annual Report and Accounts 2010/11
27 AcquisitionsNo significant acquisitions were made during the period. The acquisition in 2009/10 related to the exercise of a put option by a majority shareholder in an associated undertaking.
2009/10 £million
Total consideration paid for prior period acquisitions 10.6Less: cash acquired (3.6)
Total consideration, net of cash acquired 7.0
28 Discontinued operationsOn 19 May 2009 the Group disposed of its operations in Hungary to EW Electro Retail Limited for consideration of €1.
On 1 September 2009 the Group disposed of its operations in Poland to IDMSA Brokerage House, working with Mix Electronics S.A., for consideration of €1.
Loss after tax and cash flows from discontinued operations related to Hungary and Poland.
(a) Net loss on disposalsThe total net assets disposed were as follows:
Hungary £million
Poland £million
2009/10Total
£million
Inventories 6.9 8.0 14.9Cash and cash equivalents 5.0 1.2 6.2Other assets 1.3 2.4 3.7Current trade and other payables (3.2) (3.5) (6.7)Provisions (11.2) (6.1) (17.3)
Net assets disposed (1.2) 2.0 0.8Loss on disposals (1.0) (4.7) (5.7)
(2.2) (2.7) (4.9)
Consideration – – –Disposal fees and exit costs (1.2) (1.9) (3.1)Cumulative foreign exchange differences transferred from equity (1.0) (0.8) (1.8)
Consideration and costs (2.2) (2.7) (4.9)
Disposal fees mainly comprised fees payables to advisors. Exit costs mainly comprised asset write downs and impairments, together with associated termination costs.
Financial Statem
ents56 -- 119

Financial Statements
106 Dixons Retail plcAnnual Report and Accounts 2010/11
28 Discontinued operations continued(b) Loss after tax – discontinued operations
2010/11 £million
2009/10 £million
Loss after tax from discontinued operations (2.1) (3.0)Net loss on disposals – (5.7)
Loss after tax – discontinued operations (2.1) (8.7)
The loss after tax from discontinued operations relates to Hungary (2009/10 Hungary and Poland).
2010/11 2009/10
Hungary £million
Hungary £million
Poland £million
Total £million
Revenue – – 10.9 10.9Expenses (2.1) – (13.9) (13.9)
Operating loss (2.1) – (3.0) (3.0)Finance costs – – – –
Loss before tax (2.1) – (3.0) (3.0)Income tax expense – – – –
Loss after tax from discontinued operations (2.1) – (3.0) (3.0)Loss on disposal of discontinued operations – (1.0) (4.7) (5.7)Tax on loss on disposal – – – –
Loss for the period (2.1) (1.0) (7.7) (8.7)
All losses were attributable to the equity shareholders of the Company.
(c) Cash flows from discontinued operations 2010/11
£million2009/10 £million
Operating activities (0.1) (8.6)
29 Capital commitments2011
£million2010
£million
Contracted for but not provided for in the accounts 28.9 21.1
30 Contingent liabilities2011
£million2010
£million
Guarantees – 54.5Other 4.0 8.1
4.0 62.6
Guarantees in 2009/10 comprised potential obligations to financial institutions in respect of activities undertaken in the normal course of business and related to amounts utilised under letter of credit facilities. In addition to the figures shown in the table above, contingent liabilities also exist in respect of lease covenants relating to premises assigned to third parties.
Notes to the Consolidated Financial Statements continued

Financial Statements
Dixons Retail plc 107 Annual Report and Accounts 2010/11
31 Operating lease commitments2011 2010
Land and buildings
£million
Other assets
£million
Land and buildings
£million
Other assets £million
Total undiscounted future committed payments due: Within one year 379.0 8.9 381.7 8.7 Between two and five years 1,286.3 8.9 1,314.3 8.3 After five years 1,479.4 – 1,636.7 –
3,144.7 17.8 3,332.7 17.0
Operating lease commitments represent rentals payable for retail, distribution and office properties, as well as vehicles, equipment and office equipment. Contingent rentals are payable on certain retail store leases based on store revenues.
The above figures include committed payments under onerous lease contracts for which provisions or accruals exist on the balance sheet including those for closed businesses.
Total future minimum sub-lease payments expected to be received under non-cancellable sub-leases was £34.5 million (2010 £32.5 million).
32 Related party transactionsTransactions between Group undertakings, which are related parties, have been eliminated on consolidation and accordingly are not disclosed.
The Group via its registered charitable trust, the DSG international Foundation (the Foundation) made charitable donations of £5,000 (2009/10 £12,000). The Company made no charitable donations to the Foundation during the period (2009/10 £nil). The Company is the sole benefactor of the Foundation, the principal beneficiaries of which are concerned with education, community affairs, health and disabilities, heritage and the environment.
Steve Rosenblum and Jean-Emile Rosenblum, members of the Executive Committee, together with close family members and companies controlled by them, own 21.9% of PIXmania, a company controlled by the Group. In connection with their management roles with respect to PIXmania, Steve Rosenblum and Jean-Emile Rosenblum received management fees of €260,000 (£221,000) (2009/10 €258,000 (£228,000)). Steve Rosenblum and Jean-Emile Rosenblum together hold call options over additional shares in PIXmania representing 16.8% of the share capital held by the Group. The options can be exercised from 30 April 2011 and are subject to certain conditions including the achievement of targets related to earnings and certain capitalisation values of the PIXmania business. In addition to the call options, Steve Rosenblum and Jean-Emile Rosenblum have certain exit rights exercisable between July 2011 and July 2013 in relation to their holdings in PIXmania.
Steve Rosenblum and Jean-Emile Rosenblum own a building which is occupied and leased by PIXmania. During 2010/11 total rental payments of €653,000 (£553,000) (2009/10 €645,000 (£570,000)) were charged in relation to this property.
Remuneration of directors and key management personnelThe remuneration of non-executive directors, executive directors, and members of the Executive Committee, who are the key management personnel of the Group, is set out below. Further information about individual directors’ remuneration, share interests, share options, pensions and other entitlements, which form part of these financial statements, is given in sections (VI) to (X) of the directors’ Remuneration Report which are described as having been audited.
2011 £million
2010 £million
Short term employee benefits 5.1 7.9Termination benefits 0.2 –Share-based payment 2.2 0.9
33 Post balance sheet eventOn 1 June 2011, the Group announced that it had exchanged contracts with a syndicate of investors advised by Ness, Risan and Partners AS for the sale and leaseback of the Group’s Nordic distribution centre in Jönköping, Sweden. The sale and leaseback is expected to complete in June 2011 and the total cash consideration receivable on completion is expected to be approximately SEK600 million (£59 million). The estimated book value of the property as at 30 May 2011 was SEK214.5 million (approximately £21 million). The proceeds of the sale will be used for general corporate purposes, including offsetting drawings on the Group’s New Facility and for repayment of the 2012 Bonds.
Financial Statem
ents56 -- 119

Financial Statements
108 Dixons Retail plcAnnual Report and Accounts 2010/11
Company Balance Sheet
Note30 April 2011
£million1 May 2010
£million2 May 2009
£million
Non-current assets Investments C3 1,732.3 1,723.7 1,718.8Property, plant & equipment C4 – – –
1,732.3 1,723.7 1,718.8
Current assetsTrade and other receivables C5 36.5 53.0 53.9Cash and cash equivalents C6 10.3 80.7 –
46.8 133.7 53.9
Total assets 1,779.1 1,857.4 1,772.7
Current liabilities Bank overdrafts C7 (78.4) – (359.9)Borrowings C7 (130.0) (95.0) (250.0)Trade and other payables C8 (264.5) (462.9) (216.9)
(472.9) (557.9) (826.8)
Net current liabilities (426.1) (424.2) (772.9)
Non-current liabilitiesBorrowings C7 (314.3) (319.7) (320.1)
(314.3) (319.7) (320.1)
Total liabilities (787.2) (877.6) (1,146.9)
Net assets 991.9 979.8 625.8
Capital and reservesCalled up share capital C9 90.3 90.2 44.3Share premium account 169.5 169.4 169.4Investment in own shares (2.3) (2.3) (2.3)Capital reserves 5.0 5.0 5.0Profit and loss account 729.4 717.5 409.4
Equity shareholders’ funds 991.9 979.8 625.8
The financial statements were approved by the directors on 23 June 2011 and signed on their behalf by:
John Browett Nicholas CadburyChief Executive Group Finance Director

Financial Statements
Dixons Retail plc 109 Annual Report and Accounts 2010/11
Note
52 weeks ended
30 April 2011 £million
52 weeks ended
1 May 2010 £million
Operating activities Cash (utilised by) / generated from operations C10 (195.4) 243.3Income tax received – 1.2
Net cash flows from operating activities (195.4) 244.5
Investing activities Dividend received 50.0 100.0Interest received 16.0 20.4
Net cash flows from investing activities 66.0 120.4
Financing activities Issue of ordinary share capital 0.2 291.3Increase / (decrease) in borrowings due within one year 35.0 (155.0)Increase in borrowings due after more than one year 5.4 –Interest paid (60.0) (60.6)
Net cash flows from financing activities (19.4) 75.7
(Decrease) / increase in cash and cash equivalents †C10 (148.8) 440.6
Cash and cash equivalents at beginning of period †C10 80.7 (359.9)
Cash and cash equivalents at end of period †C10 (68.1) 80.7
† For the purposes of this cash flow statement, cash and cash equivalents comprise those items disclosed as “cash and cash equivalents” on the face of the balance sheet, less overdrafts, which are classified within current liabilities on the face of the balance sheet. A reconciliation to the balance sheet amounts is shown in note C10.
Company Cash Flow Statement
Financial Statem
ents56 -- 119

Financial Statements
110 Dixons Retail plcAnnual Report and Accounts 2010/11
Share capital
£million
Share premium £million
Merger reserve £million
Capital redemption
reserve £million
Investment in own shares
£million
Retained earnings £million
Total equity £million
At 3 May 2009 44.3 169.4 – 5.0 (2.3) 409.4 625.8Profit for the period – – – – – 57.8 57.8Placing and Rights Issue 45.9 – 245.4 – – – 291.3Transfer – – (245.4) – – 245.4 –Share-based payments – – – – – 4.9 4.9
At 1 May 2010 90.2 169.4 – 5.0 (2.3) 717.5 979.8Profit for the period – – – – – 3.3 3.3Ordinary shares issued 0.1 0.1 – – – – 0.2Share-based payments – – – – – 8.6 8.6
At 30 April 2011 90.3 169.5 – 5.0 (2.3) 729.4 991.9
As permitted by section 408 of the Companies Act 2006, no income statement for the Company is included in these financial statements.
On 9 June 2009, the Company completed a Placing and Rights Issue, further details of which are shown in note C9. The Placing and Rights Issue was effected through a structure which resulted in a merger reserve arising under section 612 of the Companies Act 2006. Following receipt of the cash proceeds through the structure, the excess of the net proceeds over the nominal value of the share capital issued was transferred from the merger reserve to retained earnings.
Own shares held by the Company represent shares in the Company held by Halifax EES Trustees International Limited, further details of which are given in notes 23(b) and 24 to the Group financial statements.
Company Statement of Changes in Equity

Financial Statements
Dixons Retail plc 111 Annual Report and Accounts 2010/11
C1 Accounting policiesThe financial statements have been prepared in accordance with International Financial Reporting Standards (IFRS) as adopted by the EU, IFRS issued by the International Accounting Standards Board and those parts of the Companies Act 2006 applicable to those companies reporting under IFRS. Accounting policies have been consistently applied throughout the current and preceding periods.
After making due enquiry, on the basis of current financial projections, the directors are satisfied that the Company has adequate resources to continue in operational existence for the foreseeable future. Accordingly, they continue to adopt the going concern basis in preparing the financial statements.
The Company’s accounting policies in relation to operating leases, share-based payments, translation of foreign currencies, property, plant and equipment, taxation and derivative financial instruments are set out in note 1 to the Group financial statements. Other accounting policies which are specific to the Company are set out below.
(a) Share-based payments Where the Company has granted rights to its equity to employees of subsidiary undertakings in relation to equity settled share-based payment arrangements the contribution to the subsidiary undertakings is recognised as an additional investment.
(b) InvestmentsInvestments are stated at cost, less any provision for impairment in value.
(c) Post-retirement benefits It is not practical to allocate the underlying assets and liabilities of the defined benefit section of the pension scheme to the Company on a consistent and reasonable basis. The Company has therefore accounted for its contributions to the defined benefit section of the scheme as if it were a defined contribution scheme.
The Company’s contributions to the defined contribution section of the pension scheme are charged to the income statement on an accruals basis as they become payable.
C2 Directors’ and auditors’ remunerationDetails of directors’ remuneration, share interests, share options, pensions and other entitlements, which form part of these financial statements, are given in the parts of the directors’ Remuneration Report which are described as having been audited. Fees paid to the auditors in respect of their audit of the Company were £0.1 million (2009/10 £0.1 million).
Notes to the Company Financial Statements
Financial Statem
ents56 -- 119
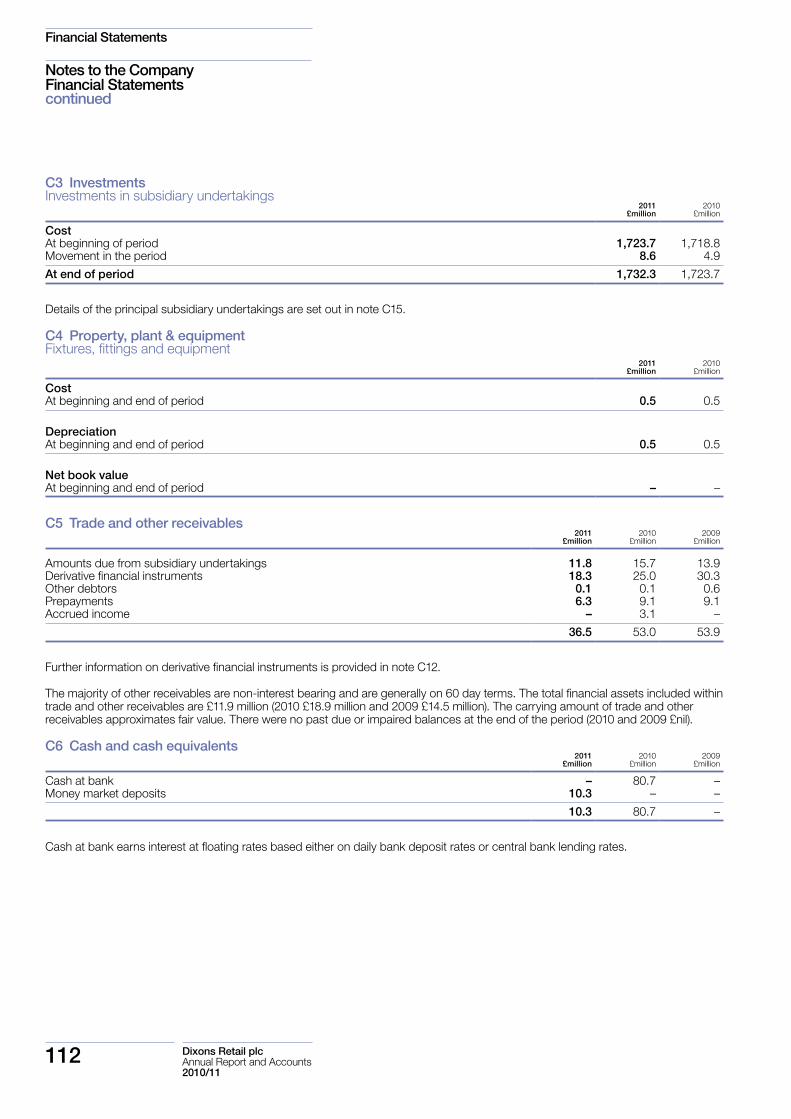
Financial Statements
112 Dixons Retail plcAnnual Report and Accounts 2010/11
Notes to the Company Financial Statements continued
C3 InvestmentsInvestments in subsidiary undertakings
2011 £million
2010 £million
CostAt beginning of period 1,723.7 1,718.8Movement in the period 8.6 4.9
At end of period 1,732.3 1,723.7
Details of the principal subsidiary undertakings are set out in note C15.
C4 Property, plant & equipment Fixtures, fittings and equipment
2011 £million
2010 £million
CostAt beginning and end of period 0.5 0.5
DepreciationAt beginning and end of period 0.5 0.5
Net book valueAt beginning and end of period – –
C5 Trade and other receivables 2011
£million2010
£million2009
£million
Amounts due from subsidiary undertakings 11.8 15.7 13.9Derivative financial instruments 18.3 25.0 30.3Other debtors 0.1 0.1 0.6Prepayments 6.3 9.1 9.1Accrued income – 3.1 –
36.5 53.0 53.9
Further information on derivative financial instruments is provided in note C12.
The majority of other receivables are non-interest bearing and are generally on 60 day terms. The total financial assets included within trade and other receivables are £11.9 million (2010 £18.9 million and 2009 £14.5 million). The carrying amount of trade and other receivables approximates fair value. There were no past due or impaired balances at the end of the period (2010 and 2009 £nil).
C6 Cash and cash equivalents 2011
£million2010
£million2009
£million
Cash at bank – 80.7 –Money market deposits 10.3 – –
10.3 80.7 –
Cash at bank earns interest at floating rates based either on daily bank deposit rates or central bank lending rates.
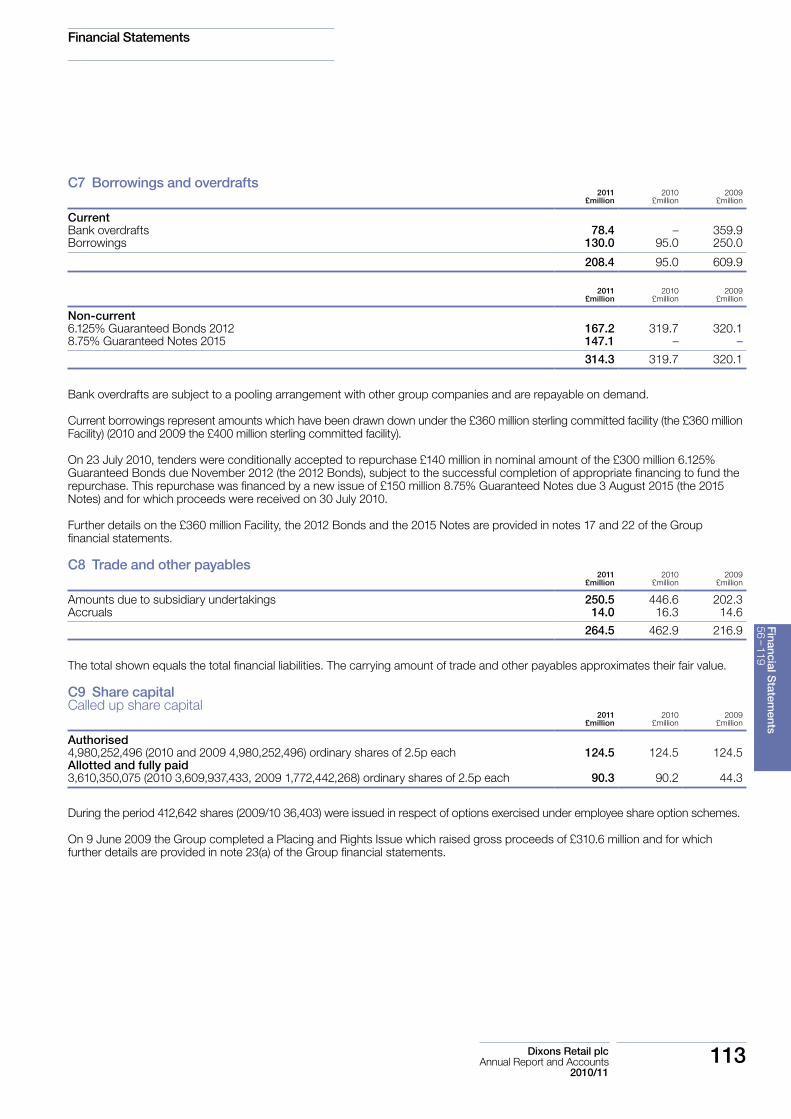
Financial Statements
Dixons Retail plc 113 Annual Report and Accounts 2010/11
C7 Borrowings and overdrafts2011
£million2010
£million2009
£million
Current Bank overdrafts 78.4 – 359.9Borrowings 130.0 95.0 250.0
208.4 95.0 609.9
2011 £million
2010 £million
2009 £million
Non-current 6.125% Guaranteed Bonds 2012 167.2 319.7 320.18.75% Guaranteed Notes 2015 147.1 – –
314.3 319.7 320.1
Bank overdrafts are subject to a pooling arrangement with other group companies and are repayable on demand.
Current borrowings represent amounts which have been drawn down under the £360 million sterling committed facility (the £360 million Facility) (2010 and 2009 the £400 million sterling committed facility).
On 23 July 2010, tenders were conditionally accepted to repurchase £140 million in nominal amount of the £300 million 6.125% Guaranteed Bonds due November 2012 (the 2012 Bonds), subject to the successful completion of appropriate financing to fund the repurchase. This repurchase was financed by a new issue of £150 million 8.75% Guaranteed Notes due 3 August 2015 (the 2015 Notes) and for which proceeds were received on 30 July 2010.
Further details on the £360 million Facility, the 2012 Bonds and the 2015 Notes are provided in notes 17 and 22 of the Group financial statements.
C8 Trade and other payables2011
£million2010
£million2009
£million
Amounts due to subsidiary undertakings 250.5 446.6 202.3Accruals 14.0 16.3 14.6
264.5 462.9 216.9
The total shown equals the total financial liabilities. The carrying amount of trade and other payables approximates their fair value.
C9 Share capitalCalled up share capital
2011 £million
2010 £million
2009 £million
Authorised4,980,252,496 (2010 and 2009 4,980,252,496) ordinary shares of 2.5p each 124.5 124.5 124.5Allotted and fully paid3,610,350,075 (2010 3,609,937,433, 2009 1,772,442,268) ordinary shares of 2.5p each 90.3 90.2 44.3
During the period 412,642 shares (2009/10 36,403) were issued in respect of options exercised under employee share option schemes.
On 9 June 2009 the Group completed a Placing and Rights Issue which raised gross proceeds of £310.6 million and for which further details are provided in note 23(a) of the Group financial statements.
Financial Statem
ents56 -- 119

Financial Statements
114 Dixons Retail plcAnnual Report and Accounts 2010/11
Notes to the Company Financial Statements continued
C10 Notes to the cash flow statement (a) Reconciliation of operating loss to net cash (outflow) / inflow from operating activities
2010/11 £million
2009/10 £million
Operating loss (3.2) (7.6)
Operating cash flows before movements in working capital (3.2) (7.6)
Movements in working capital:Decrease in trade and other receivables 6.7 2.3(Decrease) / increase in trade and other payables (198.9) 248.6
(192.2) 250.9
Cash generated from operations (195.4) 243.3
(b) Analysis of net debt2 May 2010
£millionCash flow
£million
Other non-cash movements
£million 30 April 2011
£million
Cash and cash equivalents† 80.7 (70.4) – 10.3Bank overdrafts – (78.4) – (78.4)
80.7 (148.8) – (68.1)
Borrowings due within one year (95.0) (35.0) – (130.0)Borrowings due after more than one year (319.7) (5.4) 10.8 (314.3)
(414.7) (40.4) 10.8 (444.3)
Net debt (334.0) (189.2) 10.8 (512.4)
3 May 2009 £million
Cash flow £million
Other non-cash movements
£million 1 May 2010
£million
Cash and cash equivalents† – 80.7 – 80.7Bank overdrafts (359.9) 359.9 – –
(359.9) 440.6 – 80.7
Borrowings due within one year (250.0) 155.0 – (95.0)Borrowings due after more than one year (320.1) – 0.4 (319.7)
(570.1) 155.0 0.4 (414.7)
Net debt (930.0) 595.6 0.4 (334.0)
† Cash and cash equivalents are represented as a single class of assets on the face of the balance sheet. For the purposes of the cash flow, cash and cash equivalents comprise those amounts represented on the balance sheet as cash and cash equivalents, less bank overdrafts (which are disclosed separately on the balance sheet and as disclosed in note C7).

Financial Statements
Dixons Retail plc 115 Annual Report and Accounts 2010/11
C11 Post-retirement benefitsThe Company maintains a pension scheme for eligible employees in the UK comprising both a defined benefit and defined contribution section. The defined benefit section is a funded scheme with assets held in a separate trustee administered fund. The scheme is valued by a qualified actuary at least every three years and contributions are assessed in accordance with the advice of independent qualified actuaries so as to spread the pension cost over the normal expected service lives of members. Since 1 September 2002, the defined benefit section of the scheme has been closed to new entrants and on 30 April 2010 was closed to future accrual with automatic entry into the defined contribution section being offered to those active members of the defined benefit section at that time. Membership of the defined contribution section is offered to all eligible employees.
A full actuarial valuation of the scheme was last carried out as at 31 March 2010 and showed a shortfall of assets compared with liabilities of £239.0 million. This shortfall and the associated ‘recovery plan’ have been agreed in principle with the trustee of the scheme with formal agreement expected shortly. The proposed recovery plan based on this valuation commenced in 2010/11 with special contributions of £12.0 million which rise to £16.0 million in 2011/12, £20.0 million for 2012/13 and 2013/14 and rising approximately annually thereafter to £35.0 million by 2020/21. The next triennial valuation will be as at 31 March 2013.
At 31 March 2010, the market value of the scheme’s investments was £672.0 million and, based on the above assumptions, the value of the assets was sufficient to cover 74% of the benefits accrued to members with the liabilities amounting to £911.0 million. The valuation of the defined benefit section for the purposes of IAS 19 showed a gross pension deficit (before deferred tax) of £244.0 million (2010 £263.5 million and 2009 £148.8 million). Further particulars of the scheme are disclosed in note 21 to the Group financial statements.
C12 Financial instruments (a) Financial risk management objectives and policies The Company is exposed to liquidity, interest rate, exchange, credit and capital risks and adopts the same approach to the management of these risks as the Group as set out in the Directors’ Report and in note 22 to the Group financial statements.
(b) Fair values of financial assets and liabilities For receivables and payables classified as financial assets and liabilities in accordance with IAS 32, fair value is estimated to be equivalent to book value. These values are shown in notes C5 and C8, respectively. The categories of financial assets and liabilities and their related accounting policy are set out in notes 1.11 and 1.15 to the Group financial statements.
For those financial assets and liabilities which bear either a floating rate of interest or no interest, fair value is estimated to be equivalent to book value. These values are shown in note C12 (d).
Included in trade and other receivables is £18.3 million (2010 £25.0 million and 2009 £30.3 million) relating to interest rate swaps held to hedge fair value interest rate risk. See note C12 (c) for further details.
The Company uses swaps to manage its interest rate exposure. Further details on the Company’s interest rate swaps are included in note 22(d) to the Group financial statements.
(c) Hedging activitiesThe Company manages exposures that arise on interest rates by entering into interest rate swaps. Further information on fair value hedging is set out in note 22(c) to the Group financial statements.
Financial Statem
ents56 -- 119
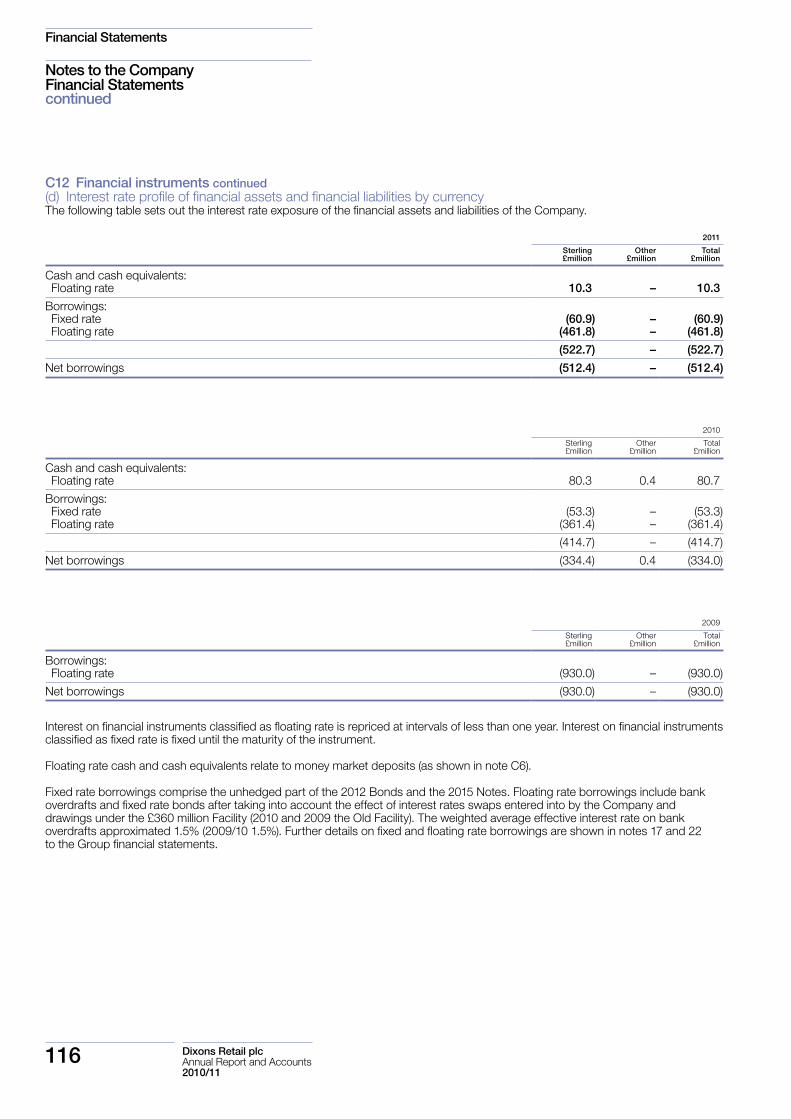
Financial Statements
116 Dixons Retail plcAnnual Report and Accounts 2010/11
Notes to the Company Financial Statements continued
C12 Financial instruments continued(d) Interest rate profile of financial assets and financial liabilities by currencyThe following table sets out the interest rate exposure of the financial assets and liabilities of the Company.
2011
Sterling £million
Other £million
Total £million
Cash and cash equivalents: Floating rate 10.3 – 10.3
Borrowings: Fixed rate (60.9) – (60.9) Floating rate (461.8) – (461.8)
(522.7) – (522.7)
Net borrowings (512.4) – (512.4)
2010
Sterling £million
Other £million
Total £million
Cash and cash equivalents: Floating rate 80.3 0.4 80.7
Borrowings: Fixed rate (53.3) – (53.3) Floating rate (361.4) – (361.4)
(414.7) – (414.7)
Net borrowings (334.4) 0.4 (334.0)
2009
Sterling £million
Other £million
Total £million
Borrowings: Floating rate (930.0) – (930.0)
Net borrowings (930.0) – (930.0)
Interest on financial instruments classified as floating rate is repriced at intervals of less than one year. Interest on financial instruments classified as fixed rate is fixed until the maturity of the instrument.
Floating rate cash and cash equivalents relate to money market deposits (as shown in note C6).
Fixed rate borrowings comprise the unhedged part of the 2012 Bonds and the 2015 Notes. Floating rate borrowings include bank overdrafts and fixed rate bonds after taking into account the effect of interest rates swaps entered into by the Company and drawings under the £360 million Facility (2010 and 2009 the Old Facility). The weighted average effective interest rate on bank overdrafts approximated 1.5% (2009/10 1.5%). Further details on fixed and floating rate borrowings are shown in notes 17 and 22 to the Group financial statements.
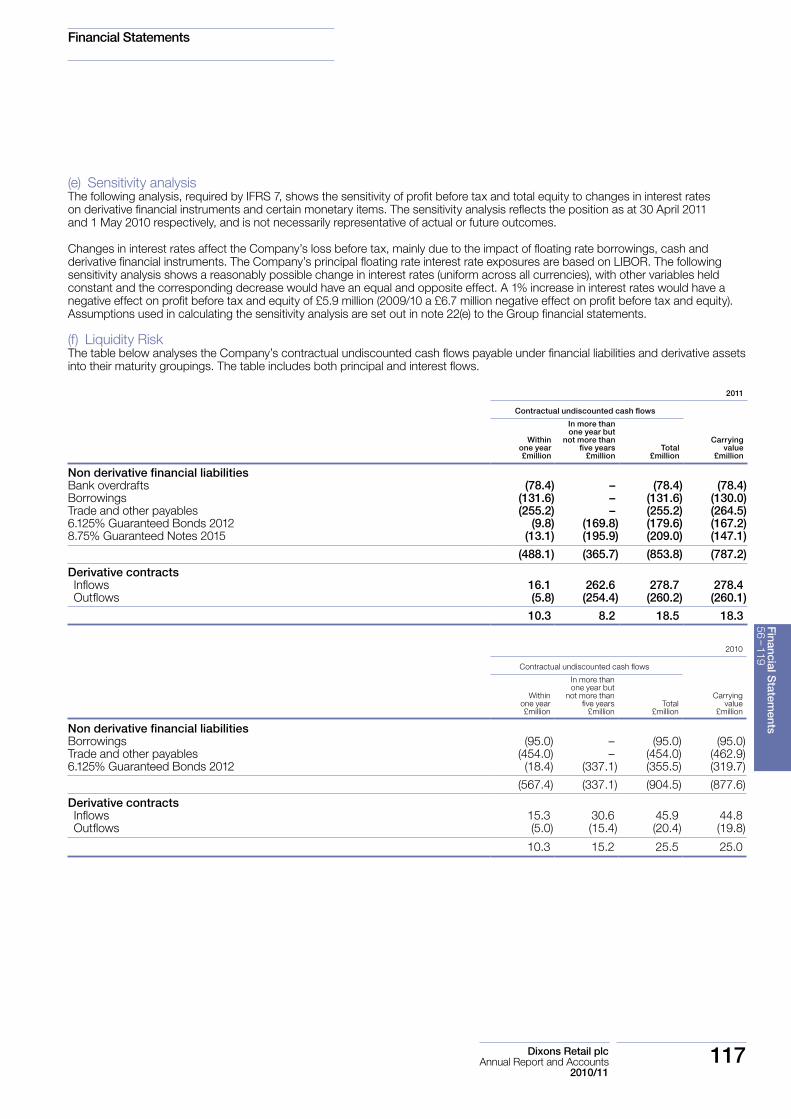
Financial Statements
Dixons Retail plc 117 Annual Report and Accounts 2010/11
(e) Sensitivity analysisThe following analysis, required by IFRS 7, shows the sensitivity of profit before tax and total equity to changes in interest rates on derivative financial instruments and certain monetary items. The sensitivity analysis reflects the position as at 30 April 2011 and 1 May 2010 respectively, and is not necessarily representative of actual or future outcomes.
Changes in interest rates affect the Company’s loss before tax, mainly due to the impact of floating rate borrowings, cash and derivative financial instruments. The Company’s principal floating rate interest rate exposures are based on LIBOR. The following sensitivity analysis shows a reasonably possible change in interest rates (uniform across all currencies), with other variables held constant and the corresponding decrease would have an equal and opposite effect. A 1% increase in interest rates would have a negative effect on profit before tax and equity of £5.9 million (2009/10 a £6.7 million negative effect on profit before tax and equity). Assumptions used in calculating the sensitivity analysis are set out in note 22(e) to the Group financial statements.
(f) Liquidity RiskThe table below analyses the Company’s contractual undiscounted cash flows payable under financial liabilities and derivative assets into their maturity groupings. The table includes both principal and interest flows.
2011
Contractual undiscounted cash flows
Within one year £million
In more than one year but
not more than five years
£millionTotal
£million
Carrying value
£million
Non derivative financial liabilitiesBank overdrafts (78.4) – (78.4) (78.4)Borrowings (131.6) – (131.6) (130.0)Trade and other payables (255.2) – (255.2) (264.5)6.125% Guaranteed Bonds 2012 (9.8) (169.8) (179.6) (167.2)8.75% Guaranteed Notes 2015 (13.1) (195.9) (209.0) (147.1)
(488.1) (365.7) (853.8) (787.2)
Derivative contracts Inflows 16.1 262.6 278.7 278.4 Outflows (5.8) (254.4) (260.2) (260.1)
10.3 8.2 18.5 18.3
2010
Contractual undiscounted cash flows
Within one year £million
In more than one year but
not more than five years
£millionTotal
£million
Carrying value
£million
Non derivative financial liabilitiesBorrowings (95.0) – (95.0) (95.0)Trade and other payables (454.0) – (454.0) (462.9)6.125% Guaranteed Bonds 2012 (18.4) (337.1) (355.5) (319.7)
(567.4) (337.1) (904.5) (877.6)
Derivative contracts Inflows 15.3 30.6 45.9 44.8 Outflows (5.0) (15.4) (20.4) (19.8)
10.3 15.2 25.5 25.0
Financial Statem
ents56 -- 119

Financial Statements
118 Dixons Retail plcAnnual Report and Accounts 2010/11
C12 Financial instruments continued2009
Contractual undiscounted cash flows
Within one year £million
In more than one year but
not more than five years
£millionTotal
£million
Carrying value
£million
Non derivative financial liabilitiesBank overdrafts (359.9) – (359.9) (359.9)Borrowings (252.1) – (252.1) (250.0)Trade and other payables (206.4) – (206.4) (216.9)6.125% Guaranteed Bonds 2012 (18.4) (355.5) (373.9) (320.1)
(836.8) (355.5) (1,192.3) (1,146.9)
Derivative contracts Inflows 15.3 45.9 61.2 70.1 Outflows (9.3) (27.8) (37.1) (39.8)
6.0 18.1 24.1 30.3
The carrying value of trade and other payables includes accrued interest on the 2012 Bonds of £4.5 million (2010 £8.4 million and 2009 £8.4 million), accrued interest of £3.2 million on the 2015 Notes (2010 £nil and 2009 £nil) and accrued interest on other borrowings of £0.1 million (2010 £0.4 million and 2009 £1.5 million).
(g) Credit riskThe Company’s exposure to credit risk is discussed in note 22 (a) to the Group financial statements. The Company’s receivable balances mainly consist of amounts due from subsidiary undertakings. Further information on the Company’s exposure to significant concentration of credit risk on receivables from subsidiary undertakings is set out in note C14.
C13 Contingent liabilities2011
£million2010
£million2009
£million
Guarantees – 54.5 75.0Other 3.1 2.8 1.8
3.1 57.3 76.8
Guarantees comprise potential obligations to financial institutions in respect of activities undertaken in the normal course of business.
C14 Related partiesDuring the period the Company entered into transactions, in the ordinary course of business, with other related parties as follows:
2010/11 £million
2009/10 £million
Subsidiary undertakings: Recharge of costs 12.9 10.1 Interest paid (6.9) (2.1) Dividends received 50.0 100.0
Recharge of costs relates to management charges for services provided to other Group companies.
Included within amounts repayable to subsidiaries are loans of £234.2 million (2010 £431.3 million and 2009 £177.7 million) with maturity of one month but renewable on a rolling basis and bear interest at 4.25% (2009/10 rates between 1.5% and 4.25%). The Company also has fixed loans of £14.2 million (2010 £14.2 million and 2009 £20.8 million) which have no maturity date and bear no interest.
Notes to the Company Financial Statements continued

Dixons Retail plc 119 Annual Report and Accounts 2010/11
Financial Statements
C15 Principal subsidiary undertakings The directors consider that to give full particulars of all group undertakings would lead to a statement of excessive length. A full list of group undertakings is attached to the latest annual return. The following information relates to those subsidiary undertakings, all of which are engaged in retail activities, whose results or financial position, in the opinion of the directors, principally affect the consolidated financial statements of the Group at 30 April 2011:
DSG international Holdings Limited – UK* El-Giganten AS – Denmark DSG Retail Ireland Limited – Ireland Elkjøp Nordic AS – Norway DSG Retail Limited – UK Gigantti OY – Finland Dixons South-East Europe A.E.V.E. – Greece (99.2%) PIXmania S.A.S. – France (77.1%) Electro World s.r.o. – Czech Republic PC City Spain S.A.U. – Spain Electro World lç ve Dıs Ticaret A.S – Turkey (60%) Unieuro S.p.A. – Italy El-Giganten AB – Sweden
* A direct subsidiary undertaking of Dixons Retail plc and a holding company
Unless otherwise indicated, principal subsidiary undertakings are wholly-owned. All Group undertakings operate in their country of incorporation.
C16 Post balance sheet event On 1 June 2011, the Company announced that the Group had exchanged contracts with a syndicate of investors advised by Ness, Risan and Partners AS for the sale and leaseback of the Group’s Nordic distribution centre in Jönköping, Sweden. The sale and leaseback is expected to complete in June 2011 and the total cash consideration receivable on completion is expected to be approximately SEK600 million (£59 million). The estimated book value of the property as at 30 May 2011 was SEK214.5 million (approximately £21 million). The proceeds of the sale will be used for general corporate purposes, including offsetting drawings on the Company’s New Facility and for repayment of the 2012 Bonds.
Financial Statem
ents56 -- 119

120 Dixons Retail plcAnnual Report and Accounts 2010/11
Shareholder Information
Consolidated income statement2010/11 £million
2009/10 £million
2008/09 £million
2007/08 £million
2006/07 £million
Underlying revenue(1) 8,154.4 8,320.0 7,955.8 8,074.8 7,531.7Percentage change (2.0)% 4.6% (1.5)% 7.2%
Underlying operating profit / EBIT(2) 127.6 133.2 95.3 214.3 279.2Underlying net finance (costs) / income(1) (42.3) (42.3) (24.7) 14.1 25.0
Underlying profit before tax(1) 85.3 90.9 70.6 228.4 304.2Percentage change (6.2)% 28.8% (69.1)% (24.9)%Business to be closed / closed businesses (8.5) (0.6) (28.6) (13.8) 2.9Acquired intangible amortisation (4.5) (4.6) (4.9) (4.4) (4.7)Net restructuring charges (17.1) (5.6) (59.1) (20.7) (55.4)Business impairment charges (251.6) – (96.1) (364.2) (115.1)Other items (24.9) – 1.9 – –Changes in pension benefits – 33.4 – – 4.7Profit on sale of investment – – – 1.7 –Net fair value remeasurements (2.8) (0.8) (7.4) (6.2) (10.5)
(Loss) / profit before tax – continuing operations (224.1) 112.7 (123.6) (179.2) 126.1Income tax expense (19.1) (46.7) (56.8) (66.0) (77.3)
(Loss) / profit after tax – continuing operations (243.2) 66.0 (180.4) (245.2) 48.8(Loss) / profit after tax – discontinued operations (2.1) (8.7) (38.9) (14.5) (46.4)
(Loss) / profit for the period (245.3) 57.3 (219.3) (259.7) 2.4
Underlying diluted earnings per share (pence)(1) 1.6p 1.5p 1.3p 7.0p 9.4ppPercentage change 6.7% 15.4% (81.4)% (25.5)%
Dividends per ordinary share (pence) – – – 5.45p 8.87p
Consolidated cash flow2010/11 £million
2009/10 £million
2008/09 £million
2007/08 £million
2006/07 £million
Underlying profit before tax(1) 85.3 90.9 70.6 228.4 304.2Business to be closed / closed businesses (loss) / profit before tax (8.5) (0.6) (28.6) (13.8) 2.9
Depreciation and amortisation 139.4 128.6 134.7 136.2 136.8Working capital movements 40.4 39.7 (285.4) 8.1 (15.1)Taxation (26.2) (31.9) (35.7) (53.1) (100.8)Net capital expenditure (221.2) (164.6) (129.9) (123.6) (108.0)Other 29.7 (34.0) (65.7) (48.9) 15.8
Free Cash Flow before restructuring items(3) 38.9 28.1 (340.0) 133.3 235.8Net restructuring and other one-off items (28.9) (45.7) (64.2) (37.6) (63.6)
Free Cash Flow(4) 10.0 (17.6) (404.2) 95.7 172.2
Closing net (debt) / funds (206.8) (220.6) (477.5) 50.1 224.9Less restricted funds(5) (120.3) (78.9) (67.6) (66.5) (111.2)
Unrestricted net (debt) / funds(5) (327.1) (299.5) (545.1) (16.4) 113.7
Five Year Record
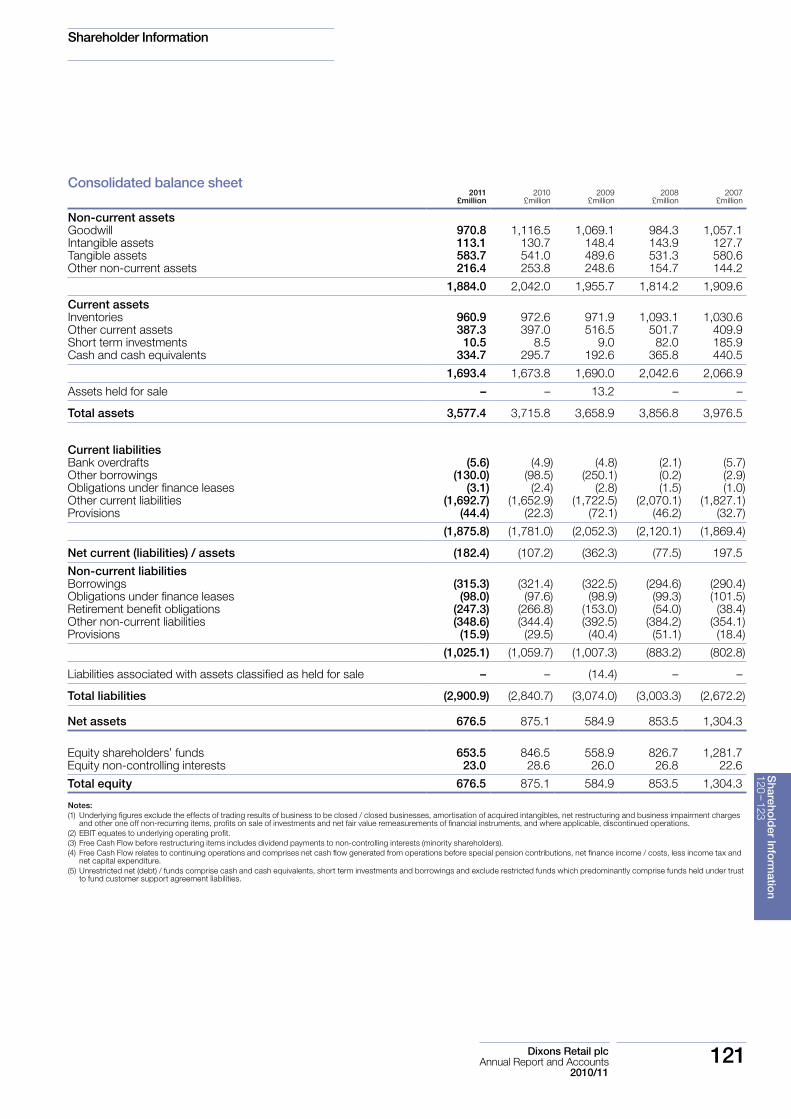
Dixons Retail plc 121 Annual Report and Accounts 2010/11
Shareholder Information
Consolidated balance sheet 2011
£million2010
£million2009
£million2008
£million2007
£million
Non-current assetsGoodwill 970.8 1,116.5 1,069.1 984.3 1,057.1Intangible assets 113.1 130.7 148.4 143.9 127.7Tangible assets 583.7 541.0 489.6 531.3 580.6Other non-current assets 216.4 253.8 248.6 154.7 144.2
1,884.0 2,042.0 1,955.7 1,814.2 1,909.6
Current assetsInventories 960.9 972.6 971.9 1,093.1 1,030.6Other current assets 387.3 397.0 516.5 501.7 409.9Short term investments 10.5 8.5 9.0 82.0 185.9Cash and cash equivalents 334.7 295.7 192.6 365.8 440.5
1,693.4 1,673.8 1,690.0 2,042.6 2,066.9
Assets held for sale – – 13.2 – –
Total assets 3,577.4 3,715.8 3,658.9 3,856.8 3,976.5
Current liabilitiesBank overdrafts (5.6) (4.9) (4.8) (2.1) (5.7)Other borrowings (130.0) (98.5) (250.1) (0.2) (2.9)Obligations under finance leases (3.1) (2.4) (2.8) (1.5) (1.0)Other current liabilities (1,692.7) (1,652.9) (1,722.5) (2,070.1) (1,827.1)Provisions (44.4) (22.3) (72.1) (46.2) (32.7)
(1,875.8) (1,781.0) (2,052.3) (2,120.1) (1,869.4)
Net current (liabilities) / assets (182.4) (107.2) (362.3) (77.5) 197.5
Non-current liabilitiesBorrowings (315.3) (321.4) (322.5) (294.6) (290.4)Obligations under finance leases (98.0) (97.6) (98.9) (99.3) (101.5)Retirement benefit obligations (247.3) (266.8) (153.0) (54.0) (38.4)Other non-current liabilities (348.6) (344.4) (392.5) (384.2) (354.1)Provisions (15.9) (29.5) (40.4) (51.1) (18.4)
(1,025.1) (1,059.7) (1,007.3) (883.2) (802.8)
Liabilities associated with assets classified as held for sale – – (14.4) – –
Total liabilities (2,900.9) (2,840.7) (3,074.0) (3,003.3) (2,672.2)
Net assets 676.5 875.1 584.9 853.5 1,304.3
Equity shareholders’ funds 653.5 846.5 558.9 826.7 1,281.7Equity non-controlling interests 23.0 28.6 26.0 26.8 22.6
Total equity 676.5 875.1 584.9 853.5 1,304.3
Notes:(1) Underlying figures exclude the effects of trading results of business to be closed / closed businesses, amortisation of acquired intangibles, net restructuring and business impairment charges
and other one off non-recurring items, profits on sale of investments and net fair value remeasurements of financial instruments, and where applicable, discontinued operations.(2) EBIT equates to underlying operating profit.(3) Free Cash Flow before restructuring items includes dividend payments to non-controlling interests (minority shareholders).(4) Free Cash Flow relates to continuing operations and comprises net cash flow generated from operations before special pension contributions, net finance income / costs, less income tax and
net capital expenditure.(5) Unrestricted net (debt) / funds comprise cash and cash equivalents, short term investments and borrowings and exclude restricted funds which predominantly comprise funds held under trust
to fund customer support agreement liabilities.
Sharehold
er Information
120 -- 123
122 Dixons Retail plcAnnual Report and Accounts 2010/11
Shareholder Information
Shareholder Information
Registered officeMaylands Avenue, Hemel Hempstead, Hertfordshire HP2 7TG. Registered No. 3847921. www.dixonsretail.com
Registrars and transfer officeCapita IRG plc, The Registry, 34 Beckenham Road, Beckenham, Kent BR3 4TU. Tel: 0871 664 0300 (calls cost 10p per minute plus network extras; lines are open 8.30am – 5.30pm Monday to Friday). If calling from abroad the number is +44 20 8639 3399. The website address is www.capitaregistrars.com
Joint brokersCitigroup Global Markets, JP Morgan Cazenove.
Shareholder enquiriesShareholders can access shareholding details over the internet via our Registrar’s secure portal at www.capitashareportal.com As well as checking name, address and shareholding details in the Shareholder Help section, you can download change of address, dividend mandate and stock transfer forms. This is a secure site and you will need to register first. Please follow the simple instructions on the website. So that the system can validate your enquiries an Investor Code is required. This is a numerical account number and can be found on your share certificate.
Share dealing serviceOnline and telephone share dealing services are available through our Registrars, providing easy access and simple to use services. There is no need to pre-register and the facilities allow you to trade in ‘real time’ and at a known price which will be given to you at the time you give your instruction. In order to deal via these facilities you will need your Investor Code (see above) as well as stating your surname, full post code and date of birth. Details of the online dealing service are available on www.capitadeal.com and the telephone dealing service is on 0871 664 0454 (calls cost 10p per minute plus network extras). Lines are open Monday to Friday 8am to 4.30pm.
JP Morgan Cazenove operates a postal share dealing service for private investors who wish to buy or sell the Company’s shares. Details are available from JP Morgan Cazenove. Tel: 020 7155 5328.
Unsolicited mailThe Company is obliged to make its share register available to third parties on payment of a prescribed fee. This may result in shareholders receiving unsolicited mail. If you wish to limit the receipt of unsolicited mail you should write to: The Mailing Preference Service, FREEPOST 22, London W1E 7ER or register on their website at www.mpsonline.org.uk
ShareGiftThe Orr Mackintosh Foundation operates a charity share donation scheme for shareholders with small parcels of shares whose value makes it uneconomic to sell them. Details of the scheme are available on the ShareGift internet site, www.sharegift.org
Financial calendarAnnual General Meeting 7 September 2011
2011/12 Interim results announcement 24 November 2011
2011/12 Interim statement publication January 2012
Alternative FormatIf you would like this Annual Report and Accounts or any other shareholder documentation in an alternative format, please send a request to [email protected] or telephone 00 44 (0)844 800 2030

Dixons Retail plc 123 Annual Report and Accounts 2010/11
Shareholder Information
Index
Page
A Accounting policies 62-68Accounting estimates & judgements 67-68Acquired intangibles 83Acquisitions 105Amortisation 72, 83Associates 84-85Audit Committee Report 44Auditors’ Remuneration 73Auditors’ Report 56
B Balance Sheet (Consolidated) 59Board of directors 36Borrowings and borrowing facilities 87Brands 02-03, 83Business Model 16-17
C Capital commitments 106Capital expenditure 72, 83-84Cash and cash equivalents 60, 86, 104Cash flow statement (Consolidated) 60Charitable donations 39Community 35Contingent liabilities 106Corporate Governance Report 40-43Customer Plan 05-07
D Deferred tax 78-79Depreciation 72, 84Directors’ remuneration 50Directors’ interests 49-51, 53Discontinued operations 105-106
E Earnings / loss per share 80Employee numbers 02-03, 77Employees 34Environment 33-34Executive Committee 37
Page
F Finance costs / income 76Finance leases 88Financial instruments 93-98Five Year Record 120-121Free Cash Flow 30-31, 60Funding 30-31, 87
G Going concern 39Goodwill 81, 83
H Health and Safety 34-35
I Impairment 74-75, 81-82Income statement (Consolidated) 57Intangible assets 83Inventories 85
K Key Performance Indicators 19
L LTIP / Long term incentive plan 47-48
N Nominations Committee Report 45Non-underlying items 62, 74-75
O Operating lease charges 73Operating lease commitments 107Outlook 07, 18
P Pensions 31, 89-92PSP / Performance share plan 47-48Placing and Rights Issue 99Post balance sheet events 107Property losses 31, 69-70Property, plant & equipment 84Provisions 89
Page
R Related party transactions 107Remuneration Report 46-54Reward Shares 51, 101-102Reward Sacrifice 101-102Risk factors 20-22
S Segmental analysis 68-72Selling space 02-03Share based payments 100-103Share capital 99Shareholder information 120-122Short term investments 86Statement of comprehensive income and expense 58Store numbers 02-03Subsidiary undertakings 119
T Tax 77-79TSR (Total Shareholder Return) 19, 50Trade & other payables 88Trade & other receivables 85-86Treasury policy 93-94
U Underlying definition 62
Sharehold
er Information
120 -- 123

124 Dixons Retail plcAnnual Report and Accounts 2010/11
Shareholder Information
Notes

Dixons Retail plcAnnual Report and Accounts 2010/11
Dixons Retail plc is a specialist electrical retailer and services company which sells consumer electronics, personal computers, domestic appliances, photographic equipment, communication products and related services.
We are one of Europe’s leading specialist electrical retailing groups. We trade through over 1,200 stores and online, spanning 28 countries and we employ 38,000 people.
www.dixonsretail.com
Designed and produced by MerchantCantos www.merchantcantos.com
Photography by Dennis Davis: Dennis Davis Photography and Dixons Retail plc Digital Studio.
Printed at St Ives Westerham Press Ltd, ISO9001, ISO14001, FSC certified and CarbonNeutral
The papers used in this report are Revive 50:50 Silk and Revive 50:50 Offset. They are produced from 50% recycled fibre from both pre- and post-consumer waste sources, together with 50% Elemental Chlorine Free fibre from well-managed forests independently certified according to the rules of the Forest Stewardship Council. The inks used are all vegetable oil based.
Dixons R
etail plc Annual R
eport and Accounts 2010/11
Dixons Retail plc Maylands AvenueHemel HempsteadHertfordshireHP2 7TG
Tel 0844 800 2030www.dixonsretail.com
Dixons Retail plc Annual Report and Accounts 2010/11
Bringing life to technology


![Neutral citation [2019] CAT 5...WLG (UK) LLP) on behalf of DSG Retail Ltd, Dixons Retail Group Ltd and Dixons Carphone PLC, the Claimants in Cases 1236/5/7/15 and 1265/5/716 Mr Thomas](https://img.dokumen.tips/doc/110x75/5fa970a032687116557d98e6/neutral-citation-2019-cat-5-wlg-uk-llp-on-behalf-of-dsg-retail-ltd-dixons.jpg)