Embed Size (px)
Citation preview

University of Alberta Hospital Antibiogram for 2007 and 2008
Division of Medical Microbiology
Department of Laboratory Medicine and Pathology
This material is supported in part by unrestricted educational grants from: Abbott, Bayer HealthCare, Merck Frosst, Roche Diagnostics, and Wyeth


2
Page Introduction ……………….……………………………………………………………………….……………………………... 4 Antibiogram Resistance Trends ……………………………………………………………………..……………………….…... 5 List of Medically Relevant Microorganisms …………………….………………………………..……………………………... 7 Abbreviations for Antimicrobial Agents ………………………………………………………………..……………………….. 8 2008 Antibiogram Gram-negative Tables
Acinetobacter baumanii complex…………………………………………………………………………………………. 10 Burkholderia cepacia complex…...……………………………………………………………………………………….. 10 Citrobacter freundii complex ……………………………………………………………………………………………... 11 Citrobacter koseri …………………………………………………………………………………………........................ 11 Enterobacter aerogenes …………………………………………………………………………………………………... 12 Enterobacter cloacae ……………………………………………………………………………………………….…….. 12 Escherichia coli (including ESBLs) …………………………………………………………………………….………... 13 Haemophilus influenzae ………………………………………………………………………………………….……….. 14 Klebsiella species (including ESBLs ) ………………………………………………………………………….………… 15 Morganella morganii ………………………………………………………………………………………….………….. 16 Proteus mirabilis …………………………………………………………………………………………….……………. 16 Pseudomonas aeruginosa ...………………………………………………………………………………………………. 17 Serratia marcesens ……...………………………………………………………………………………………………… 18 Stenotrophomonas maltophilia .………………………….………………………………………….……………………. 18
Gram-positive Tables Enterococcus species (including VRE) …………………………………………………………………………………... 19 Staphylococcus aureus (methicillin susceptible; MSSA) ………………………………………………………………… 20 Staphylococcus aureus (methicillin resistant; MRSA) …………………………………………………………………… 21 Staphylococcus species, coagulase-negative ……………………………………………………………………………... 22 Staphylococcus lugdunensis ……………….………………………..……………………………………………………. 22 Viridans group streptococci ………………………………………………………………………………….…………… 23 Streptococcus anginosis group …………………………………………………………………………………………… 23 Streptococcus pneumoniae ………………………………………………………………………………………………... 24 Streptococcus pyogenes …………………………………………………........................................................................... 24
Candida species ………………………………………………………………………………………………………..…………. 25
Table of Contents

3
2007 Antibiogram Gram-negative Tables
Page
Acinetobacter baumanii complex…………………………………………………………………………………………. 27 Burkholderia cepacia complex…...……………………………………………………………………………………….. 27 Citrobacter freundii complex ……………………………………………………………………………………………... 28 Citrobacter koseri …………………………………………………………………………………………...……………. 28 Enterobacter aerogenes ……………………………………………………………………………………..……………. 29 Enterobacter cloacae ………………………………………………………………………………………..……………. 29 Escherichia coli (including ESBLs) ………………………………………………………………………...……………. 30 Haemophilus influenzae ……………………………………………………………………………………..……………. 31 Klebsiella species (including ESBLs ) ……………………………………………………………………………………. 32 Morganella morganii ………………………………………………………………………………………..……………. 33 Proteus mirabilis …………………………………………………………………………………………….……………. 33 Pseudomonas aeruginosa ...………………………………………………………………………………….…………… 34 Serratia marcesens ……..…………………………………………………………………………………………………. 35 Stenotrophomonas maltophilia …..……………………….………………………………………………….……………. 35
Gram-positive Tables Enterococcus species (including VRE) ……………………………………………………………………...…………… 36 Staphylococcus aureus (methicillin susceptible; MSSA) ………………………………………………………………… 37 Staphylococcus aureus (methicillin resistant; MRSA) …………………………………………………………………… 38 Staphylococcus species, coagulase-negative ………………………………………………………………...……………. 39 Staphylococcus lugdunensis ……………….………………………..……………………………………….……………. 39 Viridans group streptococci ………………………………………………………………………………………………. 40 Streptococcus anginosis group ……………………………………………………………………………………………. 40 Streptococcus pneumoniae …………………………………………………………………………………...…………… 41 Streptococcus pyogenes ….………………………………………………......................................................……………. 41
Candida species …………………………………………………………………………………………………….……………. 42
Table of Contents

4
Introduction The antibiogram is an annual cumulative report of the antimicrobial susceptibility rates of common microbial pathogens to antimicrobials available on the hospital formulary. This report represents the local microbial epidemiology of the University of Alberta (UAH), Stollery Childrens’ Hospital, and the Cross Cancer Institute (CCI), and is intended to be used as a guideline to direct empiric antimicrobial therapy. Antibiograms are generated by the compilation of susceptibility results from all ‘first’ clinical isolates of a specific pathogen recovered from an individual patient per calendar year. That is, only the first isolate within a 14-day period, regardless of specimen type or body site, is selected for analysis. The rationale for this referral period is based on the need to represent ‘wild-type’ susceptibility profiles and avoid over-representing antimicrobial resistance that may develop de novo during a patient’s prolonged hospital stay. Susceptibility rates for patient groups (ie. age or ward location) represented by less than 10 isolates of a pathogen were not calculated due to the limited statistical relevance; in fact, rates derived from less than 30 isolates are of limited statistical value and should be interpreted carefully. This antibiogram handbook contains summary data for the years 2008 and 2007, presented in that order. Notable antimicrobial resistance trends are summarized below and are also included as footnotes after appropriate antibiogram tables. A tremendous amount of effort goes into the creation of this document each year and the effort of the entire medical microbiology technologist staff is truly appreciated. In particular, we would like to acknowledge Linda Rosmus, Joyce Rushton, Stacey Vachon, and Sophie Chlebek, for their sizable contributions. Also, we would like to acknowledge Dr. Darren Hudson, UAH, for taking a lead role in the development of turnkey electronic approach to the antibiogram data analyses that has significantly improved the time and effort required for the production of this document. The antibiogram is available in PDF format on the Department of Laboratory Medicine and Pathology websites below: http://www.lmp.ualberta.ca/divisions/microbiology.htm http://www.capitalhealth.ca/AboutUs/OurOrganization/AreasofService/LaboratoryMedicine/LabMedicine/LaboratoryNews/default.htm A CD-ROM application for handheld electronic devices has also been made available through Dr. Darren Hudson, RADogs Productions Inc., and the kind support of Wyeth. Inquiries and feedback may be directed to Dr. Jeff Fuller, Division of Medical Microbiology, at [email protected].
5
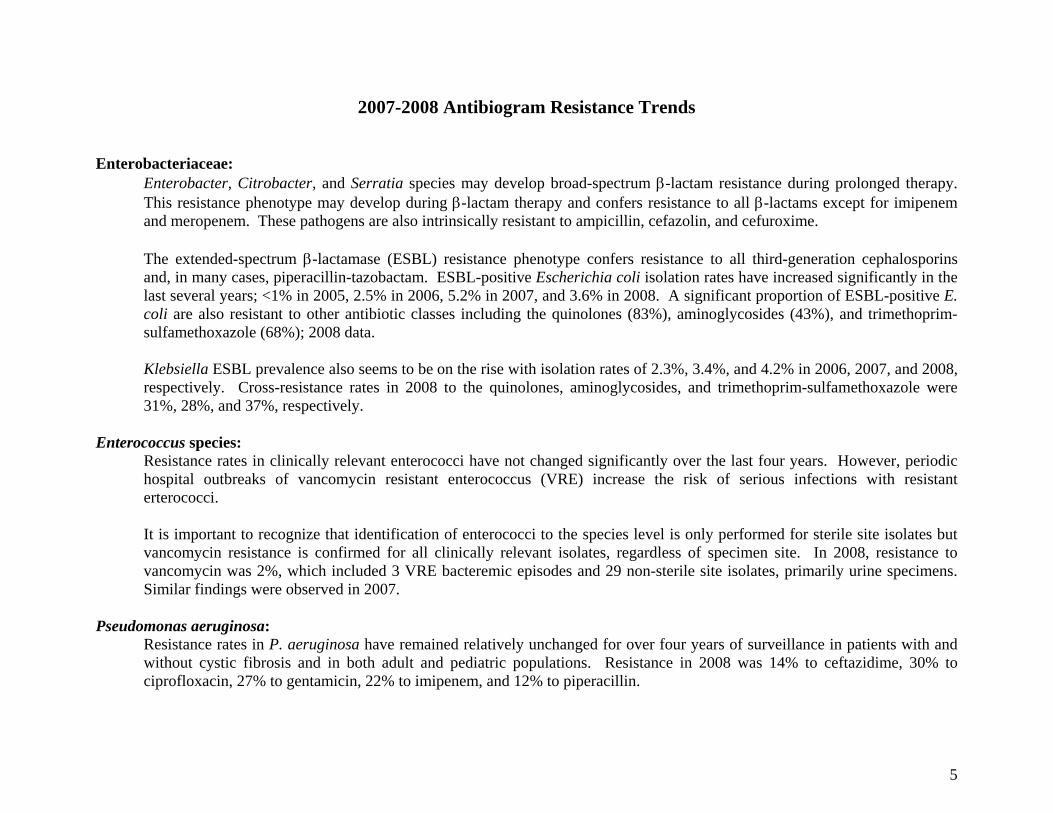
2007-2008 Antibiogram Resistance Trends Enterobacteriaceae:
Enterobacter, Citrobacter, and Serratia species may develop broad-spectrum β-lactam resistance during prolonged therapy. This resistance phenotype may develop during β-lactam therapy and confers resistance to all β-lactams except for imipenem and meropenem. These pathogens are also intrinsically resistant to ampicillin, cefazolin, and cefuroxime. The extended-spectrum β-lactamase (ESBL) resistance phenotype confers resistance to all third-generation cephalosporins and, in many cases, piperacillin-tazobactam. ESBL-positive Escherichia coli isolation rates have increased significantly in the last several years; <1% in 2005, 2.5% in 2006, 5.2% in 2007, and 3.6% in 2008. A significant proportion of ESBL-positive E. coli are also resistant to other antibiotic classes including the quinolones (83%), aminoglycosides (43%), and trimethoprim-sulfamethoxazole (68%); 2008 data. Klebsiella ESBL prevalence also seems to be on the rise with isolation rates of 2.3%, 3.4%, and 4.2% in 2006, 2007, and 2008, respectively. Cross-resistance rates in 2008 to the quinolones, aminoglycosides, and trimethoprim-sulfamethoxazole were 31%, 28%, and 37%, respectively.
Enterococcus species:
Resistance rates in clinically relevant enterococci have not changed significantly over the last four years. However, periodic hospital outbreaks of vancomycin resistant enterococcus (VRE) increase the risk of serious infections with resistant erterococci. It is important to recognize that identification of enterococci to the species level is only performed for sterile site isolates but vancomycin resistance is confirmed for all clinically relevant isolates, regardless of specimen site. In 2008, resistance to vancomycin was 2%, which included 3 VRE bacteremic episodes and 29 non-sterile site isolates, primarily urine specimens. Similar findings were observed in 2007.
Pseudomonas aeruginosa:
Resistance rates in P. aeruginosa have remained relatively unchanged for over four years of surveillance in patients with and without cystic fibrosis and in both adult and pediatric populations. Resistance in 2008 was 14% to ceftazidime, 30% to ciprofloxacin, 27% to gentamicin, 22% to imipenem, and 12% to piperacillin.

6
Staphylococcus aureus: Resistance and isolation rates of S. aureus (ie. MSSA) remain relatively stable. However, the prevalence of methicillin-resistant S.aureus (MRSA) isolates, which are resistant to all β-lactam antibiotics, has increased over the past several years. MRSA strains may be referred to as ‘community-associated’ (CA) or ‘hospital-associated’ (HA) which, in the context of this antibiogram, primarily differ based on the degree of non-β-lactam antibiotic resistance. CA-MRSA tend to be more predictably susceptible to clindamycin, gentamicin, and trimethoprim-sulphamethoxazole than HA-MRSA but this distinction technically requires molecular genotyping that is not routinely available. The annual isolation rate of MRSA relative to all S. aureus from 2004 to 2008 was 4%, 7%, 18%, 25%, and 28%, respectively. In 2008, 529 (470 Adult, 59 Pediatric) MRSA isolates were identified with susceptibility testing but genotype data is available only for the subset displayed in the table; no linezolid resistance and only one isolate with intermediate vancomycin resistance (VISA) were detected. Similarly, 438 (414 Adult, 24 Pediatric) MRSA were identified in 2007 and all were susceptible to linezolid and vancomycin. CA-MRSA resistance to clindamycin was 12% in 2007 (n=73) and increased to 29% in 2008 (n=100) while resistance to gentamicin and trimethoprim-sulphamethoxazole in 2007-08 remained less than 5%, similar to MSSA.
Streptococcus pneumoniae:
As of 2008, penicillin susceptibility interpretations for all pneumococcal isolates are reported in three categories to account for penicillin pharmacodynamics in cases of meningitis, non-meningeal infections, or oral penicillin V therapy; resistance for 2008 was 14%, 4%, and 14%, respectively. Similarly, ceftriaxone rates for meningeal and non-meningeal infections were 6% and 2%, respectively. Note, these rates do not reflect actual cases of pneumococcal meningitis. Resistance to the macrolides in S. pneumoniae is a global problem; Canadian rates have been steadily increasing for the past decade and reached ~25% in 2007. This is mirrored by our hospital rate, which has increased from 14% in 2006, to 20% in 2007, to 26% in 2008. No vancomycin resistance has been detected to date in S. pneumoniae. Trimethoprim-sulphamethoxazole resistance has remained stable at ~25% for the last several years and quinolone resistance is rare.
Candida species: C. albicans and C. glabrata comprise more than 80% of all Candida isolated from sterile-sites. This has remained unchanged since 2005 when UAH yeast susceptibility results were first published. C. albicans are predictably susceptible to most antifungal agents. However, C. glabrata exhibit significant resistance to fluconazole (30%), which is consistent with global resistance rates.

7
Medically Relevant Pathogens Based on Gram Morphology
Gram-negative bacilli
Lactose Fermenters Non-lactose Fermenters Glucose Non-fermenters
Escherichia coli Serratia marcescens Pseudomonas aeruginosa Klebsiella pneumoniae Proteus mirabilis Pseudomonas species Klebsiella oxytoca Morganella morganii Stenotrophomonas maltophilia
Enterobacter cloacae Aeromonas species Acinetobacter baumanii complex
Citrobacter freundii complex Providencia rettgeri Achromobacter species
Enterobacter aerogenes Providencia stuartii Burkholderia cepacia
Citrobacter koseri Salmonella species Chryseobacterium species
Gram-positive Cocci
Gram-positive Cocci in Chains Gram-positive Cocci in Clumps
Enterococcus species Staphylococcus aureus
Streptococcus species, including: Staphylococcus species, coagulase-negative
Streptococcus pyogenes (Group A) Staphylococcus lugdunensis
Streptococcus agalactiae (Group B) Micrococcus species
Streptococcus pneumoniae Aerococcus species
Viridans group streptococci Rothia mucilaginosus
Streptococcus anginosus group

8
Abbreviation Glossary for Antimicrobials
Antimicrobial Abbreviation Antimicrobial Abbreviation
Amikacin AMK Gentamicin GEN
Ampicillin AMP Gentamicin Synergy GM500
Amphotericin B AMB Imipenem IMI
Caspofungin CASP Levofloxacin LEV
Cefazolin FAZ Linezolid LNZ
Ceftriaxone CRO Meropenem MERO
Ceftazidime CAZ Nitrofurantoin NIT
Cefuroxime CXM Penicillin PEN
Ciprofloxacin CIP Pipercillin PIP
Clindamycin CLIN Rifampin RIF
Cloxacillin CLOX Tetracycline TET
Colistin COL Ticarcillin-clavulanic acid TIM
Doxycycline DOXY Tobramycin TOB
Erythromycin ERY Trimethoprim-sulfamethoxazole SXT
Fluconazole FLUC Vancomycin VAN
Flucytosine 5-FC Voriconazole VORI

University of Alberta Hospital Antibiogram 2008
9
2008 Antibiogram Tables

University of Alberta Hospital Antibiogram 2008
10
Acinetobacter baumanni complex All Specimen Sources CAZ CIP COL GEN IMI TOB SXT
% SUS 64 66 100 71 86 81 72 ALL Ages # SUS 35 36 41 38 45 44 39
# TESTED 54 54 41 53 52 54 54 % SUS 64 64 100 71 81 76 71
> 17 years # SUS 25 25 32 28 31 30 28 # TESTED 39 39 32 39 38 39 39
Burkholderia cepacia complex All Specimen Sources CAZ CIP GEN IMI MERO PIP SXT CF Patients % SUS 86 60 6 6 76 73 80
ALL Ages # SUS 13 9 1 1 10 11 12 # TESTED 15 15 15 15 15 15 15

University of Alberta Hospital Antibiogram 2008
11
Citrobacter freundii complex All Specimen Sources AMP FAZ CRO CXM CIP GEN IMI NIT SXT % SUS 0 0 84 0 86 87 100 92 78
ALL Ages # SUS 0 0 74 0 76 77 88 81 69 # TESTED 88 88 88 88 88 88 88 88 88 % SUS 0 0 87 1 84 91 100 94 83
> 17 years # SUS 0 0 62 1 60 65 71 67 59 # TESTED 71 71 71 71 71 71 71 71 71 % SUS 0 0 70 0 94 70 100 82 58
< 17 years # SUS 0 0 12 0 16 12 17 14 10 # TESTED 17 17 17 17 17 17 17 17 17
Citrobacter koseri All Specimen Sources AMP FAZ CRO CXM CIP GEN IMI NIT SXT % SUS 0 77 100 81 100 100 100 81 100
ALL Ages # SUS 0 21 27 22 27 27 27 22 27 # TESTED 27 27 27 27 27 27 27 27 27
% SUS 0 73 100 78 100 100 100 78 100 > 17 years # SUS 0 17 23 18 23 23 23 18 23
# TESTED 23 23 23 23 23 23 23 23 23
Enterobacter, Citrobacter, and Serratia species may develop broad-spectrum β-lactam resistance during prolonged therapy. This resistance phenotype may develop during β-lactam therapy and confers resistance to all β-lactams except for imipenem and meropenem. These pathogens are also intrinsically resistant to ampicillin, cefazolin, and cefuroxime.

University of Alberta Hospital Antibiogram 2008
12
Enterobacter aerogenes All Specimen Sources AMP FAZ CRO CXM CIP GEN IMI NIT SXT % SUS 0 0 84 0 96 100 98 17 98
ALL Ages # SUS 0 0 66 0 75 78 75 13 76 # TESTED 78 78 78 77 78 78 77 76 78
% SUS 0 0 81 0 95 100 98 15 98 > 17 years # SUS 0 0 53 0 62 65 63 9 64
# TESTED 65 65 65 64 65 65 64 63 65 Enterobacter cloacae All Specimen Sources AMP FAZ CRO CXM CIP GEN IMI NIT SXT All Patients % SUS 0 0 70 0 89 96 99 29 91
ALL Ages # SUS 0 0 211 0 270 291 298 87 274 # TESTED 303 303 302 303 303 303 301 301 301
% SUS 0 0 73 0 87 96 99 26 91 > 17 years # SUS 0 0 169 0 202 223 228 60 211
# TESTED 232 232 231 232 232 232 230 230 232 % SUS 0 0 63 0 98 98 100 39 88
< 17 years # SUS 0 0 45 0 70 70 71 28 62 # TESTED 71 71 71 71 71 71 71 71 71
% SUS 0 0 69 0 82 95 100 13 91 UAH 3C3/3C4 # SUS 0 0 26 0 31 36 38 5 35
# TESTED 38 38 38 38 38 38 38 38 38
Enterobacter, Citrobacter, and Serratia species may develop broad-spectrum β-lactam resistance during prolonged therapy. This resistance phenotype may develop during β-lactam therapy and confers resistance to all β-lactams except for imipenem and meropenem. These pathogens are also intrinsically resistant to ampicillin, cefazolin, and cefuroxime.

University of Alberta Hospital Antibiogram 2008
13
Escherichia coli All Specimen Sources AMP FAZ CRO CXM CIP GEN IMI NIT SXT All Patients % SUS 51 85 94 89 72 90 99 97 69
ALL Ages # SUS 1237 2061 2269 2141 1746 2183 2394 2349 1673 # TESTED 2425 2425 2414 2406 2425 2425 2418 2422 2425
% SUS 50 84 93 88 66 89 100 97 68 > 17 years # SUS 948 1592 1755 1655 1251 1687 1889 1835 1289
# TESTED 1895 1895 1887 1881 1895 1895 1889 1892 1895 % SUS 52 90 96 95 94 95 99 98 71
< 17 years # SUS 276 477 506 499 498 504 524 519 376 # TESTED 530 530 527 525 530 530 529 530 530
% SUS 50 82 95 88 65 94 100 98 72 UAH 3C3/3C4 # SUS 37 60 68 63 47 69 73 71 53 # TESTED 73 73 72 72 73 73 73 72 73
% SUS 46 85 91 87 62 89 100 95 75 CCI # SUS 38 71 76 71 51 74 83 79 62 # TESTED 83 83 83 82 83 83 83 83 83 Escherichia coli - ESBL Producers All Specimen Sources AMP FAZ CRO CXM CIP GEN IMI NIT SXT % SUS 0 0 0 0 17 57 100 91 32
ALL Ages # SUS 0 0 0 0 15 50 87 79 28 # TESTED 87 87 87 87 87 87 87 87 87
% SUS 0 0 0 0 14 58 100 92 31 > 17 years # SUS 0 0 0 0 11 45 77 71 24
# TESTED 77 77 77 77 77 77 77 77 77
The extended-spectrum β-lactamase (ESBL) resistance phenotype confers resistance to all third-generation cephalosporins and, in many cases, piperacillin-tazobactam. ESBL-positive E. coli isolation rates have increased significantly in the last several years; <1% in 2005, 2.5% in 2006, 5.2% in 2007, and 3.6% in 2008. A significant number of ESBL E. coli are also resistant to other antibiotic classes including quinolones (83%), aminoglycosides (43%), and trimethoprim-sulfamethoxazole (68%); 2008 data.

University of Alberta Hospital Antibiogram 2008
14
Haemophilus influenzae All Specimen Sources AMP CRO CXM SXT
% SUS 84 100 95 88 ALL Ages # SUS 196 12 45 38
# TESTED 233 12 47 43 % SUS 83 100 93 86
> 17 years # SUS 132 9 29 25 # TESTED 159 9 31 29
% SUS 86 100 100 92 < 17 years # SUS 64 3 16 13
# TESTED 74 3 16 14

University of Alberta Hospital Antibiogram 2008
15
Klebsiella species All Specimen Sources AMP FAZ CRO CXM CIP GEN IMI NIT SXT All Patients % SUS 0 80 95 88 92 96 100 53 90
ALL Ages # SUS 0 614 724 673 707 737 763 405 691 # TESTED 768 768 762 765 768 768 763 765 768
% SUS 0 81 96 89 90 97 100 49 91 > 17 years # SUS 0 505 594 554 562 605 620 304 568
# TESTED 624 624 619 622 624 624 620 621 624 % SUS 0 75 90 83 99 90 100 72 88
< 17 years # SUS 0 108 129 119 143 130 143 104 127 # TESTED 144 144 143 143 144 144 143 144 144
% SUS 0 75 94 83 91 100 100 41 95 UAH 3C3/3C4 # SUS 0 44 55 49 54 59 59 24 56 # TESTED 59 59 59 59 59 59 59 59 59 % SUS 0 81 100 90 97 100 100 45 95 CCI # SUS 0 36 43 40 431 44 42 20 42
# TESTED 44 44 43 44 444 44 42 44 44 Klebsiella species - ESBL Producers All Specimen Sources AMP FAZ CRO CXM CIP GEN IMI NIT SXT % SUS 0 0 0 0 69 72 100 72 63
ALL Ages # SUS 0 0 0 0 23 24 33 24 21 # TESTED 33 33 33 33 33 33 33 33 33
% SUS 0 0 0 0 50 85 100 60 70 > 17 years # SUS 0 0 0 0 10 17 20 12 14
# TESTED 20 20 20 20 20 20 20 20 20
The extended-spectrum β-lactamase (ESBL) resistance phenotype confers resistance to all third-generation cephalosporins and, in many cases, piperacillin-tazobactam. Klebsiella ESBL prevalence seems to be on the rise with isolation rates of 2.3%, 3.4%, and 4.2% in 2006, 2007, and 2008, respectively. Cross-resistance rates in 2008 to the quinolones, aminoglycosides, and trimethoprim-sulfamethoxazole were 31%, 28%, and 37%, respectively.

University of Alberta Hospital Antibiogram 2008
16
Morganella morganii All Specimen Sources AMP FAZ CRO CXM CIP GEN IMI NIT SXT % SUS 0 0 93 0 81 83 98 0 77
ALL Ages # SUS 0 0 57 0 49 51 59 0 47 # TESTED 61 61 61 61 61 61 60 61 61
% SUS 0 0 92 0 78 80 100 0 75 > 17 years # SUS 0 0 48 0 41 42 51 0 39
# TESTED 52 52 52 52 52 52 51 52 52 Proteus mirabilis All Specimen Sources AMP FAZ CRO CXM CIP GEN IMI NIT SXT % SUS 78 92 99 99 77 91 99 0 72
ALL Ages # SUS 140 165 177 176 138 163 177 0 129 # TESTED 179 179 179 178 179 179 179 179 179
% SUS 81 92 98 99 74 92 99 0 74 > 17 years # SUS 125 142 151 151 114 142 152 0 114
# TESTED 154 154 154 153 154 154 154 154 154 % SUS 64 92 100 100 96 88 100 0 64
< 17 years # SUS 16 23 25 25 24 22 25 0 16 # TESTED 25 25 25 25 25 25 25 25 25

University of Alberta Hospital Antibiogram 2008
17
Pseudomonas aeruginosa All Specimen Sources AMK CAZ CIP GEN IMI MERO PIP TOB All Patients % SUS 79 86 70 73 78 85 88 88
# SUS 850 935 761 794 844 801 957 957 ALL Ages # TESTED 1076 1087 1087 1087 1082 942 1088 1087
% SUS 81 87 63 75 76 84 88 89 # SUS 654 711 515 613 617 586 720 727 > 17 years
# TESTED 807 817 817 817 812 698 818 817 % SUS 74 84 91 70 85 90 86 85 # SUS 199 227 246 189 230 220 232 230 < 17 years
# TESTED 269 270 270 270 270 244 270 270 Non-CF Patients % SUS 94 86 66 85 75 84 90 94
# SUS 635 587 451 581 509 452 616 642 ALL Ages # TESTED 675 683 683 683 678 538 684 683
% SUS 93 86 60 84 73 82 89 94 # SUS 510 478 334 467 402 358 496 523 >17 years
# TESTED 548 556 556 556 551 437 557 556 % SUS 95 84 91 90 87 94 91 96 # SUS 121 107 116 114 110 95 116 122 < 17 years
# TESTED 127 127 127 127 127 101 127 127 CF Patients % SUS 55 86 76 54 83 87 85 78
# SUS 221 347 307 218 335 351 343 315 ALL Ages # TESTED 401 404 404 404 404 404 404 404
% SUS 55 88 68 55 83 88 86 80 # SUS 142 230 177 144 217 230 224 209 > 17 years
# TESTED 259 261 261 261 261 261 261 261 % SUS 55 84 92 53 83 87 82 76 # SUS 78 120 132 76 119 124 117 109 < 17 years
# TESTED 142 143 143 143 143 143 143 143 % SUS 90 82 44 75 62 75 82 90 # SUS 77 71 38 65 53 55 72 78 UAH 3C3/3C4
# TESTED 86 87 87 87 85 73 88 87 Resistance rates in P. aeruginosa have remained relatively unchanged for over four years of surveillance in patients with and without
cystic fibrosis and in both adult and paediatric populations.

University of Alberta Hospital Antibiogram 2008
18
Serratia marcescens All Specimen Sources AMP FAZ CRO CXM CIP GEN IMI NIT SXT % SUS 0 0 90 0 86 98 95 0 98
ALL Ages # SUS 0 0 116 0 111 126 122 0 126 # TESTED 129 129 129 128 129 129 128 129 129
% SUS 0 0 89 0 85 98 94 0 98 > 17 years # SUS 0 0 104 0 99 115 110 0 115
# TESTED 117 117 117 116 117 117 117 117 117
Enterobacter, Citrobacter, and Serratia species may develop broad-spectrum β-lactam resistance during prolonged therapy. This resistance phenotype may develop during β-lactam therapy and confers resistance to all β-lactams except for imipenem and meropenem. These pathogens are also intrinsically resistant to ampicillin, cefazolin, and cefuroxime. Stenotrophomonas maltophilia All Specimen Sources DOXY TIM SXT All Patients % SUS 69 22 96
ALL Ages # SUS 200 64 278 # TESTED 290 290 290
% SUS 66 26 96 > 17 years # SUS 139 55 203
# TESTED 211 211 211 % SUS 77 12 98
< 17 years # SUS 61 9 77 # TESTED 79 79 79
% SUS 70 27 100 UAH 3C3/3C4 # SUS 25 10 36
# TESTED 36 36 36

University of Alberta Hospital Antibiogram 2008
19
Enterococcus species All Specimen Sources AMP CIP GM500 LNZ NIT VAN All Patients % SUS 85 38 70 85 82 98
ALL Ages # SUS 1328 589 1091 1279 1269 1549 # TESTED 1562 1549 1558 1505 1548 1581
% SUS 82 32 66 86 80 98 > 17 years # SUS 1025 397 824 1040 993 1245
# TESTED 1250 1242 1248 1209 1241 1270 % SUS 93 64 89 83 93 99
< 17 years # SUS 290 196 276 246 286 308 # TESTED 312 307 310 296 307 311
% SUS 64 21 74 93 66 95 UAH 3C3/3C4 # SUS 48 16 56 70 50 75 # TESTED 75 75 75 75 75 79 % SUS 91 41 71 92 89 98 CCI # SUS 61 27 48 62 60 68
# TESTED 67 67 67 67 67 69 Enterococcus faecalis Blood Specimens AMP CIP GM500 LNZ NIT* VAN % SUS 100 53 67 95 97 97
ALL Ages # SUS 46 24 31 42 44 45 # TESTED 46 45 46 44 45 46 Enterococcus faecium Blood Specimens AMP CIP GM500 LNZ NIT* VAN % SUS 16 8 91 100 8 91
ALL Ages # SUS 4 2 22 23 2 22 # TESTED 24 23 24 23 23 24 *, for urninary tract infections only Resistance rates in enterococci have not changed significantly over the last four years. However, the potential for resistance to vancomycin
(VRE) is now a much greater concern. Enterococcal species identification is only performed for sterile site isolates but vancomycin resistance is confirmed for all clinically relevant isolates, regardless of specimen site. In 2008, resistance to vancomycin was 2%, which included 3 VRE bacteremic episodes and 29 non-sterile site isolates, primarily urine specimens. Similar findings were observed in 2007.

University of Alberta Hospital Antibiogram 2008
20
Staphylococcus aureus - MSSA All Specimen Sources CIP CLIN CLOX ERY GEN LNZ NIT RIF SXT TET VAN All Patients % SUS 90 78 100 75 93 100 98 99 94 97 100
ALL Ages # SUS 1221 1082 1382 1045 1265 1344 1332 1345 1301 1311 1371 # TESTED 1347 1380 1382 1380 1348 1344 1351 1348 1376 1348 1371
% SUS 88 77 100 75 93 100 99 99 95 97 100 > 17 years # SUS 846 764 984 737 897 955 952 955 934 933 975
# TESTED 957 982 984 982 958 955 961 958 978 958 975 % SUS 96 79 100 77 94 100 97 100 92 96 100
< 17 years # SUS 375 318 398 308 368 389 380 390 367 378 396 # TESTED 390 398 398 398 390 389 390 390 398 390 396
% SUS 90 77 100 77 93 100 97 100 99 98 100 UAH 3C3/3C4 # SUS 81 69 90 69 84 90 87 89 89 87 90
# TESTED 90 90 90 90 90 90 90 89 90 89 90
% SUS 90 84 100 84 100 100 100 100 96 96 100 UAH 3C2 # SUS 29 27 32 27 32 32 32 32 31 31 32
# TESTED 32 32 32 32 32 32 32 32 32 32 32 % SUS 94 83 100 77 100 100 100 100 93 98 100 CCI # SUS 55 51 64 48 60 60 61 60 59 59 61
# TESTED 59 62 64 62 60 60 61 60 63 60 61
University of Alberta Hospital Antibiogram 2008
21
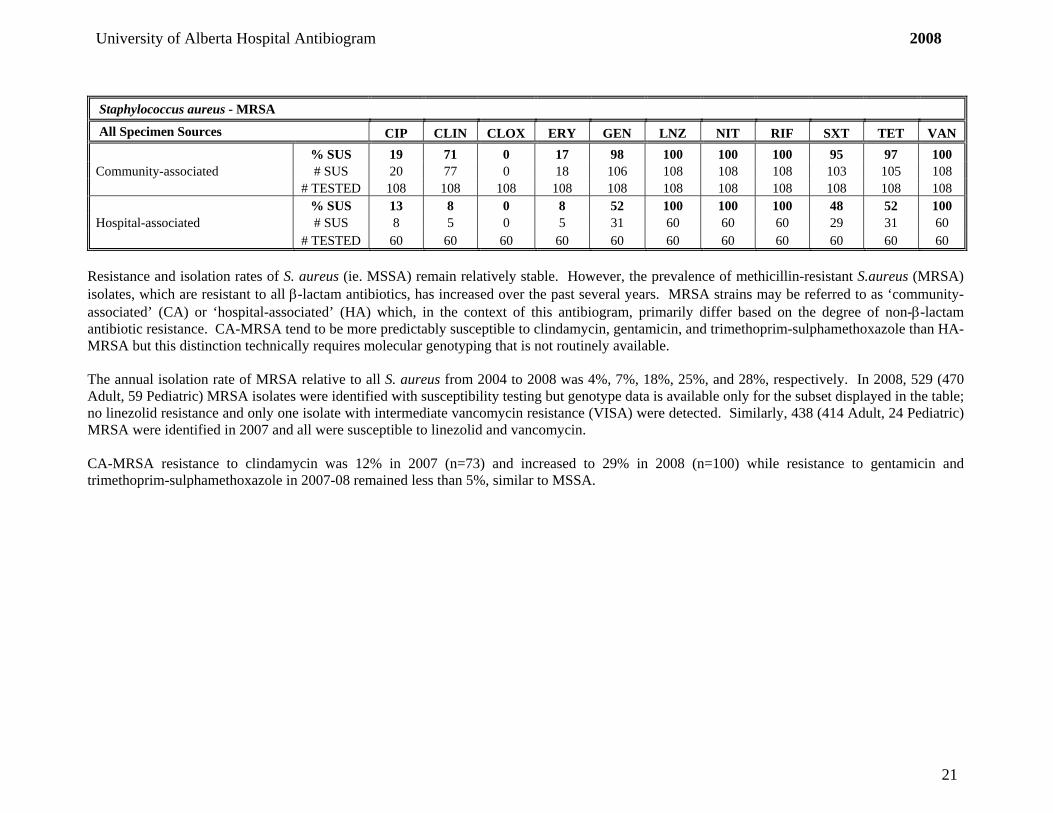
Staphylococcus aureus - MRSA All Specimen Sources CIP CLIN CLOX ERY GEN LNZ NIT RIF SXT TET VAN % SUS 19 71 0 17 98 100 100 100 95 97 100 Community-associated # SUS 20 77 0 18 106 108 108 108 103 105 108
# TESTED 108 108 108 108 108 108 108 108 108 108 108 % SUS 13 8 0 8 52 100 100 100 48 52 100 Hospital-associated # SUS 8 5 0 5 31 60 60 60 29 31 60
# TESTED 60 60 60 60 60 60 60 60 60 60 60
Resistance and isolation rates of S. aureus (ie. MSSA) remain relatively stable. However, the prevalence of methicillin-resistant S.aureus (MRSA) isolates, which are resistant to all β-lactam antibiotics, has increased over the past several years. MRSA strains may be referred to as ‘community-associated’ (CA) or ‘hospital-associated’ (HA) which, in the context of this antibiogram, primarily differ based on the degree of non-β-lactam antibiotic resistance. CA-MRSA tend to be more predictably susceptible to clindamycin, gentamicin, and trimethoprim-sulphamethoxazole than HA-MRSA but this distinction technically requires molecular genotyping that is not routinely available. The annual isolation rate of MRSA relative to all S. aureus from 2004 to 2008 was 4%, 7%, 18%, 25%, and 28%, respectively. In 2008, 529 (470 Adult, 59 Pediatric) MRSA isolates were identified with susceptibility testing but genotype data is available only for the subset displayed in the table; no linezolid resistance and only one isolate with intermediate vancomycin resistance (VISA) were detected. Similarly, 438 (414 Adult, 24 Pediatric) MRSA were identified in 2007 and all were susceptible to linezolid and vancomycin. CA-MRSA resistance to clindamycin was 12% in 2007 (n=73) and increased to 29% in 2008 (n=100) while resistance to gentamicin and trimethoprim-sulphamethoxazole in 2007-08 remained less than 5%, similar to MSSA.

University of Alberta Hospital Antibiogram 2008
22
Staphylococcus species, coagulase-negative All Specimen Sources FAZ CIP CLIN CLOX ERY GEN NIT PEN SXT VAN All Patients % SUS 38 48 43 37 32 70 99 10 54 100
# SUS 125 144 144 121 107 210 298 33 176 330 ALL Ages # TESTED 328 301 335 328 334 300 301 333 326 330
% SUS 40 43 45 39 34 74 99 10 55 100 # SUS 106 105 122 104 92 180 242 27 146 266 > 17 years old
# TESTED 264 244 271 266 271 243 244 269 265 266 % SUS 28 66 34 30 25 52 98 10 49 100 # SUS 18 38 22 19 16 30 56 6 30 64 < 17 years old
# TESTED 64 57 64 62 63 57 57 64 61 64
% SUS 23 38 37 23 19 68 100 11 48 100 # SUS 5 7 8 5 4 13 19 2 10 21 UAH 3C3/3C4
# TESTED 22 19 22 22 22 19 19 22 21 21 Staphylococcus lugdunensis All Specimen Sources FAZ CIP CLIN CLOX ERY GEN NIT PEN SXT VAN % SUS 97 97 91 97 85 97 100 53 81 100
ALL Ages # SUS 47 46 45 48 42 46 47 26 40 49 # TESTED 48 47 49 49 49 47 47 49 49 49
% SUS 100 97 90 100 83 97 100 51 79 100 > 17 years # SUS 42 40 39 43 36 40 41 22 34 43
# TESTED 42 41 43 43 43 41 41 43 43 43

University of Alberta Hospital Antibiogram 2008
23
Viridans Group Streptococci All Specimen Sources CRO PEN VAN
% SUS 98 69 100 # SUS 102 72 104 ALL Ages
# TESTED 104 104 104 % SUS 98 76 100 # SUS 76 59 78 > 17 years
# TESTED 78 78 78 % SUS 96 46 100 # SUS 25 12 26 < 17 years
# TESTED 26 26 26 Streptococcus anginosis group All Specimen Sources CRO PEN VAN % SUS 99 99 100
ALL Ages # SUS 129 129 130 # TESTED 130 130 130

University of Alberta Hospital Antibiogram 2008
24
Streptococcus pneumoniae CRO CRO DOXY ERY LEV MERO PEN PEN PEN SXT VAN All Specimen Sources (M) (NM) (M) (NM) (PO) All Patients % SUS 94 98 87 74 98 84 86 96 86 75 100
# SUS 114 118 129 124 179 39 177 197 177 126 194 ALL Ages # TESTED 121 121 148 166 181 46 204 204 204 166 194
% SUS 95 97 86 74 98 84 86 96 86 74 100
# SUS 75 77 93 86 125 27 118 197 118 86 135 > 17 years old # TESTED 79 79 108 115 127 32 137 204 137 115 135
% SUS 93 98 90 74 100 85 88 94 88 78 100 # SUS 39 41 36 38 54 12 59 63 59 40 59 < 17 years old
# TESTED 42 42 40 51 54 14 67 67 67 51 59
% SUS 93 96 87 76 100 95 87 98 87 65 100 # SUS 25 26 29 26 37 14 32 36 32 22 37 UAH 3C3/3C4
# TESTED 27 27 33 34 37 15 37 37 37 34 37 M, meningitis; NM, non-meningitis; PO, oral administration.
Streptococcus pyogenes All Specimen Sources CLIN ERY PEN % SUS 87 87 100
# SUS 48 48 55 ALL Ages # TESTED 55 55 55
As of 2008, penicillin susceptibility interpretations for all pneumococcal isolates are reported in three categories to account for penicillin pharmacodynamics in cases of meningitis, non-meningeal infections, or oral penicillin V therapy; resistance for 2008 was 14%, 4%, and 14%, respectively. Similarly, ceftriaxone rates for meningeal and non-meningeal infections were 6% and 2%, respectively. Note, these rates do not reflect actual cases of pneumococcal meningitis. Resistance to the macrolides in S. pneumoniae is a global problem; Canadian rates have been steadily increasing for the past decade and reached ~25% in 2007. This is mirrored by our hospital rate, which has increased from 14% in 2006, to 20% in 2007, to 26% in 2008. No vancomycin resistance has been detected to date in S. pneumoniae. Trimethoprim-sulphamethoxazole resistance has remained stable at ~25% for the last several years and quinolone resistance is rare.

University of Alberta Hospital Antibiogram 2008
25
Candida species All Specimen Sources AMB 5-FC ITRA FLUC VORI CASP
C. albicans % SUS 100 99 89 98 98 100 ALL Ages # SUS 95 94 85 93 93 95
# TESTED 95 95 95 95 95 95
C. glabrata % SUS 100 100 3 69 94 100 ALL Ages # SUS 68 68 2 47 64 68
# TESTED 68 68 68 68 68 68
C. parapsilosis % SUS 100 100 85 100 100 92 ALL Ages # SUS 13 13 11 13 13 12
# TESTED 13 13 13 13 13 13
C. tropicalis % SUS 100 100 65 88 94 94 ALL Ages # SUS 17 17 11 15 16 16
# TESTED 17 17 17 17 17 17
C. albicans and C. glabrata comprise more than 80% of all Candida isolated from sterile-sites. This has remained unchanged since 2005 when UAH yeast susceptibility results were first published. C. albicans are predictably susceptible to most antifungal agents. However, C. glabrata exhibit significant resistance to fluconazole (30%), which is consistent with global resistance rates.

University of Alberta Hospital Antibiogram 2007
26
2007 Antibiogram Tables

University of Alberta Hospital Antibiogram 2007
27
Acinetobacter baumanni complex All Specimen Sources CAZ CIP COL GEN IMI TOB SXT
% SUS 86 98 100 91 98 80 91 ALL Ages # SUS 38 43 35 40 43 35 40
# TESTED 44 44 35 44 44 44 44 % SUS 83 97 100 91 97 97 89
> 17 years # SUS 29 34 28 32 34 34 31 # TESTED 35 35 28 35 35 35 35
Burkholderia cepacia complex All Specimen Sources CAZ CIP GEN IMI MERO PIP SXT CF Patients % SUS 48 16 3 23 55 52 48
ALL Ages # SUS 15 5 1 7 17 16 15 # TESTED 31 31 31 31 31 31 31
% SUS 68 23 5 9 64 68 55 > 17 years # SUS 15 5 1 2 14 15 12
# TESTED 22 22 22 22 22 22 22 % SUS 0 0 0 56 33 11 33
< 17 years # SUS 0 0 0 5 3 1 3 # TESTED 9 9 9 9 9 9 9

University of Alberta Hospital Antibiogram 2007
28
Citrobacter freundii complex All Specimen Sources AMP FAZ CRO CXM CIP GEN IMI NIT SXT % SUS 0 0 78 0 89 91 100 96 82
ALL Ages # SUS 0 0 100 0 115 117 129 124 106 # TESTED 129 129 129 129 129 129 129 129 129 % SUS 0 0 79 0 88 89 100 97 84
> 17 years # SUS 0 0 82 0 91 93 104 101 87 # TESTED 104 104 104 104 104 104 104 104 104 % SUS 0 0 72 0 96 96 100 92 76
< 17 years # SUS 0 0 18 0 24 24 25 23 19 # TESTED 25 25 25 25 25 25 25 25 25
Citrobacter koseri All Specimen Sources AMP FAZ CRO CXM CIP GEN IMI NIT SXT % SUS 0 81 100 81 100 100 100 54 96
ALL Ages # SUS 0 21 26 21 26 26 26 14 25 # TESTED 26 26 26 26 26 26 26 26 26
% SUS 0 80 100 80 100 100 100 52 96 > 17 years # SUS 0 20 25 20 25 25 25 13 24
# TESTED 25 25 25 25 25 25 25 25 25
Enterobacter, Citrobacter, and Serratia species may develop broad-spectrum β-lactam resistance during prolonged therapy. This resistance phenotype may develop during β-lactam therapy and confers resistance to all β-lactams except for imipenem and meropenem. These pathogens are also intrinsically resistant to ampicillin, cefazolin, and cefuroxime.

University of Alberta Hospital Antibiogram 2007
29
Enterobacter aerogenes All Specimen Sources AMP FAZ CRO CXM CIP GEN IMI NIT SXT % SUS 0 0 88 0 99 100 100 25 96
ALL Ages # SUS 0 0 59 0 66 67 67 17 64 # TESTED 67 67 67 47 67 67 67 67 67
% SUS 0 0 89 0 98 100 100 26 95 > 17 years # SUS 0 0 55 0 61 62 62 16 59
# TESTED 62 62 62 43 62 62 62 62 62 Enterobacter cloacae All Specimen Sources AMP FAZ CRO CXM CIP GEN IMI NIT SXT All Patients % SUS 0 0 75 0 90 95 99 33 88
ALL Ages # SUS 0 0 247 0 297 315 326 108 292 # TESTED 330 330 330 178 330 330 330 330 330
% SUS 0 0 75 0 88 95 99 31 88 > 17 years # SUS 0 0 206 0 240 258 269 84 240
# TESTED 273 273 273 151 273 273 273 273 273 % SUS 0 0 72 0 100 100 100 42 91
< 17 years # SUS 0 0 41 0 57 57 57 24 52 # TESTED 57 57 57 27 57 57 57 57 57
% SUS 0 0 66 0 79 90 100 38 79 UAH 3C3/3C4 # SUS 0 0 19 0 23 26 29 11 23
# TESTED 29 29 29 18 29 29 29 29 29
Enterobacter, Citrobacter, and Serratia species may develop broad-spectrum β-lactam resistance during prolonged therapy. This resistance phenotype may develop during β-lactam therapy and confers resistance to all β-lactams except for imipenem and meropenem. These pathogens are also intrinsically resistant to ampicillin, cefazolin, and cefuroxime.
University of Alberta Hospital Antibiogram 2007
30
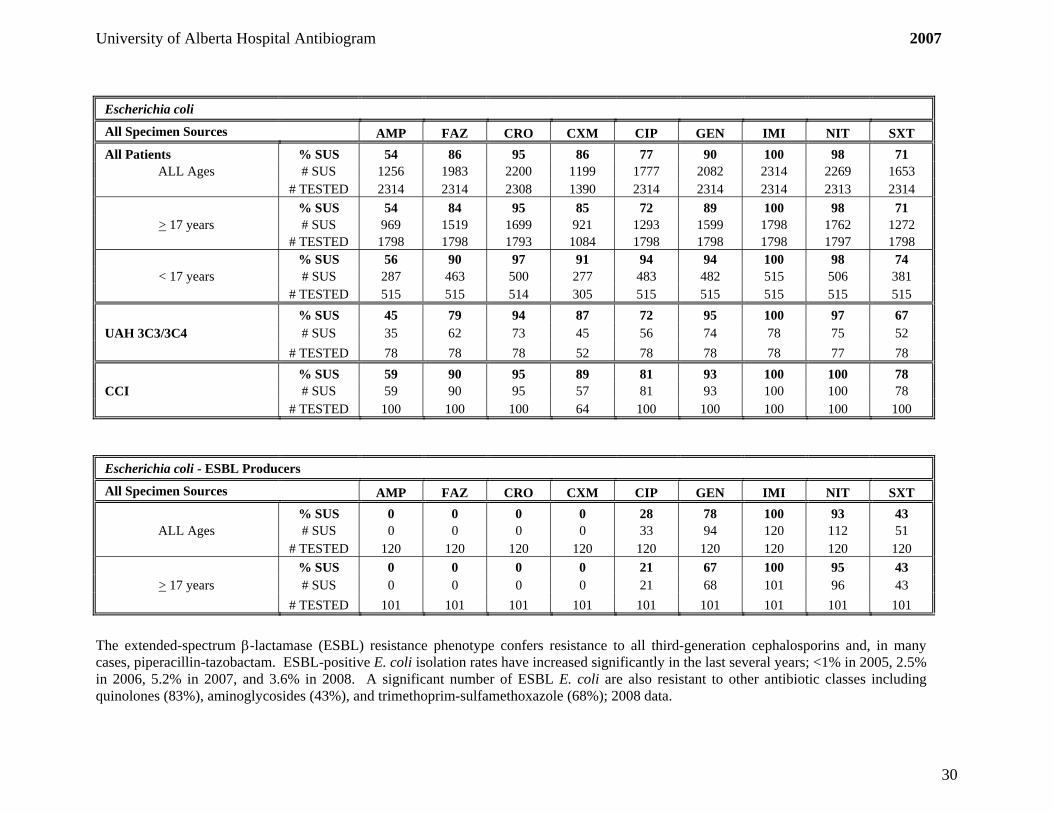
Escherichia coli All Specimen Sources AMP FAZ CRO CXM CIP GEN IMI NIT SXT All Patients % SUS 54 86 95 86 77 90 100 98 71
ALL Ages # SUS 1256 1983 2200 1199 1777 2082 2314 2269 1653 # TESTED 2314 2314 2308 1390 2314 2314 2314 2313 2314
% SUS 54 84 95 85 72 89 100 98 71 > 17 years # SUS 969 1519 1699 921 1293 1599 1798 1762 1272
# TESTED 1798 1798 1793 1084 1798 1798 1798 1797 1798 % SUS 56 90 97 91 94 94 100 98 74
< 17 years # SUS 287 463 500 277 483 482 515 506 381 # TESTED 515 515 514 305 515 515 515 515 515
% SUS 45 79 94 87 72 95 100 97 67 UAH 3C3/3C4 # SUS 35 62 73 45 56 74 78 75 52 # TESTED 78 78 78 52 78 78 78 77 78 % SUS 59 90 95 89 81 93 100 100 78 CCI # SUS 59 90 95 57 81 93 100 100 78 # TESTED 100 100 100 64 100 100 100 100 100 Escherichia coli - ESBL Producers All Specimen Sources AMP FAZ CRO CXM CIP GEN IMI NIT SXT % SUS 0 0 0 0 28 78 100 93 43
ALL Ages # SUS 0 0 0 0 33 94 120 112 51 # TESTED 120 120 120 120 120 120 120 120 120
% SUS 0 0 0 0 21 67 100 95 43 > 17 years # SUS 0 0 0 0 21 68 101 96 43
# TESTED 101 101 101 101 101 101 101 101 101
The extended-spectrum β-lactamase (ESBL) resistance phenotype confers resistance to all third-generation cephalosporins and, in many cases, piperacillin-tazobactam. ESBL-positive E. coli isolation rates have increased significantly in the last several years; <1% in 2005, 2.5% in 2006, 5.2% in 2007, and 3.6% in 2008. A significant number of ESBL E. coli are also resistant to other antibiotic classes including quinolones (83%), aminoglycosides (43%), and trimethoprim-sulfamethoxazole (68%); 2008 data.

University of Alberta Hospital Antibiogram 2007
31
Haemophilus influenzae All Specimen Sources AMP CRO CXM SXT
% SUS 85 100 98 84 ALL Ages # SUS 203 61 51 38
# TESTED 238 61 52 45 % SUS 86 100 97 83
> 17 years # SUS 140 40 32 25 # TESTED 162 40 33 30
% SUS 83 100 100 87 < 17 years # SUS 62 21 19 13
# TESTED 75 21 19 15

University of Alberta Hospital Antibiogram 2007
32
Klebsiella species All Specimen Sources AMP FAZ CRO CXM CIP GEN IMI NIT SXT All Patients % SUS 0 80 98 89 94 96 100 57 90
ALL Ages # SUS 0 627 769 675 741 757 788 449 708 # TESTED 788 788 788 762 788 788 788 788 788
% SUS 0 82 99 89 94 98 100 52 91 > 17 years # SUS 0 508 614 534 582 608 622 326 567
# TESTED 622 622 622 600 622 622 622 622 622 % SUS 0 72 93 87 96 90 100 74 85
< 17 years # SUS 0 119 155 141 159 149 166 123 141 # TESTED 166 166 166 162 166 166 166 166 166
% SUS 0 81 98 80 81 91 100 51 85 UAH 3C3/3C4 # SUS 0 43 52 40 43 48 53 27 45 # TESTED 53 53 53 50 53 53 53 53 53 % SUS 0 87 100 98 100 100 100 66 96 CCI # SUS 0 41 47 44 47 47 47 31 45
# TESTED 47 47 47 45 47 47 47 47 47 Klebsiella species - ESBL Producers All Specimen Sources AMP FAZ CRO CXM CIP GEN IMI NIT SXT % SUS 0 0 0 0 63 63 100 59 63
ALL Ages # SUS 0 0 0 0 17 17 27 16 17 # TESTED 27 27 27 27 27 27 27 27 27
% SUS 0 0 0 0 64 100 100 43 100 > 17 years # SUS 0 0 0 0 9 14 14 6 14
# TESTED 14 14 14 14 14 14 14 14 14
The extended-spectrum β-lactamase (ESBL) resistance phenotype confers resistance to all third-generation cephalosporins and, in many cases, piperacillin-tazobactam. Klebsiella ESBL prevalence seems to be on the rise with isolation rates of 2.3%, 3.4%, and 4.2% in 2006, 2007, and 2008, respectively. Cross-resistance rates in 2008 to the quinolones, aminoglycosides, and trimethoprim-sulfamethoxazole were 31%, 28%, and 37%, respectively.

University of Alberta Hospital Antibiogram 2007
33
Morganella morganii All Specimen Sources AMP FAZ CRO CXM CIP GEN IMI NIT SXT % SUS 0 0 91 0 93 87 100 0 83
ALL Ages # SUS 0 0 49 0 50 47 54 0 45 # TESTED 54 54 54 54 54 54 54 54 54
% SUS 0 0 94 0 91 87 100 0 83 > 17 years # SUS 0 0 44 0 43 41 47 0 39
# TESTED 47 47 47 47 47 47 47 47 47 Proteus mirabilis All Specimen Sources AMP FAZ CRO CXM CIP GEN IMI NIT SXT % SUS 71 89 99 98 84 96 100 0 77
ALL Ages # SUS 111 139 154 140 131 150 125 0 120 # TESTED 156 156 156 143 156 156 125 156 156
% SUS 72 91 99 99 81 95 100 0 77 > 17 years # SUS 92 117 127 117 104 122 105 0 99
# TESTED 128 128 128 118 128 128 105 128 128 % SUS 68 79 96 92 96 100 100 0 75
< 17 years # SUS 19 22 27 23 27 28 20 0 21 # TESTED 28 28 28 25 28 28 20 28 28

University of Alberta Hospital Antibiogram 2007
34
Pseudomonas aeruginosa All Specimen Sources AMK CAZ CIP GEN IMI MERO PIP TOB All Patients % SUS 79 89 76 74 82 89 88 89
# SUS 881 997 849 831 919 966 818 1003 ALL Ages # TESTED 1119 1124 1123 1124 1116 1082 932 1124
% SUS 79 88 71 75 80 89 88 89 # SUS 690 775 617 658 697 742 640 783 > 17 years
# TESTED 871 876 875 876 869 838 726 876 % SUS 77 90 94 70 90 92 86 89 # SUS 191 222 232 173 222 224 178 220 < 17 years
# TESTED 248 248 248 248 247 244 206 248 Non-CF Patients % SUS 96 90 72 87 83 91 92 96
# SUS 653 615 491 594 562 583 457 658 ALL Ages # TESTED 683 686 685 686 678 644 497 686
% SUS 96 90 69 88 82 90 92 96 # SUS 554 518 396 508 466 486 394 555 >17 years
# TESTED 575 578 577 578 571 540 429 578 % SUS 92 90 88 80 90 93 93 95 # SUS 99 97 95 86 96 97 63 103 < 17 years
# TESTED 108 108 108 108 107 104 68 108 CF Patients % SUS 52 87 82 54 82 87 83 79
# SUS 228 382 358 237 357 383 361 345 ALL Ages # TESTED 436 438 438 438 438 438 435 438
% SUS 46 86 74 50 78 86 83 77 # SUS 136 257 221 150 231 256 246 228 > 17 years
# TESTED 296 298 298 298 298 298 297 298 % SUS 66 89 98 62 90 91 83 84 # SUS 92 125 137 87 126 127 115 117 < 17 years
# TESTED 140 140 140 140 140 140 138 140 % SUS 92 86 71 88 80 89 90 96 # SUS 47 44 36 45 40 41 37 49 UAH 3C3/3C4
# TESTED 51 51 51 51 50 46 41 51 Resistance rates in P. aeruginosa have remained relatively unchanged for over four years of surveillance in patients with and
without cystic fibrosis and in both adult and paediatric populations.

University of Alberta Hospital Antibiogram 2007
35
Serratia marcescens All Specimen Sources AMP FAZ CRO CXM CIP GEN IMI NIT SXT All Patients % SUS 0 0 84 0 86 99 98 0 98
ALL Ages # SUS 0 0 103 0 104 121 120 0 120 # TESTED 122 122 122 122 121 122 122 122 122
% SUS 0 0 81 0 84 100 99 0 98 > 17 years # SUS 0 0 81 0 83 100 99 0 98
# TESTED 100 100 100 100 99 100 100 100 100 % SUS 0 0 100 0 95 95 95 0 100
< 17 years # SUS 0 0 22 0 21 21 21 0 22 # TESTED 22 22 22 22 22 22 22 22 22
Enterobacter, Citrobacter, and Serratia species may develop broad-spectrum β-lactam resistance during prolonged therapy. This resistance phenotype may develop during β-lactam therapy and confers resistance to all β-lactams except for imipenem and meropenem. These pathogens are also intrinsically resistant to ampicillin, cefazolin, and cefuroxime. Stenotrophomonas maltophilia All Specimen Sources DOXY TIM SXT All Patients % SUS 65 31 97
ALL Ages # SUS 199 94 294 # TESTED 304 304 304
% SUS 60 32 96 > 17 years # SUS 127 68 204
# TESTED 213 213 213 % SUS 79 29 99
< 17 years # SUS 72 26 90 # TESTED 91 91 91
% SUS 69 28 97 UAH 3C3/3C4 # SUS 27 11 38
# TESTED 39 39 39
University of Alberta Hospital Antibiogram 2007
36
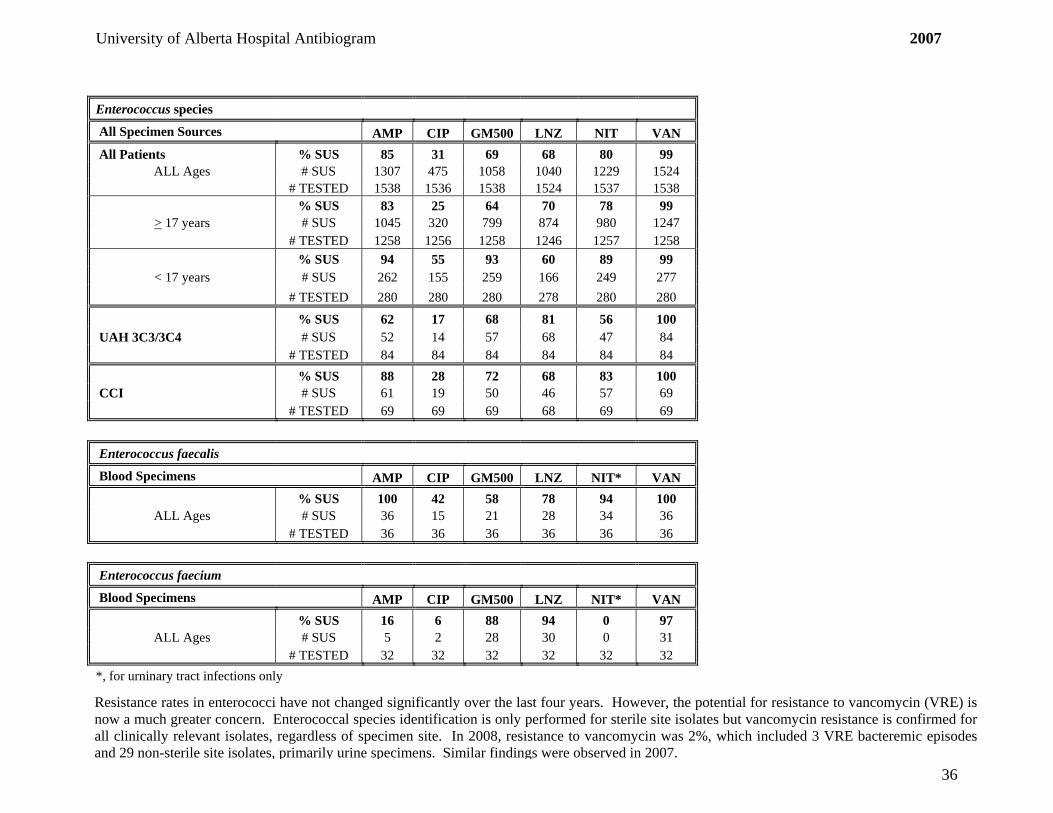
Enterococcus species All Specimen Sources AMP CIP GM500 LNZ NIT VAN All Patients % SUS 85 31 69 68 80 99
ALL Ages # SUS 1307 475 1058 1040 1229 1524 # TESTED 1538 1536 1538 1524 1537 1538
% SUS 83 25 64 70 78 99 > 17 years # SUS 1045 320 799 874 980 1247
# TESTED 1258 1256 1258 1246 1257 1258 % SUS 94 55 93 60 89 99
< 17 years # SUS 262 155 259 166 249 277 # TESTED 280 280 280 278 280 280
% SUS 62 17 68 81 56 100 UAH 3C3/3C4 # SUS 52 14 57 68 47 84 # TESTED 84 84 84 84 84 84 % SUS 88 28 72 68 83 100 CCI # SUS 61 19 50 46 57 69
# TESTED 69 69 69 68 69 69
Enterococcus faecalis Blood Specimens AMP CIP GM500 LNZ NIT* VAN % SUS 100 42 58 78 94 100
ALL Ages # SUS 36 15 21 28 34 36 # TESTED 36 36 36 36 36 36 Enterococcus faecium Blood Specimens AMP CIP GM500 LNZ NIT* VAN % SUS 16 6 88 94 0 97
ALL Ages # SUS 5 2 28 30 0 31 # TESTED 32 32 32 32 32 32 *, for urninary tract infections only Resistance rates in enterococci have not changed significantly over the last four years. However, the potential for resistance to vancomycin (VRE) is now a much greater concern. Enterococcal species identification is only performed for sterile site isolates but vancomycin resistance is confirmed for all clinically relevant isolates, regardless of specimen site. In 2008, resistance to vancomycin was 2%, which included 3 VRE bacteremic episodes and 29 non-sterile site isolates, primarily urine specimens. Similar findings were observed in 2007.

University of Alberta Hospital Antibiogram 2007
37
Staphylococcus aureus – MSSA All Specimen Sources FAZ CIP CLIN CLOX ERY GEN LNZ NIT PEN SXT VAN All Patients % SUS 100 90 78 100 76 95 100 100 17 96 100
ALL Ages # SUS 1296 929 1031 1316 996 1241 1300 1304 227 1247 1302 # TESTED 1299 1034 1318 1318 1318 1303 1300 1305 1305 1305 1306
% SUS 100 88 78 100 75 95 100 100 19 96 100 > 17 years # SUS 1002 700 798 1017 769 956 1014 1007 196 969 1007
# TESTED 1005 797 1019 1019 1019 1007 1014 1008 1011 1008 1009 % SUS 100 97 78 100 76 96 100 100 11 94 99
< 17 years # SUS 293 228 232 298 226 284 294 296 31 277 294 # TESTED 293 236 298 298 298 295 294 296 293 296 296
% SUS 98 84 71 98 68 95 100 100 19 98 99 UAH 3C3/3C4 # SUS 98 58 71 98 68 94 99 99 19 98 99
# TESTED 100 69 100 100 100 99 99 99 100 100 100
% SUS 98 90 80 100 78 100 100 100 10 100 100 UAH 3C2 # SUS 39 28 33 41 32 40 40 40 4 41 40
# TESTED 40 31 41 41 41 40 40 40 41 41 40 % SUS 100 97 86 100 85 98 100 100 15 91 100 CCI # SUS 64 56 56 65 55 63 63 64 10 59 64
# TESTED 64 58 65 65 65 64 63 64 65 65 64

University of Alberta Hospital Antibiogram 2007
38
Staphylococcus aureus - MRSA All Specimen Sources CIP CLIN CLOX ERY GEN LNZ NIT RIF TET SXT VAN % SUS 7 88 0 3 96 100 100 100 95 100 100
Community-associated # SUS 4 64 0 2 69 72 72 73 69 73 73 # TESTED 55 73 73 73 72 72 72 73 73 73 73
% SUS 0 0 0 0 34 100 100 100 32 34 100 Hospital-associated # SUS 0 0 0 0 26 77 77 77 25 26 77
# TESTED 60 77 77 77 77 77 77 77 77 77 77
Resistance and isolation rates of S. aureus (ie. MSSA) remain relatively stable. However, the prevalence of methicillin-resistant S.aureus (MRSA) isolates, which are resistant to all β-lactam antibiotics, has increased over the past several years. MRSA strains may be referred to as ‘community-associated’ (CA) or ‘hospital-associated’ (HA) which, in the context of this antibiogram, primarily differ based on the degree of non-β-lactam antibiotic resistance. CA-MRSA tend to be more predictably susceptible to clindamycin, gentamicin, and trimethoprim-sulphamethoxazole than HA-MRSA but this distinction technically requires molecular genotyping that is not routinely available. The annual isolation rate of MRSA relative to all S. aureus from 2004 to 2008 was 4%, 7%, 18%, 25%, and 28%, respectively. In 2008, 529 (470 Adult, 59 Pediatric) MRSA isolates were identified with susceptibility testing but genotype data is available only for the subset displayed in the table; no linezolid resistance and only one isolate with intermediate vancomycin resistance (VISA) were detected. Similarly, 438 (414 Adult, 24 Pediatric) MRSA were identified in 2007 and all were susceptible to linezolid and vancomycin. CA-MRSA resistance to clindamycin was 12% in 2007 (n=73) and increased to 29% in 2008 (n=100) while resistance to gentamicin and trimethoprim-sulphamethoxazole in 2007-08 remained less than 5%, similar to MSSA.

University of Alberta Hospital Antibiogram 2007
39
Staphylococcus species, coagulase-negative All Specimen Sources FAZ CIP CLIN CLOX ERY GEN NIT PEN SXT VAN All Patients % SUS 39 49 51 39 32 69 99 10 49 100
# SUS 120 139 164 126 101 194 281 32 148 315 ALL Ages # TESTED 307 282 320 320 320 282 284 318 304 315
% SUS 38 45 50 38 30 68 99 10 45 100 # SUS 97 105 134 101 80 160 234 27 116 263 > 17 years old
# TESTED 257 235 268 265 267 234 236 266 256 263 % SUS 46 72 58 52 40 71 98 10 62 100 # SUS 23 34 30 27 21 34 47 5 32 52 < 17 years old
# TESTED 50 47 52 52 52 48 48 52 52 52
% SUS 22 30 32 20 20 55 100 12 35 100 # SUS 5 6 8 5 5 11 20 3 8 25 UAH 3C3/3C4
# TESTED 23 20 25 25 25 20 20 25 23 25 Staphylococcus lugdunensis All Specimen Sources FAZ CIP CLIN CLOX ERY GEN NIT PEN SXT VAN % SUS 100 90 73 100 77 97 100 67 73 100
ALL Ages # SUS 30 26 22 30 23 28 29 20 22 30 # TESTED 30 29 30 30 30 29 29 30 30 30
% SUS 100 89 75 100 79 96 100 64 71 100 > 17 years # SUS 28 24 21 28 22 27 27 18 20 28
# TESTED 28 27 28 28 28 28 27 28 28 28

University of Alberta Hospital Antibiogram 2007
40
Viridans Group Streptococci All Specimen Sources CRO PEN VAN % SUS 100 82 100
# SUS 104 85 104 ALL Ages # TESTED 104 104 104
% SUS 100 86 100 # SUS 83 71 83 > 17 years
# TESTED 83 83 83 % SUS 100 67 100 # SUS 21 14 21 < 17 years
# TESTED 21 21 21
Streptococcus anginosis group All Specimen Sources CRO PEN VAN % SUS 100 97 100
ALL Ages # SUS 95 92 95 # TESTED 95 95 95

University of Alberta Hospital Antibiogram 2007
41
Streptococcus pneumoniae All Specimen Sources CRO ERY LEV MERO PEN SXT VAN All Patients % SUS 100 80 100 96 91 75 100
# SUS 207 185 244 165 223 172 237 ALL Ages # TESTED 208 231 244 171 245 230 237
% SUS 99 81 100 99 95 77 100 # SUS 144 135 177 118 168 127 172 > 17 years old
# TESTED 145 166 177 119 177 166 172 % SUS 100 77 100 90 81 70 100
# SUS 63 49 66 47 54 44 65 < 17 years old
# TESTED 63 64 66 52 67 63 65 % SUS 100 83 100 100 94 78 100 # SUS 28 30 36 22 34 28 35 UAH 3C3/3C4
# TESTED 28 36 36 22 36 36 35 Streptococcus pyogenes All Specimen Sources CLIN ERY PEN % SUS 71 70 100
# SUS 45 44 59 ALL Ages # TESTED 63 63 59
As of 2008, penicillin susceptibility interpretations for all pneumococcal isolates are reported in three categories to account for penicillin pharmacodynamics in cases of meningitis, non-meningeal infections, or oral penicillin V therapy; resistance for 2008 was 14%, 4%, and 14%, respectively. Similarly, ceftriaxone rates for meningeal and non-meningeal infections were 6% and 2%, respectively. Note, these rates do not reflect actual cases of pneumococcal meningitis. Resistance to the macrolides in S. pneumoniae is a global problem; Canadian rates have been steadily increasing for the past decade and reached ~25% in 2007. This is mirrored by our hospital rate, which has increased from 14% in 2006, to 20% in 2007, to 26% in 2008. No vancomycin resistance has been detected to date in S. pneumoniae. Trimethoprim-sulphamethoxazole resistance has remained stable at ~25% for the last several years and quinolone resistance is rare.

University of Alberta Hospital Antibiogram 2007
42
Candida species All Specimen Sources AMB 5-FC ITRA FLUC VORI CASP
C. albicans % SUS 98 94 90 99 100 95 ALL Ages # SUS 84 81 77 85 86 82
# TESTED 86 86 86 86 86 86
C. glabrata % SUS 93 100 4 67 86 100 ALL Ages # SUS 53 57 2 38 49 57
# TESTED 57 57 57 57 57 57
C. parapsilosis % SUS 80 100 87 100 100 100 ALL Ages # SUS 12 15 13 15 15 15
# TESTED 15 15 15 15 15 15
C. tropicalis % SUS 77 100 54 100 100 92 ALL Ages # SUS 10 13 7 13 13 12
# TESTED 13 13 13 13 13 13
C. albicans and C. glabrata comprise more than 80% of all Candida isolated from sterile-sites. This has remained unchanged since 2005 when UAH yeast susceptibility results were first published. C. albicans are predictably susceptible to most antifungal agents. However, C. glabrata exhibit significant resistance to fluconazole (30%), which is consistent with global resistance rates.


![LEVOFLOXACIN - levofloxacin injection, solution, concentrate...levofloxacin, in patients who experience any of these serious adverse reactions [see Warnings and Precautions (5.1)]](https://img.dokumen.tips/doc/110x75/60bf476c7282de4455581c59/levofloxacin-levofloxacin-injection-solution-concentrate-levofloxacin-in.jpg)