Embed Size (px)
Citation preview
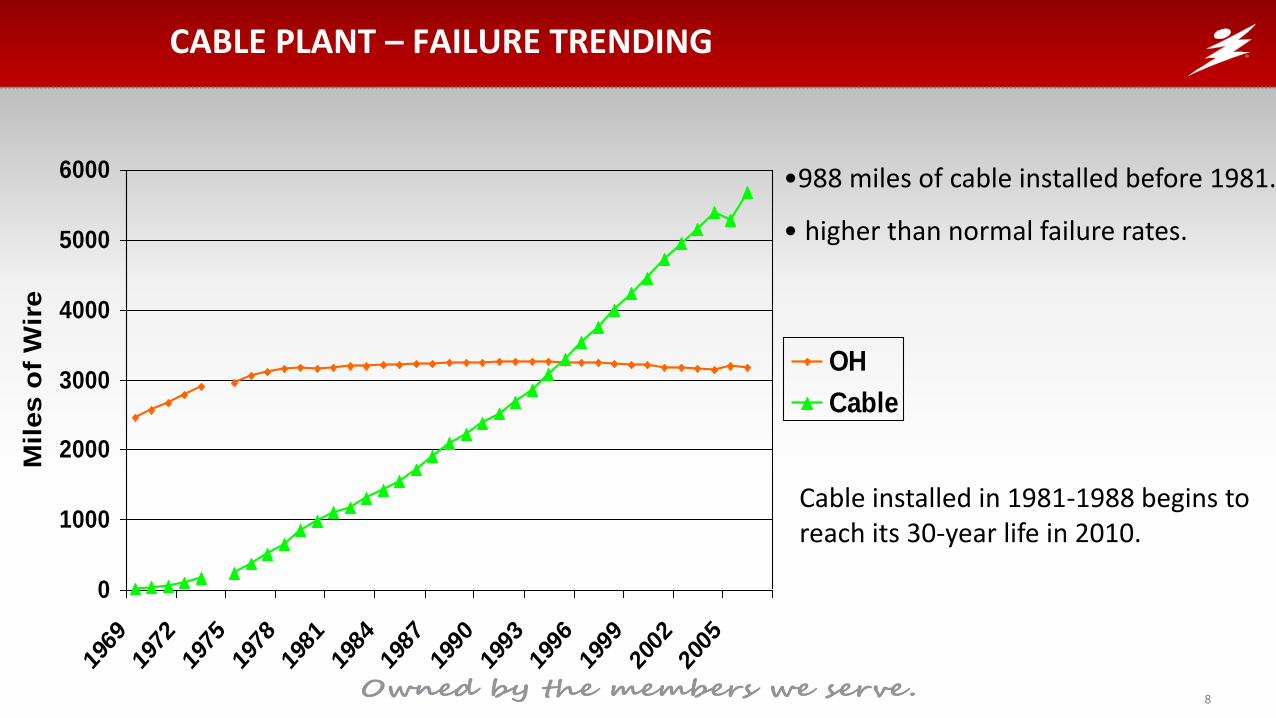
DISTRIBUTION SYSTEM PLANNING TUTORIAL
MN Power Systems Conference
November 6, 2014

2
CONNEXUS ENERGY
• 128,000 customers
• 1,000 sq. miles territory
• 44 substations
• 8,800 miles distribution
• 12.47 kV
• Wholesale supplier –
Great River Energy
Hwy 10
Hwy 65
3
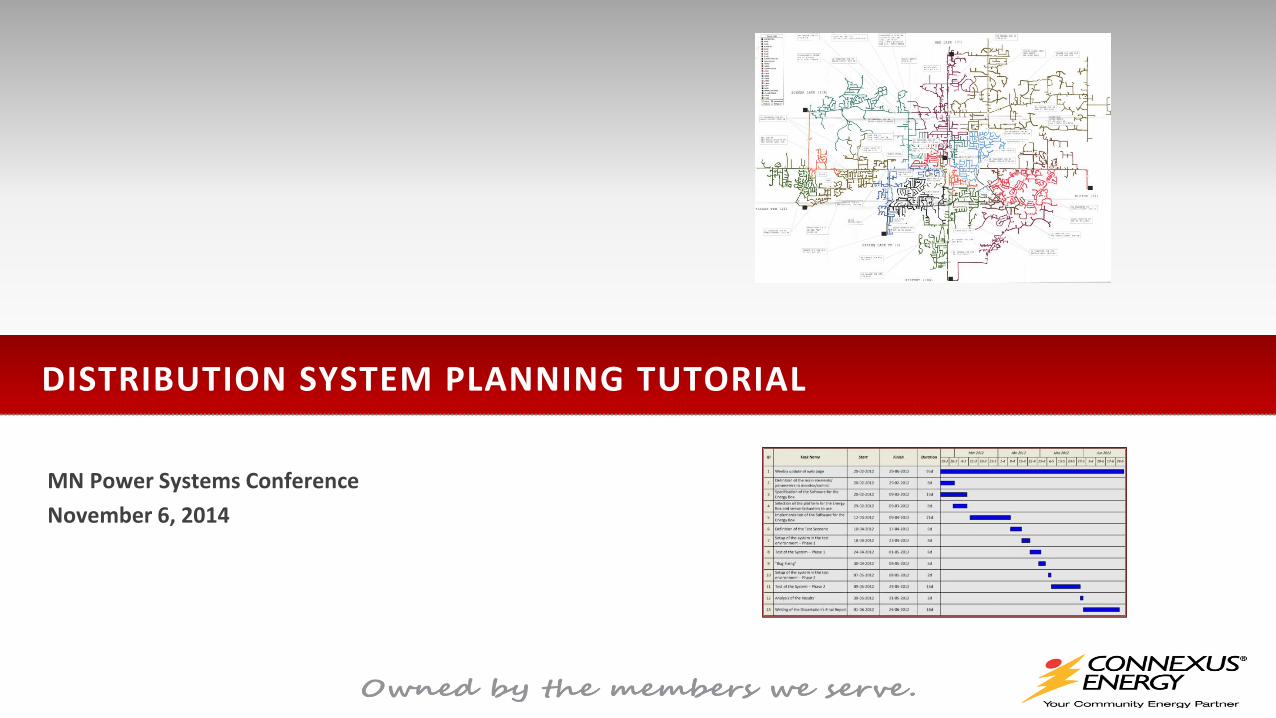
OUTLINE
Planning – reacting “Reactive Planning”
• Externalities – stuff comes up not planned for
• Reactive Planning
Backfeeding – Contingency Planning
• Emergency vs Alternate Normal
• Capacity Planning
Case Example – Johnsville Transformer Failure
• Capacity Planning
• Reactive Planning
• Contingency Event

4
“REACTIVE PLANNING”
Events or Plans by Others – direct effect to Distribution Plant • Road construction (road moves) • Infrastructure failure (cable)
New “Opportunities” • New developments (why didn’t we hear about his last year?) • Large Load Development – ex: Data center
Other “Externalities” • Economic changes (crash of 2008) • Conservation (by plan, or trying reducing due to higher energy costs) Need to plan; scan your environment ; be prepared to react; adjust (re-create) the “plan” Quote by a Senior Planning Engineer: “the forecast will never be correct”
Review
Forecast
Identify Solutions
Select
Construct
“Adjust” plan

5
PLANS BY OTHERS… ROAD CONSTRUCTION
Distribution Lines Located in Public Road Right-of-way • Permitting required for construction • No “easement” cost • Risk – utility bears cost if needed due to road construction
Can We Plan for Road Work? • Plan “road moves” capital budget • Challenge: Entities have plan, not always executed to plan • Often details not defined until after utility budgeting season • Road projects often crop up during the year

6
ROAD MOVE “PLANNING”
Planning Year Construction Year
System Analysis & Engineering Planning
Complete
Contact Rd Agencies for Plans24
Budget Plan Complete
Receive Final Schedule / Details from Rd Agencies
Rd Construction Start
Rd Construction Complete
Design (or redesign) time Permitting Construction time Variance to “planned” budget

7
ROAD MOVE PLANNING – ANNUAL CAPITAL SPENDING
0.00
0.20
0.40
0.60
0.80
1.00
1.20
1.40
2006 2007 2008 2009 2010 2011 2012 2013
Mean Median Std Deviation
1.00 1.01 0.22
8
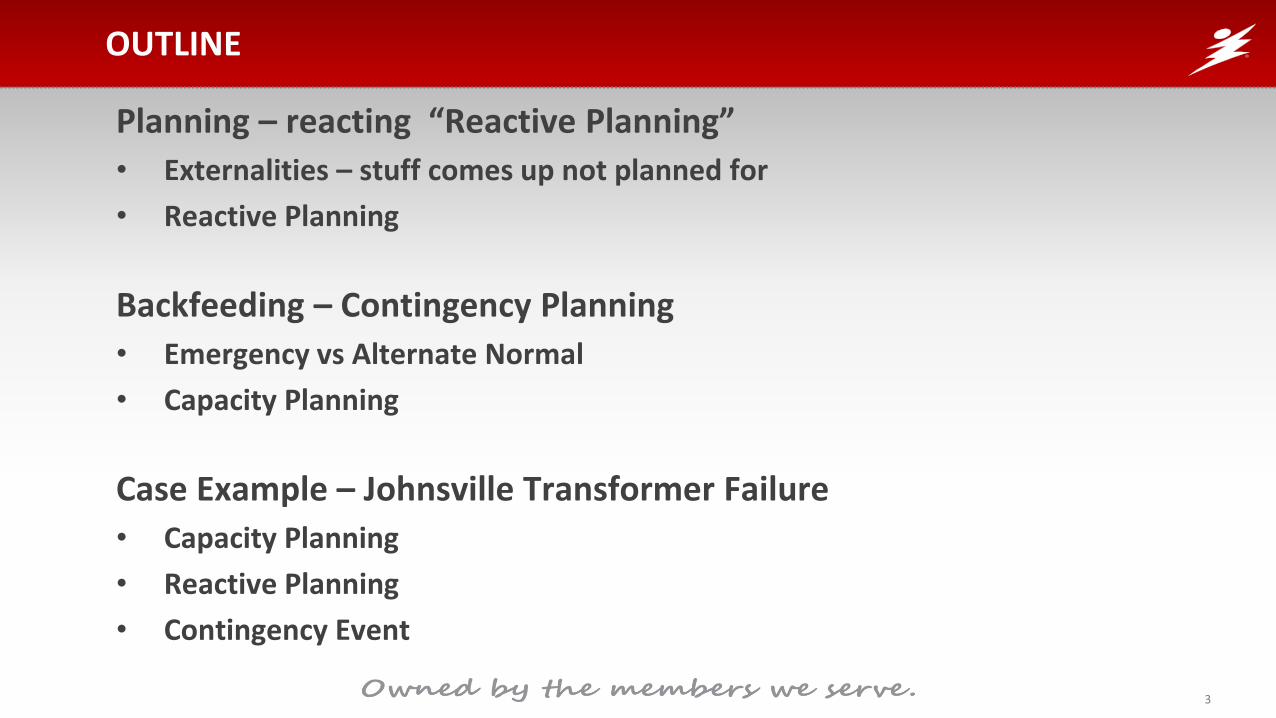
CABLE PLANT – FAILURE TRENDING
0
1000
2000
3000
4000
5000
6000
1969
1972
1975
1978
1981
1984
1987
1990
1993
1996
1999
2002
2005
Mil
es o
f W
ire
OH
Cable
•988 miles of cable installed before 1981.
• higher than normal failure rates.
Cable installed in 1981-1988 begins to reach its 30-year life in 2010.

9
MAINLINE CABLE FAILURE – ANNUAL CAPITAL SPENDING
0.00
0.20
0.40
0.60
0.80
1.00
1.20
1.40
1.60
1.80
2006 2007 2008 2009 2010 2011 2012 2013
Mean Median Std Deviation
1.00 1.13 0.49

10
SYSTEM EXPANSION & IMPROVEMENTS – ANNUAL CAPITAL SPENDING
0.00
0.20
0.40
0.60
0.80
1.00
1.20
1.40
1.60
2006 2007 2008 2009 2010 2011 2012 2013
Mean Median Std Deviation
1.00 0.98 0.30
Capacity, Voltage, Protection
11
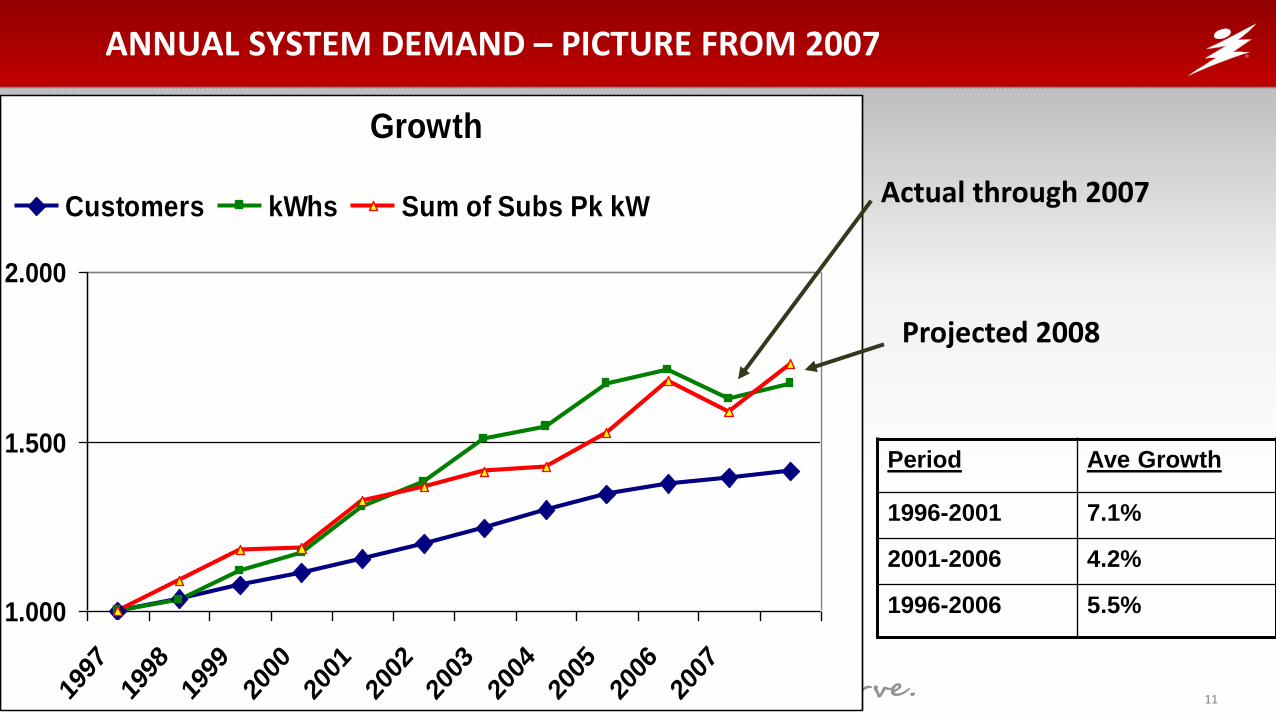
ANNUAL SYSTEM DEMAND – PICTURE FROM 2007
Growth
1.000
1.500
2.000
1997
1998
1999
2000
2001
2002
2003
2004
2005
2006
2007
Customers kWhs Sum of Subs Pk kW
Period Ave Growth
1996-2001 7.1%
2001-2006 4.2%
1996-2006 5.5%
Actual through 2007
Projected 2008

12
TREND FOR HISTORY VS ACTUAL DEMAND
Average Annual Growth 0.43%
0
100
200
300
400
500
600
700
800
900
2006 2007 2008 2009 2010 2011 2012 2013 2014 2015
Annual Growth
5.00%
Total System Demand - MW

13
COMPARISON – LINE CONSTRUCTION ACTIVITIES
0.00
0.20
0.40
0.60
0.80
1.00
1.20
1.40
1.60
1.80
2006 2007 2008 2009 2010 2011 2012 2013
System Expansion
Road Moves
Cable Replacement

14
TOTALIZED – LINE CONSTRUCTION ACTIVITIES
34
34 2006 2007 2008 2009 2010 2011 2012 2013
Cable Replacement
Road Moves
System Expansion
1.29
34% 39% 40%
49% 37% 35%
13%
42%
43% 43%
46%
44%
60% 53%
70%
41%
23%
18%
14%
7%
3% 12% 17%
17%
Std Deviation
0.18 1.17
1.05
0.66
0.95 0.95 0.94 0.98
Per unit of average

15
KEYS TO REACTIVE PLANNING
How to react to global shift?
• Continue towards long range plan
• Shift time frame of execution
How to minimize capital costs but be ready to serve?
• Defer major investment until absolutely needed;
• Reduce lead time to complete
Review
Forecast
Identify Solutions
Select
Construct

16
ALMOST NEED A SUBSTATION????
Example Problem: Load is close to needing substation expansion, but not quite…
Or… 1. Risk high dollar expenditure and the load doesn’t come?
2. Risk deferring the substation, load comes and cannot build fast enough to meet demand?
Economic Risk Reliability / customer service risk
Substation Elements:
• Engineering • Land Acquisition • Site Preparation
• Structures • Bus work / switchgear • Transformer
Plan: Do Up Front (Preparation)
Defer – React: Do when absolutely needed
“Plan - Defer - React”

17
CONTINGENCY PLANNING (AND REACTING…)

18
CONTINGENCY PLANNING
Build plant to handle loss / failure / needed alternate source of power
Issues to address:
• Investment made Reliability; Revenue
Duration of backfeed • Emergency only? • Extended? (“alternate normal”)
Use emergency equipment ratings, or normal load ratings?
Design contingency operation; • ANSI A (110 volts at meter) • ANSI B (114 volts at meter)
Use N-1? What do you do if event becomes N-2?
To what level of capacity to you build additional plant for contingency operations? • 100% of peak load • Less than 100%
Need plan for a 100% peak event Need operational plan to execute

19
LOAD DURATION CURVE – PEAK LOAD
0%
10%
20%
30%
40%
50%
60%
70%
80%
90%
100%
Peak without AC 106 %
Controllable AC potential - 100% penetration
93% peak ->20 hrs/yr (0.22%)93 %
82 % Total residential central AC demand
Peaking Load - 330 hrs
20
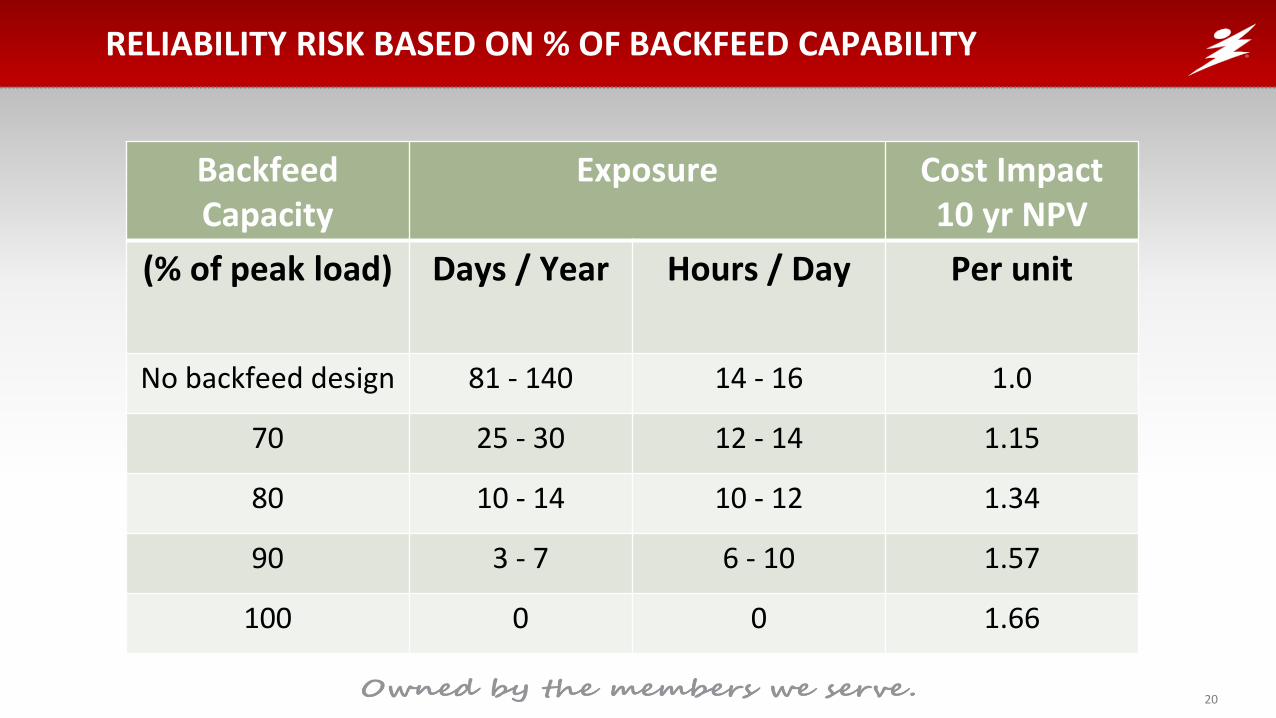
RELIABILITY RISK BASED ON % OF BACKFEED CAPABILITY
Backfeed Capacity
Exposure Cost Impact 10 yr NPV
(% of peak load)
Days / Year Hours / Day Per unit
No backfeed design 81 - 140 14 - 16 1.0
70 25 - 30 12 - 14 1.15
80 10 - 14 10 - 12 1.34
90 3 - 7 6 - 10 1.57
100 0 0 1.66

21
EQUIPMENT LOADING – “NORMAL” VS “EMERGENCY”
Plant Equipment “Normal” “Emergency” Incremental capacity (%)
Cable (750 MCM Al) 475 532 12%
OH Wire (4/0 ACSR) 330 440 33%
Substation Transformer 28 MVA 35 MVA 25%

22
STRATEGY ELEMENTS
Planning & Design Strategy: • Design feeders into multiple sections – backfeed per section • Shift load to 2nd tier substation – leverage existing transformer capacity • High probability of extended backfeed? Consider “normal load ratings” for contingency
plan • Quantify and understand the risk (voltage, capacity, degree of shortfall) • Have spare equipment (i.e., transformer) ready to roll
Operational Strategy: • Plan for placing emergency transformer in service in 24 hours. • Have a plan for contingency system operation • Have a plan to execute the plan !

23
JOHNSVILLE SUBSTATION – FEEDER TIES TO 1ST TIER SUBS
BLN
HAM
APT
SLP
VTN
BUL
JON

24
SCADA TRACE – TRANSFORMER TEMPERATURE

25
TRANSFORMER DAMAGE

26
CONTINGENCY PLANNING
Feeder BF Source Details (Range B requirement is 114 v.) ResultJON01 HAM04 106.9 v. 6.1 MW un-served
JON06 > 114 v. not applicable
SLP02 109.6 v. 6.1 MW un-served
JON01 Sec 1 SLP02
"Section Switch" is TP disconnects 2170-S: 111.7 v.; 4/0
ACSR 102% 4.7 MW un-served
JON01 Sec 2 HAM04
> 114 v.; ALSO > 114 v. if HAM04 BF JON02 with JON01
Sec 2; BUT 110.5 v. & 4/0 ACSR 114% if HAM04 BF JON02
& 03 with JON01 Sec 2 1.8 MW OK
JON02 HAM04 > 114 v. 2.8 MW OK
JON03 > 114 v. not applicable
JON03 JON02 > 114 v. not applicable
JON02 -HAM04 112.2 v. 2.2 MW un-served
JON04 BLN05 110.1 v. 4.4 MW un-served
HAM02 112.2 v.; 4/0 ACSR 109% 4.4 MW un-served
JON04 Sec 1 BLN05 "Section Switch" is disconnects 475-S: 113.6 v. 1.3 MW un-served
JON04 Sec 2 HAM02 > 114 v. 3.1 MW OK
JON05 APT05 > 114 v. 4.6 MW OK
JON06 > 114 v. not applicable
JON06 JON01 > 114 v. not applicable
JON05 > 114 v. not applicable
SLP06 113.8 v. 5.0 MW un-served

27
LOADING SUMMARY
Projected peak: 24.8 MVA
Backfeed ability through distribution: 12.3 MW (~50%)
• System as is
• Plant normal load ratings
Feeder sectionalizing enhancement 5 MW
___________________________________________________
Remaining shortfall: ~7.5 MW (~30%)
28
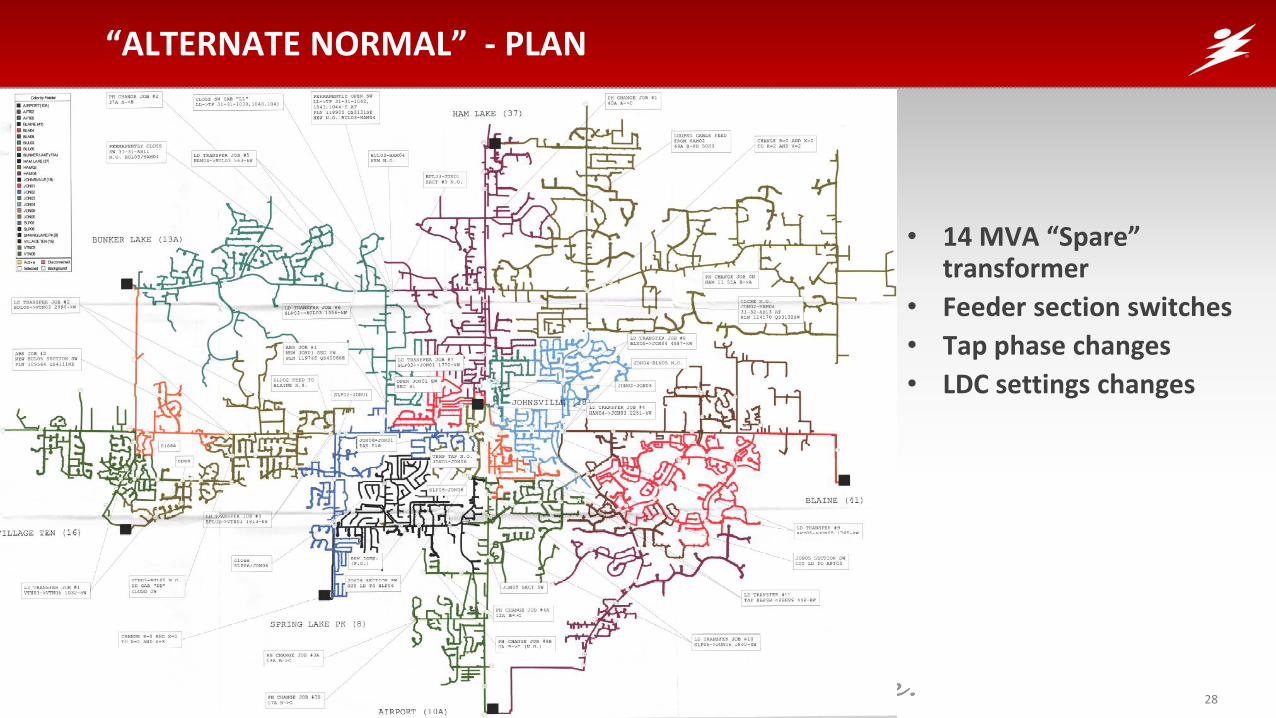
“ALTERNATE NORMAL” - PLAN
• 14 MVA “Spare” transformer
• Feeder section switches
• Tap phase changes
• LDC settings changes

29
N-2 RISK….
Feeder BF Source Details (Range B requirement is 114 v.) Result
HAM04 JON01 111.2 v. 4.4 MW un-served
SLP02 JON01 > 114 v. 4.8 MW OK
HAM04 JON02 > 114 v. 4.4 MW OK
BLN05 JON04 112.7 v., 4/0 ACSR 107% 6.7 MW un-served
HAM02 JON04 111.0 v., 4/0 ACSR 105% 6.1 MW un-served
APT05 JON05 > 114 v. 4.3 MW OK
SLP06 JON06 > 114 v. 3.6 MW OK
With 14 MVA spare transformer, backfeed to OTHER subs still short by 8 MW

30
CONTINUING CHANGE / EVOLUTION
Business Drivers:
Grid efficiency
Conservation
Reliability
Tools & Strategies:
IVVC – Integrated Volt/VAR Control
CVR – Conservation Voltage Reduction
FLISR – Fault Detection, Isolation, System Restoration
Line Sensors
AMI
DMS – Demand Management System
Communications System

31