Embed Size (px)
Citation preview

2168-6750 (c) 2016 IEEE. Personal use is permitted, but republication/redistribution requires IEEE permission. See http://www.ieee.org/publications_standards/publications/rights/index.html for more information.
This article has been accepted for publication in a future issue of this journal, but has not been fully edited. Content may change prior to final publication. Citation information: DOI 10.1109/TETC.2016.2597546, IEEETransactions on Emerging Topics in Computing
1
Distribution Based Workload Modelling ofContinuous Queries in Clouds
Alireza Khoshkbarforoushha, Rajiv Ranjan, SMIEEE, Raj Gaire, Ehsan Abbasnejad, Lizhe Wang,SMIEEE, Albert Y. Zomaya, FIEEE
Abstract—Resource usage estimation for managing streaming workload in emerging applications domains such as enterprisecomputing, smart cities, remote healthcare, and astronomy, has emerged as a challenging research problem. Such resourceestimation for processing continuous queries over streaming data is challenging due to: (i) uncertain stream arrival patterns, (ii) need toprocess different mixes of queries, and (iii) varying resource consumption. Existing techniques approximate resource usage for a queryas a single point value which may not be sufficient because it is neither expressive enough nor does it capture the aforementionednature of streaming workload. In this paper, we present a novel approach of using mixture density networks to estimate the wholespectrum of resource usage as probability density functions. We have evaluated our technique using the linear road benchmark andTPC-H in both private and public clouds. The efficiency and applicability of the proposed approach is demonstrated via two novelapplications: i) predictable auto-scaling policy setting which highlights the potential of distribution prediction in consistent definition ofcloud elasticity rules; and ii) a distribution based admission controller which is able to efficiently admit or reject incoming queries basedon probabilistic service level agreements compliance goals.
Index Terms—Data Stream processing workload, Continuous query, Resource usage estimation, Predictable auto-scaling policy,Distribution-based admission controller.
F
1 INTRODUCTION
E FFICIENT resource consumption estimation in responseto a query processing task is central to the design and
development of various workload management strategiessuch as dynamic provisioning, workload scheduling, andadmission control [6], [27]. All of these strategies typicallypossess a prediction module which can provide accurateestimations guidance on run-time operations such as addingmore resources, reordering query execution, or admitting orrejecting an incoming query.
The data stream processing workload mainly consistsof registered continuous queries and data arrival rate dis-tribution models. The key to proper exploitation of elas-ticity is to have intelligence to predict how changing datavelocity and mix of continuous queries will affect the per-formance of the underlying virtualized resources (e.g. CPUutilization). Therefore, building resource usage estimationfor continuous queries is vital, yet challenging due to: (i)variability of the data arrival rates and their distributionmodels (e.g. logistic); (ii) variable resource consumption ofdata stream processing workload; (iii) the need to process
• A Khoshkbarforoushha is with the Department of Computer Science andEngineering, The Australian National University (ANU) and Data61CSIRO, Canberra, Australia.E-mail: [email protected]
• R Ranjan is with the School of Computing Science, Newcastle University,United Kingdom.
• R Gaire is with Data61 CSIRO, Australia.• E Abbasnejad is with the Department of Computer Science and Engineer-
ing, The Australian National University (ANU) and NICTA, Canberra,Australia.
• L. Wang is with Institute of Remote Sensing, Chinese Academy ofSciences, China.
• A Y. Zomaya is with the School of Information Technologies, The Univer-sity of Sydney, Sydney, NSW, Australia.
different mixes of continuous queries; and (iv) uncertainties(e.g. contention) of the underlying cloud resources.
These complexities challenge the task of efficiently pro-cessing such streaming workloads on cloud infrastructureswhere users are charged for every CPU cycle used andevery data byte transferred in and out of the datacenter. Inthis context, cloud service providers have to intelligentlybalance between various variables including compliancewith Service Level Agreements (SLAs) and efficient usageof infrastructure at scales while handling simultaneous peakworkloads from many clients.
Recent work has studied SQL query resource estimationand run-time performance prediction using machine learn-ing (ML) techniques [2], [12], [18]. These techniques treatthe database system as a black box and try to predict basedon the training dataset provided. These techniques offer thepromise of superior estimation accuracy, since they are ableto account for factors such as hardware characteristics of thesystems as well as interaction between various components.All these techniques approximate resource usage for eachquery as a single point value.
Unlike standard SQL queries that may (not) executemultiple times (often each execution is independent of theprevious one), continuous queries are typically registered instream processing systems for a reasonable amount of timeand streams of data flow through the graph of operatorsover this period. Rapidly time-varying data arrival ratesand different query constructs (e.g. time and tuple-basedwindows) cause the resource demand for a given query tofluctuate over time. To illustrate how streaming workloadresource demands fluctuate with time, we executed thefollowing simple CurActiveCars query from a linear roadbenchmark [5]:

2168-6750 (c) 2016 IEEE. Personal use is permitted, but republication/redistribution requires IEEE permission. See http://www.ieee.org/publications_standards/publications/rights/index.html for more information.
This article has been accepted for publication in a future issue of this journal, but has not been fully edited. Content may change prior to final publication. Citation information: DOI 10.1109/TETC.2016.2597546, IEEETransactions on Emerging Topics in Computing
2
Fig. 1: (a) CPU usage of the query against 500 and 10Ktuple/sec arrival rates. (b) Normalized histogram and KDEfitted to CPU usage of CurActiveCars query against 10Kdata arrival rate.
SELECT DISTINCT car idFROM CarSegStr [RANGE 30 SECONDS ] ;
Figure 1 (a) illustrates the CPU usage for this queryagainst two different arrival rates: 500 tuple/sec and 10Ktuple/sec. As expected, the data arrival rates affect thestream processing system resource demand drastically overtime. For example, the fitted Probability Density Function(PDF) of the CPU usage for the query (Fig. 1b), shows thateven though the query is highly likely to consume between20% and 35% CPU, we need to allow for possible peakdemands (i.e. 90%) to avoid a performance hit. Under thesecircumstances, how can we address questions such as: Howmuch memory and CPU share will the query require if the arrivalrates double?,What would be the shape of CPU usage for morecomplex queries?
For problems involving the prediction of continuousvariables (e.g. resource consumption), the single point es-timation which is, in fact, a conditional average, providesonly a very limited description of the properties of thetarget variable. This is particularly true for a data streamprocessing workload in which the mapping to be learned ismulti-valued and the average of several correct target valuesis not necessarily itself a correct value. Therefore, singlepoint resource usage estimation [2], [12], [18] is often notadequate for streaming workload, since it is neither expres-sive enough nor does it capture the multi-modal nature ofthe target data. Continuous queries and streaming workloadresource management strategies rather require techniquesthat provide a holistic picture of resource utilization asa probability distribution. To achieve this, we propose anovel approach for resource usage estimation of data streamprocessing workloads. Our approach is based on the mix-ture density network (MDN) [7], which approximates theprobability distribution over target values.
To illustrate one of the possible advantages of usingthe proposed approach, consider Figure 2. It displays asample predicted PDF and actual CPU usage in terms ofnormalized histogram and fitted Kernel Density Estimation(KDE) for one of the experiments on linear road benchmark[5] queries. As we can see, the estimated PDF approximatesthe actual resource usage PDF closely. The predicted PDFprovides a complete description of the statistical propertiesof the CPU utilization through which we are not only able tocapture the observation point, but also the whole spectrumof the resource usage. In contrast, a best approximation fromthe existing resource estimation techniques [2], [12], [18]
Fig. 2: Sample distribution prediction of CPU usage forNegAccTollStr query. Actual PDF is a fitted KDE functionagainst the actual CPU usage which is used for clarity andcomparison with the prediction.
merely provides the point which is visualized by a solidvertical line. Unlike PDFs, with such estimation we are notable to directly calculate any valuable statistical measures(e.g. variance, confidence interval) about the target data.
1.1 Summary of ContributionsIn summary we make the following contributions:
Distribution-Based Prediction. This paper transfers thesolid technique that is MDN from other computer sciencefields to the cloud and database community. Though otherapproaches such as Conditional Density Estimation Net-work and Random Vector Functional Link are also availableto estimate the PDF, the benefit of using MDN is its abilityto model unknown distributions. In addition, it has alreadybeen successfully applied in other domains such as speechsynthesis.
Resource Modelling of Continuous Queries. We de-velop black-box models for predicting CPU and memory us-age of centralized data stream processing workloads basedon continuous query features and data arrival rates. We alsoconsider resource consumption estimation in the presenceof concurrent executions of a large number of queries. Notethat the approach makes no assumption of the final shapeof distribution which is the key in resource modelling ofstreaming workload as distribution models can be of anyshape and are application specific.
Distribution Based Workload Management. As a con-crete demonstration of exploiting the proposed models,we develop two novel applications: i) predictable auto-scaling policy setting; and ii) distribution based admissioncontroller. In the former, we put forward the claim thatthe workload behaviour distribution prediction providesreliable information enabling consistent auto-scaling policysetting in public clouds. In the latter, we experimentallytake the first step towards developing an admission controlwhich is able to react as per the probabilistic SLA. We eval-uate our models on a real stream processing system, usingboth the linear road [5] and TPC-H (www.tpc.org/tpch)benchmarks on both private and public cloud environments.
2 APPROACH OVERVIEW
Figure 3 shows the workflow of our approach as discussednext. In the proposed approach, we use ML technique to
2168-6750 (c) 2016 IEEE. Personal use is permitted, but republication/redistribution requires IEEE permission. See http://www.ieee.org/publications_standards/publications/rights/index.html for more information.
This article has been accepted for publication in a future issue of this journal, but has not been fully edited. Content may change prior to final publication. Citation information: DOI 10.1109/TETC.2016.2597546, IEEETransactions on Emerging Topics in Computing
3
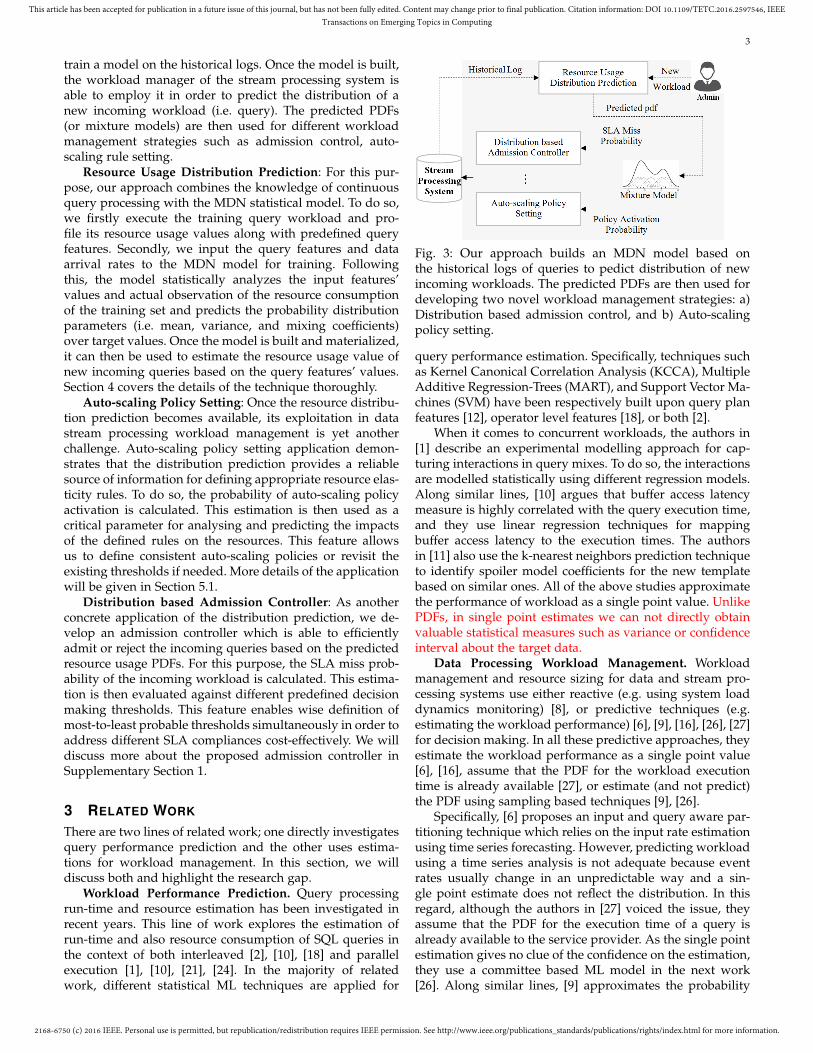
train a model on the historical logs. Once the model is built,the workload manager of the stream processing system isable to employ it in order to predict the distribution of anew incoming workload (i.e. query). The predicted PDFs(or mixture models) are then used for different workloadmanagement strategies such as admission control, auto-scaling rule setting.
Resource Usage Distribution Prediction: For this pur-pose, our approach combines the knowledge of continuousquery processing with the MDN statistical model. To do so,we firstly execute the training query workload and pro-file its resource usage values along with predefined queryfeatures. Secondly, we input the query features and dataarrival rates to the MDN model for training. Followingthis, the model statistically analyzes the input features’values and actual observation of the resource consumptionof the training set and predicts the probability distributionparameters (i.e. mean, variance, and mixing coefficients)over target values. Once the model is built and materialized,it can then be used to estimate the resource usage value ofnew incoming queries based on the query features’ values.Section 4 covers the details of the technique thoroughly.
Auto-scaling Policy Setting: Once the resource distribu-tion prediction becomes available, its exploitation in datastream processing workload management is yet anotherchallenge. Auto-scaling policy setting application demon-strates that the distribution prediction provides a reliablesource of information for defining appropriate resource elas-ticity rules. To do so, the probability of auto-scaling policyactivation is calculated. This estimation is then used as acritical parameter for analysing and predicting the impactsof the defined rules on the resources. This feature allowsus to define consistent auto-scaling policies or revisit theexisting thresholds if needed. More details of the applicationwill be given in Section 5.1.
Distribution based Admission Controller: As anotherconcrete application of the distribution prediction, we de-velop an admission controller which is able to efficientlyadmit or reject the incoming queries based on the predictedresource usage PDFs. For this purpose, the SLA miss prob-ability of the incoming workload is calculated. This estima-tion is then evaluated against different predefined decisionmaking thresholds. This feature enables wise definition ofmost-to-least probable thresholds simultaneously in order toaddress different SLA compliances cost-effectively. We willdiscuss more about the proposed admission controller inSupplementary Section 1.
3 RELATED WORK
There are two lines of related work; one directly investigatesquery performance prediction and the other uses estima-tions for workload management. In this section, we willdiscuss both and highlight the research gap.
Workload Performance Prediction. Query processingrun-time and resource estimation has been investigated inrecent years. This line of work explores the estimation ofrun-time and also resource consumption of SQL queries inthe context of both interleaved [2], [10], [18] and parallelexecution [1], [10], [21], [24]. In the majority of relatedwork, different statistical ML techniques are applied for
Fig. 3: Our approach builds an MDN model based onthe historical logs of queries to pedict distribution of newincoming workloads. The predicted PDFs are then used fordeveloping two novel workload management strategies: a)Distribution based admission control, and b) Auto-scalingpolicy setting.
query performance estimation. Specifically, techniques suchas Kernel Canonical Correlation Analysis (KCCA), MultipleAdditive Regression-Trees (MART), and Support Vector Ma-chines (SVM) have been respectively built upon query planfeatures [12], operator level features [18], or both [2].
When it comes to concurrent workloads, the authors in[1] describe an experimental modelling approach for cap-turing interactions in query mixes. To do so, the interactionsare modelled statistically using different regression models.Along similar lines, [10] argues that buffer access latencymeasure is highly correlated with the query execution time,and they use linear regression techniques for mappingbuffer access latency to the execution times. The authorsin [11] also use the k-nearest neighbors prediction techniqueto identify spoiler model coefficients for the new templatebased on similar ones. All of the above studies approximatethe performance of workload as a single point value. UnlikePDFs, in single point estimates we can not directly obtainvaluable statistical measures such as variance or confidenceinterval about the target data.
Data Processing Workload Management. Workloadmanagement and resource sizing for data and stream pro-cessing systems use either reactive (e.g. using system loaddynamics monitoring) [8], or predictive techniques (e.g.estimating the workload performance) [6], [9], [16], [26], [27]for decision making. In all these predictive approaches, theyestimate the workload performance as a single point value[6], [16], assume that the PDF for the workload executiontime is already available [27], or estimate (and not predict)the PDF using sampling based techniques [9], [26].
Specifically, [6] proposes an input and query aware par-titioning technique which relies on the input rate estimationusing time series forecasting. However, predicting workloadusing a time series analysis is not adequate because eventrates usually change in an unpredictable way and a sin-gle point estimate does not reflect the distribution. In thisregard, although the authors in [27] voiced the issue, theyassume that the PDF for the execution time of a query isalready available to the service provider. As the single pointestimation gives no clue of the confidence on the estimation,they use a committee based ML model in the next work[26]. Along similar lines, [9] approximates the probability

2168-6750 (c) 2016 IEEE. Personal use is permitted, but republication/redistribution requires IEEE permission. See http://www.ieee.org/publications_standards/publications/rights/index.html for more information.
This article has been accepted for publication in a future issue of this journal, but has not been fully edited. Content may change prior to final publication. Citation information: DOI 10.1109/TETC.2016.2597546, IEEETransactions on Emerging Topics in Computing
4
distribution using a histogram-based approach. However,this approach is only a simple approximation of distributionbased on a number of already collected query executiontimes. This means it is incapable of predicting the PDF basedon the features of a new incoming query.
Concluding Remarks. Based on the above discussions,readers may have noticed the broken link between the twothreads of work. Most of the existing techniques for queryresource or performance prediction contemplate the targetas a single point value, whereas the techniques proposed inrecent studies for workload management [9], [26], [27] relyon the whole spectrum of performance or resource usagebecause even in an OLTP workload, queries with the samequery time may follow different query time distributions[27]. The authors in [23] propose a white-box techniquefor quantifying the uncertainties of query execution timeprediction. It treats fixed constant values of operators se-lectivities, unit cost of single CPU or I/O operation asrandom variables and develop analytics techniques to inferdistribution of likely running times. Although the workdiffers to ours as they do not target continuous queriesand resource usage distribution prediction, it does havethe following limitations. The technique is limited to thePostgreSQL optimizer cost model, and more importantly itdoes not consider concurrent query execution.
Our work attempts to address the above issues byproposing a set of black-box models which are able to pre-dict the distribution of resource usage of highly concurrentworkloads. Note that ML algorithms compared to white-boxapproaches [23], [25] ease the task of cost model generationfor increasingly complex data management systems sincethey are able to capture implicitly the internal behaviourof components and their interaction with OS modules interms of their resource footprint. This complexity is furtherintensified in clouds due to the heterogeneity of resourcetypes and uncertainties of the underlying infrastructure.
4 RESOURCE USAGE PREDICTION
4.1 Single Continuous QueryA streaming application is represented by a directed graphwhose vertices are operators and whose edges are streams.In our approach, the continuous query feature set and dataarrival rate distribution models form the input vector. Thisexploits an important observation, that data stream process-ing workload behaviour is predominantly the function ofquery features along with data arrival rates.
Key to the accuracy of a prediction model is the featuresused to train the model. We identify a set of potential fea-tures that affect the stream processing performance and thequery resource usage. The potential features are gatheredby analyzing those considered in related work [2], [12] andthose we observed in various performance test analyses.Intuitively, not all features have high-correlation with thetarget of the model and thus we need to select only thosefeatures with high predictive capability. To this end, weuse a correlation-based feature subset selection method [15]along with best-first search for identifying the most effectiveattributes from feature vector spaces.
Table 1 lists the feature set used as an input to themodel. The attributes are extracted from multiple sources
TABLE 1: Feature input for training model.
Feature Name Description CollectionSource
avg arrival rate Average arrival rate (tu-ple/sec)
DistributionModel
stream no # of data stream sources Query state-ment
subquery no # of nested subqueries Query state-ment
agg func no # of aggregation functions Query state-ment
join predicate # of join predicates in query Query state-ment
project size Projection size of query Query state-ment
equ predicate # of equality selection predi-cates
Query state-ment
inequ predicate # of non equality selectionpredicates
Query state-ment
agg column no # of columns involved inGROUP BY clause
Query state-ment
opt type count # of each operator type inquery plan
Query plan
win type size The size of windows whichis either time unit (sec) intime window or tuple unit(number) in tuple windowtype
Query state-ment
win type slide The sliding value of the win-dow type
Query state-ment
such as query statement text (e.g. win type size), distri-bution model (e.g. avg arrival rate), or query plan (e.g.opt type count). Although previous studies [2] showed thatthe selectivity of operators and cardinality estimates areuseful features for execution time prediction, the reason whythey were not considered in our feature set is discussed insection 4.2.1. Note that the above list is further customizedbased on the target prediction, because attributes have dif-ferent predictive impact on CPU and memory usage estima-tion. A feature that highly correlates memory consumptionmight have no correlation with CPU usage. For example,the feature selection task shows that the window size has aninsignificant effect on CPU usage prediction, while it affectsmemory usage prediction heavily.
4.2 Concurrent Workload
A streaming application typically consists of a number ofcontinuous queries simultaneously being processed by thesystem. This means a resource usage modelling techniquehas to consider resource consumption estimation in the pres-ence of concurrent executions and the combined workloadof a large number of queries.
Queries running concurrently in a mix may either posi-tively or negatively affect each other [1]. Therefore, to modela concurrent workload, we need to study: i) the way asystem runs a batch of queries and applies optimizationsto reflect possible positive interaction in the feature set,and ii) the way queries compete for shared hardware re-sources to identify possible negative effects on the mixperformance. These two issues are studied in the followingsub-subsections respectively.
4.2.1 Stream Processing OptimizationsThe first step toward modelling concurrent workload isfeature set extension. This process is, in fact, adapting the

2168-6750 (c) 2016 IEEE. Personal use is permitted, but republication/redistribution requires IEEE permission. See http://www.ieee.org/publications_standards/publications/rights/index.html for more information.
This article has been accepted for publication in a future issue of this journal, but has not been fully edited. Content may change prior to final publication. Citation information: DOI 10.1109/TETC.2016.2597546, IEEETransactions on Emerging Topics in Computing
5
features for isolated query resource usage prediction toinclude features from concurrent executions. Since the pro-posed technique is based upon continuous query features,the key to successful modelling of combined workloads isthe function of understanding the way the system appliesoptimizations. The main optimization techniques are oper-ator reordering, redundancy elimination, placement, statesharing, and so on [17] that are somewhat supported bytoday’s stream processing systems. For example, Odysseussupports query rewrite (e.g. selection and projection pushdown) and query sharing. Note that the mentioned opti-mization strategies are not exclusive to multi-query execu-tion. However, some strategies such as sub-graph sharingor state sharing are more likely to be applied in the case ofconcurrent workload.
According to the initial feature set selection (Table 1),three optimization strategies including redundancy elimina-tion, state sharing, and reordering need to be investigatedfor feature set extension. Because the others are either i)not applicable due to the scope of this study (e.g. opera-tor placement which is for distributed stream processingenvironment), ii) application specific (e.g. load sheddingthat trades performance against accuracy of results), or iii)related to system performance configuration (e.g. batchingwhich is a typical performance tuning option in streamprocessing systems such as Oracle CEP).
Redundancy Elimination. In case of multiple-queryregistration, a data stream processing system constructsa global query graph, which contains all operators of allcurrently active queries in the system. In this case, a queryoptimization component is used to detect reusable operatorsin different queries. For example, the Odysseus streamprocessing system [3] applies query sharing which usesone operator in case of existing multiple same operators indifferent queries from the sources to the sinks. Therefore,for concurrent workload we include a list of distinct queryexecution plan nodes (i.e. operators) for all the queries inour training set as opposed to a single continuous query.This defines a global feature space to describe all concurrentqueries in the workload.
State Sharing. This strategy optimizes for space byavoiding unnecessary copies of data. For example, contin-uous query language (CQL) implements windows by non-shared array of pointers to shared data items, such that asingle data item might be pointed to from multiple windows[4]. Therefore, when there are multiple window operatorsagainst the same source, we consider the largest windowsize (i.e. win type size) in the feature list.
Operator Reordering. Reordering is profitable whenthere is a chance to move selective operators before costlyones. For example, Odysseus [3] applies selection and pro-jection push-down which avoids unnecessary processing.This optimization which is typically performed by the opti-mizer affects the selectivity ratio (i.e. the number of outputdata items per input data items) of the operator even insingle query execution. However we did not include theselectivity ratio of the operator as a feature to our trainingvector since in a stream processing environment we do nothave control over the selectivity of the operators due to con-sistent data arrival rate fluctuations. Moreover, preliminaryinvestigation of the influence of operator selectivity using
a sampling approach in a set of experiments found that itscontribution to the accuracy of resource usage distributionprediction is negligible.
4.2.2 Resource ContentionWhen multiple queries are registered on the same host,the operators competing for common hardware resourcessuch as disk, memory, or CPU might negatively impactperformance. As we aim at resource usage modelling, theresource contention is not a challenge because our modelscapture the overall resource utilization. This means if thereis a contention we will encounter higher CPU utilization andvice versa. Thus, the contention issue is implicitly handledby our models.
Resource contention hits query performance such aslatency and throughput. Although prediction of these mea-sures is not in the focus of this study, our approach toresource usage modelling paves the way for scrutinizingthe concurrency impact on query performance prediction.Specifically, distribution based prediction of resource uti-lization for a given query when it runs either in isolationor in a mix provides upper and lower bounds of resourceusage. Based on this information, analytical or statisticalmodels (e.g. correlation) are able to describe how queryperformance varies under different resource availability sce-narios.
4.3 Model Selection
The classic statistical ML techniques such as multilayerperceptron (MLP) are able to model the statistical propertiesof data generator. However, if the data has a complexstructure, for example it is a one-to-many mapping, thenthese techniques are inadequate [22]. The scatter plot ofCPU usage against average arrival rates in CurActiveCarsquery (Figure 4) illustrates the multi-valued mapping pointin which for the same arrival rate such as 10K (tuple/sec)there are many CPU usage values which range from 20 to90 percent. This means that the conditional distribution formany input value such as 10K or 9998 is multi-modal. Sucha multi-modality can be poorly represented by the condi-tional average. Therefore, we need a technique that is ableto capture the multi-modal nature of the target data densityfunction. Note that such behavior in data stream processingworkloads is common because the window construct has thepotential to impose such significant variations in resourcedemands even if we disregard arrival rate fluctuations orperformance violation from other workloads.
Our approach employs MDN [7], a special type of Ar-tificial Neural Network (ANN), in which the target (e.g.CPU usage) is represented as a conditional PDF. The condi-tional distribution represents a complete description of datageneration. An MDN fuses a mixture model with an ANN.We utilize a Gaussian Mixture Model (GMM) based MDNwhere the conditional density functions are representedby a weighted mixture of Gaussians. The GMM is a verypowerful way of modelling densities, since it is able tofully describe models by three parameters that determineGaussians and their membership weights. From this density,we can calculate the mean which is the conditional averageof the target data. Moreover, full densities are also used to

2168-6750 (c) 2016 IEEE. Personal use is permitted, but republication/redistribution requires IEEE permission. See http://www.ieee.org/publications_standards/publications/rights/index.html for more information.
This article has been accepted for publication in a future issue of this journal, but has not been fully edited. Content may change prior to final publication. Citation information: DOI 10.1109/TETC.2016.2597546, IEEETransactions on Emerging Topics in Computing
6
Fig. 4: CPU usage of CurActiveCars query against averagearrival rates showing the multi-valued mapping situationfrom the same input.
accurately estimate expectation and variance that are twomain statistics characterizing the distribution.
Figure 5 gives an overview of the approach. The maininput features of the model consists of collected queryfeatures from the CQL statement and query plan. In thisprocess, the neural network is responsible for mapping theinput vector x to the parameters of the mixture model(αi, µi, σ2), which in return provides the conditional distri-bution. In fact, Figure 5 shows a sketchy example MDN with2 components that takes a feature set x of dimensionality4 as input the vector and provides the conditional densityp(t|x) over target t of dimensionality 1.
A number of other approaches such as ConditionalDensity Estimation Network and Random Vector FunctionalLink are also available to estimate the PDF. The benefit ofusing MDN is due to its ability to model unknown distri-butions as exhibited by continuous queries and streamingworkload.
4.3.1 Mixture Density NetworksThe combined structure of feed-forward neural network anda mixture model make an MDN. In MDN, the distributionof the outputs t is described by a parametric model. Theparameters of this model are determined by the outputof a neural network. Specifically, an MDN maps a set ofinput features x to the parameters of a GMM includingmixture weights αi, mean µi, and variance σ2 which in turnproduces the full PDF of an output feature t, conditionedon the input vector p(t|x). Thus, the conditional densityfunction takes the form of GMM as follows:
p(t|x) =M∑i=1
αi(x)φi(t|x) (1)
where M is the number of mixture components, φi is theith Gaussian component’s contribution to the conditionaldensity of the target vector t as follows:
φi(t|x) =1
(2π)c/2σi(x)cexp
{− ||t−µi(x)||2
2σi(x)2
}(2)
The MDN approximates the GMM as:
αi =exp(zαi )∑Mj=1 exp(z
αj )
(3)
σi = exp(zσi ) (4)
Fig. 5: Overview of the proposed approach for predictingthe resource usage distribution of continuous queries.
µi = zµi (5)
where zαi , zσi , and zµi are the outputs of the neural networkcorresponding to the mixture weights, variance, and meanfor the ith Gaussian component in the GMM, given x [7].To constrain the mixture weights to be positive and sum tounity, the softmax function is used in Eq. (3) which relatesthe output of corresponding units in the neural network tothe mixing coefficients. Likewise, the variance parameters(Eq. 4) are related to the outputs of ANN which constrainsthe standard deviations to be positive.
The objective function for training the MDN is to mini-mize the Negative Log Likelihood (NLL) of observed targetdata points given to mixture model parameters:
E = −∑n
ln{∑M
i=1 αi(xn)φi(t
n|xn)}
(6)
Since the ANN part of the MDN provides the mixture modelparameters, the NLL must be minimized with respect tothe network weights. To minimize the error function, thederivatives of the error function with respect to the networkweights are calculated. Specifically, the derivatives of the er-ror are calculated at each network output units including thepriors, means and variances of the mixture model and thenpropagated back through the network to find the derivativesof the error with respect to the network weights. Therefore,non-linear optimization algorithms such as scaled conjugategradients can be applied to MDN training.
5 DISTRIBUTION-BASED WORKLOAD MANAGE-MENT
Before presenting the experimental results of the proposedtechnique, here we discuss its applications to answer the

2168-6750 (c) 2016 IEEE. Personal use is permitted, but republication/redistribution requires IEEE permission. See http://www.ieee.org/publications_standards/publications/rights/index.html for more information.
This article has been accepted for publication in a future issue of this journal, but has not been fully edited. Content may change prior to final publication. Citation information: DOI 10.1109/TETC.2016.2597546, IEEETransactions on Emerging Topics in Computing
7
following key question: Is the proposed approach applicableto resource management problems of stream processingsystems in practice?
5.1 Predictable Auto-Scaling Policy SettingDeveloping efficient and stable auto-scaling techniques incloud environments is a challenging task due to heteroge-neous infrastructure and transient behaviour of workloads.A number of studies approach this problem with the aid ofcontrol theory [19], reinforcement learning [16], and the like.The hard challenge is to determine a suitable policy for thedecision maker (e.g. resource provisioner), as poor policysettings can lead to either resource inefficiency or instability.For example, consider CPU utilization of the NegAccTollStrand its corresponding auto-scaling policies, as shown inFigure 6 (a). Note that these two policies are defined to avoidSLA misses 1 and resource dissipation respectively.
For the NegAccTollStr query, as the peaks go beyond90% within 2 consecutive periods of 1 minute, the firstpolicy is triggered and an additional virtual server is in-stantiated to process the workload (e.g. via stream redi-rectory technique). However, the load may now drop farbelow the predefined threshold of the second policy (i.e.avg(cpu)<15%) as the combined capacity of two virtualservers exceeds the current stream processing demands.Therefore, the second policy is activated and the provisionerdecreases the number of instances to one. This oscillatorybehaviour can continue indefinitely depending on the vari-ation in data stream arrival rate and continuous queryprocessing resource consumption pattern. [19] also reportsthe same observations. To avoid oscillations, [19] developsthe proportional thresholding technique which in fact worksby dynamically configuring the range for the controllervariables. Though this technique can tackle the oscillatoryproblem at run-time, it is incapable of anticipating the effectsof auto-scaling policies before workload execution whichcan lead to SLA violations.
To circumvent the limitation of existing approaches, wepropose a novel approach as discussed next. We perceivethat the reason for the oscillations is due to defining in-consistent policies that are agnostic to changes in work-load behaviour. In our approach such inconsistencies areavoided by exploiting the workload distribution predictionfor specifying and selecting auto-scaling policies. For exam-ple consider SegToll resource usage behaviour as shown inFigure 6 (b) in which only the first policy will be triggered.Based on the workload distribution we do not expect tomeet the second policy and following instability even afterinitial resource resizing.
Based on this observation, we claim that the workloadbehaviour distribution prediction provides more reliableadvice for auto-scaling policy setting. In fact, having the un-derstanding about the upper and lower bound of resourceutilization helps in anticipating auto-scaling policy effectsbeforehand and adjust the configurations accordingly. Inother words, a workload-distribution driven auto-scalingpolicy setting approach can help administrators in definingmore consistent auto-scaling policies.
1. We assume that CPU utilization above 90% leads to SLA misses.We will discuss about this relationship in Supplementary Section 1.
Fig. 6: The CPU utilization of (a) NegAccTollStr and (b) Seg-Toll queries for 5 minutes. The sample auto-scaling policiescause osiliation behaviour in NegAccTollStr workload, sincethey have been defined irrespective of the workload CPUusage distribution.
To validate the hypothesis, we designed an experimentto evaluate whether the predicted distribution is able tocharacterize the most/least probable auto-scaling policies beforethe actual workload execution or not.
Workload: A representative workload was built basedon the Linear Road Benchmark (LRB), LRB Mix EC2. Theworkload contains 5507 execution traces for 17 query mixes.The mixes are at multiprogramming level (MPL) range from2 to 5. All the mixes were logged for about 4 minutes onAmazon t2.micro instance. To make the test workload, werandomly selected 32 mixes of queries – different from thetraining set – at MPL range from 2 to 5.
Auto-scaling Policy Generation: In the next step, 128random auto-scaling policies were generated. The 128 po-lices were randomly split into 32 sets, each corresponds to atest query mix. This means each mix (out of 32 mixes) is runagainst a group of 4 auto-scaling policies. Therefore, beforerunning each of the query mixes, 4 auto-scaling policiesare defined on t2.micro EC2 instance. We developed all thepolicies as per the Amazon EC2 template:Policy Template: Take action A2 whenever {Average, Max,Min} of CPU Utilization is {>,≥, <,≤} than γ for at least{2, 5} consecutive periods of {1, 5} minutes.where the threshold γ was randomly generated in the range(0,100) percent.
Training the Model: We trained the MDN classifierbased on the LRB Mix EC2 training set. We then usedthe trained model to predict the PDFs of CPU usage forthe query mixes of test dataset. In the next step, theprobabilities of the policies were calculated based on thepredicted PDFs before any workload execution takes place.Once probabilities were calculated, all the query mixes wererun one after another against the predefined rules on theEC2 instance and all the activated policies were recordedover the experiment period. The experiment duration wasspecified according to the policy monitoring period. In ourexperiment it was twice the monitoring duration3. Thisworkflow was continued for all 32 mixes in test dataset.
2. In our experiment it is a simple notification email.3. For example, the experiment duration is 4 minutes for a policy
with a monitoring duration of 2 consecutive periods of 1 minute.

2168-6750 (c) 2016 IEEE. Personal use is permitted, but republication/redistribution requires IEEE permission. See http://www.ieee.org/publications_standards/publications/rights/index.html for more information.
This article has been accepted for publication in a future issue of this journal, but has not been fully edited. Content may change prior to final publication. Citation information: DOI 10.1109/TETC.2016.2597546, IEEETransactions on Emerging Topics in Computing
8
Fig. 7: The probabilities of the randomly generated auto-scaling policies for 12 (out of 32) mixes of test queries.Each query mix evaluated against 4 auto-scaling policies asshown in the form of bright and dark coloured bars. Thebright and dark bars within each policy set respectivelyshow the activated and not activated rules at run-time. Ourtechnique has successfully characterized the highly possiblepolicies for all mixes but Mix 4, 8, and 12.
We now discuss how to calculate the auto-scaling policyprobability. To do so, we first compute the probability of theCPU utilization using the following equation:
Pr[a ≤ X ≤ b
]=
∫ b
a
fX(x)dx (7)
Where a random variable X has density fX and the vari-ables a and b are the CPU utilization thresholds. Eq. 7gives the probability of CPU (or memory) utilization withinthe given thresholds. However, the auto-scaling policies arealso dependent on the consecutive occurrence of the events(i.e. the condition). The events that lead to activation ofthresholds are independent of time. Based on the probabilitytheory, assuming independence (i.e., the probability of anevent such as a threshold activation at a given point oftime is independent from the past occurrence of the sametype of event), we can compute the probability of two ormore independent events by multiplying their individualprobabilities. Therefore, the probability of an auto-scalingpolicy occurrence for m consecutive periods is calculated ina general form as:
Probability(policy,m) =m∏k=1
Prk[ak ≤ X ≤ bk
](8)
The above definition relaxes the constraint of hav-ing the same thresholds for arbitrary consecutive peri-ods, though existing auto-scaling frameworks (e.g. AmazonAuto-Scaling Service, Azure Fabric Controller) do not offerthis important feature yet. We note that the PDFs do notreflect the probability of workload behaviour across time.However, we show in our experiment that extending theprobabilities to an arbitrary number of consecutive periodsworks well in practice.
Before discussing the results, let us recap the purpose ofthe experiment. There are 32 rule groups corresponding to32 query mixes. Each group contains 4 auto-scaling policiesof which two are the most and least probable policies asregards to the calculated probabilities. This means theyare highly likely and highly unlikely to be triggered after
workload execution. We now want to evaluate, for example,What percentage of the rules with the highest probability valuesare activated?
Based on the experimental results, we found that 62% ofrules with the highest probability were activated after work-load execution. Moreover, 87% of rules that were character-ized as unlikely to be triggered at run-time also held true(i.e. they were not triggered). Figure 7 displays the resultsfor 12 out of 32 test query mixes. As the bar chart shows, theproposed technique performs well in predicting the mostprobable auto-scaling policies for each policy group. As wecan see, it only failed to characterize the highly possiblepolicies for Mixes 4, 8, and 12.
In summary, these findings clearly demonstrate that ourhypothesis held true and the distribution-based predictionprovides a reliable source of information for predictableauto-scaling policy setting. Apart from its contribution tooscillatory behaviour avoidance, we believe that this featurehelps users to use cloud infrastructure economically wherethey are charged for every CPU cycle used and every databyte transferred in and out of the datacenter.
6 EXPERIMENT
In this section we evaluate the performance of the approachas regards to the state of the art single point predictiontechniques. We conduct our experiment on both public andprivate clouds to evaluate the accuracy of estimations in thepresence of any possible performance variations. However,as we obtained identical results from the experiment onAmazon public cloud, those results are omitted.
6.1 Experimental SetupTwo virtual machine (VM) instances, one for load generationand another as a host for the stream processing system, wereemployed from CSIRO private cloud. The stream generatorsystem was a m1.medium size instance with 4GB RAM, 2VCPU running Ubuntu 12.04.02 Server 64b. All queries wereexecuted on m1.large instance size with 8GB RAM, 4VCPU,and the same OS. The hypervisor is KVM, and the nodes areconnected with 10GB Ethernet.
6.1.1 Dataset and WorkloadTo validate our approach we deployed both linear roadbenchmark (LRB) [5] and slightly modified TPC-H in acommercial centralized stream processing system X.
LRB Workload. This workload has primarily been de-signed for comparing performance characteristics of stream-ing systems. It contains 20 queries with different levels ofcomplexity in terms of execution plan. We treated them astemplate queries. Excluding the ad-hoc query answering setreduced them to 17 template queries. Various arrival rates(e.g. from 100 to 100k tuple/second) along with randomsubstitution of window size (e.g. from 1 to 900 sec.) resultedin 17289 execution traces. To generate data streams, 500MBdata (i.e. 3 hours simulated traffic management data) wasfed into the streaming system using the system’s built-in load generator which played the role of data driver inthe LRB. Each query was registered and logged for morethan 3× of its window size to capture the impacts of timewindows on resource consumption properly.

2168-6750 (c) 2016 IEEE. Personal use is permitted, but republication/redistribution requires IEEE permission. See http://www.ieee.org/publications_standards/publications/rights/index.html for more information.
This article has been accepted for publication in a future issue of this journal, but has not been fully edited. Content may change prior to final publication. Citation information: DOI 10.1109/TETC.2016.2597546, IEEETransactions on Emerging Topics in Computing
9
LRB Mix Workload. To build a representative workloadof concurrent query executions, we collected 585 executiontraces for 18 query mixes. To generate the dataset, differentcombinations of the queries at multiprogramming level(MPL) range from 2 to 17 were randomly selected andregistered in the stream processing system. Once the mixesstart processing of the incoming data streams the CPU andmemory usage of the system are collected.
TPC-H Workload. In contrast to the LRB workload, TPC-H has been designed primarily for DBMSs, though it hasalso been used in stream processing research. In this context,each relation is considered as a data stream source and thetuples are sent toward the stream processing engine over thenetwork using a load generator. Therefore, each registeredquery references a subset of the relations in the input overtime.
We created 0.1GB TPC-H database using the DBGen toolas per the specification. To keep the overall experimentationduration under control we did not use larger databasesize (e.g. 1GB) because the tables are in fact the streamsource material in our experiment and we have to send eachtuple over the network. Quite simply, in 1GB database size,LINEITEM table has 6001215 tuples and even with the 5000tuple/sec rate, it takes more than 20 minutes to send all thetuples over the network. With current hardware, this rateis the maximum consumption rate for queries without anyjoin such as Q1 and Q6. This rate drops to less than 200 forQ8 with 7 data stream sources. As the system X does notsupport correlated sub-queries, we were forced to excludetemplates 4, 11, 15-18, 20-22. We generated 35 executablequery texts using QGen based on the remained 13 TPC-Htemplates queries.
Furthermore, we slightly modified these queries for oursystem to make them compatible with the stream processingcontext. One of the key changes was adding a time windowfor each stream source to let queries show the upper boundof CPU and memory usage. Moreover, some query seman-tics require that tuples not to leave the time window untila certain period of time to be able to produce meaningfulresults. In other words, we needed to keep the first tuplethat enters the time window until the load generator readsand sends the last tuple from the relation source. To this end,we set the time window range to the value of S if the loadgenerator needs S seconds to read and send all the tuples.
The load generator was not allowed to send duplicatetuples. In addition, relations have different cardinalitiesso that in case of multiple stream sources in one query,we set all the time windows to the biggest one. This letthe relation at time t consist of tuples obtained from allelements of stream up to t. For example, in a join betweenLINEITEM (∼600k tuples) and NATION (25 tuples) streams,the latter requires as big a time window as the former to letelements remain in the window until the last tuple from theLINEITEM stream enters the window for processing.
The 35 generated executable queries were registeredseparately in the system X and their performance measuresagainst the fluctuating arrival rates were logged. The ob-tained workload consists of 8783 execution traces.
Performance measures of interests (i.e. CPU and mem-
Fig. 8: Best fit of sent tuple per second against differentdistribution models. The figures contain probability densityof average tuple sent per second for the speed rate of (a)50K and (b)100K for two different queries.
ory) were collected using the dstat4. This is a lightweightPython-based tool that collects OS and system statistics pas-sively, without affecting performance. To guarantee healthyand repeatable data gathering, the execution traces of allqueries were collected several times. Moreover, all querieswere run with cold start making sure the buffers wereflushed and we had a fresh JVM.
Note that all the models are trained and tested as pervarying data arrival rate distribution models. To this end,after setting a certain data arrival rate, the generator typi-cally tries to reach the specified velocity, while adjusting ratebased on engine consumption rate with the aid of a threadsleep function. This means that a query (especially complexones) might be able to consume only 100 tuples per secondeven when we set the load generation rate to 200 tuplesper second. Thus, a few seconds after commencement thebuffer of the stream processing engine is full and the loadgenerator thread sleeps for a few milliseconds to allow theconsumer to exhaust the queue. This situation inherentlyemulates different load generation distribution, for examplefor rate 50K and 100K the distribution is more fit to Weibulland generalized extreme value distribution, as shown inFigure 8.
6.1.2 Training and Testing SettingsTo assess how the result of a predictive model would begeneralized to an independent unforeseen data set, we di-vided the LRB workload randomly into training and testingdatasets with 66% and 34% split rates respectively. For TPC-H workload we used k-fold cross-validation. As regards tothe workload size, 2-fold cross-validation was used to trainand test parameters. For each fold, we randomly assigneddata points to two equal size sets ds1 and ds2. To do so,we shuffled the data array and then divided it in to twoarrays. We then trained on ds1 and tested on ds2, followedby training on ds2 and testing on ds1.
Before training and testing, the input and output featureswere normalized using z-score and min-max normalizationwith range (0.1-0.9). For conducting training and testing, weused a Netlab toolbox [22] which is designed to providethe central tools necessary for the simulation of theoreticallywell founded neural network algorithms and related modelsand in particular MDN. The implemented MDN model usesa MLP as a feed forward neural network, though in generalany non-linear regressor can be utilized.
4. http://dag.wiee.rs/home-made/dstat/

2168-6750 (c) 2016 IEEE. Personal use is permitted, but republication/redistribution requires IEEE permission. See http://www.ieee.org/publications_standards/publications/rights/index.html for more information.
This article has been accepted for publication in a future issue of this journal, but has not been fully edited. Content may change prior to final publication. Citation information: DOI 10.1109/TETC.2016.2597546, IEEETransactions on Emerging Topics in Computing
10
There are a number of hyper-parameters including thenumber of Gaussian components or number of neurons inMLP that need to be specified beforehand. We evaluatedseveral settings and assessed the trade-off between accuracy,training time and overhead. We concluded that a GMM with3 components and 2 neurons per feature in the input vectorprovide an acceptable accuracy within a tolerable overhead.
State of the Art Techniques. To compare the perfor-mance of our approach with single point estimators, weused REPTree and SVM as the alternative techniques. REP-Tree and SVM are the main prediction techniques used in[27] and [2] respectively. Note that [18] also uses a variantof regression trees as a core predictor.
6.2 Evaluation: CPU and Memory UsageTo determine whether a probabilistic model performs wellwe must set the goal of the model because if, for example,a trained MDN assigns some probability to the actual ob-servation, we should be able judge whether the predictionis accurate or not. Therefore, in the following subsection wefirst set the goals and then define appropriate metrics.
6.2.1 Error MetricsThe goal of a probabilistic prediction is to maximize thesharpness of the predictive distributions subject to cali-bration [13]. Sharpness refers to the concentration of thepredictive distributions. Calibration refers to the statisticalconsistency between the PDFs. Our objective is to predictcalibrated PDFs that closely approximate the region inwhich the target lies with proper sharpness. To this end,the Continuous Ranked Probability Score (CRPS) [13] is aproper metric to evaluate the accuracy of PDFs:
CRPS(F, t) =
∫ ∞−∞
[F (x)−O(x, t)
]2dx (9)
where F and O are the Cumulative Distribution Function(CDF) of prediction and observation distributions respec-tively. O(x, t) is a step function that attains the value of 1 ifx ≥ t and the value of 0 otherwise.
To calculate CRPS both the prediction and the observa-tion are converted to CDF. The CRPS compares the differ-ence between CDF of prediction and observation as givenby the hatched area in Figure 9. It can be seen that thearea gets smaller if the prediction distribution concentratesprobability mass near the observation, i.e. the better itapproximates the step function. Moreover, the small CRPSvalue shows that the prediction captures the sharpness ofprediction accurately. After calculating the CRPS for eachprediction, we need to average the values to evaluate thecomplete input set:
CRPS =1
n
n∑i=1
CRPS(Fi, ti) (10)
We are also interested in evaluating the spread of predic-tive density in which our targets lie. The average NegativeLog Predictive Density (NLPD) [14] error metric is used forevaluating this aspect:
NLPD =1
n
n∑i=1
−log(p(ti|xi)) (11)
Fig. 9: (a) predicted PDF and the observation (b) schematicsketch of the CRPS as the difference between CDFs ofprediction and observation.
where n is the number of observations. The NLPD evaluatesthe amount of probability that the model assigns to targetsand penalizes both over and under-confident predictions.
The last metric is the Mean-Square Error (MSE):
MSE =1
n
n∑i=1
(ti −mi)2 (12)
where m refers to the median of the PDFs as point predic-tions for the MDNs. This metric allows us to compare theproposed technique with single point competitors.
6.2.2 Evaluation ResultsThe results for both the proposed approach using MDN andthe single point estimators under CRPS, NLPD, and MSEmetrics are shown in Tables 2 to 4 respectively. Note thatdifferent MDN architectures including 3, 5, and 8 mixturecomponents (M) were evaluated to analyse the influence ofthis hyper-parameter in the model.
TABLE 2: Trained classifiers performance as per LRB work-load.
MDN REPtree SVMRes. M CRPS NLPD MSE MSE MSE
CPU3 0.036 -1.95 0.006
0.008 0.0075 0.128 -0.339 0.0968 0.113 -0.865 0.043
Mem.3 0.042 -3.136 0.010
0.008 0.0155 0.053 -1.465 0.0668 0.065 0.075 0.046
TABLE 3: Trained classifiers performance as per LRB MixWorkload.
MDN REPtree SVMRes. M CRPS NLPD MSE MSE MSE
CPU3 0.114 -0.584 0.032
0.038 0.0135 0.106 -0.544 0.0858 0.099 -0.46 0.056
Mem.3 0.081 -1.96 0.010
0.011 0.025 0.042 -1.33 0.0588 0.068 -1.18 0.042
TABLE 4: Trained classifiers performance as per TPC-Hworkload.
MDN REPtree SVMRes. M CRPS NLPD MSE MSE MSE
CPU3 0.034 -2.04 0.007
0.006 0.0085 0.16 -0.98 0.028 0.154 -0.9 0.02
Mem.3 0.057 -1.9 0.008
0.006 0.0115 0.092 -0.91 0.0948 0.097 -0.67 0.1
All three metrics are negatively oriented scores; hencesmaller value is better. Let us first evaluate the accuracy

2168-6750 (c) 2016 IEEE. Personal use is permitted, but republication/redistribution requires IEEE permission. See http://www.ieee.org/publications_standards/publications/rights/index.html for more information.
This article has been accepted for publication in a future issue of this journal, but has not been fully edited. Content may change prior to final publication. Citation information: DOI 10.1109/TETC.2016.2597546, IEEETransactions on Emerging Topics in Computing
11
of the MDN per se using CRPS and NLPD measures. Aswe can see, in three workloads the error numbers are smallenough to suggest that the proposed model is an appropri-ate one for distribution prediction of data stream process-ing workloads. In LRB Mix workload, sophisticated MDNarchitecture with 8 and 5 components led to respectivelybetter CPU and memory utilization prediction under CRPSmetric. In contrast, both LRB and TPC-H workloads showslightly worse performance as the architecture becomesmore complex.
The MDN shows slightly better performance in memoryutilization prediction of LRB compared with TPC-H in termsof CRPS values, though its performance in CPU predictionin both workloads is nearly identical. This is why the TPC-Hworkload is more complex than LRB as the query templatescombine complicated query plans with various data sources.Although the LRB workload has a wide complexity range ofqueries, all deal with one data stream.
In terms of concurrent workload, as the results show themodel is a reliable predictor for workloads at MPL rangefrom 2 to 17. Specifically, we can see an exact CRPS andMSE values (i.e. .042 and .010) for memory prediction inboth LRB and LRB Mix. However, the MDN has betterperformance in CPU prediction of LRB compared with LRBMix. In this regard, the CRPS error reduces as the MDNarchitecture becomes more complex. This is why the com-bined workloads are much more complex, hence requiresmore sophisticated architecture. We repeated the experimentfor another workload with 5.5K traces on Amazon EC2,observing similar performance. Due to space limitations,those are not reported.
To compare the proposed approach with the state of theart techniques, we need to treat it as single point estimatorand therefore use MSE metric error for comparison. In termsof memory utilization prediction, a closer look at the dataindicates that the MDN outperforms the SVM technique inall the experiments. In LRB and TPC-H, the REPTree showsless error, whereas in LRB Mix the opposite observationholds true. When it comes to CPU prediction, our approachis a better resource usage estimator compared with boththe REPTree and the SVM in LRB workload. In both LRBMix and TPC-H, the MDN performance is in between theREPTree and SVM. To be more specific, in LRB Mix, ourapproach outperforms the REPTree while it shows higherMSE value compared with the SVM.
In summary, our approach outperforms the state ofthe art single point techniques in 8 out of 12 experimentsconducted using the SVM and REPTree. This result is quitepromising because it shows that our approach is not onlyable to predict the full distribution over targets accurately, itis also a reliable single point estimator.
6.3 Training Times and Overhead
In this section we evaluate the training time complexity ofthe proposed models, as well as the overhead of using themat runtime. Table 5 shows the training times as regards todifferent workload sizes. As we can see, the training cost isvery small and it grows linearly as per the training set size.
Prediction Cost. A crucial issue for the deployment ofthe resulting estimation models is the overhead of invoking
TABLE 5: Training times in seconds as regards to differentworkload sizes for 1K iterations.
LRBMix
LRBMix EC2
TPC-H LRB
Workload Size 0.5K 5.5K 8.7K 17.2KElapsed Time (s) 3.2 9.65 11.78 22.62
them at runtime. For this purpose, we measured the elapsedtime for evaluating an MDN model for a given input featureset on a 2.80GHz Intel Core i7, and obtained an overhead ofabout 0.2 ms for each call. These numbers show that theMDN is quick enough to become as an integral part of anyworkload management strategies at runtime.
6.4 Follow-up Applications of Distribution-Based Pre-diction
We presented one of the main applications of our approachin 5.1. To provide a clear picture of what more we canget from the provided prediction technique, we have vi-sualized some sample distribution predictions from a testset of TPC-H workload. Figure 10 plots 14 random samplepredicted PDFs for CPU and memory consumption in whichthey were selected from the model with 3 and 5 GMMcomponents respectively. The histograms of the resourceusage of the whole test dataset are also depicted. EachPDF may (not) belong to different queries as they wereselected randomly from the test datasets, mean that theyare conditioned on different inputs. The dotted vertical lineshows the observation value.
As shown in 10(a) and 10(b), the PDFs successfully ap-proximate the resource usage distributions which are withinthe range [0.1, 0.6] and [0.1, 0.5] for CPU and memory usagerespectively. The models for CPU and memory resource us-age above the values 0.6 and 0.5 are much more uncertain. Inother words, the tendency of all CPU and memory PDFs areto the right hand side of the diagram and this is consistentwith the actual resource usage (i.e. plotted histograms) inwhich we hardly face resource demand above 0.5. Unlikeothers, the PDFs 2, 3, 13, and 14 are bimodal in which twokernels have comparable priors. This means our model isable to capture the multi-modal nature of the target.
These sample PDFs visually show that the MDN is alsoa useful classifier in the classic point estimate sense. Asregards this point, the CPU PDFs compared to memory onesperform better as the sharpness and the spread of predictivedensity is more evenly distributed over the target zone.Although the memory PDFs – particularly 8, 11, 12 and 14– give inaccurate prediction of the target values, they aresuccessful in locating the shape of distributions.
Upper and lower bounds of resource usage simplifiesthe task of performance isolation since, for example, ourpredictions in all figures capture the dominant CPU andmemory usage precisely. SLA specifications and billingmanagement also become more applicable and reliable forboth clients and providers when there is an initial measureof the actual contribution of each workload in terms ofthe overall resource consumption. When it comes to perfor-mance inspection, diagnosing abnormal behavior based onthe predicted numbers is also viable. For example, Figure 10(b) reports that for a given set of queries we will not facepeak memory usage (>0.5) very often, hence superior peak

2168-6750 (c) 2016 IEEE. Personal use is permitted, but republication/redistribution requires IEEE permission. See http://www.ieee.org/publications_standards/publications/rights/index.html for more information.
This article has been accepted for publication in a future issue of this journal, but has not been fully edited. Content may change prior to final publication. Citation information: DOI 10.1109/TETC.2016.2597546, IEEETransactions on Emerging Topics in Computing
12
Fig. 10: Sample PDF predictions for (a) CPU and (b) memory usage from TPC-H workload.
memory usage in the live environment signals the presenceof a fault in the stream processing system.
7 CONCLUSIONS AND FUTURE WORK
This paper presented a novel approach for resource usagedistribution prediction of data stream processing work-loads. We demonstrated that the predicted distributionshave the potential to become an integral component of theautomated workload management systems via developingtwo novel applications: i) predictable auto-scaling policysetting; and ii) a distribution-based admission controller.
For future work, we plan to enhance the MDN to be ableto build prediction models at runtime. For this purpose,with the aid of online learning notions the MDN will berevisited to be able to take an initial guess model and thenpicks up one-one observation from the training set andrecalibrates the weights on each input parameter. Anotherfuture plan is considering the security aspects of large scaledata processing [20], [28], [29] in the proposed applications.
REFERENCES
[1] M. Ahmad, A. Aboulnaga, S. Babu, and K. Munagala. Modelingand exploiting query interactions in database systems. In CIKM,pages 183–192. ACM, 2008.
[2] M. Akdere, U. Cetintemel, M. Riondato, E. Upfal, and S. B. Zdonik.Learning-based query performance modeling and prediction. InICDE, pages 390–401. IEEE, 2012.
[3] H. Appelrath, D. Geesen, M. Grawunder, T. Michelsen, D. Nicklas,et al. Odysseus: a highly customizable framework for creatingefficient event stream management systems. In DEBS, pages 367–368. ACM, 2012.
[4] A. Arasu, S. Babu, and J. Widom. The cql continuous querylanguage: semantic foundations and query execution. The VLDBJournal, 15(2):121–142, 2006.
[5] A. Arasu, M. Cherniack, E. Galvez, D. Maier, A. S. Maskey,E. Ryvkina, M. Stonebraker, and R. Tibbetts. Linear road: a streamdata management benchmark. In VLDB, pages 480–491. VLDBEndowment, 2004.
[6] C. Balkesen, N. Tatbul, and M. T. Ozsu. Adaptive input admissionand management for parallel stream processing. In DEBS, pages15–26. ACM, 2013.
[7] C. M. Bishop. Mixture density networks. 1994.[8] J. Cervino, E. Kalyvianaki, J. Salvachua, and P. Pietzuch. Adaptive
provisioning of stream processing systems in the cloud. In ICDEW,pages 295–301. IEEE, 2012.
[9] Y. Chi, H. Hacıgumus, W.-P. Hsiung, and J. F. Naughton.Distribution-based query scheduling. VLDB, 6(9):673–684, 2013.
[10] J. Duggan, U. Cetintemel, O. Papaemmanouil, and E. Upfal.Performance prediction for concurrent database workloads. InSIGMOD, pages 337–348. ACM, 2011.
[11] J. Duggan, O. Papaemmanouil, U. Cetintemel, and E. Upfal.Contender: A resource modeling approach for concurrent queryperformance prediction. In EDBT, pages 109–120, 2014.
[12] A. Ganapathi, H. Kuno, U. Dayal, J. L. Wiener, A. Fox, M. I. Jordan,and D. Patterson. Predicting multiple metrics for queries: Betterdecisions enabled by machine learning. In ICDE, pages 592–603.IEEE, 2009.
[13] T. Gneiting and A. E. Raftery. Strictly proper scoring rules, predic-tion, and estimation. Journal of the American Statistical Association,102(477):359–378, 2007.
[14] I. J. Good. Rational decisions. Journal of the Royal Statistical Society.,pages 107–114, 1952.
[15] M. A. Hall. Correlation-based feature selection for machine learning.PhD thesis, The University of Waikato, 1999.
[16] T. Heinze, V. Pappalardo, Z. Jerzak, and C. Fetzer. Auto-scalingtechniques for elastic data stream processing. In ICDEW, pages296–302. IEEE, 2014.
[17] M. Hirzel, R. Soule, S. Schneider, B. Gedik, and R. Grimm. Acatalog of stream processing optimizations. ACM ComputingSurveys (CSUR), 46(4):46, 2014.
[18] J. Li, A. C. Konig, V. Narasayya, and S. Chaudhuri. Robustestimation of resource consumption for sql queries using statisticaltechniques. VLDB, 5(11):1555–1566, 2012.
[19] H. C. Lim, S. Babu, and J. S. Chase. Automated control for elasticstorage. In ICAC, pages 1–10. ACM, 2010.
[20] C. Liu, et al. Authorized public auditing of dynamic big datastorage on cloud with efficient verifiable fine-grained updates.TPDS 25.9 (2014): 2234-2244.
[21] B. Mozafari, C. Curino, A. Jindal, and S. Madden. Performanceand resource modeling in highly-concurrent oltp workloads. InSIGMOD, pages 301–312. ACM, 2013.
[22] I. Nabney. NETLAB: algorithms for pattern recognition. SpringerScience & Business Media, 2002.
[23] W. Wu, X. Wu, H. Hacıgumus, and J. F. Naughton. Uncertaintyaware query execution time prediction. VLDB, 7(14):1857–1868,2014.
[24] W. Wu, Y. Chi, H. Hacıgumus, and J. F. Naughton. Towards pre-dicting query execution time for concurrent and dynamic databaseworkloads. VLDB, 6(10):925–936, 2013.
[25] W. Wu, Y. Chi, S. Zhu, J. Tatemura, H. Hacigumus, and J. F.Naughton. Predicting query execution time: Are optimizer costmodels really unusable? In ICDE, pages 1081–1092. IEEE, 2013.
[26] P. Xiong, Y. Chi, S. Zhu, H. Moon, C. Pu, and H. Hacigumus.Smartsla: Cost-sensitive management of virtualized resources forcpu-bound database services. TPDS, 2014.
[27] P. Xiong, Y. Chi, S. Zhu, J. Tatemura, C. Pu, and H. HacigumuS.Activesla: a profit-oriented admission control framework fordatabase-as-a-service providers. In SoCC, page 15. ACM, 2011.
[28] X. Zhang, et al. A hybrid approach for scalable sub-treeanonymization over big data using MapReduce on cloud. JCSS80.5 (2014): 1008-1020.
[29] C. Yang, et al. A spatiotemporal compression based approach forefficient big data processing on cloud. JCSS 80.8 (2014): 1563-1583.


![Continuous Modelling Good Practice Guideresource.npl.co.uk/docs/science_technology/scientific... · 2007. 5. 29. · “Continuous Modelling In Metrology” [1,2,3], and relates it](https://img.dokumen.tips/doc/110x75/6020ede67b7c3416bb7c3149/continuous-modelling-good-practice-2007-5-29-aoecontinuous-modelling-in-metrologya.jpg)