Embed Size (px)
Citation preview

Distractive effects of cellphone use July 2008
Land Transport New Zealand Research Report 349


Distractive effects of cellphone use
Samuel G. Charlton TERNZ Ltd, Auckland and University of Waikato, Hamilton
Land Transport New Zealand Research Report 349

ISBN 978-0-478-30979-9 ISSN 1177-0600
© 2008, Land Transport New Zealand PO Box 2840, Wellington, New Zealand Telephone 64-4 931 8700; Facsimile 64-4 931 8701 Email: [email protected] Website: www.landtransport.govt.nz Charlton, S. G.1,2 2008. Distractive effects of cellphone use. Land Transport NZ Research Report 349. 50 pp. 1 Traffic & Road Safety Research Group, Department of Psychology, University of
Waikato, Private Bag 3105, Hamilton, New Zealand 2 Transport Engineering Research New Zealand Limited, PO Box 97846, South
Auckland Mail Centre, New Zealand Keywords: (in alphabetical order) cellphone, conversation suppression, driver distraction, driving simulator, passenger conversations

An important note for the reader Land Transport New Zealand is a Crown entity established under the Land Transport New Zealand Amendment Act 2004. The objective of Land Transport New Zealand is to allocate resources in a way that contributes to an integrated, safe, responsive and sustainable land transport system. Each year, Land Transport New Zealand invests a portion of its funds on research that contributes to these objectives. The research detailed in this report was commissioned by Land Transport New Zealand. While this report is believed to be correct at the time of its preparation, Land Transport New Zealand, and its employees and agents involved in its preparation and publication, cannot accept any liability for its contents or for any consequences arising from its use. People using the contents of the document, whether directly or indirectly, should apply and rely on their own skill and judgement. They should not rely on its contents in isolation from other sources of advice and information. If necessary, they should seek appropriate legal or other expert advice in relation to their own circumstances, and to the use of this report. The material contained in this report is the output of research and should not be construed in any way as policy adopted by Land Transport New Zealand but may be used in the formulation of future policy.

Acknowledgments
The author would like to thank all of the participating drivers and conversors of
Experiment 1 and the students of Applied Cognition and Neuroscience at the University
of Waikato who participated in Experiment 2 of this research.
Abbreviations and acronyms
ADTC Accelerator distance-to-collision
ART Accelerator reaction time
ATTC Accelerator time-to-collision
BDTC Braking distance-to-collision
BRT Braking reaction time
BTTC Braking time-to-collision
SA Situation awareness

5
Contents
Executive summary ........................................................................................... 7
Abstract............................................................................................................. 9
1. Introduction ............................................................................................11
2. Experiment 1 ...........................................................................................15 2.1 Method .............................................................................................15
2.1.1 Participants ..........................................................................15 2.1.2 Apparatus ............................................................................15 2.1.3 Simulation scenario ...............................................................16 2.1.4 Procedure.............................................................................20
2.2 Results .............................................................................................21 2.2.1 Vehicle speeds ......................................................................21 2.2.2 Reaction times ......................................................................22 2.2.3 Discourse measures...............................................................26 2.2.4 Difficulty ratings, hazard recall and crashes ...............................32 2.2.5 Overtaking ...........................................................................33
2.3 Discussion.........................................................................................33
3. Experiment 2 ...........................................................................................35 3.1 Method .............................................................................................35
3.1.1 Participants ..........................................................................35 3.1.2 Apparatus ............................................................................36 3.1.3 Simulation scenario ...............................................................36 3.1.4 Procedure.............................................................................36
3.2 Results .............................................................................................36 3.3 Discussion.........................................................................................42
4. General discussion ...................................................................................43
5. References...............................................................................................46

6

7
Executive summary
A range of studies has shown that the use of cellphones has adverse consequences on a
driver’s probability of being involved in a crash. One of the most consistent findings is
that drivers’ use of cellphones increases their reaction times to vehicles braking ahead
although other adverse changes in driver behaviour have been reported as well,
including: impaired gap judgements; an increased number of traffic violations; failure to
maintain appropriate headway distances; higher curve speeds; impaired eye scanning;
reduced checking of rearview mirrors; striking pedestrians; impairment of vehicle control
actions; and poor speed management. Of considerable practical interest is whether or not
the cognitive demands and consequent changes in driver behaviour are unique to
cellphone conversations or are an inevitable result of drivers’ concurrent processing of
verbal material. For example, a frequently posited response to the finding that both
handheld and hands-free cellphones increase drivers’ crash risk is that, if conversations
are distracting regardless of phone type, then conversations with in-car passengers must
be equally dangerous.
The purpose of the present study was to investigate the differences between passenger
and hands-free cellphone conversations in a controlled manner. The study compared the
driving performance and conversational characteristics that occurred when drivers
engaged in realistic conversations with: 1) passengers physically present in the car; 2)
cellphone conversors; and 3) remote passengers (who could see the driver’s situation but
were not physically present in the car). Of interest was whether visual access to the
driver’s situation was sufficient to produce the conversation suppression and references to
the immediate driving task found with in-car passengers. The goal of the study was to
identify any differences between drivers’ cellphone conversations and conversations with
passengers in terms of their effects on driving performance. The participants drove a 25.3
km-long simulated road containing five hazards and an overtaking lane using the
University of Waikato driving simulator.
The results clearly indicated that driving while talking to an in-car passenger was
appreciably different from conversing over a cellphone. Drivers talking on a cellphone
often failed to take any action to reduce their speed as they approached the hazards,
resulting in the highest crash rates obtained. Similarly, many of these drivers also failed
to manage the overtaking scenario by increasing their speeds when appropriate. Drivers
with passengers were more likely to anticipate hazards and reduce their speeds,
performing nearly as well as the no-conversation Control group. Differences in discourse
measures gave some insight into why these two groups may have performed so
differently. Drivers and their passengers made shorter utterances, had more frequent
pauses, and were more likely to be talking about the upcoming hazard than the other
conditions. Drivers and their cellphone conversors made the longest utterances, were less
likely to mention the hazards, had the poorest recall of the hazards and the highest crash
rate. The remote passengers tended to have shorter utterances and more utterances
about the hazards than cellphone conversors, but did not display the same number of

DISTRACTIVE EFFECTS OF CELLPHONE USE
8
conversational pauses as in-car passengers and driver performance was nearly as bad as
in the cellphone condition. Drivers who were not conversing (Control group) were the
safest by most measures. These drivers displayed cautious speeds, rapid deceleration
reactions to hazards, good speed management leading to safe overtaking, the fewest
crashes and good recall of the hazards after the drive. The drivers in the Passenger group
displayed a higher number of crashes than the no-conversation drivers indicating that
there is a penalty associated with driving while conversing (perhaps because not all
passengers suppress their conversations when they should).
A second experiment investigated whether a cellphone modified to emit warning tones
could alleviate some of the adverse effects typically associated with cellphone
conversations. The underlying concept is that radio frequency ‘tags’ could be placed on
hazard warning signs, or GPS-capable cellphones could be programmed with maps
containing the locations of known road hazards. In either case, the cellphone would emit
a series of warning beeps as a driver conversing on a cellphone approached a potential
hazard. The results showed that the alerting cellphone was associated with driving
performance nearly as good as that of the no-conversation controls from the previous
experiment. The drivers’ deceleration responses were faster, earlier and further away
from the hazard than those of the Cellphone group. The discourse produced during the
cellphone alerts contained more frequent pauses, more often referred to the driving
situation and had shorter utterances than the Cellphone group. The low number of
crashes observed in this experiment suggested that the alerting cellphone was at least as
effective as passengers at helping drivers prepare for, and respond to, road hazards. In
sum, the alerting cellphone demonstrated an appealing technological possibility for
overcoming many of the unsafe effects associated with drivers conversing on cellphones
as they approach certain types of hazard locations. Additional research examining other
methods of presenting alerting information to drivers regardless of their cellphone use (eg
via in-car navigation aids such as GPS) would be required before any one technological
solution is pursued. Further, future research exploring and comparing the self-paced and
externally paced aspects of other in-car distractions of various durations would be very
useful.
Abstract
9
Abstract
The research systematically compared the driving performance and
conversational patterns of drivers speaking with in-car passengers, hands-
free cellphones, and remote passengers who could see the driver’s current
driving situation (via a window into a driving simulator). Driving performance
suffered during cellphone and remote passenger conversations as compared
with in-car passenger conversations and no-conversation controls in terms of
their approach speeds, reaction times, and avoidance of road and traffic
hazards. Of particular interest was the phenomenon of conversation
suppression, the tendency for passengers to slow their rates of conversation
as the driver approached a hazard. On some occasions these passengers also
offered alerting comments, warning the driver of an approaching hazard.
Neither conversation suppression nor alerting comments were present during
cellphone conversations. Remote passengers offered some alerting comments
but did not display conversation suppression. The data suggested that
conversation suppression is a key factor in maintaining driving performance
and that visual access to the driver’s situation is not sufficient to produce
conversation suppression. A second experiment investigated whether a
cellphone modified to emit warning tones could alleviate some of the adverse
effects typically associated with cellphone conversations. The modified
cellphone produced discourse patterns that were similar to passenger
conversations and driving performance nearly as good as that of drivers who
were not conversing.

DISTRACTIVE EFFECTS OF CELLPHONE USE
10

1. Introduction
11
1. Introduction
A range of studies has shown that the use of cellphones has adverse consequences on a
driver’s probability of being involved in a crash. Epidemiological research has shown that
as little as one hour per month of cellphone use while driving increases a driver’s crash
risk 400–900% (McEvoy et al 2005; Violanti 1998; Violanti and Marshall 1996). A widely
reported case-crossover study found that the risk attached to cellphone conversations by
drivers is comparable to that of alcohol intoxication at the maximum legal limit (0.08
blood alcohol concentration) (Redelmeier and Tibshirani 1997, 2001).
The reasons for the heightened crash risk associated with the use of cellphones have been
examined in a number of laboratory and field studies. One of the most consistent findings
is that drivers’ use of cellphones increases their reaction times to vehicles braking ahead
(Ålm and Nilsson 1994, 1995; Brookhuis et al 1991; Lamble et al 1999; Strayer and
Drews 2004) and responding to stop signs and stop lights (Beede and Kass 2006;
Hancock et al 2003). A meta-analysis of the research findings in this area (Caird et al
2008) reported a mean increase in drivers’ reaction times of 0.25 s (although the authors
noted that this value was probably an underestimate of on-road decrements). A range of
other adverse changes in driver behaviour have been reported as well, including:
impaired gap judgements (Brown et al 1969; Cooper and Zheng 2002); an increased
number of traffic violations (Beede and Kass 2006); failure to maintain appropriate
headway distances (Ålm and Nilsson 1995; Rosenbloom 2006); higher curve speeds
(Charlton 2004); impaired eye scanning (Harbluk et al 2007; Maples et al 2008); reduced
checking of rearview mirrors (Brookhuis et al 1991); striking pedestrians (Kass et al
2007); impairment of vehicle control actions (Treffner and Barrett 2004); and poor speed
management (Ålm and Nilsson 1994; Horberry et al 2006; Rakauskas et al 2004; Törnros
and Bolling 2005, 2006).
Several mechanisms have been proposed to account for the adverse effects of cellphone
conversations on driver performance. Manipulation of handheld cellphones certainly
produces some adverse effects via interference with control actions (Brookhuis et al
1991). Many of the negative effects associated with cellphone conversations, however, do
not appear to be the result of impaired driver control actions. Further, the findings that
use of hands-free cellphones may be just as detrimental as handheld (Horrey and
Wickens 2006; Matthews et al 2003; Patten et al 2004) suggest that cellphone
interference results from cognitive demands of the conversation rather than distraction
due to manipulation. It has been suggested that the cognitive demands of conversing
while driving result in reduced attention to visual inputs (Strayer et al 2003), a form of
inattentional blindness. This suggestion would appear to be supported by findings of
impaired recognition memory for billboards and words presented visually to drivers
conversing on hands-free cellphones (Strayer et al 2003).
Other researchers have argued that concurrent verbal interactions have the effect of
degrading drivers’ situation awareness and as a result, their ability to identify and

DISTRACTIVE EFFECTS OF CELLPHONE USE
12
respond quickly to hazards (Gugerty et al 2004; Kass et al 2007). This interpretation is in
concordance with findings that drivers engaged in a concurrent hands-free verbal task
displayed degraded performance on a range of situation awareness probes (Gugerty et al
2004) and that conversing drivers’ failure to maintain situation awareness was associated
with an increase in range of driving errors (Kass et al 2007). There have also been a wide
range of studies showing that drivers’ ratings of their mental workload increase as a result
of concurrent cellphone tasks and coincide with decrements in their driving performance
(Horberry et al 2006; Lamble et al 1999; Patten 2004; Törnros and Bolling 2006). These
studies suggest that the dual task situation of conversing can exceed a driver’s
momentary attentional capacity, resulting in a tendency to switch attention between the
two tasks. When a driver’s attention is diverted to the conversation task, performance on
those aspects of the driving task that require explicit attentional processing (eg detection
of hazards and decision-making) are impaired, resulting in higher detection thresholds
and longer reaction times (Beede and Kass 2006; Brookhuis et al 1991; Brown et al
1969; Patten et al 2004).
Of considerable practical interest is whether or not the cognitive demands and consequent
changes in visual attention, situation awareness and mental workload are unique to
cellphone conversations or are an inevitable result of drivers’ concurrent processing of
verbal material. For example, a frequently posited response to the finding that both
handheld and hands-free cellphones increase drivers’ crash risk is that, if conversations
are distracting regardless of phone type, then conversations with in-car passengers must
be equally dangerous. This line of argument goes on to maintain that inasmuch as
conversations between a driver and passenger cannot reasonably be prohibited, neither
should drivers’ use of cellphones. Unfortunately, the research literature on this point is
somewhat ambiguous. Epidemiological studies have found that carrying two or more
passengers in the car does increase a driver’s risk of a crash (a two-fold increase), albeit
not as much as talking on a cellphone (a four-fold increase), but there is the suggestion
that this may be primarily an issue for young drivers (McEvoy et al 2007; Neyens and
Boyle 2007).
A laboratory experiment examining drivers engaged in verbal tasks (eg answering general
knowledge and arithmetic questions) failed to find any significant differences between
remote and in-car verbal sources (Amado and Ulupinar 2005). Similarly, a field study in
which drivers completed a range of secondary cognitive tasks, either over the phone or
with an in-car experimenter, failed to detect any differences in visual search patterns or
ratings of mental demand (Nunes and Recarte 2002). Another laboratory experiment
compared participants performing a driving scene monitoring task and a concurrent word
game with a partner who either could not see the driving task display (equivalent to a
remote cellphone conversor) or could see the driving task display (an in-person passenger
equivalent) (Gugerty et al 2004). The researchers did not find any differences in the
drivers’ situation awareness in the two conditions, but there was evidence that the drivers
found conversing with the ‘in-person’ partners easier than with the ‘remote’ partners.
Interestingly, when the remote and in-person partners were both able to see the driver
(independent of the driving scenes) the additional difficulty associated with the remote

1. Introduction
13
condition was removed (Gugerty et al 2004). In contrast, experiments employing more
naturalistic conversations and measuring driving performance have reported that
conversations with passengers are not as cognitively demanding as cellphone
conversations and are associated with fewer driver errors and crashes (Drews et al 2004,
Hunton and Rose 2005).
There are several logical reasons why drivers’ conversations with passengers may not be
as cognitively demanding or impair their driving performance to the same degree as
conversations over cellphones. Drivers conversing with passengers have access to a range
of nonverbal cues (eg facial expressions, gestures and posture) that are not available
when conversing over a cellphone (Gugerty et al 2004, Hunton and Rose 2005). This
additional information can make it easier to parse the speech stream and process the
meaning of a speaker’s utterances, as well as provide cues for turn-taking and other
pragmatic aspects of discourse. A related finding is that good speech quality (intelligibility
and fidelity) is important in reducing the mental workload of drivers (Matthews et al
2003). Passenger conversations undoubtedly enjoy greater fidelity and intelligibility
compared with any sort of cellphone and thus require less attention and effort by the
driver to process the conversation, allowing more attention to remain with the primary
driving task.
There is also the suggestion that the form and content of passenger conversations are
fundamentally different from conversations over hands-free and handheld cellphones
(Haigney and Westerman 2001; McKnight and McKnight 1993; Strayer and Johnston
2001). The logic of this argument is that, because passengers can see what the driver
sees, they are able to modulate the timing and complexity of their speech to match the
driving conditions. As a result, drivers talking to passengers are less likely to become
overloaded in difficult driving conditions and may avoid many of the adverse
consequences associated with cellphone conversations (Crundall et al 2005, Hunton and
Rose 2005). In support of this line of argument, one study comparing the conversations
of drivers with in-car passengers to cellphone conversations found that the in-car
conversors reduced their rate of speech when approaching particularly demanding or
hazardous driving situations, and some stopped talking altogether (Crundall et al 2005).
This demonstration of conversation suppression, which was absent in the cellphone
conversations, may help to explain why cellphone conversations are more cognitively
demanding than passenger conversations. Although the study did not examine driving
performance, the underlying logic was that an in-car passenger’s ability to see the
momentary demands of the traffic and road situation led to a modulation of their speech,
which in turn, freed the driver to allocate more attention to the driving task.
Even more compelling evidence for the advantage of passenger conversations over
cellphone conversations can be taken from the finding that the content of conversations
with in-car passengers includes more turn-taking, more references to the driving
situation, and may actually help maintain driver situation awareness, compared with
cellphone conversations (Drews et al 2004). Drivers engaged in a cellphone conversation
spent less time discussing the surrounding traffic and were more likely to miss important

DISTRACTIVE EFFECTS OF CELLPHONE USE
14
elements of the driving task. When passengers are conversationally involved in the
driving task, their participation may even increase the driver’s situation awareness of
upcoming hazards, and alleviate the potential adverse effects of driving while conversing
(Drews et al 2004).
The purpose of the present study was to investigate the differences between passenger
and cellphone conversations in a controlled manner. The study compared the driving
performance and conversational characteristics that occurred when drivers engaged in
realistic conversations with: 1) passengers physically present in the car; 2) cellphone
conversors; and 3) remote passengers (who could see the driver’s situation but were not
physically present in the car). Of interest was whether visual access to the driver’s
situation was sufficient to produce the conversation suppression and references to the
immediate driving task found with in-car passengers. Also of interest was the degree to
which these conversational aspects were associated with drivers’ speed management,
reaction times to driving hazards, recall of those hazards and ratings of mental effort
across the three conversation conditions. The goal of the study was to address whether,
and in what ways, drivers’ conversations with passengers were able to avoid the harmful
effects on driving performance found with cellphone conversations.
2. Experiment 1
15
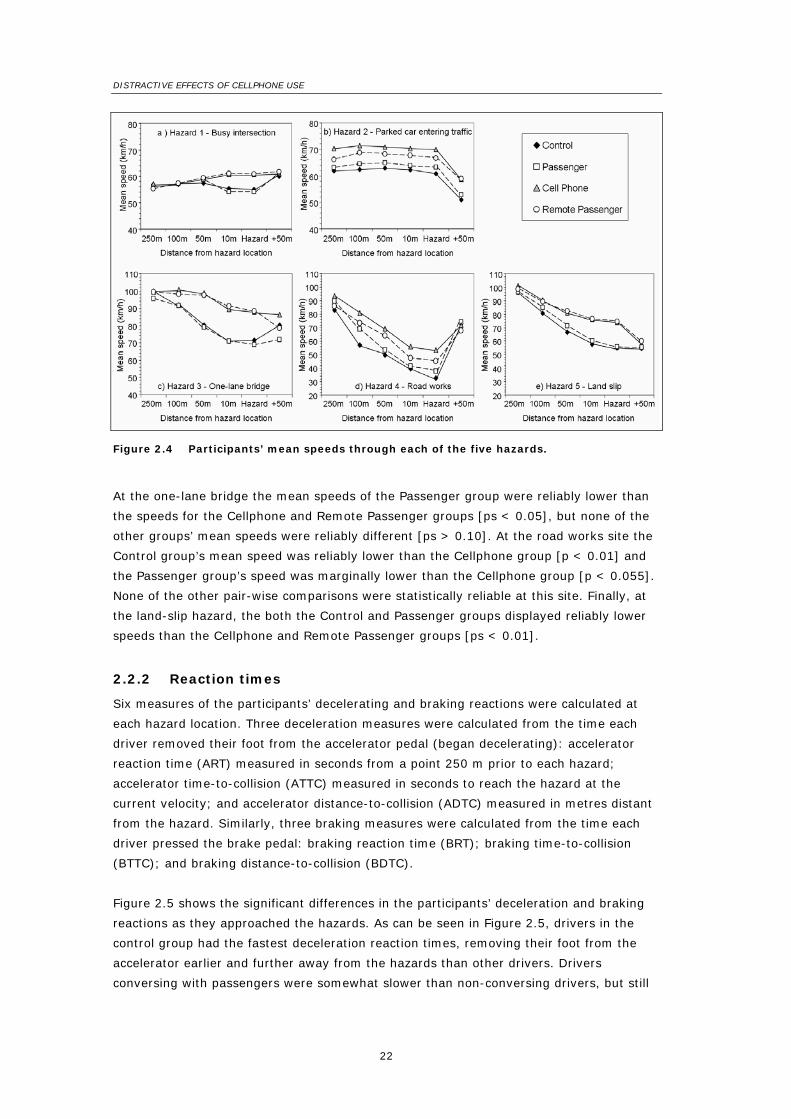
2. Experiment 1
This experiment compared four driving conditions: drivers conversing with in-car
passengers; drivers conversing over a hands-free cellphone; drivers conversing with
remote passengers (who could see the driving situation) by means of a hands-free
cellphone; and a no-conversation control group. Several aspects of driving performance
were measured including drivers’ speeds and deceleration and braking reactions on the
approach to hazardous road situations. In addition, the pacing and content of the
discourse in the three conversation groups was recorded along with drivers’ ratings of
driving difficulty and conversational interference, and the accuracy of their recall of the
hazards they encountered.
2.1 Method
2.1.1 Participants
A sample of 119 participants, 56 male and 61 female, were recruited from the local area
via notices placed in professional newsletters, university bulletin boards and newspapers.
The participants ranged from 17 to 59 years of age with an average age of 27.65 years
(SD = 10.55). Participants were required to possess a current New Zealand driver licence
and were asked to wear any corrective lenses during the experiment if they were required
to do so as a condition of their driver licence. Seven participants did not complete the
experiment due to either mechanical failures (5) or participant reports of eyestrain or
dizziness (2). The remaining sample of 112 was composed of equal numbers of male (56)
and female (56) participants. Of the 64 participants in this sample who were drivers in the
experiment (the other 48 served as conversors for the drivers), 87% indicated they
owned a cellphone. Of those drivers who owned a cellphone, 78.6% admitted they used it
to converse as they drove and 51.8% said they used it weekly or more often. Also of
note, 66.1 % of the drivers who owned a cellphone said they used their cellphone to send
and receive text messages while they drove, 51.8% of them weekly or more often.
2.1.2 Apparatus
The experimental apparatus was the University of Waikato driving simulator consisting of
a complete automobile (BMW 314i) positioned in front of three angled projection surfaces
(shown in Figure 2.1). The centre projection surface was located 2.42 m in front of the
driver’s seat with two peripheral surfaces connected to the central surface at 62 degree
angles. The entire projection surface was angled back away from the driver at 14 degrees
(from the bottom to the top of the projection surface) and produced a 175 degree
(horizontal) by 41 degree (vertical) forward view of the simulated roadway from the
driver’s position. The image projected on the central surface measured 2.64 m wide by
2.10 m high (at a resolution of 1280 by 1024 pixels) and each of the two peripheral
images measured approximately 2.65 m by 2.00 m (at resolutions of 1024 by 768 pixels).
In addition, two colour LCDs with an active area of 12.065 cm by 7.493 cm each at a
resolution of 640 by 480 pixels were mounted at the centre rear-view mirror and driver’s
wing mirror positions to provide views looking behind the driver’s vehicle. The simulated

DISTRACTIVE EFFECTS OF CELLPHONE USE
16
vehicle’s dashboard displayed accurate speed and engine RPM data and vehicle
performance was determined by a multi-body vehicle dynamics model configured as an
automobile with automatic transmission, 3-litre engine (making 170 kW power) and
power steering. The projected images and vehicle model were updated at a minimum rate
of 100 frames per sec. The steering wheel provided tactile feedback to simulate the forces
produced when steering the vehicle. Four speakers located inside the car and a sub-
woofer underneath the car presented realistic engine and road noises as appropriate. The
simulation software recorded the participant’s speed, lane position and control actions
automatically throughout designated sections of the simulation scenario. A digital video
camera was mounted in the rear seat of the simulated vehicle to record the participants’
conversations during the experimental sessions.
Figure 2.1 The University of Waikato driving simulator.
2.1.3 Simulation scenario
The simulated road created for this study was a 25.3 km-long section of rural road
containing a combination of straights and gentle horizontal and vertical curves. The road
geometry was an accurate representation of a rural two-lane state highway in New
Zealand and was based on the surveyed 3-dimensional road geometry of the highway.
The lane widths, road markings, sight distances and other road engineering
characteristics were incorporated in the simulation using road survey data obtained from
the road controlling authority and by comparing the simulations to video recordings of the
highway taken from the driver’s perspective. Road signs and roadside objects were
modelled as 3-dimensional objects and placed in the simulations to match the video
recordings of the highway. Other traffic was placed in the scenario to depict a
representative mixture of cars, light trucks and heavy trucks at a volume of
approximately 8,000-10,000 passenger car units per day. Special care was taken to
introduce heading traffic at key points in the scenario to control each participant’s

2. Experiment 1
17
progress through a series of driving hazards described below. The speed limits of the
simulated road were changed from those present on the actual highway: the first 4.75 km
of the simulated road had a posted speed limit of 60 km/hr; followed by 19.5 km of road
with a 100 km/h speed limit; returning to a 60 km/h speed zone for the final 1.05 km of
road.
The simulated road was also altered from the veridical road to contain five traffic hazards
and an overtaking lane, located at approximately 4–5 min intervals as shown in Figure
2.2. The first hazard was a busy ‘T’ intersection with several turning vehicles as shown in
Figure 2.3a. On the approach to the intersection the participant’s vehicle was preceded by
two vehicles travelling at 52 km/h. When the participant reached a point 150 m before
the intersection, the car immediately ahead began indicating a left turn and then
decelerated and moved left into a left-turn lane. The other leading car briefly illuminated
its brake lights and then proceeded though the intersection which contained a truck
signalling a turn across the participant’s path (moving towards the participant’s vehicle at
1 m per sec) and a vehicle emerging from the road to the left also preparing to turn
across the participant’s path.
Approximately 2 km later the participants reached the second hazard, a car pulling out of
a curb parking area as the participant approached (see Figure 2.3b). When the
participant’s vehicle was 60 m away, the parked car began to blink its right indicator light.
When the participant was 30 m away the parked vehicle pulled into the participant’s lane,
accelerating to 60 km/h.
The third hazard was a one-lane bridge located 4.24 km later, in the 100 km/h speed
area (see Figure 2.3c). A hazard warning sign for the bridge was located 272.5 m in
advance of the bridge; with a second warning sign accompanied by a supplementary right
of way plate (giving right of way to the participant’s vehicle) located 42.5 m ahead of the
bridge entrance (at the beginning of the roadway taper). As the participant’s vehicle
approached the bridge a large truck was exiting the bridge and two cars were beginning
to cross. A fourth vehicle arriving at the far end of the 48 m bridge slowed to a rolling
stop (1 m per sec) to wait for the participant’s vehicle to cross.

DISTRACTIVE EFFECTS OF CELLPHONE USE
18
Figure 2.2 A map of the simulated road showing the five hazard locations and overtaking lane.

2. Experiment 1
19
Figure 2.3 Participants’ views of the five hazards and overtaking lane.
An overtaking lane approximately 1 km in length was located 3.15 km after the bridge
hazard. Although not specifically designed to constitute a hazard, it was included to
present a challenging driving task for the participants. The overtaking lane was preceded
by a series of advisory/warning signs located 2 km, 1 km and 400 m before the start of
the lane. As the participant’s car approached the 1 km advisory sign it encountered a
series of leading vehicles; a car travelling 95 km/h which slowed to follow a van travelling
87 km/h, both of them slowing further to follow a tanker truck travelling 78 km/h. At the
beginning of the overtaking lane all three leading vehicles stayed in the left (slow) diverge
lane. Almost immediately, the car and the van indicated a change to the right (fast) lane
and accelerated to 96 km/h. After the van overtook the truck it indicated and moved to
the left lane while the car accelerated to 106 km/h and overtook the truck and van (see
Figure 2.3d). Approximately 250–300 m of the overtaking lane remained at this point and
an advisory warning sign indicating the lane merge was located 200 m before the merge
taper. If the participant did not overtake the truck or van during the overtaking lane, the
car and van indicated a left turn and pulled into a left-turn lane at an intersection located
560 m after the overtaking lane.
The fourth hazard location was a road works site preceded by a road works hazard
warning sign (240 m prior), a temporary 30 km/h speed restriction sign (60 m prior), and
a loose seal (gravel) hazard sign 30 m prior. The road works site itself consisted of a
series of road cones located in the centre of the road leading through a 38.5 m stretch of
loose seal and an 85 m section of road with no road markings (see Figure 2.3e). The road
works terminated with a ‘works end–100 km/h’ sign.

DISTRACTIVE EFFECTS OF CELLPHONE USE
20
The final hazard was located 3.5 km later and was composed of a temporary ‘slip’ hazard
warning sign followed by a series of road cones in the centre and along the left of the
road leading traffic around a land slip that extended approximately 1.5 m into the
participant’s lane (100 m after the initial warning sign). The posted speed limit returned
to 60 km/h 2.28 km after the final road cone and led to a Stop sign indicating the end of
the simulation scenario 1.05 km later.
2.1.4 Procedure
At the time of scheduling an appointment for the experiment the participants were
randomly assigned to one of four experimental groups. Group 1 was a no-conversation
control group containing 16 participants (8 male and 8 female) that completed the
simulation scenario individually. Group 2 was a passenger conversation group in which 16
pairs of participants (8 male pairs and 8 female pairs) completed the simulation scenario
together, one member of each pair driving the simulated car while the other sat in the
front passenger seat. Group 3 was a cellphone conversation group that contained 16 pairs
of participants (8 male and 8 female pairs) in which one person drove the simulated car
and the other was seated in an adjoining room conversing with the driver by means of a
hands-free cellphone. Another 16 participant pairs (8 male and 8 female) were assigned
to Group 4, a remote passenger condition in which the conversor was seated in an
adjoining room while communicating with the driver over the hands-free cellphone but
was able to view the driver’s progress through the simulation scenario via a large window
located just behind the right rear (driver’s side) of the simulation vehicle (the remote
passengers’ view is shown in Figure 2.1). From this position the remote passenger could
see the simulation, but not the driver’s facial expression. In most cases, the members of
each participant pair were acquainted with one another from their workplace, university
classes, or membership in professional organisations.
Upon arrival, the participants were given an overview of the activities involved and the
time required for the experiment, and were asked to complete an informed consent
agreement and a brief questionnaire about their driving background and cellphone use.
After completion of the questionnaire each participant was given a short practice session
and allowed to drive until they felt comfortable operating the simulator. Participants in
Groups 2, 3 and 4 then self-selected which member of the pair would be the driver and
which would be the conversor. The pairs were told that they were free to converse about
any topics they chose to. The conversor in each pair was also provided with a set of
conversation cards containing topics that could be used if they had any difficulty finding
subjects to discuss (eg a list of 10 items they would agree to take to a deserted tropical
island for a two-week stay; a list of 10 songs to put on a mix tape to listen to on a long
car trip; etc.)
Once the driver and conversor were seated in their positions, a voice check was
conducted with the hands-free cellphone for the participants in Groups 3 and 4, the video
recorder was switched on and the simulation scenario was begun. The average time
required to complete the simulation scenario was approximately 24 min. During this time,
the participants’ self-paced conversations continued without prompting from the

2. Experiment 1
21
experimenter. Although a conversation duration of 24 min may have been somewhat
atypical when compared with drivers’ normally occurring cellphone conversations, the
continuous self-paced conversation was desirable in order to examine whether any
conversation modulation occurred in the vicinity of the hazards. Only one of the
participants commented that they felt it unusual or difficult to maintain a conversation of
that length. Following completion of the simulation scenario the drivers were asked to
rate the difficulty of driving the simulated road on a seven-point mental workload/driving
difficulty scale ranging from 1 = easy; no difficulty at all to 7 = extremely difficult; unsafe
(Charlton 2004) and recall as many hazards or difficult situations from their drive as
possible. Drivers in Groups 2, 3 and 4 were also asked to rate the amount of interference
their conversation had on their driving on a seven-point scale (1 = no interference, 7 =
complete interference).
2.2 Results
2.2.1 Vehicle speeds
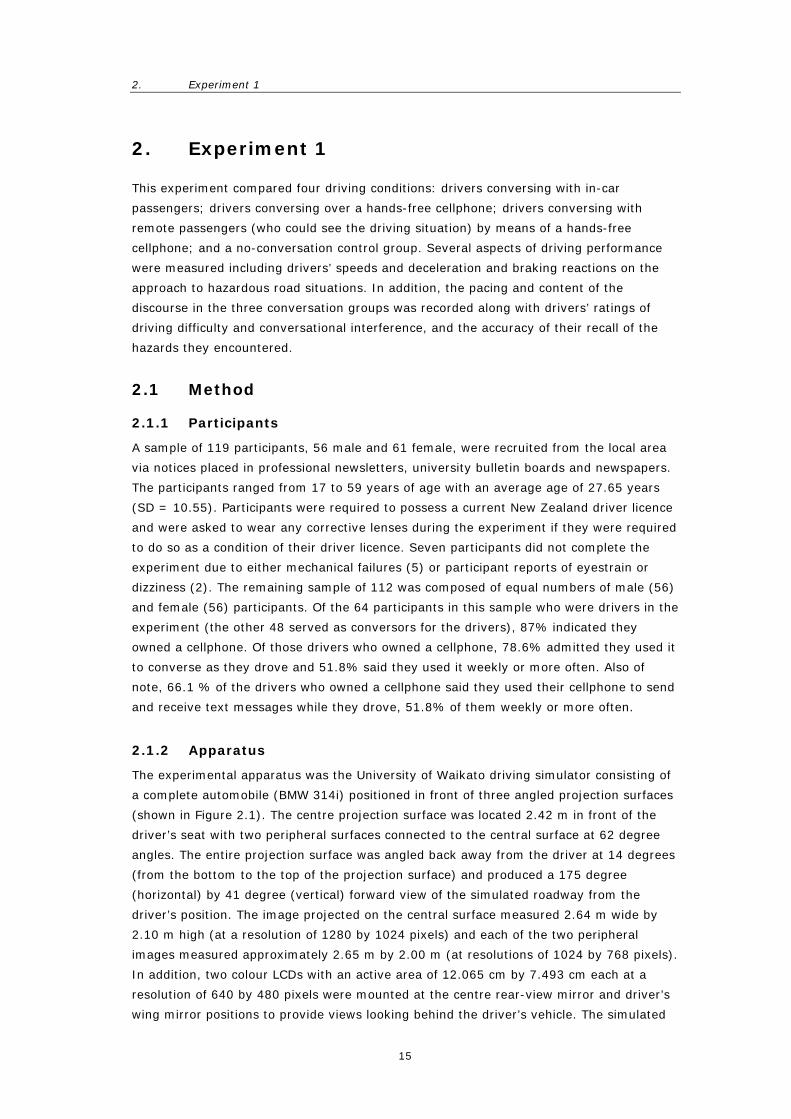
Shown in Figure 2.4 are the mean vehicle speeds for the four experimental groups as
they approached and passed through each of the five simulated hazard sites. As can be
seen in the figure, drivers in the Control (no conversation) and Passenger groups
generally reduced their speeds as they approached and drove past each hazard point,
whereas the average speeds of drivers in the Cellphone and Remote Passenger groups
decreased only slightly or not at all.
A one-way multivariate analysis of variance (General Linear Models procedure, SPSS, Inc,
Chicago IL) comparing the groups’ vehicle speeds at the five hazard points indicated a
statistically reliable difference between the groups [Wilks’ Lambda = .470, F(15,154.99) =
3.246, p < 0.001]. Examination of the univariate group comparisons at each hazard site
showed group differences at Hazard 1 (busy intersection) [F(3, 60) = 5.577, p < 0.01],
Hazard 3 (one-lane bridge) [F(3, 60) = 4.543, p < 0.01], Hazard 4 (road works) [F(3, 60) =
4.924, p < 0.01], and Hazard 5 (land slip) [F(3, 60) = 11.026, p < 0.001]. The group
differences in speeds at the second hazard point (parked car entering traffic) were not
statistically reliable [F(3, 60) = 1.938, p > 0.05].
Post hoc pair-wise comparisons of individual group means at each hazard point were
made using a Bonferroni adjustment for experiment-wise error rate. At the busy
intersection the mean speeds of drivers in the Passenger group were significantly lower
than the speeds in the Cellphone and Remote Passenger groups [ps < 0.05] and the
Control group was slower (marginally significant) than the Cellphone and Remote
Passenger groups [p < 0.06 & p < 0.07 respectively]. The comparison of the Cellphone
and Remote Passenger groups failed to indicate any reliable difference in their mean
speeds; nor was there any reliable difference in the speeds of the Control and Passenger
groups.
DISTRACTIVE EFFECTS OF CELLPHONE USE
22
Figure 2.4 Participants’ mean speeds through each of the five hazards.
At the one-lane bridge the mean speeds of the Passenger group were reliably lower than
the speeds for the Cellphone and Remote Passenger groups [ps < 0.05], but none of the
other groups’ mean speeds were reliably different [ps > 0.10]. At the road works site the
Control group’s mean speed was reliably lower than the Cellphone group [p < 0.01] and
the Passenger group’s speed was marginally lower than the Cellphone group [p < 0.055].
None of the other pair-wise comparisons were statistically reliable at this site. Finally, at
the land-slip hazard, the both the Control and Passenger groups displayed reliably lower
speeds than the Cellphone and Remote Passenger groups [ps < 0.01].
2.2.2 Reaction times
Six measures of the participants’ decelerating and braking reactions were calculated at
each hazard location. Three deceleration measures were calculated from the time each
driver removed their foot from the accelerator pedal (began decelerating): accelerator
reaction time (ART) measured in seconds from a point 250 m prior to each hazard;
accelerator time-to-collision (ATTC) measured in seconds to reach the hazard at the
current velocity; and accelerator distance-to-collision (ADTC) measured in metres distant
from the hazard. Similarly, three braking measures were calculated from the time each
driver pressed the brake pedal: braking reaction time (BRT); braking time-to-collision
(BTTC); and braking distance-to-collision (BDTC).
Figure 2.5 shows the significant differences in the participants’ deceleration and braking
reactions as they approached the hazards. As can be seen in Figure 2.5, drivers in the
control group had the fastest deceleration reaction times, removing their foot from the
accelerator earlier and further away from the hazards than other drivers. Drivers
conversing with passengers were somewhat slower than non-conversing drivers, but still
2. Experiment 1
23
registered deceleration responses considerably earlier and further away than drivers in
the Cellphone and Remote Passenger groups.
Hazard 3, the one-lane bridge, which displayed some of the largest between-group
differences in speed, is shown in the top panel of Figure 2.5. As can be seen, a greater
proportion of the participants in the Control and Passenger groups reacted on the
approach to the one-lane bridge by removing their foot from the accelerator and/or
braking, compared with the Cellphone and Remote Passenger groups where only 31.3%
and 43.8% of the drivers braked. A one-way multivariate analysis of variance comparing
the four groups across the three deceleration measures indicated a reliable effect of group
at Hazard 3 [Wilks’ Lambda = .582, F(9, 99.93) = 2.768, p < 0.01]. Univariate comparisons
for each of the three deceleration measures indicated significant group differences for ART
[F(3, 43) = 6.353, p < 0.001], ATTC [F(3, 43) = 5.300, p < 0.01], and ADTC [F(3, 43) = 5.613,
p < 0.01]. Post hoc pair-wise comparisons revealed that the Control group was reliably
different from the Passenger and Remote Passenger groups on all three deceleration
measures [ps < 0.01], but none of the other group means were reliably different from
one another.

DISTRACTIVE EFFECTS OF CELLPHONE USE
24
Figure 2.5 Proportion of participants’ deceleration and braking reactions at Hazards 3 (top row) and deceleration times and distances at Hazards 4 and 5 (bottom two rows).
A comparison of the groups across the three braking measures at Hazard 3 also indicated
a reliable difference between the groups [Wilks’ Lambda = .470, F(9, 73.16) = 2.953, p <
0.01]. Univariate comparisons revealed that the source of this effect was due to group
differences for the BTTC measure [F(3, 32) = 3.702, p < 0.05] as shown in Figure 2.5. Post
hoc pair-wise comparisons of the group BTTC means using a Bonferroni adjustment
indicated that the Control group braked significantly earlier than the Cellphone group [p <
0.05]; none of the other groups differed reliably [ps > 0.05]. It should be noted that the
one-lane bridge was apparently the most challenging driving situation in the experimental
scenario. Examination of the drivers’ lateral positions as they crossed the bridge revealed
that a sizable number of drivers would have sideswiped or collided with the bridge rails,
another vehicle, or both; 11 drivers (68.8%) in each of the Cellphone and Remote
Passenger groups displayed vehicle trajectories that intersected with other objects, while
only three drivers (18.8%) in the Passenger group and one driver (6.3%) in the Control
group did.
At Hazard 4 (road works), shown in the middle panel of Figure 2.5, all of the participants
registered a deceleration response and a majority of them also registered a braking

2. Experiment 1
25
response. A one-way multivariate analysis of variance comparing the four groups across
the three deceleration measures indicated a reliable effect of group at Hazard 4 [Wilks’
Lambda = .573, F(9, 141.31) = 4.031, p < 0.001]. Univariate comparisons for the three
deceleration measures indicated significant group differences for ATTC [F(3, 60) = 7.292, p
< 0.001], ADTC [F(3, 60) = 7.719, p < 0.001], but not for ART [F(3, 60) = 1.560, p > 0.05].
Post hoc pair-wise comparisons revealed that the Control group responded earlier and
further away than the Cellphone and Remote Passenger groups [ps < 0.01]. The
Passenger group was earlier (marginally significant) than the Cellphone group on the
ATTC measure [p < 0.06] and further away from the bridge than the Cellphone group on
the ADTC measure [p < 0.01]. A one-way multivariate analysis of variance for the three
braking response measures failed to detect a significant difference across the four groups
[Wilks’ Lambda = .729, F(9, 114.54) = 1.761, p > 0.05].
Most of the participants registered a deceleration response at Hazard 5, the land slip (all
of the Control and Passenger groups and 75% of those in the Cellphone and Remote
Passenger groups). The group differences in the deceleration reactions were even more
pronounced at this hazard location, as shown in the bottom panel of Figure 2.5. A
multivariate analysis of variance indicated that the timing of the deceleration responses
were reliably different across the four groups [Wilks’ Lambda = .687, F(9, 121.84) = 2.255, p
< 0.05]. Univariate tests on each of the deceleration measures indicated significant group
differences for ART [F(3, 52) = 5.232, p < 0.01], ATTC [F(3, 52) = 6.483, p < 0.001], and
ADTC [F(3, 52) = 5.731, p < 0.01]. Post hoc pair-wise comparisons revealed that the
Control group responded more quickly, earlier, and further away than the Cellphone and
Remote Passenger groups (ps < 0.01), but none of the other groups differed reliably.
Fewer than 50% of the drivers in the Cellphone and Remote Passenger groups registered
a braking response at the land slip and although there was a significant multivariate
group effect across the three braking measures [Wilks’ Lambda = .614, F(9, 85.331) =
2.100, p < 0.05], none of the individual univariate tests produced a sufficiently reliable
result, perhaps because of the rate of braking by the Cellphone and Remote Passenger
drivers.
During the approach to the busy intersection site (Hazard 1), only 31.3 % of the drivers
in the Cellphone and Remote Passenger groups registered a deceleration response
(removed their foot from the accelerator) compared with the Control and Passenger
groups (56.3% and 68.8% respectively). None of the drivers in the Cellphone and Remote
Passenger groups undertook a braking response whereas 18.8% of the Control group
drivers and 31.3% of the Passenger group did. The relatively low numbers of participants
registering a deceleration or braking response made statistical comparison of reaction
time differences between the groups impracticable. A greater proportion of the drivers
decelerated and braked at Hazard 2 (parked car entering traffic). Nearly all of the drivers
in the Control group (93.8%) and Passenger group (81.3%) registered a deceleration
response and 62.5% of both the Cellphone and Remote Passenger groups did likewise.
Although there was a trend for drivers in the Control and Passenger groups to decelerate
earlier and further away from the car ahead of them than drivers in the Cellphone group,
the pattern was not statistically reliable [Wilks’ Lambda = .800, F(9, 99.93) = 1.065, p >

DISTRACTIVE EFFECTS OF CELLPHONE USE
26
0.05]. Only 25% of the Control group, 37.5% of the Cellphone group and 43.8% of the
Passenger and Remote Passenger groups registered a braking response, too few for a
reliable comparison of group differences for the braking response measures.
2.2.3 Discourse measures
The conversations of the participants in the Passenger, Cellphone and Remote Passenger
groups were recorded throughout the experiment. The portions of these conversations
corresponding to the 15 sec prior to, and 5 sec after each hazard point were transcribed
and several measures of conversational performance were calculated: the number of
utterances (Brown and Yule 1983) made by the driver and conversor; the mean utterance
length (the total number of words divided by the number of utterances) for the driver and
conversor; the number of utterances where the topic was the immediate driving situation
(defined as situation awareness utterances or simply SA utterances); and the number of
pauses longer than 2 sec that occurred within clause boundaries.
The top panel of Figure 2.6 shows the discourse measures for the three conversation
groups at Hazard 1, the busy intersection. As can be seen in the figure, participants in the
Cellphone group had fewer pauses in their discourse (particularly the conversors) and did
not discuss the driving situation (SA utterances). Drivers and conversors in the Passenger
group tended to have shorter utterances. A multivariate analysis of variance of the six
discourse measures indicated a significant difference between the three groups [Wilks’
Lambda = .420, F(12, 80) = 3.623, p < 0.001]. The univariate analyses indicated significant
group differences for four of the measures: number of driver pauses [F(2, 45) = 4.452, p <
0.05], number of conversor pauses[F(2, 45) = 6.559, p < 0.01], percent of driver SA
utterances [F(2, 45) = 9.602, p < 0.001], and percent of conversor SA utterances [F(2, 45) =
8.556, p < 0.001]. There was also a marginally significant result for conversor utterance
length [F(2, 45) = 2.758, p < 0.07] with Cellphone conversors displaying the longest
utterances.

2. Experiment 1
27
Figure 2.6 Participant’s discourse measures at Hazards 1–5.

DISTRACTIVE EFFECTS OF CELLPHONE USE
28
The second panel of Figure 2.6 shows the same data for Hazard 2, the parked car
entering traffic. It can be seen that a similar pattern of discourse was present:
participants in the Cellphone group had fewer pauses and tended not to discuss the
driving situation. Conversors in the Cellphone and Remote Passenger groups also
produced longer utterances than their driving partners and participants in the other
groups. Statistical analyses revealed a significant group effect in the multivariate analysis
[Wilks’ Lambda = .262, F(12, 80) = 6.353, p < 0.001], and significant univariate group
differences for five of the six measures: number of driver pauses [F(2, 45) = 7.146, p <
0.001], number of conversor pauses [F(2, 45) = 22.770, p < 0.001], percent of driver SA
utterances [F(2, 45) = 9.760, p < 0.001], percent of conversor SA utterances [F(2, 45) =
8.962, p < 0.001], and for conversor utterance length [F(2, 45) = 3.872, p < 0.05].
As can be seen in the middle panel of Figure 2.6, this pattern of discourse was repeated
at the one-lane bridge (Hazard 3), albeit with an even higher proportion of conversation
about the driving situation for participants in the Passenger group and drivers in the
Remote Passenger group. Statistical analyses confirmed the pattern with significant group
effect in the multivariate analysis [Wilks’ Lambda = .154, F(12, 80) = 10.325, p < 0.001],
and significant univariate group differences for all six of the discourse measures: number
of driver pauses [F(2, 45) = 3.868, p < 0.05], number of conversor pauses [F(2, 45) =
44.600, p < 0.001], percent of driver SA utterances [F(2, 45) = 16.765, p < 0.001],
percent of conversor SA utterances [F(2, 45) = 32.822, p < 0.001], driver utterance length
[F(2, 45) = 4.091, p < 0.05], and conversor utterance length [F(2, 45) = 8.024, p < 0.05].
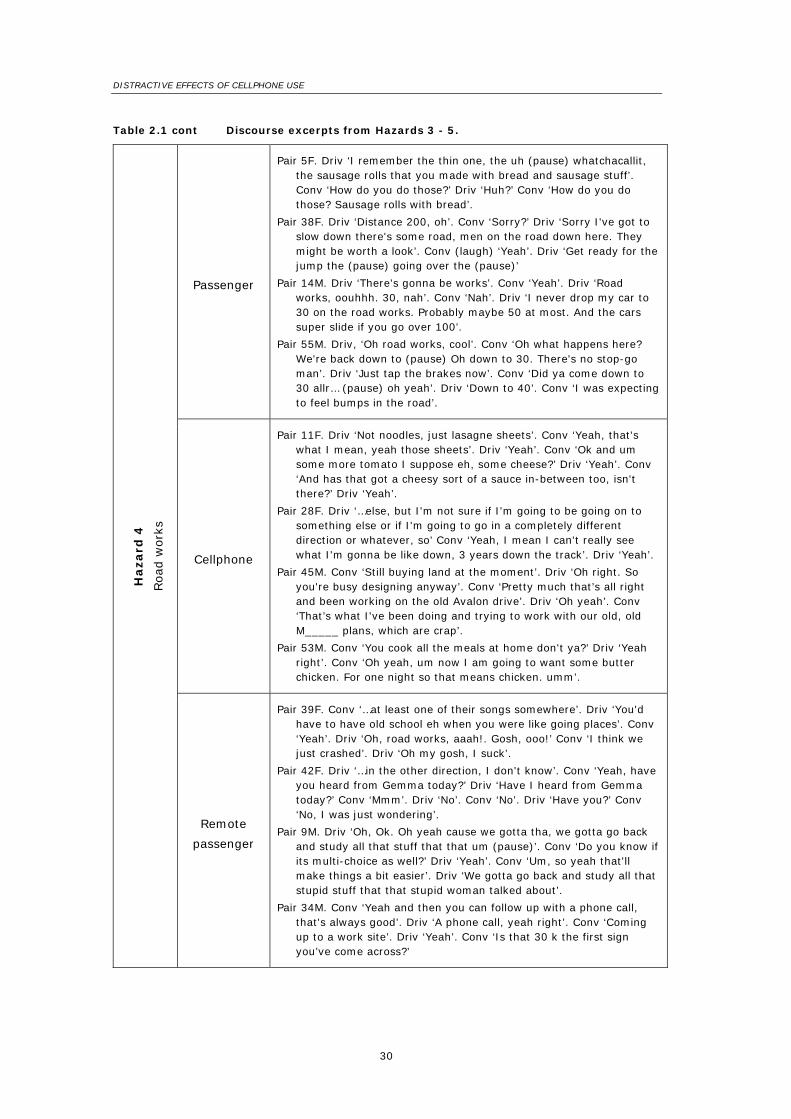
Table 2.1 shows some of the contents of the conversations at the one-lane bridge, the
road works and land slip hazards. As can be seen in the conversation excerpts, the
conversations between drivers and their in-car passengers contain more references to the
hazards (ie SA utterances) and more frequent pauses than the Cellphone and Remote
Passenger groups.
The final two hazards, road works (Hazard 4) and land slip (Hazard 5), produced the
same discourse patterns as those found in the other hazards (shown in the lower two
panels of Figure 2.6). Conversors in the Cellphone group didn’t pause, didn’t discuss what
the driver was doing and produced long utterances. This appeared to affect the drivers in
the Cellphone group as well; they also tended to make fewer utterances about what they
were doing than the drivers in the other two groups. Once again, the statistical analyses
confirmed that the differences between the groups were reliable. Multivariate analysis
results were significant for both Hazard 4 [Wilks’ Lambda = .394, F(12, 80) = 3.954, p <
0.001] and Hazard 5 [Wilks’ Lambda = .301, F(12, 80) = 5.475, p < 0.001]. The univariate
results indicated significant group effects for four of the six measures at Hazard 4
(number of conversor pauses [F(2, 45) = 14.683, p < 0.001], percent of driver SA
utterances [F(2, 45) = 13.070, p < 0.001], percent of conversor SA utterances [F(2, 45) =
7.807, p < 0.001], and conversor utterance length [F(2, 45) = 3.615, p < 0.05]), but only
two of the six measures displayed reliable group differences at Hazard 5; number of
conversor pauses [F(2, 45) = 32.670, p < 0.001] and percent of conversor SA utterances
[F(2, 45) = 3.674, p < 0.05].

2. Experiment 1
29
Table 2.1 Discourse excerpts from Hazards 3–5.
Passenger
Pair 5F. Conv ‘He's got the right of way’. Driv ‘It’s just thin’. Conv ‘Nah, didn't you see back there?’ Driv. ‘No, I didn't’ Conv ‘Well red usually means (pause) stop’. Driv ‘I didn't see no red’.
Pair 26F. Conv ‘…New Zealand bands (pause) Che Fu’. Driv ‘I like… (pause) Oh sh*t’. Conv ‘It’s a one-lane bridge’. Driv ‘Oh, I didn't even realise it was a one lane bridge. Ooops’.
Pair 14M. Conv ‘Think they'd know how to do it by now, but still they tend to scream’. Driv ‘Narrow bridge’. Conv ‘Yeah, damn narrow’. Driv ‘Where's the sign? There was no sign’. Conv ‘I'm sure there was’. Driv ‘You sure?’ Conv ‘No, maybe I should have been paying attention’.
Pair 43M. Conv ‘…and bloody hell it is’. Driv ‘Really’. Conv ‘Yeah, it’s (pause) oohh aye’. Driv ‘Yiyiyiyiyi! You guys are waiting for me. Yeah, thanks a lot pal. Oh looks like he is gonna give way. Geez eh?’ Conv ‘Far out. New Zealand drivers eh?’
Cellphone
Pair 28F. Conv ‘…Waikeria prison is?’ Driv ‘No’. Conv ‘I was going to say its kind near there, like it’s about half an hour out of Te Awamutu’ Driv ‘OK’. Conv ‘So it’s quite close really, its only like an hour and a bit drive here and so cause I'm in the halls at the moment so if I go home I just go home for the weekends’.
Pair 29F. Driv ‘Yeah, Mt Karori’. Conv ‘Yeah, that's the one’. Driv ‘Oh cool’. Conv ‘So, I'm probably gonna die, I'm a smoker’. Driv ‘I just died, ahhh’. Conv ‘I'm not sure how I'm gonna go’. Driv ‘I just died and crashed the car’.
Pair 45M. Driv ‘You'll, you'll struggle Aaron cause you'll be wanting to do (pause) Guy that's bloody skinny’. Conv ‘What (unintell)’. Driv ‘Oh the road got narrow. You'll be wanting to do hand brakes and drive 200 kilometres an hour’. Conv ‘Why's that?’ Driv ‘Well that's the way you drive isn't it?’ Conv ‘Am I, am I a boy racer?’ Driv ‘You're a boy racer’.
Pair 56M. Driv ‘…before that my golf is shocking and after that I get exhausted’. Conv ‘And what's your handicap?’ Driv ‘I don't have a handicap. That was a narrow bridge’. Conv ‘Do you have any handicaps?’ Driv ‘I didn't see it. I didn't see that narrow bridge’.
Haza
rd 3
One-
lane
bri
dge
Remote passenger
Pair 4F. Conv ‘What's that called again?’ Driv ‘I can't remember’. Conv ‘Try and think’. Driv ‘Whoa, people on the wrong side of the road’. Conv (laugh) Driv ‘I think that was a one-way bridge actually, whoopsies’. Conv ‘Okay, what's the new one on C4 right now? By Brooke Frasier?’ Driv ‘Can't remember’.
Pair 42F. Conv ‘…were supposed to be in love and you know others were supposed to be (pause)’. Driv ‘Oh, I'm going to crash into the bridge’. Conv ‘Ouch. Isn’t uh’ Driv ‘Karen, Karen I just died, your cellphone's right’. Conv ‘I'll mourn you. Do you want me to mourn you?’
Pair 9M. Driv ‘Oh, yeah’. Conv ‘Because I went over, came over on the 18th’. Driv ‘Whoa, a (pause) oh a one-way bridge’. Conv ‘Good job’. Driv ‘That was your fault, I blame that squarely on you’. Conv ‘I'm sorry for being such a distraction’.
Pair 33M. Conv ‘Yeah, no I haven't even touched that textbook I bought eh?’ Driv ‘True, Ohh (pause) Far out I've just had a head-on collision with a truck. Was that a one-way road?’ Conv ‘Yeah, a one-lane bridge’. Driv ‘Totally missed it eh?’ Conv ‘I don't know if you had right of way, I didn't see’.
DISTRACTIVE EFFECTS OF CELLPHONE USE
30
Table 2.1 cont Discourse excerpts from Hazards 3 - 5.
Passenger
Pair 5F. Driv ‘I remember the thin one, the uh (pause) whatchacallit, the sausage rolls that you made with bread and sausage stuff’. Conv ‘How do you do those?’ Driv ‘Huh?’ Conv ‘How do you do those? Sausage rolls with bread’.
Pair 38F. Driv ‘Distance 200, oh’. Conv ‘Sorry?’ Driv ‘Sorry I've got to slow down there's some road, men on the road down here. They might be worth a look’. Conv (laugh) ‘Yeah’. Driv ‘Get ready for the jump the (pause) going over the (pause)’
Pair 14M. Driv ‘There's gonna be works’. Conv ‘Yeah’. Driv ‘Road works, oouhhh. 30, nah’. Conv ‘Nah’. Driv ‘I never drop my car to 30 on the road works. Probably maybe 50 at most. And the cars super slide if you go over 100’.
Pair 55M. Driv, ‘Oh road works, cool’. Conv ‘Oh what happens here? We're back down to (pause) Oh down to 30. There's no stop-go man’. Driv ‘Just tap the brakes now’. Conv ‘Did ya come down to 30 allr… (pause) oh yeah’. Driv ‘Down to 40’. Conv ‘I was expecting to feel bumps in the road’.
Cellphone
Pair 11F. Driv ‘Not noodles, just lasagne sheets’. Conv ‘Yeah, that's what I mean, yeah those sheets’. Driv ‘Yeah’. Conv ‘Ok and um some more tomato I suppose eh, some cheese?’ Driv ‘Yeah’. Conv ‘And has that got a cheesy sort of a sauce in-between too, isn't there?’ Driv ‘Yeah’.
Pair 28F. Driv ‘…else, but I'm not sure if I'm going to be going on to something else or if I'm going to go in a completely different direction or whatever, so’ Conv ‘Yeah, I mean I can't really see what I'm gonna be like down, 3 years down the track’. Driv ‘Yeah’.
Pair 45M. Conv ‘Still buying land at the moment’. Driv ‘Oh right. So you're busy designing anyway’. Conv ‘Pretty much that’s all right and been working on the old Avalon drive’. Driv ‘Oh yeah’. Conv ‘That’s what I've been doing and trying to work with our old, old M_____ plans, which are crap’.
Pair 53M. Conv ‘You cook all the meals at home don't ya?’ Driv ‘Yeah right’. Conv ‘Oh yeah, um now I am going to want some butter chicken. For one night so that means chicken. umm’.
Haza
rd 4
Road
work
s
Remote
passenger
Pair 39F. Conv ‘…at least one of their songs somewhere’. Driv ‘You'd have to have old school eh when you were like going places’. Conv ‘Yeah’. Driv ‘Oh, road works, aaah!. Gosh, ooo!’ Conv ‘I think we just crashed’. Driv ‘Oh my gosh, I suck’.
Pair 42F. Driv ‘…in the other direction, I don't know’. Conv ‘Yeah, have you heard from Gemma today?’ Driv ‘Have I heard from Gemma today?’ Conv ‘Mmm’. Driv ‘No’. Conv ‘No’. Driv ‘Have you?’ Conv ‘No, I was just wondering’.
Pair 9M. Driv ‘Oh, Ok. Oh yeah cause we gotta tha, we gotta go back and study all that stuff that that um (pause)’. Conv ‘Do you know if its multi-choice as well?’ Driv ‘Yeah’. Conv ‘Um, so yeah that'll make things a bit easier’. Driv ‘We gotta go back and study all that stupid stuff that that stupid woman talked about’.
Pair 34M. Conv ‘Yeah and then you can follow up with a phone call, that's always good’. Driv ‘A phone call, yeah right’. Conv ‘Coming up to a work site’. Driv ‘Yeah’. Conv ‘Is that 30 k the first sign you’ve come across?’

2. Experiment 1
31
Table 1 cont Discourse excerpts from Hazards 3–5.
Passenger
Pair 38F. Driv ‘Home cooked meals?’ Conv ‘Yeah. And what do you, what do you put in (pause)’. Driv ‘Oh, something with mince (pause) Oh! Made it, I'm so glad’.
Pair 40F. Conv ‘I haven't been there for vears, since (pause)’. Driv ‘Yeah. I wanna go because (pause) last time I went was years ago’. Conv ‘Yeah’. Driv ‘Um and (pause) I'm sure I could still enjoy it’.
Pair 50M. Driv ‘I mean it was five months out of its guarantee so (pause)’ Conv ‘That's very good service eh?. Because most of the time once you um (pause) Might have hit that one’. Driv ‘Don't think so, didn't hear anything’. Conv ‘What about the rear view mirror?’
Pair 47M. Driv ‘You want a gas bottle fridge?’ Conv ‘Can't you get one of those?’ Driv ‘I don't know. I've never had one. Bloody road works. What's going on here? Oh, bit of a slip’.
Cellphone
Pair 11F. Conv ‘Curry, you'd use the curry powder eh?’ Driv ‘Yeah’. Conv ‘Yeah, ok some saussies, some curry powder. What do you have with it?’ Driv ‘Onion’. Conv ‘Yeah’. Driv ‘Um (pause) Oh dear’. Conv ‘You're not doing it again are you?’ Driv ‘Oh dear. What's that?’ Conv ‘You're not crashing again are you?’ Driv ‘No, almost’.
Pair 48F. Conv ‘…which is strange’. Driv ‘Oh! (pause) Had to concentrate then, I had to stop talking’. Conv ‘You what?’ Driv ‘I had to concentrate then, I couldn't talk’.
Pair 45M. Conv ‘Well you need to convince her then’. Driv ‘Well I recon we could go for like 2 or 5 years and then come back and I'd be able to bloody buy a house outright, just about’. Conv ‘Have you crashed?’ Driv ‘No, I just braked a bit excessively’. Conv ‘I can hear all sorts of clanking going on’.
Pair 53M. Driv ‘Sausages, how're ya gonna cook sausages?’ Conv ‘Sausages cooked in oil, we need sausages, bit of mashed potato with it so we need potato, a bit of seasoning to mix the potato with, some tea on top of it, we'll have some gravy…’
Haza
rd 5
Land s
lip
Remote
passenger
Pair 4F. Driv ‘Oh I love it, parmesan cheese’. Conv ‘Yeah’. Driv ‘It’s yum’. Conv ‘Whatd I say before, after spaghetti bolognese?’ Driv ‘Ahh, wahh, wahh’ Conv ‘Do you remember?’ Driv ‘Sorry I'm kinda swerving things’.
Pair 12F. Conv ‘One's doing their PhD, one's doing their masters, and the other one works for NIWA’. Driv ‘Oh, ok’. Conv ‘Mmmm’. Driv ‘So they're all studying hard out’. Conv ‘Yeah, they're like, they help me with everything’. Driv ‘That's good’. Conv ‘Like if I don't understand anything I just ask em’. Driv ‘Ahhh! (laugh)’. Conv ‘what was that?’ Driv ‘Ah this road slip like’.
Pair 9M. Conv ‘…like 39 ks earlier’. Driv ‘Yeah’. Conv ‘Look I'm sure I've seen this hill before’. Driv ‘Ha. That tree, I know that tree. Slip’. Conv ‘However the road does change’. Driv ‘Ahhh!’
Pair 54M. Conv ‘I really really enjoyed going there. You, you certainly feel very safe over there though don't you?’ Driv ‘Yeah, yeah’. Conv ‘What's that um that quay against, along the river um’ Driv ‘Oh’. Conv ‘Its not, its not Lambton quay or Frankton quay or something like that’. Driv ‘I can't remember’.

DISTRACTIVE EFFECTS OF CELLPHONE USE
32
2.2.4 Difficulty ratings, hazard recall and crashes
Comparison of the participants’ ratings of driving difficulty and degree of interference
produced by the conversations are shown in Figure 2.7. There was wide variation in the
driving difficulty ratings and no reliable group differences were obtained from the
statistical analysis [F(3, 60) = 2.138, p > 0.05] There was, however, a significant difference
in the ratings of conversation interference [F(2, 45) = 6.394, p < 0.01] with post hoc
comparisons indicating that the Cellphone group suffered considerably more interference
than the Passenger group [ p < 0.01]. There were also substantial group differences in
the number of hazards correctly recalled and in the number of crashes that occurred at
the five hazard sites. Also shown in Figure 2.7, drivers in the Control group had the
highest percentage of hazards correctly recalled (76.25%) and drivers in the Cellphone
group had the lowest (46.25%). A one-way analysis of variance indicated this difference
was reliable [F(3, 60) = 3.817, p < 0.05]. The most memorable hazard for the participants
was the land slip (recalled by 84.38% of the participants), perhaps indicative of a recency
effect inasmuch as this was the last hazard to appear. The hazard associated with the
greatest difficulty for the participants (as reflected in their crash rates), the one-lane
bridge, was recalled by 68.75% of the participants whereas the parked car entering traffic
was recalled by 78.13% of the participants. The roadworks site was mentioned by 62.5%
of the participants while the busy intersection was recalled by only 20.31% of the
participants. The total number of crashes is also shown in Figure 2.7, the bulk of them
occurring at the one-lane bridge (62%). As can be seen in Figure 2.7, the Cellphone and
Remote Passenger groups recorded the highest numbers of crashes, the Control group the
lowest. In order to evaluate the group differences in crash rate a Chi-squared analysis
was calculated for the proportion of drivers having one, two or no crashes at the five
hazard sites. This analysis indicated a significant difference between the four groups [Chi-
square = 27.042, df = 6, p < 0.001].
Figure 2.7 Participants’ ratings of driving difficulty, conversation interference (with ranges and quartiles), percent of hazards correctly recalled and total number of crashes.

2. Experiment 1
33
2.2.5 Overtaking
A final point of interest was the participants’ driving performance at the overtaking lane.
There were no significant group differences in the drivers’ speeds measured at four points
along the overtaking lane [Wilks’ Lambda = .737, F(12, 143.62) = 1.462, p > 0.05]. There
were, however, differences in the number of vehicles overtaken by the participants. In the
overtaking scenario the maximum number of vehicles that could be overtaken was three;
however, the optimal number that could be safely overtaken (without excessive speed or
crossing into oncoming traffic) was two vehicles. Figure 2.8 shows the proportion of
drivers in each group successfully overtaking one, two, three or no vehicles. The Control
group had the highest proportion of drivers overtaking two vehicles (68.8%) whereas
50% of the drivers in the Cellphone group did not overtake any of the vehicles. In this
context, the failure to overtake can be construed as poor or delayed speed management;
drivers in the Cellphone group were less likely to accelerate to the speed required to
overtake the vehicles ahead of them. A Chi-squared analysis of the proportion of drivers
overtaking one, two, three or no vehicles indicated a marginally significant group
difference [Chi-square = 16.119, df = 9, p < 0.064].
Figure 2.8 Number of vehicles overtaken by drivers in each group.
2.3 Discussion
Drivers talking on a cellphone often failed to take any action to reduce their speed as they
approached the hazards, resulting in the highest crash rates obtained (68.8% of
participants). Similarly, many of these drivers also failed to manage the overtaking scenario
by increasing their speeds when appropriate. Drivers with passengers were more likely to
anticipate hazards and reduce their speeds, performing nearly as well as the no-

DISTRACTIVE EFFECTS OF CELLPHONE USE
34
conversation Control group. The differences in the discourse measures give some insight
into why these two groups may have performed so differently. Passengers talking to drivers
made shorter utterances, had more frequent pauses and were more likely to be talking
about the upcoming hazard than cellphone conversors. Drivers and their cellphone
conversors tended to make longer utterances than the other participants, were less likely to
mention the hazards, had the poorest recall of the hazards, and had the highest crash rate.
The findings clearly indicate that driving while talking to an in-car passenger is
appreciably different from conversing over a cellphone. Conversation suppression did
occur in the Passenger group (relative to the Cellphone and Remote Passenger groups) as
indicated by the number of pauses and the shorter length of conversor utterances. Topic
shifts to the hazards also occurred, potentially improving the drivers’ awareness of the
hazards. Cellphone conversors displayed none of these conversational features. In this
context it is interesting that the Remote Passenger group wasn’t appreciably better than
the Cellphone group as regards their driving performance. The remote passengers did
engage in some discussion of the hazards, albeit not to the degree that the passengers
did, but they were not as likely to stop talking (pause) as the in-car passengers, or even
their driving partners. Apparently the ability to see what the driver can see doesn’t lead to
the same degree of conversation suppression, and is thus associated with only slightly
better performance on the driving task than drivers talking to conversors who are blind to
their situation. Of even greater significance, the drivers conversing with remote
passengers displayed much poorer performance than drivers conversing with in-car
passengers, highlighting the fact that cellphone conversations are significantly more
detrimental than passenger conversations.
Regardless of how well the drivers talking to passengers performed relative to the drivers
talking on cellphones, it should be noted that drivers who were not conversing (Control
group) were the safest by most measures. These drivers displayed cautious speeds, rapid
deceleration reactions to hazards, good speed management leading to safe overtaking,
the fewest crashes and good recall of the hazards after the drive. The drivers in the
Passenger group displayed a higher number of crashes than the no-conversation drivers
indicating that there is a penalty associated with driving while conversing (perhaps
because not all passengers suppress their conversations when they should). Drivers in
both the Passenger and Remote Passenger groups showed good recall of the hazards after
the drive, indicating that their discussion of the hazards may have given them a recall
advantage over drivers in the Cellphone group, although that advantage in memory
performance did not appear to confer any advantage in driving performance to the
Remote Passenger group.

3. Experiment 2
35
3. Experiment 2
Regardless of the wealth of information available about the risks associated with driving
while conversing on a cellphone, many drivers continue to engage in the practise and resist
restrictions on their use (McCartt and Geary 2004; Rajalin et al 2005). The findings of the
previous experiment indicate that conversations per se are not inherently a problem for
drivers; conversation rates that are inflexible and incompatible with momentary traffic
demands are a problem however. Passenger conversations that contain shorter utterances
and pauses during difficult driving situations, and offer comments alerting drivers to the
presence of hazards, enable quite satisfactory levels of driver performance.
A reasonable question to ask is whether there are any technological modifications to
cellphones that could introduce some of the same features of passenger discourse into a
cellphone conversation? One study that addressed this proposition tested a cellphone
modified to present three short beeps followed by a suspension of the conversation (Wood
and Hurwitz 2005). The researchers reported that the modified cellphone counteracted
some of the negative effects typically associated with cellphone conversations, decreasing
drivers’ workload ratings and their reaction times to vehicles decelerating ahead of them.
The present experiment explored a somewhat different technological modification in the
form of a cellphone that provided alerting tones as a driver approached a hazard location.
The purpose of this trial was to investigate whether the introduction of alerting beeps
would produce conversational pauses similar to those seen in passenger conversations
and whether these ‘artificial’ pauses would result in similar driving performance. The
underlying concept is that radio frequency ‘tags’ could be placed on hazard warning signs,
or GPS-capable cellphones could be programmed with maps containing the locations of
known road hazards. In either case, the cellphone would emit a series of warning beeps
as a driver conversing on a cellphone approached a potential hazard. This experiment was
conducted to examine what effects the alerting signals would have on drivers’ behaviour.
There were two possibilities predicted for the alerting cellphone design: 1) the alerting
beeps would add another source of distraction and workload making driving performance
worse; and 2) the alerting beeps would interrupt the conversation and alert the driver,
artificially replicating the role of an in-car passenger.
3.1 Method
3.1.1 Participants
A sample of 40 participants, 14 male and 26 female, were recruited from a third-year
university course in applied cognitive psychology. The participants ranged from 19 to 40
years of age with an average age of 23. 5 years (SD = 5.54). Participants were required
to possess a current New Zealand driver licence and asked to wear any corrective lenses
during the experiment if they were required to do so as a condition of their driver licence.
Two participant pairs did not complete the experiment due to eyestrain or dizziness
leaving a final sample of 36 (18 participant pairs) that was composed of 13 male and 23

DISTRACTIVE EFFECTS OF CELLPHONE USE
36
female participants. In this sample all of the drivers indicated they owned a cellphone and
of those, 55.6% admitted they conversed on it while they drove, with 22.3% using it
weekly or more often. In comparison, 77.8% of the participants said they used their
cellphone to send and receive text messages while they drove, with 61.1% of the
participants using it weekly or more often.
3.1.2 Apparatus
The University of Waikato driving simulator hardware, software and video recording
equipment described in the previous experiment was used unchanged.
3.1.3 Simulation scenario
The 25.3 km simulated road created for the previous study was again used for the
present experiment. The simulation scenario was changed so that the software produced
a series of beeps at each of the five hazard sites. As the driver reached a point 300 m
away from the hazard a single beep 100 msec in length was sounded. At 200 m from the
hazard three beeps were sounded at 400 msec intervals. At 100 m and 50 m from the
hazard a series of five beeps (at 250 msec intervals) were sounded.
3.1.4 Procedure
At the time of scheduling an appointment for the experiment the participants self-selected
into pairs. All of the pairs experienced the same experimental condition, the alerting
cellphone. As in the cellphone conversation group from the previous experiment, one
member of each pair drove the simulated car and the other was seated in an adjoining
room conversing with the driver by means of a hands-free cellphone. The participants
were given the same overview of activities as in the previous experiment and asked to
complete an informed consent agreement and a brief questionnaire about their driving
background and cellphone use. As with the previous experiment, each participant was
given a short practice session and then each pair self-selected which person of the pair
would be the driver. The pairs were told that they were free to converse about any topics
they chose to and the conversor in each pair was provided with the conversation cards
used in the previous experiment. Following completion of the simulation scenario the
drivers were asked to rate the driving difficulty of the simulated road, recall as many
hazards or difficult situations from their drive as possible, and to rate the amount of
interference their conversation had on their driving.
3.2 Results
Figure 3.1 shows the participants’ speeds at each of the five hazard locations. The speeds
from the Cellphone and Control groups from the previous experiment have been included
alongside for comparison. As can be seen, the Alerting Cellphone condition was associated
with the lowest speeds at every hazard, even lower than the no-conversation control condition
in some cases. A multivariate analysis of variance indicated a reliable difference between the
groups across the entire scenario [Wilks’ Lambda = .348, F(10, 86) = 5.972, p < 0.001] and
univariate group differences were reliable for each hazard [F(2, 47) = 6.435, p < 0.01 for
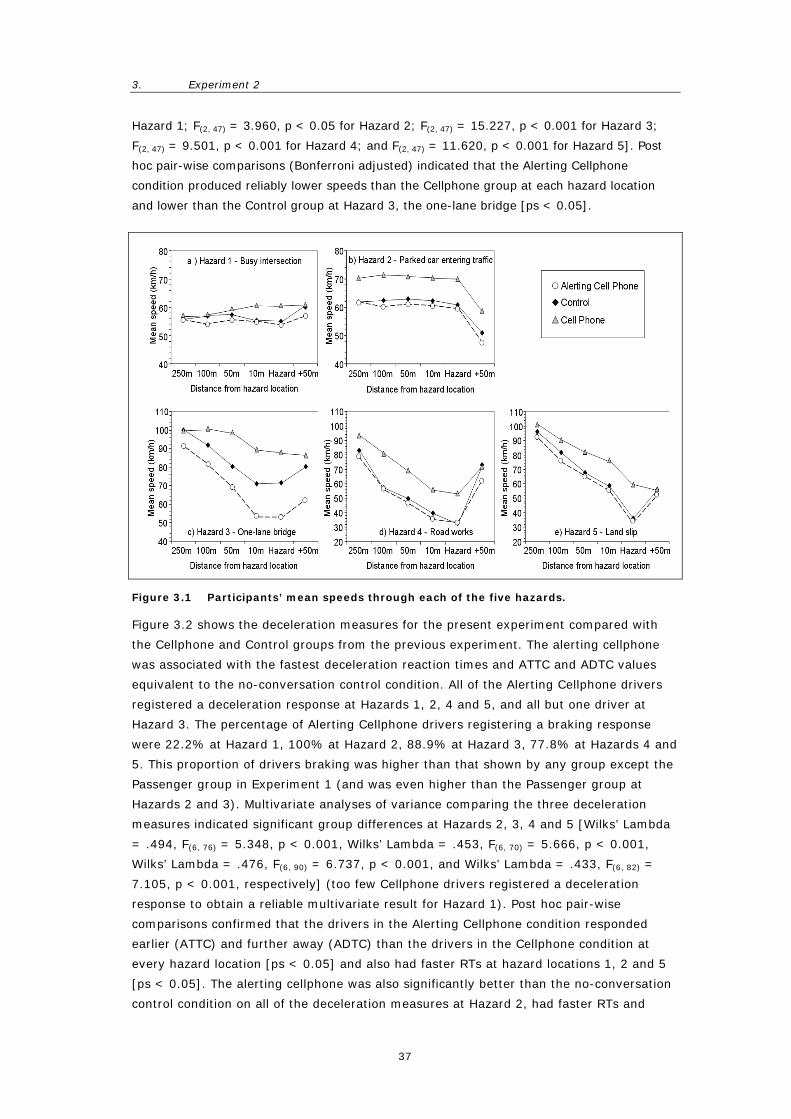
3. Experiment 2
37
Hazard 1; F(2, 47) = 3.960, p < 0.05 for Hazard 2; F(2, 47) = 15.227, p < 0.001 for Hazard 3;
F(2, 47) = 9.501, p < 0.001 for Hazard 4; and F(2, 47) = 11.620, p < 0.001 for Hazard 5]. Post
hoc pair-wise comparisons (Bonferroni adjusted) indicated that the Alerting Cellphone
condition produced reliably lower speeds than the Cellphone group at each hazard location
and lower than the Control group at Hazard 3, the one-lane bridge [ps < 0.05].
Figure 3.1 Participants’ mean speeds through each of the five hazards.
Figure 3.2 shows the deceleration measures for the present experiment compared with
the Cellphone and Control groups from the previous experiment. The alerting cellphone
was associated with the fastest deceleration reaction times and ATTC and ADTC values
equivalent to the no-conversation control condition. All of the Alerting Cellphone drivers
registered a deceleration response at Hazards 1, 2, 4 and 5, and all but one driver at
Hazard 3. The percentage of Alerting Cellphone drivers registering a braking response
were 22.2% at Hazard 1, 100% at Hazard 2, 88.9% at Hazard 3, 77.8% at Hazards 4 and
5. This proportion of drivers braking was higher than that shown by any group except the
Passenger group in Experiment 1 (and was even higher than the Passenger group at
Hazards 2 and 3). Multivariate analyses of variance comparing the three deceleration
measures indicated significant group differences at Hazards 2, 3, 4 and 5 [Wilks’ Lambda
= .494, F(6, 76) = 5.348, p < 0.001, Wilks’ Lambda = .453, F(6, 70) = 5.666, p < 0.001,
Wilks’ Lambda = .476, F(6, 90) = 6.737, p < 0.001, and Wilks’ Lambda = .433, F(6, 82) =
7.105, p < 0.001, respectively] (too few Cellphone drivers registered a deceleration
response to obtain a reliable multivariate result for Hazard 1). Post hoc pair-wise
comparisons confirmed that the drivers in the Alerting Cellphone condition responded
earlier (ATTC) and further away (ADTC) than the drivers in the Cellphone condition at
every hazard location [ps < 0.05] and also had faster RTs at hazard locations 1, 2 and 5
[ps < 0.05]. The alerting cellphone was also significantly better than the no-conversation
control condition on all of the deceleration measures at Hazard 2, had faster RTs and

DISTRACTIVE EFFECTS OF CELLPHONE USE
38
responded further away (ADTC) at Hazard 1 [ps < 0.05], and had longer ATTCs at
Hazards 1 and 5 [p < 0.06 & p < 0.05 respectively]. Multivariate analyses of the braking
responses produced reliable group effects at Hazards 3 [Wilks’ Lambda = .455, F(6, 56) =
4.505, p < 0.001] and 5 [Wilks’ Lambda = .588, F(6, 56) = 2.843, p < 0.05]. However, no
reliable group differences in braking responses were detected in the post hoc comparisons
at these two locations (and thus are not included in Figure 3.2).
Figure 3.2 Participants’ deceleration reactions at the five hazards (compared to the control and cellphone participants from Experiment 1).

3. Experiment 2
39
Figure 3.3 shows the discourse measures for the present experiment compared with the
Cellphone and Control groups from the previous experiment. As can be seen in Figure 3.3,
the Alerting Cellphone group produced many more driver and conversor pauses than the
Cellphone group; had a much higher proportion of SA utterances; and their mean
conversor utterance length was shorter. Multivariate analyses of the discourse measures
indicated significant group differences [ps < 0.001] at every hazard location except the
land slip (which was marginally significant at p < 0.07). The univariate comparisons
(Bonferroni adjusted) confirmed that the Alerting Cellphone group had more conversor
pauses and conversor SA utterances at every location (an exception was conversor SA at
Hazard 2 which was p < 0.059); more driver pauses and driver SA utterances at every
location except Hazard 5 (which was p < 0.058 for pauses); and shorter conversor and
driver utterance lengths at Hazards 2, 3 and 4, [ps < 0.01]. Table 3.1 contains some
excerpts from the participants’ conversations at the five hazard sites. As with the driver-
passenger conversations in the first experiment, the conversations over the alerting
cellphone contain frequent pauses and more references to the hazard (SA utterances), as
well as references to the alerting tones themselves.
The mean driving difficulty rating for drivers in the Alerting Cellphone condition was 2.89,
which was lower than the Cellphone group in Experiment 1 (mean of 3.38) and higher
than the control drivers and drivers with passengers (2.44, and 2.75). Post hoc
comparisons indicated that the Alerting Cellphone group’s ratings were not reliably
different from those of either the Control or Cellphone groups [p > 0.05]. Similarly, the
participants’ ratings of driving interference produced by their conversations (mean rating
of 4.22) were lower than the Cellphone group (4.88) and higher than the Passenger group
(3.28), but did not yield reliably different post hoc mean differences.
The 18 drivers had a total of four crashes in Experiment 2 (22% of participants), all but
one of them at the one-lane bridge (the other was at the land slip). This was more than
the single crash that occurred for the 16 no-conversation participants in Experiment 1
(6% of participants), but fewer than the five drivers who crashed while conversing with a
passenger (31%) and far fewer than the 75% of participants in the Cellphone group who
had one or more crashes (for a total of 18 crashes). A Chi-Squared analysis comparing
the Alerting Cellphone and Cellphone groups’ proportion of drivers having one, two, or no
crashes at the five hazard sites indicated a significant group difference [Chi-square =
11.879, df = 2, p < 0.01 ]. Finally, at the end of the experimental session the Alerting
Cellphone group correctly recalled 74.44% of the hazards, which was equivalent to the
Control group in Experiment 1 (76.25%) and significantly better than the 46.25%
correctly recalled by the Cellphone group [p < 0.001].

DISTRACTIVE EFFECTS OF CELLPHONE USE
40
Figure 3.3 Participant’s discourse measures at the five hazards (compared with the control and cellphone participants from Experiment 1).

3. Experiment 2
41
Table 3.1 Discourse excerpts from Alerting Cellphone group.
Hazard 1
Busy
intersection
Pair 3F. Conv ‘I heard a beep’. Driv ‘Yeah I heard a beep too’. Conv ‘Think there is some trouble ahead’. Driv ‘Hazard must be the intersection’. Conv ‘Good thing to notice’. Driv ‘Is it beeping because of the hazard or because I'm doing something wrong?’ C. ‘Think it’s just warning you- you're not doing anything wrong’.
Pair 21 F. Driver ‘That was my resolution to (pause)…ahh I doubt it’s (pause) really going to come true with these test results (pause) oh well’. Conv ‘Is it hard to drive with the beeping?’ Driver ‘Ahh, a little, its real hard to talk’.
Hazard 2
Parked car
entering
traffic
Pair 9F. Driv ‘Yeah, but I failed English’. Converser ‘Are you busy again?’ Driv ‘Yeah. Uh... Just watching’. Conv ‘Yeah? All good?’ Driv ‘Yip. There's a car coming’. Conv ‘So, did you see the stage production with Lawrence Olivier?’
Pair 12M. Driv ‘Yeah, I've just been playing a few on that’. Conv ‘Oh yeah I (pause) sounds like you've encountered a few hazards then’. Driv ‘Looks like it yeah, some car just pulled out in front of me!’ Conv (laughs). Driv ‘Quite suddenly might I add’.
Hazard 3
One-lane
bridge
Pair 16M. Conv ‘What’s the hazard now?’ Driv ‘It looks like a bridge, oh it’s a one lane bridge’. ‘yea (pause) it’s a one way bridge’. Conv: ‘Oh yea’. Driv ‘Hey! Oh this is weird (laughs) It’s just hard to judge, I couldn’t really tell what the car was doing but it was stopping’. (laughs) Conv ‘Oh’.
Pair 24F. Driv ‘…matches and lighters [pause] ok it's beeping at me’. Conv ‘Yeah it's quite loud aye? Is that the phone?’ Driver ‘Pardon?’ Conv ‘Is that the phone beeping?’ Driv ‘We're at a one way bridge’. Conv ‘This trip's gonna last about five hours’.
Hazard 4
Road works
Pair 6M. Driv ‘it’s um (pause) it’s something’. Conv ‘no kidding’. Driv ‘I’m trying to concentrate people, I'm trying to concentrate, jeez what do you think this is’. Conv ‘I’m sorry. Are you through the hazard yet?’ Driver ‘Yeah’.
Pair 20F: Driv ‘200 metres till road works [pause] ooh how exciting’. Conv: ‘“Haha hit the workers. Ha-ha you know you want to’. Driv ‘30kms? I hate it when it says 30kms!’ Conv ‘Try driving all the way out from Feilding, where they had road works on every [pause] every 20 or 30 minutes’.
Hazard 5
Land slip
Pair 8F. Conv ‘Yeah until I was sixteen’. Driv ‘Sixteen!’ Conv ‘Yeah (pause) then we moved down to Hamilton’. Driver ‘Oh that would have been cool. Ok (pause) what's this hazard? A slip’. Conv ‘Man it's hard to just keep talking’.
Pair15M. Driv ‘I think New Zealand, the New Zealand accent is the best English accent. But yep. Oh What! Oh no! Oooh’. Conv ‘Are you alright?’ Driv: ‘Yep, there are a lot of – tell Sam there are a lot of hazards, they did well making the hazards’.
DISTRACTIVE EFFECTS OF CELLPHONE USE
42
3.3 Discussion
The alerting cellphone was associated with driving performance nearly as good as that of
the no-conversation controls from the previous experiment. The drivers’ deceleration
responses were faster, earlier and further away than those of the Cellphone group. The
discourse produced during the cellphone alerts contained more frequent pauses, more
often referred to the driving situation and had shorter utterances than the Cellphone
group. Given the explicit alerting function of the cellphone beeps, it was perhaps not
surprising to find that this condition produced the highest hazard recall accuracy as well.
The low number of crashes observed in this experiment suggests that the alerting
cellphone was at least as effective as passengers at helping drivers prepare for, and
respond to, road hazards. More testing would be required to investigate the technical
feasibility of an alerting cellphone, particularly as regards radio frequencies, signal
strength and placement. Clearly, not all road hazards would be possible or suitable for
such warnings, but the approach might be of some use at locations where stationary
hazards might normally be unexpected or have limited visibility to drivers, such as
temporary road works sites.
When asked to write down what they thought of the alerting cellphone, the participants’
comments were almost universally positive. Some of those reactions included:
Driver 3F. The beeping cellphone was very good at its job. I became
distracted from the conversation the second I heard the first beep and
started concentrating on what was ahead.
Driver 4F. I found that having the warning beeps were beneficial in
keeping my driving safe and my concentration on the road.
Driver 6M. I certainly reacted verbally to the tones when they came on
and found myself searching the road more.
Driver 15M. I personally found the cellphone beeps helpful, as they
alerted me to the fact that I was approaching a section of road that
would require more than the baseline attention to navigate safely.
Driver 17F. I found the hazard warning signals made me focus my
attention on my driving and my driving environment by making me feel
slightly apprehensive about what was coming up further down the road.
Driver 20 F. I did appreciate the warning tones as they drew my
attention to a possible hazard approaching which possibly meant I was
better able to react when the hazard appeared.
Driver 26F. When the tones sounded I noticed our conversation
slowed, stopped and sometimes changed our conversation directly to
talking about the upcoming hazard.
In sum, the alerting cellphone presents an appealing technological possibility for
overcoming many of the unsafe effects associated with drivers conversing on cellphones.

4. General discussion
43
4. General discussion
Driving while talking on a cellphone is different from driving while talking to a passenger.
Drivers conversing on cellphones are less likely to initiate a deceleration response as they
approach a hazard. When cellphone drivers do decelerate, they decelerate later and closer
to the hazard and they are more likely to crash. In the present study, many of these
cellphone drivers failed to prepare for hazards, often didn’t react when they had close
calls or minor collisions, and they had no recollection of the hazard afterwards. One can
infer that these drivers never detected the hazards unless they had a significant collision.
This finding is consistent with recent reports in the literature that drivers are typically
unaware of how poor their driving has become as a result of conversing on cellphones
(Horrey et al 2008). Because drivers’ attention is directed towards the conversation,
rather than their driving, they neither detect nor recall performance decrements or close
calls.
The practical implication of the findings obtained for drivers’ conversing with passengers
is clear; the idea that drivers’ use of cellphones need not be restricted simply because of
the impracticality of restricting equally hazardous conversations with passengers is not a
viable argument. Drivers’ cellphone and passenger conversations are different and have
different effects on driving performance. One reason for the safety differences between
drivers conversing on cellphones and passenger conversations may lie in the content and
form of the discourse in these two cases. Passengers were more likely to pause and make
shorter utterances (conversation suppression) and were more likely to say something
about the current driving situation (SA utterances) as compared to cellphone conversors.
Which of these two conversational aspects is important for avoiding the negative
consequences of drivers’ cellphone use? The remote passengers displayed some of the
topic shifts but very few of the pauses, with the result that their driving partners
displayed nearly the same level of disruption as drivers conversing with a conversor who
was blind to the drivers’ situation. Several aspects of this finding are important to
consider: 1) seeing the drivers’ situation can result in more utterances about the
situation; 2) seeing what the driver sees doesn’t necessarily produce conversation
suppression (being physically present in the car may be required); and 3) conversation
suppression appears to be somewhat more important than situation-relevant utterances
for safe driving. These findings suggest that conversation suppression can indeed allow
the driver to allocate more attention to the primary driving task when they need to. The
conversation interference ratings were reliably lower for drivers talking to passengers, but
the driving difficulty ratings were too variable to show clear differences between the
conditions. The better driving performance seen in the passenger condition could also be
interpreted as resulting from some other factors such as lower workload due to better
intelligibility or even more caution resulting from the driver’s concern about the welfare of
their passenger. The performance of the drivers conversing on the alerting cellphone was
nearly as good as the control drivers in the second experiment, suggesting that decreased
workload due to better speech intelligibility was not the reason for the advantage enjoyed

DISTRACTIVE EFFECTS OF CELLPHONE USE
44
by passenger conversations. Similarly, concern for the passengers was probably not a
significant factor moderating driver behaviour inasmuch as the passenger condition did
not produce slower speeds or faster reaction times than the control condition and alerting
cellphone condition (when drivers were alone).
The role of conversation suppression appears to be a key factor in avoiding the negative
effects associated with drivers conversing on cellphones. The alerting cellphone simulation
was able to produce a level of conversation suppression similar to that found with
passengers and thus promises a technological solution to a vexing problem associated
with public resistance to restrictions on the use of cellphones in cars. The feasibility of this
solution, however, would require considerably more investigation in order to judge its
ultimate usefulness. Additional research could also productively explore the relative
contributions of speech intelligibility and speech rate on driver workload to determine
whether attention and workload are the important constituents of the advantage of
passenger conversations over cellphone conversations. Finally, an argument can be made
that cellphone conversations are more distracting than other in-car activities because they
are continuous and externally paced. In contrast, operation of radios and CD changers
can be stopped and started, drivers can actively manage their level of distraction, similar
to the way passengers manage their distraction by pausing. Drivers can not, however,
manage their cellphone conversations in the same way. Participants in a conversation
have an expectation of continuous discourse, with no interruptions, that places cognitive
demands on drivers that other distractions do not (McKnight and McKnight 1993).
Although an alerting cellphone may provide one suggested method of relieving some of
this continuous demand when necessary, more research examining other methods of
presenting alerting information to drivers regardles of their cellphone use (eg via in-car
navigation aids such as GPS) would be required before any one solution is pursued.
Further, future research exploring and comparing the self-paced and externally paced
aspects of other in-car distractions of various durations would be very useful.
The artificiality of laboratory procedures generally, and simulations specifically, must be
taken into account when generalising the results from such procedures to real-life
situations. In the present case, the unfamiliar car and visual resolution may have
contributed to poorer performance than we would obtain in an actual car on the highway.
Although the hazards included in the simulation scenario were all plausible, their
concentration in a short section of road was unlikely. Certainly the number of crashes
observed in the present experiments would be extremely disappointing and tragic were
they to occur in real life. This does, however, speak to one advantage of simulation, the
possibility of even a low rate of crashes would make replication of this sort of experiment
on the highway unethical and impractical. Further there is an emerging consensus that
relative validity (ie the equal generalisability of the conditions being compared in a
simulated environment) may be more important than absolute validity (eg the veridical
correspondence between driver speeds and reaction times obtained in simulation and on
real roads) (Godley et al 2002; Törnros 1998). The number of laboratories using
simulation has increased dramatically in recent years, perhaps reflecting this
understanding (Bella 2008). In the specific case of research into driving and cellphone

4. General discussion
45
use, a recent meta analysis failed to detect any significant differences in on-road and
simulator research (Caird et al 2008).
At the outset of this research we posed the question of whether driving while conversing
with passengers was safer than conversing over a cellphone; and, if so, was it because of
passengers’ conversation suppression or their ability to alert drivers to hazards ahead?
The present research has shown that passenger conversations are indeed safer than
cellphone conversations, and that what passengers don’t say to drivers may be more
important than what they do say.

DISTRACTIVE EFFECTS OF CELLPHONE USE
46
5. References
Ålm, H., and Nilsson, L. 1994. Changes in driver behaviour as a function of handsfree
mobile phones – a simulator study. Accident Analysis & Prevention 26: 441–451.
Ålm, H., and Nilsson, L. 1995. The effects of a mobile telephone task on driver behaviour
in a car following situation. Accident Analysis & Prevention 27: 707–715.
Amado, S., and Ulupinar, P. 2005. The effects of conversation on attention and peripheral
detection: Is talking with a passenger and talking on the cellphone different?
Transportation Research Part F 8: 383–395.
Beede, K. E., and Kass, S. J. 2006. Engrossed in conversation: The impact of cellphones
on simulated driving performance. Accident Analysis & Prevention 38: 415–421.
Bella, F. 2008. Driving simulator for speed research on two-lane rural roads. Accident
Analysis & Prevention DOI:10.1016/j.aap.2008.01.009.
Brookhuis, K. A., de Vries, G., and de Waard, D. 1991. The effects of mobile telephoning
on driving performance. Accident Analysis & Prevention 23: 309–316.
Brown, G., and Yule, G. 1983. Discourse analysis. Cambridge: Cambridge University
Press.
Brown, I. D., Tickner, A. H., and Simmonds, D. C. V. 1969. Interference between
concurrent tasks of driving and telephoning. Journal of Applied Psychology 53: 419–
424.
Caird, J. K., Willness, C. R., Steel, P., and Scialfa, C. 2008. A meta-analysis of the effects
of cellphones on driver performance. Accident Analysis & Prevention
DOI:10.1016/j.aap.2008.01.009.
Charlton, S.G. 2004. Perceptual and attentional effects on drivers' speed selection at
curves. Accident Analysis and Prevention 36: 877–884.
Consiglio, W., Driscoll, P., Witte, M., and Berg, W. P. 2003. Effects of cellular telephone
conversations and other potential interference on reaction time in a braking response.
Accident Analysis & Prevention 35: 495–500.
Cooper, P. J., and Zheng, Y. 2002. Turning gap acceptance decision-making: The impact
of driver distraction. Journal of Safety Research 33: 321–335.
Crundall, D., Bains, M., Chapman, P., and Underwood, G. 2005. Regulating conversation
during driving: a problem for mobile telephones? Transportation Research Part F 8:
197–211.

5. References
47
Drews F. A., Pasupathi, M., and Strayer D. L. 2004. Passenger and cell-phone
conversations in simulated driving. Proceedings of the Human Factors & Ergonomics
Society 48th Annual Meeting 2210–2212.
Godley, S. T., Triggs, J. T., and Fildes, B. N. 2002. Driving simulator validation for speed
research. Accident Analysis & Prevention 34: 589–600.
Gugerty, L., Rakauskas, M., and Brooks, J. 2004. Effects of remote and in-person verbal
interactions on verbalization rates and attention to dynamic spatial scenes. Accident
Analysis & Prevention 36: 1029–1043.
Haigney, D., and Westerman, S. J. 2001. Mobile (cellular) phone use and driving: A
critical review of research methodology. Ergonomics 44: 132–143.
Hancock, P. A., Lesch, M., and Simmons, L. 2003. The distraction effects of phone use
during a critical driving maneuver. Accident Analysis & Prevention 35: 501–514.
Harbluk, J. L., Noy, Y.I., Trobvich, P. L., and Eizenman, M. 2007. An on-road assessment
of cognitive distraction: Impacts on drivers’ visual behavior and braking performance.
Accident Analysis & Prevention 39: 373–379.
Horberry, T., Anderson, J., Regan, M. A., Triggs, T. J., and Brown. J. 2006. Driver
distraction: The effects of concurrent in-vehicle tasks, road environment complexity
and age on driving performance. Accident Analysis & Prevention 38: 185–191.
Horrey, W. J., and Wickens, C. D. 2006. Examining the impact of cellphone conversations
on driving using meta-analytic techniques. Human Factors 48: 196–205.
Horrey, W. J., Lesch, M. F., and Garabet, A. 2008. Assessing the awareness of
performance decrements in distracted drivers. Accident Analysis & Prevention 40:
675–682.
Hunton, J., and Rose, J. M. 2005. Cellular Telephones and driving performance: The
effects of attentional demands on motor vehicle crash risk. Risk Analysis 25: 855–866.
Kass, S. J., Cole, K. S., and Stanny, C. J. 2007. Effects of distraction and experience on
situation awareness and simulated driving. Transportation Research Part F 10: 321–
329.
Lamble, D., Kauranen, T., Laakso, M., and Summala, H. 1999. Cognitive load and
detection thresholds in car following situations: Safety implications for using mobile
(cellular) telephones while driving. Accident Analysis & Prevention 31: 617–623.
McCartt, M. T., and Geary, L. L. 2004. Longer term effects of New York State’s law on
handheld cellphone use. Injury Prevention 10: 11–15.

DISTRACTIVE EFFECTS OF CELLPHONE USE
48
McEvoy. S. P., Stevenson, M. R., McCartt, A. T., Woodward, M., Haworth, C., Palamara,
P., and Cercarelli, R. 2005. Role of mobile phones in motor vehicle crashes resulting in
hospital attendance: a case-crossover study. BMJ 331: 428–430.
McEvoy, S. P., Stevenson, M. R., and Woodward, M. 2007. Contribution of passengers
versus mobile phone use to motor vehicle crashes resulting in hospital attendance by
the driver. Accident Analysis & Prevention 39: 1170–1176.
McKnight, A. J., and McKnight, A. S. 1993. The effect of cellular phone use upon driver
attention. Accident Analysis & Prevention 25: 259–265.
Maples, W. C., DeRosier, W., Hoenes, R., Bendure, R., and Moore, S. 2008. The effects of
cellphone use on peripheral vision. Optometry 79: 36–42.
Matthews R., Legg, S., and Charlton, S. 2003. The effect of cellphone type on drivers’
subjective workload during concurrent driving and conversing. Accident Analysis &
Prevention 35: 451–457.
Neyens, D. M., and Boyle, L. N. 2007. The effect of distractions on the crash types of
teenage drivers. Accident Analysis & Prevention 39: 206–212.
Nunes, L., and Recarte, M. A., 2002. Cognitive demands of hands-free phone
conversation while driving. Transportation Research Part F 5: 133–144.
Patten, C. J. D., Kircher, A., Östlund, J., and Nilsson, L. 2004. Using mobile telephones:
cognitive workload and attention resource allocation. Accident Analysis & Prevention
36: 341–350.
Rajalin, S., Summala, H., Pöysti, L., Anteroinen, P., and Porter B. E. 2005. In-car
cellphone use and hazards following hands free legislation. Traffic Injury Prevention 6:
225–229.
Rakauskas, M. E., Gugerty, L. J., and Ward, N. J. 2004. Effects of naturalistic cellphone
conversations on driving performance. Journal of Safety Research 35: 453–464.
Redelmeier D. A., and Tibshirani R. J. 1997. The association between cellular telephone
calls and motor vehicle collisions. New England Journal of Medicine 336(7): 453–458.
Redelmeier D. A, and Tibshirani R. J. 2001. Car phones and car crashes: Some popular
misconceptions. Canadian Medical Association Journal 164: 1581–1582.
Rosenbloom, T. 2006. Driving performance while using cellphones: An observational
study. Journal of Safety Research 37: 207–212.
Strayer, D. L., and Johnston, W. A. 2001. Driven to distraction: Dual task studies of
simulated driving and conversing on a cellular telephone. Psychological Science 12:
462–466.
5. References
49
Strayer, D. L., Drews, F. A., and Johnston, W. A. 2003. Cellphone induced failures of
visual attention during simulated driving. Journal of Experimental Psychology: Applied
9: 23–23.
Strayer, D. L., and Drews, F. A. 2004. Profiles in driver distraction: Effects of cellphone
conversations on younger and older drivers. Human Factors 46: 640–649.
Törnros, J. 1998. Driving behaviour in a real and simulated road tunnel – a validation
study. Accident Analysis & Prevention 30: 497–503.
Törnros, J. E. B., and Bolling, A. K. 2005. Mobile phone use – effects of handheld and
handsfree phones on driving performance. Accident Analysis & Prevention 37: 902–
909.
Törnros, J., and Bolling, A. 2006. Mobile phone use – effects of conversation on mental
workload and driving speed in rural and urban environments. Transportation Research
Part F 9: 298–306.
Treffner, P. J., and Barrett, R. 2004. Hands-free mobile phone speech while driving
degrades coordination and control. Transportation Research Part F 7: 229–246.
Violanti, J. M. 1998. Cellular phones and fatal traffic collisions. Accident Analysis &
Prevention 30: 519–524.
Violanti, J. M., and Marshall, J. R. 1996. Cellular phones and traffic accidents: An
epidemiological approach. Accident Analysis & Prevention 28: 265–270.
Wood, C., and Hurwitz, J. 2005. Driver workload management during cellphone
conversations. In Proceedings of the Third International Driving Symposium on Human
Factors in Driver Assessment, Training and Vehicle Design 202–209.

DISTRACTIVE EFFECTS OF CELLPHONE USE
50