Embed Size (px)
Citation preview
J.Chem.Soc.Pak., Vol. 33, No. 2, 2011 174
Assessment of Dissolved/ Dispersed Aliphatic and Aromatic HydrocarbonPollution in Seawater at the Clifton Beach on the Karachi Coast
HINA AHSAN, ALIA BANO MUNSHI*, SOHAIL SHAUKATFAYYAZ AHMED ANSARI AND MOHAMMAD FAISAL KHAN
Center for Environmental Studies, PCSIR Laboratories Complex, Karachi-75280, Pakistan.
(Received on 11th January 2010, accepted in revised form 30th July 2010)
Summary: Sea water samples collected at different depths from 10 stations along the Clifton beach of Karachi Coast were analyzed for dissolved/dispersed polyaromatic and aliphatic hydrocarbons (PAHs and AHs) by GC and GC-MS. Sampling was performed in august 2003, just after the Tasman Spirit oil spill and in august 2003. Levels of total polycyclic aromatic hydrocarbon (PAHs) and aliphatic hydrocarbons (AHs) were 8.20-26.35 µg L−1 (Σ 16 PAHs) and 5.23-21.005 µg L−1 (Σ 16 AHs), respectively. Values decreased later on till lower than 0.02-0.25 ug L−1 possibly representing the background level of the region, exhibited lower concentrations that ranged from 0.02-0.05 µg L−1
(Av. 0.15 µg L−1 Σ 16 PAHs and 0.05–0.2 µg L−1 Σ 14 aliphatic hydrocarbons) with decreasing to 0.07 µg L−1 of PAHs with depth in the water. In September 2005, the concentrations were rather uniform, averaging 0.05 µg L−1 (Σ 16 PAHs) and 4.08 µg L−1 Σ 14 aliphatic hydrocarbons.
Introduction
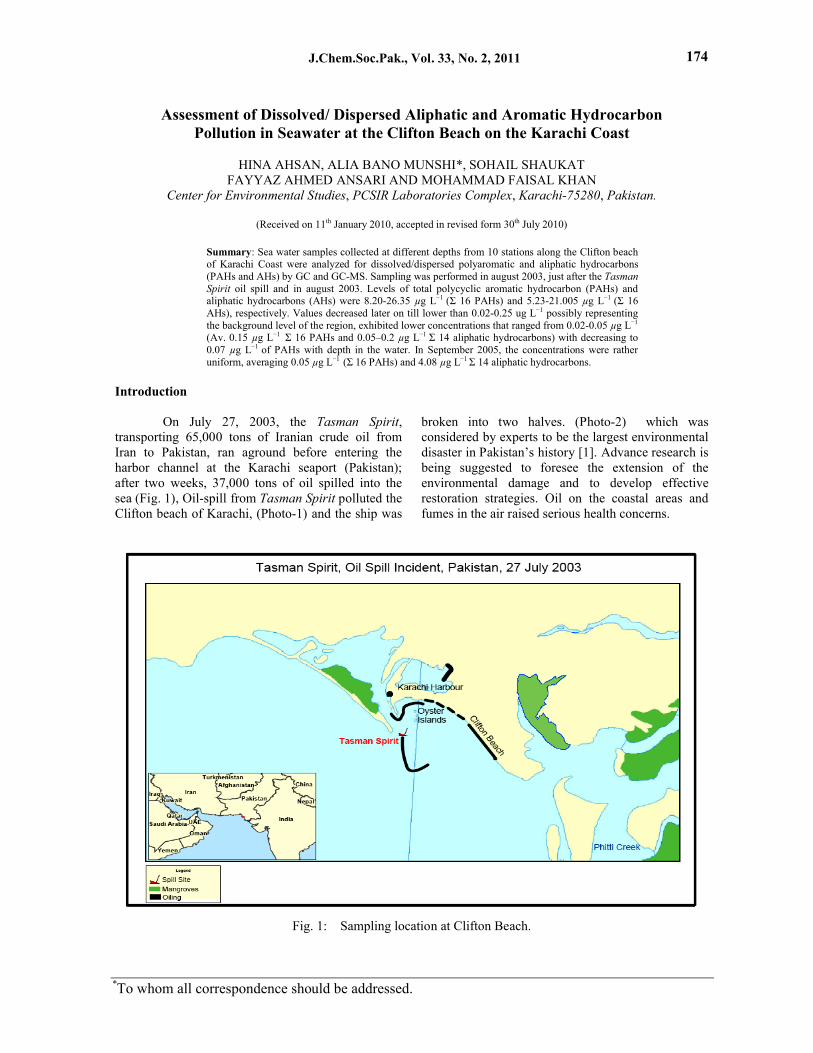
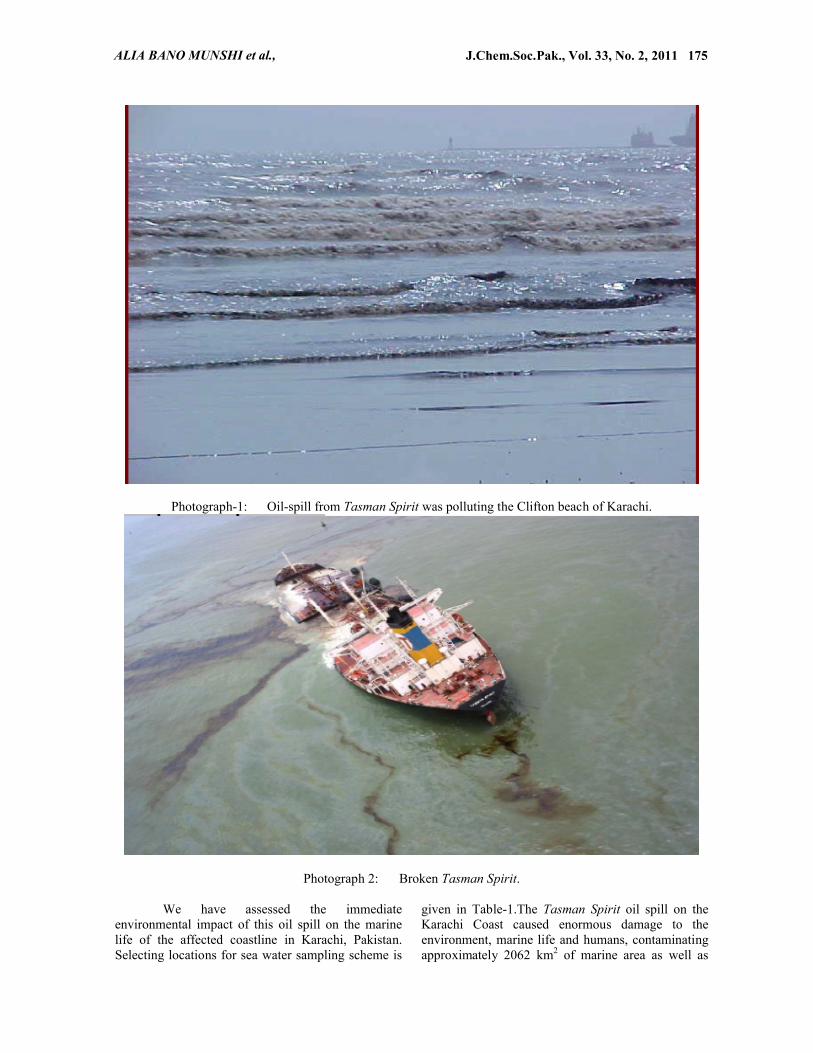
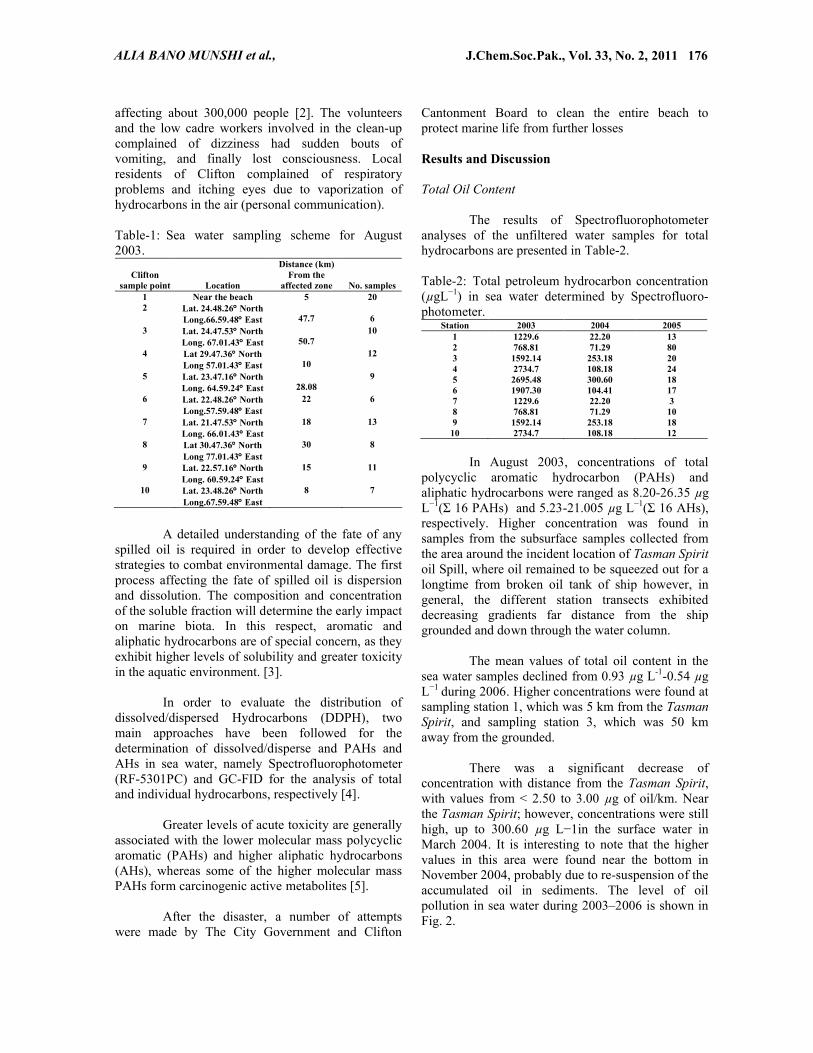
On July 27, 2003, the Tasman Spirit,transporting 65,000 tons of Iranian crude oil from Iran to Pakistan, ran aground before entering the harbor channel at the Karachi seaport (Pakistan); after two weeks, 37,000 tons of oil spilled into the sea (Fig. 1), Oil-spill from Tasman Spirit polluted the Clifton beach of Karachi, (Photo-1) and the ship was
broken into two halves. (Photo-2) which was considered by experts to be the largest environmental disaster in Pakistan’s history [1]. Advance research is being suggested to foresee the extension of the environmental damage and to develop effective restoration strategies. Oil on the coastal areas and fumes in the air raised serious health concerns.
Fig. 1: Sampling location at Clifton Beach.
*To whom all correspondence should be addressed.
J.Chem.Soc.Pak., Vol. 33, No. 2, 2011
J.Chem.Soc.Pak., Vol. 33, No. 2, 2011 175
Photograph-1: Oil-spill from Tasman Spirit was polluting the Clifton beach of Karachi.
Photograph 2: Broken Tasman Spirit.
We have assessed the immediate environmental impact of this oil spill on the marine life of the affected coastline in Karachi, Pakistan. Selecting locations for sea water sampling scheme is
given in Table-1.The Tasman Spirit oil spill on the Karachi Coast caused enormous damage to the environment, marine life and humans, contaminating approximately 2062 km2 of marine area as well as
ALIA BANO MUNSHI et al.,
J.Chem.Soc.Pak., Vol. 33, No. 2, 2011 176
affecting about 300,000 people [2]. The volunteers and the low cadre workers involved in the clean-up complained of dizziness had sudden bouts of vomiting, and finally lost consciousness. Local residents of Clifton complained of respiratory problems and itching eyes due to vaporization of hydrocarbons in the air (personal communication).
Table-1: Sea water sampling scheme for August 2003.
Cliftonsample point Location
Distance (km)From the
affected zone No. samples1 Near the beach 5 202 Lat. 24.48.26 North
Long.66.59.48 East 47.7 63 Lat. 24.47.53 North
Long. 67.01.43 East 50.710
4 Lat 29.47.36 NorthLong 57.01.43 East 10
12
5 Lat. 23.47.16 NorthLong. 64.59.24 East 28.08
9
6 Lat. 22.48.26 NorthLong.57.59.48 East
22 6
7 Lat. 21.47.53 NorthLong. 66.01.43 East
18 13
8 Lat 30.47.36 NorthLong 77.01.43 East
30 8
9 Lat. 22.57.16 NorthLong. 60.59.24 East
15 11
10 Lat. 23.48.26 NorthLong.67.59.48 East
8 7
A detailed understanding of the fate of any spilled oil is required in order to develop effective strategies to combat environmental damage. The first process affecting the fate of spilled oil is dispersion and dissolution. The composition and concentration of the soluble fraction will determine the early impact on marine biota. In this respect, aromatic and aliphatic hydrocarbons are of special concern, as they exhibit higher levels of solubility and greater toxicity in the aquatic environment. [3].
In order to evaluate the distribution of dissolved/dispersed Hydrocarbons (DDPH), two main approaches have been followed for the determination of dissolved/disperse and PAHs and AHs in sea water, namely Spectrofluorophotometer (RF-5301PC) and GC-FID for the analysis of total and individual hydrocarbons, respectively [4].
Greater levels of acute toxicity are generally associated with the lower molecular mass polycyclic aromatic (PAHs) and higher aliphatic hydrocarbons (AHs), whereas some of the higher molecular mass PAHs form carcinogenic active metabolites [5].
After the disaster, a number of attempts were made by The City Government and Clifton
Cantonment Board to clean the entire beach to protect marine life from further losses
Results and Discussion
Total Oil Content
The results of Spectrofluorophotometer analyses of the unfiltered water samples for total hydrocarbons are presented in Table-2.
Table-2: Total petroleum hydrocarbon concentration (µgL−1) in sea water determined by Spectrofluoro-photometer.
In August 2003, concentrations of total polycyclic aromatic hydrocarbon (PAHs) and aliphatic hydrocarbons were ranged as 8.20-26.35 µg L−1(Σ 16 PAHs) and 5.23-21.005 µg L−1(Σ 16 AHs),respectively. Higher concentration was found in samples from the subsurface samples collected from the area around the incident location of Tasman Spiritoil Spill, where oil remained to be squeezed out for a longtime from broken oil tank of ship however, in general, the different station transects exhibited decreasing gradients far distance from the ship grounded and down through the water column.
The mean values of total oil content in the sea water samples declined from 0.93 µg L-1-0.54 µg L−1 during 2006. Higher concentrations were found at sampling station 1, which was 5 km from the Tasman Spirit, and sampling station 3, which was 50 km away from the grounded.
There was a significant decrease of concentration with distance from the Tasman Spirit,with values from < 2.50 to 3.00 µg of oil/km. Near the Tasman Spirit; however, concentrations were still high, up to 300.60 µg L−1in the surface water in March 2004. It is interesting to note that the higher values in this area were found near the bottom in November 2004, probably due to re-suspension of the accumulated oil in sediments. The level of oil pollution in sea water during 2003–2006 is shown in Fig. 2.
Station 2003 2004 20051 1229.6 22.20 132 768.81 71.29 803 1592.14 253.18 204 2734.7 108.18 245 2695.48 300.60 186 1907.30 104.41 177 1229.6 22.20 38 768.81 71.29 109 1592.14 253.18 18
10 2734.7 108.18 12
ALIA BANO MUNSHI et al.,
J.Chem.Soc.Pak., Vol. 33, No. 2, 2011 177
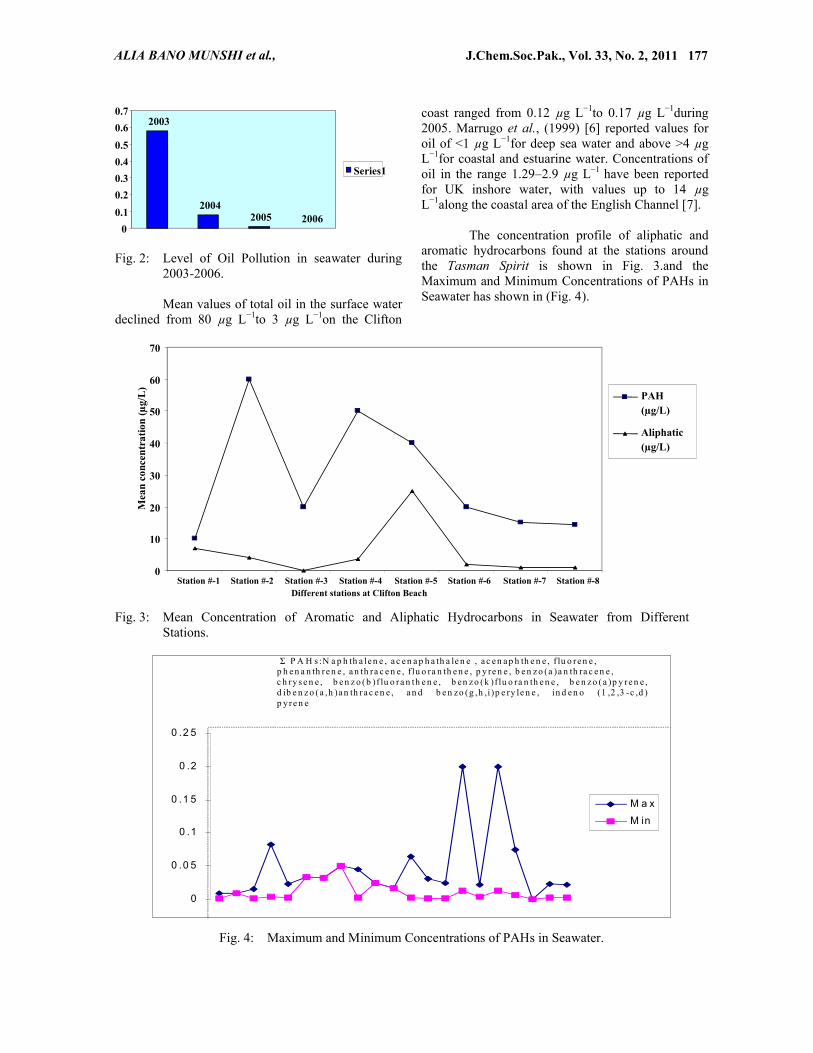
Fig. 2: Level of Oil Pollution in seawater during 2003-2006.
Mean values of total oil in the surface water declined from 80 µg L−1to 3 µg L−1on the Clifton
coast ranged from 0.12 µg L−1to 0.17 µg L−1during 2005. Marrugo et al., (1999) [6] reported values for oil of <1 µg L−1for deep sea water and above >4 µg L−1for coastal and estuarine water. Concentrations of oil in the range 1.29–2.9 µg L−1 have been reported for UK inshore water, with values up to 14 µg L−1along the coastal area of the English Channel [7].
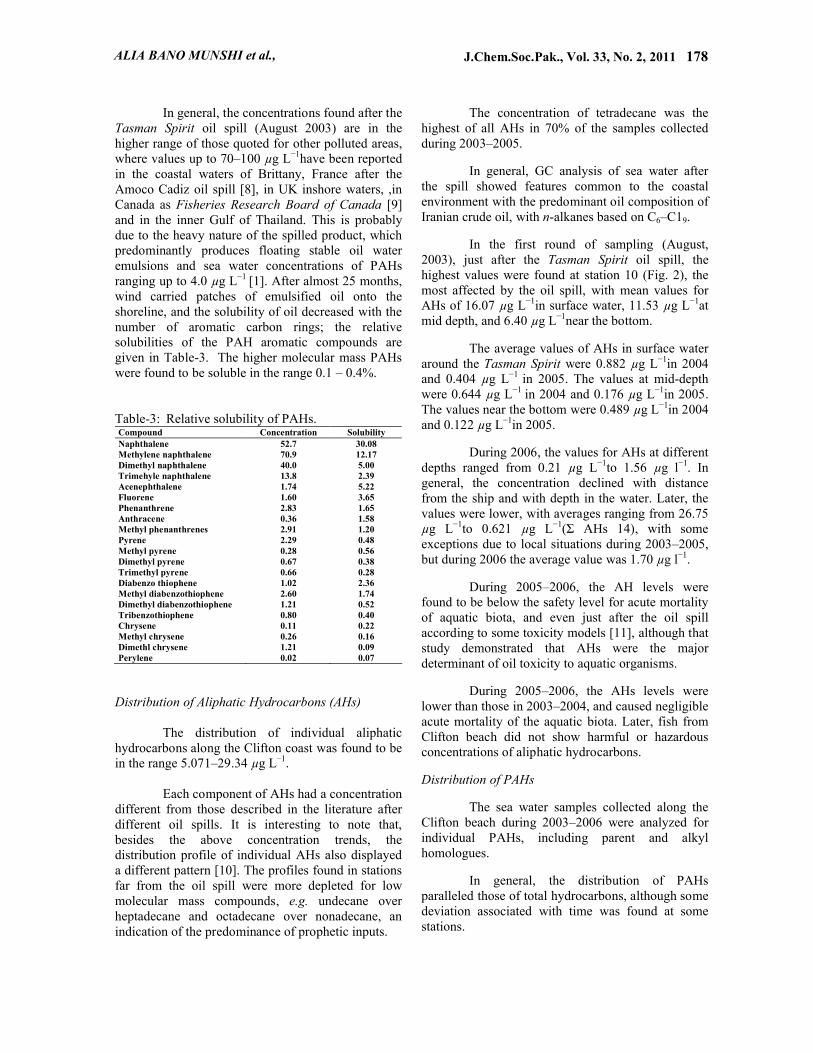
The concentration profile of aliphatic and aromatic hydrocarbons found at the stations around the Tasman Spirit is shown in Fig. 3.and the Maximum and Minimum Concentrations of PAHs in Seawater has shown in (Fig. 4).
Fig. 3: Mean Concentration of Aromatic and Aliphatic Hydrocarbons in Seawater from Different Stations.
Σ P A H s :N a p h th a le n e , a c e n a p h a th a le n e , a c e n a p h th e n e , f lu o re n e , p h e n a n th re n e , a n th ra c e n e , f lu o ra n th e n e , p y re n e , b e n z o (a )a n th ra c e n e ,c h ry s e n e , b e n z o (b )f lu o ra n th e n e , b en z o (k )f lu o ra n th e n e , b e n z o (a )p y re n e , d ib e n z o (a ,h )a n th ra c e n e , a n d b e n zo (g ,h ,i )p e ry le n e , in d e n o (1 ,2 ,3 -c ,d ) p y re n e
0
0 .0 5
0 .1
0 .1 5
0 .2
0 .2 5
M a x
M in
Fig. 4: Maximum and Minimum Concentrations of PAHs in Seawater.
0
10
20
30
40
50
60
70
Station #-1 Station #-2 Station #-3 Station #-4 Station #-5 Station #-6 Station #-7 Station #-8Different stations at Clifton Beach
PAH(µg/L)
Aliphatic(µg/L)
Mea
n co
ncen
trat
ion
(µg/
L)
2003
20042005 2006
0
0.1
0.2
0.3
0.4
0.5
0.6
0.7
Series1
ALIA BANO MUNSHI et al.,
J.Chem.Soc.Pak., Vol. 33, No. 2, 2011 178
In general, the concentrations found after theTasman Spirit oil spill (August 2003) are in the higher range of those quoted for other polluted areas,where values up to 70–100 µg L−1have been reported in the coastal waters of Brittany, France after the Amoco Cadiz oil spill [8], in UK inshore waters, ,in Canada as Fisheries Research Board of Canada [9]and in the inner Gulf of Thailand. This is probably due to the heavy nature of the spilled product, which predominantly produces floating stable oil water emulsions and sea water concentrations of PAHs ranging up to 4.0 µg L−1 [1]. After almost 25 months,wind carried patches of emulsified oil onto the shoreline, and the solubility of oil decreased with the number of aromatic carbon rings; the relative solubilities of the PAH aromatic compounds are given in Table-3. The higher molecular mass PAHs were found to be soluble in the range 0.1 – 0.4%.
Table-3: Relative solubility of PAHs.Compound Concentration SolubilityNaphthalene 52.7 30.08Methylene naphthalene 70.9 12.17Dimethyl naphthalene 40.0 5.00Trimehyle naphthalene 13.8 2.39Acenephthalene 1.74 5.22Fluorene 1.60 3.65Phenanthrene 2.83 1.65Anthracene 0.36 1.58Methyl phenanthrenes 2.91 1.20Pyrene 2.29 0.48Methyl pyrene 0.28 0.56Dimethyl pyrene 0.67 0.38Trimethyl pyrene 0.66 0.28Diabenzo thiophene 1.02 2.36Methyl diabenzothiophene 2.60 1.74Dimethyl diabenzothiophene 1.21 0.52Tribenzothiophene 0.80 0.40Chrysene 0.11 0.22Methyl chrysene 0.26 0.16Dimethl chrysene 1.21 0.09Perylene 0.02 0.07
Distribution of Aliphatic Hydrocarbons (AHs)
The distribution of individual aliphatic hydrocarbons along the Clifton coast was found to be in the range 5.071–29.34 µg L−1.
Each component of AHs had a concentration different from those described in the literature after different oil spills. It is interesting to note that,besides the above concentration trends, the distribution profile of individual AHs also displayed a different pattern [10]. The profiles found in stations far from the oil spill were more depleted for low molecular mass compounds, e.g. undecane over heptadecane and octadecane over nonadecane, an indication of the predominance of prophetic inputs.
The concentration of tetradecane was the highest of all AHs in 70% of the samples collected during 2003–2005.
In general, GC analysis of sea water after the spill showed features common to the coastal environment with the predominant oil composition of Iranian crude oil, with n-alkanes based on C6–C19.
In the first round of sampling (August,2003), just after the Tasman Spirit oil spill, the highest values were found at station 10 (Fig. 2), the most affected by the oil spill, with mean values for AHs of 16.07 µg L−1in surface water, 11.53 µg L−1at mid depth, and 6.40 µg L−1near the bottom.
The average values of AHs in surface water around the Tasman Spirit were 0.882 µg L−1in 2004 and 0.404 µg L−1 in 2005. The values at mid-depth were 0.644 µg L−1 in 2004 and 0.176 µg L−1in 2005. The values near the bottom were 0.489 µg L−1in 2004 and 0.122 µg L−1in 2005.
During 2006, the values for AHs at different depths ranged from 0.21 µg L−1to 1.56 µg l−1. In general, the concentration declined with distance from the ship and with depth in the water. Later, the values were lower, with averages ranging from 26.75 µg L−1to 0.621 µg L−1(Σ AHs 14), with some exceptions due to local situations during 2003–2005,but during 2006 the average value was 1.70 µg l−1.
During 2005–2006, the AH levels were found to be below the safety level for acute mortality of aquatic biota, and even just after the oil spill according to some toxicity models [11], although that study demonstrated that AHs were the major determinant of oil toxicity to aquatic organisms.
During 2005–2006, the AHs levels were lower than those in 2003–2004, and caused negligible acute mortality of the aquatic biota. Later, fish from Clifton beach did not show harmful or hazardous concentrations of aliphatic hydrocarbons.
Distribution of PAHs
The sea water samples collected along the Clifton beach during 2003–2006 were analyzed for individual PAHs, including parent and alkyl homologues.
In general, the distribution of PAHs paralleled those of total hydrocarbons, although some deviation associated with time was found at some stations.
ALIA BANO MUNSHI et al.,
J.Chem.Soc.Pak., Vol. 33, No. 2, 2011 179
In the first round of sampling (August. 2003), just after the Tasman Spirit oil spill, the highest subsurface values were between 1.25 µg L−1
and 8.20 µg L−1(Σ16 PAHs) (Fig. 1).
In 2003, the maximum concentration of PAHs was 0.888 µg L−1, which decreased to 0.716 µg L−1 in 2004 (Table-3). During 2005, the total concentration of Σ PAHs was increased slightly to 0.81 µg L−1, with more deposition of Σ PAHs at the bottom, where the concentration was 0.452 µg L−1
presumably because of resuspension of oil from the sea bed.
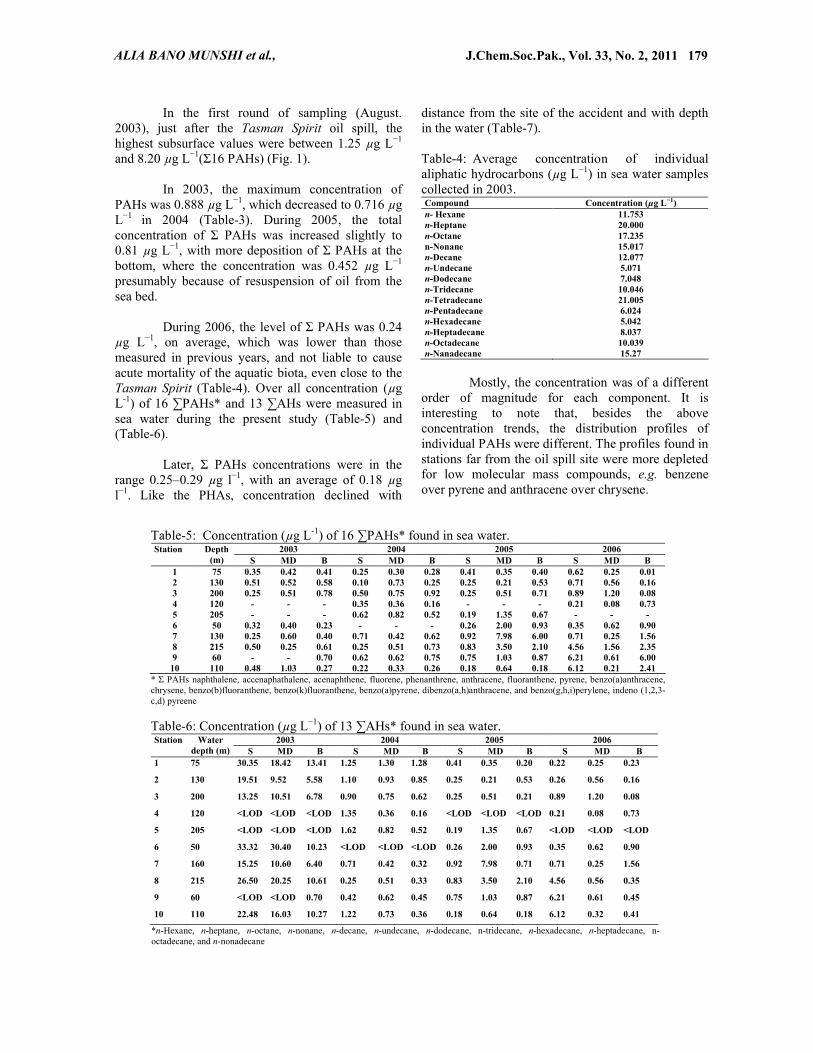
During 2006, the level of Σ PAHs was 0.24 µg L−1, on average, which was lower than those measured in previous years, and not liable to cause acute mortality of the aquatic biota, even close to theTasman Spirit (Table-4). Over all concentration (µg L-1) of 16 ∑PAHs* and 13 ∑AHs were measured in sea water during the present study (Table-5) and (Table-6).
Later, Σ PAHs concentrations were in the range 0.25–0.29 µg l−1, with an average of 0.18 µg l−1. Like the PHAs, concentration declined with
distance from the site of the accident and with depth in the water (Table-7).
Table-4: Average concentration of individual aliphatic hydrocarbons (µg L−1) in sea water samples collected in 2003.Compound Concentration (µg L−1)n- Hexane 11.753n-Heptane 20.000n-Octane 17.235n-Nonane 15.017n-Decane 12.077n-Undecane 5.071n-Dodecane 7.048n-Tridecane 10.046n-Tetradecane 21.005n-Pentadecane 6.024n-Hexadecane 5.042n-Heptadecane 8.037n-Octadecane 10.039n-Nanadecane 15.27
Mostly, the concentration was of a different order of magnitude for each component. It is interesting to note that, besides the above concentration trends, the distribution profiles of individual PAHs were different. The profiles found in stations far from the oil spill site were more depleted for low molecular mass compounds, e.g. benzene over pyrene and anthracene over chrysene.
Table-5: Concentration (µg L-1) of 16 ∑PAHs* found in sea water.2003 2004 2005 2006Station Depth
(m) S MD B S MD B S MD B S MD B1 75 0.35 0.42 0.41 0.25 0.30 0.28 0.41 0.35 0.40 0.62 0.25 0.012 130 0.51 0.52 0.58 0.10 0.73 0.25 0.25 0.21 0.53 0.71 0.56 0.163 200 0.25 0.51 0.78 0.50 0.75 0.92 0.25 0.51 0.71 0.89 1.20 0.084 120 - - - 0.35 0.36 0.16 - - - 0.21 0.08 0.735 205 - - - 0.62 0.82 0.52 0.19 1.35 0.67 - - -6 50 0.32 0.40 0.23 - - - 0.26 2.00 0.93 0.35 0.62 0.907 130 0.25 0.60 0.40 0.71 0.42 0.62 0.92 7.98 6.00 0.71 0.25 1.568 215 0.50 0.25 0.61 0.25 0.51 0.73 0.83 3.50 2.10 4.56 1.56 2.359 60 - - 0.70 0.62 0.62 0.75 0.75 1.03 0.87 6.21 0.61 6.00
10 110 0.48 1.03 0.27 0.22 0.33 0.26 0.18 0.64 0.18 6.12 0.21 2.41* Σ PAHs naphthalene, accenaphathalene, acenaphthene, fluorene, phenanthrene, anthracene, fluoranthene, pyrene, benzo(a)anthracene, chrysene, benzo(b)fluoranthene, benzo(k)fluoranthene, benzo(a)pyrene, dibenzo(a,h)anthracene, and benzo(g,h,i)perylene, indeno (1,2,3-c,d) pyreene
Table-6: Concentration (µg L−1) of 13 ∑AHs* found in sea water.2003 2004 2005 2006Station Water
depth (m) S MD B S MD B S MD B S MD B1 75 30.35 18.42 13.41 1.25 1.30 1.28 0.41 0.35 0.20 0.22 0.25 0.23
2 130 19.51 9.52 5.58 1.10 0.93 0.85 0.25 0.21 0.53 0.26 0.56 0.16
3 200 13.25 10.51 6.78 0.90 0.75 0.62 0.25 0.51 0.21 0.89 1.20 0.08
4 120 <LOD <LOD <LOD 1.35 0.36 0.16 <LOD <LOD <LOD 0.21 0.08 0.73
5 205 <LOD <LOD <LOD 1.62 0.82 0.52 0.19 1.35 0.67 <LOD <LOD <LOD
6 50 33.32 30.40 10.23 <LOD <LOD <LOD 0.26 2.00 0.93 0.35 0.62 0.90
7 160 15.25 10.60 6.40 0.71 0.42 0.32 0.92 7.98 0.71 0.71 0.25 1.56
8 215 26.50 20.25 10.61 0.25 0.51 0.33 0.83 3.50 2.10 4.56 0.56 0.35
9 60 <LOD <LOD 0.70 0.42 0.62 0.45 0.75 1.03 0.87 6.21 0.61 0.45
10 110 22.48 16.03 10.27 1.22 0.73 0.36 0.18 0.64 0.18 6.12 0.32 0.41
*n-Hexane, n-heptane, n-octane, n-nonane, n-decane, n-undecane, n-dodecane, n-tridecane, n-hexadecane, n-heptadecane, n-octadecane, and n-nonadecane
ALIA BANO MUNSHI et al.,
J.Chem.Soc.Pak., Vol. 33, No. 2, 2011 180
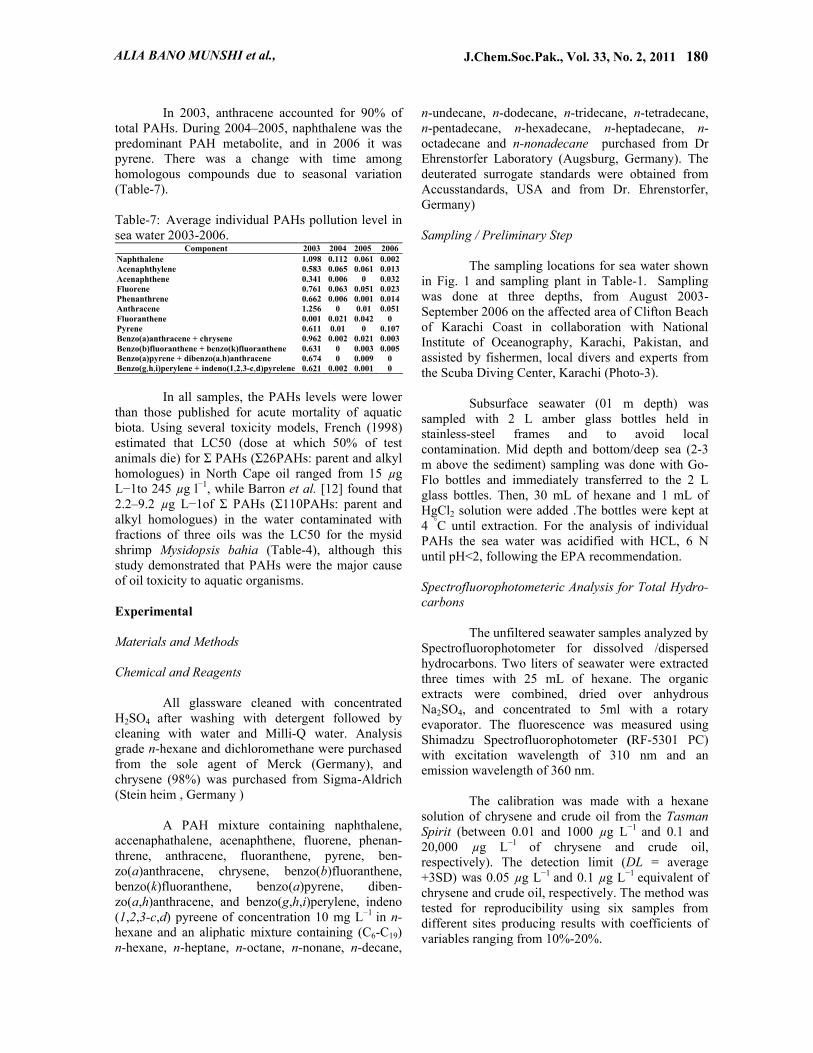
In 2003, anthracene accounted for 90% of total PAHs. During 2004–2005, naphthalene was the predominant PAH metabolite, and in 2006 it was pyrene. There was a change with time among homologous compounds due to seasonal variation (Table-7).
Table-7: Average individual PAHs pollution level in sea water 2003-2006.
Component 2003 2004 2005 2006Naphthalene 1.098 0.112 0.061 0.002Acenaphthylene 0.583 0.065 0.061 0.013Acenaphthene 0.341 0.006 0 0.032Fluorene 0.761 0.063 0.051 0.023Phenanthrene 0.662 0.006 0.001 0.014Anthracene 1.256 0 0.01 0.051Fluoranthene 0.001 0.021 0.042 0Pyrene 0.611 0.01 0 0.107Benzo(a)anthracene + chrysene 0.962 0.002 0.021 0.003Benzo(b)fluoranthene + benzo(k)fluoranthene 0.631 0 0.003 0.005Benzo(a)pyrene + dibenzo(a,h)anthracene 0.674 0 0.009 0Benzo(g,h,i)perylene + indeno(1,2,3-c,d)pyrelene 0.621 0.002 0.001 0
In all samples, the PAHs levels were lower than those published for acute mortality of aquatic biota. Using several toxicity models, French (1998) estimated that LC50 (dose at which 50% of test animals die) for Σ PAHs (Σ26PAHs: parent and alkyl homologues) in North Cape oil ranged from 15 µg L−1to 245 µg l−1, while Barron et al. [12] found that 2.2–9.2 µg L−1of Σ PAHs (Σ110PAHs: parent and alkyl homologues) in the water contaminated with fractions of three oils was the LC50 for the mysid shrimp Mysidopsis bahia (Table-4), although this study demonstrated that PAHs were the major cause of oil toxicity to aquatic organisms.
Experimental
Materials and Methods
Chemical and Reagents
All glassware cleaned with concentrated H2SO4 after washing with detergent followed by cleaning with water and Milli-Q water. Analysis grade n-hexane and dichloromethane were purchased from the sole agent of Merck (Germany), and chrysene (98%) was purchased from Sigma-Aldrich (Stein heim , Germany )
A PAH mixture containing naphthalene,accenaphathalene, acenaphthene, fluorene, phenan-threne, anthracene, fluoranthene, pyrene, ben-zo(a)anthracene, chrysene, benzo(b)fluoranthene,benzo(k)fluoranthene, benzo(a)pyrene, diben-zo(a,h)anthracene, and benzo(g,h,i)perylene, indeno (1,2,3-c,d) pyreene of concentration 10 mg L−1 in n-hexane and an aliphatic mixture containing (C6-C19)n-hexane, n-heptane, n-octane, n-nonane, n-decane,
n-undecane, n-dodecane, n-tridecane, n-tetradecane,n-pentadecane, n-hexadecane, n-heptadecane, n-octadecane and n-nonadecane purchased from Dr Ehrenstorfer Laboratory (Augsburg, Germany). The deuterated surrogate standards were obtained from Accusstandards, USA and from Dr. Ehrenstorfer,Germany)
Sampling / Preliminary Step
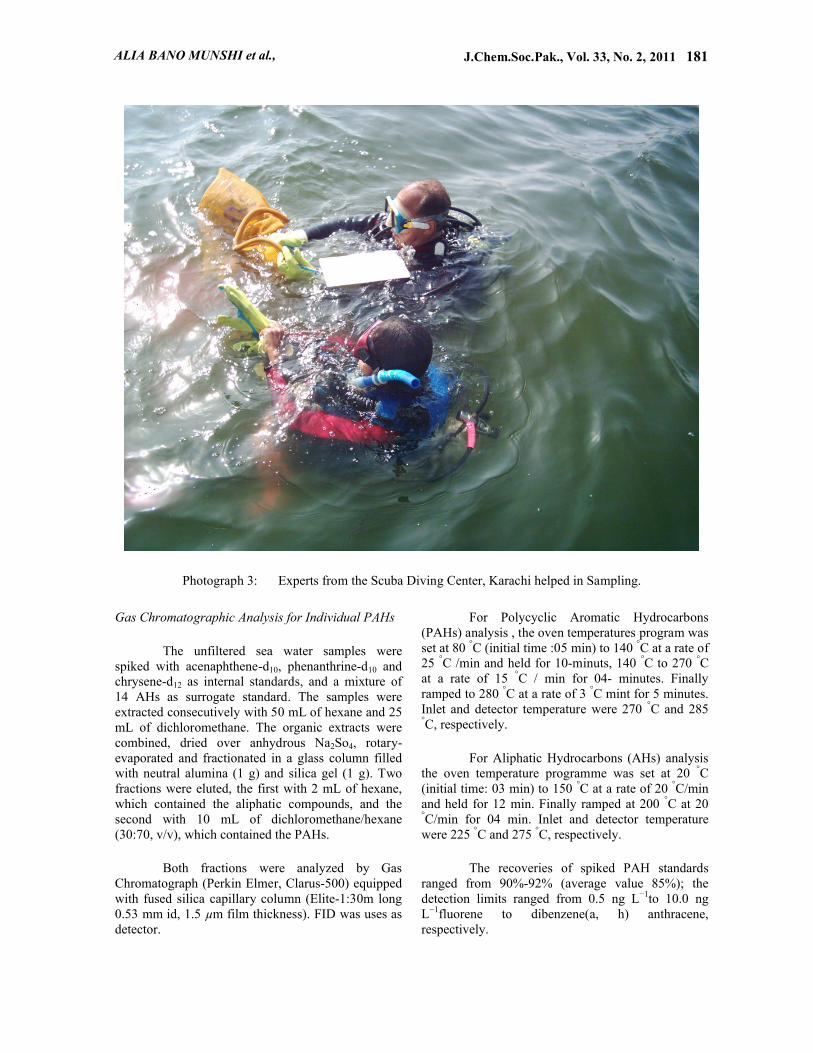
The sampling locations for sea water shown in Fig. 1 and sampling plant in Table-1. Sampling was done at three depths, from August 2003-September 2006 on the affected area of Clifton Beach of Karachi Coast in collaboration with National Institute of Oceanography, Karachi, Pakistan, and assisted by fishermen, local divers and experts from the Scuba Diving Center, Karachi (Photo-3).
Subsurface seawater (01 m depth) was sampled with 2 L amber glass bottles held in stainless-steel frames and to avoid local contamination. Mid depth and bottom/deep sea (2-3m above the sediment) sampling was done with Go-Flo bottles and immediately transferred to the 2 L glass bottles. Then, 30 mL of hexane and 1 mL of HgCl2 solution were added .The bottles were kept at 4 °C until extraction. For the analysis of individual PAHs the sea water was acidified with HCL, 6 N until pH<2, following the EPA recommendation.
Spectrofluorophotometeric Analysis for Total Hydro-carbons
The unfiltered seawater samples analyzed by Spectrofluorophotometer for dissolved /dispersed hydrocarbons. Two liters of seawater were extracted three times with 25 mL of hexane. The organic extracts were combined, dried over anhydrous Na2SO4, and concentrated to 5ml with a rotary evaporator. The fluorescence was measured usingShimadzu Spectrofluorophotometer (RF-5301 PC) with excitation wavelength of 310 nm and an emission wavelength of 360 nm.
The calibration was made with a hexane solution of chrysene and crude oil from the Tasman Spirit (between 0.01 and 1000 µg L−1 and 0.1 and 20,000 µg L−1 of chrysene and crude oil,respectively). The detection limit (DL = average +3SD) was 0.05 µg L−1 and 0.1 µg L−1 equivalent of chrysene and crude oil, respectively. The method was tested for reproducibility using six samples from different sites producing results with coefficients of variables ranging from 10%-20%.
ALIA BANO MUNSHI et al.,
J.Chem.Soc.Pak., Vol. 33, No. 2, 2011 181
Photograph 3: Experts from the Scuba Diving Center, Karachi helped in Sampling.
Gas Chromatographic Analysis for Individual PAHs
The unfiltered sea water samples were spiked with acenaphthene-d10, phenanthrine-d10 and chrysene-d12 as internal standards, and a mixture of 14 AHs as surrogate standard. The samples were extracted consecutively with 50 mL of hexane and 25mL of dichloromethane. The organic extracts were combined, dried over anhydrous Na2So4, rotary-evaporated and fractionated in a glass column filled with neutral alumina (1 g) and silica gel (1 g). Two fractions were eluted, the first with 2 mL of hexane,which contained the aliphatic compounds, and the second with 10 mL of dichloromethane/hexane (30:70, v/v), which contained the PAHs.
Both fractions were analyzed by Gas Chromatograph (Perkin Elmer, Clarus-500) equipped with fused silica capillary column (Elite-1:30m long 0.53 mm id, 1.5 µm film thickness). FID was uses as detector.
For Polycyclic Aromatic Hydrocarbons (PAHs) analysis , the oven temperatures program was set at 80 °C (initial time :05 min) to 140 °C at a rate of 25 °C /min and held for 10-minuts, 140 °C to 270 °Cat a rate of 15 °C / min for 04- minutes. Finally ramped to 280 °C at a rate of 3 °C mint for 5 minutes. Inlet and detector temperature were 270 °C and 285 °C, respectively.
For Aliphatic Hydrocarbons (AHs) analysis the oven temperature programme was set at 20 °C (initial time: 03 min) to 150 °C at a rate of 20 °C/min and held for 12 min. Finally ramped at 200 °C at 20°C/min for 04 min. Inlet and detector temperature were 225 °C and 275 °C, respectively.
The recoveries of spiked PAH standards ranged from 90%-92% (average value 85%); the detection limits ranged from 0.5 ng L−1to 10.0 ng L−1fluorene to dibenzene(a, h) anthracene,respectively.
ALIA BANO MUNSHI et al.,
J.Chem.Soc.Pak., Vol. 33, No. 2, 2011 182
Standardization of Methods for Analysis
Quantification was carried out by comparison with naphthalene and normal hexadecane as internal standards for the aliphatic and aromatic fractions, respectively, as well as with an external standard. A spiked water sample of known concentration (1.00 µg L−1) was analyzed according to this procedure; the results were within the confidence intervals for both aliphatic and polyaromatic hydrocarbons. The average extraction recovery was 92.8 (± 4.0) % for the PHA fractions and 90.4 (± 2.9) % for the PAH fractions.
Analytical Quality Control / Quality Assurance
The quality of data was assured through analysis of the appropriate Certified Reference Materials. Deuterated surrogates and internal standards were used to compensate for loss during sample extraction and work-up. The surrogate standard was used to monitor method performance for each sample, while the internal standard was used to compensate for variation in the final extract volume, injection volume, and instrument sensitivity[13]. Analysis of blank samples was carried out with each batch. All compounds were identified by retention times. Values for % RSD, LOD and LOR are given in Table-3.
Conclusion
Studies have demonstrated that levels of PAHs and AHs as low as 1 ng L−1in sea water cause toxic, long-term effects. This detailed study has taken about two years, with the main objective of monitoring the levels of PAHs and AHs from July 27, 2003 up to December 2006 after an oil spill at sea. On the basis of the findings of this study, it has been concluded that no harmful oil pollution persists at present (2006), due to considerable bioremedial measures that were taken in this area, but regular monitoring for at least the next 10 years is recommended.
Acknowledgement
The Ministry of Science & Technology,Pakistan is duly acknowledged for financial support via DDWP project, funding of Rs. 10.5 million for PCSIR.
References
1. Oil Spill from Tasman Spirit may affect Marine Life for 500 Years”, Daily DAWN Newspaper,(2003),
2. Tasman Spirit disaster report: Ecological recovery could take 10 years, Daily Times Updates (2005),
3. J. J. Gonzalez, L. M. A. Vinas, Franco, J.Fumega, J. A. Sorina, G. Gruuiro, S. Muniategui,P. Lopez-Mahia, D. Prada, J. M. Bayona, R.Alzaga, and J. Albaiges, Marine PollutionBulletin, 53, 239 (2006).
4. K. Grassholf, K. Ling, and G Ehrhadt (Eds),Wiley-VCH, Weinhein, Germany (1999).
5. J. Guinan, M. Charles Worth. M. Serviceb, T. Oliverb, Marine Polluttion Bulletin, 42, 1073 (2001).
6. A. J. M. Gonzalez, R. F. Maestre, and R. I.Gaitan, Marine Pollution Bulletin, 38, 819 (1999).
7. R. J. Law, Marine Pollution Bulletin, 12 153 (1981).
8. M. H. Marchand, Environmental International,4, 442 (1980).
9. P. R .Mackie, R. Hardy, and R. Whittle, Journal of the Fisheries Research Board of Canada, 35,544 (1978).
10. M. P. Zakaria, T. Okude, and H. Takada,Marine Pollution Bulletin, 2, 1357 (2001).
11. D. P. French, AMOP Technical Seminar,Alberta, Canada, 387-430 (1998).
12. M. G. Barron, T. Prdrabsky, S. Logic, and Rieker, Txicology, 46, 253 (1999).
13. UNESCO (IOC) Manual for intergovernmental Oceanographic Commission Manuals and Guides, No.13:35, (1984).
ALIA BANO MUNSHI et al.,