Embed Size (px)
Citation preview

Current Science International ISSN 2077-4435
Volume : 4 | Issue : 01 | Jan-Mar. | 2015 Pages: 27-44
Corresponding Author: Omayma E. Ahmed, Department of evaluation and analysis Egyptian petroleum Research institute Nasr City, Cairo, Egypt
E-mail: [email protected]
27
Aliphatic and Poly-Aromatic Hydrocarbons Pollution at the Drainage Basin of Suez Oil Refinery Company 1Omayma E. Ahmed and 1Sawsan A. Mahmoud, 2Abd El Rahman M. Mousa 1 Egyptian Petroleum Research Institute, Nasr City, Cairo, Egypt
2Ain Shams University, Cairo, Egypt. ABSTRACT
Aliphatic and PAHs were investigated in the surface water of drainage basin of Suez Oil Petroleum Company (SOPC) in 2014 by Gas chromatography, HPLC, Ultraviolet, and FT-IR spectroscopy to evaluate an environmental risk assessment from PAHs contamination. Aliphatic ranged from 5726 to 45825 ng/L, while aromatics varied between 64.791and 2338412.8 ng/L. PAHs ranged from a relatively moderate to high PAHs pollution compared to other urbanized coastal areas worldwide. 3-ring and 4-ring PAHs were most abundant in the sampling area. The studied stations received their PAHs from both petrogenic and pyrolitic sources, although petroleum derived PAHs were dominant at the stations situated near the refinery processes and pyrolytic sources were mainly prevalent in the drainage of (SOPC). The ratio of UCM to n-alkanes and CPI values in all stations indicate that the main contribution to petroleum hydrocarbons contamination is via oil and its products. Regular monitoring of aliphatic and PAHs contaminant in the region is recommended. Key words: PAHs, Aliphatic hydrocarbons, UCM ratio, n-alkanes and CPI values, drainage basin of (SOPC).
Introduction
The Suez oil petroleum Company (SOPC) have oil companies, several of these companies have been in operation of oil refining, processing and petroleum products distribution activities and war strikes have resulted in tremendous impacts on the safety and environmental conditions in the Gulf Suez. Hydrocarbon leaks and spills have resulted in serious contamination to the Gulf and become the major fire safety hazard in addition to posing serious environmental risk. Due to financial reasons and urge of immediate correction action, the conducted investigation focused on fire potential in order to minimize the risk. Free product were discharged in outlet of SOPC by investigation of these products, it found (paraffin's, isoparaffins, aromatics, naphthenic and olefins) and give a complete breakdown of the entire chemical component which comprise the hydrocarbons. Chemical analysis of the free product collected from the subsurface that several sources of petroleum hydrocarbon release are responsible for the free product plume. Mazot, solar (diesel) and gasoline (Benzenes) range petroleum hydrocarbons. Suez Oil processing company (SOPC) is referred free products such as paraffin, aromatic naphthene and olefin and give a complete breakdown of all the chemical components which comprise the hydrocarbons, by analytical analysis of it suggested heavy range crude oil (C6-C25) and low naphthenic, low aromatics and olefins. The hydrocarbon is more towards heavy crude range (C6-C25) with strong normal paraffin's. Very broadly, the hydrocarbon components of petroleum compounds may be categorized as either saturated hydrocarbons (alkenes) or alternatively categorized as aromatic and non-aromatic (aliphatic hydrocarbons). Paraffin's are the straight chain alkanes, isoparaffins are the branch- chain alkanes and the naphthenic are the saturated hydrocarbons that are arranged in one or more rings (cycloalkanes or cycloparaffins). Paraffin, isoparaffins and naphthenic are aliphatic (non-aromatic) hydrocarbons. Paraffin hydrocarbons are not very soluble in water and will biodegrade rapidly under the proper environmental conditions. Olefins are the aliphatic (non-aromatic) hydrocarbons. Paraffin hydrocarbons are not very soluble in water and will biodegrade rabidly under the proper environmental conditions. Olefins are the aliphatic (non-aromatic) alkenes (unsaturated hydrocarbons). The Olefins are mono-unsaturated (single double bond between carbon atoms). Olefins are usually formed by thermal and catalytic cracking and rarely occur naturally in un-processed crude oil. The aromatic compounds are cyclic (ring-type) unsaturated hydrocarbons containing one or more benzene rings. In general aromatic hydrocarbons are more soluble in water, more toxic and more resistant to biodegradation than the corresponding paraffin's, isoparaffins, naphthenic and olefins. The polycyclic aromatic hydrocarbons (PAHs) contain multiple benzene rings. PAHs are known potent human carcinogens and are not easily biodegraded. The PAHs included naphthalene (C10-H10) anthracene (C14-H10), phenanthrene (C14-H10), and pyrene (C16-H10). Of these compounds, naphthalene PAHs was found in the hydrocarbons from the waste ponds. These include naphthalene (0.3% by weight), 1-methylnaphthalene (1.5%) and 2-

Curr. Sci. Int., 4(1): 27-44, 2015
28
methylnaphthalene (0.6%). Naphthalene compounds contain a double benzene ring and are not to be confused with naphththenes (cycloparaffins). Naphththenes is patent carcinogen versus the relatively less toxic naphthenic. These naphthenic compounds represent a potential health hazard (Sameh, 2004). The width of the Suez Gulf fluctuates between 20 and 40 km, and its depth throughout its axis is fairly constant with a mean of 45 m (El-Sabh, et al., 1983; El-Moselhy, et al., 2004). The Suez Bay in the northern part of the Suez Gulf a eutrophic region characterized by anticlockwise water circulation (Meshal, 1970; Soliman, 1996; El-Moselhy, et al., 2004). The Suez Bay ecosystem is suffering of adverse effects of discharged as well as industrial wastes from various activities based near the Suez Gulf Figures. 1&2, such as petroleum companies, Suez Petroleum Company and Al-Nasr Petroleum Company for refining the crude oil. The Suez bay area is subjected to pollution and all refuses coming from the sources are discharged directly or indirectly into the Bay. These refuses contain a very large variety of chemicals residues especially, hydrocarbons. Such undesirable inflows disrupt the ecological balance and affect the quality of water for human use. Inlet outlet water of (SOPC) is located in Zietyia area about 2-3 km south west of Suez city and closed to the most important and famous international way. The Suez oil company is the first national petroleum refinery in Egypt, since 1921 (Eman, 2013). The company processes various kinds of crude oils and producing the following finished oil products: fuel gas, propane, butane, gasoline, jet fuel, and kerosene and gas oil. The wastewater samples were taken from the drainage basin, which is used to remove the waste oil from the surface of the wastewater. The petroleum companies takes water from Suez bay and mixed it with fresh water to utilize in washing the crude oil. Main activity of Suez Oil Company is the refining of oil to produce petroleum derivative products like naphtha, kerosene, gasoline, asphalt, petroleum coal through coaling towers as well as sulfur. The company is located in the south of Al -Nasr Petroleum Company. The company discharges oily wastewater into the Gulf of Suez, the discharge rate is 360.000 m3/ day (REMIP WORKING GROUPs 2008). It is reported that the water quality of the effluent is almost in conformity with the limits of effluent standards in Egypt; however 6,060 kg of oil and greases is discharged daily in the receiving waters.
Therefore, the purpose of this study is to assess the level of concentration, distribution and Potential sources of aliphatic and Poly-aromatic Hydrocarbons contamination transferred from the discharge basin of SOPC to the Suez Gulf in order to minimize the risk and use a basic data for manage and monitor.
Methods and Materials Area of study on the Suez Gulf:
Suez Gulf to be wholly affected by the discharged pollutants Figures 1&2. Outlet of Suez Oil Company is located in area about 2-3 km south west of Suez city and closed to the most important and famous international way. The minimum areas and dimensions for discharge basin as a final design: Number of channel (n) is 2, the maximum width, (B) = 55m. Depth, (d) = 3.5 m. Length, (L) = 148 m. Sampling station have selected to appreciate the direct influence of associated oil activities Suez Gulf relative to a reference background level represented by the discharge basin of (SOPC) (REMIP WORKING GROUPs 2008).
Fig. 1: Position of the Suez Oil Petroleum Company (SOPC)

Curr. Sci. Int., 4(1): 27-44, 2015
29
Collection of waste water samples
The samples are collected from the Different distances along the drainage Basin of SOPC in the studied area as described in Figure 2 & Table 1. The wastewater samples were taken from the drainages using plastic water sampler for waste water analysis, the sample size was (3L.) for the petroleum analysis and cleaned before use; they were rinsed several time in 0.1N hydrochloric acid for several days and then rinsed and protected in diluted acid to prevent degradation of oil to give proper result of analysis. During the period of study, the wastewater samples are collected from two sides of the location and mixed to make composite sample which represent one station.
Fig. 2: Position of Outlet of SOPC wastewater and samples station along the Suez Gulf Table 1: Studied site, their location, activities and distance along the drainage Basin of Suez Oil Petroleum Company (SOPC) S. No.
Locations
Activities for each site Distance from
drainage center of ( SOPC) m.
1 Outlet center of (SOPC). Wastes of conversion operations of crude oil to refined products at the center of the outlet of petroleum drainage of Suez Company.
0-0 m.
2 25 m. /west from outlet center of (SOPC). Wastes of conversion operations of crude oil to refined products along the west side of the outlet of petroleum drainage of Suez Company with 25 m.
25 m./ west
3 25 m. / east from outlet center of (SOPC). Wastes of conversion operations of crude oil to refined products along the east side of the outlet of petroleum drainage of Suez Company with 50 m.
25 m./ east
4 50 m. /west from outlet center of (SOPC). Wastes of conversion operations of crude oil to refined products along the west side of the outlet of petroleum drainage of Suez Company with 50 m.
50 m./ west
5 50 m. / east from outlet center of (SOPC). Wastes of conversion operations of crude oil to refined products along the east side of the outlet of petroleum drainage of Suez Company with 50 m.
50 m./ east
6 75 m. / west from outlet center of (SOPC). Wastes of conversion operations of crude oil to refined products along the west side of the outlet of petroleum drainage of Suez Company with75 m.
75 m./ west
7 75 m. /east from outlet center of (SOPC). Wastes of conversion operations of crude oil to refined products along the east side of the outlet of petroleum drainage of Suez Company with75 m
75 m./ east
8 100 m. /west from outlet center of (SOPC). Wastes of conversion operations of crude oil to refined products along the west side of the outlet of petroleum drainage of Suez Company with 100 m.
100 m./ west
9 100 m. /east from outlet center of (SOPC). Wastes of conversion operations of crude oil to refined products along the east side of the outlet of petroleum drainage of Suez Company with 100 m.
100 m./ east
m.: Meter's.

Curr. Sci. Int., 4(1): 27-44, 2015
30
Extraction of petroleum oil from seawater samples:
100 ml of the surface seawater sample was shaken with 100ml of carbon tetrachloride in a separating funnel for 15 minutes. After 30 seconds agitation and 3 minutes settling period, the aqueous layer was discarded. The process was repeated until all of seawater sample has been extracted. The obtained extract was dried using anhydrous sodium sulphate (30g).The extract was then transferred to a weighted beaker and finally evaporated by electrical furnace at 60 0C till constant weight (Nazik, et al. , 2013) Gas chromatography analysis:
All the oils-extracted from the studied water samples were analyzed using capillary column according to the standard test method IP318/75 (IP Standard, 1993; Omayma, et al., 2014) for Analysis and Testing of Petroleum and Related Products. Agilent Technologies7890 A, Gas Chromatograph System, FID with HP-5, 30m Length, 0.320mn film thickness capillary Column. The Carrier gas was helium at flow rate of 2ml/min. The injection volume was 0.1 µI. Oven temperature increased from 80◦C with a rate of 3◦C/min up to 300 ◦C. The injector temperature and detector temperature were 320 ◦C. High-Performance liquid chromatography analysis:
PAH identification and quantification in the extracted oil was performed using HPLC technique (Shou, et al., 2006). The apparatus used was water HPLC 600, Auto Sampler 616 Plus, Dual Absorbance Detector 2487, attached to a computerized system with Millennium 32 Software. The following were the HPLC conditions: the sample volume was 100 μl; the column used was Supelcosil LC-PAHs 5 cm, 4.6 mm ID, 4-μm particles; mobile phase was achieved using a acetonitrile/water ratio of 60:40 and was changed gradually to 100 % acetonitrile within 20 min. The flow rate was 1.2 ml/min, and the detector used was a UV type, 254 mm.
Ultraviolet analysis:
Ultraviolet analysis was carried by UV/VIS/NIR Spectrophotometer (USA) V-570 JASCO, UV/VIS/NIR Spectrophotometer. The oil samples extract were dissolved in small amounts of n-hexane, Scanning range 200 –600nm, the absorbance (A) was measured and their ratios were calculated as A205/ A215, A228/A256, A248/A267, A248/A278 (Ehrhadt, et al ., 1989 ; Maged, et al ., 1999). Fourier transforms Infrared spectral analysis (FT-IR):
This technique was used for the characterization of petroleum and its degradation compounds dispersed in samples. Infrared allows us to give a picture of an oil ´s health and also whether any contaminants are present such as fuel or coolant. The sample as dissolved in carbon tetrachloride (A.R.) and introduced into quartz cell for analysis. Nicolet IS-10 FT-IR, Thermo Fisher Scientific model Nicolet IS-10, CS-Q 01, AKX0901119012A0607 was used in the range 4000-500 cm-1 (Abd El Rahman, et al., 2001).
Results and Discussions
Analysis of oil extracted from the discharge basin of SOPC Oil Content comparable with some reported studies:
Concentrations of oil content vary widely from 5726 to 45825 ng/L depending on sites with the west coast of discharge basin recorded higher values than the east coast ones Table 2, Figure 3. The highest concentrations at outlet center of SOPC 45825 ng/L whereas, the lowest concentrations at 100m. /east from outlet center of SOPC 5726 ng/L. On the other hand, a steady decline of oil content from the outlet center to 100m. distances towards the west and east sides. This is much to do with the state of development and the effect of the current direction of wind in the discharge basin of SOPC. The company processes various kinds of crude oils and producing the following finished oil products: fuel gas, propane, butane, gasoline, jet fuel, and kerosene and gas oil, the wastewater was discharged to the drainage basin. The petroleum company's takes water from Suez bay and mixed it with fresh water to utilize in washing the crude oil and different cooling purposes, some oily smuggling occurs for water. The oily water is characterized by that they contain a high proportion of the oil

Curr. Sci. Int., 4(1): 27-44, 2015
31
which is caused by refinery production units (Coking - distillation - oils), liquidation warehouses crude and petroleum products, water waste companies neighboring filter wards pumps, Trnchat grids crude and petroleum products, this oily water are assembled and pushing it through a network of lines to basins separated oil but, the separation efficiency percentage of oil not good. So, the treatment plant cannot process in the company anymore, which is directly (untreated) discharged into the Suez Gulf. In comparison with other studies dealing that these results are higher than those reported in Kuwait 2100-3600 ng/L by EL-Samara, et al., (1986); Oman 1300-28900 ng/L by Badawy, et al., (1993); Mediterranean Sea, Damietta –Manzalah lake Egypt, 1120-6010 ng/L by Mohamed, (2004); English Channel 300-14000 ng/L by Fileman, (1989); Arabian Sea ( Coast Zone) 600-18800 ng/L by Sen-Gupta, et al.,(1980); Suez Gulf, Egypt 3880-7460 ng/L by Mohamed, (2012) in summer season; King George Island, Antarctica 2800-17900 ng/L by Márcia, et al., (2003); Mediterranean Sea, Damietta – Man zalah lake 2200-10370 ng/L by Maged, et al., (1999); Thailand, Western Coast of the Philippines 200- 1470 ng/L by Suriyan, et al., (1998); Mediterranean Sea, Alexandria coast 1875-15857&616-5074 ng/L for winter and summer by Abd-el Rahman, et al., (2012); Arabian Gulf 190-3470 ng/L by Ehrhrdt et al., (1993); Red Sea 1880-7600 ng/L by (Nagla, 2006); Mediterranean Sea, Alexandria coast 600-41400 ng/L by Wahby, et al., (1980) and Saudi Red Sea (<70) – 2940 ng/L by Sultans, et al., (1997). However, total hydrocarbon concentrations in the discharge basin were lower than those found by several authors, 0.0-139000 ng/L by Hanan, (2007), 53200-376900 ng/L in summer season by Mohamed, (2012) and 1868-65698ng/L&5639-74800 ng/L for winter and summer seasons respectively by Eman., (2013) in Suez Gulf Egypt; 14550-65460 ng/L by Shereet, (2009); in Mediterranean Sea, Damietta harbor; 18800-412000 ng/L and 35000-612000 ng/L by Awad, (1990 & 1988) in Red Sea, Saudi Arabia Coast and 170-59700 ng/L ( El-Agroudy, 2001) in Suez Canal.
Table 2: Oil content (ng/L) extracted from sampling stations along the drainage basin.
Oil content (ng/L) Location S.NO
45825 Outlet center of (SOPC). 1 34644 25 m. /west from outlet center of (SOPC). 2 23851 25 m. / east from outlet center of (SOPC). 3 10412 50 m. /west from outlet center of (SOPC). 4 9009 50 m. / east from outlet center of (SOPC). 5 8561 75 m. /west from outlet center of (SOPC). 6 6914 75 m. /east from outlet center of (SOPC). 7 8146 100 m. /west from outlet center of (SOPC). 8 5726 100 m. /east from outlet center of (SOPC). 9
m: meter
Fig.3: Histogram representing oil content (ng/L) extracted from sampling stations along the drainage basin. Nevertheless, these data suggest that the level of petroleum hydrocarbons is higher than the level fixed by meteorology and Environmental Protection Administration, (MEPA, 1982). It is generally stated that water could be considered polluted when the hydrocarbon concentration is higher than 2.0 ug/L (Keizer, 1973); petroleum products are major pollutants responsible for ecological damage in surface water. The lethal effect of oil concentration occurs in the range (1-10 mg/L), while sublethal effect occurs at very low concentrations (0.1-

Curr. Sci. Int., 4(1): 27-44, 2015
32
1.0 mg/L). Among the sublethal effects of oil contents are extremely toxic to phytoplankton especially in bay area where concentration of both oil phytoplanktons tends to accumulate, (Hanan, 2007) Gas chromatography Analysis
Gas chromatography Fingerprinting:
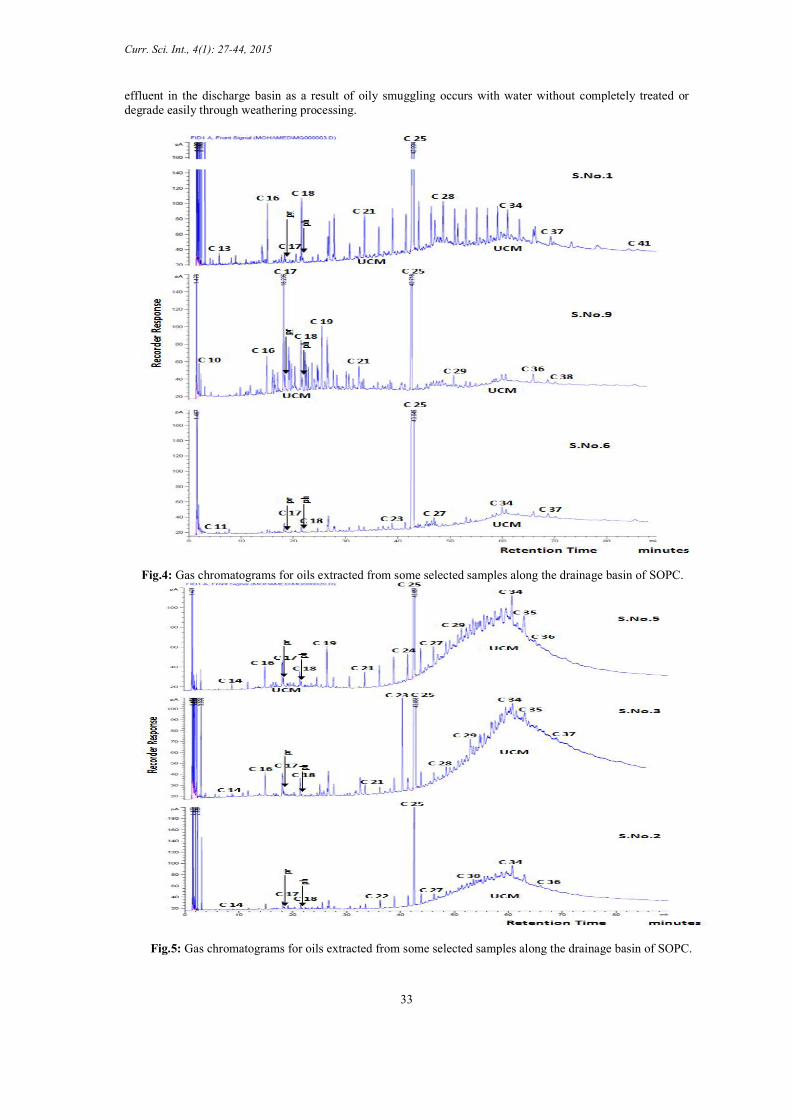
The gas chromatograms of oils extracted from water samples Figures 4 & 5 can be classified into two main groups with two profiles. The first group is characterized by a pattern similar to slightly weathered crude oil profile. The primary feature for this group reperesented by samples (1,9 & 6) Figure 4 is the presence of a homologous series of abundant n-alkane peaks starting from nC10 or nC12 up to nC38 or nC41. These n-paraffins are standing out at equal distances above a relatively moderate hump of unresolved complexes mixture (UCM). Furthermore, samples (1&9) display a bimodal n-alkane distribution significant for mixed crudes. The second profile displayed by samples (5, 3& 2) Figure 5 show more weathered crude oil profile with a bundant n-alkane peaks specially in the range nC14 up to nC38. It is noted that large envelop of unresolved complexes mixture (UCM) is the major chromatografhic future for this group.
Occurrence and distributions of n-alkanes in the discharge basin of SOPC n-alkanes:
Concentrations of total n-alkanes vary between 10.236 and 94.838 ng/L Table 3, nC10 and nC37 to nC41 alkanes in some samples were the most abundant and dominant n-alkanes other prominent ones were nC18, C21, nC25, nC26, nC27 and nC29. In general, the heavier n-alkanes prevailed, in concentration and abundance, over the lighter ones and, although not very clear, odd n-alkanes were slightly dominant over even n-alkanes. Distribution profiles of these compounds have been shown in Figures 4&5. The lighter n-alkanes were distributed more evenly discharge basin, particularly nC12, nC14, nC15, nC16 and nC18 showed less variation respectively, in the surface water of discharge basin whereas the heavier, n-alkanes presented a more odd distribution. It is noteworthy that high concentrations of nC34 in the waters in comparison to other chain lengths suggest that the impact is primarily due to The deliberate drainage of oil related activities and oily smuggling from the industrial processing cause's continuous inputs and large cumulative loading on discharge basin water. On the other hand, nC15, nC16, nC19 to nC21 n-alkenes is associated with aquatic algae sources, plankton and photosynthetic bacteria (Samuel, et al., 2012) and nC31 to related grasses (Cranwell, 1973). Although less abundant, contributions from nC17, nC27, nC29 and nC31 alkanes were noted and possibly arose from waxes of higher plants (Meyers, 2003), nC23, nC25 probably from floating and submerged plants (Cranwell, 1984; Ficken, et al., 2000) and nC18 from indigenous sources, such as bacterial degradation of algae and detritus (Juan, et al., 2013; Ekpo, et al., 2005).
The relatively low pristine /phytane: values.
Range from n.d. to 1.8837 Table 3, with average 1.0165 also suggests that the n-alkanes were mainly from petroleum. Pristane (Pr) and phytane (Ph) are generally present in crude oil, and they are often considered as good indicators of petroleum contamination (Samuel, et al., 2012). The ratios of Pr/C17 ranged between n.d. and 0.8406, Ph/C18 ranged from n.d. up to 0.9459 in the surface waters and mean values 0.3056 and 0.2895, respectively and this indicates the incorporation of fossil hydrocarbons. Moreover, according to Didyk, et al., (1978) high level of phytane could also be explained by microbial activities in a reducing condition. An approach by Mille, et al. (2007) was employed to roughly determine the natural n-alkane proportions. The approach is based on an assumption that even numbered n-alkanes in the range C19 to C33 in most cases come from petroleum with no significant odd– even predominance (CPI is close to unit). UCM:
In addition to the chromatographically resolved compounds, an unresolved complex mixture (UCM) of hydrocarbons is present in most samples Figure 3, in the range nC25 to nC35. However, in some samples, it appears as a bimodal hump in the range nC17 to nC25 and nC29 to nC35. The UCM is generally considered as a mixture of many structurally complex isomers and homologs of branched and cyclic hydrocarbons that cannot be resolved by capillary columns (Bouloubassi, et al., 2001; Gough, et al., 1990). Further, the presence of the UCM in the aliphatic fraction is considered as the most important indicator of petrogenic pollution by weathered or degraded petroleum residues from petroleum refinery process in SOPC when the maximum height occurs mainly in the higher molecular weight. Yet, it has also been linked to bacterial degradation of natural organic inputs (algal detritus) (Gough, et al., 1990). The UCM concentrations vary from n.d. to 88.340 % ng/L Table 3. The ratio of the unresolved to resolved components (U/R) has been calculated for most samples. Usually U/R > 4 is used as a criterion for the presence of important petroleum residues (Mazurek, et al., 1984; Michelle, et al., 2014). In this study, S.NO.2 shows U/R > 4, (S.NO.4, S.NO. 5, & S.NO. 8); these results can be explained that hydrocarbons were dissolved and dispersed on surface waters from a variety of processing sources, an industrial
Curr. Sci. Int., 4(1): 27-44, 2015
33
effluent in the discharge basin as a result of oily smuggling occurs with water without completely treated or degrade easily through weathering processing.
Fig.4: Gas chromatograms for oils extracted from some selected samples along the drainage basin of SOPC.
Fig.5: Gas chromatograms for oils extracted from some selected samples along the drainage basin of SOPC.

Curr. Sci. Int., 4(1): 27-44, 2015
34
The Carbon Preference Index: The carbon preference index (CPI) which could be obtained from the n-alkane distributions is a
parameter that has been widely used as source indicator of n-alkanes (Simoneit, et al., 1989) in discharge basin of SOPC. CPI values of n-alkanes derived from land plant epicuticular waxes range from 4 to 10 (Cranwell, 1984) while those from petroleum and other anthropogenic activities such as combustion of fossil fuel, wood and agricultural debris have values close to 1 (Wakeham, 1996). The CPI (nC14– nC 20) Table 3 values calculated from n-alkane distributions in the studied samples ranged from n.d. to 2.6625. Majority of the samples has values less than 1 or between 1 and 3, suggesting n-alkanes of mixed origin (Michelle, et al., 2014). Similarly, both CPI (nC20- nC24) and (nC26– nC35) values were between 0.5073-1.3855 and 0.6602-1.4425 respectively. Generally, all CPI values for the discharge basin show the predominance of petrogenic sources due to continuous discharged of the refinery’s effluents where oil input was detected based on the presence of a UCM, Figures 4&5. Total n.alkanes/ Total isoalkanes
This ratio is often used to indicate degree of biodegradations and weathering, because n-alkanes are more liable to be degraded compared with isoalkanes (Wang, et al., 1995). Data present in Table 3 show values ranged between 0.1140-18.374. Sample 7 exhibits the least value being relatively more biodegraded as a result of long exposure to different weathering factors. On the other hand, samples 1, 3, 5 & 6 have high values 3.8117; 5.625; 3.326 & 18.374 respectively as they are less biodegraded compared with the other samples. nC10-nC25 / nC17- nC25 ratio:
This ratio is used to indicate the addition of algal biosynthesized hydrocarbons and or degree of weathering (Wang, et al., 1995). Most of samples generally exhibits close values in the range of 1.002 to 1.05, this is means similar degree of weathering and no significant variation, on the other hand S.NO. 2 (1.1679) have slightly higher value due to the algal addition on the low molecular weight alkanes < nC17.
n C14– nC18/ Five iso alkanes in between:
This ratio of n-alkanes /five iso-alkanes is defined as the ratio of the sum of nC14-nC18 over the sum of farnesane, trimethyl C13, norpristane, pristane and phytane (Omayma, et al., 2014), this ratio is often used to indicate the degree of biodegradations weathering, because n-alkanes are more liable to be degraded compared to isoalkanes. Data in Table 3 reverse values between n.d. and 4.4402, S.NO.3 (2.4022), 4 (3.570), 8 (4.4402) & 9 (2.524) exhibits the high values as they are less weathered. On the contrary, samples 1 (0.2733) ; 2 (0.7373);5 (0.865) & 6 (0.6155) display the lowest values being highly weathered, as a result of long exposure to photo-oxidation, vaporization, dissolution and bio-degradation, (Maged, et al., 1999; Eman, 2013). Weathering ratio (WR):
Evaporations and dissolution effects are detected by calculating sum nC23 – nC34 / sum nC11– nC22, (Nazik, et al., 2014). Table 4; have variable values showing different degree of weathering ranged from 1.8094 up to 111.18. This can be confirmed by the low concentration of low molecular weight n-hydrocarbons, these variations indicate various industrial complexes of the petroleum Suez Company as a result of activities industrial processing and refinery’s effluents from different pollutants to the Company discharge basin. LMW/HMW:
Ratios of low molecular weight C15–C20 to high molecular weight C21–C34, n-alkanes have been used to determine the source of n-alkanes (Commendatore, et al., 2000) in surface waters of refinery’s effluents discharge basin of SOPC. The LMW/HMW ratios in the studied samples ranged from 0.0063 to 0.5460 Table 3. Ratios that are usually below 1 represent n-alkanes produced by higher plants, marine animals and aquatic bacteria while values close to 1 suggest n-alkanes mainly from petroleum and plankton sources. LMW/ HMW ratios >2 often indicate the presence of fresh oil in surface waters, (Saida, et al., 2011; Gokdeniz, et al., 2012). Some petroleum distillates have been reported to have the LMW/HMW values that are significantly smaller than 1 (Wang, et al., 2005). The n-alkane ratio C31/C19:
Has been employed in differentiating source inputs of n-alkanes in surface waters (Simoneit, et al., 1990). The ratio can serve as a measure of the relative proportions of allochthonous and autochthonous hydrocarbon inputs. The C31/C19 ratios >0.4 are thought to be diagnostic of non-marine sources (Moldowan, et al., 1985). The C31/C19 ratios in the studied samples are between n.d. - 3. 340 Table 3, indicating marine sources, as a results of petroleum company's takes water from Suez bay and mixed it with fresh water to utilize in washing the crude oil and different cooling purposes, some oily smuggling occurs for water. The oily water is

Curr. Sci. Int., 4(1): 27-44, 2015
35
characterized by that they contain a high proportion of the oil which is caused by refinery production units (Coking - distillation - oils), while sample 1 (15.576) exhibits ratios >0.4 Indicating non-marine sources.
Occurrence and distributions of PAHs in the discharge basin of SOPC Concentration of individual PAHs in surface waters comparable with other locations around the world:
Report presents results from analyses of parent PAHs in discharge basin of SOPC. The concentration ranges of individual and total PAHs in waters are shown in Figure 6. The total PAH concentrations ranged from 64.791to 2338412.8 ng/L in waters with mean value of 322442.63 ng/L. The highest concentration of surface water was observed at station 7(2338412.8 ng/L), which is situated at 75 m. /east from outlet center of (SOPC). With increasingly intense industrial process inside SOPC, the amount of PAHs detected there is obviously related to direct discharge waste effluents to the discharge basin beside, it's nearby from the Nasr Petroleum Company (NPC) from the east side. Similarly, high concentrations 12219.385 ng/L was also found at 50 m. /west from outlet center of (SOPC), hence, there were many non-point sources along discharge basin, contributing to the very high concentrations of PAHs detected. The level of poly-aromatic hydrocarbons in the waters at all the stations are found to vary widely depending on sites with the west coast of discharge basin recorded higher values than the east coast ones, this is consistent with the direction of the water currents and winds from the west to the east side's within the basin. Generally, in this study, there are three areas with different degrees of impact were identified within the basin first, the eastern area with a relatively high hydrocarbons impact probably associated with discharging waste effluents from Nasr Petroleum Company (NPC),which situated at the east side of SOPC second, the central area where PAHs have accumulated due to intense industrial process and third, the western area where the direction of wind and current circulation may have favored PAHs accumulation and comparable to that found in other locations around the world National comparison revealed, elevated PAH concentrations in the Suez Gulf, Cairo, Egypt, 1640-39139.2 ng/L summer and 731.7-21937.3 ng/L winter by Mostafa, et al. (2014); Alexandria Sea Coasts, Egypt 52811-559096 ng/L by Nazik, et al., (2013); Mumbai Harbour Line, India 8660–46740 ng/L by Dhananjayan, et al. (2012); the Gulf of Suez, Cairo, Egypt 15392 - 66718 ng/L winter and 3115 -252786 ng/L summer by Mohamed, (2012); the Northern Spanish 190–28800 ng/L by Gonz´alez, et al. (2006); the Daya Bay, China 4228–29320 ng/L by Zhou, et al., (2003); the Jiulong River Estuary, western Xiamen Sea ,China 6960-26.920 ng/L by Maskaoui, et al., (2002); in the Seawater around England and Wales<1-24824 ng/L by Law, et al. (1997). This comparison also showed higher concentrations of PAHs compared with those found in Todos os Santos Bay, Brazil 0.0029 to 0.1079 ng/L by Joil, et al. (2012); Western Taiwan Strait, China 12.3–58 ng/L by Wu, et al. (2011); Chesapeake Bay, USA 20–65.7 ng/L by Gustafson, et al., (1997); Deep Bay, China 24.7–69 ng/L, Qiu, et al., (2009); Gulf of Trieste, Northern Adriatic, 78-302 ng/L by Ludvik, (2010); Saronikos Gulf, Greece 425–459 ng/L by (Valavanidis, et al., 2008); Baltic Sea 300-594 ng/L by Maldonado, et al., (1999) and in Western Xiamen Sea, China 106–945ng/L, by Zhou, et al., (2000). PAH compound Profiles and origins Source apportionment of PAHs
Recognition of PAH sources is necessary for control of their input and for allocating responsibility for remedial activities. A number of studies have demonstrated the practicability of using PAH isomeric ratios in source apportionment (Essam, et al., 2013). In the present study, the ratios of low molecular weight PAHs (LMW) to high molecular weight PAHs (HMW), Ant/Ant+Phe and Flu /Pyr + Flu were used to identify the PAH sources. The majority of PAHs in surface waters originate from pyrogenic or petrogenic sources. Pyrolytic PAHs are produced during incomplete combustion of carbon, wood and fossil fuels and they are characterized by compounds with four or more aromatic rings. In contrast, petrogenic PAHs contain only two or three aromatic rings (Xinran, et al., 2014). Therefore, the ratio of LMW to HMW has been used to distinguish pyrogenic (<1) and petrogenic (>1) sources. Figure 7 & Table 4, shows the ratios of LMW/HMW, which were <1 at 4 monitoring sites, indicating that the PAHs in discharge basin originated mainly from pyrogenic sources. The LMW/HMW ratios at sites 3(38.033), 4(1.0563), 5(9084.1), 7(14.57) and 9(1.924) were >1, indicating that petrogenic sources could occasionally contribute to PAH contamination in this area. On the other hand, a ratio (Ant/Ant+Phe) <0.1 indicates a petrogenic source as most of samples Table 6, while the ratio (Flu /Pyr + Flu) differentiates between petroleum, wood, coal and plants combustion. When Flu/Pyr+Flu <0.5, it is generally associated with petrogenic source as a characteristic of fuel combustion (gasoline, diesel and crude oil), while when this ratio exceeds 0.5 as recorded at samples 1(0.999), 4(1.0), 8(1.0), 9(1.0) which characterized pyrolytic sources (kerosene, wood, terrestrial plants and coal combustion. Beside, values of IP/IP + BP <0.20 indicate petroleum, 0.20–0.50 indicate petroleum combustion, and >0.50 indicate the combustion of coal, grasses and wood. In the discharge basin waters, polycyclic aromatic hydrocarbons are both numerous and of various origins. We can thus consider the refinery rejection effluents as a significant pyrolytic source due to the oil combustion, refining and incinerating operations involved. At the sites located close to the refinery’s rejection area, pyrolytic hydrocarbon appears to be the primary PAH source, whilst the contribution of petroleum was

Curr. Sci. Int., 4(1): 27-44, 2015
36
confirmed at site 7(0.244) and the high pyrolytic input at the rest of sites may reveal other sources. We therefore suggest mixed origins in the discharge basin waters. Table 3: Aliphatic hydrocarbon (AH) concentrations (ng/L) in sampling stations along the drainage basin of (SOPC) Station AH
1 2 3 4 5 6 7 8 9
nC10 N.D. N.D. 0.0126 N.D. N.D. N.D. 0.0142 0.0296 0.4152
nC11 N.D. N.D. 0.8586 0.0270 0.0319 0.0121 N.D. 0.0349 0.2920
nC12 0.0959 0.5995 0.0132 0.0084 0.0477 0.0109 0.0093 0.0908 0.2920 nC13 0.1324 N.D. 0.0158 N.D. N.D. 0.0202 N.D. N.D. N.D. nC14 0.1051 0.0145 0.0190 N.D. 0.0291 N.D. N.D. N.D. 0.2179 nC15 0.1501 N.D. 0.0117 0.0451 0.1314 0.259 N.D. 0.0455 0.1564 nC16 0.9717 0.1197 0.1713 N.D. 0.1311 0.0621 N.D. N.D. 1.1200 nC17 0.2361 0.0297 0.3085 0.3597 0.0184 0.1590 N.D. 0.3551 9.1121 Pristane 0.0973 0.2405 0.9658 0.1988 0.2877 0.0378 N.D. 0.2986 0.5112 nC18 1.1281 0.1116 0.1536 0.0992 0.1044 0.1184 N.D. 0.0957 1.8409 Phytane 0.1596 0.2069 0.5083 0.1986 0.2445 0.0495 N.D. 0.2024 0.4745 nC19 0.0521 0.1774 0.0322 0.0961 0.2999 0.1352 0.0355 0.0415 2.5158 nC20 0.8128 0.0753 0.1067 0.1145 0.0865 0.1218 N.D. 0.1555 1.2473 nC21 0.8819 0.1208 0.0898 0.762 0.1168 0.738 N.D. 0.0787 0.6500 nC22 0.5989 0.2179 0.0640 0.0460 0.1565 0.0597 0.0486 0.0481 0.2456 nC23 0.9711 0.3024 0.1423 0.0745 0.2128 0.1576 N.D. 0.0775 0.2437 nC24 1.0388 0.2997 0.1604 0.0973 0.2333 0.2133 N.D. 0.0797 0.2687 nC25 31.848 3.0365 23.015 6.9593 7.1026 71.343 9.1384 7.0225 27.974 nC26 1.1025 0.2789 0.1587 0.1074 0.2134 0.0904 N.D. 0.1054 0.2013 nC27 0.9023 0.2055 0.0801 0.0596 0.1738 0.687 0.0542 0.1358 0.1310 nC28 0.9125 0.1788 0.1110 0.0844 0.1547 0.0702 N.D. 0.4699 0.2716 nC29 0.9140 0.1242 0.1332 0.1433 0.0971 0.0624 N.D. 0.1386 0.5270 nC30 0.8685 0.1004 0.4044 0.4926 0.2120 N.D. N.D. 0.1320 0.1787 nC31 0.8115 0.0920 0.0805 0.1963 0.0427 0.0353 0.0396 0.2793 N.D. nC32 0.9415 0.3101 0.0924 0.3530 0.1542 0.0365 N.D. 0.3793 N.D. nC33 0.9222 0.2920 0.5171 0.6710 0.2031 0.0960 N.D. 0.3962 0.1616 nC34 0.9196 0.6516 0.2761 0.7699 0.3952 0.1331 0.0650 0.1036 N.D. nC35 0.6752 0.5462 0.1967 0.3032 0.3719 N.D. N.D. 0.0415 0.0807 nC36 0.4022 0.0345 0.0747 0.0963 0.0273 0.3176 N.D. N.D. 0.3088 nC37 0.4476 N.D. 0.0094 0.0543 N.D. 0.2076 N.D. N.D. 0.1687 nC38 0.3752 N.D. N.D. N.D. N.D. N.D. N.D. N.D. N.D. nC39 0.4687 N.D. N.D. N.D. N.D. N.D. N.D. N.D. N.D.
nC40 0.1767 N.D. N.D. N.D. N.D. N.D. N.D. N.D. N.D. nC41 0.3857 N.D. N.D. N.D. N.D. N.D. N.D. N.D. N.D. Pr /nC17 0.2471 0.2161 1.009 0.0971 0.8406 0.1845 N.D. 0.1180 0.0377 Ph /nC18 0.0855 0.9459 0.1057 0.3519 0.3214 0.3249 N.D. 0.2968 0.1732 Pr/Ph 0.6099 1.1627 1.8837 1.001 1.1765 0.7626 N.D. 1.475 1.0773 UCM% 39.538 88.340 68.052 82.433 86.275 22.363 N.D. 85.963 32.821 UCM/R 0.654 7.574 2.130 4.629 6.286 0.288 0.092 6.124 0.489 CPI
nC14-nC20 0.1455 0.6447 0.7821 2.3446 1.0253 1.0587 N.D. 1.7597 2.6625 nC20-nC24 0.7562 0.7160 0.7009 0.5846 0.6920 0.5860 1.3855 0.5514 0.5073 nC26-nC35 0.8970 0.8289 0.6602 0.8098 0.7680 0.7947 1.4425 0.8740 0.7868
Tn. alkanes 83.161 67.901 84.906 65.033 77.652 94.838 10.236 73.643 73.812
Tn.alk./T.iso 3.8117 2.1153 5.625 1.8598 3.326 18.374 0.1140 2.794 2.818 nC10-nC25/nC17-n C25 1.0387 1.1679 1.0455 1.0102 1.0303 1.002 1.0026 1.0252 1.0531 n C14– nC18/ Five iso. 0.2733 0.7373 2.4022 3.570 0.865 0.6155 N.D. 4.4402 2.524 WR 8.1578 4.3585 13.743 6.0608 9.2459 111.18 86.383 9.7558 1.8094 LMW/HMW 0.0849 0.1793 0.0677 0.1452 0.0835 0.0072 0.0063 0.0932 0.5460 nC31/ nC19 15.576 0.078 2.500 2.043 0.142 0.261 1.115 3.340 N.D. AH: Aliphatic hydrocarbon; pr: pritane, ph: phytane; nC17/Pr: normal alkanes of nC17 over pristine; nC18/Ph: normal alkanes of nC18 over phytane; Pr/Ph: pristane (Pr) over phytane (Ph);UCM: Unresolved complex mixture; UCM/R:Unresolved complex mixture over resolved aliphatic hydrocarbon concentration ratio, CPI: Carbon preference index; T.n-alk: total resolved n-alkanes from nC11 to nC41; Tn.alk./ Tiso.alk.: Total normal alkanes /Total iso alkanes; nC10-nC25/ nC17- nC25: normal alkanes from nC10-nC25 over normal alkanes from nC17- nC25; nC14–nC18 / Five iso.: normal alkanes from nC14 to nC18 over five isoprenoid in between; WR: weathering ratio = (sum nC23 – nC34 /sum nC11– nC22); LMW/HMW: the ratios of low molecular weight (LMW, sum of n-C10 to n-C20) to high molecular weight (HMW, sum of n-C21 to n-C34); (Samuel, et al., 2012), N.D.: Under the limit of detection.

Curr. Sci. Int., 4(1): 27-44, 2015
37
Fig.6: Histogram representing Average Concentration of Σ PAHs (ng/L) in the oil extracted from the drainage basin waters.
Fig. 7: The total of LMW, HMW and Ʃ PAHs concentrations (ng/L) in the drainage basin waters
Composition of PAHs:
The composition pattern of PAHs by ring size in surface water samples from the discharge basin are shown in Figure 8, Table 4. The percentage compositions of PAHs were varied much from one sampling site to another, indicating different PAH sources over the whole area. At most of the stations along the drainage basin, the high-molecular-weight PAHs of four rings (FIu, Pyr, BaA, and Chr), five rings (BbF, BkF, BaP, and DahA and six rings (IP, BP) generally account for 0.006 - 96.134%, <1-8.812, and 0.021- 52.077% of the total PAH concentrations, respectively. However, the lower-molecular-weight PAHs of 2-3 rings (Nap, A, Ace, Flu, Phe, and Ant) were the most abundant components in water samples of drainage basin, with a range between <1 and 99.989% followed, by HMW-PAHs (4–ring) 96.134%, which are likely derived from anthropogenic activities (Essam, et al., 2013), associated with direct discharge waste effluents to the drainage basin from SOPC. Both

Curr. Sci. Int., 4(1): 27-44, 2015
38
the higher molecular compounds (4-ring PAHs) and lower molecular compounds (2-3 ring PAHs) were representative of the total PAH compounds in the drainage basin of SOPC.
Fig. 8: Histogram represents the distribution of PAHs (ng/L) along the drainage basin of (SOPC) according to the number of aromatic rings%.
Table 4: Aromatic hydrocarbons in sampling stations along the drainage basin of (SOPC) measured by HPLC (ng/L)
<1: Below the detection limit, Concentration: ng/L.
U V studies:
The UV Spectra for oil extracted from the sea water are represented in Fig. 9 they show distinguished bands around 205, 215, 228, 248, 256, 274, 278nm. Four absorption bands ratio (Abd-el Rahman, et al., 2001) were
Station Compunds
1 2 3 4 5 6 7 8 9
2-3 Ring PAHs (Nap) <1 <1 <1 1315.012 <1 <1 <1 12472.511 <1 (A) <1 <1 2320.583 <1 <1 <1 <1 <1 <1
(Ace) 52065.98 <1 <1 9590.664 91549.471 <1 2188032.5 <1 5685.001 (Phe) <1 <1 <1 176.554 <1 <1 <1 <1 158.153
(F) <1 <1 <1 591.981 <1 <1 <1 <1 <1 (Ant) <1 <1 <1 <1 <1 <1 212.094 <1 <1
Total 2-3 Ring 52065.98 <1 2320.583 11674.211 91549.471 <1 2188244.5 12472.511 5843.154 4-Ring PAHs (Flu) 71970.527 <1 <1 441.831 <1 <1 <1 311451.3 <1
(pyr) 82.675 <1 <1 <1 <1 <1 <1 <1 2922.157 (BaA) 3.193 132.6 1.744 6.137 5.049 3.135 148030.22 1.486 <1 (Chr) <1 <1 <1 <1 <1 <1 <1 <1 <1
Total 4-Ring 72056.395 132.6 1.744 447.968 5.049 3.135 148030.22 311452.78 2922.157 5-Ring PAHs (BbF) <1 29.874 4.206 14.599 <1 <1 52.113 7.859 14.467
(BkF) <1 <1 <1 <1 <1 <1 708.38 <1 <1 (Bap) <1 <1 <1 <1 <1 <1 <1 <1 <1
(DahA) <1 <1 <1 <1 <1 <1 881.416 <1 <1 Total 5-Ring <1 29.874 4.206 14.599 <1 <1 1641.909 7.859 14.467 6-Ring PAHs (BP) <1 <1 <1 <1 <1 <1 370.710 <1 <1
(IP) 25.664 176.557 55.065 82.61 5.029 61.656 119.451 44.743 100.995 Total 6-Ring 25.664 176.557 55.065 82.61 5.029 61.656 490.161 44.743 100.995 Total PAH 124148.039 339.031 2381.598 12219.385 91559.549 64.791 2338412.8 323977. 84 8880.771 Ant/Ant+phe <1 <1 <1 <1 <1 <1 1 <1 <1 Flu/Flu+Pyr 0.999 <1 <1 1 <1 <1 <1 1 1
BaA/BaA+Chr 1 1 1 1 1 1 1 1 <1 IP/IP+BP 1 1 1 1 1 1 0.244 1 1 ƩLMW 52065.98 0.0 2320.583 11674.21 91549.47 0.0 2188244.0 12472.51 5843.154 ƩHMW 72082.05 339.031 61.015 11052.17 10.078 64.791 150186.3 311505.3 3037.617 ƩLMW/ ƩHMW 0.722 0.0 38.033 1.0563 9084.1 0.0 14.57 0.040 1.924 2-3 Ring % 41.939 <1 97.438 95.5538 99.989 <1 93.578 3.850 65.796 4-Ring% 58.04 39.111 0.073 36.663 0.006 4.866 6.330 96.134 32.904 5-Ring% <1 8.812 0.177 0.119 <1 <1 0.07 0.002 0.014 6-Ring % 0.021 52.077 2.312 6.764 0.005 0.952 0.021 0.163 1.137

Curr. Sci. Int., 4(1): 27-44, 2015
39
calculated from the UV spectra and represented in Table 5. The first ratio 205/215 have low values ranging between 0.985 and 1.159, the relatively low values for this ratio maybe due to the fact that by weathering low molecular weight aromatic hydrocarbons such as benzene, xylenes have been seriously affected through vaporization. Good agreement between studied samples indicates a close concentration values for these aromatics. The second ratio 228/256 has been taken as a good parameter for petroleum inputs and is constant for particular oil regardless of aging of the spread oil or its concentration. Good agreement between studied samples indicates a close concentration values for these aromatics. The second ratio 228/256 has been taken as a good parameter for petroleum inputs and is constant for particular oil regardless of aging of the spread oil or its concentration (Omayma, et al., 2014), data in Table. 5 show that most of samples exhibit values ranging between 0.889 and 0.977 indicating probably the same oil origin. On the other hand, samples number 9 (0.915) & 2(0.921) can be correlated with each other and probably from the same oil source, Table. 5 demonstration that the majority of the studied samples have close values for the ratio 248/267 which vary from 0.787 up to 0.968. Careful examination of data in this ratio illustrates those samples 4 (0.824) can be matched with sample 5(0.815). Finally, the ratio 248/278 exhibit values varying from 0.732up to 0.842, the general agreement between oil pollutants indicates that the surface waters are probably contaminated with aromatic components from little oil origin, as a result of the deliberate drainage of oil related activities and oily smuggling from the industrial processing cause's continuous inputs and large cumulative loading on the discharge basin waters, without completely treated or degraded easily through weathering process.
Fig.9: UV absorption spectra for oils extracted from water samples along the drainage basin of SOPC.
Table 5: Calculated UV absorption ratios for oil extracted from surface water along Suez Company drainage basin.
S.NO. Location A 205/ A 215
A 228/ A 256
A 248/ A 267
A 248/ A 278
1 Outlet center of (SOPC). 1.055 0.889 0.869 0.791 2 25 m. /west from outlet center of (SOPC). 1.016 0.921 0.919 0.827 3 25 m. / east from outlet center of (SOPC). 1.103 0.841 0.842 0.732 4 50 m. /west from outlet center of (SOPC). 1.077 0.907 0.824 0.748 5 50 m. / east from outlet center of (SOPC). 1.159 0.878 0.815 0.740
6 75 m. /west from outlet center of (SOPC). 0.997 0.977 0.940 0.765 7 75 m. / east from outlet center of (SOPC). 1.077 1.037 0.787 0.842 8 100 m. /west from outlet center of (S OPC). 1.059 0.300 0.968 0.764 9 100 m. /east from outlet center of (SOPC). 0.985 0.915 0.895 0.798
A: Absorbance
FT-IR Spectral Analysis:
IR spectra of tested surface sea waters along the drainage basin of SOPC were demonstrated in Table 6 and Figure 10. Inspection of these spectra reveals the presence of the following two peaks at wave no. 2924 cm-1

Curr. Sci. Int., 4(1): 27-44, 2015
40
and 2854 cm-1 represent – CH3 and – CH2- stretching frequencies (Yanan, 2010); two peaks at wave no. 1461 cm-1 and 1376 cm-1 represent – CH3 and – CH2- pending frequencies (Omayma, et al., 2014); beside three peaks at wave no.1273 cm-1, 1123 cm-1 and 1072 cm-1 represent carboxylic acids; two strong broad bands of tri-fluoromethyl (flouroalkanes) and C-X ordinary fluoroalkanes, (Keroly, et al., 2013), Finally sharp peak at 723 cm-1 for aliphatic hydrocarbons of chains containing carbon atoms equal or greater than seven, (Jianfeng, et al., 2008). These data indicates that the refinery’s effluents related by oily smuggling with water to the discharge basin has paraffinic nature.
Table 6: Infrared signals and assignments of the oil extracted from the discharge of surface waters
Assignments of Chemical groups Wave number Cm-1 CH3 stretching. 2924 CH2 stretching. 2854 CH3 bending. 1461 CH2 bending. 1376 Carboxylic acids. 1273 Two strong broad bands of tri-fluoromethyl (flouroalkanes). 1123 C-X Ordinary fluoroalkanes. 1072 Aliphatic hydrocarbons of chains containing carbon atoms ≥7. 723
Fig.10: FT-IR absorption spectra for oils extracted from some selected water samples as an example of FT-IR analysis

Curr. Sci. Int., 4(1): 27-44, 2015
41
Conclusion and Recommendations:
Concentrations of oil content of aliphatic hydrocarbons vary widely from 5726 to 45825 ng/L depending on sites with the west coast of discharge basin recorded higher value than the east coast ones, this is much to do with the state of development and the effect of the current direction of wind in the discharge basin of SOPC, whilst the total PAH concentrations ranged from 64.791 to 2338412.8 ng/L. In this study, three situations with different degrees of impact were identified within the basin, first the eastern side, with a high hydrocarbons in some sites impact probably associated with discharging waste effluents from Nasr Company and the direction of the current circulation within the basin, second the central, where PAHs have accumulated due to the intense of industrial process and third the western side, where direction of the current circulation may have favored PAHs accumulation. In comparison with other studies dealing that these results above the range reported for areas considered as mildly polluted. The treatment plant cannot process in the company anymore, which is directly (untreated) discharged into the Suez Gulf. The PAH composition patterns in surface waters suggest the dominance of high molecular weight compounds and indicate important pyrolytic and petrogenic sources. PAH concentrations detected along the discharge basin of (SOPC) were sufficiently high to pose a risk to the Suez Gulf if they are exposed continuously to this concentration. Hence, continuous monitoring of the discharge basin is highly warranted. Spectroscopic UV and FT-IR visible reveal a significant contamination by aliphatic and aromatic hydrocarbons with few oil origins. Petroleum refining is an important industry for SOPC and production activities in the region, the company processes various kinds of crude oils and producing the following finished oil products: fuel gas, propane, butane, gasoline, jet fuel, and kerosene and gas oil, the wastewater was discharged to the drainage basin. Because of the Suez Gulf is used in many areas as a recipient for wastewater from different sources, this study recommended that pollution control for wastewater disposing into it should be improved. Threats of oil contamination in the sea and the coastal area as a result of the petroleum related activities and the usage of petroleum and petroleum products is very serious since this could cause irreparable damage to the marine ecosystem there by affecting the socio-economic status of the population who depend on coastal resources for their likelihood.
References Abd El Rahman, M., A. F. Nazik, M. S. Maged, E. A. Omyma, 2001. State of Petroleum pollution in the south
eastern Mediterranean Sea, Port Said coastal waters. Egypt J. Petrol., 10 (2): 1-14. Abd-el Rahman, M., A. F. Nazik, M. S. Maged, E. A. Omayma, 2012. Contamination of water on Alexandria
seashore, 15th International Conference on petroleum Mineral Resources and Development 8-April,Cairo,Egypt.
AWAD, H., 1988. Potential and causes of accidental oil spills in the Red Sea and Gulf of Aden: 1974-1986, a review, Bulletin of the National Institute of Oceanography & Fisheries, Egypt, 14, (1): 293-296.
AWAD, H., 1990. Hydrocarbon content in Red Sea surface waters and fishes in the region between Jeddah and Yanbu, Saudi Arabia. In Proceedings of the First Conference on Environmental Sciences, 27-31 January 1990, Sabha, Lybia, (In Arabic, English abstract).
Badawy, M. I., I. S. AL-Mujaing, M. d. Hernandez, 1993. Petroleum –derived Hydrocarbons in water, sediment and biota from the Mina al fahal Coastal waters. Mar. Pull., 26: 457-460.
Bouloubassi, I., J. Fillaux, A. Saliot, 2001. Hydrocarbons in Surface Sediment from the Changjiang (Yangtze River) Estuary, East China Sea. Marine Pollution Bulletin, 42, 12: 1335-1346.
Commentator, M., J. Esteves, J. Colombo, 2000. Hydrocarbons in coastal sediments of Patagonia, Argentina, levels and probable sources. Mar. Pollut. Bull., 40: 989–98.
Cranwell, P.A., 1973. Chain-length distribution of n-alkanes from lake sediments in relation to post-glacial environmental change. Fresh water Biol., 3: 259–265.
Cranwell, P.A., 1984. Lipid geochemistry of sediments from Upton Broad, a small productive lake, Org. Geochem, 7: 25–37.
Dhananjayan, V., S. Muralidharan, R. P. Vinny, 2012. Occurrence and Distribution of Polycyclic Aromatic Hydrocarbons in water and Sediment Collected along the Harbour Line, Mumbai, India Hindawi Publishing Corporation. International Journal of Oceanography Volume Article ID 403615, 7 .
Didyk, B., B. Simoneit, S. Brassell, G. Eglinton, 1978. Organic geochemical indicators of palaeo environmental conditions of sedimentation. Nature, 272:216–22.
Ehrhardt, M., G. Petrick, 1989. Relative concentrations of dissolved/dispersed fossil fuel residues in Mediterranean surface waters as measured by UV fluorescence. Marine Pollution Bulletin, 20: 560.–565.
Ehrhardt, M.G., K.A. Burns, 1993. Hydrocarbons and related photo- oxidation products in Saudi Arabian Gulf coastal waters and hydrocarbons in underlying sediments and bio-indicator bivalves. Marine Pollution Bulletin, 27: 187-197.

Curr. Sci. Int., 4(1): 27-44, 2015
42
Ekpo, B.O., O.E. Oyo-Ita, H. Wehner, 2005. Even-n-alkane/alkene predominance's in surface sediments from the Collabra River, SE Niger Delta, and Nigeria. Naturwis-senschaften, 92: 341–346.
El Samra, M.I., H.I. Emara, F. Shunbo, 1986. Dissolved petroleum hydrocarbon in the northwestern Arabian Gulf. Marine Pollution Bulletin, 17, 2: 65-68.
El-Agroudy, N., Abd allah abd el-ghany 2001. Environmental studies on hydrocarbon materials in Suez Canal provide.
El-Moselhy, K. M., M. N. Gabal, 2004. Trace metals in water, sediments and marine organisms for the northern part of the Gulf of Suez, Red Sea. J. Mar. Syst., 46: 39–46.
El-Sabh, M. I., A. I., Beltagy, 1983. Hydrography and Chemistry of the Gulf of Suez during September 1966. Bull. Inst. Oceanogr. Fish ARE 9: 78–82.
Eman, M., 2013. Thesis submitted for MSC, Chemical studies on some selected water pollutants, Al-Azhar University, Cairo, Egypt.
Essam, N., Y. H., Lee, Z. Zuriati, S. Salmijah, 2013. Concentrations and Sources of Polycyclic Aromatic Hydrocarbons in the Seawater around Langkawi Island, Malaysia, Hindawi Publishing Corporation. Journal of Chemistry, 2013, ID 975781: 10
Ficken, K.J., B. Li, D.L. Swain, G. Eglinton, 2000. An n-alkane proxy for the Sedimentary input of submerged/floating freshwater aquatic macrophytes, Org. Geochem. 31: 745–749.
Fileman, T.w., R.J. Law, 1988. Hydrocarbon Concentrations in sediments and water from the English Channel. Mar. Pollut. Bull., 19: 390-393.
Gassmann, G., 1982. Detection of aliphatic hydrocarbons derived by recent “bio-conversion from fossil fuel oil in North Sea waters. Mar. Pollut. Bull., 13: 309–15
Gokdeniz, Nes_er, K. Aynur, U. Deniz, A. Oya, D. Enis , U. Esin, Filiz K., Y. Funda, 2012. Polycyclic aromatic and aliphatic hydrocarbons pollution at the coast of Aliag˘a (Turkey) ship recycling zone. Marine Pollution Bulletin, 64: 1055–1059
Gonz´alez, J., J. L. Vi˜nas, M. A. Franco, 2006. Spatial and temporal distribution of dissolved/dispersed aromatic hydrocarbons in seawater in the area affected by the Prestige oil spill. Marine Pollution Bulletin, 53, (5-7): 250–259.
Gough, M. A., S. J. Rowland, 1990. Characterization of Unresolved Complex Mixture of Hydrocarbons in Petroleum. Nature, 344, 12: 648-650.
Gustafson, K. E., R. M. Dickhut, 1997. Distribution of polycyclic aromatic hydro-carbons in Southern Chesapeake Bay surface water, evaluation of three methods for determining freely dissolved water concentrations. Environmental Toxicology and Chemistry, 16: 452–461.
Hanan, B. H., 2007. Thesis submitted for Ph.D., Assessment of pollution in the marine Environment in Suez Canal. Fac. Sci., Al-Azhar University.
Ip, 1993. Standards for Analysis and testing of petroleum and related products. Institute of petroleum. Jianfeng, L., H. Brynn, F. Stephen, 2008. Numerical methods for comparing fresh and weathered oils by their FTIR
spectra Analyst. Issue 8, 132: 792-800. Juan S., F. Sandro, F. Filipe, 2013. Use of biomarkers indices in a sediment core to evaluate potential pollution
sources in a subtropical reservoir in Brazil. Chemie der Erde, 73: 555– 563. Keizer, P., D. Gordon, 1973. Detection of Trace amounts of oil in Sea water by Fluorescence Spectroscopy. J. Fish
Resh. Bd. C an., 30: 1039-1045. Keroly, A. P., G. P. Colati, E. Dalmaschio, A. O. Castro, B. G. Gomesb, W. R. Vaz, 2013. Monitoring the
liquid/liquid extraction of naphthenic acids in Brazilian crude oil using electro spray ionization FT-ICR mass spectrometry (ESI FT-ICR MS). Fuel, 108: 647–655.
Law, R. J., V. J. Dawes, R. J. Woodhead, Matthiessen, 1997. Polycyclic aromatic hydrocarbons (PAH) in seawater around England and Wales. Marine Pollution Bulletin, 34, 5: 306–322.
Ludvik, p., 2010. MSC. Thesis entitled "polycyclic aromatic hydrocarbons in the seawater and sediment of the Gulf of Trieste. University of nova Goric a graduate school, Nova, Garcia.
Maged, M. S., E. A. Omyma, A. F. Nazik, M. Abd El Rahman, 1999. Hydrocarbon contamination in manzalah lake water. Egypt. J. petrol., 8 (1): 77-85.
Márcia, C. B., Z. L. Eliete, R. W. Rolf, 2003. Four-year survey of dissolved/dispersed petroleum hydrocarbons on surface waters of Admiralty Bay, King George Island-Antarctica Rev. Bras. Occanogr., 51(unico): 33-38.
Maskaoui, K., J. L. Zhou, H.S. Hong, Z.L. Zhang, 2002. Contamination by polycyclic aromatic hydrocarbons in the Jiulong river estuary and western Xianeb Sea, China, Environmental Pollution, 118: 109-122.
Mazurek, M. A., B. R. Simoneit, 1984. Characterization of Biogenic and Petroleum-Derived Organic Matter in Aerosols over Remote, Rural and Urban Areas In L. H. Keith, Ed., Identification and Analysis of Organic Pollutants in Air. Ann Arbor Science/ Butterworth, Boston: 353-370.
MEPA, 1982. Environmental Protection Standards Document. No. 1409 - 01, Metrology and Environment Protection Administration. Saudi Arabia, 17.
Meshal, A. H., 1970. Water pollution in Suez Bay. Bull. Inst. Oceanography, Fish ARE1, 463–473.

Curr. Sci. Int., 4(1): 27-44, 2015
43
Meyers, P. A., 2003. Applications of organic geochemistry to paleolimnological reconstructions a summary of examples from the Laurentian Great Lakes. Org. Geochem, 34: 261–289.
Michelle, A., A. B. Carlos, C.B. Mrcia, C. M. César, 2014. Sedimentary biomarkers along a contamination gradient in a human-impacted sub-estuary in Southern Brazil, A multi-parameter approach based on spatial and seasonal variability. Chemosphere, 103: 156–163.
Mille, G., L. Asia, M. Guiliano, L. Malleret, P. Doumenq, 2007. Hydrocarbons in coastal sediments from the Mediterranean Sea (Gulf of Fos area, France). Mar Pollut Bull, 54,566–75.
Mohamed Abd-EL-Hakem S., 2004. Thesis submitted for MSC, Studied on oil pollutants in some selected important Egyptian marine environment. Al-Azhar University.
Mohamed, I.A., 2012.Thesis submitted for MSC, Studied on water quality in selected area of Egypt.. Al- Azhar University.
Moldowan, J., W. Seifert, E. Gallegos, 1985. Relationship between petroleum composition and depositional environment of petroleum source rocks. AAPG Bull, 69: 1255–68.
Mostafa, M. E., A. F. Nazik, A. El. Enas, E. A. Omayma, M. K.Eman, 2014. Origin and Distribution of Polycyclic Aromatic Hydrocarbons (PAHs) in Surface Water of Suez Gulf, Egypt. J. Anal. Chem., 23: 54-73.
Nagla, M., 2006. Thesis submitted for Ph. D., Studied on Pollutants Contaminating Red Sea Marine Environmental with Special Emphasis to Aromatic Hydrocarbons. Al-Azhar University- Girls Branch.
Nazik, A. F., I. Mohamed, E. A. Omayma, S. Rabie, M. E. Mostafa, 2014. State of Petroleum Pollution in the Suez Gulf Coastal Waters, the 17th International Conference on Petroleum Mineral Resources and Development, Feb., 9 – 11.
Nazik, A. F., E. A. Omayma, M. Abd el-Rahman 2013. Contamination of water, Sediment, Tar ball and Fishes by Poly-aromatic Hydrocarbons (PAHs) in Alexandria Sea Coasts. Journal of Applied Sciences Research, 9(11): 5619-5632.
Omayma E. A., A. A. Nabila, A. M. Sawsan, M. D. Mamdouh, 2014. Environmental Assessment of Contamination by Petroleum Hydrocarbons in the Aquatic Species of Suez Gulf, ISSN, 2166-074 Florida, USA. International Journal of Modern Organic Chemistry, 3(1): 1-17.
Qiu, Y. W., G. G. Zhang, L. L. Liu, X. D. Guo, Li, O. Wai, 2009. Polycyclic aromatic hydrocarbons (PAHs) in the water column and sediment core of Deep Bay, South China. Estuarine, Coastal and Shelf Science, 83, 1: 60–66.
REMIP WORKING GROUPs 2(WG2), JICA and EEAA, 2008. State oil pollution and Management in Suez Gulf region: 15.
Saida, B., K. Soumaya, B. Ioanna, S. Alain, E. R. Hassan, 2011. Assessment of the Moroccan Mediterranean Coasts Contamination by Hydrocarbons (Non Aromatic Hydrocarbons, Aromatic Hydrocarbons and Linear Alkyl benzenes). International Journal of Geosciences, 2011, 2: 562-572.
Sameh, M. A., 2004. Petroleum Hydrocarbon Contamination of Ground water In Suez causes severe fire Risk. Hydrology Days.
Samuel, O. S., O. S. Oluwadayo, O. Ekundayo, Y. Z. Eddy, 2012. Assessing anthropogenic contamination in surface sediments of Niger Delta, Nigeria with fecal sterols and n-alkanes as indicators. Science of the Total Environment, 441, 89–96.
Sen-G., S. Z. Qasim, S. P. Fondekar, Topgi, 1980. Dissolved petroleum hydro-carbons in some regions. Pollut. Bull, 11: 65-68.
Shen, S. F., R. A. Mowery, V. A. Castleberry, G.P. van Walsum, C. K. Chambliss, 2006. High-performance liquid chromatography method for simultaneous determination of aliphatic acid, aromatic acid and neutral degradation products in biomass pretreatment hydrolysates, Journal of Chromatography A, 1104: 54–61.
Shereet, S.M., 2009. Pollution of petroleum hydrocarbon in the new Damietta harbor, Egypt. Emirates Journal for Engineering Research, 14 (1): 65-71
Simoneit, B. 1989. Organic matter of the troposphere, V. Application of molecular marker analysis to biogenic emissions into the troposphere for source reconciliation. J. Atmos Chem., 8: 251–75.
Simoneit, B., J. Cardoso, N. Robinson, 1990. An assessment of terrestrial higher molecular weight lipid compounds in aerosol particulate matter over the South Atlantic from about 30–70°S. Chemosphere, 21: 1285–301.
Soliman, G. F., 1996. Simulation of water circulation in the Suez Bay and its hydrographic features during winter and summer, The 6th Conf. of the Envi. Port. Is a must. Nat. Oceanography. And Fish, Euro-Arab Cooperation Center. Inter. Sci. Asso. and Soci. Fund for Development: 400–433
Sultans, A., A. Turkis, 1997. Petroleum Hydrocarbons in Saudi Red Sea Coastal Waters Marine Chemistry Department, Faculty of Marine Sciences, King Abdul-Aziz University, Jeddah, Saudi Arabia JKAU. Mar. Sci., 8: 83-89.
Suriyan, S., W. Gullaya, 1998. Petroleum Hydrocarbon Contamination in Seawater along the Western Coast of the Philippines, Department of Marine Science, Chulalongkorn University, Bangkok 10330, Thailand, Southeast Asian Fisheries Development Center.

Curr. Sci. Int., 4(1): 27-44, 2015
44
Tulloch, A., 1976. Chemistry of waxes of higher plants. In Kolattukudy PE, editor, Chemistry and biochemistry of natural waxes. Amsterdam Elsevier: 235–87.
Valavanidis, A., T. Vlachogianni, S. Triantafillaki, M. Dassenakis, F. Androutsos, M. Scoullos, 2008. Polycyclic aromatic hydrocarbons in surface seawater and in indigenous mussels (Mytilus galloprovincialis) from coastal areas of the Saronikos Gulf (Greece). Estuarine, Coastal and Shelf Science, 79, 4: 733–739
Wahby, S., K. El Deeb, 1980. A study of the state of pollution by petroleum hydrocarbons along the Alexandria Coast, Ves Journeys Etud Pollutions: 257-262.
Wakeham, S. 1996. Aliphatic and polycyclic aromatic hydrocarbons in Black Sea sediments. Mar. Chem., 53:187–205.
Wang, Z., M. Fingas, 2005. Oil and petroleum product fingerprinting analysis by gas chromatographic techniques. New York, CRC Press
Wang, Z., M. Fingas, G. Sergy, F. Marilda, M. H. Gisele, 1995. Persistent toxic substances in surface water of Todos Os Santos Bay, Brazil. Resources and Environment, 2012, 2(4): 141-149
Wu, Y. L., X. H. Wang, Y. Y. Li, H. S. Hong, 2011. Occurrence of polycyclic aromatic hydrocarbons (PAHs) in seawater from the Western Taiwan Strait, China. Marine Pollution Bulletin, 63, (5–12): 459–463.
Xinran, H., H. S. Yong, S. Xiaojuan, C. Binlin, F. Zhihua, M. Yuqin, 2014. Distribution, sources and ecological risk assessment of PAHs in surface sediments from Guan River Estuary, China. Marine Pollution Bulletin, 80: 52–58.
Yanan, X., 2010. Thesis submitted for MSC, Characterizations of dissolved organic carbon in prairie surface waters using Fourier transforms infrared spectroscopy, university of Saskatchewan Saskatoon.
Zhou, J. L, K. Maskaoui, 2003. Distribution of polycyclic aromatic hydrocarbons in water and surface sediments from Daya Bay, China. Environmental Pollution, 121, 2: 269–281,
Zhou, J. L., H. Hong, Z. Zhang, K. Maskaoui, W. Chen, 2000. Multi-phase distribution of organic micro pollutants in Xiamen Harbor, China. Water Research, 34, 7: 2132–2150.


![Large Scale Bioaugmentation of Municipal Waste Water ... · polycyclic aromatic hydrocarbons, heterocyclic compounds and aliphatic hydrocarbons [1-3]. Most of these compounds are](https://img.dokumen.tips/doc/110x75/6018160f877d3d5dda491687/large-scale-bioaugmentation-of-municipal-waste-water-polycyclic-aromatic-hydrocarbons.jpg)