Embed Size (px)
Citation preview
Polynuclear aromatic hydrocarbons in Port Valdez shrimp and sediment
January 26, 2015
Mark G. Carls, Larry Holland, Erik Pihl, Marilyn A. Zaleski, John Moran, and Stanley D. Rice
Memorandum of Understanding AKC-‐075.5
between
Prince William Sound Regional Citizens’ Advisory Council
and
Alaska Fisheries Science Center
The opinions expressed in this PWSRCAC Commissioned report are not necessarily those of PWSRCAC.
Polynuclear aromatic hydrocarbons in Port Valdez shrimp and sediment Mark G. Carls, Larry Holland, Erik Pihl, Marilyn A. Zaleski, John Moran, and Stanley D. Rice
Introduction
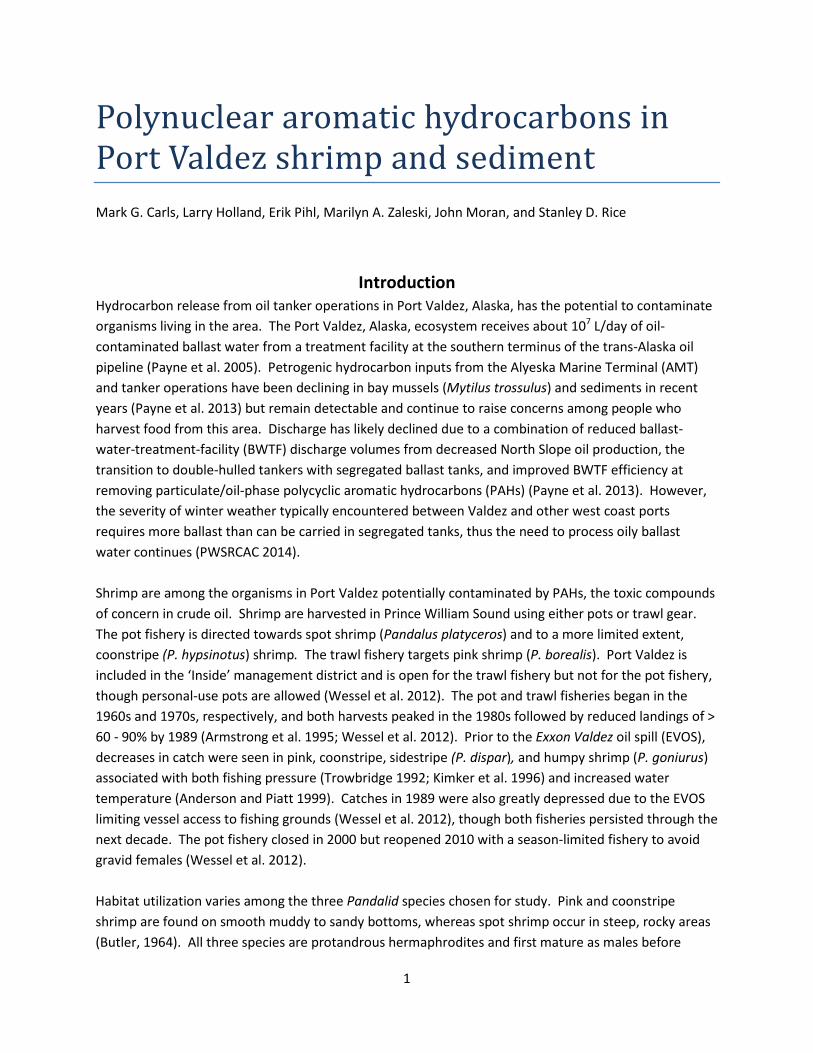
Hydrocarbon release from oil tanker operations in Port Valdez, Alaska, has the potential to contaminate organisms living in the area. The Port Valdez, Alaska, ecosystem receives about 107 L/day of oil-contaminated ballast water from a treatment facility at the southern terminus of the trans-Alaska oil pipeline (Payne et al. 2005). Petrogenic hydrocarbon inputs from the Alyeska Marine Terminal (AMT) and tanker operations have been declining in bay mussels (Mytilus trossulus) and sediments in recent years (Payne et al. 2013) but remain detectable and continue to raise concerns among people who harvest food from this area. Discharge has likely declined due to a combination of reduced ballast-water-treatment-facility (BWTF) discharge volumes from decreased North Slope oil production, the transition to double-hulled tankers with segregated ballast tanks, and improved BWTF efficiency at removing particulate/oil-phase polycyclic aromatic hydrocarbons (PAHs) (Payne et al. 2013). However, the severity of winter weather typically encountered between Valdez and other west coast ports requires more ballast than can be carried in segregated tanks, thus the need to process oily ballast water continues (PWSRCAC 2014). Shrimp are among the organisms in Port Valdez potentially contaminated by PAHs, the toxic compounds of concern in crude oil. Shrimp are harvested in Prince William Sound using either pots or trawl gear. The pot fishery is directed towards spot shrimp (Pandalus platyceros) and to a more limited extent, coonstripe (P. hypsinotus) shrimp. The trawl fishery targets pink shrimp (P. borealis). Port Valdez is included in the ‘Inside’ management district and is open for the trawl fishery but not for the pot fishery, though personal-use pots are allowed (Wessel et al. 2012). The pot and trawl fisheries began in the 1960s and 1970s, respectively, and both harvests peaked in the 1980s followed by reduced landings of > 60 - 90% by 1989 (Armstrong et al. 1995; Wessel et al. 2012). Prior to the Exxon Valdez oil spill (EVOS), decreases in catch were seen in pink, coonstripe, sidestripe (P. dispar), and humpy shrimp (P. goniurus) associated with both fishing pressure (Trowbridge 1992; Kimker et al. 1996) and increased water temperature (Anderson and Piatt 1999). Catches in 1989 were also greatly depressed due to the EVOS limiting vessel access to fishing grounds (Wessel et al. 2012), though both fisheries persisted through the next decade. The pot fishery closed in 2000 but reopened 2010 with a season-limited fishery to avoid gravid females (Wessel et al. 2012). Habitat utilization varies among the three Pandalid species chosen for study. Pink and coonstripe shrimp are found on smooth muddy to sandy bottoms, whereas spot shrimp occur in steep, rocky areas (Butler, 1964). All three species are protandrous hermaphrodites and first mature as males before
1
undergoing a sex transformation into functional females at about 4.5, 3, and 6 years, respectively (Oresanz et al., 1998; Armstrong et al., 1995). Variability in the mean age and size at sex change can vary with both population density and geography (Anderson P., 1991; Armstrong et al. 1995). The ovigerous period of mature female shrimp varies among species, ranging from 7 - 8, 6 - 11, and 4 - 5.5 months in pink, coonstripe, and spot shrimp, respectively (Shumway et al., 1985; Oresanz et al., 1998). We hypothesized that shrimp species with the most contact with soft sediment are the most likely to become contaminated because previous study has demonstrated sediment is a compartment that accumulates oil residue in Port Valdez. We further hypothesized that shrimp eggs would be the most likely tissue to accumulate PAHs if transfer involved constituents dissolved in water. The relatively high lipid content of egg tissue and their external position on shrimp should render them vulnerable to PAH accumulation similar to lipid-rich copepods and passive samplers (Salazar et al. 2002; Carls et al. 2004). Dissolved PAHs have also been detected in bay mussels in Port Valdez (Payne et al. 2005), although these filter-feeding organisms can accumulate oil droplets when the water column is not stratified (Payne et al. 2005). This study was prompted by sport fisherman concern that hydrocarbon discharge may pose health risks to the reproductive capacity of indigenous shrimp or human consumers of them. The goal was to measure PAH loads in eggs, edible muscle tissue, and heads and viscera (combined), to determine if observed concentrations pose a health risk to consumers or to the reproductive capacity of the shrimp. Sediment was collected when and where shrimp were collected to assess the exposure potential for shrimp utilizing this habitat and determine hydrocarbon sources.
Sample area Port Valdez is a narrow fjord located in the northeast corner of Prince William Sound (PWS), Alaska, and is separated from PWS by a narrow channel and double sill (Fig. 1). The walls of this approximately 100 km2 basin drop steeply to a nearly flat bottom about 240 m deep; mean depth is about 180 m (Colonell 1980). Tidal exchange is large, about 5.6 m maximum and 3.0 m mean. Mean annual precipitation is 158 cm per year (Blanchard and Feder 2000; Blanchard and Feder 2000). The suspended sediment load is seasonal; high loads coincide with spring melt (Sharma and Burbank 1973; Feder and Keiser 1980). Subsurface flow patterns (15 m below the surface) tend to be irregular, with an ill-defined wind-driven western movement (Muench and Nebert 1973). Water exchange between PWS and Port Valdez is influenced by tidal flushing, seasonal deep water exchange, and weather-driven events. The tidal prism is about 1.6% of the total volume, suggesting the half-life of a conservative (i.e. degradation-resistant) pollutant is about 22 d in dry weather (Colonell 1980). Deep water exchange is enhanced during summer and early autumn as surface freshwater outflow is replaced by more saline deeper water from PWS via the Valdez Narrows (Muench and Nebert 1973; Sharma and Burbank 1973; Colonell 1980). Surges of surface water from PWS into Port Valdez and large outflows at depths >50 m are apparently related to weather systems, and are believed to be the processes with the greatest influence on deep water exchange (Colonell 1980). Together, these processes suggest the residence time of pollutants is probably no more than a few weeks (Colonell 1980).
2
Methods Nine sites were sampled within Port Valdez, Alaska, and one additional site, Jack Bay, was sampled adjacent to the Valdez Narrows (Table 1, Fig. 1). Sites were chosen to allow comparison between reference areas and areas receiving hydrocarbon input as a result of ballast water treatment at the AMT. The sites were also chosen to allow comparison to previous studies (Salazar et al. 2002; Carls et al. 2006; Payne et al. 2013). Jack Bay was chosen as a nearby reference site. Some locations are used by local shrimp fishermen (West Town, Gold Creek, Shoup Bay, and Anderson Bay). The area outside the AMT security zone was sampled because ballast treatment water is released at the AMT. The AMT West and AMT East sites were relatively shallow (60 – 86 m) sport fishing areas immediately outside the security zone. Deeper AMT sites (197 to 237 m) were sampled on the northern edge of the security zone, an area where pink shrimp were more likely than coonstrip and spot shrimp. Each site was typically sampled with four 80 cm diameter by 30 cm tall shrimp pots with 2 cm mesh; one pot out of 12 had approximately 3 cm mesh (Table 1). No shrimp were captured at AMT West Deep, even though 5 pots were used. Shrimp were separated by species wrapped in aluminum foil, placed in ziplock bags, and frozen immediately after capture. Benthic sediment was collected with a Van Veen grab in close proximity to shrimp pot placement. The grab preserved sediment structure and the top two or three millimeters were sampled with a hydrocarbon-free spoon to yield samples of recent sediment. These were frozen pending analysis. Shrimp tissues were subdivided into egg, muscle, and head-thorax samples in the laboratory before further analysis. In short, shrimp were thawed, weighed to the nearest 0.001 g, measured (carapace length in mm), and dissected within 15 minutes of thawing (Fig 2). Shrimp were handled with hydrocarbon clean forceps, scalpels, and scissors. Subsampled tissues were placed in hydrocarbon-free jars and frozen pending hydrocarbon extraction. Lipid measurement Lipids were measured to understand the relative ability of the three tissue types to accumulate hydrocarbons. Analysis among tissues was restricted to coonstripe shrimp, where an adequate number of samples were available for each tissue type (6 ≤ n ≤ 8). Additional available spot shrimp eggs (n = 1) and pink shrimp eggs (n = 2) were measured for an among-species egg comparison. Lipid was extracted from roughly 0.250 g of wet sample homogenate using a 1:1 chloroform methanol solution (Christie 1982). Liquid-liquid extractions were performed using an aqueous solution of 0.88% potassium chloride (0.88 g / 100 mL) equal to one quarter of the extraction volume. The bottom layer of biphasic solution was collected and re-extracted using a 1:1 methanol deionized water solution at one quarter of the volume of the recovered extract. The bottom extraction layer was collected and its volume reduced to 1 mL under vacuum using a rotary evaporator. Gravimetric analysis of the lipid extract was used to determine the percent lipid expressed as a percentage of the wet tissue mass. Hydrocarbon measurement
3
Hydrocarbons were extracted from tissue and sediment with dichloromethane, dried, fractionated, purified, and processed by gas chromatography-flame ionization detection (GC-FID) and gas chromatography-mass spectroscopy (GC-MS). Tissue was spiked with 500 μL of deuterated surrogate recovery standard (Appendix A), then extracted with dichloromethane using a Dionex accelerated solvent extractor (Larsen et al. 2008). Tissue and sediment extracts were dried with sodium sulfate and concentrated to 1 ml in hexane. The extracts were applied to a chromatography column (20 g of 5% deactivated silica gel over 10 g of 2% deactivated alumina) and separated into aliphatic and aromatic fractions. The aliphatic compounds were eluted with 50 ml pentane, and aromatic compounds were eluted with 250 ml of a 1:1 mixture of pentane and dichloromethane. Tissue aromatic fractions were further purified by a high performance liquid chromatograph equipped with size-exclusion columns (22.5 mm x 250 mm, phenogel, 100 angstrom pore size). Both the aliphatic and the aromatic fractions were reduced to 1 ml in hexane, spiked with internal standards (dodecylcyclohexane and hexamethylbenzene, respectively) and stored at −20° C pending GC analysis. Aliphatic fractions were analyzed for n-alkanes using GC-FID. Analyte concentrations were determined by the internal standard method. Experimentally determined method detection limits were about 5 ng/g in tissue and < 1 ng/g in sediment. The accuracy of the alkane analyses was ± 11% based on a spiked blank processed with each set of samples, and precision expressed as coefficient of variation was usually less than about 20%. Surrogate recoveries averaged 57 and 58% in tissue and sediment, respectively. Total alkane concentrations were calculated by summing concentrations of individual calibrated alkanes (Appendix B). The unresolved complex mixture (UCM) concentration was determined from the difference between the total FID response area and resolved peak areas. Concentrations are reported as ng/g dry weight. Aromatic fractions were analyzed for PAHs by GC-MS. Data were acquired in selected ion monitoring (SIM) mode and concentrations were determined by the internal standard method (Short et al. 1996). Experimentally determined method detection limits were about 0.3 ng/g in tissue and 0.04 ng/g in sediment. The accuracy of the PAH analyses was about ± 15% based on comparison with National Institute of Standards and Technology values (SRM1944), and precision expressed as coefficient of variation was about 30%, depending on the PAH. Surrogate recoveries averaged 60 and 74% in tissue and sediment, respectively. Total PAH (TPAH) concentrations were calculated by summing concentrations of individual PAH (Appendix C). Concentrations are reported as ng/g dry weight. Aliphatic fractions of sediments were analyzed for biomarkers by GC-MS. The data were acquired in a selected-ion monitoring mode, and concentrations were determined by the internal standard method with response factors (RF) based on two representative compounds, 17α (H),21β(H)-hopane (H30) and 5α(H),14α(H),17α(H)-cholestane. The accuracy of the biomarker analyses was about ± 15% based on a spiked blank processed with each set of samples, and precision expressed as coefficient of variation was about 20%, depending on the biomarker. Biomarker concentrations were not corrected for recovery; surrogate recovery averaged 70% (range 55 to 76%). Biomarker analytes are reported in Appendix D. Measurement interpretation
4
Composition of all PAHs was analyzed by Principal Components Analysis (PCA), providing insight into the presence (or absence) of oil constituents, weathering, and geographic patterns. Concentration data were normalized before analysis (PAHi / TPAH) to understand composition similarities and differences without complication by variable concentration. PCA was completed with Minitab using correlation matrices. Composition of PAH was also modeled to characterize source attributes (petrogenic or pyrogenic) using revised methods of (Carls 2006); values ranged from -1 (pyrogenic) to +1 (petrogenic).
Alkane composition was modeled to identify the presence or absence of oil. Normalized alkane values (alkanei / ∑alkanes) were compared to composition in Alaska North Slope crude oil (ANSCO), which varies considerably due to weathering processes, particularly for the smallest compounds. Values within the ANSCO range were scored 1 for each analyte else 0. These were summed and divided by the total number of analytes (30) to yield a raw score; 1.0 was a perfect match, 0.0 was unlike ANSCO. Raw scores were adjusted by considering even- odd-alkane distributions in the range n-C21 to n-C36: pOdd = ∑( n-C21 + n-C23 + … + n-C35) / (n-C21 + n-C22 + … + n-C36). Smaller alkanes were not included in this calculation because degradation can obscure patterns. When composition is primarily or entirely odd the likely source is from plants. If no alkanes were present in this range the alkane score was set to zero. Otherwise, the score was adjusted by pOdd: alkane score = raw score * (1 – 2 * (pOdd – 0.5)). Average pOdd is 0.5 in ANSCO, thus there was no adjustment when pOdd = 0.5; scores increased when pOdd < 0.5 (rare) and decreased when pOdd > 0.5.
Results Shrimp were successfully collected from all sites except AMT West Deep; all three species were captured (Table 1). Egg-bearing coonstripe shrimp were present at most locations; very few spot shrimp had eggs. Pink shrimp were encountered less frequently than the other species. Spot shrimp were the largest and pink shrimp were the smallest, consistent with typical species size (Fig. 3a). Egg mass increased with shrimp size (Fig. 3b).
Tissue Percent lipid content was significantly greater in coonstripe eggs (8.7%) than in heads (2.6%) and muscle (1.5%). Thus, percent lipid was nearly six times greater in eggs than heads. We suspect this general relationship is true for the other two shrimp species presented in this report: there were insufficient egg samples for a full analysis. However, percent lipid was 8.6 (8.57 to 8.70) in a single spot shrimp egg sample and ranged from 6.1 to 8.5 in pink shrimp eggs (n = 2). Percent lipid was not significantly different among species (PANOVA = 0.473).
Hydrocarbons varied among tissue and species. The mean TPAH concentration was least in muscle and greatest in eggs although ranges overlapped (Table 2). Perylene, which was rare in tissue (11 of 124 samples) and occurs naturally, was not included in the TPAH analysis. In samples where it occurred, perylene accounted for up to 100% of the PAHs above method detection limits (MDL). Alkane concentration was least in muscle and greatest in heads (Table 2). These relationships were the same for even alkanes, an analysis designed to avoid contemporary plant contributions, but mean
5
concentrations were much lower. No UCMs were observed in tissue. Alkanes typically accounted for 85% of the hydrocarbons detected in eggs, and >99% in heads, but only 9% in muscle. Evidence of oil was discovered in some eggs but not in muscle and heads.
Eggs The composition of PAHs in eggs, elucidated by PCA, varied geographically and graded from background conditions to oiled (Figs. 4 to 6). Composition in shrimp from Jack Bay, and Shoup Bay was consistent with background conditions (Fig. 6, panel 1). Composition in eggs changed toward Gold Creek, West Town and AMT East Deep (Fig. 5a); oil influence was not evident in most of these (Fig. 6, panel 2 – 3). Composition in the remaining eggs was at the other extreme and included Anderson Bay and most AMT sites (Fig. 5a); most of these were either oiled or plausibly contained traces of oil (Fig. 6, panels 5 – 6). Conditions at Anderson Bay were the most diverse; PAH in some eggs was consistent with background conditions (about 20 of 32 samples) and oil in others.
Petrogenic PAHs, determined by composition modeling, were present or plausible in coonstripe and pink shrimp eggs at some AMT sites and Anderson Bay (Fig. 6). Spot shrimp eggs were not collected in these areas and did not have evidence of oil. Oil was likely in pink shrimp eggs at AMT East and in 1 of 2 Anderson Bay samples (composition model results were 0.62 to 0.63; Table 3). Total PAH concentrations in these eggs were the greatest observed, 4065 and 564 ng/g dry weight, respectively. Four additional egg samples had distinct petrogenic fluorenes, dibenzothiophenes, and phenanthrenes, and oil was plausible in four more, typically involving dibenzothiophene and phenanthrenes (Table 3). All samples with oil or possible oil were collected in the AMT area or Anderson Bay and they had the highest observed TPAH concentrations (> 69 ng/g TPAH minus perylene) with a single exception, the unusual AMT East Deep sample (121 ng/g, Fig. 6, panel 7). The reason for the elevated TPAH concentration in the latter sample is unclear but it was in the area where oil was observed (AMT) and was weathered more than most (13% chrysenes). The only other comparably weathered sample was an Anderson Bay sample (15% chrysenes, Fig. 6 panel 8). Perylene dominated the composition in a single Shoup Bay sample (89%), likely from a natural contemporary source. Petrogenic alkanes were not observed in egg samples (Fig. 7), hence the contamination was from a soluble source.
Muscle There was no evidence of petrogenic PAHs in shrimp muscle (Fig. 8). Total PAH concentration varied between 0 and 58 ng/g dry weight with no evidence of contamination (−0.17 ≤ pS3 ≤ 0.07, where pS3 is the composition model result). PAHs above MDL included occasional naphthalenes, phenanthrenes, and perylene (Fig. 8). All TPAH concentrations > 10 ng/g were in pink shrimp muscle and these included all sites with samples (Jack and Anderson Bays and three AMT sites). Alkanes were rarely detected in muscle (3 of 41), and were present as a single compound in each instance (typically pristane; Fig. 7).
Heads There was no evidence of petrogenic hydrocarbons in shrimp heads (Fig. 8). Median TPAH concentration varied among species (4.6, 11.2, and 88.0 ng/g dry weight for coonstripe, spot, and pink shrimp, respectively). There was no evidence of contamination in any samples (−0.18 ≤ pS3 ≤ 0.22).
6
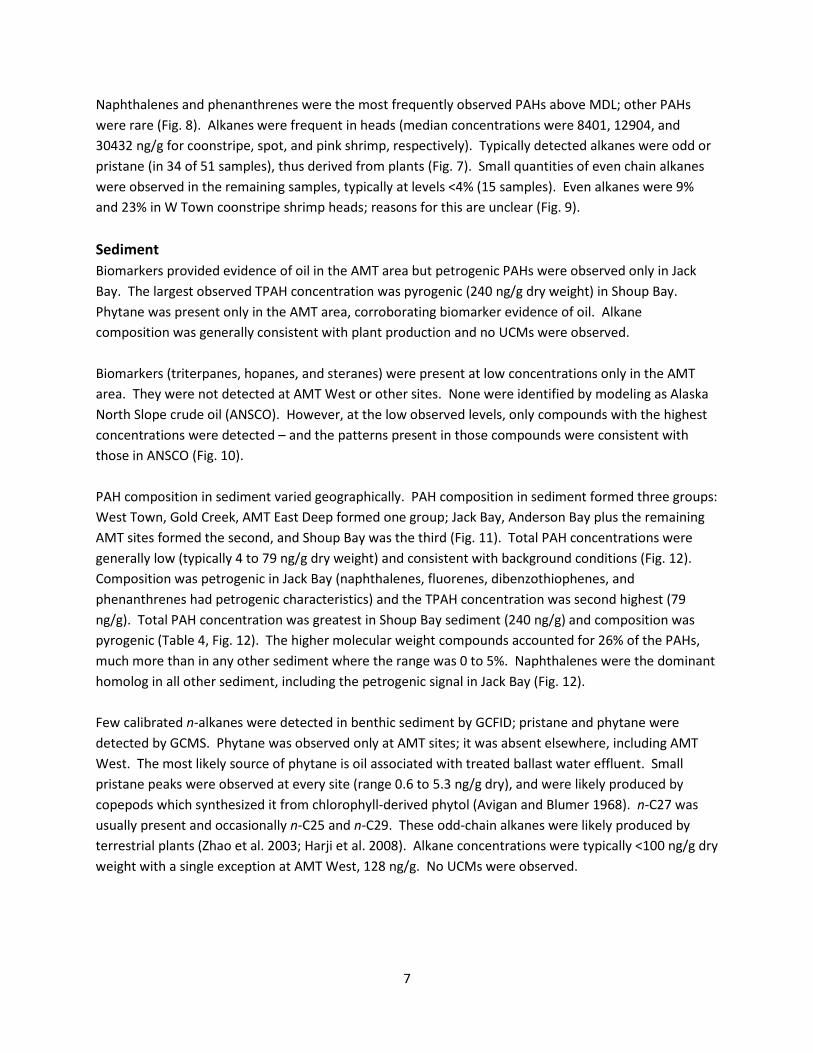
Naphthalenes and phenanthrenes were the most frequently observed PAHs above MDL; other PAHs were rare (Fig. 8). Alkanes were frequent in heads (median concentrations were 8401, 12904, and 30432 ng/g for coonstripe, spot, and pink shrimp, respectively). Typically detected alkanes were odd or pristane (in 34 of 51 samples), thus derived from plants (Fig. 7). Small quantities of even chain alkanes were observed in the remaining samples, typically at levels <4% (15 samples). Even alkanes were 9% and 23% in W Town coonstripe shrimp heads; reasons for this are unclear (Fig. 9).
Sediment Biomarkers provided evidence of oil in the AMT area but petrogenic PAHs were observed only in Jack Bay. The largest observed TPAH concentration was pyrogenic (240 ng/g dry weight) in Shoup Bay. Phytane was present only in the AMT area, corroborating biomarker evidence of oil. Alkane composition was generally consistent with plant production and no UCMs were observed.
Biomarkers (triterpanes, hopanes, and steranes) were present at low concentrations only in the AMT area. They were not detected at AMT West or other sites. None were identified by modeling as Alaska North Slope crude oil (ANSCO). However, at the low observed levels, only compounds with the highest concentrations were detected – and the patterns present in those compounds were consistent with those in ANSCO (Fig. 10).
PAH composition in sediment varied geographically. PAH composition in sediment formed three groups: West Town, Gold Creek, AMT East Deep formed one group; Jack Bay, Anderson Bay plus the remaining AMT sites formed the second, and Shoup Bay was the third (Fig. 11). Total PAH concentrations were generally low (typically 4 to 79 ng/g dry weight) and consistent with background conditions (Fig. 12). Composition was petrogenic in Jack Bay (naphthalenes, fluorenes, dibenzothiophenes, and phenanthrenes had petrogenic characteristics) and the TPAH concentration was second highest (79 ng/g). Total PAH concentration was greatest in Shoup Bay sediment (240 ng/g) and composition was pyrogenic (Table 4, Fig. 12). The higher molecular weight compounds accounted for 26% of the PAHs, much more than in any other sediment where the range was 0 to 5%. Naphthalenes were the dominant homolog in all other sediment, including the petrogenic signal in Jack Bay (Fig. 12).
Few calibrated n-alkanes were detected in benthic sediment by GCFID; pristane and phytane were detected by GCMS. Phytane was observed only at AMT sites; it was absent elsewhere, including AMT West. The most likely source of phytane is oil associated with treated ballast water effluent. Small pristane peaks were observed at every site (range 0.6 to 5.3 ng/g dry), and were likely produced by copepods which synthesized it from chlorophyll-derived phytol (Avigan and Blumer 1968). n-C27 was usually present and occasionally n-C25 and n-C29. These odd-chain alkanes were likely produced by terrestrial plants (Zhao et al. 2003; Harji et al. 2008). Alkane concentrations were typically <100 ng/g dry weight with a single exception at AMT West, 128 ng/g. No UCMs were observed.
7

Discussion Generally low level petrogenic hydrocarbon contamination was evident in shrimp eggs primarily in the vicinity of the AMT and extending along the southern shore of Port Valdez to Anderson Bay. Shrimp eggs, which are carried externally on female pleopods, are capable of bioaccumulating hydrocarbons from water and sequestering them at detectable levels. An absence of petrogenic alkanes indicated that hydrocarbons accumulated from a dissolved source and there was no visible evidence of oil coating. Eggs were the most vulnerable biological compartment to hydrocarbon accumulation; there was no evidence of oil in shrimp muscle or heads. Some oil-contaminated sediment was observed in the vicinity of the AMT, coincident with evidence of egg contamination, thus the source of biological contamination was possibly sediment, mediated by aqueous transfer, or contamination of both sediment and eggs was direct exposure to aqueous ballast water effluent. Total PAH accumulation was substantially greater in some pink shrimp than in other species, thus differences in habitat utilization (muddy versus rocky substrate) are potentially important.
Similarities of PAH uptake by shrimp eggs and past observations supports aqueous transfer as the exposure route. Ingestion is not a possible route of contamination in eggs, coating was not observed, and the hydrocarbon chemistry was consistent with a dissolved source. Where they are exposed under current conditions (2008 – 2012), Port Valdez mussels typically acquire only dissolved oil constituents (Payne et al. 2013). Planktonic copepods, which seasonally occupy various depths in the water column, also accumulate dissolved PAHs; insoluble phytane was not detected in them (Carls et al. 2006). Passive samplers (polyethylene membrane devices, PEMDs) deployed in the AMT area in 2001 accumulated dissolved petrogenic constituents (Salazar et al. 2002). PCA comparison of PEMD data with the shrimp egg data reveals that PAH composition in shrimp eggs and in PEMDs in the AMT area was similar and the point clouds overlapped (Figs. 5b and 5c). We infer that the hydrocarbon exposure processes observed in 2013 were the same as those active in 2001; in both cases dissolved oil constituents were present in the water and available for accumulation by lipid-rich organisms or surrogate passive samplers.
Mean TPAH concentrations in pink shrimp eggs were greater than expected from the historical record but generally comparable for other eggs and all tissues. Concentrations in bay mussels ranged from about 7 to 55 ng/g dry wt. in the past five years (2009 to 2012) (Payne et al. 2013) and about 126 – 296 ng/g in Neocalanus copepods collected within Port Valdez (Carls et al. 2006). The mean concentration in pink shrimp eggs was 630 ng/g (n = 8); this was biased high by a sample with 4065 ng/g load and another at 564 ng/g. Total PAH concentrations in shrimp muscle tissue (Table 2) were below to within the 5-year range observed in mussels.
Total PAH concentrations in sediment in 2013 were similar to or lower than those in the past 5 years. For example, TPAH ranged from 5 – 15 ng/g dry wt. in the AMT area, within the 24 – 119 range observed between 2009 and 2012 (Payne et al. 2013). The concentration at Gold Creek was lower 6 ng/g, less than the 15 – 50 ng/g previous range, and the 79 ng/g concentration at Jack Bay was less than that in 2004 (2015 ng/g).
8

Petrogenic hydrocarbon accumulation in some shrimp eggs raises concern for embryonic development. In general, PAH quantities in egg tissue were of little concern; TPAH concentrations were typically < 100 ng/g dry wt. (24 of 32 samples). However, concentrations in some coonstripe shrimp from the AMT area were in the 200-300 ng/g range (n = 3) and TPAH exceeded 100 ng/g in three pink shrimp egg samples in this area (122 – 564 ng/g). Total PAH was unexpectedly high in pink shrimp eggs from Anderson Bay (4065 ng/g) and the sample had a weathered oil signature. Pacific herring eggs exposed to weathered crude oil were damaged at peak accumulations of about 200 ng/g dry wt (Carls et al. 1999), raising concern for potential damage in similarly exposed shrimp embryos. Relationships between exposure timing, incubation time, species differences and other factors are unknown, making inferences difficult – but it raises the possibility that shrimp development might be impaired by environmental exposures and suggests further study is warranted.
In conclusion, hydrocarbon tainting of shrimp muscle is not a concern for the shrimp fishery in Port Valdez and observed concentrations do not pose a human health risk. However, PAH accumulation in some shrimp eggs may potentially impair development. Petrogenic contamination was not observed in shrimp muscle and heads. Differences in shrimp habitat utilization may be important; pink shrimp eggs accumulated more PAHs than coonstripe shrimp eggs despite similarities in lipid content. In general, PAH loads were consistent with local time series data in other species, and the accumulation mechanism, dissolved uptake from water, was consistent with passive sampler observations completed more than a decade earlier. Hydrocarbon levels in the majority of samples were not concerning. Most elevated concentrations occurred in the AMT area but the egg sample with the greatest contamination was observed in Anderson Bay, about 17 km west of the ballast water treatment facility.
References Anderson, P. J. and J. F. Piatt (1999). "Community reorganization in the Gulf of Alaska following ocean
climate regime shift." Marine Ecology Progress Series 189: 117-123. Armstrong, D. A., P. A. Dinnel, et al. (1995). Status of selected bottomfish and crustacean species in
Prince William Sound following the Exxon Valdez oil spill. Exxon Valdez oil spill: Fate and effects in Alaskan waters. P. G. Wells, J. N. Butler and J. S. Hughes, ASTM STP 1219.
Avigan, J. and M. Blumer (1968). "On the origin of pristane in marine organims." Journal of Lipid Research 9: 350-352.
Blanchard, A. and H. M. Feder (2000). "Distribution, reproduction, and shell growth of limpets in Port Valdez, Alaska." Veliger 43: 289-301.
Blanchard, A. and H. M. Feder (2000). "Shell growth of Mytilus trossulus Gould, 1850, in Port Valdez, Alaska." Veliger 43(34-42).
Carls, M. G. (2006). "Nonparametric identification of petrogenic and pyrogenic hydrocarbons in aquatic ecosystems." Environmental Science & Technology 40(13): 4233-4239.
Carls, M. G., L. G. Holland, et al. (2004). "Monitoring polynuclear aromatic hydrocarbons in aqueous environments with passive low-density polyethylene membrane devices." Environmental Toxicology and Chemistry 23(6): 1416-1424.
Carls, M. G., S. D. Rice, et al. (1999). "Sensitivity of fish embryos to weathered crude oil: Part I. Low-level exposure during incubation causes malformations, genetic damage, and mortality in larval Pacific herring (Clupea pallasi)." Environmental Toxicology and Chemistry 18(3): 481-493.
9
Carls, M. G., J. W. Short, et al. (2006). "Accumulation of polycyclic aromatic hydrocarbons by Neocalanus copepods in Port Valdez, Alaska." Marine Pollution Bulletin 52(11): 1480-1489.
Christie, W. W. (1982). Lipid analysis. Oxford, UK, Pergamon. Colonell, J. M. (1980). Physical Oceanography. Port Valdez Alaska: environmental studies 1976-1979. J.
M. Colonell, Occasional Publication No. 5. Institute of Marine Science, University of Alaska, Fairbanks: 11-35.
Feder, H. M. and G. E. Keiser (1980). Intertidal biology. Port Valdez, Alaska: environmental studies 1976-1979. J. M. Colonell, Occasional Publication No. 5. Institute of Marine Science, University of Alaska, Fairbanks: 143-233.
Harji, R. R., A. Yvenat, et al. (2008). "Sources of hydrocarbons in sediments of the Mandovi estuary and the Marmugoa harbor, west coast of India." Environment International 34: 959-965.
Kimker, A., W. Donaldson, et al. (1996). "Spot shrimp growth in Unakwik Inlet, Prince William Sound, Alaska." Fishery Research Bulletin 3: 1-8.
Larsen, M. L., L. Holland, et al. (2008). Standard operating procedures for the analysis of petroleum hydrocarbons in seawater, marine sediments, and marine faunal tissue at the Auke Bay Laboratory. Juneau, AK, NOAA, NMFS, Alaska Science Center, Auke Bay Laboratories: 81.
Muench, R. D. and D. L. Nebert (1973). Physical Oceanography. Environmental studies of Port Valdez. D. W. Hood, W. E. Shiels and E. J. Kelley, Occasional Publication No. 3. Institute of Marine Science: 101-149.
Payne, J. R., W. B. Driskell, et al. (2013). Long-term environmental monitoring program, Prince William Sound Regional Citizens' Advisory Council: 89.
Payne, J. R., W. B. Driskell, et al. (2005). From tankers to tissues -- tracking the degradation and fate of oil discharges in Port Valdez, Alaska., Calgary, Alberta, Canada, Proceedings of Arctic Marine Oil Spill Conference 2005.
PWSRCAC. (2014). from http://www.pwsrcac.org/programs/terminal/ballast-water-treatment-facility/. Salazar, M. H., J. W. Short, et al. (2002). 2001 Port Valdez Monitoring Final Report, Prince William Sound
Regional Citizens' Advisory Council. Sharma, G. D. and D. C. Burbank (1973). Geological oceanography. Environmental studies of Port Valdez.
D. W. Hood, W. E. Shiels and E. J. Kelley, Ocassional Publication No. 3. Institute of Marine Science: 15-100.
Short, J. W., T. L. Jackson, et al. (1996). "Analytical methods used for the analysis of hydrocarbons in crude oil, tissues, sediments, and seawater collected for the natural resources damage assessment of the Exxon Valdez oil spill." American Fisheries Society Symposium 18: 140-148.
Trowbridge, C. (1992). Injury to Prince William Sound spot shrimp. Final Report for Exxon Valdez Oil Spill State/Federal NRDA Subtidal Study No. 5.
Wessel, M., C. E. Trowbridge, et al. (2012). Prince William Sound area management report for dungeness crab, shrimp, and miscellaneous shellfish fisheries 2011. Anchorage, AK, Fishery Management Report No. 12-05, Alaska Department of Fish and Game: 37 pp.
Zhao, M., L. Dupont, et al. (2003). "n-Alkane and pollen reconstruction of terrestrial climate and vegetation for N.W. Africa over the last 160 kyr." Organic Geochemistry 2003: 131-143.
10
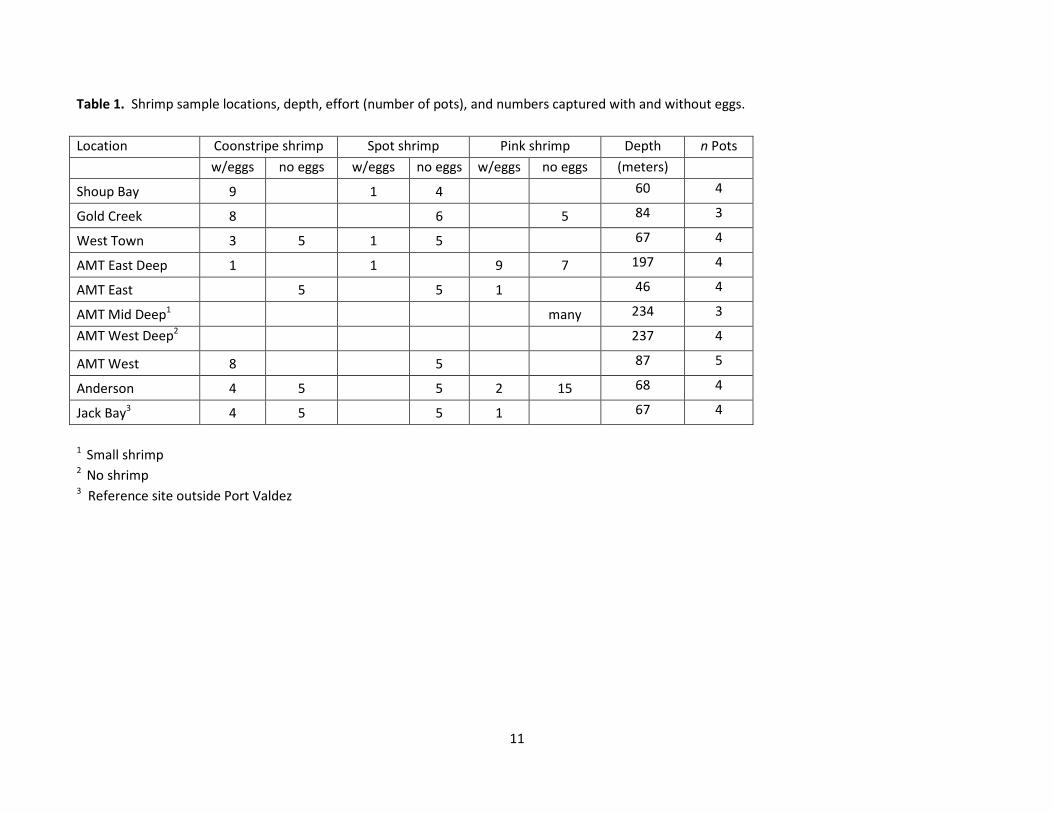
Table 1. Shrimp sample locations, depth, effort (number of pots), and numbers captured with and without eggs.
Location Coonstripe shrimp Spot shrimp Pink shrimp Depth n Pots w/eggs no eggs w/eggs no eggs w/eggs no eggs (meters)
Shoup Bay 9 1 4 60 4
Gold Creek 8 6 5 84 3
West Town 3 5 1 5 67 4
AMT East Deep 1 1 9 7 197 4
AMT East 5 5 1 46 4
AMT Mid Deep1 many 234 3
AMT West Deep2 237 4
AMT West 8 5 87 5
Anderson 4 5 5 2 15 68 4
Jack Bay3 4 5 5 1 67 4
1 Small shrimp 2 No shrimp 3 Reference site outside Port Valdez
11
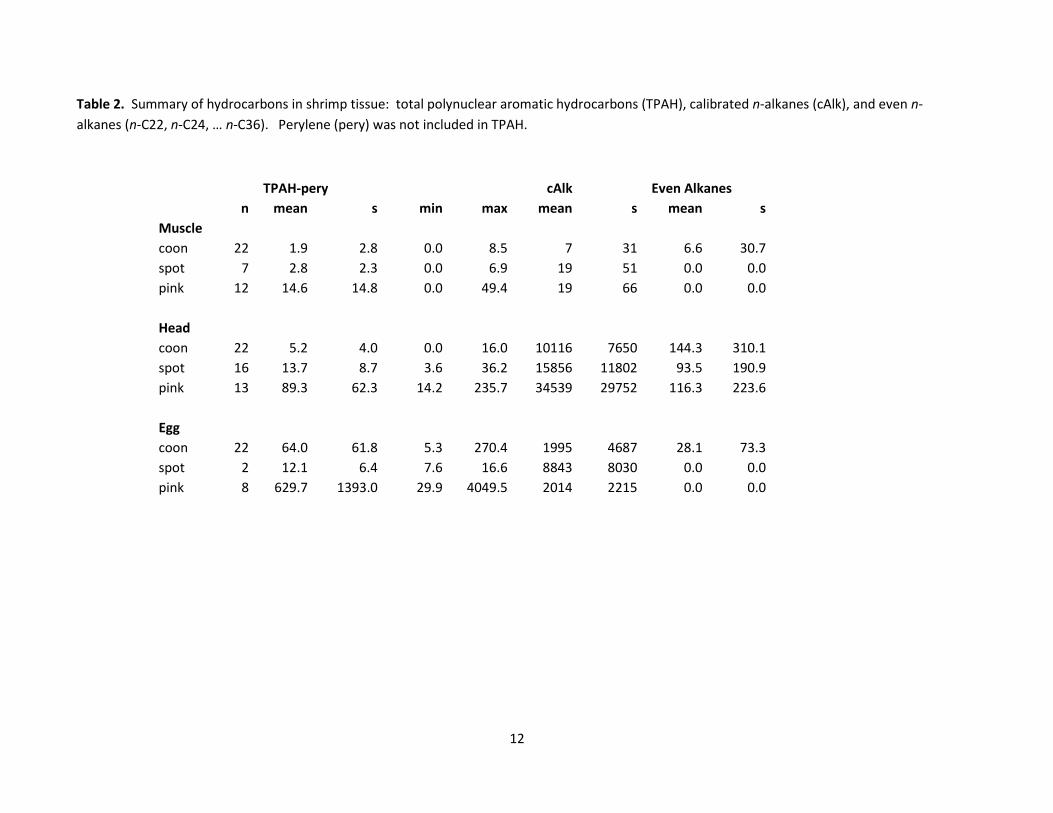
Table 2. Summary of hydrocarbons in shrimp tissue: total polynuclear aromatic hydrocarbons (TPAH), calibrated n-alkanes (cAlk), and even n-alkanes (n-C22, n-C24, … n-C36). Perylene (pery) was not included in TPAH.
TPAH-pery cAlk Even Alkanes n mean s min max mean s mean s
Muscle coon 22 1.9 2.8 0.0 8.5 7 31 6.6 30.7 spot 7 2.8 2.3 0.0 6.9 19 51 0.0 0.0 pink 12 14.6 14.8 0.0 49.4 19 66 0.0 0.0
Head coon 22 5.2 4.0 0.0 16.0 10116 7650 144.3 310.1 spot 16 13.7 8.7 3.6 36.2 15856 11802 93.5 190.9 pink 13 89.3 62.3 14.2 235.7 34539 29752 116.3 223.6
Egg coon 22 64.0 61.8 5.3 270.4 1995 4687 28.1 73.3 spot 2 12.1 6.4 7.6 16.6 8843 8030 0.0 0.0 pink 8 629.7 1393.0 29.9 4049.5 2014 2215 0.0 0.0
12
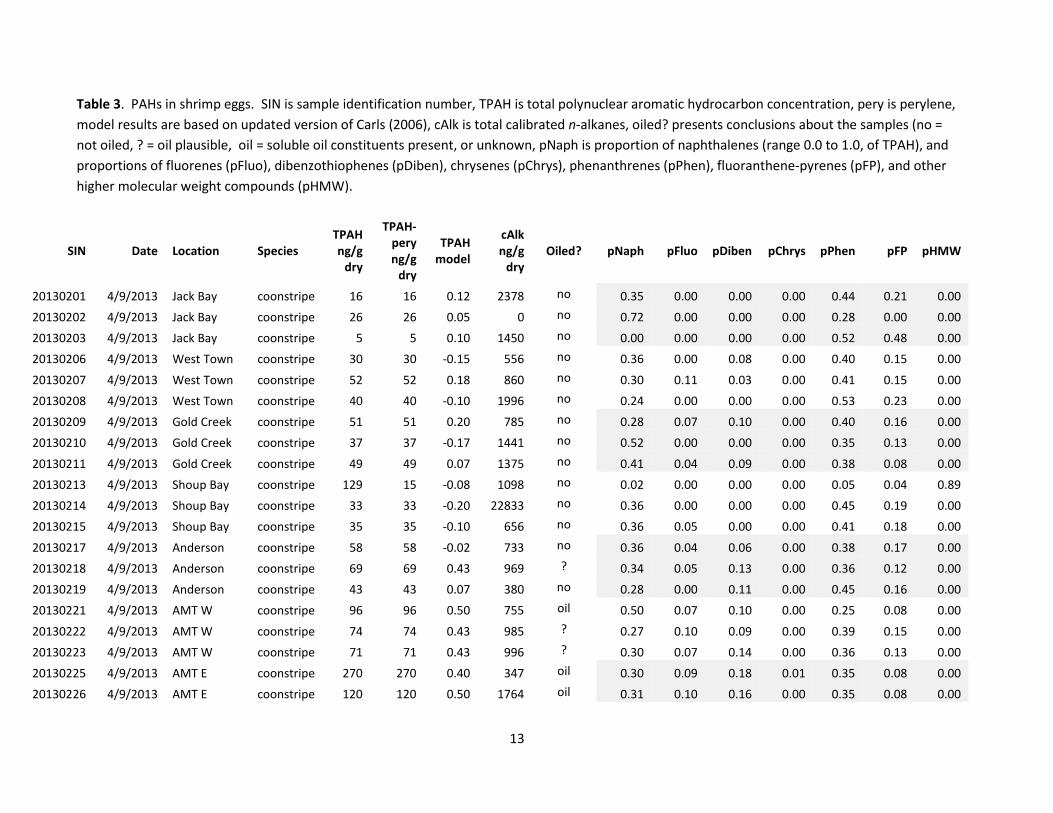
Table 3. PAHs in shrimp eggs. SIN is sample identification number, TPAH is total polynuclear aromatic hydrocarbon concentration, pery is perylene, model results are based on updated version of Carls (2006), cAlk is total calibrated n-alkanes, oiled? presents conclusions about the samples (no = not oiled, ? = oil plausible, oil = soluble oil constituents present, or unknown, pNaph is proportion of naphthalenes (range 0.0 to 1.0, of TPAH), and proportions of fluorenes (pFluo), dibenzothiophenes (pDiben), chrysenes (pChrys), phenanthrenes (pPhen), fluoranthene-pyrenes (pFP), and other higher molecular weight compounds (pHMW).
SIN Date Location Species TPAH ng/g
dry
TPAH-pery ng/g
dry
TPAH model
cAlk ng/g
dry Oiled? pNaph pFluo pDiben pChrys pPhen pFP pHMW
20130201 4/9/2013 Jack Bay coonstripe 16 16 0.12 2378 no 0.35 0.00 0.00 0.00 0.44 0.21 0.00 20130202 4/9/2013 Jack Bay coonstripe 26 26 0.05 0 no 0.72 0.00 0.00 0.00 0.28 0.00 0.00 20130203 4/9/2013 Jack Bay coonstripe 5 5 0.10 1450 no 0.00 0.00 0.00 0.00 0.52 0.48 0.00 20130206 4/9/2013 West Town coonstripe 30 30 -0.15 556 no 0.36 0.00 0.08 0.00 0.40 0.15 0.00
20130207 4/9/2013 West Town coonstripe 52 52 0.18 860 no 0.30 0.11 0.03 0.00 0.41 0.15 0.00 20130208 4/9/2013 West Town coonstripe 40 40 -0.10 1996 no 0.24 0.00 0.00 0.00 0.53 0.23 0.00 20130209 4/9/2013 Gold Creek coonstripe 51 51 0.20 785 no 0.28 0.07 0.10 0.00 0.40 0.16 0.00 20130210 4/9/2013 Gold Creek coonstripe 37 37 -0.17 1441 no 0.52 0.00 0.00 0.00 0.35 0.13 0.00
20130211 4/9/2013 Gold Creek coonstripe 49 49 0.07 1375 no 0.41 0.04 0.09 0.00 0.38 0.08 0.00 20130213 4/9/2013 Shoup Bay coonstripe 129 15 -0.08 1098 no 0.02 0.00 0.00 0.00 0.05 0.04 0.89 20130214 4/9/2013 Shoup Bay coonstripe 33 33 -0.20 22833 no 0.36 0.00 0.00 0.00 0.45 0.19 0.00 20130215 4/9/2013 Shoup Bay coonstripe 35 35 -0.10 656 no 0.36 0.05 0.00 0.00 0.41 0.18 0.00
20130217 4/9/2013 Anderson coonstripe 58 58 -0.02 733 no 0.36 0.04 0.06 0.00 0.38 0.17 0.00 20130218 4/9/2013 Anderson coonstripe 69 69 0.43 969 ? 0.34 0.05 0.13 0.00 0.36 0.12 0.00 20130219 4/9/2013 Anderson coonstripe 43 43 0.07 380 no 0.28 0.00 0.11 0.00 0.45 0.16 0.00 20130221 4/9/2013 AMT W coonstripe 96 96 0.50 755 oil 0.50 0.07 0.10 0.00 0.25 0.08 0.00
20130222 4/9/2013 AMT W coonstripe 74 74 0.43 985 ? 0.27 0.10 0.09 0.00 0.39 0.15 0.00 20130223 4/9/2013 AMT W coonstripe 71 71 0.43 996 ? 0.30 0.07 0.14 0.00 0.36 0.13 0.00 20130225 4/9/2013 AMT E coonstripe 270 270 0.40 347 oil 0.30 0.09 0.18 0.01 0.35 0.08 0.00 20130226 4/9/2013 AMT E coonstripe 120 120 0.50 1764 oil 0.31 0.10 0.16 0.00 0.35 0.08 0.00
13
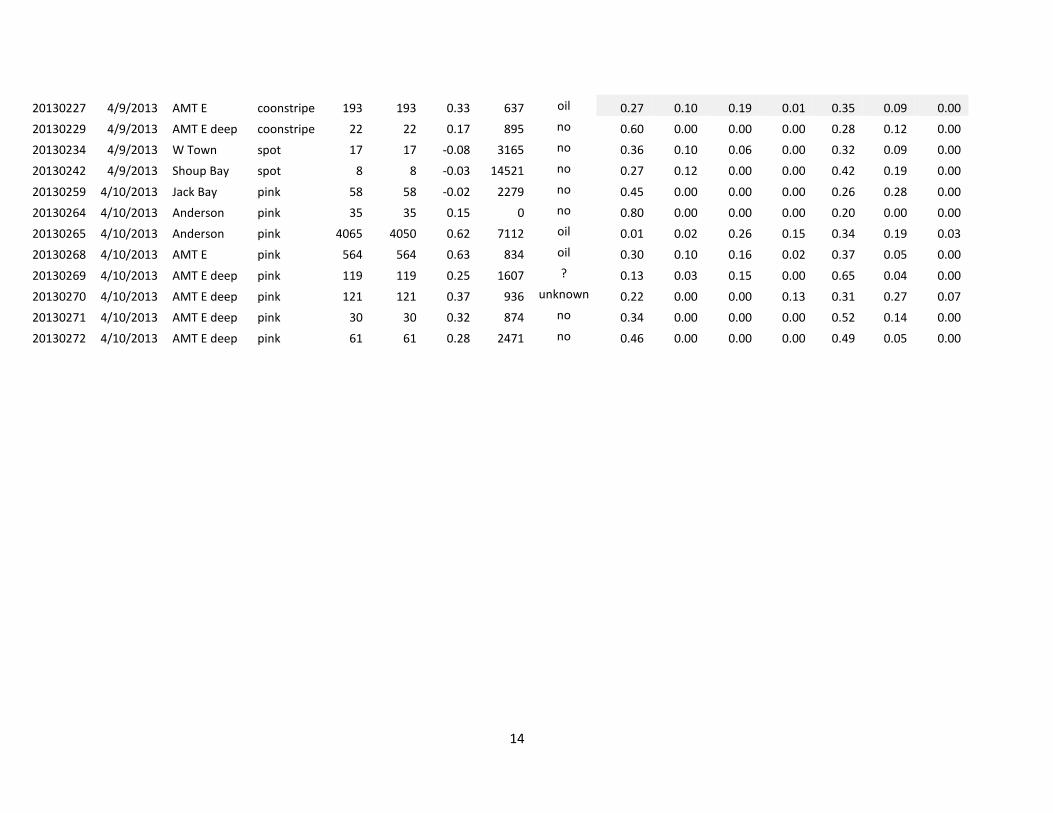
20130227 4/9/2013 AMT E coonstripe 193 193 0.33 637 oil 0.27 0.10 0.19 0.01 0.35 0.09 0.00 20130229 4/9/2013 AMT E deep coonstripe 22 22 0.17 895 no 0.60 0.00 0.00 0.00 0.28 0.12 0.00 20130234 4/9/2013 W Town spot 17 17 -0.08 3165 no 0.36 0.10 0.06 0.00 0.32 0.09 0.00 20130242 4/9/2013 Shoup Bay spot 8 8 -0.03 14521 no 0.27 0.12 0.00 0.00 0.42 0.19 0.00
20130259 4/10/2013 Jack Bay pink 58 58 -0.02 2279 no 0.45 0.00 0.00 0.00 0.26 0.28 0.00 20130264 4/10/2013 Anderson pink 35 35 0.15 0 no 0.80 0.00 0.00 0.00 0.20 0.00 0.00 20130265 4/10/2013 Anderson pink 4065 4050 0.62 7112 oil 0.01 0.02 0.26 0.15 0.34 0.19 0.03 20130268 4/10/2013 AMT E pink 564 564 0.63 834 oil 0.30 0.10 0.16 0.02 0.37 0.05 0.00
20130269 4/10/2013 AMT E deep pink 119 119 0.25 1607 ? 0.13 0.03 0.15 0.00 0.65 0.04 0.00 20130270 4/10/2013 AMT E deep pink 121 121 0.37 936 unknown 0.22 0.00 0.00 0.13 0.31 0.27 0.07 20130271 4/10/2013 AMT E deep pink 30 30 0.32 874 no 0.34 0.00 0.00 0.00 0.52 0.14 0.00 20130272 4/10/2013 AMT E deep pink 61 61 0.28 2471 no 0.46 0.00 0.00 0.00 0.49 0.05 0.00
14
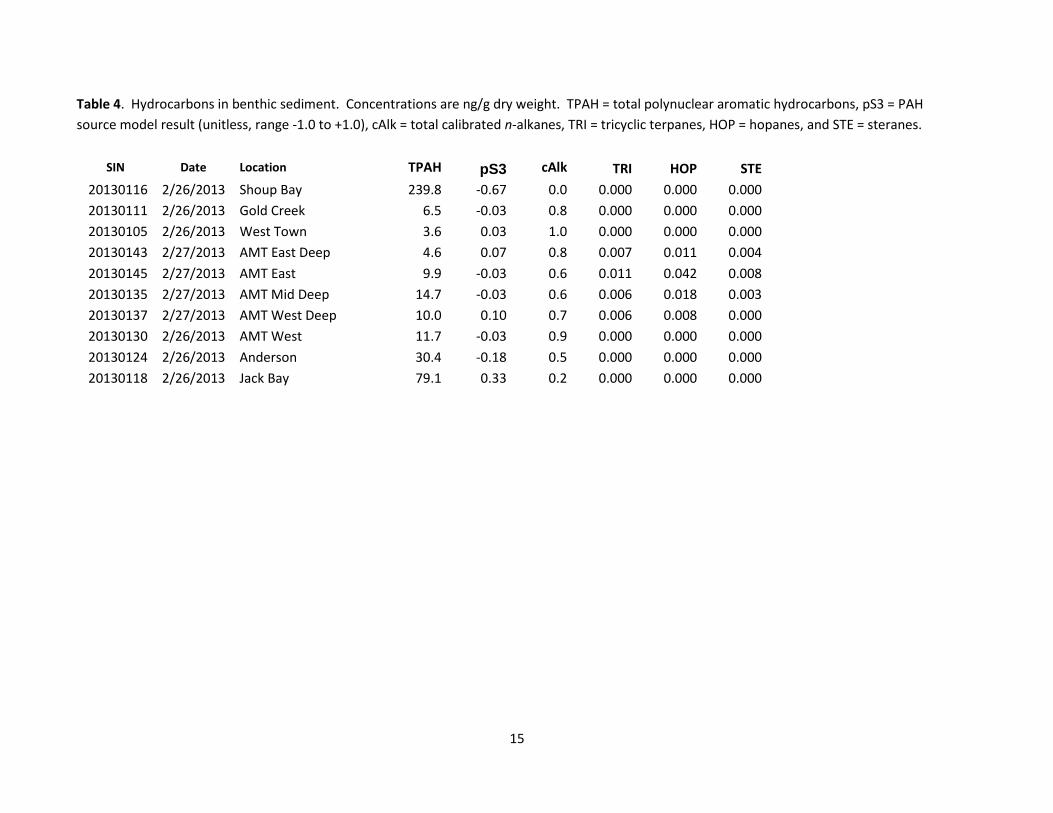
Table 4. Hydrocarbons in benthic sediment. Concentrations are ng/g dry weight. TPAH = total polynuclear aromatic hydrocarbons, pS3 = PAH source model result (unitless, range -1.0 to +1.0), cAlk = total calibrated n-alkanes, TRI = tricyclic terpanes, HOP = hopanes, and STE = steranes.
SIN Date Location TPAH pS3 cAlk TRI HOP STE 20130116 2/26/2013 Shoup Bay 239.8 -0.67 0.0 0.000 0.000 0.000 20130111 2/26/2013 Gold Creek 6.5 -0.03 0.8 0.000 0.000 0.000 20130105 2/26/2013 West Town 3.6 0.03 1.0 0.000 0.000 0.000 20130143 2/27/2013 AMT East Deep 4.6 0.07 0.8 0.007 0.011 0.004 20130145 2/27/2013 AMT East 9.9 -0.03 0.6 0.011 0.042 0.008 20130135 2/27/2013 AMT Mid Deep 14.7 -0.03 0.6 0.006 0.018 0.003 20130137 2/27/2013 AMT West Deep 10.0 0.10 0.7 0.006 0.008 0.000 20130130 2/26/2013 AMT West 11.7 -0.03 0.9 0.000 0.000 0.000 20130124 2/26/2013 Anderson 30.4 -0.18 0.5 0.000 0.000 0.000 20130118 2/26/2013 Jack Bay 79.1 0.33 0.2 0.000 0.000 0.000
15
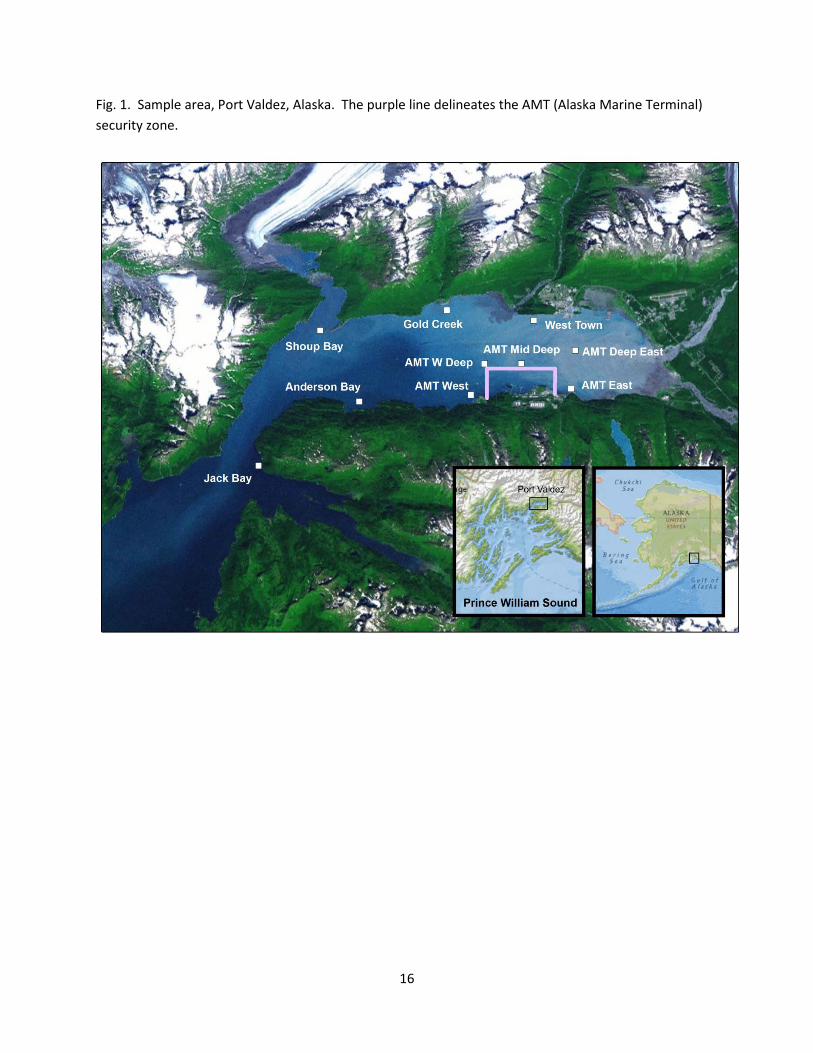
Fig. 1. Sample area, Port Valdez, Alaska. The purple line delineates the AMT (Alaska Marine Terminal) security zone.
16
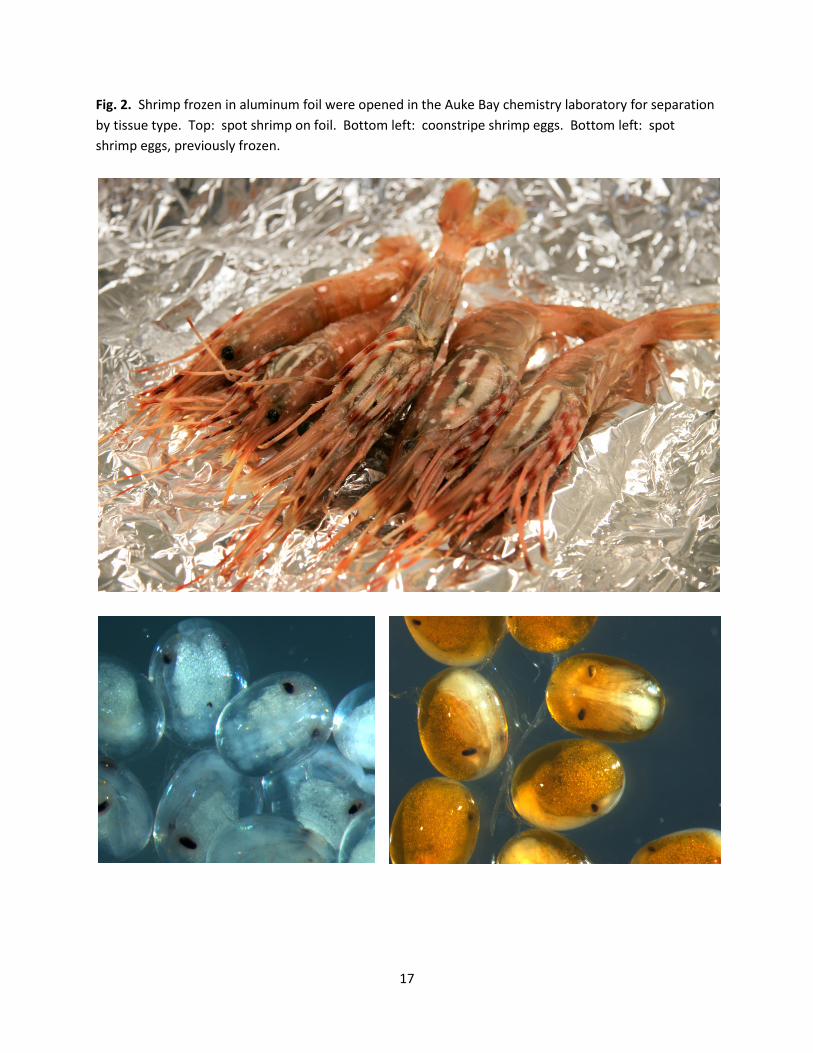
Fig. 2. Shrimp frozen in aluminum foil were opened in the Auke Bay chemistry laboratory for separation by tissue type. Top: spot shrimp on foil. Bottom left: coonstripe shrimp eggs. Bottom left: spot shrimp eggs, previously frozen.
17
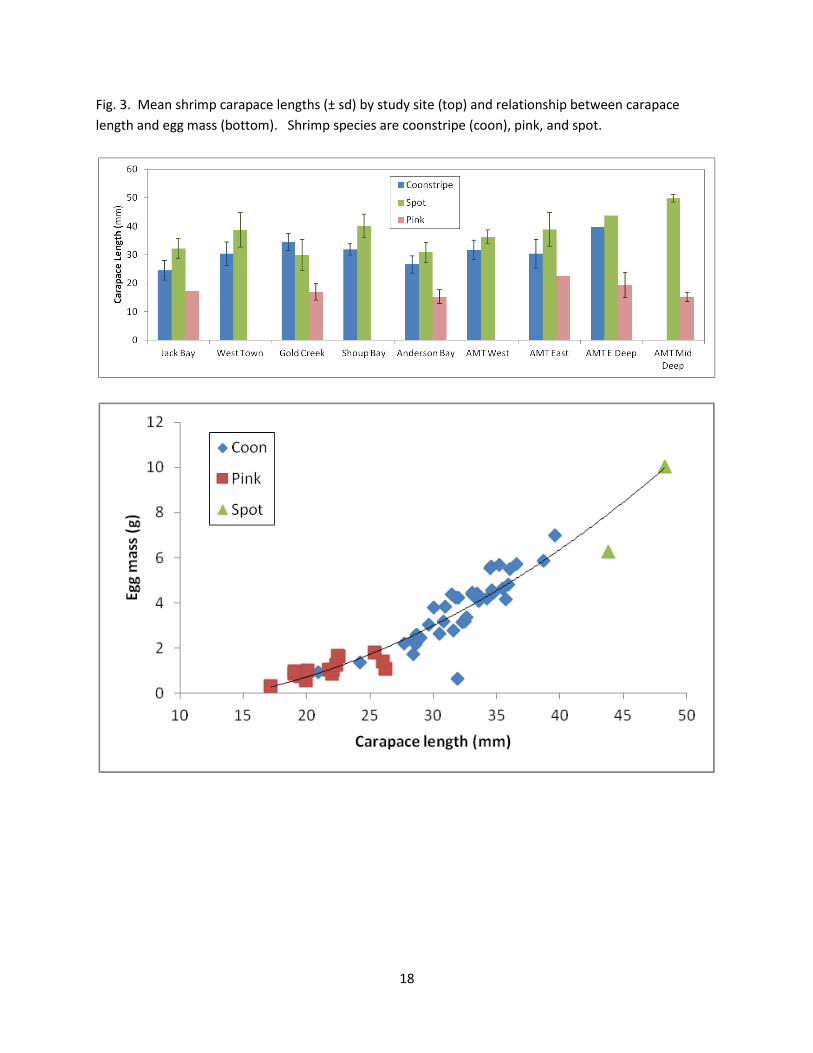
Fig. 3. Mean shrimp carapace lengths (± sd) by study site (top) and relationship between carapace length and egg mass (bottom). Shrimp species are coonstripe (coon), pink, and spot.
18
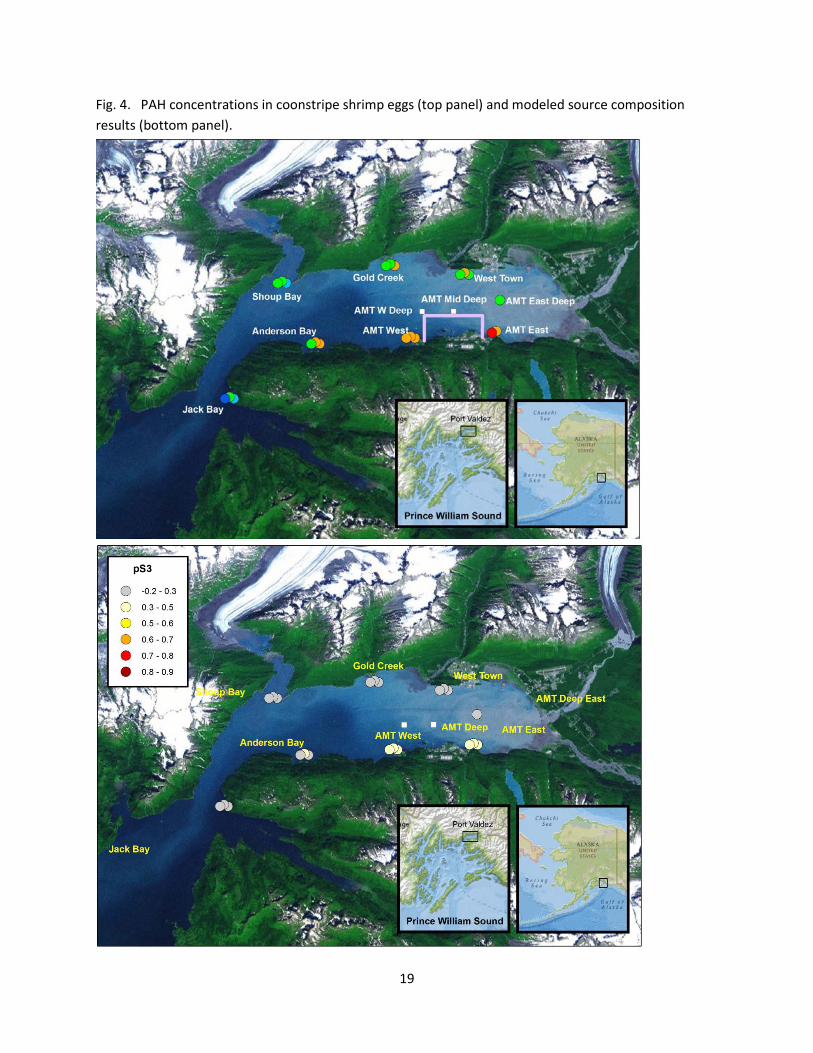
Fig. 4. PAH concentrations in coonstripe shrimp eggs (top panel) and modeled source composition results (bottom panel).
19

Fig. 5a. Shrimp egg PCA. Composition of all PAHs was analyzed by Principal Components Analysis (PCA), providing insight into the presence (or absence) of oil constituents, weathering, and geographic patterns. Circles represent coonstripe shrimp, triangles spot shrimp, and squares pink shrimp. Locations are identified by color. Numbers refer to example chromatograms in Fig. 6. The x-axis is PCA component 1, and the y-axis is PCA component 2.
-5
-3
-1
1
3
5
-3 2 7 12 17
Com
pone
nt 2
Component 1
ShoupGold CrW TownAMT Deep EAMT EAMT WAndersonJack
1
2
6
43
5
7
8
20

Fig. 5b. Note that composition in shrimp eggs is consistent with composition previously observed in PEMDs (Fig. 5a). This is a second, independent PCA run, with PEMDs included. Note also that the y-axis is reversed so that top-to-bottom ordering is the same as in Fig. 5a. The PEMDs, which were deployed primarily in the AMT area are located in the region where oil was detected in eggs. The x-axis is PCA component 1, and the y-axis is PCA component 2.
Fig. 5c. Zoomed view of the central point cloud.
-5
-3
-1
1
3
5
-3 7 17 27 37
Com
pone
nt 2
Component 1ShoupGold CrW TownAMT Deep EAMT EAMT WAndersonJackW Town spotShoup spotJack pinkAnderson pinkAMT E pinkAMT Deep EPEMDs
-5
-3
-1
1
3
5
-2 -1 0 1 2
Com
pone
nt 2
Component 1
21
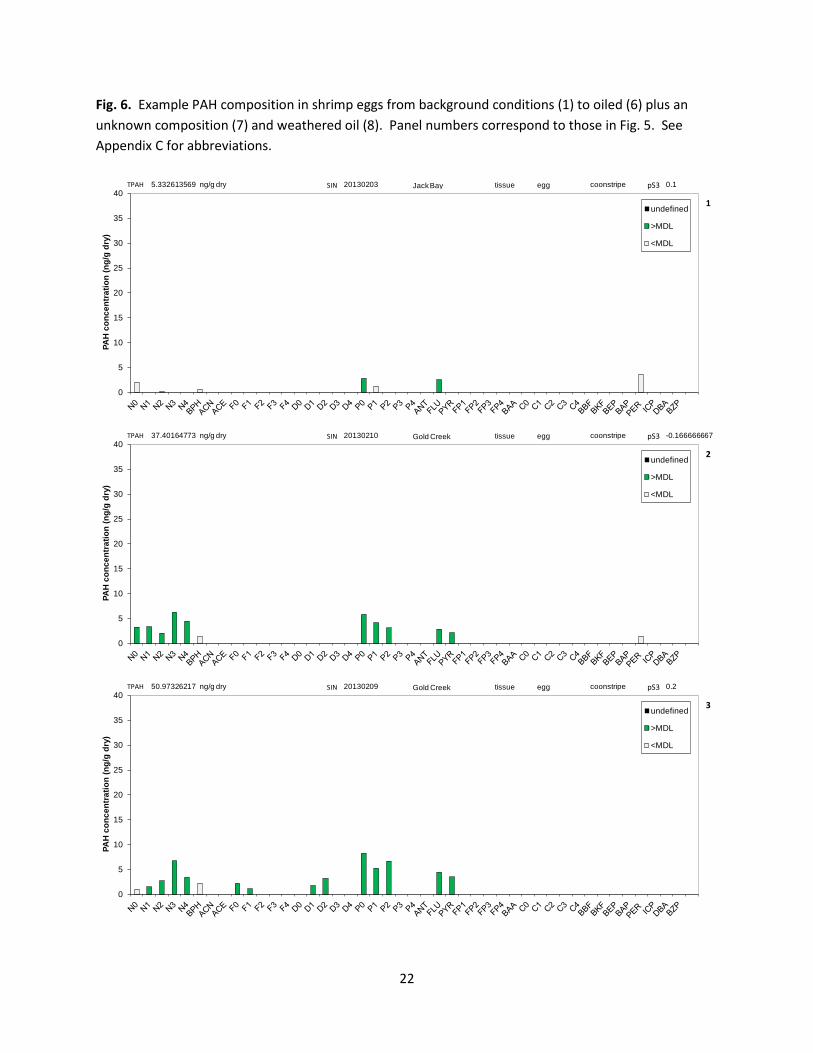
Fig. 6. Example PAH composition in shrimp eggs from background conditions (1) to oiled (6) plus an unknown composition (7) and weathered oil (8). Panel numbers correspond to those in Fig. 5. See Appendix C for abbreviations.
0
5
10
15
20
25
30
35
40
PAH
con
cent
ratio
n (n
g/g
dry)
undefined
>MDL
<MDL
0.15.332613569TPAH SIN pS320130203 Jack Bay tissue egg coonstripeng/g dry
1
0
5
10
15
20
25
30
35
40
PAH
con
cent
ratio
n (n
g/g
dry)
undefined
>MDL
<MDL
-0.16666666737.40164773TPAH SIN pS320130210 Gold Creek tissue egg coonstripeng/g dry
2
0
5
10
15
20
25
30
35
40
PAH
con
cent
ratio
n (n
g/g
dry)
undefined
>MDL
<MDL
0.250.97326217TPAH SIN pS320130209 Gold Creek tissue egg coonstripeng/g dry
3
22
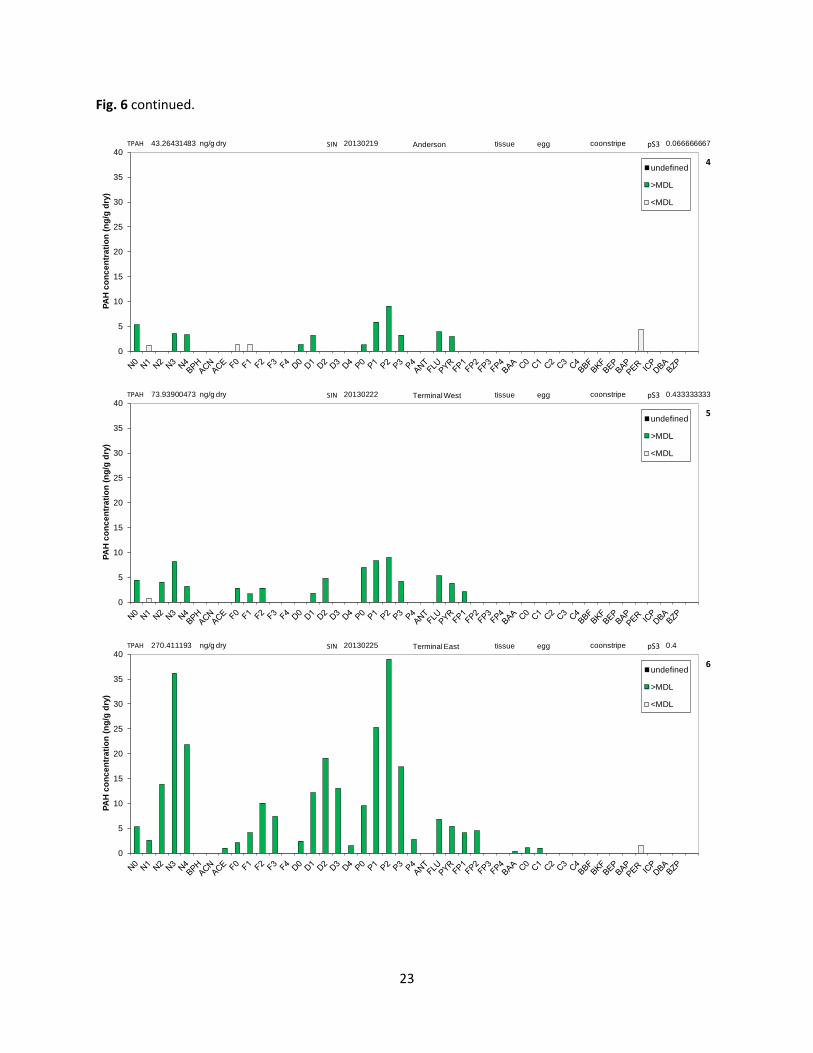
Fig. 6 continued.
0
5
10
15
20
25
30
35
40
PAH
con
cent
ratio
n (n
g/g
dry)
undefined
>MDL
<MDL
0.06666666743.26431483TPAH SIN pS320130219 Anderson tissue egg coonstripeng/g dry
4
0
5
10
15
20
25
30
35
40
PAH
con
cent
ratio
n (n
g/g
dry)
undefined
>MDL
<MDL
0.43333333373.93900473TPAH SIN pS320130222 Terminal West tissue egg coonstripeng/g dry
5
0
5
10
15
20
25
30
35
40
PAH
con
cent
ratio
n (n
g/g
dry)
undefined
>MDL
<MDL
0.4270.411193TPAH SIN pS320130225 Terminal East tissue egg coonstripeng/g dry
6
23
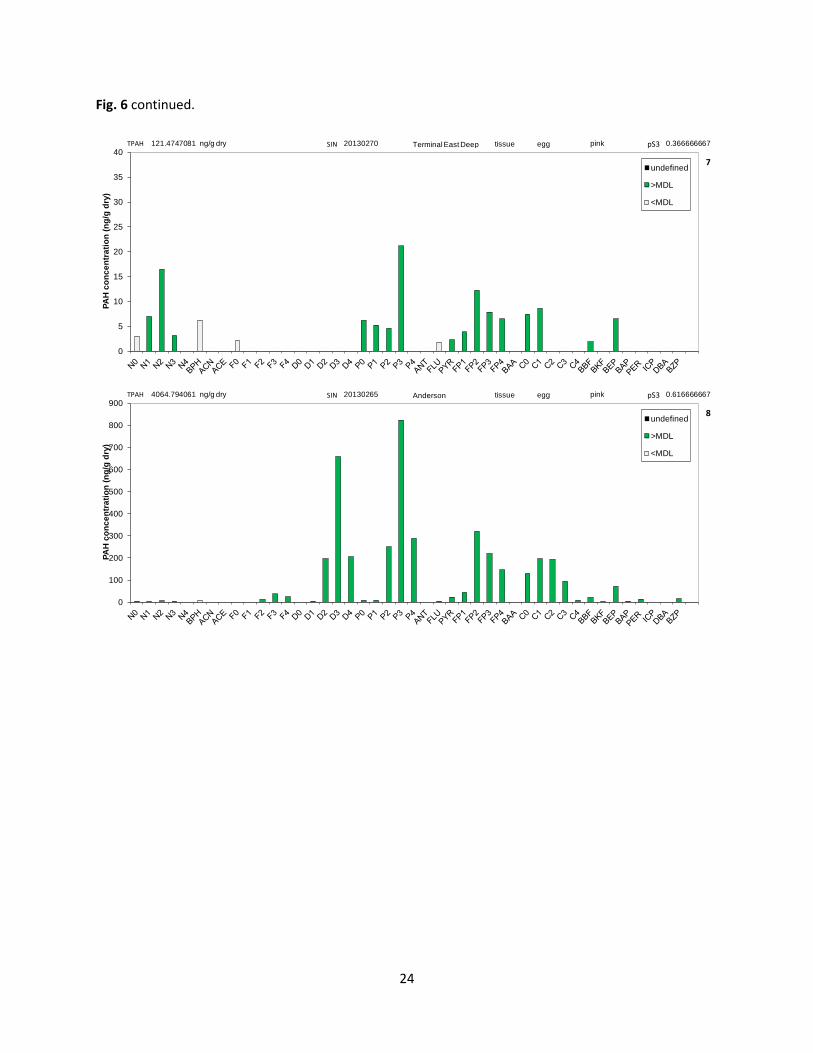
Fig. 6 continued.
0
5
10
15
20
25
30
35
40
PAH
con
cent
ratio
n (n
g/g
dry)
undefined
>MDL
<MDL
0.366666667121.4747081TPAH SIN pS320130270 Terminal East Deep tissue egg pinkng/g dry
7
0
100
200
300
400
500
600
700
800
900
PAH
con
cent
ratio
n (n
g/g
dry)
undefined
>MDL
<MDL
0.6166666674064.794061TPAH SIN pS320130265 Anderson tissue egg pinkng/g dry
8
24
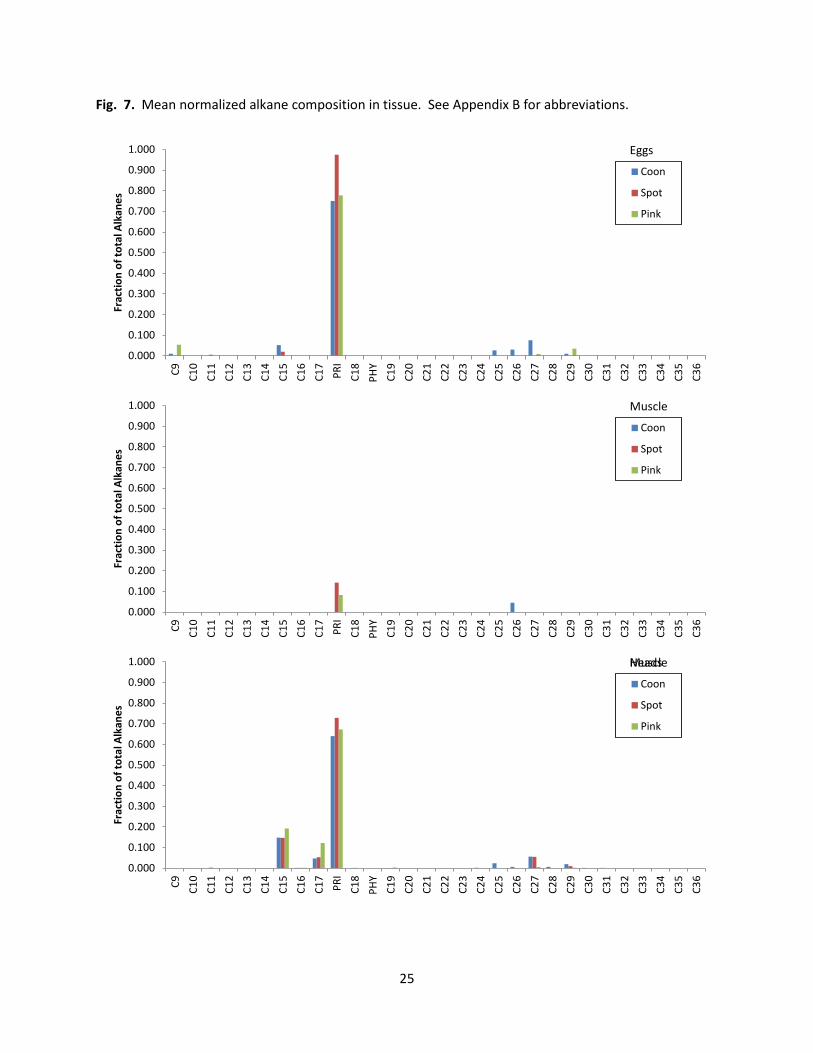
Fig. 7. Mean normalized alkane composition in tissue. See Appendix B for abbreviations.
0.000
0.100
0.200
0.300
0.400
0.500
0.600
0.700
0.800
0.900
1.000
C9 C10
C11
C12
C13
C14
C15
C16
C17
PRI
C18
PHY
C19
C20
C21
C22
C23
C24
C25
C26
C27
C28
C29
C30
C31
C32
C33
C34
C35
C36
Frac
tion
of to
tal A
lkan
es
Coon
Spot
Pink
Eggs
0.000
0.100
0.200
0.300
0.400
0.500
0.600
0.700
0.800
0.900
1.000
C9 C10
C11
C12
C13
C14
C15
C16
C17
PRI
C18
PHY
C19
C20
C21
C22
C23
C24
C25
C26
C27
C28
C29
C30
C31
C32
C33
C34
C35
C36
Frac
tion
of to
tal A
lkan
es
Coon
Spot
Pink
Muscle
0.000
0.100
0.200
0.300
0.400
0.500
0.600
0.700
0.800
0.900
1.000
C9 C10
C11
C12
C13
C14
C15
C16
C17
PRI
C18
PHY
C19
C20
C21
C22
C23
C24
C25
C26
C27
C28
C29
C30
C31
C32
C33
C34
C35
C36
Frac
tion
of to
tal A
lkan
es
Coon
Spot
Pink
HeadsMuscle
25
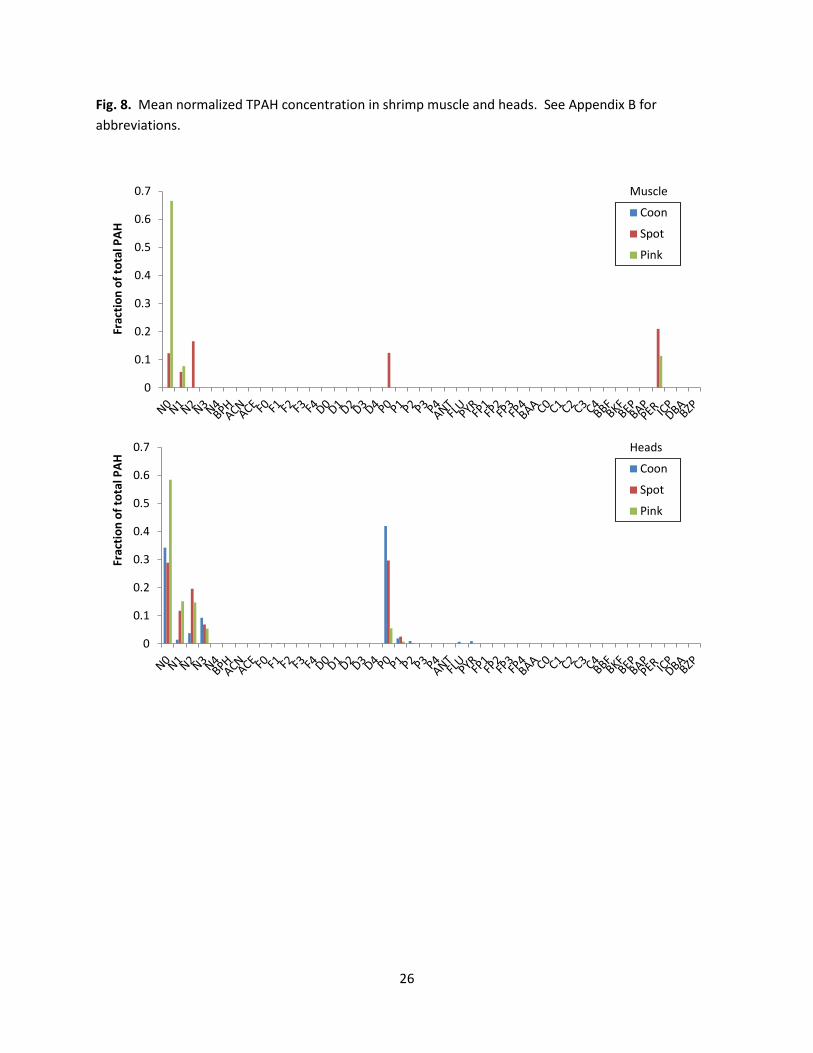
Fig. 8. Mean normalized TPAH concentration in shrimp muscle and heads. See Appendix B for abbreviations.
0
0.1
0.2
0.3
0.4
0.5
0.6
0.7
Frac
tion
of to
tal P
AH
Coon
Spot
Pink
Muscle
0
0.1
0.2
0.3
0.4
0.5
0.6
0.7
Frac
tion
of to
tal P
AH Coon
Spot
Pink
Heads
26
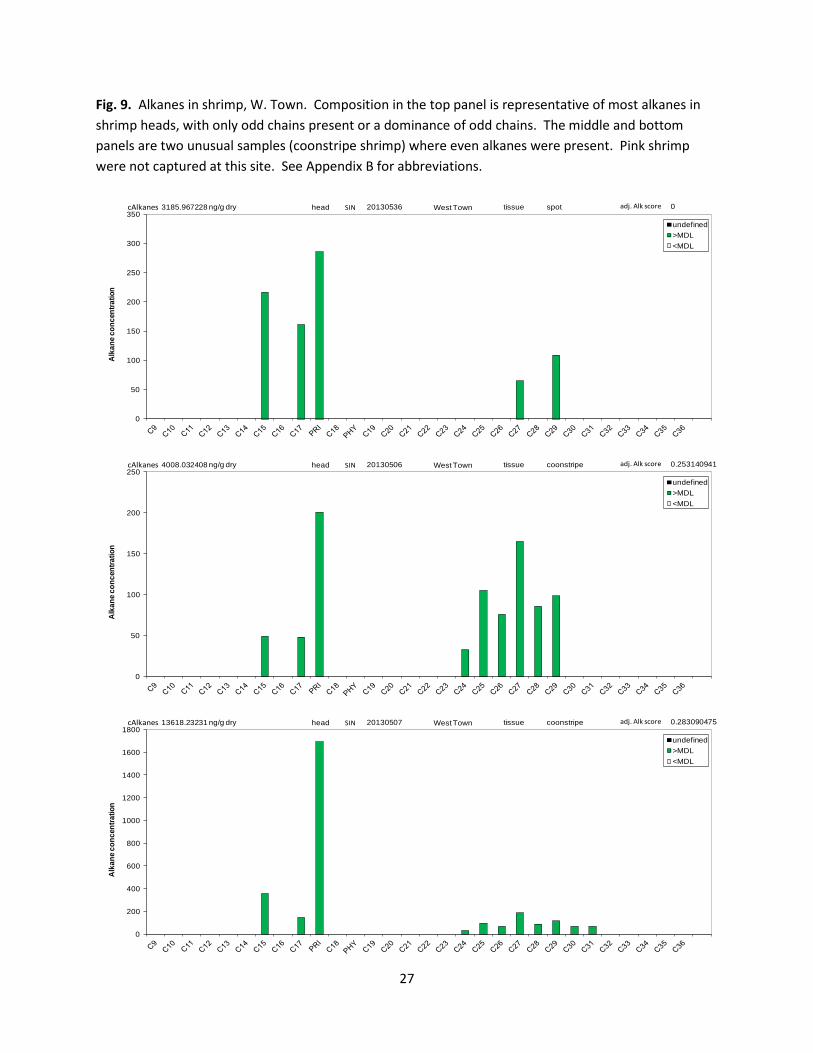
Fig. 9. Alkanes in shrimp, W. Town. Composition in the top panel is representative of most alkanes in shrimp heads, with only odd chains present or a dominance of odd chains. The middle and bottom panels are two unusual samples (coonstripe shrimp) where even alkanes were present. Pink shrimp were not captured at this site. See Appendix B for abbreviations.
0
50
100
150
200
250
300
350
Alka
ne co
ncen
tratio
n
undefined>MDL<MDL
3185.967228cAlkanes head SIN 20130536ng/g dry West Town tissue spot adj. Alk score 0
0
50
100
150
200
250
Alka
ne co
ncen
tratio
n
undefined>MDL<MDL
4008.032408cAlkanes head SIN 20130506ng/g dry West Town tissue coonstripe adj. Alk score 0.253140941
0
200
400
600
800
1000
1200
1400
1600
1800
Alka
ne co
ncen
tratio
n
undefined>MDL<MDL
13618.23231cAlkanes head SIN 20130507ng/g dry West Town tissue coonstripe adj. Alk score 0.283090475
27
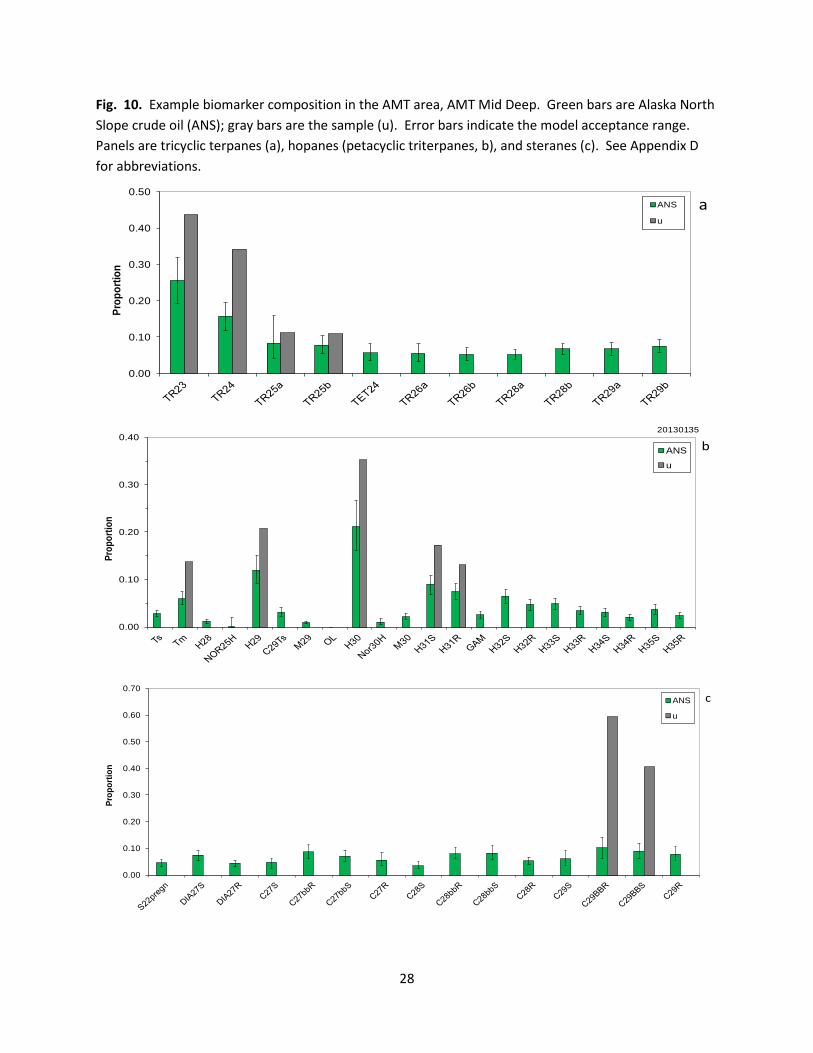
Fig. 10. Example biomarker composition in the AMT area, AMT Mid Deep. Green bars are Alaska North Slope crude oil (ANS); gray bars are the sample (u). Error bars indicate the model acceptance range. Panels are tricyclic terpanes (a), hopanes (petacyclic triterpanes, b), and steranes (c). See Appendix D for abbreviations.
0.00
0.10
0.20
0.30
0.40
0.50
Prop
ortio
n
ANS
u
a
0.00
0.10
0.20
0.30
0.40
Prop
ortio
n
ANS
u
b20130135
0.00
0.10
0.20
0.30
0.40
0.50
0.60
0.70
Prop
ortio
n
ANS
u
c
28
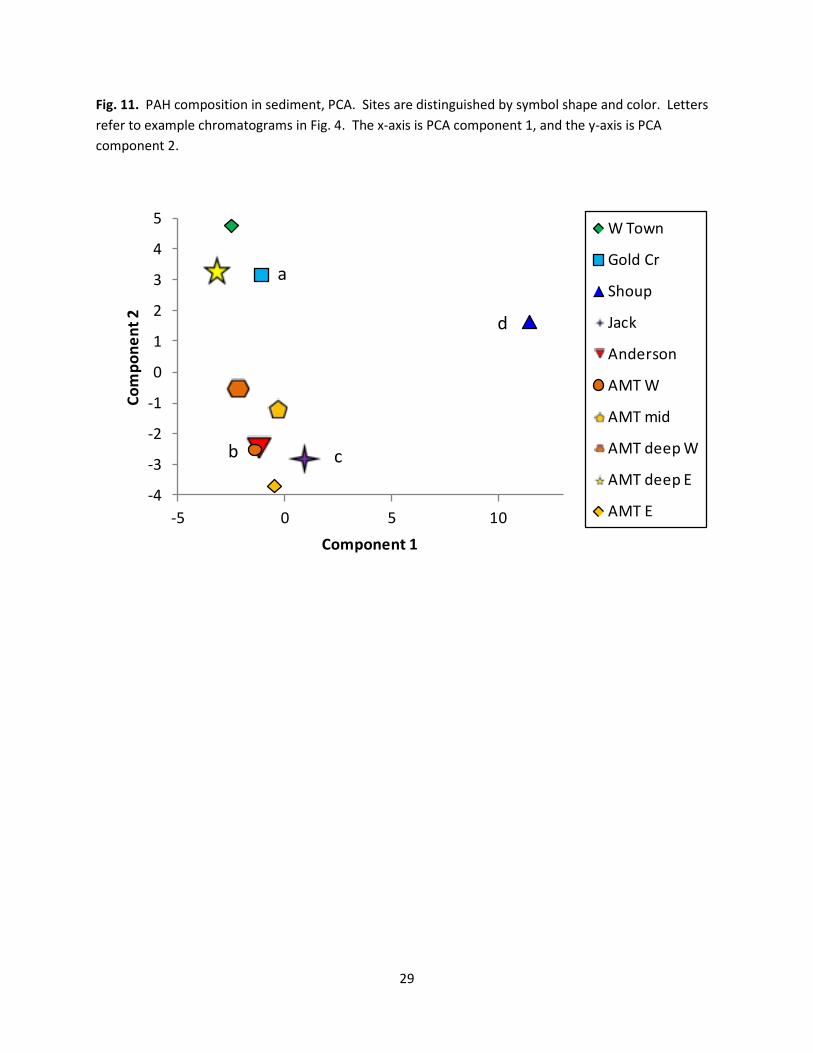
Fig. 11. PAH composition in sediment, PCA. Sites are distinguished by symbol shape and color. Letters refer to example chromatograms in Fig. 4. The x-axis is PCA component 1, and the y-axis is PCA component 2.
-4
-3
-2
-1
0
1
2
3
4
5
-5 0 5 10
Com
pone
nt 2
Component 1
W Town
Gold Cr
Shoup
Jack
Anderson
AMT W
AMT mid
AMT deep W
AMT deep E
AMT E
a
b c
d
29
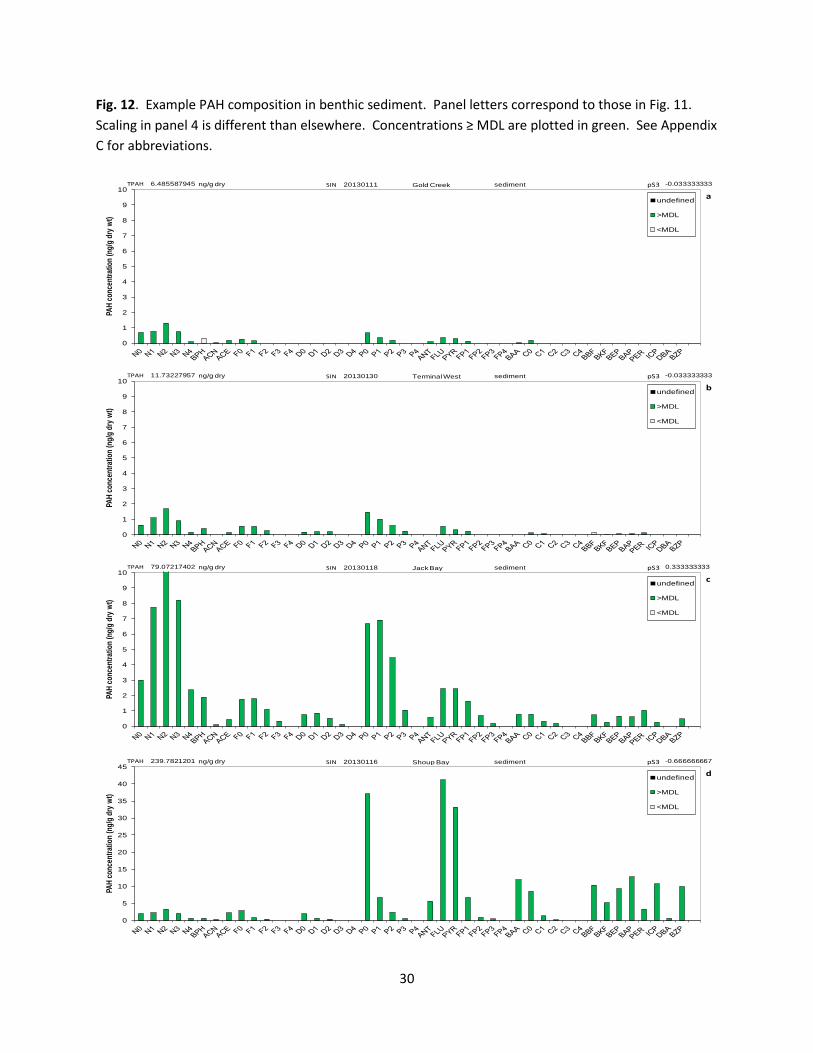
Fig. 12. Example PAH composition in benthic sediment. Panel letters correspond to those in Fig. 11. Scaling in panel 4 is different than elsewhere. Concentrations ≥ MDL are plotted in green. See Appendix C for abbreviations.
0
1
2
3
4
5
6
7
8
9
10
PAH
conc
entra
tion
(ng/
g dr
y wt
)
undefined
>MDL
<MDL
-0.0333333336.485587945TPAH SIN pS320130111 Gold Creek sedimentng/g dry
a
0
1
2
3
4
5
6
7
8
9
10
PAH
conc
entra
tion
(ng/
g dr
y wt
)
undefined
>MDL
<MDL
-0.03333333311.73227957TPAH SIN pS320130130 Terminal West sedimentng/g dry
b
0
1
2
3
4
5
6
7
8
9
10
PAH
conc
entra
tion
(ng/
g dr
y wt
)
undefined
>MDL
<MDL
0.33333333379.07217402TPAH SIN pS320130118 Jack Bay sedimentng/g dry
c
0
5
10
15
20
25
30
35
40
45
PAH
conc
entra
tion
(ng/
g dr
y wt
)
undefined
>MDL
<MDL
-0.666666667239.7821201TPAH SIN pS320130116 Shoup Bay sedimentng/g dry
d
30


![Polycyclic aromatic hydrocarbons (PAH) guidance · Polycyclic aromatic hydrocarbons (Benzo[a]pyrene) General Information Key Points Identity The term polycyclic aromatic hydrocarbons](https://img.dokumen.tips/doc/110x75/5af498db7f8b9a8d1c8c6b2b/polycyclic-aromatic-hydrocarbons-pah-guidance-aromatic-hydrocarbons-benzoapyrene.jpg)