Embed Size (px)
Citation preview
Discharge at Partial-Record Stations and Miscellaneous Sites 199
Discharge at Partial-Record Stations and Miscellaneous SitesAs the number of streams on which streamflow information is likely to be desired far exceeds the number of stream-gaging
stations feasible to operate at one time, the USGS collects limited streamflow data at sites other than stream-gaging stations. When limited streamflow data are collected on a systematic basis over a period of years for use in hydrologic analyses, the site at which the data are collected is called a partial-record station. Data collected at these partial-record stations are usable in low-flow or flood-flow analyses, depending on the type of data collected. In addition, discharge measurements are made at other sites not included in the partial-record program. These measurements are generally made in times of drought or flood to give better areal coverage to those events. Those measurements and others collected for some special reason are called measurements at miscellaneous sites.
Records collected at crest-stage partial-record stations are presented in the following table. Discharge measurements made at low-flow partial-record sites and at miscellaneous sites for special studies are given in separate tables in Volume 2 of this report.
Great
Mia
mi
River
SciotoR
iver
River
Mahoning
River
Sevenmile
CreekGreenvilleCreek
Stillwater
River
SciotoR
iver
Paint
Creek
Alum
Creek
Olentangy R
iver
West
Branch
Pym
atuning
Creek
SenecaFork
Wills
Creek
Muskingum
Licking
River
Walhonding River
Moh
ican
Riv
er
ClearFork
Black
Fork
TuscarawasRiver
Sugar Creek
Stillwater
Creek
Conotton Creek
WolfCreek
Bokenge
halas
Creek
Deer
Creek
Mad
Rive
r
Crawford Richland
LoganShelby
Darke Miami
Champaign
Clark
GreenePreble
Butler Warren Clinton
Fayette Pickaway
Madiso
n Franklin
Fairfield Perry
Hocking
Athens
Washington
Morgan
NobleMonroe
Muskingum
Licking
Union Delaware
Marion MorrowKnox
Holmes
Wayne Stark
Medina Porta
ge
Mahoning
Trumbull
Harrison
Carroll
Columbiana
Coshocton
Guernsey
Belmont
Highland
Brown
Scioto
Lawrence
Pike
Ross Vinton
MeigsJackson
Gallia
Hamilton
Hardin
Mercer
Montgomery
Ashla
nd
Tusc
araw
as
Jeffe
rson
Clermont
Adams
IND
IAN
A
41o
40o
84o
83o
39o
82o
81o
OHIO
RIVER
PE
NN
SY
LVA
NIA
0 20
20
40 MILES
40 KILOMETERS0
Study Area
OHIO
03086500
03271500
03234000
0314750003141500
0313500003131500
03133500
03126000
0312700003128500
03122500
03102950
03120500
0323090003230700
03115973
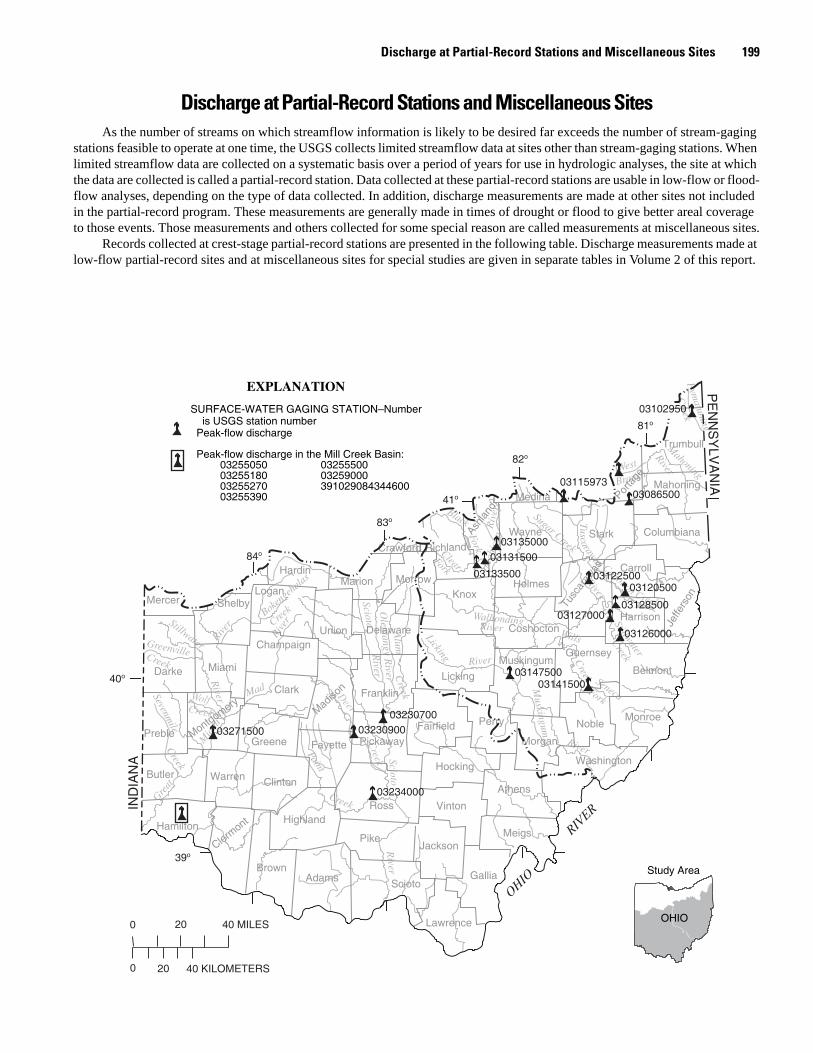
EXPLANATION
SURFACE-WATER GAGING STATION–Number is USGS station number Peak-flow discharge
Peak-flow discharge in the Mill Creek Basin: 03255050 03255500 03255180 03259000 03255270 391029084344600 03255390
200 Water Resources Data—Ohio, 2005—Volume 1
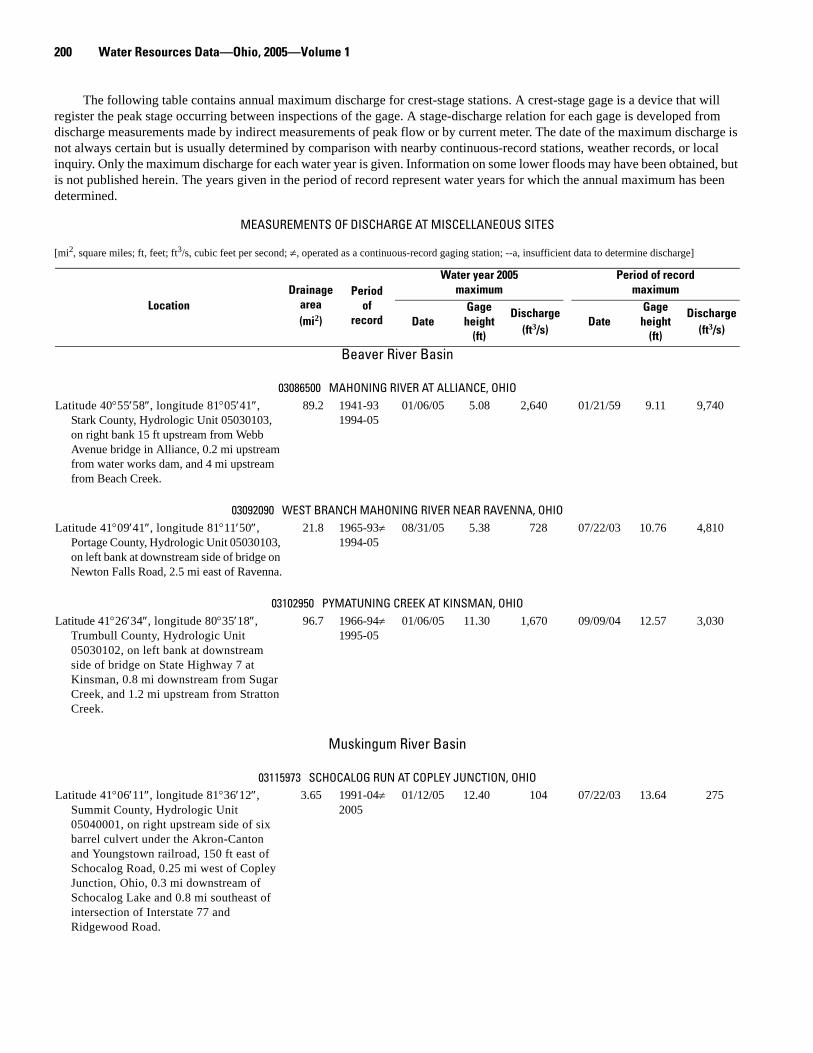
The following table contains annual maximum discharge for crest-stage stations. A crest-stage gage is a device that will register the peak stage occurring between inspections of the gage. A stage-discharge relation for each gage is developed from discharge measurements made by indirect measurements of peak flow or by current meter. The date of the maximum discharge is not always certain but is usually determined by comparison with nearby continuous-record stations, weather records, or local inquiry. Only the maximum discharge for each water year is given. Information on some lower floods may have been obtained, but is not published herein. The years given in the period of record represent water years for which the annual maximum has been determined.
MEASUREMENTS OF DISCHARGE AT MISCELLANEOUS SITES
[mi2, square miles; ft, feet; ft3/s, cubic feet per second; ≠, operated as a continuous-record gaging station; --a, insufficient data to determine discharge]
LocationDrainage
area(mi2)
Periodof
record
Water year 2005maximum
Period of recordmaximum
DateGage
height(ft)
Discharge(ft3/s)
DateGage height
(ft)
Discharge(ft3/s)
Beaver River Basin
03086500 MAHONING RIVER AT ALLIANCE, OHIOLatitude 40°55′58″, longitude 81°05′41″,
Stark County, Hydrologic Unit 05030103, on right bank 15 ft upstream from Webb Avenue bridge in Alliance, 0.2 mi upstream from water works dam, and 4 mi upstream from Beach Creek.
89.2 1941-931994-05
01/06/05 5.08 2,640 01/21/59 9.11 9,740
03092090 WEST BRANCH MAHONING RIVER NEAR RAVENNA, OHIOLatitude 41°09′41″, longitude 81°11′50″,
Portage County, Hydrologic Unit 05030103, on left bank at downstream side of bridge on Newton Falls Road, 2.5 mi east of Ravenna.
21.8 1965-93≠1994-05
08/31/05 5.38 728 07/22/03 10.76 4,810
03102950 PYMATUNING CREEK AT KINSMAN, OHIOLatitude 41°26′34″, longitude 80°35′18″,
Trumbull County, Hydrologic Unit 05030102, on left bank at downstream side of bridge on State Highway 7 at Kinsman, 0.8 mi downstream from Sugar Creek, and 1.2 mi upstream from Stratton Creek.
96.7 1966-94≠1995-05
01/06/05 11.30 1,670 09/09/04 12.57 3,030
Muskingum River Basin
03115973 SCHOCALOG RUN AT COPLEY JUNCTION, OHIOLatitude 41°06′11″, longitude 81°36′12″,
Summit County, Hydrologic Unit 05040001, on right upstream side of six barrel culvert under the Akron-Canton and Youngstown railroad, 150 ft east of Schocalog Road, 0.25 mi west of Copley Junction, Ohio, 0.3 mi downstream of Schocalog Lake and 0.8 mi southeast of intersection of Interstate 77 and Ridgewood Road.
3.65 1991-04≠2005
01/12/05 12.40 104 07/22/03 13.64 275
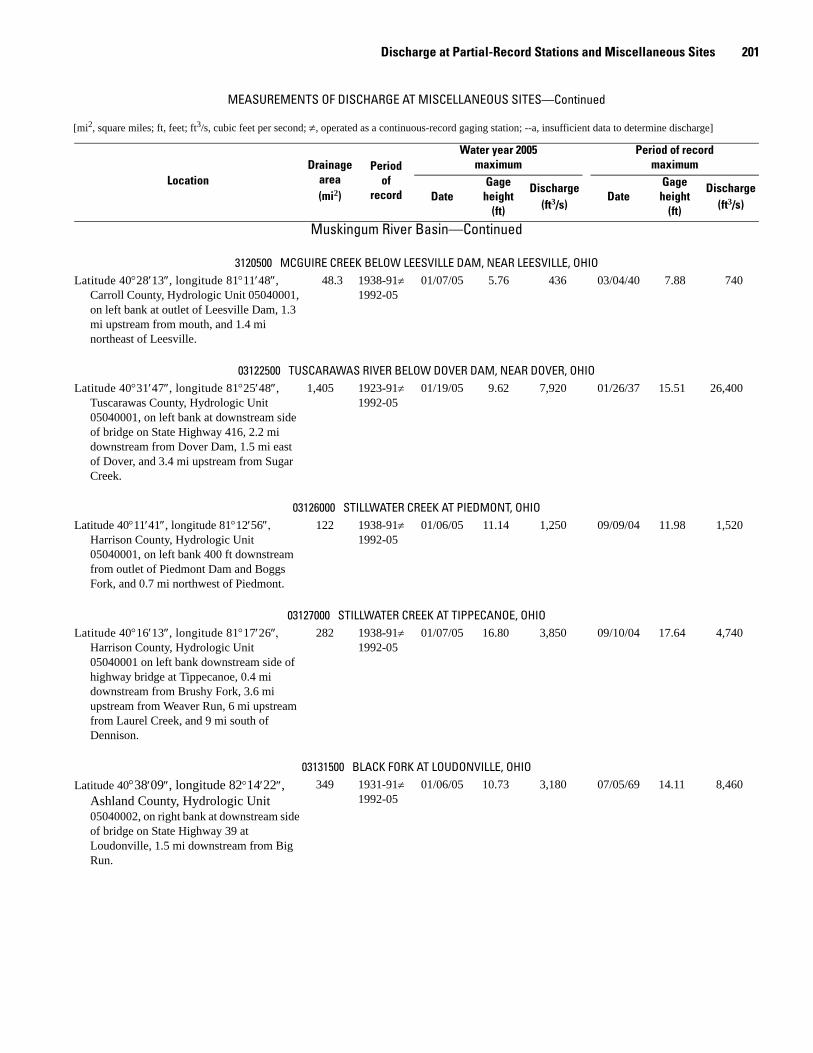
Discharge at Partial-Record Stations and Miscellaneous Sites 201
Muskingum River Basin—Continued
3120500 MCGUIRE CREEK BELOW LEESVILLE DAM, NEAR LEESVILLE, OHIOLatitude 40°28′13″, longitude 81°11′48″,
Carroll County, Hydrologic Unit 05040001, on left bank at outlet of Leesville Dam, 1.3 mi upstream from mouth, and 1.4 mi northeast of Leesville.
48.3 1938-91≠ 1992-05
01/07/05 5.76 436 03/04/40 7.88 740
03122500 TUSCARAWAS RIVER BELOW DOVER DAM, NEAR DOVER, OHIOLatitude 40°31′47″, longitude 81°25′48″,
Tuscarawas County, Hydrologic Unit 05040001, on left bank at downstream side of bridge on State Highway 416, 2.2 mi downstream from Dover Dam, 1.5 mi east of Dover, and 3.4 mi upstream from Sugar Creek.
1,405 1923-91≠ 1992-05
01/19/05 9.62 7,920 01/26/37 15.51 26,400
03126000 STILLWATER CREEK AT PIEDMONT, OHIOLatitude 40°11′41″, longitude 81°12′56″,
Harrison County, Hydrologic Unit 05040001, on left bank 400 ft downstream from outlet of Piedmont Dam and Boggs Fork, and 0.7 mi northwest of Piedmont.
122 1938-91≠ 1992-05
01/06/05 11.14 1,250 09/09/04 11.98 1,520
03127000 STILLWATER CREEK AT TIPPECANOE, OHIOLatitude 40°16′13″, longitude 81°17′26″,
Harrison County, Hydrologic Unit 05040001 on left bank downstream side of highway bridge at Tippecanoe, 0.4 mi downstream from Brushy Fork, 3.6 mi upstream from Weaver Run, 6 mi upstream from Laurel Creek, and 9 mi south of Dennison.
282 1938-91≠ 1992-05
01/07/05 16.80 3,850 09/10/04 17.64 4,740
03131500 BLACK FORK AT LOUDONVILLE, OHIOLatitude 40°38′09″, longitude 82°14′22″,
Ashland County, Hydrologic Unit 05040002, on right bank at downstream side of bridge on State Highway 39 at Loudonville, 1.5 mi downstream from Big Run.
349 1931-91≠ 1992-05
01/06/05 10.73 3,180 07/05/69 14.11 8,460
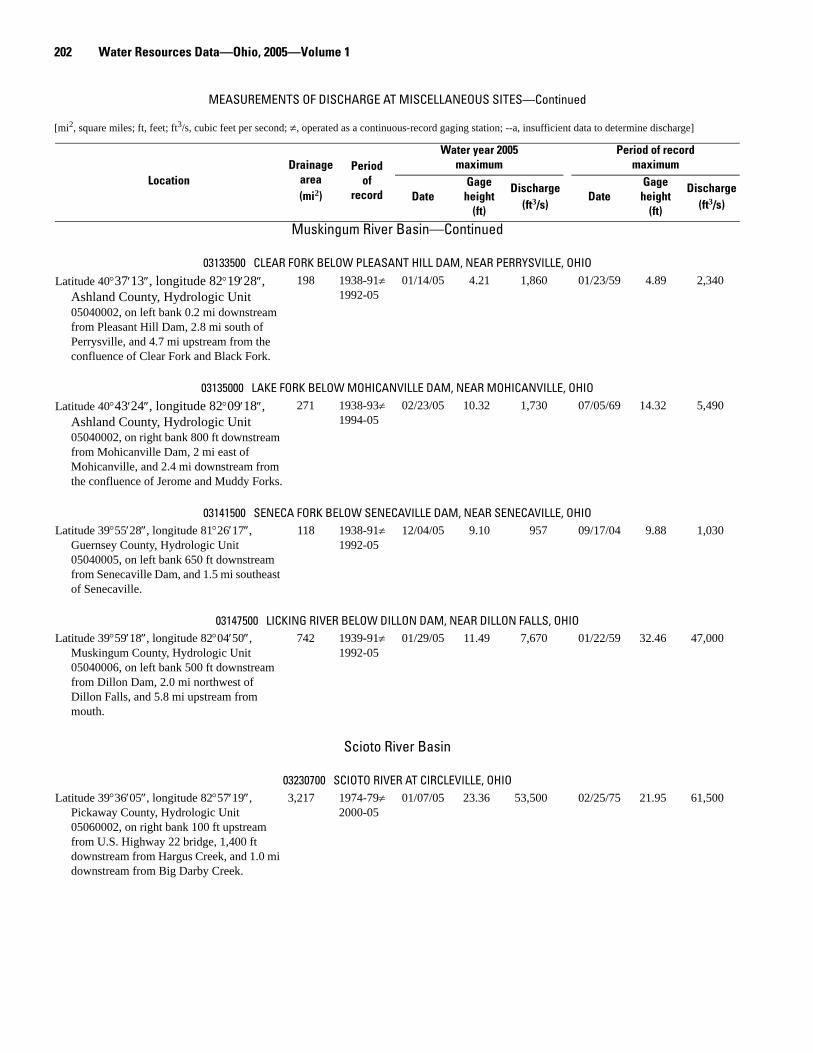
MEASUREMENTS OF DISCHARGE AT MISCELLANEOUS SITES—Continued
[mi2, square miles; ft, feet; ft3/s, cubic feet per second; ≠, operated as a continuous-record gaging station; --a, insufficient data to determine discharge]
LocationDrainage
area(mi2)
Periodof
record
Water year 2005maximum
Period of recordmaximum
DateGage
height(ft)
Discharge(ft3/s)
DateGage height
(ft)
Discharge(ft3/s)
202 Water Resources Data—Ohio, 2005—Volume 1
Muskingum River Basin—Continued
03133500 CLEAR FORK BELOW PLEASANT HILL DAM, NEAR PERRYSVILLE, OHIOLatitude 40°37′13″, longitude 82°19′28″,
Ashland County, Hydrologic Unit 05040002, on left bank 0.2 mi downstream from Pleasant Hill Dam, 2.8 mi south of Perrysville, and 4.7 mi upstream from the confluence of Clear Fork and Black Fork.
198 1938-91≠ 1992-05
01/14/05 4.21 1,860 01/23/59 4.89 2,340
03135000 LAKE FORK BELOW MOHICANVILLE DAM, NEAR MOHICANVILLE, OHIOLatitude 40°43′24″, longitude 82°09′18″,
Ashland County, Hydrologic Unit 05040002, on right bank 800 ft downstream from Mohicanville Dam, 2 mi east of Mohicanville, and 2.4 mi downstream from the confluence of Jerome and Muddy Forks.
271 1938-93≠ 1994-05
02/23/05 10.32 1,730 07/05/69 14.32 5,490
03141500 SENECA FORK BELOW SENECAVILLE DAM, NEAR SENECAVILLE, OHIOLatitude 39°55′28″, longitude 81°26′17″,
Guernsey County, Hydrologic Unit 05040005, on left bank 650 ft downstream from Senecaville Dam, and 1.5 mi southeast of Senecaville.
118 1938-91≠ 1992-05
12/04/05 9.10 957 09/17/04 9.88 1,030
03147500 LICKING RIVER BELOW DILLON DAM, NEAR DILLON FALLS, OHIOLatitude 39°59′18″, longitude 82°04′50″,
Muskingum County, Hydrologic Unit 05040006, on left bank 500 ft downstream from Dillon Dam, 2.0 mi northwest of Dillon Falls, and 5.8 mi upstream from mouth.
742 1939-91≠ 1992-05
01/29/05 11.49 7,670 01/22/59 32.46 47,000
Scioto River Basin
03230700 SCIOTO RIVER AT CIRCLEVILLE, OHIOLatitude 39°36′05″, longitude 82°57′19″,
Pickaway County, Hydrologic Unit 05060002, on right bank 100 ft upstream from U.S. Highway 22 bridge, 1,400 ft downstream from Hargus Creek, and 1.0 mi downstream from Big Darby Creek.
3,217 1974-79≠2000-05
01/07/05 23.36 53,500 02/25/75 21.95 61,500
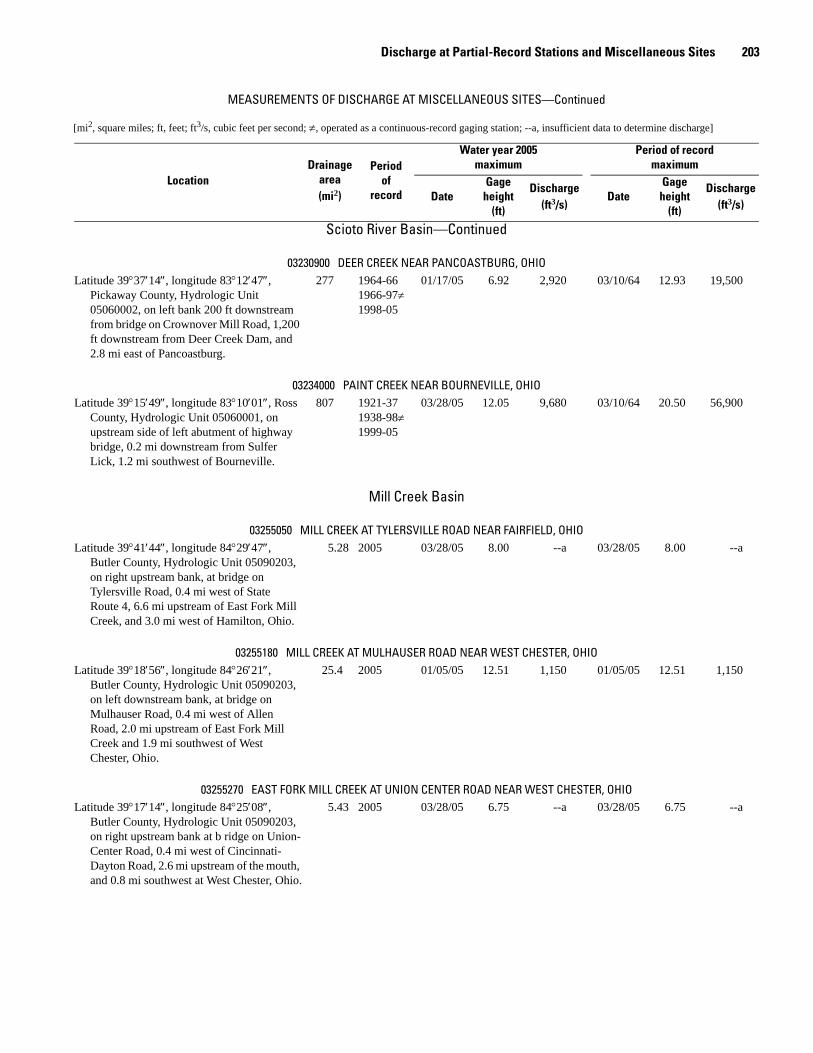
MEASUREMENTS OF DISCHARGE AT MISCELLANEOUS SITES—Continued
[mi2, square miles; ft, feet; ft3/s, cubic feet per second; ≠, operated as a continuous-record gaging station; --a, insufficient data to determine discharge]
LocationDrainage
area(mi2)
Periodof
record
Water year 2005maximum
Period of recordmaximum
DateGage
height(ft)
Discharge(ft3/s)
DateGage height
(ft)
Discharge(ft3/s)
Discharge at Partial-Record Stations and Miscellaneous Sites 203
Scioto River Basin—Continued
03230900 DEER CREEK NEAR PANCOASTBURG, OHIOLatitude 39°37′14″, longitude 83°12′47″,
Pickaway County, Hydrologic Unit 05060002, on left bank 200 ft downstream from bridge on Crownover Mill Road, 1,200 ft downstream from Deer Creek Dam, and 2.8 mi east of Pancoastburg.
277 1964-661966-97≠ 1998-05
01/17/05 6.92 2,920 03/10/64 12.93 19,500
03234000 PAINT CREEK NEAR BOURNEVILLE, OHIOLatitude 39°15′49″, longitude 83°10′01″, Ross
County, Hydrologic Unit 05060001, on upstream side of left abutment of highway bridge, 0.2 mi downstream from Sulfer Lick, 1.2 mi southwest of Bourneville.
807 1921-371938-98≠1999-05
03/28/05 12.05 9,680 03/10/64 20.50 56,900
Mill Creek Basin
03255050 MILL CREEK AT TYLERSVILLE ROAD NEAR FAIRFIELD, OHIOLatitude 39°41′44″, longitude 84°29′47″,
Butler County, Hydrologic Unit 05090203, on right upstream bank, at bridge on Tylersville Road, 0.4 mi west of State Route 4, 6.6 mi upstream of East Fork Mill Creek, and 3.0 mi west of Hamilton, Ohio.
5.28 2005 03/28/05 8.00 --a 03/28/05 8.00 --a
03255180 MILL CREEK AT MULHAUSER ROAD NEAR WEST CHESTER, OHIOLatitude 39°18′56″, longitude 84°26′21″,
Butler County, Hydrologic Unit 05090203, on left downstream bank, at bridge on Mulhauser Road, 0.4 mi west of Allen Road, 2.0 mi upstream of East Fork Mill Creek and 1.9 mi southwest of West Chester, Ohio.
25.4 2005 01/05/05 12.51 1,150 01/05/05 12.51 1,150
03255270 EAST FORK MILL CREEK AT UNION CENTER ROAD NEAR WEST CHESTER, OHIOLatitude 39°17′14″, longitude 84°25′08″,
Butler County, Hydrologic Unit 05090203, on right upstream bank at b ridge on Union-Center Road, 0.4 mi west of Cincinnati-Dayton Road, 2.6 mi upstream of the mouth, and 0.8 mi southwest at West Chester, Ohio.
5.43 2005 03/28/05 6.75 --a 03/28/05 6.75 --a
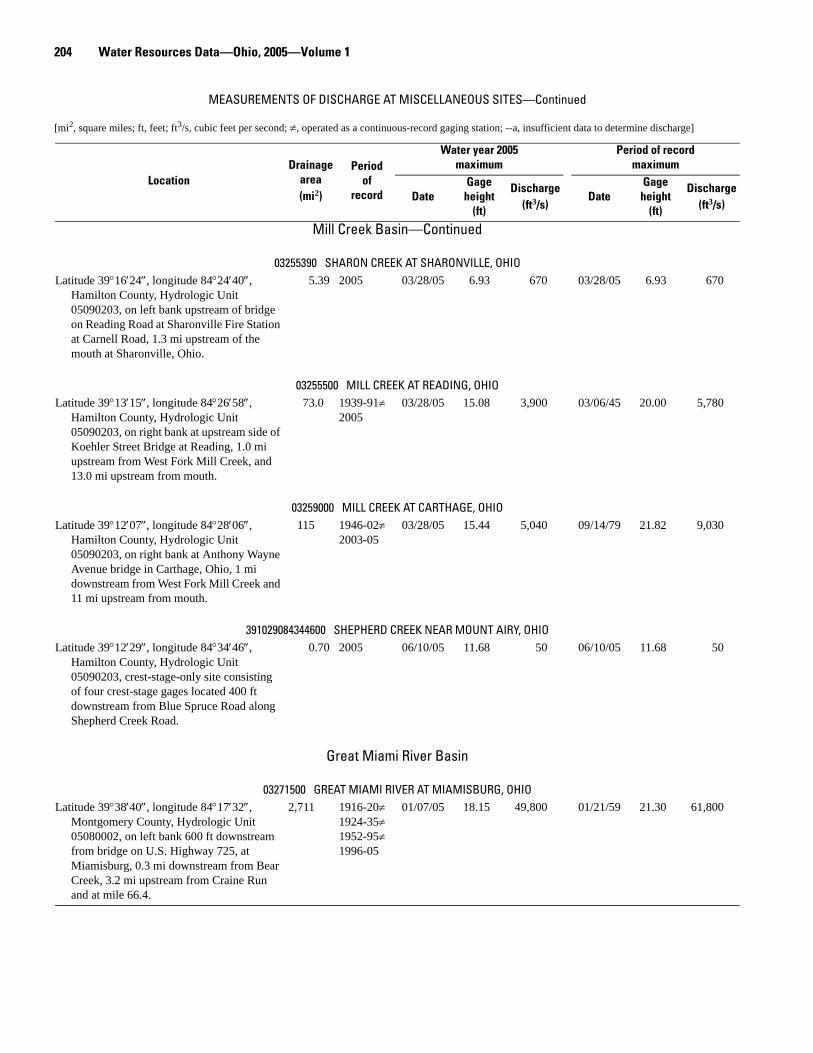
MEASUREMENTS OF DISCHARGE AT MISCELLANEOUS SITES—Continued
[mi2, square miles; ft, feet; ft3/s, cubic feet per second; ≠, operated as a continuous-record gaging station; --a, insufficient data to determine discharge]
LocationDrainage
area(mi2)
Periodof
record
Water year 2005maximum
Period of recordmaximum
DateGage
height(ft)
Discharge(ft3/s)
DateGage height
(ft)
Discharge(ft3/s)
204 Water Resources Data—Ohio, 2005—Volume 1
Mill Creek Basin—Continued
03255390 SHARON CREEK AT SHARONVILLE, OHIOLatitude 39°16′24″, longitude 84°24′40″,
Hamilton County, Hydrologic Unit 05090203, on left bank upstream of bridge on Reading Road at Sharonville Fire Station at Carnell Road, 1.3 mi upstream of the mouth at Sharonville, Ohio.
5.39 2005 03/28/05 6.93 670 03/28/05 6.93 670
03255500 MILL CREEK AT READING, OHIOLatitude 39°13′15″, longitude 84°26′58″,
Hamilton County, Hydrologic Unit 05090203, on right bank at upstream side of Koehler Street Bridge at Reading, 1.0 mi upstream from West Fork Mill Creek, and 13.0 mi upstream from mouth.
73.0 1939-91≠2005
03/28/05 15.08 3,900 03/06/45 20.00 5,780
03259000 MILL CREEK AT CARTHAGE, OHIOLatitude 39°12′07″, longitude 84°28′06″,
Hamilton County, Hydrologic Unit 05090203, on right bank at Anthony Wayne Avenue bridge in Carthage, Ohio, 1 mi downstream from West Fork Mill Creek and 11 mi upstream from mouth.
115 1946-02≠2003-05
03/28/05 15.44 5,040 09/14/79 21.82 9,030
391029084344600 SHEPHERD CREEK NEAR MOUNT AIRY, OHIOLatitude 39°12′29″, longitude 84°34′46″,
Hamilton County, Hydrologic Unit 05090203, crest-stage-only site consisting of four crest-stage gages located 400 ft downstream from Blue Spruce Road along Shepherd Creek Road.
0.70 2005 06/10/05 11.68 50 06/10/05 11.68 50
Great Miami River Basin
03271500 GREAT MIAMI RIVER AT MIAMISBURG, OHIOLatitude 39°38′40″, longitude 84°17′32″,
Montgomery County, Hydrologic Unit 05080002, on left bank 600 ft downstream from bridge on U.S. Highway 725, at Miamisburg, 0.3 mi downstream from Bear Creek, 3.2 mi upstream from Craine Run and at mile 66.4.
2,711 1916-20≠ 1924-35≠ 1952-95≠ 1996-05
01/07/05 18.15 49,800 01/21/59 21.30 61,800
MEASUREMENTS OF DISCHARGE AT MISCELLANEOUS SITES—Continued
[mi2, square miles; ft, feet; ft3/s, cubic feet per second; ≠, operated as a continuous-record gaging station; --a, insufficient data to determine discharge]
LocationDrainage
area(mi2)
Periodof
record
Water year 2005maximum
Period of recordmaximum
DateGage
height(ft)
Discharge(ft3/s)
DateGage height
(ft)
Discharge(ft3/s)
Peak Discharge and Stage at Continuous-Record Surface Discharge Stations 205
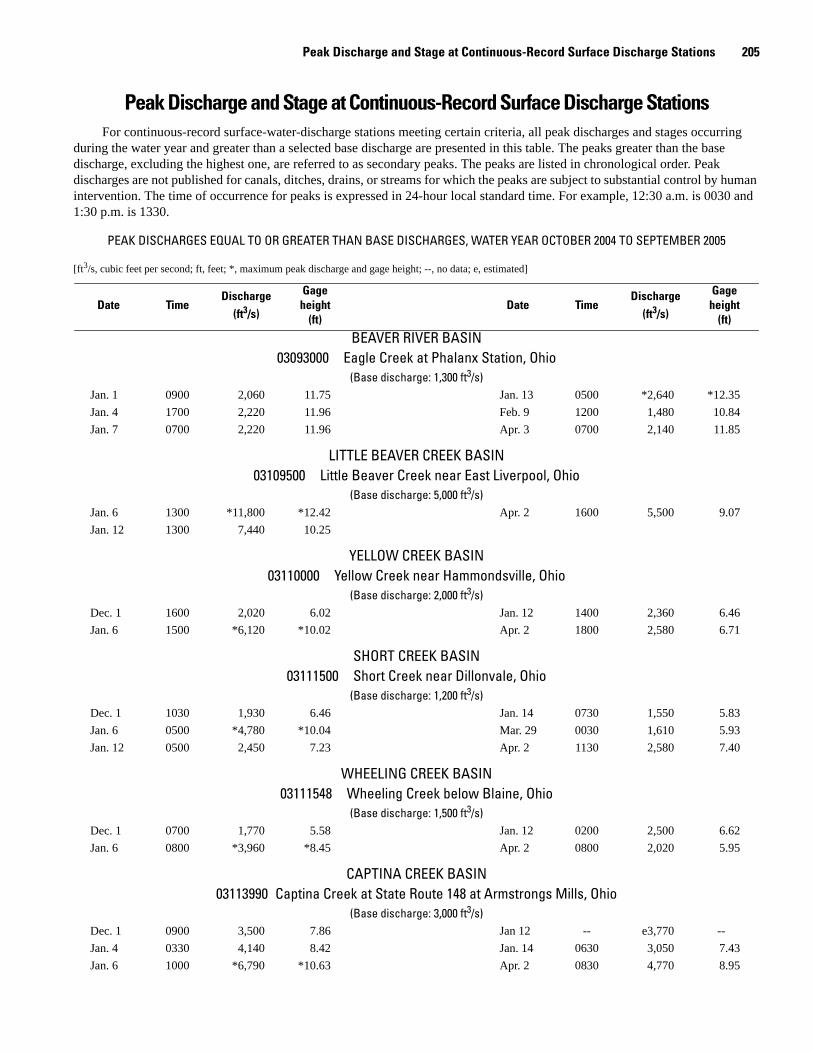
Peak Discharge and Stage at Continuous-Record Surface Discharge StationsFor continuous-record surface-water-discharge stations meeting certain criteria, all peak discharges and stages occurring
during the water year and greater than a selected base discharge are presented in this table. The peaks greater than the base discharge, excluding the highest one, are referred to as secondary peaks. The peaks are listed in chronological order. Peak discharges are not published for canals, ditches, drains, or streams for which the peaks are subject to substantial control by human intervention. The time of occurrence for peaks is expressed in 24-hour local standard time. For example, 12:30 a.m. is 0030 and 1:30 p.m. is 1330.
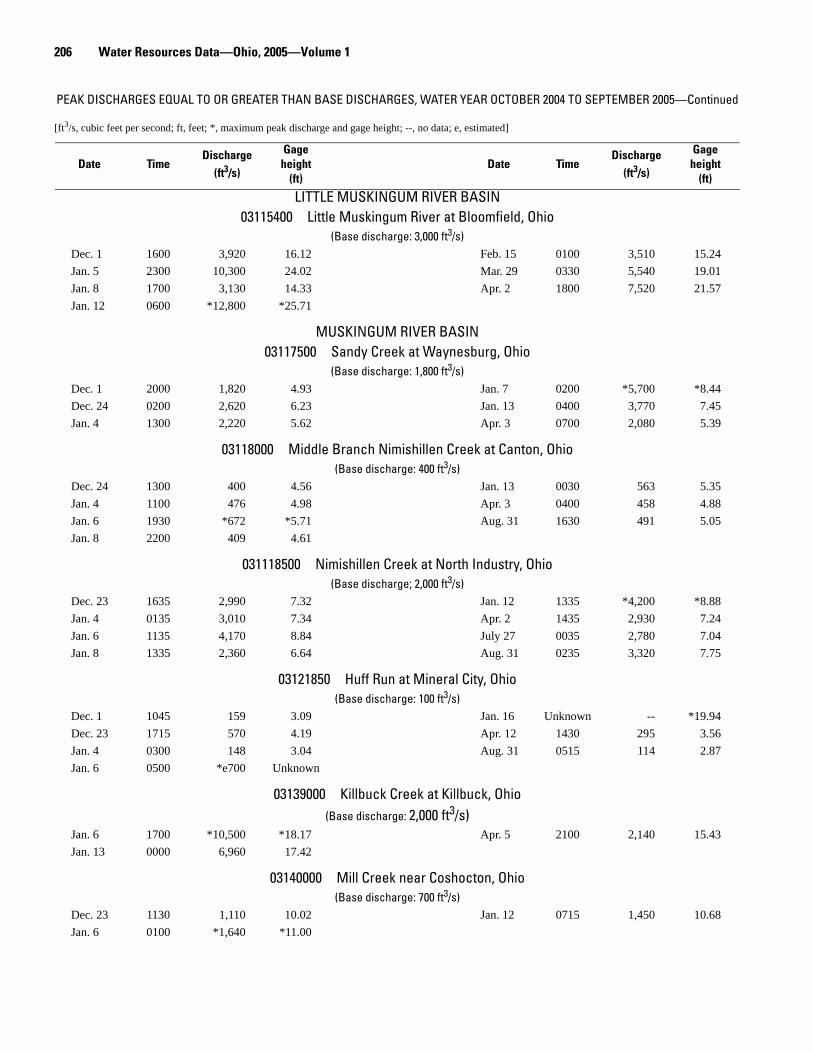
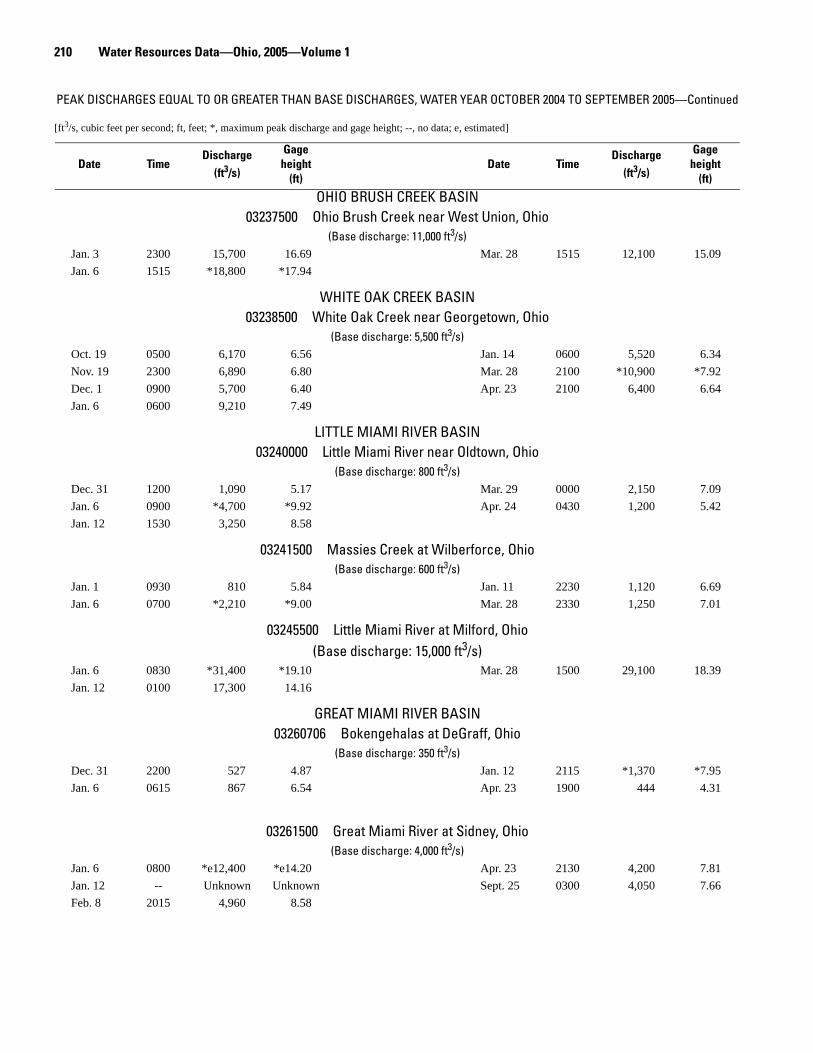
PEAK DISCHARGES EQUAL TO OR GREATER THAN BASE DISCHARGES, WATER YEAR OCTOBER 2004 TO SEPTEMBER 2005
[ft3/s, cubic feet per second; ft, feet; *, maximum peak discharge and gage height; --, no data; e, estimated]
Date TimeDischarge
(ft3/s)
Gage height
(ft)Date Time
Discharge(ft3/s)
Gageheight
(ft)
BEAVER RIVER BASIN03093000 Eagle Creek at Phalanx Station, Ohio
(Base discharge: 1,300 ft3/s)Jan. 1 0900 2,060 11.75 Jan. 13 0500 *2,640 *12.35Jan. 4 1700 2,220 11.96 Feb. 9 1200 1,480 10.84Jan. 7 0700 2,220 11.96 Apr. 3 0700 2,140 11.85
LITTLE BEAVER CREEK BASIN03109500 Little Beaver Creek near East Liverpool, Ohio
(Base discharge: 5,000 ft3/s)Jan. 6 1300 *11,800 *12.42 Apr. 2 1600 5,500 9.07Jan. 12 1300 7,440 10.25
YELLOW CREEK BASIN03110000 Yellow Creek near Hammondsville, Ohio
(Base discharge: 2,000 ft3/s)Dec. 1 1600 2,020 6.02 Jan. 12 1400 2,360 6.46Jan. 6 1500 *6,120 *10.02 Apr. 2 1800 2,580 6.71
SHORT CREEK BASIN03111500 Short Creek near Dillonvale, Ohio
(Base discharge: 1,200 ft3/s)Dec. 1 1030 1,930 6.46 Jan. 14 0730 1,550 5.83Jan. 6 0500 *4,780 *10.04 Mar. 29 0030 1,610 5.93Jan. 12 0500 2,450 7.23 Apr. 2 1130 2,580 7.40
WHEELING CREEK BASIN03111548 Wheeling Creek below Blaine, Ohio
(Base discharge: 1,500 ft3/s)Dec. 1 0700 1,770 5.58 Jan. 12 0200 2,500 6.62Jan. 6 0800 *3,960 *8.45 Apr. 2 0800 2,020 5.95
CAPTINA CREEK BASIN03113990 Captina Creek at State Route 148 at Armstrongs Mills, Ohio
(Base discharge: 3,000 ft3/s) Dec. 1 0900 3,500 7.86 Jan 12 -- e3,770 --Jan. 4 0330 4,140 8.42 Jan. 14 0630 3,050 7.43Jan. 6 1000 *6,790 *10.63 Apr. 2 0830 4,770 8.95
206 Water Resources Data—Ohio, 2005—Volume 1
LITTLE MUSKINGUM RIVER BASIN03115400 Little Muskingum River at Bloomfield, Ohio
(Base discharge: 3,000 ft3/s)Dec. 1 1600 3,920 16.12 Feb. 15 0100 3,510 15.24Jan. 5 2300 10,300 24.02 Mar. 29 0330 5,540 19.01Jan. 8 1700 3,130 14.33 Apr. 2 1800 7,520 21.57Jan. 12 0600 *12,800 *25.71
MUSKINGUM RIVER BASIN03117500 Sandy Creek at Waynesburg, Ohio
(Base discharge: 1,800 ft3/s)Dec. 1 2000 1,820 4.93 Jan. 7 0200 *5,700 *8.44Dec. 24 0200 2,620 6.23 Jan. 13 0400 3,770 7.45Jan. 4 1300 2,220 5.62 Apr. 3 0700 2,080 5.39
03118000 Middle Branch Nimishillen Creek at Canton, Ohio(Base discharge: 400 ft3/s)
Dec. 24 1300 400 4.56 Jan. 13 0030 563 5.35Jan. 4 1100 476 4.98 Apr. 3 0400 458 4.88Jan. 6 1930 *672 *5.71 Aug. 31 1630 491 5.05Jan. 8 2200 409 4.61
031118500 Nimishillen Creek at North Industry, Ohio(Base discharge; 2,000 ft3/s)
Dec. 23 1635 2,990 7.32 Jan. 12 1335 *4,200 *8.88Jan. 4 0135 3,010 7.34 Apr. 2 1435 2,930 7.24Jan. 6 1135 4,170 8.84 July 27 0035 2,780 7.04Jan. 8 1335 2,360 6.64 Aug. 31 0235 3,320 7.75
03121850 Huff Run at Mineral City, Ohio(Base discharge: 100 ft3/s)
Dec. 1 1045 159 3.09 Jan. 16 Unknown -- *19.94Dec. 23 1715 570 4.19 Apr. 12 1430 295 3.56Jan. 4 0300 148 3.04 Aug. 31 0515 114 2.87Jan. 6 0500 *e700 Unknown
03139000 Killbuck Creek at Killbuck, Ohio(Base discharge: 2,000 ft3/s)
Jan. 6 1700 *10,500 *18.17 Apr. 5 2100 2,140 15.43Jan. 13 0000 6,960 17.42
03140000 Mill Creek near Coshocton, Ohio(Base discharge: 700 ft3/s)
Dec. 23 1130 1,110 10.02 Jan. 12 0715 1,450 10.68Jan. 6 0100 *1,640 *11.00
PEAK DISCHARGES EQUAL TO OR GREATER THAN BASE DISCHARGES, WATER YEAR OCTOBER 2004 TO SEPTEMBER 2005—Continued
[ft3/s, cubic feet per second; ft, feet; *, maximum peak discharge and gage height; --, no data; e, estimated]
Date TimeDischarge
(ft3/s)
Gage height
(ft)Date Time
Discharge(ft3/s)
Gageheight
(ft)
Peak Discharge and Stage at Continuous-Record Surface Discharge Stations 207
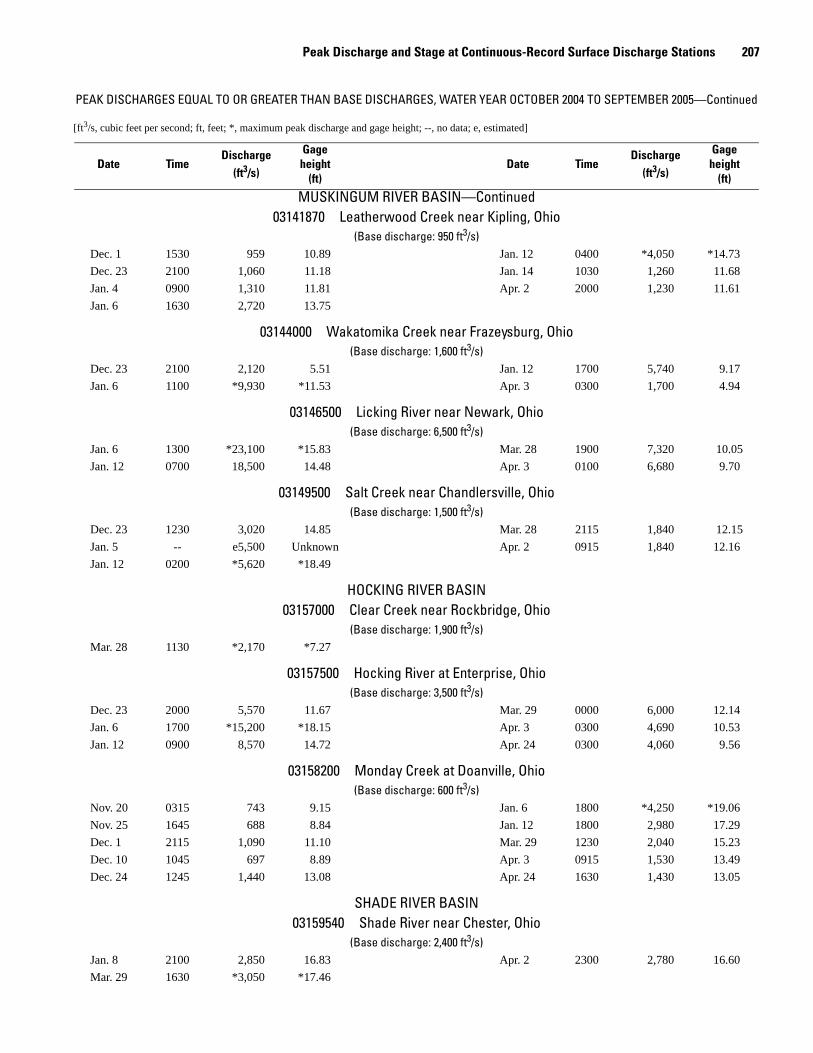
MUSKINGUM RIVER BASIN—Continued03141870 Leatherwood Creek near Kipling, Ohio
(Base discharge: 950 ft3/s)Dec. 1 1530 959 10.89 Jan. 12 0400 *4,050 *14.73Dec. 23 2100 1,060 11.18 Jan. 14 1030 1,260 11.68Jan. 4 0900 1,310 11.81 Apr. 2 2000 1,230 11.61Jan. 6 1630 2,720 13.75
03144000 Wakatomika Creek near Frazeysburg, Ohio(Base discharge: 1,600 ft3/s)
Dec. 23 2100 2,120 5.51 Jan. 12 1700 5,740 9.17Jan. 6 1100 *9,930 *11.53 Apr. 3 0300 1,700 4.94
03146500 Licking River near Newark, Ohio(Base discharge: 6,500 ft3/s)
Jan. 6 1300 *23,100 *15.83 Mar. 28 1900 7,320 10.05Jan. 12 0700 18,500 14.48 Apr. 3 0100 6,680 9.70
03149500 Salt Creek near Chandlersville, Ohio(Base discharge: 1,500 ft3/s)
Dec. 23 1230 3,020 14.85 Mar. 28 2115 1,840 12.15Jan. 5 -- e5,500 Unknown Apr. 2 0915 1,840 12.16Jan. 12 0200 *5,620 *18.49
HOCKING RIVER BASIN03157000 Clear Creek near Rockbridge, Ohio
(Base discharge: 1,900 ft3/s)Mar. 28 1130 *2,170 *7.27
03157500 Hocking River at Enterprise, Ohio(Base discharge: 3,500 ft3/s)
Dec. 23 2000 5,570 11.67 Mar. 29 0000 6,000 12.14Jan. 6 1700 *15,200 *18.15 Apr. 3 0300 4,690 10.53Jan. 12 0900 8,570 14.72 Apr. 24 0300 4,060 9.56
03158200 Monday Creek at Doanville, Ohio(Base discharge: 600 ft3/s)
Nov. 20 0315 743 9.15 Jan. 6 1800 *4,250 *19.06Nov. 25 1645 688 8.84 Jan. 12 1800 2,980 17.29Dec. 1 2115 1,090 11.10 Mar. 29 1230 2,040 15.23Dec. 10 1045 697 8.89 Apr. 3 0915 1,530 13.49Dec. 24 1245 1,440 13.08 Apr. 24 1630 1,430 13.05
SHADE RIVER BASIN03159540 Shade River near Chester, Ohio
(Base discharge: 2,400 ft3/s)Jan. 8 2100 2,850 16.83 Apr. 2 2300 2,780 16.60Mar. 29 1630 *3,050 *17.46
PEAK DISCHARGES EQUAL TO OR GREATER THAN BASE DISCHARGES, WATER YEAR OCTOBER 2004 TO SEPTEMBER 2005—Continued
[ft3/s, cubic feet per second; ft, feet; *, maximum peak discharge and gage height; --, no data; e, estimated]
Date TimeDischarge
(ft3/s)
Gage height
(ft)Date Time
Discharge(ft3/s)
Gageheight
(ft)
208 Water Resources Data—Ohio, 2005—Volume 1
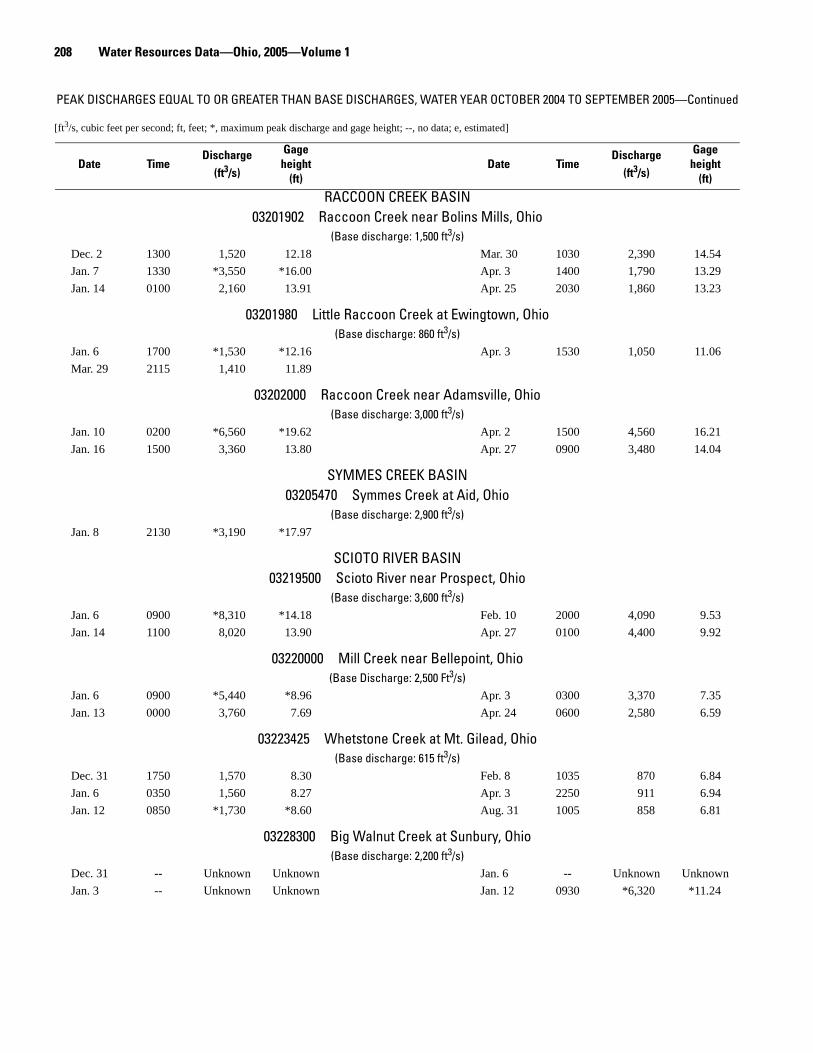
RACCOON CREEK BASIN03201902 Raccoon Creek near Bolins Mills, Ohio
(Base discharge: 1,500 ft3/s)Dec. 2 1300 1,520 12.18 Mar. 30 1030 2,390 14.54Jan. 7 1330 *3,550 *16.00 Apr. 3 1400 1,790 13.29Jan. 14 0100 2,160 13.91 Apr. 25 2030 1,860 13.23
03201980 Little Raccoon Creek at Ewingtown, Ohio(Base discharge: 860 ft3/s)
Jan. 6 1700 *1,530 *12.16 Apr. 3 1530 1,050 11.06Mar. 29 2115 1,410 11.89
03202000 Raccoon Creek near Adamsville, Ohio(Base discharge: 3,000 ft3/s)
Jan. 10 0200 *6,560 *19.62 Apr. 2 1500 4,560 16.21Jan. 16 1500 3,360 13.80 Apr. 27 0900 3,480 14.04
SYMMES CREEK BASIN03205470 Symmes Creek at Aid, Ohio
(Base discharge: 2,900 ft3/s)Jan. 8 2130 *3,190 *17.97
SCIOTO RIVER BASIN03219500 Scioto River near Prospect, Ohio
(Base discharge: 3,600 ft3/s)Jan. 6 0900 *8,310 *14.18 Feb. 10 2000 4,090 9.53Jan. 14 1100 8,020 13.90 Apr. 27 0100 4,400 9.92
03220000 Mill Creek near Bellepoint, Ohio(Base Discharge: 2,500 Ft3/s)
Jan. 6 0900 *5,440 *8.96 Apr. 3 0300 3,370 7.35Jan. 13 0000 3,760 7.69 Apr. 24 0600 2,580 6.59
03223425 Whetstone Creek at Mt. Gilead, Ohio(Base discharge: 615 ft3/s)
Dec. 31 1750 1,570 8.30 Feb. 8 1035 870 6.84Jan. 6 0350 1,560 8.27 Apr. 3 2250 911 6.94Jan. 12 0850 *1,730 *8.60 Aug. 31 1005 858 6.81
03228300 Big Walnut Creek at Sunbury, Ohio(Base discharge: 2,200 ft3/s)
Dec. 31 -- Unknown Unknown Jan. 6 -- Unknown UnknownJan. 3 -- Unknown Unknown Jan. 12 0930 *6,320 *11.24
PEAK DISCHARGES EQUAL TO OR GREATER THAN BASE DISCHARGES, WATER YEAR OCTOBER 2004 TO SEPTEMBER 2005—Continued
[ft3/s, cubic feet per second; ft, feet; *, maximum peak discharge and gage height; --, no data; e, estimated]
Date TimeDischarge
(ft3/s)
Gage height
(ft)Date Time
Discharge(ft3/s)
Gageheight
(ft)
Peak Discharge and Stage at Continuous-Record Surface Discharge Stations 209
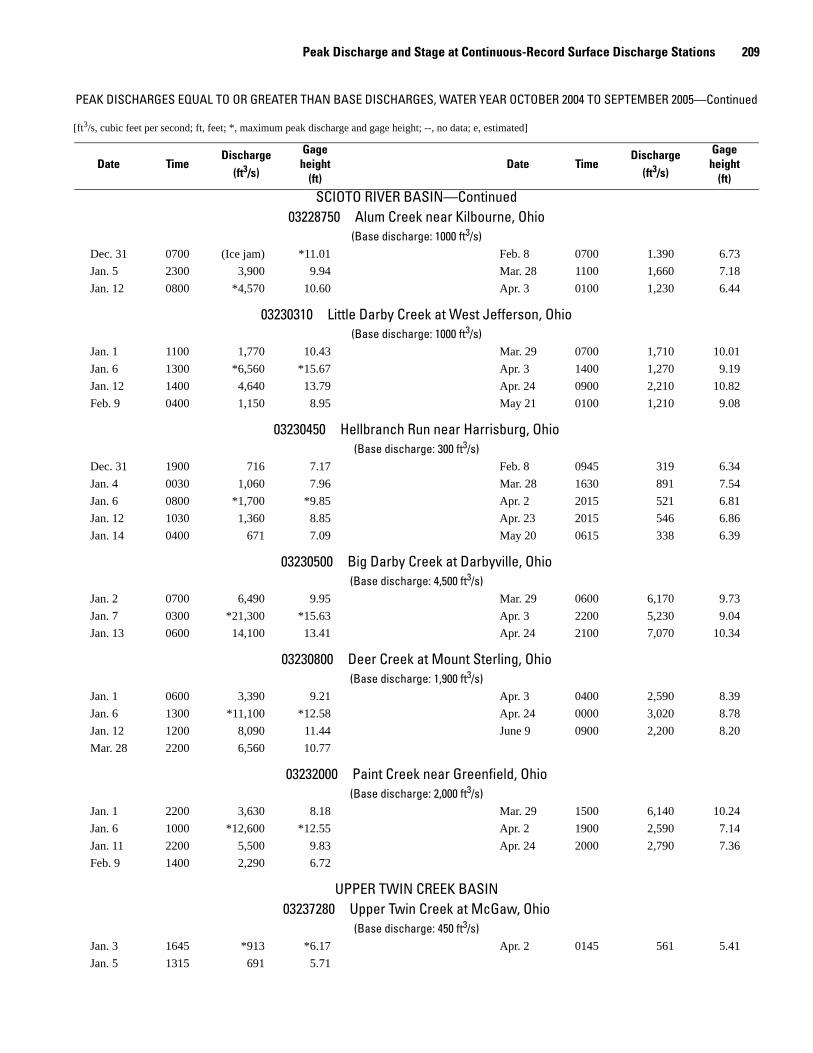
SCIOTO RIVER BASIN—Continued03228750 Alum Creek near Kilbourne, Ohio
(Base discharge: 1000 ft3/s)Dec. 31 0700 (Ice jam) *11.01 Feb. 8 0700 1.390 6.73Jan. 5 2300 3,900 9.94 Mar. 28 1100 1,660 7.18Jan. 12 0800 *4,570 10.60 Apr. 3 0100 1,230 6.44
03230310 Little Darby Creek at West Jefferson, Ohio(Base discharge: 1000 ft3/s)
Jan. 1 1100 1,770 10.43 Mar. 29 0700 1,710 10.01Jan. 6 1300 *6,560 *15.67 Apr. 3 1400 1,270 9.19Jan. 12 1400 4,640 13.79 Apr. 24 0900 2,210 10.82Feb. 9 0400 1,150 8.95 May 21 0100 1,210 9.08
03230450 Hellbranch Run near Harrisburg, Ohio(Base discharge: 300 ft3/s)
Dec. 31 1900 716 7.17 Feb. 8 0945 319 6.34Jan. 4 0030 1,060 7.96 Mar. 28 1630 891 7.54Jan. 6 0800 *1,700 *9.85 Apr. 2 2015 521 6.81Jan. 12 1030 1,360 8.85 Apr. 23 2015 546 6.86Jan. 14 0400 671 7.09 May 20 0615 338 6.39
03230500 Big Darby Creek at Darbyville, Ohio(Base discharge: 4,500 ft3/s)
Jan. 2 0700 6,490 9.95 Mar. 29 0600 6,170 9.73Jan. 7 0300 *21,300 *15.63 Apr. 3 2200 5,230 9.04Jan. 13 0600 14,100 13.41 Apr. 24 2100 7,070 10.34
03230800 Deer Creek at Mount Sterling, Ohio(Base discharge: 1,900 ft3/s)
Jan. 1 0600 3,390 9.21 Apr. 3 0400 2,590 8.39Jan. 6 1300 *11,100 *12.58 Apr. 24 0000 3,020 8.78Jan. 12 1200 8,090 11.44 June 9 0900 2,200 8.20Mar. 28 2200 6,560 10.77
03232000 Paint Creek near Greenfield, Ohio(Base discharge: 2,000 ft3/s)
Jan. 1 2200 3,630 8.18 Mar. 29 1500 6,140 10.24Jan. 6 1000 *12,600 *12.55 Apr. 2 1900 2,590 7.14Jan. 11 2200 5,500 9.83 Apr. 24 2000 2,790 7.36Feb. 9 1400 2,290 6.72
UPPER TWIN CREEK BASIN03237280 Upper Twin Creek at McGaw, Ohio
(Base discharge: 450 ft3/s)Jan. 3 1645 *913 *6.17 Apr. 2 0145 561 5.41Jan. 5 1315 691 5.71
PEAK DISCHARGES EQUAL TO OR GREATER THAN BASE DISCHARGES, WATER YEAR OCTOBER 2004 TO SEPTEMBER 2005—Continued
[ft3/s, cubic feet per second; ft, feet; *, maximum peak discharge and gage height; --, no data; e, estimated]
Date TimeDischarge
(ft3/s)
Gage height
(ft)Date Time
Discharge(ft3/s)
Gageheight
(ft)
210 Water Resources Data—Ohio, 2005—Volume 1
OHIO BRUSH CREEK BASIN03237500 Ohio Brush Creek near West Union, Ohio
(Base discharge: 11,000 ft3/s)Jan. 3 2300 15,700 16.69 Mar. 28 1515 12,100 15.09Jan. 6 1515 *18,800 *17.94
WHITE OAK CREEK BASIN03238500 White Oak Creek near Georgetown, Ohio
(Base discharge: 5,500 ft3/s)Oct. 19 0500 6,170 6.56 Jan. 14 0600 5,520 6.34Nov. 19 2300 6,890 6.80 Mar. 28 2100 *10,900 *7.92Dec. 1 0900 5,700 6.40 Apr. 23 2100 6,400 6.64Jan. 6 0600 9,210 7.49
LITTLE MIAMI RIVER BASIN03240000 Little Miami River near Oldtown, Ohio
(Base discharge: 800 ft3/s)Dec. 31 1200 1,090 5.17 Mar. 29 0000 2,150 7.09Jan. 6 0900 *4,700 *9.92 Apr. 24 0430 1,200 5.42Jan. 12 1530 3,250 8.58
03241500 Massies Creek at Wilberforce, Ohio(Base discharge: 600 ft3/s)
Jan. 1 0930 810 5.84 Jan. 11 2230 1,120 6.69Jan. 6 0700 *2,210 *9.00 Mar. 28 2330 1,250 7.01
03245500 Little Miami River at Milford, Ohio(Base discharge: 15,000 ft3/s)
Jan. 6 0830 *31,400 *19.10 Mar. 28 1500 29,100 18.39Jan. 12 0100 17,300 14.16
GREAT MIAMI RIVER BASIN03260706 Bokengehalas at DeGraff, Ohio
(Base discharge: 350 ft3/s)Dec. 31 2200 527 4.87 Jan. 12 2115 *1,370 *7.95Jan. 6 0615 867 6.54 Apr. 23 1900 444 4.31
03261500 Great Miami River at Sidney, Ohio(Base discharge: 4,000 ft3/s)
Jan. 6 0800 *e12,400 *e14.20 Apr. 23 2130 4,200 7.81Jan. 12 -- Unknown Unknown Sept. 25 0300 4,050 7.66Feb. 8 2015 4,960 8.58
PEAK DISCHARGES EQUAL TO OR GREATER THAN BASE DISCHARGES, WATER YEAR OCTOBER 2004 TO SEPTEMBER 2005—Continued
[ft3/s, cubic feet per second; ft, feet; *, maximum peak discharge and gage height; --, no data; e, estimated]
Date TimeDischarge
(ft3/s)
Gage height
(ft)Date Time
Discharge(ft3/s)
Gageheight
(ft)
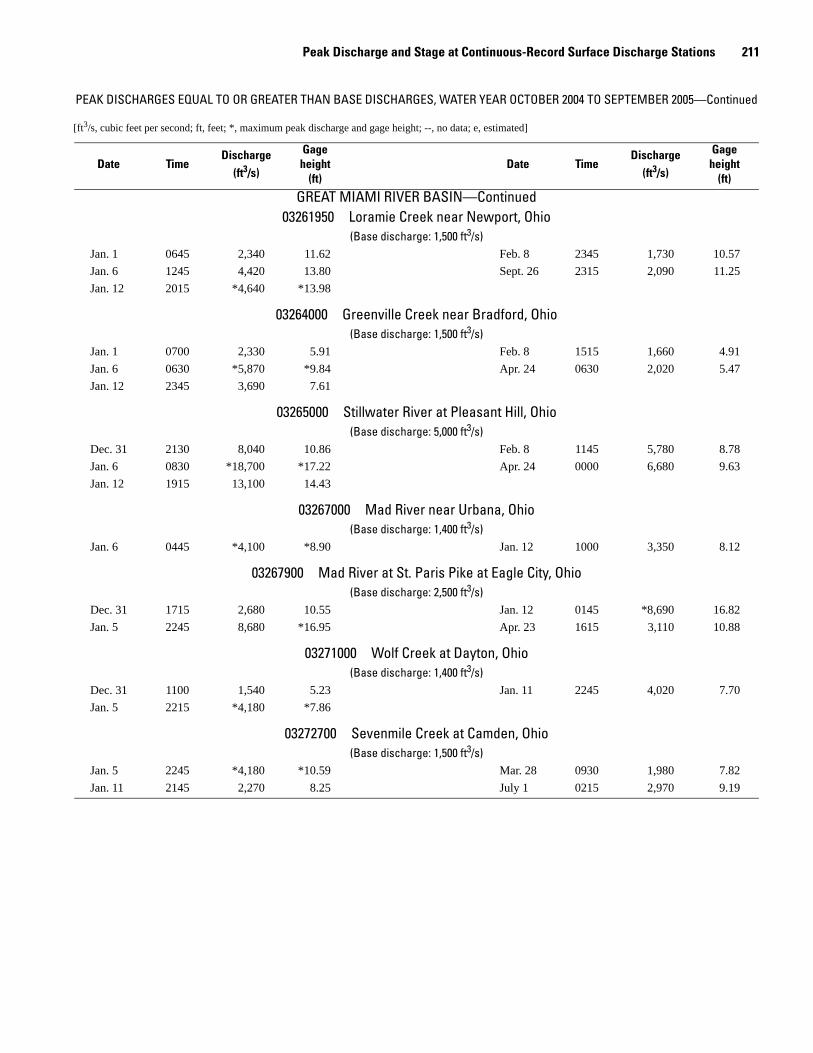
Peak Discharge and Stage at Continuous-Record Surface Discharge Stations 211
GREAT MIAMI RIVER BASIN—Continued03261950 Loramie Creek near Newport, Ohio
(Base discharge: 1,500 ft3/s)Jan. 1 0645 2,340 11.62 Feb. 8 2345 1,730 10.57Jan. 6 1245 4,420 13.80 Sept. 26 2315 2,090 11.25Jan. 12 2015 *4,640 *13.98
03264000 Greenville Creek near Bradford, Ohio(Base discharge: 1,500 ft3/s)
Jan. 1 0700 2,330 5.91 Feb. 8 1515 1,660 4.91Jan. 6 0630 *5,870 *9.84 Apr. 24 0630 2,020 5.47Jan. 12 2345 3,690 7.61
03265000 Stillwater River at Pleasant Hill, Ohio(Base discharge: 5,000 ft3/s)
Dec. 31 2130 8,040 10.86 Feb. 8 1145 5,780 8.78Jan. 6 0830 *18,700 *17.22 Apr. 24 0000 6,680 9.63Jan. 12 1915 13,100 14.43
03267000 Mad River near Urbana, Ohio(Base discharge: 1,400 ft3/s)
Jan. 6 0445 *4,100 *8.90 Jan. 12 1000 3,350 8.12
03267900 Mad River at St. Paris Pike at Eagle City, Ohio(Base discharge: 2,500 ft3/s)
Dec. 31 1715 2,680 10.55 Jan. 12 0145 *8,690 16.82Jan. 5 2245 8,680 *16.95 Apr. 23 1615 3,110 10.88
03271000 Wolf Creek at Dayton, Ohio(Base discharge: 1,400 ft3/s)
Dec. 31 1100 1,540 5.23 Jan. 11 2245 4,020 7.70Jan. 5 2215 *4,180 *7.86
03272700 Sevenmile Creek at Camden, Ohio(Base discharge: 1,500 ft3/s)
Jan. 5 2245 *4,180 *10.59 Mar. 28 0930 1,980 7.82Jan. 11 2145 2,270 8.25 July 1 0215 2,970 9.19
PEAK DISCHARGES EQUAL TO OR GREATER THAN BASE DISCHARGES, WATER YEAR OCTOBER 2004 TO SEPTEMBER 2005—Continued
[ft3/s, cubic feet per second; ft, feet; *, maximum peak discharge and gage height; --, no data; e, estimated]
Date TimeDischarge
(ft3/s)
Gage height
(ft)Date Time
Discharge(ft3/s)
Gageheight
(ft)