Embed Size (px)
Citation preview

Dimensionality Reduction Dimensionality Reduction with Linear Transformationswith Linear Transformations
project updateproject update
by
Mingyue Tan
March 17, 2004
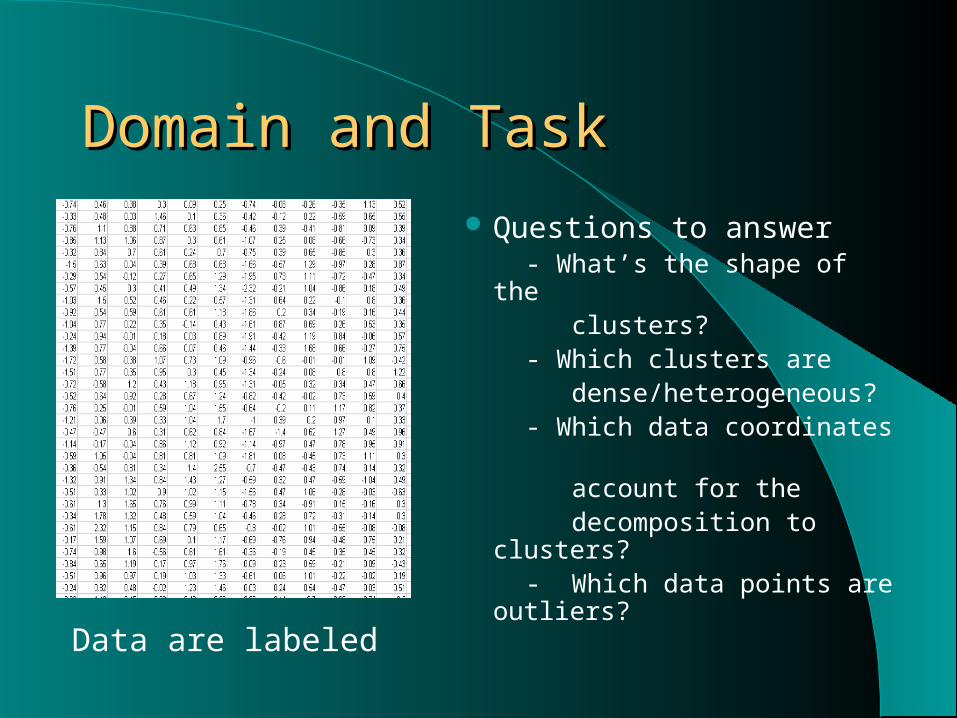
Domain and TaskDomain and Task
Questions to answer - What’s the shape of the clusters? - Which clusters are dense/heterogeneous? - Which data coordinates account for the decomposition to clusters? - Which data points are
outliers? Data are labeled

Solution - Solution - Dimension ReductionDimension Reduction
1. Project the high-dimensional points in a low dimensional space while preserving the “essence” of the data
- i.e. distances are preserved as well as possible
2. Solve the problems in low dimensions
Dim
en
si onal ity
re
ducti o
n
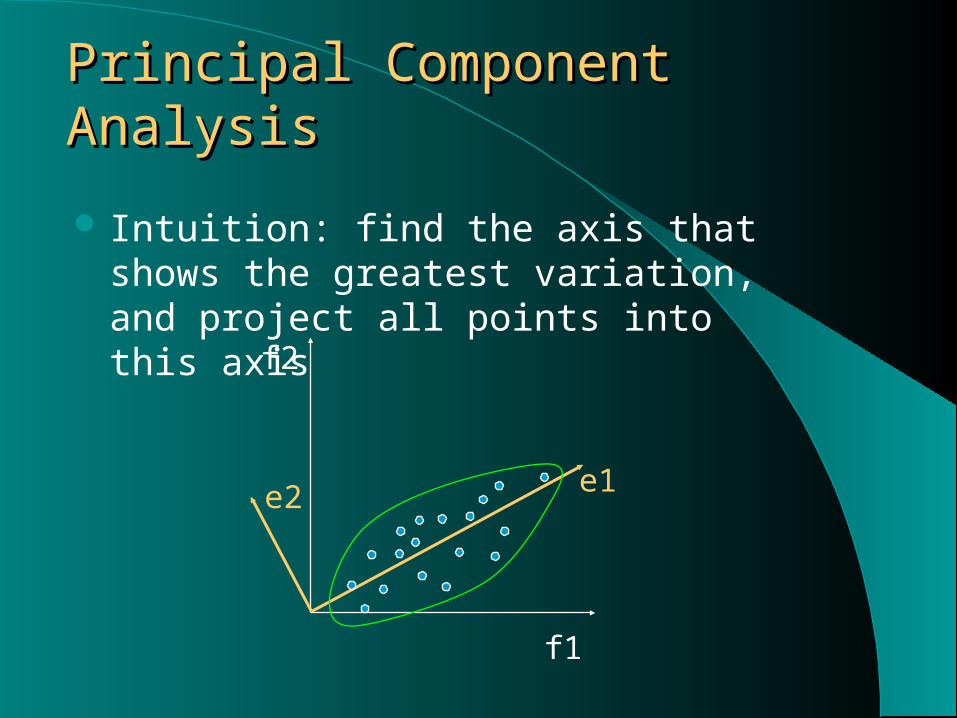
Principal Component AnalysisPrincipal Component Analysis
Intuition: find the axis that shows the greatest variation, and project all points into this axis
f1
e1e2
f2
Problem with PCAProblem with PCA
Not robust - sensitive to outliers
Usually does not show clustering
structure

New ApproachNew Approach
PCA
- seeks a projection that maximizes the sum
Weighted PCA
- seeks a projection that maximizes the weighted sum
- flexibility
2distpij
i j 2dist
pij ij
i jw
Bigger wij -> More important to put them apart

Weighted PCAWeighted PCA
Varying wij gives:Weights specified by userNormalized PCA – robust towards outliers
Supervised PCA – shows cluster structures
- If i and j belong to the same cluster set wij=0
- Maximize inter-cluster scatter
1
distij
ijw 2dist
pij ij
i jw

Comparison – with outliersComparison – with outliers
- PCA: Outliers typically govern the projection direction
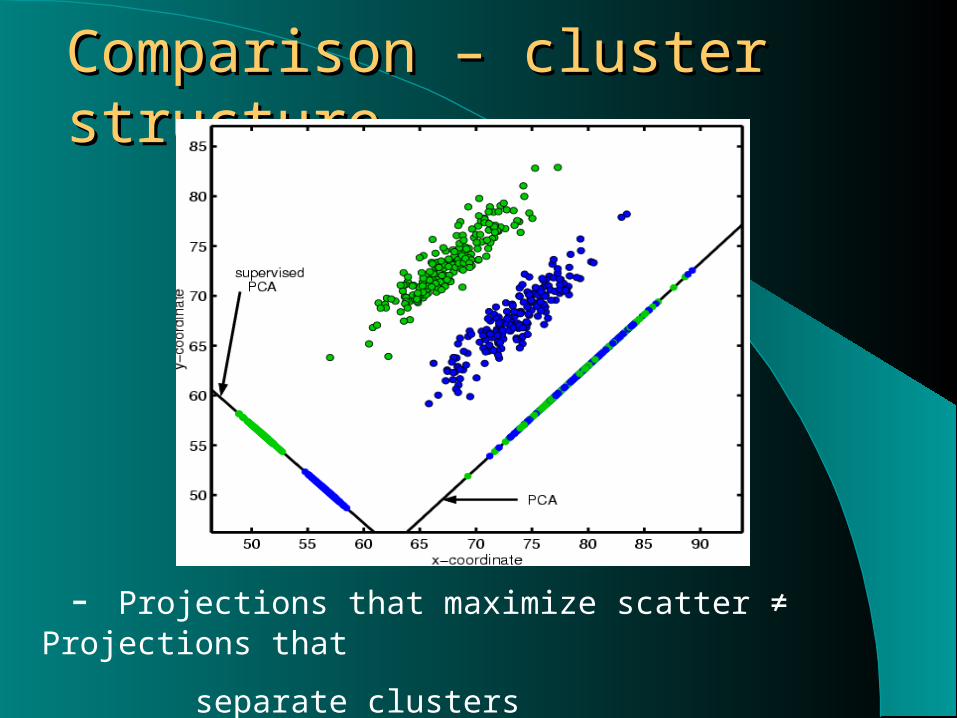
Comparison – cluster Comparison – cluster structurestructure
- Projections that maximize scatter ≠ Projections that
separate clusters
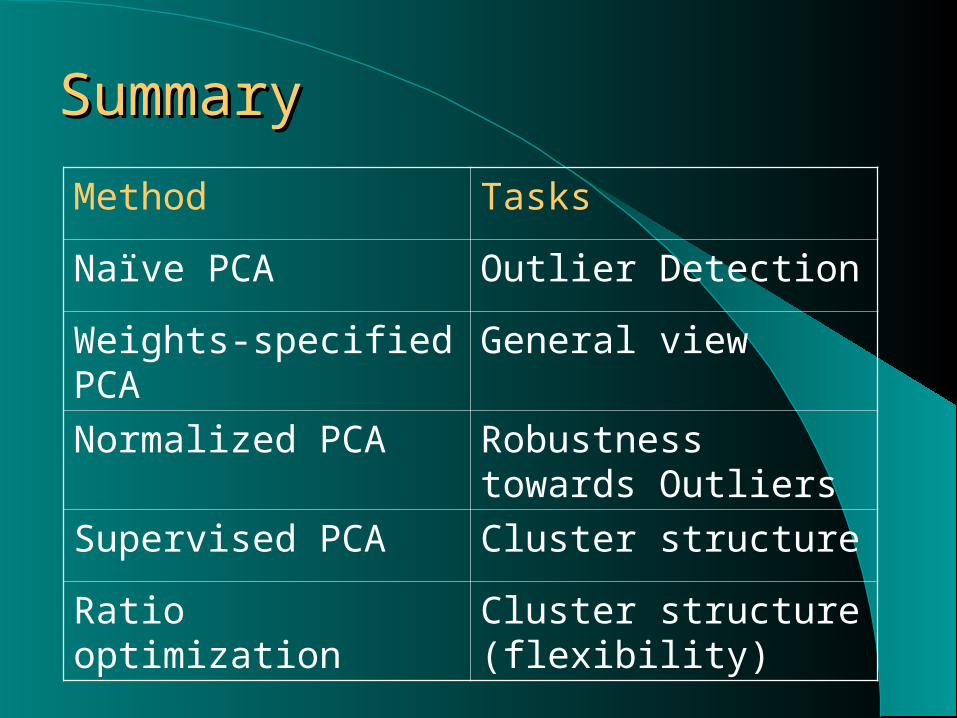
SummarySummary
Method Tasks
Naïve PCA Outlier Detection
Weights-specified PCA General view
Normalized PCA Robustness towards Outliers
Supervised PCA Cluster structure
Ratio optimization Cluster structure (flexibility)

InterfaceInterface

Interface - FileInterface - File

Interface - taskInterface - task

Interface - methodInterface - method
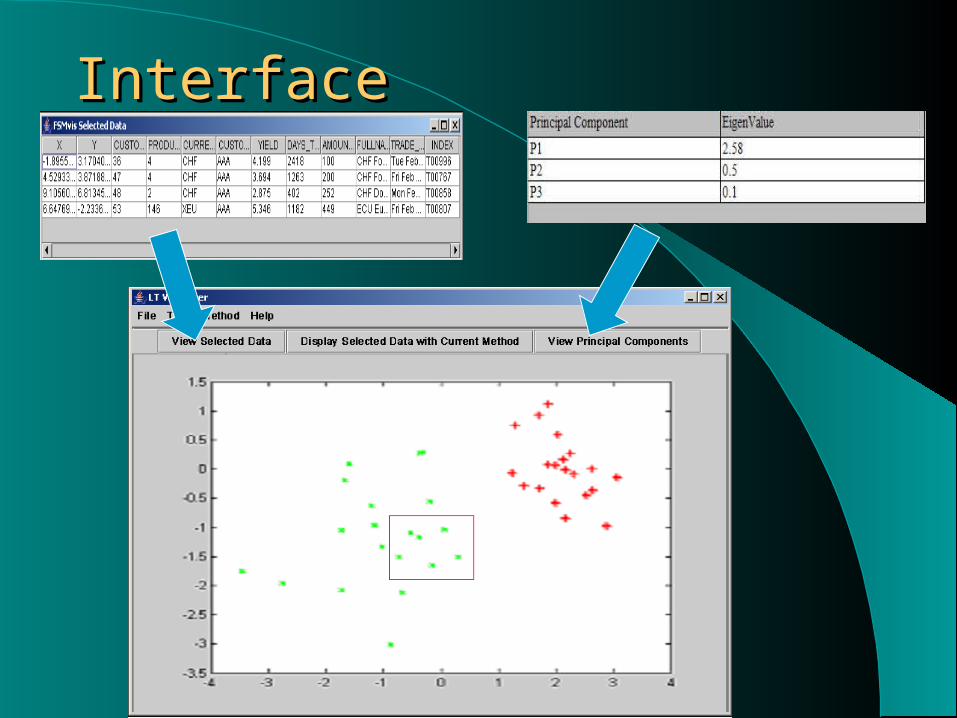
InterfaceInterface

MilestonesMilestones
Dataset Assembled - same dataset used in the paper Get familiar with NetBeans - implemented preliminary interface (no
functionality) Rewrite PCA in Java (from an existing
Matlab implementation) – partially done Implement four new methods
ReferenceReference
[1] Y. Koren and L. Carmel, “Visualization of Labeled Data Using Linear Transformations", Proc. IEEE Information Visualization (InfoVis?3), IEEE, pp.121-128, 2003.