Embed Size (px)
Citation preview

Dimensionality reduction
Usman Roshan
CS 675

Dimensionality reduction
• What is dimensionality reduction?– Compress high dimensional data into lower
dimensions
• How do we achieve this?– PCA (unsupervised): We find a vector w of length
1 such that the variance of the projected data onto w is maximized.
– Binary classification (supervised): Find a vector w that maximizes ratio (Fisher) or difference (MMC) of means and variances of the two classes.
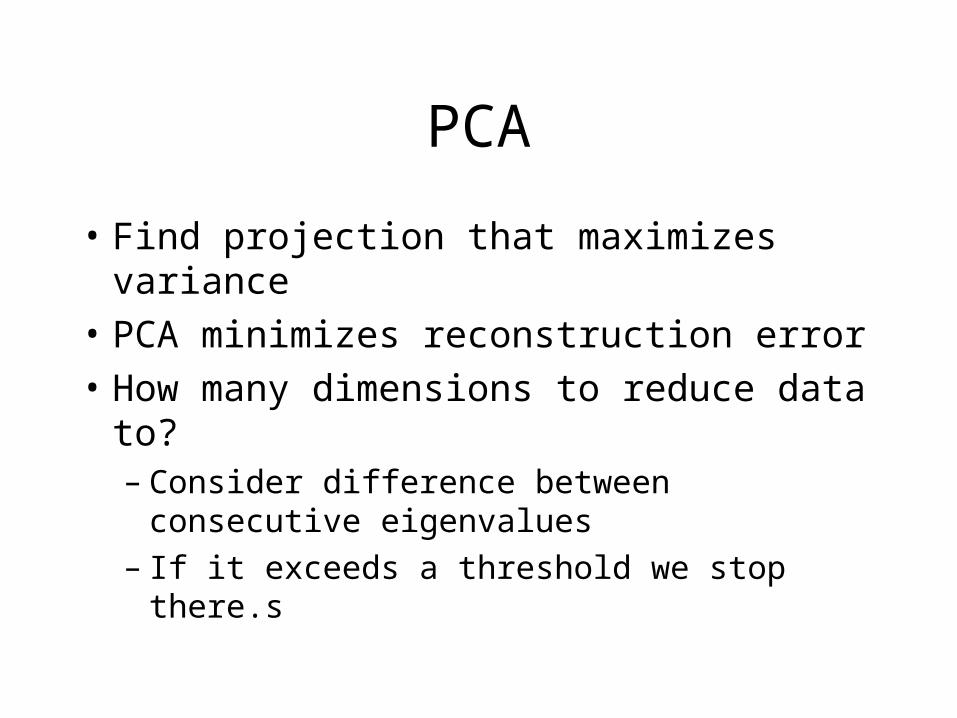
PCA
• Find projection that maximizes variance
• PCA minimizes reconstruction error
• How many dimensions to reduce data to?– Consider difference between consecutive
eigenvalues– If it exceeds a threshold we stop there.s
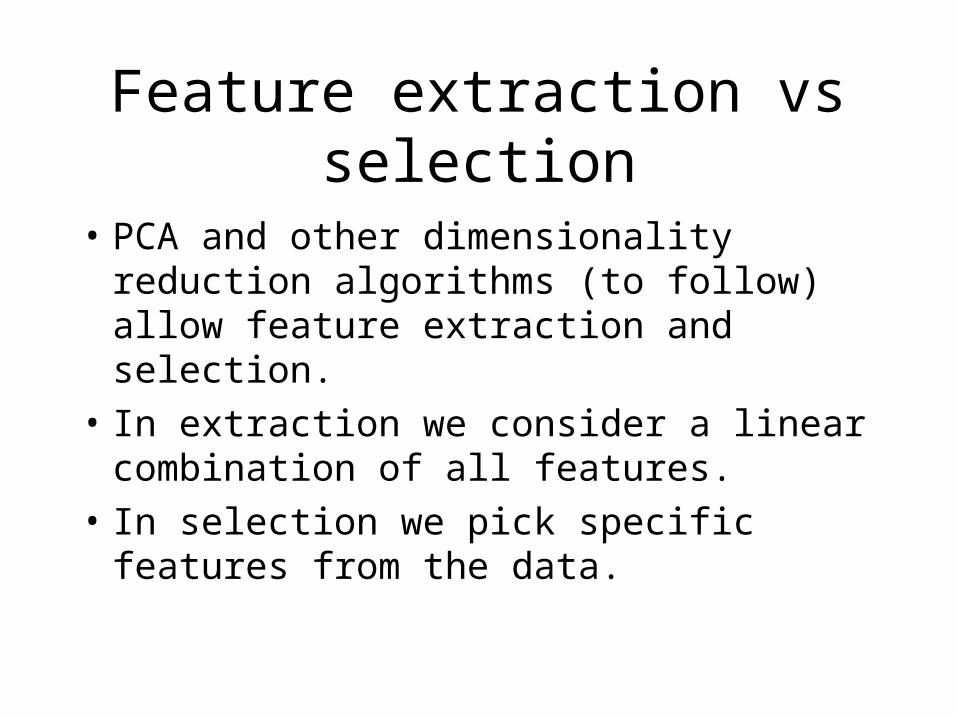
Feature extraction vs selection
• PCA and other dimensionality reduction algorithms (to follow) allow feature extraction and selection.
• In extraction we consider a linear combination of all features.
• In selection we pick specific features from the data.

Kernel PCA
• Main idea of kernel version– XXTw = λw
– XTXXTw = λXTw
– (XTX)XTw = λXTw
– XTw is projection of data on the eigenvector w and also the eigenvector of XTX
• This is also another way to compute projections in space quadratic in number of rows but only gives projections.

Kernel PCA
• In feature space the mean is given by
• Suppose for a moment that the data is mean subtracted in feature space. In other words mean is 0. Then the scatter matrix in feature space is given by

Kernel PCA
• The eigenvectors of ΣΦ give us the PCA solution. But what if we only know the kernel matrix?
• First we center the kernel matrix so that mean is 0
where j is a vector of 1’s.K = K
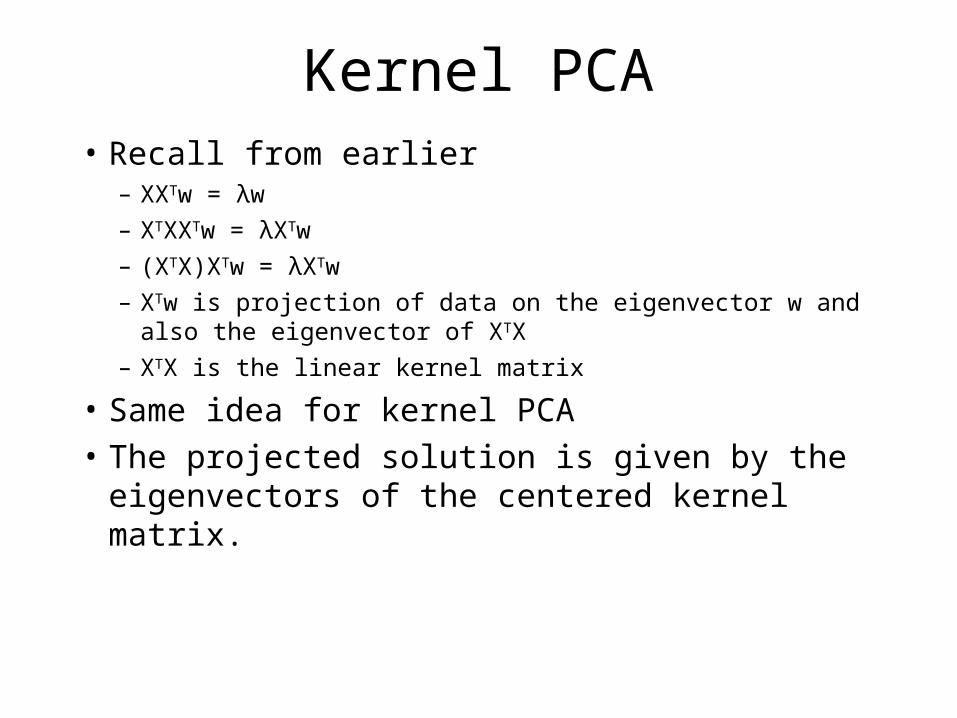
Kernel PCA• Recall from earlier
– XXTw = λw
– XTXXTw = λXTw
– (XTX)XTw = λXTw
– XTw is projection of data on the eigenvector w and also the eigenvector of XTX
– XTX is the linear kernel matrix
• Same idea for kernel PCA
• The projected solution is given by the eigenvectors of the centered kernel matrix.

Polynomial degree 2 kernelBreast cancer

Polynomial degree 2 kernelClimate

Polynomial degree 2 kernelQsar

Polynomial degree 2 kernelIonosphere

Supervised dim reduction: Linear discriminant analysis
• Fisher linear discriminant:– Maximize ratio of difference means to sum
of variance

Linear discriminant analysis
• Fisher linear discriminant:– Difference in means of projected data
gives us the between-class scatter matrix
– Variance gives us within-class scatter matrix

Linear discriminant analysis
• Fisher linear discriminant solution:– Take derivative w.r.t. w and set to 0
– This gives us w = cSw-1(m1-m2)

Scatter matrices
• Sb is between class scatter matrix
• Sw is within-class scatter matrix
• St = Sb + Sw is total scatter matrix

Fisher linear discriminant
• General solution is given by eigenvectors of Sb
-1Sw

Fisher linear discriminant
• Problems can happen with calculating the inverse
• A different approach is the maximum margin criterion

Maximum margin criterion (MMC)
• Define the separation between two classes as
• S(C) represents the variance of the class. In MMC we use the trace of the scatter matrix to represent the variance.
• The scatter matrix is
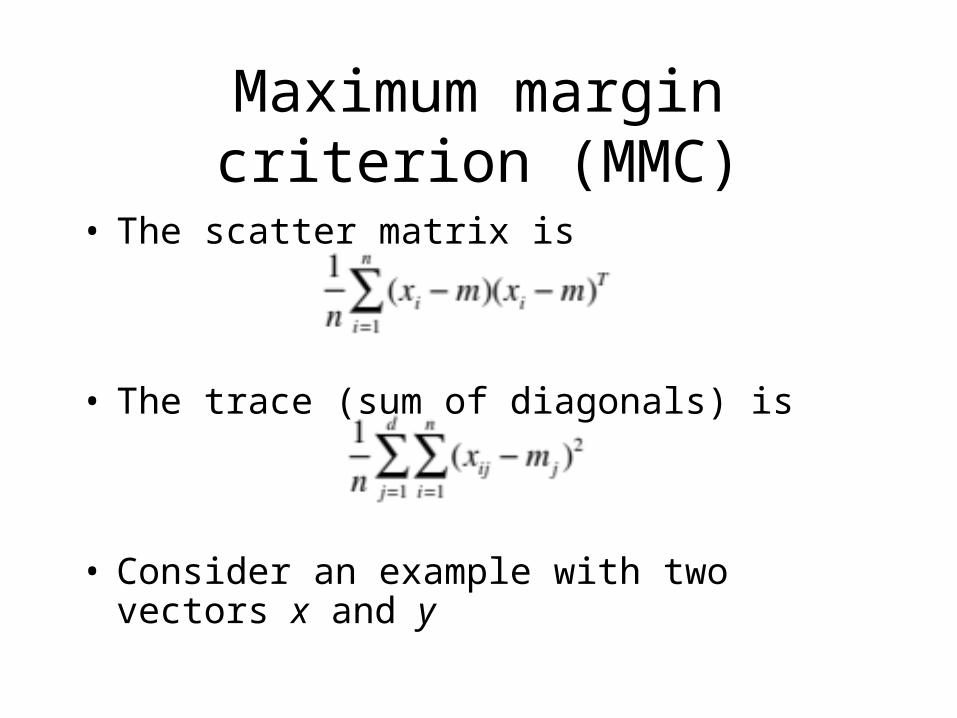
Maximum margin criterion (MMC)
• The scatter matrix is
• The trace (sum of diagonals) is
• Consider an example with two vectors x and y

Maximum margin criterion (MMC)
• Plug in trace for S(C) and we get
• The above can be rewritten as
• Where Sw is the within-class scatter matrix
• And Sb is the between-class scatter matrix

Weighted maximum margin criterion (WMMC)
• Adding a weight parameter gives us
• In WMMC dimensionality reduction we want to find w that maximizes the above quantity in the projected space.
• The solution w is given by the largest eigenvector of the above

How to use WMMC for classification?
• Reduce dimensionality to fewer features
• Run any classification algorithm like nearest means or nearest neighbor.

K-nearest neighbor
• Classify a given datapoint to be the majority label of the k closest points
• The parameter k is cross-validated
• Simple yet can obtain high classification accuracy

Weighted maximum variance (WMV)
• Find w that maximizes the weighted variance

Weighted maximum variance (WMV)
• Reduces to PCA if Cij = 1/n