Embed Size (px)
Citation preview

DIGITAL GREEN FARMSTACK
EVALUATION RESULTS
A USE CASE FOR CASHEW IN ANDHRA PRADESH
February 1, 2021
For Digital Green and the Bill and Melinda Gates Foundation

Acknowledgements We would like to thank the Digital Green staff who contributed to the development of this evaluation, including Shreya Agarwal, Pritam Nanda, K Archana, Sanjeev Kumar, Abhinav Kumar, and Sagar Singh. This report and its analyses were produced by IDinsight staff: William Slotznick, Rupika Singh, and Daniel Stein. Field collection efforts were led by Syed Maqbool, Rajkumar Sharma, Marapelly Karunakar, and Venkatesh Teegala. We would also like to thank Sanjeeva Rao from Velugu Association and Krishna Rao from Kovel Foundation for their time speaking with us. IDinsight’s engagement with Digital Green was supported by the Bill & Melinda Gates Foundation. Cover photo: A Farmer Producer Group meets to learn about FarmStack in Visakhapatnam, Andhra Pradesh. c. William Slotznick.
About IDinsight IDinsight uses data and evidence to help leaders combat poverty worldwide. Our collaborations deploy a large analytical toolkit to help clients design better policies, rigorously test what works, and use evidence to implement effectively at scale. We place special emphasis on using the right tool for the right question, and tailor our rigorous methods to the real-world constraints of decision-makers. IDinsight works with governments, foundations, NGOs, multilaterals and businesses across Africa and Asia. We work in all major sectors including health, education, agriculture, governance, digital ID, financial access, and sanitation. Visit www.IDinsight.org and follow on Twitter @IDinsight to learn more

3
TABLE OF CONTENTS
EXECUTIVE SUMMARY 4
1. BACKGROUND 6
1.1 About DIGITAL GREEN AND FARMSTACK 6
1.2 Cashews as a use case 7
1.3 Community Managed Natural Farming(CMNF) 7
1.4 Supplementary and Customized Mobile Advisory 8
1.5 Intervention 9
1.6 Environmental factors 10
1.7 Timeline 11
2. RESEARCH QUESTIONS AND OUTCOMES 12
3. METHODOLOGY 12
3.1 RCT 12
3.1.1 Evaluation Design 12
3.1.2 Selection and Sampling Procedure 13
3.1.3 Data 15
3.1.4 Analysis 16
3.2 Process Evaluation 18
3.2.1 Methodology and Sampling 18
3.2.2 Data collection 19
3.2.3 Analysis 19
4. QUANTITATIVE RESULTS 20
4.1 Farmer access to extension 20
4.2 Farmer perceptions of extension 22
4.3 Functionary perceptions 25
4.4 Farmer recall of practices 28
4.5 Farmer knowledge 29
4.6 Farmer adoption 31
4.7 Farmer production and yield 35
4.8 Reflections on Gender 38
4.9 Cost Effectiveness 38
5. ADDITIONAL QUALITATIVE FINDINGS 40
6. CONCLUSION 43
7. REFERENCES 44
8. APPENDICES 45

Final Evaluation Report 4
EXECUTIVE SUMMARY
FarmStack is a data-sharing platform developed by Digital Green. It uses the integration of farm and farmer data to develop customized and demand driven information and services offered to farmers via multiple integrated channels of communication (e.g., video and mobile based channels.)
IDinsight conducted a comprehensive evaluation from November 2019-August 2020 to rigorously assess the impact of a pilot cashew “use case”. This use case involved providing information to farmers using a combination of video and IVR as well as involved integration of soil and weather data to offer customized content. Our study included a randomized-controlled trial (RCT) as well as a light process evaluation.
In the RCT, we compare farmers who received customized information via IVR and SMS (“Video+IVR”) along with in-person videos to those who received only Digital Green’s standard video program (“Video Only”). We also non-experimentally compare outcomes between program farmers to those who had never received exposure to Digital Green. In this report, we share findings on the program’s effects on cashew farmer knowledge, adoption, and productivity outcomes. In the process evaluation, we quantitatively assess farmers’ and functionaries’ (extension agents) perceptions of the utility of the IVR messages as a complement to videos. We also use in-depth qualitative interviews with program stakeholders to develop insights on the pilot experience and areas for future strengthening. This evaluation took place during the COVID-19 pandemic, and therefore the context has some unusual features. In-person video screening were paused due to restrictions on meetings, and all data had to be gathered remotely. Our evaluation suggests that the IVR messages improved knowledge and adoption of practices, compared to those who only received information via group video dissemination:
● Knowledge: Farmers who received Video+IVR were more likely to know about all promoted practices, with effects ranging from 5.2 to 9.1 percentage points (8%-52% relative increase). They also showed a significant increase (0.232 SD) in overall knowledge of practices
● Adoption: Video+IVR farmers were more likely to adopt all promoted practices, with effects ranging from 4.7 to 7.6 percentage points. They are 8.6 percentage points more likely to adopt at least one practice (a relative increase of 21%).
● Productivity: There are slightly higher production levels and yields in the Video+IVR group, but these indicators are noisily measured and there is no statistically significant difference from the Video Only group.
● Gender: There are some indications that the Video+IVR treatment is more effective for women, as we see higher treatment effects compared to men for some knowledge, adoption, and production indicators. Notably, women in the Video+IVR group do have 38% higher production compared to women in the Video Only group. These results

5
are intriguing, but should be interpreted with caution due to the small size of the female sample (383 households, 17% of the overall sample.)
In addition, we find:
● Farmers stated that the IVR messages were effective, giving them high scores on Ease, Understanding, Timeliness, and Relevance. However, the scores for Influence were lower, reflecting barriers besides knowledge to adoption.
● Cashew farmers in the project area reported much higher levels of knowledge and adoption of promoted practices than cashew farmers outside the project area (“non-intervention farmers”). This indicates that both videos and IVR messages are likely improving knowledge and adoption of the promoted cashew practices. However, farmers in the project area did not report higher production than non-intervention farmers.
Our process evaluation indicated that this Farmstack implementation was able to set the basic technology framework to integrate information from various data sources and send out recommendations successfully. Farmers found the IVR messages understandable, but frequently lacked the resources or desire to act upon the recommendations. While use of mobile technology has advantages in terms of speed and scale, there are still infrastructural and network-related challenges that hinder the medium’s reach. Additionally, stakeholders expressed a desire to expand the system to output markets as well as other crops.
Altogether, we find highly promising results from Digital Green’s cashew FarmStack use case on primary outcomes of farmer knowledge and adoption rates. This evaluation shows that the FarmStack system shows promise, and provides feedback on how it can continue to improve.

Final Evaluation Report 6
1. BACKGROUND
As mobile phone penetration increases in rural areas around the world, the use of mobile technology to provide customized information to farmers is on the rise. Although there has been some mixed evidence as to the effectiveness of these systems, a recent meta-analysis showed that transmission of agricultural information through mobile technologies in sub-Saharan Africa and India had positive effects on average technology adoption and yields (Fabregas et al., 2019). Since mobile phone ownership skews toward richer households as well as men, it may be the case that digital extension excludes vulnerable populations. However, the evidence is still mixed on the reach and inclusivity of digital extension (Cole and Fenando, 2018; Fabregas et al 2019).
This report presents the results of an impact evaluation of Digital Green’s FarmStack use case with cashew farmers in Andhra Pradesh. It studies the results of the FarmStack IVR system on farmer outcomes, including describing differential effects by gender.
1.1 About DIGITAL GREEN AND FARMSTACK
Digital Green (DG) is a global development organization that focuses on technology-enabled solutions to empowering smallholder farmers. DG’s flagship program is the video-mediated approach (VMA), a participatory, community-based, and digitally-enabled methodology for agriculture extension. DG has operated VMA across 12 states in India to date. Digital Green is developing and testing a digital platform called FarmStack. In Andhra Pradesh, the first use case of the FarmStack-powered decision support tool aimed to address a phenomenon called ‘flower drop’1 in cashew crops, which leads to low production and yield. A supplement to DG’s video-based model, FarmStack sends customized crop care, soil health, and weather prediction advisories directly to farmers' mobile phones. The use case was implemented in four districts of Andhra Pradesh, with support from the Walmart Foundation. On-ground agriculture extension was implemented in partnership with the Kovel Foundation (in Visakhapatnam, Vizianagaram, East Godavari) and the Velugu Association (in Srikakulam district). These community organizations have a well-established relationship with local Farmer Producer Organizations (FPOs), and which enabled the rapid roll-out of this pilot. Partner organizations were responsible for collecting farmer profile data at the onset, and they facilitated the video-enable extension throughout the cashew season. IDinsight conducted a rigorous, mixed-methods evaluation of the FarmStack pilot, in order to inform various design and scale-up decisions.
1 Cashew flowers produce cashew apples and seeds, the latter of which is processed in cashew nuts. A combination of poor weather, low soil nutrients, and infestation can cause the flowers to prematurely drop from trees before the cashew fruits are produced.

7
In this study we focus on a specific implementation of FarmStack that combines the Video-Mediated Approach (VMA) with farm-tailored mobile phone communication, such as IVR and SMS. Using integrated channels, Digital Green aims to cost-effectively boost farmer knowledge and adoption of pertinent crop care and productivity-enhancing methods. FarmStack combines three types of information that are shared through relevant technology channels:
1. Information on Community Managed Natural Farming (CMNF): a package of methods for preparing and applying natural inputs for organic fertilizers and pesticides (details in section 1.3).
2. Weather advisories: alerts on localized (village level) weather forecast information, plus recommendations on weather-appropriate crop care and infestation management.
3. Soil nutrient analysis: recommendations on natural inputs to improve soil fertility, based on plot-level soil sample tests.
FarmStack employs three media channels to deliver the above recommendations. ZBNF practices are first disseminated through VMA, with follow-up supplementary Integrated Voice Response (IVR) and Short Message Service (SMS) messages. The dynamic and customized weather and soil advisories are sent using IVR and SMS.
1.2 Cashews as a use case
Cashew is an important crop for the livelihoods of farmers in Andhra Pradesh, a heavily-forested state on the southeast coast of India. Andhra Pradesh is the second largest producer of cashew nuts in India, averaging 100,000 metric tonnes of cashew per annum (ICAR, 2018 ). However, the majority of cashew growers are smallholders, who typically reside in resource-low communities with limited access to agricultural information.
A persistent barrier to cashew cultivation in Andhra Pradesh is a phenomenon called “flower drop.” Flower drop is when cashew flowers prematurely detach from trees, before the cashew fruits and seeds can be grown and harvested. This can occur due to crop infestation (e.g. by tea-mosquitos), adverse weather conditions (e.g. drought, humidity, fog), or soil nutrient deficiencies. FarmStack seeks to provide timely and relevant information on crop care and soil health management in order to help smallholder farmers combat flower drop and boost their cashew yields.
1.3 Community Managed Natural Farming(CMNF) Digital Green’s outreach to cashew farmers in Andhra Pradesh focuses on the delivery of CMNF (previously known as Zero Budget Natural Farming ZBNF) methods. CMNF is a set of experimental, low-budget, and organic practices meant to overcome the resource gap of smallholder farmers, and encourage higher yields from non-commercial orchards. Under CMNF, farmers combine naturally-occurring inputs (such as cow dung, cow urine, or jaggery) in the preparation of organic fertilizers and pesticides that improve productivity. While these practices lead to reduction in cost of production the evidence on yield is mixed. Currently there is ongoing research to empirically evaluate the impact and efficacy of the practices.
In this evaluation, we studied the following four CBNF practices:
Final Evaluation Report 8
Figure 1: CMNF Practices for Cashews
ZBNF Method Description
Dravajeevamrutham A natural liquid fertilizer that promotes soil fertility and plant nutrient absorption. Ingredients include cow urine, cow dung, black jaggery, gram flour, red soil, and water. Used as a liquid treatment between July and October to prepare the soil, and between November and February as a tree spray.
Girijana Panchagavya A spray for trees that promotes nutrient absorption, fast fruit production, and deters tea mosquitos. Ingredients include cow urine, cow dung, cow milk, palm wine, coconut water, banana, black jaggery, pumpkin pulp, and water. Used during the budding stage from December to February.
Cowdung, Urine, Hing Treatment
A spray for trees that protects against tea mosquito infestation. Used throughout the season (October to March), during the leaf growing, flower budding, and seed formation stages.
Sour Buttermilk A spray for trees that combats powdery mildew. Ingredients include curd, coconut water, and natural water. Used during the budding stage from December to January.
1.4 Supplementary and Customized Mobile Advisory
Supplementary advisories
In addition to VMA, Digital Green developed a series of supplementary, mobile-delivered advisories using the set of ZBNF practices for cashew. Supplementary advisories were disseminated to farmers via IVR and SMS. The IVRs were short (less than a minute) recorded messages, delivered 2-3 times per week.
In addition to the standardized IVR and SMS, Digital Green developed a set of customized advisories based on village-level weather forecasts and plot-level soil test data (see below).
Weather advisory
Digital Green sourced village-level weekly weather prediction data using services provided by Skymet. Weather data, including rainfall, temperature and humidity, were automatically imported to the FarmStack back-end platform and matched against certain conditions to trigger the advisory selection. The advisories mostly centered on crop care and treatment methods (drawn from ZBNF) to prevent ‘flower drop’ due to adverse weather conditions.2
2 These messages included prediction and linked advisory. For example, “The humidity in the air is expected to be fairly high over the next week. During this time, your cashew plantations are more likely to be affected by pests. So, for early prevention, farmer brothers should spray panchagavya or girijana panchagavya and along with this, spray the mixture of cow dung and Asafoetida (Hing).”

9
Soil nutrient advisory
Digital Green partnered with state and district agricultural testing labs to test soil samples from 2000 farmer plots. The test results were manually imported to the FarmStack back-end platform, which matched the soil nutrient levels of nitrogen, phosphorus, and potassium against the optimum ratio for the cashew crop. FarmStack then used a set of conditions to pick relevant ZBNF recommendations that could enrich the soil, and disseminated them to farmers via SMS.3 The SMS-based soil advisories were disseminated to less than 25% of total 8000 plus program farmers.
1.5 Intervention
Between October 2019 and June 2020, Digital Green planned to reach 10,000 farmers through either VMA or FarmStack in Andhra Pradesh. Based on initial feasibility studies, four districts -- Visakhapatnam, Vizianagaram, East Godavari, and Srikakulam -- were identified for this use case (see Figure 2 below).
For the purposes of this study, the farmer communities selected for the pilot were randomly assigned to the video-only and FarmStack groups (see details in section 2.2).
1. Video-only: All participating communities received the base Digital Green VMA program. The video sequence included 11 videos, geared to ZBNF for cashew cultivation. VMA was disseminated by functionaries, typically within organized farmer groups such as Self-Help Groups or Farmer Producer Groups. Videos were deployed from October 2019 to March 2020.
2. Video + IVR: In addition to VMA, Digital Green delivered to some communities a series of IVR and SMS advisories. Although we refer to this treatment groups in shorthand as “Video + IVR” some advisories (such as the soil nutrient information) were delivered via SMS. Using services from Exotel (initially) and Awaaz De, Digital Green disseminated the three types of advisories described above: ZBNF practices, weather forecasts, and soil nutrient based advisory4. IVR and SMS messages were delivered from December 2019-May 2020.
3 An example of these messages is “Nitrogen and phosphorus, which are suitable for the growth of trees are less in your cashew garden soil. To increase that nutrients, dig around each tree and apply 5 kg of neem leaves
per tree and spray 10 liter of dravajeevamrutham.” 4 11 farmers (in 8 villages) from the Video-only group also received SMS-based soil advisories. This occurred because the soil samples were collected before the RCT was designed, and Digital Green opted to return the lab analyses to all farmers who participated in those tests. As this amount of contamination was small, we do not believe the soil messages substantively influenced the outcomes of the Video-only group

Final Evaluation Report 10
Figure 2: Map of intervention districts in Andhra Pradesh
For about two months in April and May, post COVID-19 lockdown in India, DG briefly experimented using WhatsApp as another medium to disseminate information to about 1200 farmers with smartphone in both the groups. Videos and texts were sent on post-harvest crop management and market aggregation information. As WhatsApp messages were sent to both groups, our estimates in this evaluation do not measure their effects.
1.6 Environmental factors
2020 was a trying year for the world, including for cashew farmers in Andhra Pradesh. In addition to the COVID-19 pandemic, cashew farms also experienced difficult weather conditions.
As the COVID-19 pandemic spread in India, the country went through a multi-phase lockdown beginning on 24 March 2020. The initial phases included strict rules for physical movement, with a gradual relaxation of restrictions from April 20. As a result, the in-person video mediation (in both of our treatment arms) stalled during March and April. Mobile phone (IVR and SMS) dissemination continued until harvest in May.
Additionally, the districts in our study experienced excess rainfall, which can lead to increased pest or disease incidence in cashew trees, and consequently, flower drop. The districts in this study saw rainfall totals 20-60% above average in January and February 2020 (Socio Economic

11
Survey (AP), 2019-20)5. Our surveys asked farmers about the shocks they experienced, and found that 63% of the sample reported crop disease or infestation this season (Figure 3).
Figure 3: Farmer reported environmental shocks in 2020
1.7 Timeline
Figure 4 outlines the key project activities through the 2020 cashew season. While the cashew vegetation starts around June, the flowering generally starts around December. This year the flower was delayed and mostly started around January.
Figure 4: Timeline and key activities
Oct-19 Nov-19 Dec-19 Jan-20 Feb-20 Mar-20 Apr-20 May-20 Jun-20 Jul-20 Aug-20
CASHEW CROP CYCLE
Flowering Harvest Rain and Humidity
COVID-19 PANDEMIC Lockdown
DIGITAL GREEN INTERVENTION ACTIVITIES
Video Dissemination Activities Customized IVRs and SMS WhatsApp Messages
IDINSIGHT EVALUATION ACTIVITIES
Study Design
Scoping
Non-intervention
Listing
Phone Survey
Phone Survey II
(RCT+PE)
5 This season, most flowering was delayed and started in January and February.

Final Evaluation Report 12
2. RESEARCH QUESTIONS AND OUTCOMES
This evaluation aims to answer the following research questions:
1. Was the FarmStack model (“Video+IVR”) more impactful than standard video dissemination (VMA) in increasing farmers’ knowledge and adoption of promoted practice for improving cashew yield?
The key outcomes for the RCT are farmer knowledge and farmer adoption. Knowledge was measured by scoring the extent to which farmers recalled the usage and ingredients of each ZBNF practice. These scores were also combined into an aggregate knowledge index. Adoption was measured in binary terms as self-reported uptake of a given practice.
The information provided was aimed at addressing the issue of high ‘flower drop’ in cashew which leads to low production and yield. As such, we also measured cashew production (kg) and yield (kg/acre), while fully recognizing ZBNF may not lead to significant productivity gains in the first year of implementation.
2. How was the experience of FarmStack cashew use case and what are some learnings to iterate the model for future? Did farmers benefit from the customized weather and soil information they received?
As Digital Green continues to iterate their FarmStack model, this study aims to inform the scale up by identifying areas where this pilot was successful or needs strengthening. We collected suggestions for iterations and modifications in the model as the scope and design of FarmStack continues to be revised. This included both quantitative and qualitative data collection. Although the RCT design does not allow us to discern the effects of the customized weather/SMS messages from the more general messages on practices, we explore the efficacy of these components in qualitative work.
3. METHODOLOGY
In order to comprehensively assess the effect of the FarmStack pilot and inform future iterations, we performed a mixed-methods study that combined a cluster-level randomized control trial (RCT) with a lean process evaluation (PE).
3.1 RCT
3.1.1 Evaluation Design
The impact evaluation seeks to measure the causal effect of FarmStack on knowledge and adoption of promoted practices, compared to farmers who only received videos. The communities that participated in the study were identified by Digital Green and its partner organizations as cashew-growing places where the promoted ZBNF practices were uncommon, and therefore could benefit from extension. They conducted a listing exercise to identify eligible communities and farmers who could be enrolled for the FarmStack pilot.

13
Farmers were eligible if they lived in the designated communities, grew cashews, owned a phone, and were members of farmer producer groups (FPGs).
At the farmer level, we compare outcomes between two randomly assigned farmer groups, designated “Video-only” and “Video+IVR.” The level of randomization is the community, which is equivalent to either a village or habitation (a sub-village unit), depending on the district. Some of our districts had very large villages, so for these we defined the unit of randomization as the habitation. We randomly allocated around one quarter of the pre-enrolled communities to Video-only, and the majority to the Video+IVR group in the following proportions:
1. Video-only: 82 communities with approximately 2280 farmers 2. Video+IVR (including customized weather and soil advisories): 250 communities with
approximately 6160 farmers
This uneven randomization was done so that Digital Green could meet their goal of reaching as many farmers with IVR as possible within the context of the evaluation. Communities were stratified at the district and mandal levels to ensure equal and representative variation in geography.
In addition, IDinsight conducted an independent listing exercise to identify a third group of communities (from the same districts) that had no exposure whatsoever to Digital Green. This “non-intervention” arm (65 communities, 1160 farmers) serves as a useful comparator to the two Digital Green groups, though we cannot make causal claims in relation to this group since it was selected via a different process from our treatment groups. These external villages received standard support from the Department Agriculture. The Department of Agriculture had access to Digital Green’s videos on cashew cultivation, but we understand that any extension activities for casher farmers in these areas were limited and intermittent.
Digital Green also used IVR to communicate with a sample of their functionaries (extension agents), to help them improve their performance. We explore their experience in the process evaluation.
3.1.2 Selection and Sampling Procedure
Our original sample for the evaluation included 4,004 treatment farmers (163 communities), and 1169 non-intervention farmers (65 communities). Our final analysis sample was smaller than this due to an inability to reach some farmers by phone. We outline below the procedure taken to sample communities and farmers respectively. Treatment communities and farmers
1. DG compiled a list of approximately 10,000 farmers located in 355 communities across
four districts in Andhra Pradesh, all of which were part of Farmer Producer Organizations. The dataset had been collected via DG’s locally-based NGO partners, and were deemed eligible to receive IVR messages. Approximately 52% of the listed farmers (whose gender was specified) were women.
2. Of the listed communities, we asked DG and its NGO partners to identify which ones they wished to preserve for receiving IVR messages, due to strategic or political

Final Evaluation Report 14
reasons. We excluded these communities (21 in total) from the study entirely so as to ensure they would receive the complete intervention.
3. A number of additional parsing steps were taken to finalize the sample. DG dropped farmers with inaccurate or non-unique phone numbers. DG also dropped a number of sites where the functionaries assigned to them had resigned, or for other programmatic reasons. Lastly, we dropped villages that had less than 7 farmers.6
4. Of the remaining 332 sites, we randomly assigned a portion to the Video-Only arm, and the majority to the FarmStack arm, stratifying by district and mandal (see section 2.1).
5. We then randomly sampled a portion of communities to participate in phone surveying. We sampled from all communities (82) in the Video-only arm, and randomly sampled a nearly equal number from the FarmStack arm (81), stratified by mandal. Within communities, we randomly sampled enough farmers to achieve our desired sample size of 2,000 farmers per treatment arm. We sampled up to 44 households per village in Video+IVR villages, and 53 households in Video-only villages. If there were less than 44/53 eligible households per village, all were selected. The different cut-offs per village for each treatment arm ensure that the total amount of sampled households in each arm are the same, as the distribution of eligible farmers per village in each arm differed slightly. Altogether, we achieved a combined treatment sample of 163 communities with 4,004 farmers for surveying
6. We were unable to reach all farmers for our phone survey. Our final sample of farmers who completed surveys consists of 2132 farmers in 158 communities.
Non-intervention communities and farmers
1. Separately, DG and their partners compiled a list of 122 non-exposure communities across the 4 districts, who were identified as cashew-growing villages. IDinsight field teams then visited the communities (in January 2020) and verified that farmers grew cashews and had never received cashew videos in the past (as the AP government showed videos in some communities in previous years). In communities that were verified, surveyors took rosters of cashew farmers and their phone numbers.
2. We then randomly sampled verified communities that listed at least 7 cashew farmers. Within those, we chose to survey all farmers with viable phone numbers. This led to our final “non-intervention” sample of 65 communities with 1169 farmers.
3. We were unable to reach all non-intervention farmers for our phone survey. Our final sample of farmers who completed surveys consists of 654 farmers in 62 communities.
4. Finally we conducted a matching exercise to ensure that the non-intervention farmers were similar to our treatment farmers on pre-intervention characteristics. This resulted in a final sample of 336 non-intervention farmers.
6 The decision to drop small villages was made to decrease field costs for what was originally planned to be an in-person endline survey.

15
3.1.3 Data
Phone survey data
The data for this study comes primarily from phone-based surveys implemented by IDinsight.
While the team initially piloted and planned for an in-person collection, the project pivoted to a remote, phone-based collection due to COVID-19. For logistical reasons, interviews were conducted in two tranches, between June 20 -June 28 and between July 26 to August 26. Households that had not been reached in the first tranche were rolled over to the second one.
In the majority of cases, we had one phone number per household. The target respondent was the adult in the household who self-reported to be most knowledgeable about the family’s cashew production. Most often, this was the male household head who owned and registered the phone with Digital Green, and who answered the phone when we called. If the individual who picked up the phone stated they were not the most knowledgeable about cashew farming, we arranged to speak with the person who met our criteria. Ultimately, 83% of our respondents were male and 17% were female.
Households were called up to 10 times, across various days and times, until a voluntary response was recorded. Given the remote data collection, rigorous follow up protocols were used to maximize the sample reach7. Farmers could also opt to schedule an appointment for another day; surveyors followed-up at the specified time and afterwards if there was no response. If respondents agreed to interview, but the call disconnected during the conversation, the surveyors re-attempted the call up to 10 times. If the call could not be re-established, surveyors submitted the partial data. Between the two tranches, we achieved an interview response rate of 54% (2785 out of 5157 farmers). In the table below, we provide the breakdown of responses rates per group.
Figure 5: Phone survey response rates
Sample/reached Video+IVR Video No-intervention
Communities Sampled 81 82 65
Reached 81 77 62
% reached 100% 94% 95%
Farmers Sampled 1980 2024 1169
Reached 1068 1064 654
% reached 54% 53% 56%
The most common reasons for non-connection were poor network, or non-functioning/changed phone numbers. We deployed conventional data quality procedures throughout collection, including audio audits of phone calls, regular debriefs and refresher training with surveyors, and daily data checks to uncover any erroneous or outlying
7 Call times were specified for morning (8 am to 10 am), afternoon (12 pm-2 pm), and evening (4-6 pm), although these were sometimes extended for particular regions based on observed pick-up rates. Surveying occurred 6 days a week, with off days on Tuesdays or Wednesdays. For incorrect or not reachable phone numbers or households, we asked neighbouring households if they could help us speak to the sampled household.

Final Evaluation Report 16
information. We used a combination of Survey CTO and Exotel for administering and recording data collection, and for monitoring data quality through phone surveys.
IVR call log data
Additionally, we use call log data generated by the dissemination services Exotel and Awaaz De to assess the proportion of all FarmStack farmers who successfully received IVRs. We identify the proportion of farmers who received at least one IVR, and among those, how many were received on average.
3.1.4 Analysis
We estimate the impact of FarmStack treatment on the above outcomes using a Ordinary Least Squares (OLS) regression. In this specification, we focus on intent to treat (ITT) estimates. Our OLS specification is:
𝑦𝑖 = 𝑎 + 𝛽𝑇𝑐 + 𝑋𝑖𝛿 + 휀𝑖𝑐
Where 𝑦𝑖 denotes the level of outcome y measured at the farmer level i. The variable 𝑇𝑐 indicates the treatment status of community c. 𝑋 is a vector of additional controls including the tranche of the survey, along with farmer age, gender, household size, size of cashew
orchard, and cashew production in the previous year. 휀𝑖𝑐 is the error term for farmer i in community c, assumed to be clustered at the community level.
The following tables include the description of variables used for each of the outcomes measured.
Figure 6: Outcomes of impact evaluation
Outcome Variable Description
Farmer Knowledge
Farmer Recall Proportion of farmers that recognize each ZBNF practice. Farmers are provided a brief prompt – e.g. “[practice] is a liquid fertilizer. Are you familiar with [practice]?”
Knowledge Score Farmers are tested on the (1) usage and (2) ingredients of each ZBNF practice. This leads to 7 discrete knowledge scores, calculated as the proportion of elements correctly answered. We subtract a point for ingredients reported that were not mentioned in the videos. We do not ask for the ingredients of Cow Dung, Urine, and Hing treatment.
Knowledge Index The seven knowledge scores are combined into a single index8 to provide a comprehensive indicator of farmer knowledge.
Farmer adoption
Farmer Adoption Self-reported adoption of recommended practices. Adoption is calculated as the proportion of farmers implementing each
ZBNF practice; we also assess the number of practices adopted, as well as proportion of farmers implementing at least one practice.
8 We use a standard inverse-covariate weighting index as suggested by Anderson (2008).
17
Farmer Productivity
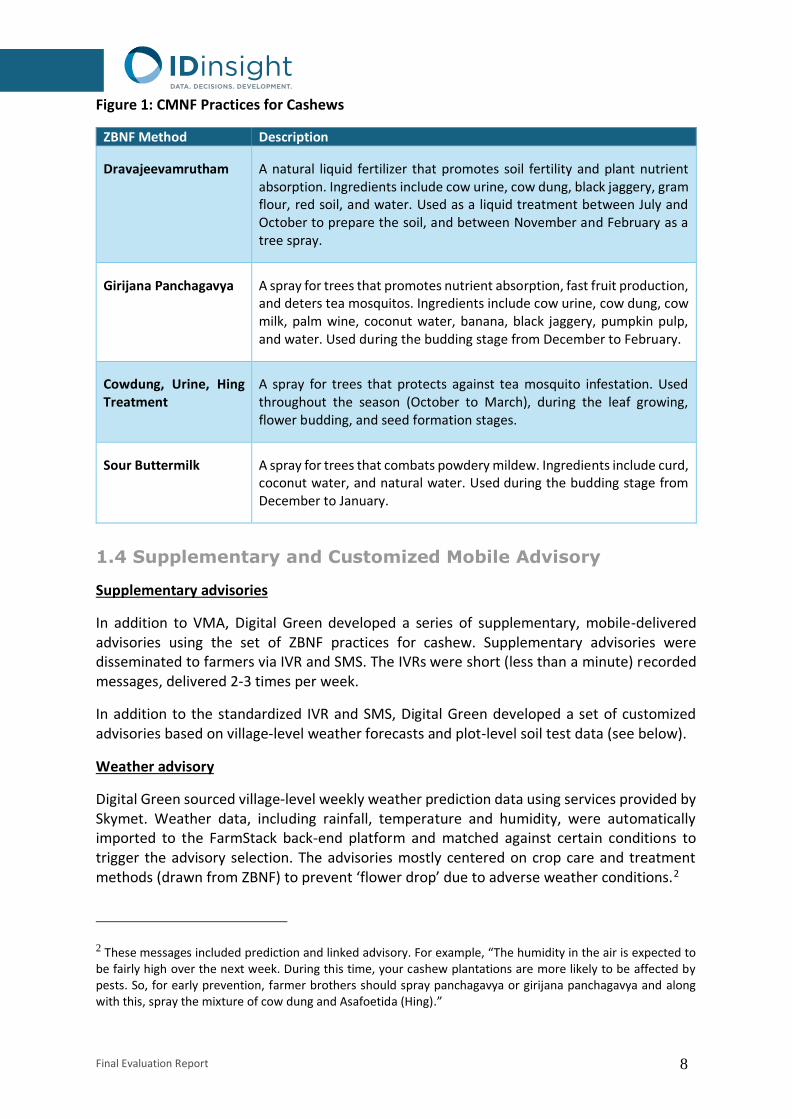
Incidence of flower drop / crop infestation
Farmers are asked whether the incidence of ‘flower drop’ and ‘crop infestation’ is lower, higher, or the same relative to the last growing season (2019). We assess the proportion of farmers reporting lower incidence of each malady.
Farmer Production (2020)
Farmer self-reported total production (kg) from cashew orchard.
Farmer Yield (2020)
We calculate yield based self-reported production (kg) and total acreage of cashew trees.
We did not collect any farmer-level data for cost of cultivation, labour or inputs. We do conduct a cost-effectiveness analysis from implementation standpoint. Due to survey length constraints and the low number of respondents effected (relative to video, supplementary advisory, and weather advisory), we chose to not survey respondents about the soil advisories.
As described earlier in the sampling section, we selected cashew farmers from non-intervention areas nearby our treatment areas. To improve the comparability, we used propensity score matching to select a non-intervention sample that was similar to our treatment groups on important pre-intervention characteristics. We matched control farmers to the video-only group on the area of cashew cultivation, the previous years’ cashew harvest, and the gender of the respondent. This resulted in a non-intervention sample of 363 farmers, weighted to improve comparability on the matching variables.
Although we attempted to create a non-intervention group that was comparable to our intervention group, there are a number of reasons to be skeptical that this group is a true counterfactual to our treatment groups. First, these farmers are from somewhat different areas (mandals) within districts, where cashew cultivation may be different. Second, they are outside the area of operation of the local NGOs that DG worked with, meaning they may have received different support for cashew production over the years. Third, we had few pre-intervention variables, and they may not have been very accurate since they relied on recall from the previous season. This means that our matching technique has limited credibility.
Overall, we believe that the non-intervention group provides a useful comparison, but cannot be used to develop causal estimates of the impact of Digital Green’s program. We therefore present means of key outcomes for our non-intervention group, but do not calculate treatment effects of our treatment arms in comparison to the non-intervention group. These comparisons give indicative results on the impact of Digital Green’s program, but also may suffer from selection bias.
The table in Appendix A demonstrates balanced characteristics for the three study arms, in terms of age, gender, household size, cashew acreage, last year’s cashew production, and survey round. There are no significant differences in attributes between the two experimental arms (2) and (3), though we note small differences in household size when comparing to the non-intervention arm.

Final Evaluation Report 18
3.2 Process Evaluation
3.2.1 Methodology and Sampling
Our process study examines various operational and programmatic questions relevant to FarmStack scale-up. First, we surveyed the same RCT sample of farmers and on the utility of the platform along five dimensions (see Figure 7). We also repeated these questions for a set of 49 of Digital Green’s functionaries who received IVR messages. Each dimension was numerically scored between 1-3, where 1 was the lowest degree and 3 was the highest degree. Additionally, we surveyed farmers and functionaries on the benefits and barriers to using FarmStack.
Figure 7: Platform utility dimensions
Dimension Farmer Functionary
Ease Ability to participate in video disseminations; ability to retrieve IVRs, including in low-network zones
Ability to retrieve IVRs, including in low-network zones
Understanding Intelligibility of videos and IVRs; comprehension of video and IVR content
Intelligibility of IVRs; comprehension of IVR content
Timeliness Timely receipt of video and IVR content at correct point in cashew season
Timely receipt of IVR content at correct point in cashew season
Relevance Accuracy and relevance of information in videos and IVRs
Usefulness IVR content; applicability to extension communities
Influence/consistency Influence: Extent to which video and IVR content influenced cultivation activities
Consistency: Extent to which information provided in the videos and reminder calls were complementary.
Secondly, we performed in-depth interviews with key staff from Digital Green and its partner organizations to understand the operational successes and challenges of FarmStack. In order to get a holistic view of implementation, we discussed with stakeholders from various capacities and roles in the planning and execution of the project. We spoke to one person each from the following teams:
1. Digital Green: a. State program team - responsible for partnerships and operations apart from
program strategy and planning at state level

19
b. Technology team - leads development and deployment of the FarmStack platform; their work involves all technical aspects related to designing and integration of multiple platforms and data systems
2. Partner Organizations: a. Kovel Foundation - Chief functionary along with other team members
responsible for implementation in three districts b. Velugu Association - Chief functionary of the organization responsible for
implementation in one district 3. Field Team:
a. Field Coordinators - managed mandals within districts of operation and each led a team of around five functionaries who were responsible for video dissemination at the village level
3.2.2 Data collection
Process questions for farmers were included in the same household survey as used for RCT. A separate functionary questionnaire for process questions was developed. We share these results at the beginning of the Quantitative Section.
For key stakeholder interviews, we conducted in-depth, semi-structured phone interviews with the identified respondents. At the onset of each discussion, we provided an overview of our study’s objectives to ensure they understood the purpose of the interview, and to encourage them to share information beyond our prepared questions. Additionally, we took verbal consent to record these interviews for post-interview transcribing.
3.2.3 Analysis
In our quantitative analysis, we took the mean of each farmer and functionary process score across the five dimensions. We also took a simple distribution of farmer and functionary reported benefits and barriers to using FarmStack.
For qualitative interviews, the transcribed data was cleaned for analysis and the answers were segregated by question and categories by respondents. Given the small sample size, no software was used for creating codes and themes; this was done manually, ensuring compilation of comprehensive summaries of responses. In Figure 8, we outline all of the key outcomes and variables for the process evaluation.

Final Evaluation Report 20
Figure 8: Key outcomes for process evaluation
Outcome Variable Source Description
Platform utility ● Farmer perception scores
● Functionary perception scores
● Farmer survey
● Functionary surveys
● Average ratings of each dimension: Ease, Understanding, Timeliness, Relevance, Influence
● Reported barriers to adoption
● Reported benefits of platform
● Farmer survey
● Functionary surveys
● Proportion of farmers/ functionaries reporting barriers and benefits
Experience ● Value add of FarmStack
● Partner relationships ● Barriers and
challenges
Key Stakeholder Interviews
● Aspects of the platform that are identified as achievements by various stakeholders
● Challenges in the execution or implementation of the platform
Recommendations ● Opportunities for growth
Key Stakeholder Interviews
● Suggestions to enhance the benefits of the platform and potential areas of improvements
4. QUANTITATIVE RESULTS
4.1 Farmer access to extension
First, we examine the extent to which farmers received the intended extension programs. Results are outlined in Figure 9 below.
Figure 9: Access to Extension Services Received in IDinsight sample
Type Videos IVRs Weather Access rate 68.4% 59.0% 31.4%
Sample Size 2132 1068 1068
To assess access to Digital Green services, we first use our phone survey data. In the two treatment groups, 68.4% of farmers reported viewing a cashew video by Digital Green via group video screenings. Of those farmers, the average number of distinct videos seen was 3 (out of 11). In the Video+IVR group, 59.0% of farmers reported receiving an IVR call. Of those respondents, the average number of IVR messages received was 12 (out of 22). Also in the Video+IVR group, 31.4% reported receiving an IVR-based weather advisory. The average number of weather advisories received (among those who received at least one) was 9.

21
We also assessed IVR pick-up and listen rates using call logs from the Exotel and Awaaz De platforms provided by Digital Green. Analyzing data on 20 IVR rounds from January 13 to April 27, we find that 5024 out of 6160 recipients (81.6%) successfully picked-up at least one IVR. Of those farmers, the average number of IVRs picked-up was 7, and the average listening time was 29.57 seconds. The majority of those farmers (55.74%) listened to the IVRs for an average of 20 seconds or more. 32.54% listened to them for an average of 30 seconds or more. These figures suggest relatively strong engagement with the messages, as the IVRs were 40 to 57 seconds long (average of 47.25). We provide the full distribution of listening time in Figure 10.
We note our sample’s self-reported IVR pick-up rate is 22.6 percentage points lower than what we estimate in the call logs from Exotel and Awaaz De. This discrepancy may be driven by two, overlapping factors. First, the lapse between IVR dissemination (January-April) and data collection (June-August) may have negatively affected farmers’ recall of receiving IVRs. Secondly, if respondents did not listen to individual IVRs for very long, they may not have recalled receiving them. Figure 10: Distribution of listening times of supplementary IVR messages
Average IVR length = 47.25 seconds

Final Evaluation Report 22
4.2 Farmer perceptions of extension
We assessed farmer user experience with receiving videos, supplementary IVR and Weather advisory. Participating farmers rated their satisfaction (on a scale of 1=Lowest to 3=Highest) with DG’s services for the following five dimensions:
1. Ease (E): ability to participate in video disseminations; ability to retrieve IVRs, including in low-network zones
2. Understanding (U): intelligibility of videos and IVRs; comprehension of video and IVR content
3. Timeliness (T): timely receipt of video and IVR content at correct point in cashew season
4. Relevance (R): accuracy and relevance of information in videos and IVRs 5. Influence (I): extent to which video and IVR content influenced cultivation activities
In general, all three dissemination types received high scores for most dimensions. Farmers reported supplementary IVR and weather IVR were highly relevant and easily understandable but somewhat difficult to access, in part due to network and other technical issues. With all three types of extension, farmers described only moderate levels of influence on cultivation practices, which we explore quantitatively later in the report. We then disaggregate these perception scores by gender (Figures 119. and 12 below). Overall, we find that males and females have similar perception of the IVR messages across most categories.
9 The first panel, Video, pools responses from both Video-only and Video+IVR farmers. The second (IVR) and
third (Weather) panels draw from the Video+IVR group.

23
Figure 11: Farmer Utility Scores (Male Treatment Farmers)
Figure 12: Farmer Utility Scores (Female Treatment Farmers)

Final Evaluation Report 24
In Figure 13, we also explore the barriers treatment farmers typically encountered in adopting the disseminated practices. Among treatment farmers who received video extension, 54% cited no barriers in adoption. Among the remaining, the most highly cited barrier was “poor access to the requisite inputs”, followed by “too high effort.” These barriers are further illuminated in the Qualitative Findings Section below.
Figure 13: Barriers to adopting practices by video participants
Lastly, we surveyed recipients of IVR on the advantages of multiple extension channels. In Figure 14, the three most cited benefits were that IVRs “served as reminders of the video content”, “encouraged adoption of practices”, and “improved understanding of video content.”

25
Figure 14: Most cited benefits of the IVR add-on by treatment farmers
4.3 Functionary perceptions
We go on to assess functionaries’ experience with the Reminder IVRs. Through phone surveys, we asked treatment functionaries to rate their satisfaction along five dimensions (similar to those used with farmers):
● Ease (E): ability to retrieve IVRs, including in low-network zones ● Understanding (U): intelligibility of IVRs; comprehension of IVR content ● Timeliness (T): timely receipt of IVR content at correct point in cashew season ● Relevance (R): accuracy and relevance of information in the IVRs ● Consistency (C): extent to which video and IVR content was consistent
Aggregate results are provided in Figure 15. Functionaries scored the dimensions Understanding, Relevance, and Consistency the most highly. They scored Ease the lowest, which is consistent with reports from farmers and reflective of reported network and technological challenges.

Final Evaluation Report 26
Figure 15: Functionary Utility Scores
In Figure 16, we explore the barriers reported by FAs in following the Reminder IVRs. The majority of FAs reported no barrier. Of those who did, the most highly cited barriers were “difficulty in receiving the IVR” and “receiving the IVR at the incorrect time in the season.”
Figure 16: Most cited barriers to adoption of IVRs by functionaries

27
Next, we surveyed treatment FAs on their perceived advantages of Reminder IVRs (Figure 17). The most cited benefit was that the IVRs informed FAs of which videos they should show at a given point in the season. The IVRs’ influence on showing more types or a greater overall quantity of videos was less pronounced. Figure 17: Benefits of IVR Reminders
Lastly, we asked FAs to describe what they believe to be the benefits of FarmStack for farmers (Figure 18). The two most cited benefits were that the supplementary IVRs served as reminders about the disseminated practices, and encouraged farmers to adopt those practices. This is highly consistent with farmer reports on the same indicator, except farmers also emphasized the role of IVRs in boosting their comprehension of ZBNF practices.

Final Evaluation Report 28
Figure 18: Functionary Perspective on Benefits of Supplementary IVR for Farmers
4.4 Farmer recall of practices
Moving to farmer outcomes, we begin by measuring farmer recognition (or, recall) of the 4 promoted technologies. Surveyors provided farmers with the name and a brief prompt for each practice10, and asked farmers if they recognized the technique.
Across all four practices, farmers in the Video+IVR group reported higher recall rates relative to those in the Video-only group. Dravajeevamrutham was the most highly recognized practice (for all groups), and FarmStack led to a significant 7 percentage point increase (51.3% to 58.3%) in recall over the base program. Sour Buttermilk was less known, but the Video+IVR group reported a significant 9.1 percentage point increase (29.3% to 38.4%) in recognition.
Additionally, the treatment groups show much higher recognition of practices compared to the non-intervention group — for example, approximately a 50 percentage point difference in recall of Dravajeevamrutham. However, these numbers do not constitute rigorous treatment effects of Digital Green’s programs due to limited comparability between the treatment and non-intervention areas.
10 An example prompt was, “Dravajeevamrutham is a natural liquid fertilizer for cashew trees.”

29
We did not measure any significant difference in recall rates by gender.
Figure 19: Average Recall Rate of Practices
4.5 Farmer knowledge
Next, we assess farmer comprehension of the disseminated practices, using both discrete knowledge scores and a composite index.
Knowledge scores are calculated as the percentage of elements correctly reported per knowledge question11. For three of the practices, farmers were independently tested on the “usage” and the “ingredients” of the specified technology (totalling six knowledge questions). For one practice, Cowdung, Urine, and Hing Treatment, only the “usage” was tested, as the
11 There were two types of knowledge questions for each practice: usage (e.g. what are all the purposes of Dravajeevamrutham?) and ingredients (e.g. what are the recommended ingredients of Dravajeevamrutham?). Surveyors had a list of correct answers to each question (drawn from the ZBNF videos), and did not read them aloud to farmers. When farmers reported a correct purpose or ingredient, those elements were checked. When farmers reported an incorrect answer, the option ‘other’ was selected. In our analysis, we calculate the average of correct elements per knowledge question (correct elements/total elements). On all ‘ingredient’ questions, we subtract a point when a farmer objectively reported an input not specified by Digital Green (i.e. ‘other’). We do not subtract answers coded as ‘other’ on “usage” questions, however, as enumerator notes indicated that e farmers reported slightly different but not entirely incorrect usage from our provided list.

Final Evaluation Report 30
practice name contains all the ingredients. The resulting seven knowledge scores are presented by treatment group in Figure 20.
Altogether, we find positive and significant gains for six out of the seven scores in the Video+IVR group.
● On Dravajeevamrutham, we see a 5.9% increase in knowledge of usage (17.1% to 22.9%), and a 4.5 percentage point increase in knowledge of ingredients (20.6% to 25.1%).
● On Girijana Panchagavya, we see a 2.9% gain in knowledge of usage (8.8% to 11.7%), the increase in knowledge of ingredients is not statistically significant.
● On Cow Dung, we see a 4.5% increase in knowledge of usage (11% to 15.5%). ● On Sour Buttermilk, we see a 3.6% increase in knowledge of usage (9.2% to 12.8%),
and a 3.7% increase knowledge of ingredients (7.1% to 10.8%)
Figure 20: Knowledge Scores by Practice and Treatment Group
In the case of all seven scores, knowledge is substantially higher among treatment farmers
relative to the non-intervention group. However, again, these comparisons do not allow
rigorous treatment effects of Digital Green’s programs due to limited comparability.
To get an overall view of knowledge gains, we combine the knowledge scores in an inverse-covariate weighted index as popularized in Anderson (2008). In Figure 21, we see the Video+IVR treatment drives a strongly significant increase (0.232 SDs) in overall knowledge.

31
Figure 21: Knowledge Index Score
Lastly, we examine the relative effects of Video+IVR on knowledge for male versus female respondents. In most cases, there were not significant differences in treatment effects for men versus women. We measure a significant difference in two cases.
● Women’s knowledge of ‘Dravajevamrutham usage’ increased by 4.91 percentage points more than it did for males (10.33 versus 5.42 percentage points over the Video-only group).
● Women’s knowledge of ‘Cow, Urine, and Hing usage’ increased by 3.31 percentage points more than it did for males (10.16 versus 6.85 percentage points over the Video-only group).
In these two cases, women were more likely to recall knowledge components of the ZBNF practices than men12.
4.6 Farmer adoption
Gains in farmer knowledge were followed by increases in the uptake of practices. The adoption rate (of at least one practice) in the Video+IVR group is 8.6 percentage points higher than in the Video-only group (41.1% to 49.7%).
12 The differences between male and female knowledge scores were significant at the 10% level (p<0.1)

Final Evaluation Report 32
Farmers in the Video+IVR group also adopted more distinct practices than those in the Video-only group. We find the IVR add-on led farmers to adopt a higher share of promoted practices being adopted by 5.0 percentage points (45.5% to 50.5%). This means that farmers in the Video-only group adopted an average of 1.82 (out of 4) practices, while farmers in the Video+IVR group adopted an average of 2.02 practices
In Figure 22, we show adoption effects for each of the four practices. While overall adoption rates are modest, we see significant increases across the board with the addition of IVR.
● For Dravajeevamrutham, Video+IVR led to a 7.6 percentage point increase in adoption (30.6% to 38.2%);
● For Girijana Panchagavya, a 6.6 percentage point increase in adoption (15.0% to 21.6%);
● For Cowdung, Urine, and Hing Treatment, a 4.7 percentage point increase in adoption (13.9% to 18.6%);
● For Sour Buttermilk, a 6.7 percentage point increase in adoption (15.5% to 22.2%).
Our non-intervention area reported very little adoption of any of these practices.
Table 22: Farmer Adoption of 4 Practices
We then explore adoption effects by gender. We find the IVR add-on encourages more women than men to adopt at least one practice (17.5 versus 6.7 percentage points gain over Video-only), although the difference in treatment effects between genders is just outside of conventional norms of significance (p=0.114). We illustrate this in Figure 23.
33
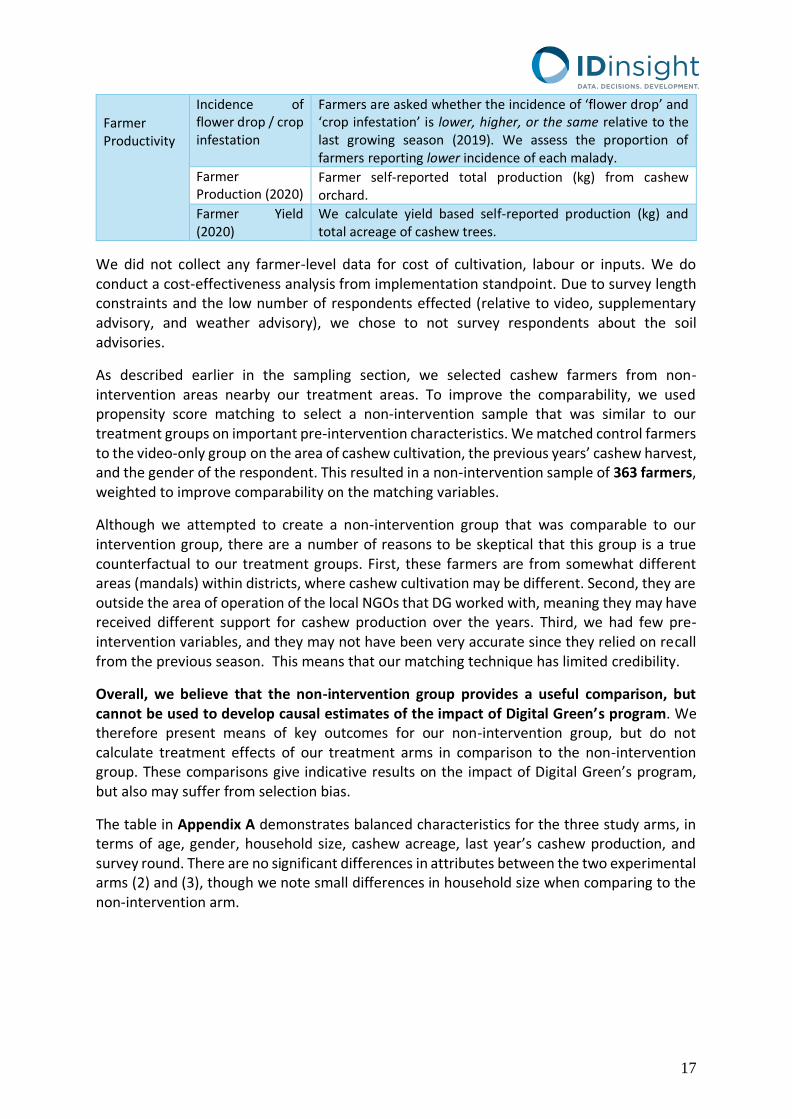
Table 23: Adoption of at least one practice by gender
Next, we consider the effects of videos and IVR on adoption rates within each of the two program groups. Within the Video-only group (Figure 24), we find farmers who reported watching videos had higher adoption of at least one practice by 40.8 percentage points, relative to not watching videos (14.2% to 55.5%). Within the Video + IVR group (Figure 25), farmers who reported receipt of IVR had higher adoption of at least one practice by 26.1 percentage points, relative to not receiving IVR (34.3% to 60.4%, p = 0). Note that since viewer/recipients may be systematically different than non-viewers/recipients, these estimates should not be interpreted as a causal relationship between receiving extension and adopting. However, it does show that there is a positive correlation.

Final Evaluation Report 34
Table 24: Adoption of at least one practice within the Video-only group
Table 25: Adoption of at least one practice within the Video+IVR group

35
4.7 Farmer production and yield
Next, we assess the effects of FarmStack on farmer productivity. While the practices studied are meant to decrease flower drop and therefore increase production, production gains may not show up in the first year of implementation. This is because the IVR messages were not delivered as early in the season as would have been optimal, plus some of the practices (such as soil amendments) will not result in immediate gains in yield. Also, production and land area are difficult to measure accurately over a phone-based survey. With these caveats in mind, we explore whether FarmStack managed to increase productivity within the constraints of this study.
As described earlier, reducing crop infestation and flower drop are two intermediate outcomes that contribute to enhanced farm productivity. In our surveys, we asked farmers whether their levels of infestation and flower drop in the current season (2020) were “more, less, or the same” relative to the previous season (2019).
In comparison to Video-only farmers, more Video+IVR farmers reported a ‘lower incidence of infestation’ in the current season (23% vs 29.3%). Additionally, more Video+IVR farmers reported ‘less flower drop’ in the current season (12.2% to 15.6%), though this difference was not significant (p = 0.132).
In terms of 2020 production, we see a 10.68 kg increase (130.21 to 140.89 kg, 8% relative increase) in the Video + IVR group relative to Video-only. We also find a 8.65 kg/acre gain in cashew yield (55.82 to 64.47 kg/acre) with the addition of IVR. However, the difference between treatment groups is not significant for either production or yield.
Interestingly, while we see dramatic differences between non-intervention and treatment farmers in recall, knowledge, and adoption outcomes, these do not appear in measures of productivity. Non-intervention farmers produced an average of 127.12 kg of cashews, and an average of 46.17 kg/acre of cashew yield.

Final Evaluation Report 36
Figure 26: Farmer Production and Yield in 2020
However, when we disaggregate these effects by gender, we find women actually saw substantially higher production gains from the IVR relative to men (5.57 kg v 34.30 kg, p = 0.079). For just the sample of women, the increase in yield is marginally statistically significant (p=.087), and represents a 38% relative increase in production. We illustrate this in Figure 27. We also see larger treatment effects for women on yield, but these are not statistically significant

37
Figure 27: Farmer Production by Gender (2020)
While the large treatment effects on production for women are interesting, they should be interpreted with caution, as women make up a small proportion (17%) of the sample.
Altogether, the evidence suggests a higher adoption rate of ZBNF practices (as a result of the IVR add-on) has a meaningful influence on intermediate outcomes such as reduced crop infestation. However, we see unclear outcomes on production and yield. This may be because production is noisily measured in the survey (we see considerable variance in this outcome), or because it may take more than one season for these practices to have an effect on production. It also may be possible that the promoted practices do not have a meaningful effect on cashew production in this context.
We note that cashew production across all three arms decreased substantially between 2019 and 2020. Respondents noted environmental factors such as bad weather leading to the loss in production. These shocks may have also disrupted the normal efficacy of ZBNF for improved cashew productivity.
On average, farmers produced 365.20 kg in 2019 and produced only 134.62 kg in 2020, which saw poor weather that affected production. Therefore, the (modest) treatment effects on productions should be seen as dampening a decline in production rather than causing an absolute increase.

Final Evaluation Report 38
4.8 Reflections on Gender
Our gender-disaggregated results show a pattern that our Video+IVR treatment seems to be more effective for female respondents13. Although the differences do not show up in all outcomes and are not always statistically significant, we do see some indications that the treatment was more effective for women on knowledge, adoption, and production. While these results are intriguing, we believe they should be interpreted with caution. Our sample of female respondents for the Video vs Video+IVR comparison is quite small, at 383. It’s therefore possible that these results reflect an imbalance between the two treatment arms rather than a real treatment effect, since randomization does not necessarily produce balance in small samples. Also, given the small sample there tends to be low precision on estimates of the female-only sample, which gives us less confidence in our results. That being said, we see these gender effects as an intriguing area for future research. It may be the case that women are simply more receptive to phone-based extension. Or it may be that women have lower production, and therefore have more to gain from additional extension. (We indeed see lower production and yield for women in your sample.) If IVR extension is more effective for women, this presents an exciting opportunity to close the gender gap in technology adoption.
4.9 Cost Effectiveness
To calculate the cost-effectiveness of the FarmStack pilot, we first need to identify the marginal cost for implementing FarmStack over the standard video-based approach. To do this, we used cost documents from the full implementation (which also included video-dissemination activities) and identified the marginal cost from including FarmStack. In our calculations, we used budget utilization numbers for Digital Green’s operational costs as well as budget data from their implementation partners (Kovel Foundation and Velugu Association). Along with this, we used DG’s monthly workplan to identify FarmStack related work to select marginal costs. As FarmStack expenses were not tracked ex-ante, the cost calculations are based on ex-post assumptions and should be interpreted cautiously. To calculate the marginal FarmStack cost, we identified two types of cost categories from the budget utilization numbers of this pilot.
1. Cost categories that were added solely for FarmStack pilot, like soil and weather data cost, and consultant cost for advisory. This full cost was accounted for resulting from Farmstack.
2. For cost categories that were partially associated with FarmStack, like personnel and travel, we calculated the marginal costs using high-level assumptions. This was done using the work plan of monthly activities for selected line items for FarmStack. This included activities such as file operation set up, collection of farmers’ phone numbers,
13 The respondent was defined as the person in the household who is most knowledgeable about cashew cultivation.

39
soil sample collection, and technology development for integration. For the selected months, the costs for the technology team and program team were accounted as being marginal FarmStack costs. See the table below for this breakdown.
Figure 28: Digital Green’s personnel cost assumptions
For implementing partners, only the initial three months of operations (October to December 2019) activities were identified for purely FarmStack work. For personnel, 30% of the field animators cost was accounted as marginal cost. Total travel cost for the same period is allocated for only FarmStack related activities. Of the other direct costs, soil sample collection and testing was also accounted as marginal FarmStack cost. All of the remaining costs including PICO projectors and other direct costs were dropped from this calculation as they were not exclusively related to the FarmStack implementation. Using these assumptions, the total marginal cost of FarmStack was 53,056 USD, resulting in a cost per farmer of approximately 9 USD. For calculating the scale-up cost, we categorized the costs that would not increase linearly with the addition of more villages or farmers as non-linear cost. We assume that the non-linear cost is the set-up cost and would be a onetime expense. This includes program costs, technology team costs for setting up operations, and consultant costs for advisory services. All the remaining categories were identified as linear costs for scale-up. We assume that with scale-up the weather and soil data cost could be availed with a 30% discount. Figure 29: Scale-up cost assumptions
Source of Cost
Cost Categories Marginal FS cost For Scale-up
DG Cost
Weather and Soil data cost
Fully marginal FS cost linear (30% discount)
DG consultant Fully marginal FS cost non-linear
Personnel Program and Tech staff costs in May-June '19
and 3/4 the tech costs from Oct '19 to May '20 non-linear
Travel Program and Tech staff costs in May-June '19
and 3/4 the tech costs from Oct '19 to May '20 linear
Velugu and Kovel
Personnel 30% Field Animator’s cost in Oct-Dec'19 linear
Travel All travel cost Oct-Dec’19/Jan'20 (For
Kovel/Velgu) linear
Other direct cost Only research and soil sample collection cost linear
The total marginal cost of reaching the 5770 farmers who participated in the FarmStack pilot is USD 53,056. Based on these assumptions we find that the non-linear cost of the FarmStack

Final Evaluation Report 40
pilot was USD 33,126. The per farmer linear cost is approximately $3.5. Therefore, we assume the total scale-up cost for X farmer in USD is 33126 + 3.5X. As an example, if the program were to scale to 10x its current size (57700 farmers), we estimate that the total cost would be 235,076 USD, for a per-farmer cost of around 4 dollars. We can combine our impact results with this cost data to calculate a simple cost-effectiveness estimate. We mentioned in the results section that Video+IVR farmers use a 5 percentage points higher proportion of promoted practices than Video Only farmers. Since we asked about 4 practices, this means that Video+IVR farmers on average adopted .2 more practices. Given the at-scale cost of $4/farmer, this means that we expect FarmStack to cost around $20 USD per adoption. This simple calculation is likely an overestimate of the cost/adoption for a couple of reasons. First, Digital Green promoted many techniques, and we only asked about four of them in our survey. Therefore, it is possible that the program was influencing many adoptions that are not captured here. Second, this only captures effects over one season. If farmers continue to adopt in future seasons (without the FarmStack program continuing), this would increase cost-effectiveness.
5. ADDITIONAL QUALITATIVE FINDINGS To add insights to our quantitative results we conducted a small sample in-depth interviews with Digital Green, partner organizations and field coordinators. The main objective was to collate the experience from different perspectives and gather suggestions on strengthening the FarmStack platform.
We mainly find that the platform has been successful in providing customized advisory to cashew farmers, who have not been prioritized by traditional extension systems. There were some implementation challenges like connectivity, timely dissemination and access to inputs which hinder adoption of practices. Digital Green is considering revisions in terms of the type of advisory and what crops are included.
In this section we first highlight the stated achievements of the FarmStack program, and then discuss challenges shared. We close with some suggestions shared on future iterations of the platform.
5.1 Achievements
Digital Green, through its implementing partners, has received feedback that farmers have experienced benefits from the information received. In general, yields this year were low because of delays in flowering, untimely rain and high infestation. Despite this, some farmers who adopted the promoted practices shared that they had experienced lower flower drop than the previous season. The main achievements discussed include:

41
1. Easy and Accessible: The information sent through phones worked as a reminder of practices discussed during video dissemination. The soil nutrient advisory (which was sent via SMS) was easy to understand and readily accessible when needed.
2. Customized and Targeted Dissemination: While the video showings are important for leveraging the advantage of community in introducing new practices, it is practically infeasible to share dynamic information at an individual level in these meetings. Hence, the IVRs and text messages came particularly handy in sharing weather predictions and soil-testing based recommendations for individual farmers.
3. Developed Structure for Platform: As FarmStack model integrates data from various sources, it is a humongous task both to collect and collate the data from diverse platforms. Digital Green has been able to successfully gather farmer level profile data for 8000 farmers. Of these they collected soil test data for 2000 farmers at individual level. This includes efforts in gathering primary data from the field, connecting external data sources and setting up systems to send out information. While this is the basic structure, it will serve as the foundation for future iterations of the FarmStack model. The technology team aims to improve the user (internal) experience so that setting up of dissemination can be done easily by the program team.
4. Fast Roll-out and Reach: Given the strong network and rapport of partner organizations, the project was quickly rolled out after the planning stage. The targeted groups of farmers have mostly been left out of the traditional extension services because of their remote locations and have for the first time received customized recommendations based on weather predictions and soil tests. Because of promising production, farmers have begun to focus on cashew as a main crop as opposed to being an alternate or secondary crop. The IVRs and SMSs also helped in building trust in addition to keeping constant touch with farmers through in-person visits.
5. Continued Support through Pandemic: While in-person video extension was stalled in March and April, due to the COVID-19 lockdown, this project continued to provide information to farmers through FarmStack IVRs and SMSs through May. While all other projects by the partner organizations were not active, the FarmStack pilot project continued its remote operations. This also led to partner organizations to switch to other technologies, like WhatsApp, to connect and reach farmers. There have also been some reports of exchange of information from FarmStack within the farmer network within villages as well.
5.2 Challenges
As design and implementation of this platform was done from scratch, there were a few challenges and lessons from this pilot.
1. Connectivity and Network: There were connectivity and network issues in reaching the farmers through mobile phones as the pilot included few extremely remote areas. Because of this, there were partial pickup rates and early disconnections due to call drops. Also, as per telecom regulations, a calling number gets marked as spam if the response rate to the calling number is low or is marked so by users. Because of this, the number from which calls were sent needed to be revised/updated regularly, so that respondents wouldn't avoid calls from ‘spam’ numbers. Suggestions to address these problems included proactive communication and awareness generation about

Final Evaluation Report 42
such calls so that the response rate is good. In some areas, recorded messages were circulated by partner organizations on WhatsApp groups of farmers to overcome the connectivity issues.
2. Data Integration: There were issues in integrating weather, soil test and farmer profile data from various sources, because of data formats and manual data entry errors. This could be resolved with a structured data entry format.
3. Access to Resources: While some practices required farmers to use equipment or resources that were not available because of financial constraints, Digital Green and partners organizations were able to work in ‘convergence’ with various state government departments to help farmers avail subsidy for purchasing the required tools like sprayers and tarpaulin mats. Additionally, farmers who did not have access to ingredients for inputs used in ZBNF had followed up with organizations for more information and help. Some farmers also ended up purchasing inputs like cow urine and dung from other farmers in villages
4. Other Areas of Information: Given that farmers have adopted ZBNF practices there could be more support on organic certification to avail better prices for their produce. Though this is not directly linked to FarmStack, it is useful to keep in mind that avenues for better income can motivate farmers to adopt and sustain adoption of practices.
5. Tenure and Timing: Implementing partners suggested that eight months is too short to be educating farmers for behavioural change and switch to ZBNF farming. There were suggestions of at least providing this support for two to three years in the same area. Additionally, because of various external factors, the dissemination through mobile phones was slightly delayed in the season (even though video dissemination was ongoing). The timeliness of recommendation is important in driving adoption and if the objective is to use the IVRs and SMS as reminders, then on-time implementation is essential.
5.3 Opportunities for Growth and Scale up
Based on experiences in this pilot, Digital Green is already planning a number of improvements of the model.
1. More Data and Technology: Digital Green is planning to integrate other technology partners (for example satellite imagery and market linkages), to provide diverse information along the value chain. Partner organizations have suggested adding more information on market linkages for better price realization. Furthermore, while some data has already been collected (soil test samples), there is scope to assess extrapolation (if done accurately like the Soil Information Systems developed by Cereal Systems Initiative for South Asia) for more farmers in the same geography to receive recommendations using the same test data. Additionally, as the data sets grow, some of the manual process of soil test data entry also will need to be automated. As the scope of the platform expands, there is a need to protect it from data security threats.
2. Increase Scope: Most of the stakeholders involved suggested increasing the coverage to reach more famers by expanding geography and to crops like millets, pulses, and vegetables. As we write this report, Digital Green is internally considering such an

43
expansion. They are in the process of collecting relevant data and identifying use case this platform.
3. Demand Driven Service: This project is a part of an ambitious technology model where eventually the hope is to develop individual profiles, where farmers can track the history of their cultivation at plot level (land size, crops, inputs, harvest etc.) and make agricultural decisions. This could then also become a demand driven service where only relevant and/or requested information is shared with the farmers.
6. CONCLUSION
Overall, we find that the addition of IVR combined with video dissemination led to positive and significant increase in knowledge and adoption of practices but had inconclusive effect on production. This could either be because of practice related limitations or high variance in the reported data. We do find that females (small sample) seeing somewhat higher treatment effects for knowledge and adoption, and they also show a positive and significant increase in production. These effects are encouraging as this was the first season of cashew where information was shared with farmers through IVRs. Farmers found the information received through IVRs to be highly relevant and easy to understand. The most common benefits of receiving IVR by farmers were reminders of practices and encouragement to adopt. Farmers who did not adopt any of the four practices did so because of lack of resources or practice being too high effort. The functionaries found the information received through IVRs to be useful for dissemination. The content was easy to understand, relevant and consistent. The main reported benefit of receiving the IVRs was to remind them of correct topic and timing of video dissemination. Through use of technology, extension information was able to reach remote farmers and a horticulture crop generally deprioritized by traditional extension systems. DG is already in the process of exploring next use cases in terms of crop and type of information. The iteration of FarmStack in Andhra Pradesh could aim to address barriers to adoption, connectivity and inclusivity. This being the first year using IVRs messages to reach cashew farmers, there is scope to test sustainability and scalability of information disseminated through IVRs. In the long-run also useful to evaluate if adoption of ZBNF practices lead to an increase in production, cost saving and soil conservation.

Final Evaluation Report 44
7. REFERENCES
1. Cole, Shawn Allen, and A. Fernando. "‘Mobile’izing Agricultural Advice: Technology Adoption, Diffusion and Sustainability." Harvard Business School Finance Working Paper 13-047 (2016)
2. Fabregas, Raissa, et al. SMS-extension and Farmer Behavior: Lessons from Six RCTs in East Africa. Working paper, 2019
3. Fabregas, Raissa, Michael Kremer, and Frank Schilbach. "Realizing the potential of digital development: The case of agricultural advice." Science 366.6471 (2019)

45
8. APPENDICES
Appendix A: Balance Table
Balance Table of Study Arms with Non-intervention weighting
(1) (2) (3) t-test t-test t-test
Non-intervention Video-only Video + IVR (1)-(2) (1)-(3) (2)-(3)
Variable N/[Clusters] Mean/SD N/[Clusters] Mean/SD N/[Clusters] Mean/SD
farmer age 1016 33.315 1029 34.612 1004 33.782 -1.297 -0.467 0.830
[61] [39.316] [78] [17.809] [81] [13.333]
farmer gender 1018 0.850 1064 0.820 1068 0.820 0.029 0.029 0.000
[61] [1.010] [78] [0.706] [81] [0.664]
household size 1016 4.895 1029 5.492 1004 5.375 -0.597*** -0.480** 0.117
[61] [5.262] [78] [4.356] [81] [3.900]
cashew acreage 1018 2.691 1064 2.763 1068 2.520 -0.072 0.171 0.243
[61] [6.549] [78] [3.951] [81] [3.138]
2019 production (kg) 1018 338.198 1018 361.576 994 350.708 -23.378 -12.509 10.868
[61] [1641.830] [78] [761.809] [81] [593.906]
survey tranche 1018 1.638 1064 1.747 1068 1.721 -0.110** -0.083* 0.026
[61] [1.463] [78] [0.672] [81] [0.629]
The value displayed for t-tests are the differences in the means across the groups. Standard deviations are clustered at variable location_no. ***, **, and * indicate significance at the 1, 5, and 10 percent critical level.

Final Evaluation Report 46
Appendix B: Regression Results
Table 1: Regression Results for Recall of Practices
(1) (2) (3) (4) Drava GP Cow Sour
Farmer assigned IVR .07** .066* .052* .091*** (.034) (.034) (.031) (.034)
Observations 2010 2010 2010 2009 R-squared .014 .012 .018 .017
Mean in 'Video Only' Group 0.513 0.270 0.260 0.293
Each column represents an OLS regression estimating the treatment effect of being assigned IVR messages
alongside videos. The omitted category are farmers in the 'Video-Only' group. Standard errors in parentheses are
clustered at the level of randomization (village or habitation). All regressions include the following additional
controls: age of respondent, household size, gender of respondent, size of cashew orchard, and cashew production
in the previous years. *** p<.01, ** p<.05, * p<.1
Table 2: Regression Results for Farmer Knowledge
(1) (2) (3) (4) (5) (6) (7) (8) Drava
Usage Drava Ingredient
GP Usage
GP Ingredient
Cow Usage
Sour Usage
Sour Ingredient
Index
Farmer assigned IVR
.059** .045* .029** .023 .045** .036** .037*** .971***
(.023) (.023) (.013) (.014) (.02) (.016) (.014) (.341)
Observations 2010 2010 2010 2010 2010 2008 2008 2011 R-squared .019 .021 .009 .015 .014 .009 .011 .02 Mean in 'Video Only' Group
0.171 0.206 0.088 0.074 0.110 0.092 0.071 2.513
Each column represents an OLS regression estimating the treatment effect of being assigned IVR messages
alongside videos. The omitted category are farmers in the 'Video-Only' group. Standard errors in parentheses
are clustered at the level of randomization (village or habitation). All regressions include the following
additional controls: age of respondent, household size, gender of respondent, size of cashew orchard, and
cashew production in the previous years. *** p<.01, ** p<.05, * p<.1
Table 3: Regression Results for Farmer Adoption
(1) (2) (3) (4) (5) (6) Any %_Applied Drava GP Cow Sour
Famer Assigned IVR .086** .05** .076** .066** .047** .067** (.036) (.025) (.034) (.026) (.023) (.026)
Observations 2011 913 2011 2011 2011 2011 R-squared .016 .021 .015 .018 .014 .015
Mean in 'Video Only' Group 0.411 0.455 0.306 0.150 0.139 0.155
Each column represents an OLS regression estimating the treatment effect of being assigned IVR messages
alongside videos. The omitted category are farmers in the 'Video-Only' group. Standard errors in parentheses are
clustered at the level of randomization (village or habitation). All regressions include the following additional
controls: age of respondent, household size, gender of respondent, size of cashew orchard, and cashew production
in the previous years. *** p<.01, ** p<.05, * p<.1

47
Table 4: Regression Results for Farmer Productivity
(1) (2) (3) (4) Flower Infest Production (kg) Yield (kg/acre)
Farmer Assigned IVR .034 .063** 10.679 8.652 (.022) (.028) (15.573) (7.189)
Observations 1937 1955 2001 2001 R-squared .023 .016 .298 .139 Mean in 'Video Only' Group 0.123 0.230 130.211 55.824
Each column represents an OLS regression estimating the treatment effect of being assigned IVR messages
alongside videos. The omitted category are farmers in the 'Video-Only' group. Standard errors in parentheses
are clustered at the level of randomization (village or habitation). All regressions include the following
additional controls: age of respondent, household size, gender of respondent, size of cashew orchard, and
cashew production in the previous years. *** p<.01, ** p<.05, * p<.1