Embed Size (px)
Citation preview
Walking School BusEvaluation Results2014-2015 School YearCenter for Public and Nonprofit ManagementUniversity of Central FloridaJune 2015
Tim PehlkeAssistant Director for Special Projects
Emily BachmanProgram Assistant

Table of Contents
1 Executive Summary
2 Introduction 3 Review of Year One Results
Youth Survey Results4 Demographic Information 5 Social and Emotional Development 7 Attitude Toward Risky Behaviors8 Physical Activity Level 9 Pedestrian Safety Knowledge 12 Benefits of Walking School Bus 12 Open Ended
Parent Survey Results14 Demographic Information 14 Parent Perceived Benefits15 Parent Observation of WSB Volunteers Results Volunteer Survey Results17 Demographic Information17 Volunteer Motivation Results 18 Volunteer Participation Benefits Results
20 Discussion

From April 2013 through June 2015 the UCF Center for Public and Nonprofit Management partnered with local school districts to organize and provide ongoing support to Walking School Bus (WSB) ini-tiatives in the Central Florida region. A total of 851 young people took part in WSB programming at 10 elementary schools across three counties. Participants walked along 13 routes under the supervision of a team of 70 volunteers that included a mix of parents, returning veterans and community members. Programming was offered in a variety of formats (including traditional, staging post, and a hybrid mod-el) that met on different days of the week (ranging from Wednesday mornings only to every day before and after school) to address the diverse needs of communities (e.g., health, safety, and/or traffic allevia-tion focused).
A total of 28 youth participated in the post-test survey. This constitutes 8% of the overall school-based WSB youth membership. Representatives from six of seven active schools completed the assess-ment, with the highest number of responses coming from Eagle’s Nest Elementary (n = 8) and Millennia Elementary (n = 1) providing the fewest responses. While completed surveys were received from all grades, participation was highest among second, third, and fourth graders (72% of the total sample).
Results highlight the positive impact of WSB programming across multiple domains. Active commuting rates rose sharply over the course of the program, increasing from 77% walking one day or fewer per week to 65% of respondents walking 3 or more days per week. These gains are particularly notewor-thy, as five of seven active sites walk only one day a week. Such results indicate that WSB participants become more likely to walk to school even on days when the program isn’t operating.
WSB members developed a mastery of key pedestrian safety concepts as a result of participating in the program. This includes the necessity of always looking “left, right, left” before crossing the street (12% gain), the importance of “walking on the left” when no sidewalk is present (6% gain), and “wait-ing for cars to pass and then look[ing] again” before crossing the street (4% gain). Improvements are still needed in knowing where to walk when no sidewalks are present. While a greater percentage of students answered this question correctly in the post-test (6% gain), the majority of responses were still incorrect (59%).
The remaining questions focused specifically on the impact of WSB programming. Responses indicate that participation increased youth’s likelihood of walking to school (61%). WSB was also considered a “fun” activity (92%), that taught youth to walk safely (73%), and exposed young people to caring adults (73%). The vast majority of respondents indicated that the program has, to some extent, taught them to enjoy the outdoors (97%), helped them make new friends (96%) and helped them pay better attention in class (70%). These findings were supported in results from the Parent and Volunteer surveys.
In conclusion, results from Year Two of the UCF Walking School Bus program identify gains that are supportive of the program’s goal of promoting health, safety, and friendship. Future work should utilize more robust samples that track a diverse group of respondents over the course of multiple years. Such work would benefit from the addition of a control group.
Executive Summary
1
In the fall of 2014, researchers from the Center for Public and Nonprofit Management distributed a pre-test survey to all students participating in the Walking School Bus Program (WSB) with a completed Institutional Review Board (IRB) form on file. The answers from this survey provided a baseline com-parison for determining the extent to which youth benefited from participating in WSB programming. Participants later received a post-test survey in the spring of 2015. The questions asked in both sur-veys pertained to student participants’ (1) social and emotional development, (2) attitudes toward risky behaviors, (3) physical activity level, (4) pedestrian safety knowledge, and (5) direct benefits from WSB participation. This survey is a modified version of the 2013 – 14 survey, with revisions made to pedes-trian safety and physical activity questions based on feedback from Year One findings.
During the same time period, pre-test and post-test surveys were distributed to parents of this same population of elementary school students to evaluate what benefits, if any, were obtained by families that had students participating in the WSB Program. The questions asked in both surveys pertained to parents’ perception of benefits for their family as a whole and for their children. Additional data was obtained through a pre-test and post-test survey of program volunteers and a follow up interview with each sites designated “team leader”.
The first section of this paper will discuss results of the youth pre-test and post-test surveys. It is hy-pothesized that youth participants will demonstrate gains across the domains of health, safety, and social-emotional well-being. The second section of this paper will discuss the results of the parent pre-test and post-test surveys to evaluate what benefits the WSB program had for parents. The third section of this paper will discuss the results of the volunteer survey and follow-up interviews. The last section of this paper will discuss outcomes from the 2014- 15 school year.
Introduction
2

Review of Year One Results
In 2013 – 14 the Center for Public and Nonprofit Management partnered with elementary schools in three school districts to organize and provide ongoing support to Walking School Bus (WSB) initiatives. A total of 227 youth participated in programming along seven routes at five elementary schools this past school year. These efforts were supported by a dedicated staff of 62 volunteers that included a mix of parents, returning veterans, and community members. Programming was offered in a variety of formats (including traditional, staging post and a hybrid model) that met on different days of the week (including Wednesday morning and five days a week) to address the diverse needs of communities (e.g., health focused, safety specific, and some combination of the above).
A total of 27 youth completed the post-test survey. This constitutes 12% of the overall WSB youth membership. Representatives from all five participating elementary schools took part in the survey, with the highest number of responses obtained from Eagle’s Nest (n = 10) and least number of respons-es obtained from Spirit Elementary (n = 1). While completed surveys were received from all grades, participation was highest among third and fifth graders (52% of total).
Results highlight the positive impact of WSB programming across multiple domains. Participants were less likely to approve of stealing (30%), view teasing in a positive light (13%), or accept fighting as an ac-ceptable means of handling problems (9%). Important gains were also found in understanding the link between individual choices and health outcomes, as 75% of post-test respondents agreed that “Kids can make decisions that help them stay healthy the rest of their lives” (15% gain). In addition, youth were more likely to understand the consequences associated with unauthorized prescription drug use (30%), marijuana (18%), alcohol (14%), and smoking cigarettes (3%).
The vast majority of respondents possess basic pedestrian safety knowledge. This includes knowing the necessity of “crosswalk use” (93%), the importance of “waiting for cars to pass and then look again” before crossing the street (85%), and the need to look “left, right, left” before crossing the street. Im-provements are needed in knowing where to walk when no sidewalks are present (only 42% of respon-dents answered this question correctly) and the use of signalized intersections.
The remaining questions focused specifically on the impact of WSB programming. Responses indicate that participation increased youth’s likelihood of walking to school (63%) and was a “fun” activity (63%). A sizeable number of respondents also stated that the program to some extent taught them pedestri-an safety (83%), helped them make new friends (83%), was led by adult leaders who care about them (83%) and exposed them to nature (83%). These findings were supported by results from the Parent and Volunteer surveys.
In conclusion, results from Year One of the Walking School Bus program indicate youth gains across domains related to health, safety and social-emotional well-being.
3

Youth Survey Results
Demographic Information
The following figures represent demographic characteristics of survey respondents to questions re-garding school designation and grade level questions that were asked during the 2014 – 15 pre-test survey.
The following figures present demographic characteristics of survey respondents to questions regard-ing school designation and grade level questions that were asked during the 2014 – 15 post-test sur-vey.
Figure 1: Post-test Participation by Grade
Survey responses were received from participants in all elementary school grade levels. Response rates were highest among students in the second and third grades, which constituted 54% of the over-all sample and make up roughly 1/4 of the students enrolled in Walking School Bus.
4

Figure 1: Post-test Participation by School
Survey responses were received from 85% of school-based WSB programs (six of seven). Participation was highest among students attending Stevenson Elementary and lowest among students attending Millennia Elementary. These figures are largely consistent with overall program enrollment. A total of 28 student participants completed the post-test. A total of 42% of youth respondents (n = 12) complet-ed both the pre and post-test survey.
Social and Emotional Development
The following tables represent findings of surveyed student participants to social skills questions that were asked during the 2014 – 15 pre-test and post-test surveys. For each question participating students were asked to rate the truthfulness (“Yes”, “Somewhat”, or “No”) of each of each statement associated with social and emotional well-being (Quest International, 1992). The researchers hypoth-esize that students will demonstrate more pro-social attitudes as a result of their participation in WSB programming.
5
Youth Survey Results

6
Table 1: Social and Emotional Development Survey Responses
Youth Survey Results

Results from the post-test study demonstrate mixed results among measures of social and emotional development. On the positive side, research found that 71% of participants strongly believed that it is acceptable to “say no to friends” sometimes”. This is a 10% improvement from the pre-test survey – with gains from the “somewhat true” to the “Yes, Very Much” option. In total 96% of program partic-ipants either strongly or moderately agreed with this statement. Gains were also witnessed in partici-pants desire to form new friendships (4% increase), though the strength of these convictions declined (as witnessed by an increase in “Somewhat True” responses).
Interestingly, results indicate declines in several measures of social and emotional well – being from the pre to post-test survey. Based on Table 1 above, youth participants were less likely to disapprove of name calling and other forms of teasing (14% decline). Results also document a decline in the per-centage of youth who believe that fighting is an acceptable means of resolving conflicts, though these changes were confined to shifts from “Yes, Very Much” to “Somewhat True”.
Attitude Toward Risky Behaviors
The following tables represent the responses of surveyed student participants to health risk factor questions that were asked in the 2014 – 15 pre-test and post-test surveys. For each question partic-ipating students were asked to rate the truthfulness of each of the following health risk factor state-ments among three options (“Yes”, “Somewhat”, or “No”). The researchers hypothesize that students will demonstrate increased awareness of health risk factors as a result of their participation in WSB programming.
Figure 2: Attitude Toward Risky Behaviors Survey Responses
7
Youth Survey Results

Results indicate few changes among youth participants’ attitude towards health risk factors. Participant’s demonstrated increased knowledge of the risks associated with unauthorized prescription drug usage (6% increase). Interestingly, these gains mirror Year 1 Findings, where a 30% gain was recorded (Pehlke & Palmer, 2014). Measures of attitudes toward smok-ing, marijuana and alcohol usage remained largely unchanged. This is due to the overall positive nature of health risk factor pre-test responses. A decline in the strength of responses on measures of young people’s role in making healthy life choic-es was also recorded, though all respondents responded at the “Somewhat True” level or above.
Physical Activity Level
The following tables represent the responses of survey respondents to questions regarding youth participant’s physical activity level during the 2014 – 15 program year. The researchers hypothesize that WSB participation will result in increased physical activity and more frequent active commuting to school. Responses recorded youth’s responses before and after the program year.
Figure 3: Percentage of Youth Who Engage in Free Time Physical Activity
8
Youth Survey Results
Youth Survey Results
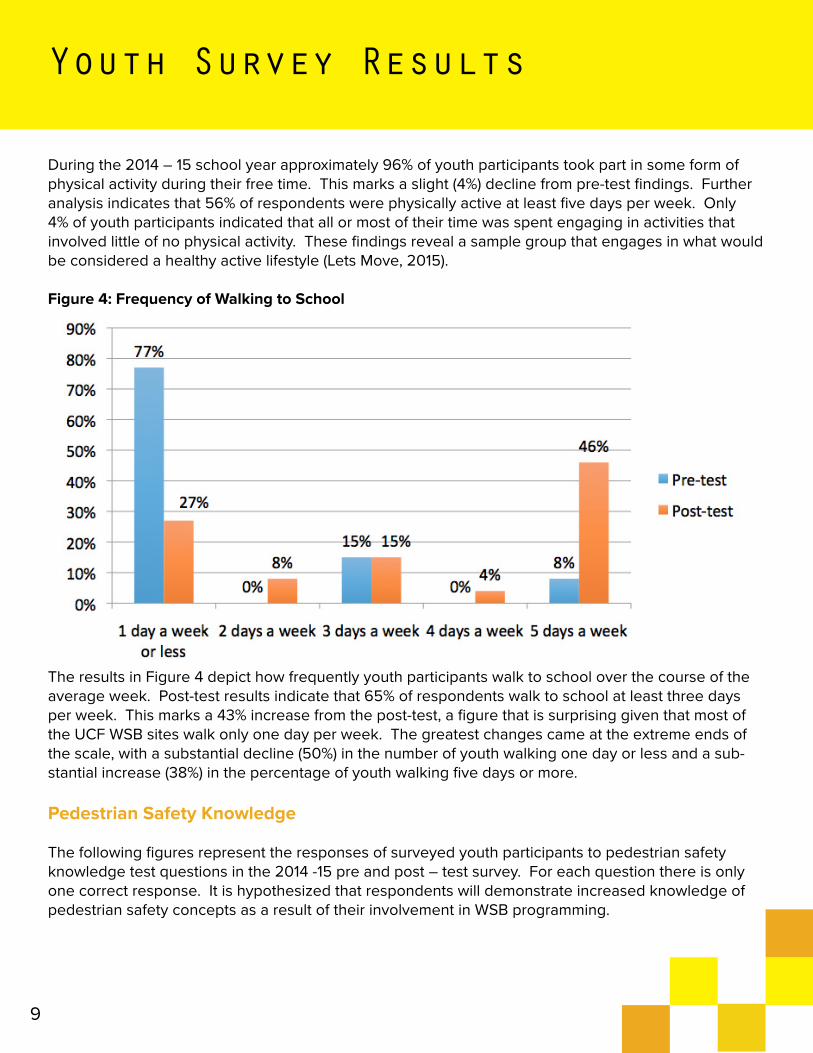
During the 2014 – 15 school year approximately 96% of youth participants took part in some form of physical activity during their free time. This marks a slight (4%) decline from pre-test findings. Further analysis indicates that 56% of respondents were physically active at least five days per week. Only 4% of youth participants indicated that all or most of their time was spent engaging in activities that involved little of no physical activity. These findings reveal a sample group that engages in what would be considered a healthy active lifestyle (Lets Move, 2015).
Figure 4: Frequency of Walking to School
The results in Figure 4 depict how frequently youth participants walk to school over the course of the average week. Post-test results indicate that 65% of respondents walk to school at least three days per week. This marks a 43% increase from the post-test, a figure that is surprising given that most of the UCF WSB sites walk only one day per week. The greatest changes came at the extreme ends of the scale, with a substantial decline (50%) in the number of youth walking one day or less and a sub-stantial increase (38%) in the percentage of youth walking five days or more.
Pedestrian Safety Knowledge
The following figures represent the responses of surveyed youth participants to pedestrian safety knowledge test questions in the 2014 -15 pre and post – test survey. For each question there is only one correct response. It is hypothesized that respondents will demonstrate increased knowledge of pedestrian safety concepts as a result of their involvement in WSB programming.
9

Youth Survey Results
The correct answer to the above question is “Left, Right, Left”. According to the results in Figure 5 above, 89% of post-test respondents answered this question correctly. This marks an 11% improvement over the pre-test.
Figure 6: Where is the safest place to cross a street?
The correct answer to the above question is “At the crosswalk with a crossing guard”. According to the results in Figure 6 above, 100% of youth respondents answered this question correctly. This marks a 4% improvement over the pre-test.
10

Youth Survey Results
Figure 7: If you see a car coming before you cross the street, what should you do?
The correct answer to the above question is “Wait for the car to pass then look again to cross the street”. According to the results from Figure 7 above, a total of 82% of youth respondents answered this question correctly. These results indicate no gain from the pre-test, though results indicate that the vast majority of participants have mastered this pedestrian safety concept.
Figure 8: If the road does not have a sidewalk, where should you walk?
The correct answer to the above question is “Left side of the street”. According to the results in Fig-ure 8 above, a total of 41% of respondents answered this question correctly. This marks a 6% increase over the pre-test. While this marks an improvement, results indicate that the majority of youth partici-pants have yet to master this pedestrian safety concept.
11

12
Youth Survey Results
Benefits of a Walking Shool Bus Program
The last group of questions in the 2014 – 15 post-test survey asked student participants to rate (“Yes”, “Somewhat”, “No”) whether or not the WSB had helped them achieve a holistic set of potential benefits. These questions pertain to matters of health, safety and friendship.
Table 3: Studen Perceived Benefits of WSB Program Participation
Results highlight the multi-faceted benefits of WSB involvement. At least 88% of students surveyed found it to be true or somewhat true that WSB involvement helped them make friends, learn pedestri-an safety skills, exposed them to nature, and increased the number of days that they walk to school. Moreover, a total of 92% of youth participants found WSB to be an enjoyable experience. Lesser support was found for the connection between WSB involvement and academic performance, though nearly 70% of respondents founds this statement to be at least somewhat true.
Open Ended; What did you learn from Walking School Bus?
The last set of questions in the 2014 – 15 student post-test survey asked participating students to reveal what they had learned through WSB involvement. This inquiry was presented in the form of an open-ended question that allowed youth participants more latitude in their responses. Thematic analy-sis separated these responses into three categories: pedestrian safety, physical activity, and pedestrian safety. The results of each category were analyzed, with similar comments grouped accordingly. The following figure represents the responses of surveyed student participants related to the question: “What did you learn from Walking School Bus?”.
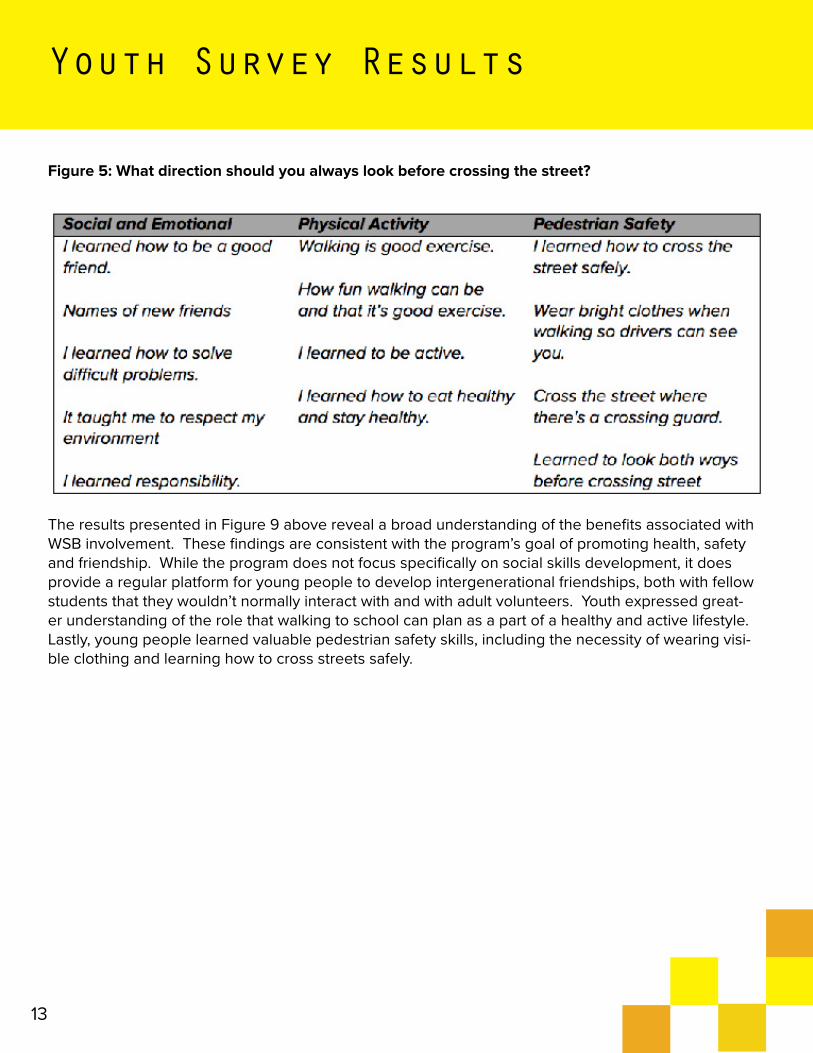
Figure 5: What direction should you always look before crossing the street?
Youth Survey Results
The results presented in Figure 9 above reveal a broad understanding of the benefits associated with WSB involvement. These findings are consistent with the program’s goal of promoting health, safety and friendship. While the program does not focus specifically on social skills development, it does provide a regular platform for young people to develop intergenerational friendships, both with fellow students that they wouldn’t normally interact with and with adult volunteers. Youth expressed great-er understanding of the role that walking to school can plan as a part of a healthy and active lifestyle. Lastly, young people learned valuable pedestrian safety skills, including the necessity of wearing visi-ble clothing and learning how to cross streets safely.
13

Parent Survey Results
14
Demographic Information
The following figures represent the responses of the parents of program participants to pre and post-test survey instruments.
Figure 10: Schools Represented by Parent Respondents
Figure 10 above presents the distribution of parent respondents by school. A total of 28 parents com-pleted the post-test survey. This represents a slight decline (6%) from that of the pre-test (n = 30). The highest level of participation was found at Eagle’s Nest Elementary and Stevenson Elementary, which constitute the largest UCF WSB sites in terms of enrollment. Millennia.
Parent Perceived Benefits
The following set of questions asked parent participants to rate on a scale of “Yes, Very Much” to “No, Never” the extent to which WSB involvement proved beneficial to their child(ren) on a series of do-mains.

Table 3: Parent Perceived Benefits of WSB Participation Responses
Based on the results above, the vast majority of parent respondents indicated that their child(ren)’s WSB involvement was at least “somewhat” beneficial. Notably, 66% of respondents strongly believed that the program taught their child(ren) how to walk safely. Strong support was also found for the program’s effect on physical activity levels and in fostering new friendships. To a lesser extent, parents believed that the program fostered an appreciation of the outdoors, improved concentration in the classroom, boosted school attendance, and improved youth’s behavior at home.
Parent Observations of Walking School Bus Volunteers
The following pictorials represent the responses of parents to questions surrounding the role of WSB volunteers. For each question parent respondents were asked to rate the extent of their support (from “Yes, Very Much” to “No, Never”) for a series of observations about WSB volunteers.
Parent Survey Results

Parent Survey Results
Table 4: Parent Observations of WSB Volunteer Responses
Based on the results shown in Table 5 above, at least 85% of parent respondents strongly believe that WSB volunteers care about their child(ren), are knowledgeable about pedestrian safety, are trust-worthy, and are dependable. None of the parent respondents expressed negative concerns about WSB volunteers.
Figure 11: Why do parents trust their children to walk to school?
Note: Responses were assessed a value depending on how parents responded (Yes, Very Much = 2, Somewhat = 1, No, Never = 0).
Figure 11 above presents findings from a question surrounding who, if anyone, parents would trust to walk their child(ren) to school. Not surprisingly, school staff were viewed as the most trustworthy. This was followed by parents of other students, community volunteers and college students. Interestingly, “other adults from my neighborhood” were viewed as less trustworthy than college students, a reversal from last year’s study.

Volunteer Survey Results
The following figure represents the responses of surveyed WSB program volunteers to questions re-garding their site assignment.
Demographic Information
Figure 12: 2014 – 15 School Assignments for Volunteer Respondents
Note: No post-test volunteer responses were obtained from Eagle’s Nest Elementary or Millennia Ele-mentary
A total of nine volunteer survey responses were recorded. This constitutes 14% of the overall WSB vol-unteer team (n = 69). Response rates were highest at Stevenson Elementary and Brookshire Elemen-tary (n = 3 for each). No responses were recorded for Eagle’s Nest Elementary or Millennia Elementary. While this constitutes a small sample population, findings do provide valuable insights on the effective-ness of WSB programming.
Volunteer Motivation
The following table represents the responses of volunteer survey respondents to questions surround-ing their motivation for entering volunteer service. For each question participants were asked to rate how strongly (from Yes, Very Much to No, Never) they supported a series of statements.
17

Volunteer Survey Results
Table 7: What Motivates Volunteers?
Responses to questions surrounding volunteer motivation are presented in Table 7 above. Volunteer respondents were unanimous in stating that a desire to “help children” motivated them to volunteer. A large majority (81%) also viewed WSB as a means of gaining physical activity. Volunteers were less mo-tivated by the desire to make new friends, though a majority viewed this as part of the attraction. Re-spondents were significantly less likely to state that they volunteered in response to a friend or family member injured by as a pedestrian or in an effort to receive recognition from the community.
Volunteer Perceived Benefits
The following tables represent the responses of volunteer survey respondents to questions about the benefits of WSB involvement to both them as an individual and to youth participants. For each ques-tion participants were asked to rate the strength of their support for a series of statements on this topic.
Table 8: Volunteer-Perceived Benefits of WSB Program Participation
WSB involvement had significant benefits for program volunteers (as noted in Table 8). Volunteers were most likely to cite the new friends (100% at least “somewhat true”) they made through their in-volvement with the program, which is interesting considering this was not their original purpose for get-ting involved (as noted in Table 7). In addition, volunteers cited increased awareness of pedestrians on the road and at least moderate improvements in overall health.
18
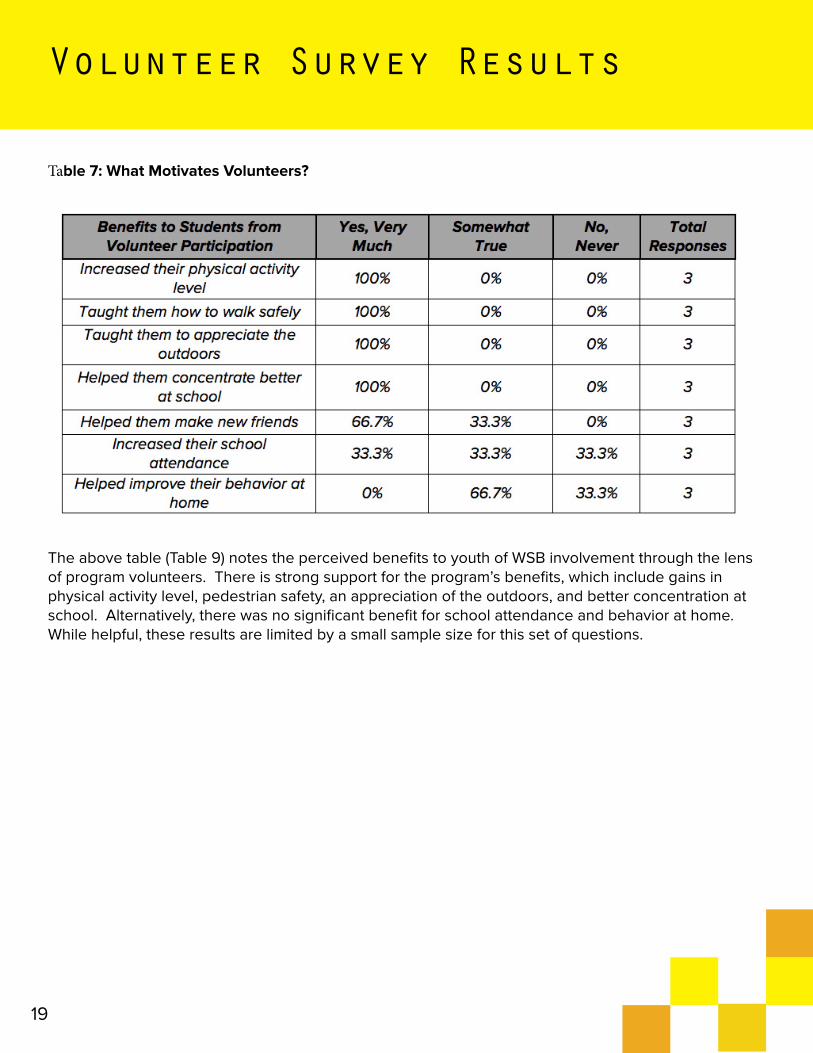
Table 7: What Motivates Volunteers?
Volunteer Survey Results
The above table (Table 9) notes the perceived benefits to youth of WSB involvement through the lens of program volunteers. There is strong support for the program’s benefits, which include gains in physical activity level, pedestrian safety, an appreciation of the outdoors, and better concentration at school. Alternatively, there was no significant benefit for school attendance and behavior at home. While helpful, these results are limited by a small sample size for this set of questions.
19

Discussion
The above sections present findings for Year Two of the UCF Walking School Bus program. This study examined health, safety and social – emotional outcomes among youth (n = 29), parents (n = 29), and volunteers (n = 11). Results indicate that young people who participate in WSB programming engage in more frequent active commuting to school. These findings extend to days when WSB is not in session. Participants learned valuable pedestrian safety concepts, as demonstrated through knowledge gains on topics such as safe street crossings and navigating streets without sidewalks. They were also found to develop increased coping skills that make them less susceptible to peer pressure. When asked to consider the benefits of WSB involvement youth participants noted that the program is (1) enjoyable, (2) teaches them how to walk safely, and (3) exposes them to caring adults. These benefits were rein-forced in the results of related parent and volunteer surveys.
This study advances our knowledge of the benefits of WSB programming on several fronts. For one, this is the first study (Stewart, 2011) to examine the positive youth development features (e.g., social and emotional development and resilience) associated with WSB programming. While Year Two find-ings in this area differed from that of Year One, this is certainly an area worth pursuing further. Indeed, multiple findings from this study documented the intergenerational friendships (sometimes unexpect-ed) developed through involvement with this program. A second key finding concerns measures of pedestrian safety knowledge. No published studies have identified and measured the specific knowl-edge gains sought through such a program. Lastly, survey results from parents and program volun-teers provided an important point of comparison that in some instances (e.g., friendship) served as triple verification of youth survey findings.
Future research should focus on several underexplored areas. First, there is a need for large sample populations and control groups to strengthen the validity of research findings. In this particular study student turnover, particularly in lower income schools, and the loss of staff at key times in the evalua-tion process limited our ability to develop a robust sample. Findings in this study were limited by sam-ple size, consistency of the sample population, and the geographic distribution of schools, which were all located in the Central Florida region. A second area of need is in the intentional linking of pedestri-an safety education with WSB programming. Such programming should be viewed as complimentary elements of a broader pedestrian safety program, with WSB serving to reinforce the concepts students learn in the classroom. Lastly, there is a need for long-term evaluations of community-based WSB pro-grams. In most instances such programming is reliant upon grants for funding, which in turn limits the opportunity to conduct extensive evaluations.
20

References
Lets Move (2015). Get active. Retrieved June 1, 2015 from http://www.letsmove.gov/get-active.
Pehlke, T. & Palmer, J. (2014). Walking School Bus evaluation results: 2013 – 14 school year. Orlando, FL: Center for Public and Nonprofit Management.
Quest International Research and Evaluation Department (1993). Student Assessment Survey: Grade level 2/3. Retrieved June 1, 2015 from http://www.lions-quest.org/evaltools.php#Social.
Stewart, O. (2011). Findings from research on active transportation to school and implications for Safe Routes to School programs. Journal of Planning Literature, 26(2), 127-150.
Center for Public and Nonprofit ManagementCollege of Health and Public AffairsUniversity of Central Florida4364 Scorpius St.P.O. Box 161395Orlando, FL [email protected]/cpnm