Embed Size (px)
Citation preview

1
DIFFERENTIAL LASER-INDUCED PERTURBATION SPECTROSCOPY FOR ANALYSIS
OF BIOLOGICAL MATERIAL
By
SARAH ELIZABETH SMITH
A DISSERTATION PRESENTED TO THE GRADUATE SCHOOL
OF THE UNIVERSITY OF FLORIDA IN PARTIAL FULFILLMENT
OF THE REQUIREMENTS FOR THE DEGREE OF
DOCTOR OF PHILOSOPHY
UNIVERSITY OF FLORIDA
2012

2
© 2012 Sarah Elizabeth Smith

3
ACKNOWLEDGMENTS
I thank my advisor, Dr. David. W. Hahn, for his guidance and encouragement throughout
my academic career at the University of Florida. Thanks also goes out to Dr. Omenetto and Dr.
Mikolaitis for their input and Dr. Angelini for joining my committee late in my studies. Finally,
thanks go out to Ray and Jen for their help with the animals and Dr. Castlemen for his help with
pathology.
4
TABLE OF CONTENTS
page
ACKNOWLEDGMENTS ...............................................................................................................3
LIST OF TABLES ...........................................................................................................................6
LIST OF FIGURES .........................................................................................................................9
ABSTRACT ...................................................................................................................................12
CHAPTER
1 INTRODUCTION ..................................................................................................................14
The Properties of Light, Lasers, and Matter ...........................................................................14
Properties of Light ...........................................................................................................14
Properties of Lasers .........................................................................................................15
Properties of Matter .........................................................................................................16
The Interaction of Light and Matter .......................................................................................22
Light and Matter Interactions on a Bulk Level ...............................................................22
Light and Matter Interactions on a Molecular Level .......................................................25
Light and Tissue Interactions ..........................................................................................27
The Interaction of Lasers and Bulk Matter ......................................................................29
The Interaction of Lasers and Tissue ......................................................................................33
Photochemical Effects .....................................................................................................33
Photomechanical Effects .................................................................................................34
Photothermal Effects .......................................................................................................35
Coagulation of tissue ................................................................................................37
Vaporization of tissue ...............................................................................................38
Carbonization of tissue .............................................................................................38
Ablation of tissue .....................................................................................................38
Laser-Tissue Interaction Examples .................................................................................43
2 SPECTROSCOPIC METHODS ............................................................................................45
Vibrational Spectroscopy ........................................................................................................45
Infrared Spectroscopy ......................................................................................................48
Raman Spectroscopy .......................................................................................................50
Raman micro-spectroscopy ......................................................................................52
Resonance Raman spectroscopy ..............................................................................53
Surface-Enhanced Raman spectroscopy ..................................................................56
Raman spectroscopy of peptides and proteins .........................................................57
Raman spectroscopy of tissue ..................................................................................60
Coupled Raman Spectroscopy and Infrared Spectroscopy .............................................63
Electronic Spectroscopy .........................................................................................................64
Ultraviolet and Visible Spectroscopy ..............................................................................65

5
Chrioptical Spectroscopy .................................................................................................66
Fluorescence Spectroscopy .............................................................................................66
Fluorescence excitation-emission matrix spectroscopy ...........................................68
Fluorescence recovery after photobleaching spectroscopy ......................................70
Laser-Induced fluorescence spectroscopy ................................................................71
Fluorescence spectroscopy using fluorophore manipulation ...................................72
Fluorescence spectroscopy of tissue ........................................................................73
3 EXPERIMENTAL METHODS AND PRELIMINARY RESULTS .....................................77
Amino Acids Study.................................................................................................................85
Introduction to Amino Acids ...........................................................................................85
Methods ...........................................................................................................................88
Results .............................................................................................................................88
Conclusions .....................................................................................................................93
Collagenous and Related Biological Materials .......................................................................95
Introduction to Collagenous materials .............................................................................95
Methods .........................................................................................................................101
Results ...........................................................................................................................102
Conclusions ...................................................................................................................106
Animal Model Study .............................................................................................................107
Introduction to Animal Model .......................................................................................107
Methods .........................................................................................................................112
Results ...........................................................................................................................113
Conclusion .....................................................................................................................116
4 SUMMARY OF RESEARCH AND PROPOSAL OF FUTURE WORK ...........................154
Summary of Research ...........................................................................................................154
Proposal of Future Work ......................................................................................................160
APPENDIX
Appendix ......................................................................................................................................163
LIST OF REFERENCES .............................................................................................................164
BIOGRAPHICAL SKETCH .......................................................................................................176
6
LIST OF TABLES
Table page
3-1 The band identity, wavenumber, and band assignment for L-alanine ......................... 142
3-2 The band identity, wavenumber, and band assignment for L-alanine-glycine ............. 142
3-3 The band identity, wavenumber, and band assignment for glycine ............................ 142
3-4 The band identity, wavenumber, and band assignment for glycine-glycine ................ 143
3-5 The band identity, wavenumber, and band assignment for L-proline ......................... 143
3-6 The band identity, wavenumber, and band assignment for glycine-L-proline ............. 144
3-7 The wavenumber, factor, and band assignment for all traditional Raman studied
amino acids ........................................................................................................ 144
3-8 This is the wavenumber, factor, and band assignment for traditional Raman studied
peptides ............................................................................................................. 144
3-9 The wavenumber, factor, and band assignment for traditional Raman studied
dipeptides ........................................................................................................... 145
3-10 The wavenumber, factor, and band assignment for all DLIPS studied amino acids ..... 145
3-11 The wavenumber, factor, and band assignment for DLIPS studied peptides ............... 145
3-12 The wavenumber, factor, and band assignment for all DLIPS studied dipeptides........ 146
3-13 The predicted class of all materials (i.e., peptides and dipeptides) studied using
traditional Raman within the training set ................................................................ 146
3-14 The predicted class of all materials (i.e., peptides and dipeptides) studied using
traditional Raman within the validation set ............................................................ 146
3-15 The predicted class of the peptides studied using traditional Raman within the
training set ......................................................................................................... 146
3-16 The predicted class of the peptides studied using traditional Raman within the
validation set ...................................................................................................... 147
3-17 The predicted class of the dipeptides studied using traditional Raman within the
training set ......................................................................................................... 147
3-18 The predicted class of the dipeptides studied using traditional Raman within the
validation set ...................................................................................................... 147

7
3-19 The predicted class of all materials (i.e., peptides and dipeptides) studied using the
DLIPS method within the training set .................................................................... 147
3-20 The predicted class of all materials (i.e., peptides and dipeptides) studied using the
DLIPS method within the validation set ................................................................. 147
3-21 The predicted class of the peptides studied using the DLIPS method within the
training set ......................................................................................................... 148
3-22 The predicted class of the peptides studied using the DLIPS method within the
validation set ...................................................................................................... 148
3-23 The predicted class of the dipeptides studied using the DLIPS method within the
training set ......................................................................................................... 148
3-24 The predicted class of the dipeptides studied using the DLIPS method within the
validation set ...................................................................................................... 148
3-25 The band identity, wavenumber, and band assignment for collagen .......................... 148
3-26 The band identity, wavenumber, and band assignment for fibrinogen ....................... 149
3-27 The band identity, wavenumber, and band assignment for IgA ................................. 149
3-28 The band identity, wavenumber, and band assignment for IgG ................................. 149
3-29 The band identity, wavenumber, and band assignment for IgM ................................ 149
3-30 The wavenumber, factor, and band assignment for all traditional Raman technique
studied materials ................................................................................................. 150
3-31 The wavenumber, factor, and band assignment for only the Igs traditional Raman
technique studied materials .................................................................................. 150
3-32 The wavenumber, factor, and band assignment for all the DLIPS method studied
materials ............................................................................................................ 150
3-33 The wavenumber, factor, and band assignment for only the Igs DLIPS method
studied materials ................................................................................................. 151
3-34 The predicted class of all materials studied using traditional Raman within the
training set ......................................................................................................... 151
3-35 The predicted class of all materials studied using traditional Raman within the
validation set ...................................................................................................... 151
3-36 The predicted class of only the Igs studied using traditional Raman within the
training set ......................................................................................................... 151

8
3-37 The predicted class of only the Igs studied using traditional Raman within the
validation set ...................................................................................................... 152
3-38 The predicted class of all materials studied using the DLIPS method within the
training set ......................................................................................................... 152
3-39 The predicted class of all materials studied using the DLIPS method within the
validation set ...................................................................................................... 152
3-40 The predicted class of only the Igs studied using the DLIPS method within the
training set ......................................................................................................... 152
3-41 The predicted class of only the Igs studied using the DLIPS method within the
validation set ...................................................................................................... 152
3-42 The value of the x-axis intercept of type IV collagen, fibrinogen, IgA, and IgG ......... 153
A-1 The chemical index of all materials used ............................................................... 163

9
LIST OF FIGURES
Figure page
3-1 The DLIPS system .............................................................................................. 118
3-2 The structures of glycine, alanine and proline ......................................................... 118
3-3 The structures of glycine-glycine, glycine-L-proline, and L-alanine-glycine .............. 118
3-4 The general structure of an α-amino acid ............................................................... 118
3-5 The traditional fluorescence spectra of the amino acids (i.e., preperturbation) ............ 119
3-6 Key of color that represents each studied amino acid .............................................. 119
3-7 The traditional fluorescence spectra of L-alanine (blue) and L-alanine-glycine (red)
(i.e., preperturbation) ........................................................................................... 119
3-8 The traditional fluorescence spectra of glycine (light blue) and glycine-glycine
(orange) (i.e., preperturbation) .............................................................................. 120
3-9 The traditional fluorescence spectra of L-proline (green) and glycine-L-proline
(violet) (i.e., preperturbation) ............................................................................... 120
3-10 The DLIPS spectra of the amino acids ................................................................... 121
3-11 The DLIPS spectra of L-alanine (blue) and L-alanine-glycine (red) after 700 laser
pulses ................................................................................................................ 121
3-12 The DLIPS spectra of glycine (light blue) and glycine-glycine (orange) after 500
laser pulses ......................................................................................................... 122
3-13 The DLIPS spectra of L-proline (green) and glycine-L-proline (violet) after 600 laser
pulses ................................................................................................................ 122
3-14 The DLIPS spectra of glycine (light blue) after 500 laser pulses, L-alanine (blue)
after 700 laser pulses and L-proline (green) after 600 laser pulses ............................ 123
3-15 The DLIPS spectra of glycine-glycine (orange) after 500 laser pulses, L-alanine-
glycine (red) after 700 laser pulses and glycine-L-proline (violet) after 600 laser
pulses ................................................................................................................ 123
3-16 The traditional Raman spectra of the amino acids (i.e., preperturbation). Each
spectrum other than proline pre has been shifted vertically to show distinction
between Raman peaks of each amino acid ............................................................. 124
3-17 The traditional Raman spectra of L-alanine (blue) and L-alanine-glycine (red) (i.e.,
preperturbation) .................................................................................................. 124

10
3-18 The traditional Raman spectra of glycine (light blue) and glycine-glycine (orange)
(i.e., preperturbation) ........................................................................................... 125
3-19 The traditional Raman spectra of L-proline (green) and glycine-L-proline (violet)
(i.e., preperturbation) ........................................................................................... 125
3-20 The traditional Raman preperturbation (blue) spectrum of L-alanine ........................ 126
3-21 The traditional Raman preperturbation (red) spectrum of L-alanine-glycine .............. 126
3-22 The traditional Raman preperturbation (light blue) spectrum of glycine .................... 127
3-23 The traditional Raman preperturbation (orange) spectrum of glycine-glycine ............ 127
3-24 The traditional Raman preperturbation (green) spectrum of L-proline ....................... 128
3-25 The traditional Raman preperturbation (purple) spectrum of glycine-L-proline .......... 128
3-26 The DLIPS of the amino acids .............................................................................. 129
3-27 The traditional fluorescence preperturbation spectra of the collagenous material ........ 129
3-28 The color that represents each studied collagenous material ..................................... 130
3-29 A close-up view of the absolute fluorescence spectra of the collagenous material.
(Fibrinogen and IgG are not plotted here) .............................................................. 130
3-30 The DILPS spectra of the collagenous material after 2000 laser pulses. .................... 130
3-31 A close-up view of the DLIPS spectra of the collagenous material after 2000 laser
pulses. (IgM is not plotted here) ............................................................................ 131
3-32 The traditional Raman spectra of the collagenous material. Each spectrum other than
IgM has been shifted vertically to show distinction between Raman peaks of each
collagenous material. ........................................................................................... 131
3-33 The traditional preperturbation spectrum of collagen............................................... 132
3-34 The traditional preperturbation spectrum of fibrinogen ............................................ 132
3-35 The traditional preperturbation spectrum of the IgA ................................................ 133
3-36 The traditional preperturbation spectrum of IgG ..................................................... 133
3-37 The traditional preperturbation spectrum of IgM .................................................... 134
3-38 The DLIPS of Collagenous and related biological material ...................................... 135
3-39 The average DLIPS spectra at weeks 1-11 for the untreated skin .............................. 136

11
3-40 The average DLIPS spectra at weeks 1-11 for the DMBA-treated skin ...................... 137
3-41 The average absolute fluorescence for the DMBA-treated (▲) and untreated skin at
week 2 ............................................................................................................... 137
3-42 The average absolute fluorescence for the DMBA-treated (▲) and untreated skin at
week 6 ............................................................................................................... 138
3-43 The average absolute fluorescence for the DMBA-treated (▲) and untreated skin at
week 8 ............................................................................................................... 138
3-44 The average DLIPS fluorescence for the DMBA-treated (▲) and untreated skin at
week 2 ............................................................................................................... 138
3-45 The average DLIPS fluorescence for the DMBA-treated (▲) and untreated skin at
week 6 ............................................................................................................... 139
3-46 The average DLIPS fluorescence for the DMBA-treated (▲) and untreated skin at
week 8 ............................................................................................................... 139
3-47 The H&E stained histology section of skin from an untreated mouse at week 4 ......... 140
3-48 The H&E stained histology section of skin from a DMBA-treated mouse at week 4.
Note: (▲) denotes thickened regions of the stratum corneum, symptomatic of
orthokeratotic hyperkeratosis. (X) highlights the thickening of the stratum spinosum,
characteristic of acanthosis. (*) denotes areas of increased dermal collagen density ... 140
3-49 The H&E stained histology section of skin from a DMBA-treated mouse at week 8.
Note: (▲) denotes thickened regions of the stratum corneum, symptomatic of
orthokeratotic hyperkeratosis. (X) highlights the thickening of the stratum spinosum,
characteristic of acanthosis. (*) denotes areas of increased dermal collagen density ... 141
3-50 The H&E stained histology section through a developed papilloma of skin from a
DMBA-treated mouse at week 11 ......................................................................... 141
12
Abstract of Dissertation Presented to the Graduate School
of the University of Florida in Partial Fulfillment of the
Requirements for the Degree of Doctor of Philosophy
DIFFERENTAIL LASER-INDUCED PERTURBATION SPECTROSCOPY FOR ANALYSIS
OF BIOLOGICAL MATERIAL
By
Sarah Elizabeth smith
December 2012
Chair: David W. Hahn
Major: Mechanical Engineering
Improved sensitivity and/or specificity for rapid and accurate biosensing is highly
desirable for in situ and in vivo cancer screening, detection of biological pathogens for
biodefense, as well as food and building safely. However, despite the need and motivation, to
date the clinical applicability of in vivo sensing schemes has been limited by the large patient-to-
patient variations. The current study seeks to provide additional insight as well as increased
sensitivity and specificity as compared to the current state-of-the-art optical based sensing
methodologies.
In this study differential laser-induced perturbation spectroscopy (DLIPS) is developed
and studied in detail. DLIPS is a unique optical sensing scheme based on deep ultra violet (UV)
photochemical perturbation in combination with difference spectroscopy. Applying a sequence
of optical probing, UV laser-induced perturbation, and repeat optical probing coupled with
difference spectroscopy provides a new spectral signature. This scheme is based on recent
research showing that the biological matrix may be altered by low intensity ultraviolet radiation
such that the intrinsic fluorescence or Raman scattering response is perturbed. This new spectral
dimension based on difference spectroscopy, will be strongly coupled to the local biomolecular

13
matrix. Since the targeted material is optically probed both before and after perturbation with the
deep UV light source, the resulting differential response will avoid the major limitation of the
current biosensing schemes, namely, the significant variations in the absolute optical response, as
generally observed in patient-to-patient populations.
Experiments with amino acids glycine, alanine, proline, glycine-glycine, glycine-proline,
and alanine-glycine are conducted using Raman and fluorescence spectroscopy as the probes.
Results showed that the DLIPS technique can differentiate between all amino acids. Experiments
on collagenous and related connective-tissue materials study involving collagen type IV,
fibrinogen, immunoglobulin A, immunoglobulin G, and immunoglobulin M was also conducted.
These experiments also showed the sensitivity and specificity that can be achieved with the
DLIPS technique using Raman and fluorescence Spectroscopy as the probes. Experiments
performed in an animal model study upon mice and hamsters, confirmed that the DLIPS
technique can be implemented into an in vivo environment while retaining the sensitivity and
specificity this technique offers. Overall, the current set of experiments shows the strong
dependence of laser-tissue interactions and highlights the need for a complete understanding of
the related photo-chemical perturbation processes. Finally, additional experiments are proposed
to further facilitate this understanding.

14
CHAPTER 1
INTRODUCTION
In this dissertation, a unique optical sensing scheme known as differential laser-induced
perturbation spectroscopy, which is based on a sequence of optical probing, ultra violet (UV)-
laser perturbation, and repeat optical probing coupled with difference spectroscopy, is used to
analyze biological materials. Analysis of biological materials, through an amino acids study, a
collagenous material study, and an animal model study, that result in new differential spectral
signatures is presented.
1.1 The Properties of Light, Lasers, and Matter
1.1.1 Properties of Light
The interaction of a light quanta and a molecule can result in chemical and physical
changes within the molecule. The interaction of light with matter can also tell us about the nature
of the matter, setting the basis for optical diagnostic scheme.
Based on Einstein’s study of Planck’s result and the photoelectric effect, it was
determined that light is a quantized amount of energy that behaves as a particle and a wave.
Therefore, light or radiation, possess a dual characteristic, and can be viewed as a wave in an
electromagnetic field, or a stream of massless particles called photons. A wave can be
characterized by its wavelength or by the frequency and energy that it carries. Light is known as
electromagnetic radiation and an electromagnetic spectrum contains all possible waves over a
continuum of frequencies and energies. The spectrum spans from radio radiation which has a
wavelength >109 Å (1 Å = 1x10
-10 m) and a frequency <3x10
9 Hz to gamma ray radiation which
has a wavelength <0.1 Å and a frequency >3x10¹⁹
Hz.(Calvert, 1966) Also, the theory of wave-
particle duality allows us to assume that photons and electrons follow the same general
principles. However, a few distinctions must be noted. Electrons must obey Fermi statistics while

15
a photon must obey Bose statistics. In Fermi statistics, two electrons in the same system cannot
have the same physical properties (i.e., quantum numbers). In Bose statistics there is no
restriction so photons can occur in large numbers, having the same energy, and momentum, such
as in a pulse of laser light.
1.1.2 Properties of Lasers
The amplification of light by stimulated emission of radiation (i.e., LASER light) is a
unique form of radiation. Unlike other forms of radiation, light amplification by stimulated
emission of radiation, known as laser light, is highly monochromatic, coherent, and collimated.
(Niemz, 1996) A laser consists of three main parts: an energy source or pump, an amplifying
medium, and an optical cavity. In the amplifying medium, an atom or molecule is excited and
emits spontaneously a photon as it returns to its lower energy state. As these excited-state atoms
release their photons, the photons will interact with other excited atoms to stimulate the release
of more photons of the same wavelength, energy and phase. Atoms in the ground state can also
absorb photons, and since more electrons are in low energy states than in upper states, the
probability of net absorption is larger than a net amplification. For more photons to be produced
than removed, more atoms must be in an excited state, thereby creating a population inversion.
This is obtained by the energy source or pump delivering energy to a multiple energy level roster
(generally three-level or four-level) and taking advantage of different decay rates. The
amplifying medium will therefore determine the wavelength of the laser radiation. The optical
cavity consists of precisely aligned mirrors to direct the photons in phase, through the laser
medium to realize amplification as well as to provide directionality and increased intensity with
high coherence. The laser beam profile will depend on the geometry of the mirrors, their
separation, and the optical cavity construction. Therefore, different wavelengths can be emitted
from the laser by using different laser systems and mediums.
16
As noted above, a laser produces a highly monochromatic, coherent collimated beam.
The beam is of a single wavelength or frequency (with some finite linewidth) which is
determined by the amplification medium. The laser beam is also considered one of the most
coherent forms of light. Coherence defines the phase correlation between different emitted waves
at different times and locations. The waves of light in lasers are in phase with each other in both
time and space; hence, they are coherent. The laser beam is highly collimated, the waves of light
run parallel to each other, because of the laser cavity design and the monochromatic and coherent
nature of the stimulated light generated within the cavity. No other light source can generate a
beam with precise directionality and minimum angular spread as a laser.
Another unique feature of lasers is that they are capable of producing short bursts of
highly intense light. Laser light, depending on the energy level scheme, can be delivered as a
continuous wave (CW) or a pulsed wave. Continuous wave lasers emit a beam of light with near
constant intensity over time. Pulsed wave lasers emit a pulse or multiple pluses at a selected
interval. The excitation energy can also be stored and released suddenly by operating the laser in
a Q-switch mode or locking mode. Very short pulses (picosecond or femtosecond) are possible
with lasers, but in principle an infinitely short pulse of finite energy will contain all wavelengths
with the same power; hence an increase in bandwidth or a reduction in the monochromatic
characteristic of the laser light can occur with ultra short pulses. (Pedrotti, 1987) The current
research will predominately utilize Q-switched lasers with pulse widths in the ns time scale
regime, and wavelengths generally in the UV and visible wavelength regime.
1.1.3 Properties of Matter
Now that a basic introduction to light has been presented, the properties of matter will
now be briefly reviewed in the context of laser-material interactions. Generally, knowing the
electron configurations within atoms allows us to better understand and predict the properties of
17
elements. A specific group of atoms within a molecule that is mainly responsible for reactions
within the molecule is called a functional group. Relevant to biological tissue, all organic
compounds have a functional group of hydrocarbons. Hydrocarbons are divided into two main
classes based on the structure and are known as aliphatic and aromatic. (Chang, 2003) Aromatic
hydrocarbons contain one or more benzene rings where aliphatic hydrocarbons do not contain a
benzene ring or benzene group. Also in alkanes, only single covalent bonds are present and they
contain the maximum number of hydrogen atoms that can bond with the number of carbon atoms
present.
Like light, matter also possesses a dual nature, with the quantum structure ultimately
defining its interaction with light. The dual nature of electrons can be explained best through the
Heisenberg uncertainty principle and Schrodinger’s wave equation. The Heisenberg uncertainty
principle states that it is impossible to know, simultaneously, the momentum and the position of
a particle with certainty. Therefore, it is not appropriate to imagine the electron in a well-defined
orbital, circling the nucleus. As a result, particles do not obey deterministic laws of motion.
Schrodinger in 1926 determined a mathematical model that can describe the behavior and
energies of submicroscopic particles through calculated probabilities. (Chang, 2003) The
Schrodinger equation incorporates particle-behavior in terms of mass and wave-behavior in
terms of a wave function. The electron density gives the probability that an electron will be
found in a particular region of an atom. The wave function has no direct physical meaning but
the wave function squared is proportional to the probability of finding the electron in a certain
region in space (i.e., the distribution of the electron density in space around the nucleus). The
wave amplitudes describe the probability that a particle will be found within a region of space
during an interval of time. Thus, high wave amplitudes or high electron densities represent a high
18
probability of locating the electron in that region. This results in acceptable-energy levels (most
likely) capable of describing electrons moving around the nucleus or the atom. The wave
function of an electron in an atom can be thought of as an atomic orbital. Therefore, an atomic
orbital has a characteristic energy and electron density distribution. These are known as the
various quantized electronic energy levels of an atom.
The distribution of electrons in atoms can be described by four quantum numbers, three
from the solution of the Schrodinger’s wave equation and one from the results of Dirac’s
relativistic mechanics. The three quantum numbers that result from Schrodinger’s wave
equation, the principal, the angular momentum, and the magnetic, are used to describe atomic
orbitals and to label electrons that reside within the atomic orbitals. The fourth quantum number
called the spin quantum number is used to describe the behavior of a specific electron. The four
quantum numbers also help to explain electronic transitions and the periodic behavior of the
elements.
The total energy of an atom with many electrons depends not only on the sum or the
orbital energies but also on the energy of repulsion or between the electrons in these orbitals. The
magnetic moment due to the spin of an electron and the magnetic field produced by the electrons
orbital motion around the nucleus can result in a magnetic interaction and can create spin-orbital
coupling. The charge of the nucleus (the atomic number) will affect the spin-orbital coupling and
heavier atoms will have strong spin-orbital coupling. Shifting and splitting of the energy levels
within the atom can be produced by the spin-orbital coupling since strong mixing of spin and
orbital properties can occur. Such behavior plays a key role in many absorption and fluorescence
schemes.

19
In atoms with several unpaired electrons, strong inter-electron coupling between the spin
and angular momenta will occur. In lighter elements, the total angular momentum of the atom is
assumed to be the sum of the net orbital angular momentum of the electrons and the total spin
angular momentum. This type of coupling is known as Russell-Saunders coupling (L-S
coupling). For heavier elements, the total angular momentum of the atom is assumed to be the
sum of the individual orbital and spin angular momenta couple for each individual unpaired
electron. This type of coupling is known as J-J coupling. (Niemz, 1996)
In addition to electron levels, molecules also possess vibrational levels and rotational
energy levels, which form the basis for vibrational spectroscopy, such as Raman scattering. At
room temperature, most molecules exist in their ground vibrational state. The spacing between
two consecutive vibrational levels is constant and the vibrational frequency is inversely
proportional to the square root of the reduced mass, proportional to the square root of the force
constant and proportional to the strength of the bond. These relationships help to explain why
heavier nuclei have lower vibrational frequencies. For a molecule with N atoms, the numbers of
different vibrational displacements or degrees of freedom are 3N-5 for a linear molecules and
3N-6 for nonlinear molecules. The 5 within the 3N-5 equation comes from the fact that three
translational and two rotational degrees of freedom occur within linear molecules. The 6 within
the 3N-6 equations comes from the fact that there are three translational and three rotational
degrees of freedom within nonlinear molecules. (Chang, 2003) These vibrational modes are
coupled and result in simultaneous displacements of all nuclei. The displacements of nuclei and
the symmetry of the molecule result in distinct vibrational patterns and are called normal modes
of vibration. A specific mode of vibration is assigned to the specific bond or angle of the

20
molecule and its corresponding displacement. Such behavior plays a key role in Raman
scattering, as discussed later, including the selection rules.
Since a molecule contains more than one nucleus, determining the origin of the electronic
displacement becomes difficult. Two electrons in a spin-coupled configuration define the
formation of a bond. A diatomic molecule with the same nucleus and the same type of atomic
orbitals can combine to form molecular orbitals. Overlapping of two orbitals in their lowest
states can be described by two possible linear combinations of 1s atomic orbitals of each atom.
Overlapping wave functions can be described as constructive or destructive interference. The
constructive overlapping results in an increased electron density between the two nuclei resulting
in a binding between the orbitals and allows the nuclear-nuclear repulsion to be overcome. The
resulting molecular orbital is called a 1σ orbital and the energy of the 1σ orbital is lower in
comparison with the individual 1s atomic orbitals. This is known as a bonding molecular orbital.
The destructive overlapping results in a cancellation of the electron density in the region between
the nuclei. The resulting molecular orbital is called a 2σ* orbital and the energy of the 2σ*
orbital is higher in comparison with the individual 1s atomic orbitals. This is known as an anti-
bonding molecular orbital. (Prasad, 2003) The asterisk symbol as a superscript represents an
anti-bonding orbital, the σ represents the overlapping of atomic orbitals along the inter-nuclear
axis. Only when a multiple bond is formed between two atoms can π and π* molecular orbitals
form. These orbitals are formed by the overlapping of two atomic orbitals and are not as stable as
σ orbitals.
In polyatomic molecules, electrons are either bound to a particular molecule or are quasi-
free. The motion is restricted and these rotational and translation motions become known as
lattice vibrations. More than one atomic orbital on one atom is typically involved in bonding and

21
certain atomic orbitals do not mix to form bonds. Also in polyatomic molecules multiple
interactions can occur and these interactions produce a modification of the orbitals of individual
molecules. New energy states are spread over both molecules and new energy band formation
occurs for both the electronic and vibrational energy levels of each molecule. One of these
interactions is known as weak van der Waals interactions (~0.01 eV). (Calvert, 1966) Van der
Waals interactions can occur even between neutral molecules. Momentary random fluctuations
in the distribution of the electrons of an atom create an unequal electric dipole and unequal
electric dipoles of two non-covalent bonded atoms can attract each other resulting in van der
Waals interactions. Another type of interaction is related with specific chemical bonding or
chemical association. An example of this type of interaction is hydrogen bonding. When a
hydrogen atom is bonded to an electronegative atom in one molecule and is bonded to another
electron rich atom on another molecule, a weak electrostatic interaction occurs.
Having discussed the general atomic and molecular structure, attention is now turned to
more complicated tissue structures. Tissue is composed of specialized cells that are organized to
perform specific tasks. Cells interact with each other and their functions are coordinated to allow
an organism to perform a set of functions. Cells in tissues are generally held together by the
extracellular matrix. Within this matrix, cells can interact with each other as well as migrate. The
extracellular matrix is composed of a variety of proteins and polysaccharides (long carbohydrate
molecules of repeated monomer units joined together by glycosidic bonds) that are assembled
into an organized lattice.
The chemical structure of protein consists of amino acids that are linked together by a
peptide bond. Condensations of the amino groups are of one amino acid with the carboxylic
group of another forming the peptide bond. This process involves the NH2 and COOH groups on
22
both ends of amino acids. (Chang, 2003) There are 20 different amino acids and the functions of
each depend on the side chain group. The extracellular matrix not only provides adhesion and
binding of tissue but also provides strength and resilience, and cushion for the cells depending on
how the matrix organizes. The strength and resilience of tissue is proportional to collagen
content and biological tissue is known to be fragile.
Water content, blood circulation and structure all affect the properties of tissue. Living
tissue does not have the same structure as dead tissue; drying, freezing, dehydration or soaking in
saline of tissue will greatly alter tissue properties as well. In vitro determined tissue properties
can also greatly differ from in vivo determined properties. It is obvious the nature of tissue is
inhomogeneous and this creates many difficulties in comparing experimental data between
samples, notably so for laser-tissue interactions, as described in the next section.
1.2 The Interaction of Light and Matter
1.2.1 Light and Matter Interactions on a Bulk Level
Matter, when compared to the wavelength size of the incident light is considered bulk
matter if the tissue dimension is much larger than the wavelength of light. The wave nature of
light leads to two important properties of the interaction of light with matter on a bulk level:
refraction and reflection. The absorption and scattering of light are two other properties which
are important in this type of interaction but the wave model of light cannot explain these
phenomena or the effects which absorbed light produces. Therefore, light interacts with bulk
matter in three key ways: absorption, reflection and refraction, and scattering. (Pedrotti, 1987)
These properties are determined by the sum of the average of the molecular properties that
correspond to the bulk matter. Light will propagate undisturbed until it interacts with a
nonhomogenity (e.g. tissue). The interaction can be described as a bulk medium subjected to an
external electric field that responds by becoming electronically polarized.
23
Once absorption occurs in matter, the photon energy is partially converted to heat.
Energy as well as momentum is involved in the interaction of light with matter, and both must be
conserved. The ability of bulk matter to absorb radiation is dependent upon the material
composition, the wavelength of radiation, and the material properties such as excitable energy
states. Absorption can be quantified as the ratio of absorbed intensity to the incident intensity.
The amount of light absorbed by bulk material is independent of the incident light intensity
provided saturation does not occur, and dependent upon the amount of absorbing material
through which the light passes.
Reflection and refraction are generally dependent upon the material, the incident
wavelength, polarization of light and the angle of incidence. In bulk matter, reflection occurs by
re-radiation (i.e., scattering) from the surface upon which it was incident. Within the plane of
incidence, the wave normal of the reflected beam, incident beam, and the reflecting surface
normal must all satisfy the laws of reflection. A reflecting surface is the boundary between two
materials of different indices of refraction, where the index of refraction describes the optical
response of a material with respect to propagation of light through it. The amount of refraction of
light also depends upon the index of refraction which determines the phase as well as the
velocity of propagation and strongly depends on wavelength in regions of high absorption only.
Refraction usually occurs when two mediums of different indices of refraction are within the
same reflection surface resulting in a change in speed of the light wave. The change in speed of
the light wave results in a change of angle of propagation when entering from on medium to
another. Reflection and refraction are governed by Fresnel’s law and Snell’s law, respectively,
and can be difficult to measure in a complex medium like tissue due to simultaneous absorption
and scattering.

24
If the frequency of the incident radiation does not correspond to the frequency of the
vibrations of a particle, elastic scattering will occur. In general, depending upon the energy of the
incident and scattered photons, scattering can be elastic or inelastic. Elastic scattering occurs by
Mie or Rayleigh scattering, and the incident and scattered photons will have the same energy
(i.e., same wavelength and frequency). Mie scattering is applicable for particles of size
comparable to the wavelength of the incident radiation or laser. Mie scattering typically scatters
preferentially in the forward direction and depends on λ-x
where 0.4≤ x ≤ 0.5, where λ is the
radiation wavelength. Rayleigh scattering is applicable only if the particles are much smaller in
size when compared to the wavelength of the incident radiation. Rayleigh scattering scatters in
the forward and backward direction at the same rate and depends on λ-4
, where λ is the radiation
wavelength. (Pedrotti, 1987) Rayleigh scattering will result in blue light scattering more
efficiently than red light, as based on scattering alone. In general, the longer the wavelength of
light, the deeper it will penetrate into bulk matter.
In inelastic scattering, the incident and scattered photons will have different energies.
One type of inelastic scattering is Brillouin scattering. Brillouin scattering occurs by inducing
inhomogeneity of the refractive index from an acoustic wave interfering with bulk matter. This
type of scattering will result in the frequency of the scattered photons shifting up or down.
Another type of inelastic scattering is Raman scattering. Stokes Raman scattering occurs when
the scattered photon energy is lower than the incident photon energy, and anti-Stokes Raman
scattering occurs when the scattered photon energy is higher than the incident photon energy.
The difference in energy between incident Raman scattering radiation is accounted for as energy
either added to or removed from vibrational modes of the solid matrix.

25
1.2.2 Light and Matter Interactions on a Molecular Level
The stability of molecules can help explain the nature of the reactions that the molecules
may undergo. Energy transfer and excited state formation requires one or more molecules
interacting, therefore, a minimum molecular size is required and is known as a dimer. A dimer in
an excited state is called an excimer (i.e., excited dimer). The interaction of two different
molecules with each other, when one is in an excited state is known as an excited state complex
or exciplex. On a molecular level, Einstein’s quantum theory of radiation is typically used to
explain the interaction between radiation and matter. Stimulated absorption, spontaneous
emission, and spontaneous absorption are the three processes that explain this interaction.
Absorption of light results in an excitation of certain vibrations or electronic states in the
molecules of the absorbing material. Like bulk matter, on the molecular level, the ability to
absorb radiation is dependent upon the material composition, the wavelength of radiation, the
material properties and the energy state. In stimulated absorption, the transition of a molecule
from a lower energy initial level to a higher energy level occurs where the photon energy of the
incident radiation is equal to the energy gap between the levels. A photon will be absorbed in this
process. Generally, at room temperature molecules are in their lowest state known as the ground
state. If the initial level is an excited sate, the absorption is called excited state absorption.
Absorption and emission processes can be defined by the Einstein model which states that the
number of molecules present in the initial state and the density of the photons are proportional to
a transition rate from a lower energy state to a higher energy state. Absorption and emission
processes can occur at any of the electronic and vibrational states of a molecule, provided that
the transition is allowed.
Once a molecule is in an excited state, it must find a way to release the extra energy to
return back to the ground state. A variety of paths are usually available for the degradation of the

26
electronic energy. Spontaneous emission may occur whenever molecules are in an excited state.
For spontaneous emission, no external radiation is required to start the emission process;
therefore the emission rate is only proportional to the number of molecules in the excited state.
To radiatively bring the molecule back to the ground state, a photon is spontaneously emitted in
a random direction, with photon energy corresponding to the energy gap between the two energy
levels. In the spontaneous emission process, if external radiation is interacting with molecules,
the emitted photon will not generally correspond directionally with the external radiation. In
contrast, the process of stimulated emission requires an incident photon of an energy that
corresponds to the energy gap between the initial and higher level. The incident photon will
interact with an atom or molecule in an excited state and stimulates the system to fall to a lower
energy level and release a photon of the same energy, phase, and direction as the incident
photon, as discussed previously in the context of lasers.
Nonradiative processes can also occur where the release of energy can be dissipated as
heat or produce a chemical reaction, or be passed to another system. When heat is produced in a
nonradiative process, the excess energy is converted to vibrational energy by electronic
vibrational state coupling. The vibrational energy is then converted to heat by vibrational
relaxation. A combination of radiative and nonradiative processes can also occur as the molecule
returns to the ground state. (Chang, 2003) Even though the entire molecule is in an excited state,
the excited state energy is mainly localized for simple transitions and can be assigned to
chromophores in a molecule. A chromophore is a molecular unit where an electron being excited
is primarily located. Radiative and nonradiative processes are considered photophysical
processes which do not lead to an over all chemical change. Excited molecules can also directly

27
produce new products or forms of free radicals or excited molecules, which can lead to physical
or chemical changes.
The natural state of most molecules is in the ground state and involves paired electrons,
that, have a total spin of S=0. (Calvert, 1966) Excitation of paired electrons from molecules
whose ground states are singlet will result in the electrons staying paired and excited in a singlet
state S, or the electrons become unpaired and excited in a triplet state T. Two electronic states of
the same spin multiplicity can cross and this is called an internal conversion. After an internal
conversion, vibrational relaxation occurs where the excess energy is converted to heat and the
molecule will now be at the lowest vibrational level of the electronic state. Next, a photon is
emitted and the molecule will return to the ground state. This type of emission (from a high
singlet state to a low singlet state of same spin multiplicity) is known as fluorescence. Crossing
of excitation can also occur from a singlet state to a triplet state where the two different states
have different spin, and this process is known as intersystem crossing and is a nonradiative
process. Typically, the energy of an excited triplet state is lower than that of an excited singlet
state for excitation of the same orbital state.
The transition of the excitation of an electron from the highest occupied orbital centered
on one molecule to the lowest unoccupied orbital centered on another molecule results in an
intermolecular charge transfer interaction. This type of interaction of energy levels between two
different molecules will also produce a shift of their energy levels and is called a Forster energy
transfer. A charge transfer transition can also occur in an asymmetric molecule.
1.2.3 Light and Tissue Interactions
The cellular, extracellular, and bulk properties of tissue will produce diverse processes
during the interaction of light. Tissue, like other matter, will interact with light through
absorption, scattering, reflection and transmission; resulting in radiative and nonradiative
28
processes. (Niemz, 1996) Important properties of tissue itself include the structure, water
content, blood circulation, thermal conductivity, heat capacity, density, and the presence of
melanin, other fluorophores, and chromophores. The inhomogeneity of different samples of
biological tissue makes it difficult to correlate its optical properties.
If the frequency of the incident wave equals the frequency of the free vibrations of the
tissue particles, absorption will occur. Absorption of photons by tissue is typically dominated by
proteins, DNA, water, melanin, and hemoglobin absorbing the incident photons. The exact tissue
component that absorbs the photons depends on the wavelength of the incident light, and these
components are known as chromophores. A chromophore will absorb energy and become
electronically excited. For tissue, this vibrational and translational energy is typically converted
to thermal energy or heat. The longer the wavelength, the deeper it will penetrate the tissue up to
a wavelength of about 1300 nm. At wavelengths above 1300 nm, penetration is only superficial
because of the absorption coefficient of tissue water. (Prasad, 2003) The absorbance of tissue is
difficult to determine since the photons that are absorbed cannot be used any more for detection
and the scattering may be significant. Subtraction of the transmitted, reflected, and scattered
intensities from the incident intensity is one method of determine the absorbed intensity.
In general, the most evident effect in light and tissue interactions is scattering. Once light
enters tissue, scattering occurs because of the heterogeneous structure of tissue which varies in
particle size and index of refraction between different parts of the tissue. The depth of
penetration is also limited since scattering in such a turbid medium results in backward and
forward scattering. It should now be obvious that the scattering process in tissue is complex. In
biological tissue, inelastic scattering via Brillouin scattering is weak, becoming significant only
under shockwave generation. Neither Rayleigh nor Mei scattering can completely describe the

29
elastic scattering of light by tissue. Raman scattering of light by tissue will produce excitation of
the molecular vibrations and may be significant in tissue. Scattering within tissue will also affect
the absorption of light by the tissue. In most tissues, absorption and scattering processes will take
place simultaneously, and will occur with varying ratios.
1.2.4 The Interaction of Lasers and Bulk Matter
The destructive interaction of lasers with matter is facilitated by the generation and then
acceleration of free electrons. For such light and matter interactions, a free electron is produced
by the simultaneous absorption of photons or by the kinetic energy of an impacting free electron
to exceed the band gap energy. However, for the interaction of lasers with matter, the exceeded
band gap energy requirement is replaced by the effective ionization potential requirement since
the oscillation energy of the electron due to the laser’s electric field needs to be accounted for.
(Niemz, 1996) At least one free seed electron produced by multi-photon ionization or by impact
ionization is required to start a cascade ionization effect. Photoionization for different laser field
strengths and frequencies can result in multi-photon ionization. In impact ionization, the kinetic
energy of the impacting electrons is used to overcome the effective ionization potential
requirement. The excess energy that remains after the impact of electrons is distributed among
the electrons involved in the collision. This results in the electrons needing to gain less energy to
reach the critical level.
The energy carried by the free electron within the material, for a time interval that
depends on the material and laser settings, will originally induce a primary thermalization effect.
Thermoelastic stresses caused by the rise in temperature will stay confined to the irradiated area,
creating a rise in pressure. If the laser pulse duration is longer than the thermalization effect, the
pressure within the confined medium will reach a maximum, and a stress wave will be emitted
that contains a compressive and tensile stress. Even if damage is not produced by the increase in

30
temperature (thermal damage) the tensile stress wave can induce fractures in the material. In an
aqueous media, rupture by tensile stresses under isothermal conditions is called cavitation and
bubble formation by heating under isobaric conditions is called boiling. However, under
confined stress conditions where heating and stretching are both occurring distinction becomes
difficult therefore the term optical breakdown is used. Also, if the laser pulse duration is in the
nanosecond range or shorter and has an extremely high spatial density of photons an optical
breakdown will result. During optical breakdown, temperatures of several thousand Kelvin can
be reached. Optical breakdown can include bubble formation, plasma luminescence, and ionized
regions of extremely high electron density.
Material removal via volumetric processes is known as ablation. Ablation processes can
remove molecular clusters, molecular fragments, and single molecules as well as forming
bubbles or cracks through the fracture of chemical bonds. The ablation of deeper layers will
continue as long as the critical energy is supplied and this process is known as phase explosions.
Photochemical, photomechanical and/or photothermal processes can lead to vaporization,
molecular fragmentation and void formation through phase transitions.
When a pulsed laser beam is focused, plasma formation results in catapulting, while for a
pulsed unfocused laser beam, confined thermal ablation results in catapulting. Plasma formation
initiated by linear absorption can be used for micro-dissection and for surface cleaning.
Conventional cleaning of surfaces typically has a negative result involving direct contact and
chemical reactions. Surface cleaning by lasers is capable of removing submicroscopic particles
and hydrocarbon films of contaminants from surfaces.
Since the ability to control material removal in surgery and electronic manufacturing is
important, ablation at 248 nm has been studied by Kuper and colleagues in 1990. For many

31
polymers, the dominating contribution of ablation by UV excimer lasers is unknown. Poly-
methyl-meth-acrylate (PMMA) can be used as a model for quantitative and qualitative analysis
of the photolysis products. A well-defined photochemical fragmentation pattern of PMMA has
been found and the major primary process is the side chain scission under the formation of
double bonds. The degradation process upon heating of PMMA indicated the existence of highly
vibrational excited molecules and can be considered as the photothermal contribution. Finally,
the high measured quantum yield showed the photochemical contribution to the ablation process.
It was concluded that thermal and photochemical processes can produce an increase in the
specific volume to cause ablation of material.
Nucleation and pressure generation processes at a liquid-solid interface induced by a
pulsed laser can create a surface plasmon. A surface plasmon can be used as a probe which can
provide accurate information on the early stages of the nucleation processes, nucleation
thresholds, transient pressure generation, absolute pressure amplitudes and growth velocities by
rapid bubble growth. The surface plasmon will be scattered by the bubbles formed resulting in
the surface plasmon resonance broadening and shifting, and hence temporarily increasing the
reflectance. As the bubbles collapse, the surface plasmon resonance becomes narrower and the
reflectance decreases. The resonance shift is caused solely by the rise in temperature at the
interface and this is supported by numerical computations for the temperature evolution at the
interface. It was also determined that the bubbles remained confined within the superheated
liquid layer and the size does not exceed the thickness of the superheated liquid layer.
Knowledge about the plume dynamics and the stress distribution below the target surface
helps to explain the kinetics of phase transitions during ablation. The visualization of ablation
plumes is difficult since the refractive index variations are usually smaller in gases than in

32
liquids or solids and the plumes are small in size, so interactions are short with light illumination
that produces only small deflections. Campillo in 2006, using a Schlieren filter, which requires a
point source and white light, studied plume dynamics. The Schlieren technique works on the
principle of deflection of light beam to produce dark-field images. Using this technique, the
plume was determined to consist of an upper and lower part. With the upper part consisting of
water vapor that results from complete vaporization of the targets top layer, and the lower part
consisting of vapor and droplets that result from a phase explosion. It was also shown that the
collision between the plume and ambient air produced an internal shock wave that traveled back
through the center of the plume.
Any simple relation between radiant exposure and ablation depth as predicted by a blow-
off model or stead-state models can only be an approximation for a limited range of radiant
exposures. Therefore, different models have been developed in an attempt to describe UV-laser
ablation of polymers by Arnold and Bityurin in 1999. In a photochemical model, electronic
excitation will result in the direct breaking of bonds without thermalization. In models where
bonds are broken thermally, the ablation rate, threshold of the laser pulse rate, and pulse length
are all dependent and supports that the ablation process is thermal in nature. In photophysical
models, both thermal and non-thermal features are taken into account. Models of ablation can
also be divided into volume and surface models. In volume models, the decomposition of
material is assumed to take place within the bulk material. In surface models, material removal
takes place within several monolayers from the surface. Combining multiple models can predict
a sharp explosive ablation threshold as well as the near-threshold for ablation occurring
significantly after the end of the laser pulse. Also, the small ablated depth per laser pulse will
result in high values of ablation velocity.

33
1.3 The Interaction of Lasers and Tissue
The interaction of laser light with tissue depends upon the properties of the tissue and the
parameters of the laser. The magnitude, exposure time, and placement of the deposited heat
inside the tissue will determine the spatial extent and degree of tissue reaction. The optical
properties of the tissue that effect this interaction are reflection and refraction, scattering, and
absorption. Laser beams can be used to open, seal, cut, vaporize, coagulate, cauterize, rupture
and weld human tissue. Biophysical or biochemical processes can also be monitored it real time
using very short pulses of laser light. However, once the beam enters the tissue, scattering occurs
resulting in the rapid loss of collimation of the beam. This will result in a loss of the initial
directionality of the laser beam as well as a defocusing of the beam spot. The scattering process
in tissue is quite complex and involves several mechanisms since the structure of tissue will
initiate scattering of the beam and the region within the tissue will be irradiated from all
directions by multiple photons. The fundamental principles, depending upon the interaction time
and the effective power density of the interaction of lasers with tissue can be summarized as
photochemical, photothermal, and photomechanical effects. For photochemical and photothermal
processes, a quasi-continuous wave irradiation can be used. Photomechanical processes can be
achieved with short, high powered laser pulses. Interaction types that occur adjacently cannot
always be strictly separated.
1.3.1 Photochemical Effects
Photochemical effects will occur at long interaction times, ranging from seconds to
continuous wave, and at low power densities, typically 1 W/cm2. Light is absorbed by the tissue
with no primary heating of the tissue and will induce chemical effects and reactions within the
tissue. Almost all biological relevant photochemical reactions are dependent upon the generation
of reactive oxygen species. Photochemical interactions of lasers with tissue are complicated and

34
lengthy. Therefore, photochemical interactions will be discussed when appropriate in the
following chapter.
1.3.2 Photomechanical Effects
Photomechanical effects will occur at power densities greater than 100 W/cm2. Laser
light is converted into kinetic energy by strong electric fields generated from the high irradiance
leading to either a breakage of the intracellular structure, or a dissociation or ionization of the
tissue involved. Photomechanical effects on tissue are determined by the magnitude of the tensile
forces, shear forces and their duration since tissue must strain before it ruptures. For tissue, while
the strain at fracture does not change significantly with strain rate, the ultimate tensile strength
(UTS) increases. Rapid deformation conditions will result in the increase in UTS since
significant viscous dissipation occurs between matrix elements. In general, increased tissue
strength is associated with increased collagen content and phase transitions of water within tissue
are strongly dependent upon the mechanical properties of tissue.
In soft tissues, high intensity irradiation produces plasma, and the generation of
shockwaves in the tissue disrupts the tissue through mechanical effects. The mechanical energy
of a laser is used to create shockwaves and cavitation in tissue with minimal thermal damage is
known as photodisruption. Photodisruption will result in these effects spreading into adjacent
tissues. Catapulting driven by plasma formation will result in strong shear forces when tightly
focused laser pulses are used. Also, the re-cultivation rate of catapulted cells is much higher
when focused pulses are used. Time-resolved photography of UV exposed live cells proves the
side effects by heat will play a minor role when compared to the damage by mechanical effects.
Another photomechanical effect that occurs at power densities above the threshold value
is the photoablative effect. The energy of a single UV photon is sufficient to cause dislocations
in the photoablative effect. The photoablative effect differs from photodisruption and plasma-

35
induced ablation by occurring on a shorter time scale, typically < 1 ns. Photodisruption and
thermal-induced ablation will occur on a time scale of 1 µs down to 1 ns. Photomechanical
effects will occur at relatively the same energy densities therefore, exposure time is the main
parameter used to distinguish between different effects. Photoablation occurs so quickly that
thermal conductivity and thus thermal damage effects have almost no impact. The laser energy is
used to cause a phase transition resulting in the tissue evaporating. The applied electric field,
when comparable in size to the average atomic or intramolecular Coulomb electric field, will
cause tissue breakdown. Again, the extent of this process depends on the tissue properties. This
type of ablation is localized within the laser beam spot and can be used for tissue sculpturing.
Power densities below the threshold value cannot result in spontaneous tissue removal and the
absorbed energy will be converted into heat.
1.3.3 Photothermal Effects
Photothermal effects can be induced in tissue during laser-tissue interactions.
Photothermal effects include a large group of interaction types where increased temperature is
the main parameter. The degree and extent of photothermal effects is determined by the optical
and thermal properties of the tissue as well as the laser parameters. Heat generation within the
tissue is mainly determined by the wavelength dependency absorption of the tissue. The
temperature rise within tissue is associated with the photon energy converting to kinetic energy
through a combination of nonradiative processes and vibrational relaxations. Thermal effects will
result, in most biomolecules, since a large number of accessible vibrational states are available to
facilitate absorption as well as a large number of channels are available for thermal decay and
deactivation. Many lasers used for surgical applications fall within this category of converting
laser light into thermal energy. When tissue is irradiated by a laser beam, heat is generated inside
the tissue and the absorptivity of the tissue can change. In the example of the cornea exposed to

36
UV radiation, this change is associated with both the formation of radicals (whose absorption
cross section exceeds that of the original macromolecule links) and the development of light
scattering as result of water in the cornea starting to boil.
If heat moves faster than molecules can diffuse, thermal energy can be deposited into
high absorbance regions through short laser pulses, and this is known as selective heating.
During selective heating, the laser energy is absorbed by a targeted chromophore, leaving the
surrounding tissue largely undamaged. The time needed for the targeted chromophore to cool
after laser irradiation will be proportional to the strength and number density of the
chromophores, and is known as thermal relaxation. Thermal relaxation time during thermal
decomposition is important since it measures the thermal susceptibility of the tissue. The
temperature that tissue reaches locally during and after exposure to a laser determines the
location and extent of thermal effects with the tissue. Heat transport within the tissue is
associated with the thermal tissue properties, and losses of heat during laser-tissue interactions
also need to be considered. For most laser application the loss of heat is associated with
conduction. However, estimation of the spread of energy by thermal conductivity is difficult
since tissue layers can strongly differ in structure or complicated geometries are involved.
Lowering water content will generally result in a decrease in heat conductivity and heat capacity.
Living cells have a highly ordered structure that is stable at body temperature (~37 °C).
As the tissue temperature increases, the duration and peak value of the tissue temperature will
govern the photothermal effects achieved. These effects include coagulation, vaporization,
ablation, and carbonization of tissue. Inflammation, cellular injury and cellular enzyme
deactivation can occur to tissue as the temperature is raised by ~5-10 °C. Tissue generally, can
reach up to a temperature of ~45 °C before irreversible damage occurs if exposure time is not
37
limited. Older tissue has a higher density of cross-linking; therefore, higher temperatures are
required to undergo these transitions.
Further heating of tissue to ~45-50 °C will result in molecules within the tissue entering
into an energy activated state and transitioning into an irreversible damaged state. Absorption by
tissue at this range will result in weak hydrogen bonds and van der Waals interactions that
stabilize the helical configuration of the chains in collagen being overcame. Shrinkage of
collagen fibers in tissue will occur as a tensile stress is developed along the fibrils as well as
enzymatic changes and the development of edema. Spatial arrangement of protein molecules will
be lost and membrane alterations can also occur at this temperature range.
1.3.3.1 Coagulation of tissue
Tissue will begin to coagulate and denaturalize as temperatures approach ~50-60 °C. At
this temperature range, the helical structure of the chains in collagen transform into a denatured
structure that is randomly coiled. Most protein molecules will lose their ability to function in the
cell and also become denaturalized. In thermal denaturation, both the magnitude and duration of
thermal exposure can be interchanged to coagulate tissue. Either high temperatures at low
heating times or long heating times at low temperatures will produce the thermal energy for
tissue temperature to become ~50-60 °C. It is exactly the denaturation of protein structures that
determines the morphology of laser cuts. Successive laser pulses will result in the coagulated
zone deepening within the tissue.
Heating of tissue beyond 60 °C will result in a disintegration of collagen where the
coagulated tissue becomes necrotic, hydrogen bond breaking and retraction will occur. After a
relaxation of the stresses that develop during shrinkage, the tissue structure will experience total
mechanical failure. Above 70 °C denaturation of DNA occurs and at temperature higher than 80

38
°C equilibrium of chemical concentration is destroyed and membrane permeability is drastically
increased. Depending on the nature of the tissue, there may be a delay in tissue necrosis.
1.3.3.2 Vaporization of tissue
Once tissue reaches a temperature of 100 °C, vaporization will occur. Water within tissue
and cellular protoplasm will vaporize and produce thermal ablation of the irradiated tissue. As
water within the tissue tries to expand in volume as it vaporizes, an increase in pressure will
result and lead to localized micro-explosions. The vapor generated will carry away excess heat.
Phase transition of the tissue will be accompanied by bubble formation (micro-cavitation) and
thermal decomposition of the tissue fragments.
1.3.3.3 Carbonization of tissue
Carbonization of tissue will occur once tissue reaches approximately 150 °C. Tissue will
char as its organic elements convert into carbon. Carbon is released and blackening of the tissue
occurs. Carbonization of tissue currently has no benefits and results in irreversible damage. Since
tissue will become necrotic at lower temperature and carbonization reduces visibility, it should
be avoided in any case. When tissue reaches temperatures beyond 300 °C, melting can occur.
Melting of tissue can be used for tissue welding.
1.3.3.4 Ablation of tissue
Tissue temperatures between 300 °C and 1000 °C are achieved during ablation of tissue
with smoke generation. Ablation as a pure thermal effect is produced by the pressure buildup
from steam formation. The tissue matrix elastic restoring forces and the surface tension can be
overcame by the vapor pressure within the tissue. Bubble growth will occur within the tissue as
the water within the tissue boils. The temperature of the tissue is above the saturation
temperature and bubbles will continue to grow. As the pressure continues to increase, tissue that
cannot withstand the deformation and stresses associated with the phase explosion will result in

39
material ejection since the ultimate tensile strength of the ECM is exceeded. Evaporation,
followed by the expulsion of the evaporated material is the ablation process. Thermal
decomposition includes ablation. In ablation, the tissue is torn open and ejected by the expansion
of steam leaving behind craters in the area. Ablation events will depend of the laser irradiance,
radiant exposure, optical tissue properties and mechanical tissue properties. The vigor of the
ablation process is correlated to the water content of the tissue. Lateral tissue damage away from
the ablation site can be created by blood vessels transporting heat. Damage to surrounding tissue
can also occur through scattering.
Ablation with little to no thermal damage can also result, notably tissue ablation with UV
lasers. The ablation efficiency at high radiant exposures will be limited by the scattering and
absorbing of the incident light by the ablation plume which reduces the amount of energy that
can be deposited to the target tissue site. A recoiled-induced tissue expulsion can occur after the
primary tissue ejection and is largely determined by the mechanical strength of the tissue.
For soft tissue, ablation occurs via a phase explosion of the tissue water since the tissue
matrix is weaker than the pressure developed during the phase separation. When the ablation
front reaches a depth where the temperature is below the stability limit of the superheated tissue
water, ejection will stop. In mechanically weak tissue, ejection can be followed by a recoil-
induced material expulsion and by a dramatic mechanical deformation of the non-ablated
material. A recoil pressure can be induced in soft tissue by the primary ejection of ablation
products resulting in a second expulsion of the tissue. This secondary tissue expulsion increases
the ablation efficiency and the side effects of ablation. If the speed of ablation is more important
than precision and damage to surrounding tissue, ablation efficiency can also be increased in soft
tissue by reducing the laser pulse duration. Recoil stresses can result in a delay in ablation of

40
deeper tissue layers and ablation continuing beyond the laser pulse. In mechanically strong
tissue, like skin, no secondary expulsion effect will occur. The tensile strength of the tissue
matrix in mechanically strong tissue is higher than the stresses resulting from the phase
explosion. Ablation of strong tissue occurs only after pressure is built up through confined
boiling. The ablated tissue can be re-deposited onto the surface and is typically unwanted. Flow
components parallel to the ablated tissue surface can be monitored to prevent re-depositing.
A primary application of ablation is phototherapy or photothermal ablation (PTA).
Phototherapy is used to treat various medical conditions. Photochemical ablation is one of the
most successful techniques for refractive corneal surgery, where the refractive power of the
cornea is altered in myopia, hyperopia, or astigmatism. Cancer cells can be directly destroyed by
heat generated through the absorption of light within the tissue. PTA can be performed
repeatedly without the accumulation of toxic side effects and resistance. PTA is a localized
physical treatment and therefore would have fewer side effects than conventional cancer
treatments. Photothermal effects have been shown to be enhanced significantly, therefore
increasing the efficiency of PTA, when a light-absorbing material is applied to the target tissue.
Photothermal coupling agents are used to mediate increases in the local temperatures far above
the threshold at which irreversible cell death occurs. A study by the authors of “Small-animal
PET of tumor damage induced by photothermal ablation with Cu-Bis-DOTA-Hypericin” (Song,
2011) showed that CuS nanoparticles can be used in partnership with a NIR laser to cause
significantly greater cell death to BT474 tumor cells than exposure to a NIR laser alone.
In 2011, Song and coworkers investigated the potential application of small molecular
weight Cu-labeled bis-DOTA-Hypericin to increase the efficiency of PTA. Hypericin is a
naturally occurring photodynamic agent that induces cell necrosis when combined with light.
41
Hypericin will bind to phospholipids that are exposed to the exterior of the cell when the cell
membrane is damaged, which is the case in cell necrosis. Since phospholipids normally reside in
the interior of the cell membrane, the authors hypothesized that hypericin derivative can be used
for early assessment of PTA induced necrosis. MRI was used to provide real-time temperature-
sensitive images during the therapy. Breast tumor (BT474) cells where treated with photothermal
ablation therapy. In vitro results showed that treated BT474 cells had a higher uptake of Cu-Bis-
DOTA-Hypericin than untreated cells. Autoradiography and histology results also showed that
radiotracers where selectively applied to the necrotic zone of the tumor that was induced by
PTA. Therefore, this study was able to show that Cu-Bis-DOTA-Hypericin can potentially be
used to image tumor cell damage induced by photothermal ablation therapy.
Thermotherapy carried out by the transpupillary route is known as transpupillary
thermotherapy (TTT). Transpupillary thermotherapy is an accepted conservative treatment for
choroidal melanoma. In TTT, the laser beam is directed on the apex of the tumor through a
dilated pupil and is performed at temperatures that fall within the coagulation zone. Therefore,
TTT can result in an irreversible cytotoxic effects and damage to the tumor cells.
The interaction of neural tissue and a flexible CO2 laser fiber for the application of
neurosurgery was examined and compared by Ryan and coworkers in 2010. The wavelength of
the CO2 laser is 10.6 µm and is highly absorbed in tissue and water, independent of pigment. A
major application of CO2 laser energy is for resection and ablation of tumor tissue. A rapid
conversion of light to heat in very small volumes of tissue with minimal penetration to
surrounding areas is therefore possible. Experiments were conducted using a swine cranium; its
large animal brain tissue can simulate humans. The flexible CO2 laser was also compared to
conventional methods for neural tissue incisions by the authors. The thermal tissue injury lateral

42
to the incision was minimal and did not increase significantly with higher power settings of the
flexible CO2 laser. Clean pia (delicate innermost layer of the membranes surrounding the brain
and spinal cord) incisions without hemorrhaging were produced with the focused CO2 laser and
the depth increased as a function of wattage. Wide charred pia incisions were produced when the
CO2 laser was unfocused. At high magnification, the desiccated tissue was observed to be blood
cell debris free. When compared to bipolar cautery, the total tissue area affected by thermal
energy was much higher than with the CO2 laser. When axons suffer thermal injury, they
develop swelling and balloons and these nerve fibers are vulnerable to degeneration and death.
Therefore thermal injury must be kept to a minimum and the minimal injury to adjacent tissue
was produced by the flexible CO2 laser.
In corneal ablation, high precision as well as minimal adjacent tissue damage are very
important. In 2008, Tsiklis and coworkers, the authors of “Photorefractive keratectomy using
solid state laser 213 nm and excimer laser 193 nm: A randomized, contralateral, comparative,
experimental study” determined that this can be achieved by using far-UV lasers since corneal
tissue strongly absorbs in the far-UV region (190-200 nm). A solid state 213 nm laser was
compared to an excimer 193 nm laser. Only small differences were observed between the two.
For the excimer laser, ablated samples showed keratocyte dehydration, vascularization, and
pronounced fragmentation of the cell bodies. Also, the excimer laser samples demonstrated
normal epithelial thickness with mild hyperplasia and slightly thicker pseudo-membrane than the
solid state laser samples. The solid state laser ablated specimens demonstrated normal
appearance of keratocytes across the entire corneal thickness. Also, the solid state laser samples
demonstrated thinner than normal epithelium.

43
1.3.4 Laser-Tissue Interaction Examples
Forme fruste keratoconus is an abortive state of keratoconus where the progression
process has stopped at a certain point. Keratoconus occurs when the cornea thins and gradually
bulges outward causing blurred vision and may cause sensitivity to light and glare. Since LASIK
(laser-assisted in situ keratomileusis) may trigger the halted progression of keratectasis,
crosslinking of the cornea was introduced as an approach to stop the progression of keratoconus
into a forme fruste keratoconus cornea. Surface ablation has shown good refractive results and is
less invasive regarding the biomechanical stability of the cornea in keratoconus cases. Kaller and
collagens in 2005 published clinical results of customized topography-guided surface ablation in
patients with forme fruste keratoconus. Rehabilitation of the eyes by means of customized
topography-guided surface ablation was the main goal of this study. A significant reduction in
the refractive error, corneal irregularity, and ghosting for all patients was observed in comparison
to their preoperative statues.
Femtosecond laser pulses for nanosurgery of cells and biological tissue has been reported
by Vogel and coworkers in 2005. These authors used low density plasma to help explain the
mechanisms behind femtosecond laser pulses. Femtosecond laser pulses, because of the high
precision and the very low energy threshold optical breakdown, create very fine effects with a
spatial extent below the optical diffraction limit. Experimental parameters used for cell surgery
and computed numerical results were compared and two modes of dissection were differentiated.
In one mode, they determined that dissection using long pulses at MHz repetition rates are
mediated by free electron induced chemical decomposition and not related to heating or
thermoelastic stresses. Bubbles will cause dislocations far beyond the laser focus spot. In the
second mode, they determined that intercellular dissection at kHz repetition rates rely on
thermoelastic stresses that induce the formation of small transient cavities. Both modes of

44
femtosecond laser pulses for nanosurgery showed to achieve better precision in cell surgery than
surgery performed using continuous wave pulses.
A comparison between the thresholds for optical breakdown and dissection using
nanosecond and femtosecond laser pulses has been published by Vogel in 2007. The author
determined that for nanosecond pulses, the optical breakdown threshold depends mainly on the
linear absorption at the laser focus. At nanosecond pules, plasma luminescence usually serves as
an experimental breakdown criterion. For femtosecond pulses, no plasma luminescence in the
visible region occurs. Also, for femtosecond laser pulses, the thresholds for optical breakdown
and dissection are the same and the required irradiance is approximately two orders of magnitude
larger than for nanosecond pulses. Also, the breakdown energy required during femtosecond
laser pulses is approximately three orders of magnitude smaller in comparison to nanosecond
laser pulses. One advantage of femtosecond pulses over nanosecond pulses is when wavelengths
in the IR are used; they can penetrate deep into tissue without compromising the precision of
tissue effects because the wavelength dependence of femtosecond breakdown is weak. Finally, it
was concluded that any thermal denaturation of biomolecules will always be mixed with free
electron induced chemical effects and the latter will probably dominate.

45
CHAPTER 2
SPECTROSCOPIC METHODS
Spectroscopy techniques can provide a large amount of molecular structure information
rapidly. Since the absorption and emission of atoms and molecules must occur between well-
defined energy levels, every element has a unique emission spectrum. Each spectroscopic
method can be distinguished by how it interacts with the sample material, the energy used and
the component it determines. Nuclear magnetic resonance, vibrational and electronic
spectroscopy methods all involve the absorption of electromagnetic energy and the promotion of
the sample molecules from a ground state to an excited state. The following sections describe in
detail the spectroscopic methods of vibrational and electronic schemes.
Infrared (IR), Raman, Ultraviolet (UV), Visible (VIS), and Fluorescence spectroscopy
have all been proposed for biochemical and clinical analysis for in vivo screenings of diseased,
(thereby avoiding a biopsy), population screening, early diagnosis, prognosis, monitoring of
therapy and many others. Therefore, these techniques will be covered in more detail.
2.1 Vibrational Spectroscopy
Raman and Infrared (IR) spectroscopy are techniques that exploit the normal vibrational
modes that occur naturally and predictably within molecules. The photon energies associated
with this region of the electromagnetic spectrum can cause vibrational excitation, but are
generally too small to result in electronic excitation. Molecules will experience a wide range of
vibrational motions based upon the atomic composition, (as mentioned in the previous chapter).
In a normal mode of vibration, each atom executes a simple harmonic oscillation about its
equilibrium position. The center of gravity of the molecule does not move but all the atoms move
in phase with the same frequency. Stretching, bending, rocking, scissoring and twisting are all
46
types of vibrational motion. The mass of the component atoms and the strength of the bonds
involved will determine the frequency which a given vibration will occur.
For a clear explanation, consider two completely free identical diatomic molecules. They
will vibrate with identical frequencies but when the two diatomic groups are part of a molecule,
they can no longer vibrate independently of each other because the vibration of one group causes
displacement of the other atoms in the molecule. These displacements are transmitted through
the molecule and interact with the vibrations of the second group. The resulting vibrations are in-
plane and out-of-plane combinations of the two diatomic vibrations. Unless the groups are
widely separated in the molecule, the two frequencies may not be resolved since the coupling is
very small. When this occurs, usually the higher frequency mode is the anti-symmetric (out-of-
phase) vibration and the lower frequency mode is the symmetric (in-phase) vibration. Unless a
combination of force constants and mass effects result in similar uncoupled frequencies, the
vibrations are not coupled. The distinction between symmetric and anti-symmetric modes is
accomplished by means of depolarization measurements, where symmetric modes produce
polarized Raman bands and anti-symmetric modes produce depolarized Raman bands. The
symmetric modes are always active in the Raman spectrum because they produce a change in the
polarizability of the molecule. However, anti-symmetric modes are not active in Raman
scattering for molecules possessing a center-of-symmetry.
Raman and infrared spectra of a large number of compounds that contain a particular
functional group have certain features that appear at generally the same frequency for every
compound containing the group. These spectral features are then associated with the
complementary functional group. Also, the exact position of the group frequency within the
range can provide further information on the environment of the functional group. A substitute

47
atom or group creates changes in the distribution of electrons in a molecule and can be detected
in the vibrational spectrum. Some changes involve electron distribution in a molecule and cause
changes in the force constants, and as a result creates changes in group frequencies.
Separate signals for each 3N-6 vibrational modes of a molecule are not always displayed
in the spectrum. The signals observed can be a combination of vibrations, increased or decreased
because of molecular interactions or decreased by molecular symmetry or spectrometer
limitations. Dissimilar modes such as bending and stretching vibrations can be coupled if the
frequencies of the vibrations are similar and the two groups involved are adjacent in the
molecule. An example of this is in amides. The C-N stretching vibration is similar to that of the
N-H bending mode and the interaction of these similar frequencies results in two bands in the
spectrum. One band occurs at a higher frequency and one band occurs at a lower frequency than
the uncoupled frequencies of the N-H bending vibration and C-N stretching vibration. These
bands are known as Amide II and Amide III bands. As a note, the Amide I band is associated
with the C=O stretching vibrational mode. Fermi resonance is another special case of coupling.
Fermi resonance occurs from coupling of a fundamental vibration with a combination and results
in a shift of group frequencies and the introduction of extra bands. When Fermi resonance
occurs, there is a sharing of intensity and this effect can be strong.
Typically stretching frequencies are higher than the corresponding bending frequencies,
since a bond can bend easier than it can stretch or compress (i.e., less energy). The stretching
frequencies of hydrogen bonds are higher than those to heavier atoms. Also, excluding hydrogen
bonds, triple bonds have higher stretching frequencies than the corresponding double bonds,
which have higher frequencies than corresponding single bonds.

48
A vibrational spectrum will display the transmittance on the vertical axis and the energy
in inverse centimeters (cm-1
) on the horizontal axis. The inverse centimeter is also known as the
wavenumber since it is the number of wave cycles in one centimeter, and importantly, is directly
proportioned to energy.
2.1.1 Infrared Spectroscopy
Infrared (IR) spectroscopy is a rapid and simple method for obtaining the identity and
structure of molecules, including organics. The absorption spectrum is a plot of the percentage of
IR radiation that passes through the sample vs. the wavelength (or wavenumber) of the radiation.
The position and relative amplitudes of the absorption peaks or bands gives information about
the molecular structure.
There are two main types of instruments for IR spectroscopy, those are Fourier transform
(FT) and dispersive. FT-IR spectrometers are based on the Michelson interferometer.
Interferometers record the spectrum in the time domain, resulting in an interferogram which must
be transformed to the frequency domain by means of a Fourier transformation to obtain the IR
spectrum. In IR dispersive instruments, the spectrum is directly recorded in the frequency
domain using a dispersive device.
For a particular vibrational mode to absorb IR energy, a change in the dipole moment
should occur with displacement, and a large change in dipole moment will result in strong
absorption bands. Practically all organic compounds absorb IR radiation. IR spectra can be
obtained from samples in any phase, but care must be taken to insure that the sample solute or
sample substrate does not obscure the sample spectral regions. For example, glass absorbs IR
radiation and should not be used. Vibrations that are often weak in the Raman spectrum typically
have strong IR absorption characteristics. Infrared spectroscopy produces spectra of samples that
absorb radiation in the infrared region of the electromagnetic spectrum, from about 200 to 4000

49
cm-1
. IR absorption occurs when energy is transferred from the incident radiation to the
molecule, and a quantum mechanical transition between two vibrational energy levels occurs.
The difference in energy between the two vibrational energy levels is directly related to the
frequency of the electromagnetic radiation. A feature observed in the spectrum is an expression
of an absorption band in the sample. The most important transitions are from the ground state to
the first excited levels and these transitions usually give rise to strong absorption bands in the IR.
For example, the method of static and time-resolved infrared difference spectroscopy has been
used to investigate carboxylic groups in greater detail using [4-13C] aspartic acid labeled
bacteriorhodopsin (BR) by Engelhard and coworkers in 1985. In this study, data provided
assignment of the helices in the amino acid sequences based on the neutron scattering
experiments.
For aliphatic amino acid side chains, hydrogen bonding, protonation state, and
coordination of cations are the dominate factors for determining band positions. Infrared
spectroscopy is one of a few techniques that can define the protonation state of side chains which
has an important consequence for the electrostatic interactions in proteins. Also, infrared
spectroscopy can observe side chains and the protein backbone in the same experiment, therefore
allowing the comparison of the kinetics of the backbone structural changes with the side chain
signals.
Molecules adsorbed on surfaces as well as their structures can be identified using infrared
spectroscopy based on the surface infrared selection rule. This rule states that only vibrational
modes with a component of the dynamic dipole moment along the surface normal will be
observed. Interpretation of the spectra traditionally relies on comparisons with spectra of known
molecular species or using theory to assign surface vibrations to particular molecular vibrations.

50
Theoretical spectra reproduce the general qualitative features of the experimental spectra in
terms of approximate frequencies and relative intensities. The use of theory to assign the surface
vibrational spectra greatly enhances the reliability of those assignments and provides additional
insights that cannot be obtained from only the experimental spectra. However, when using theory
to assign surface vibrational spectra, the relative intensities are generally not in complete
agreement with experiments. This is mainly because the theoretical spectrum does not take into
account the intermolecular forces within the molecule.
Comparisons between IR spectra are often difficult. Baseline distortion has been shown
to make it difficult to differentiate between small bands in a spectrum and background noise.
Also, small deviations in band positions and band intensities can produce artificial bands in the
region of symmetric vibration.
2.1.2 Raman Spectroscopy
Raman spectroscopy is also a vibrational spectroscopic technique. When the energy of an
incident photon is unaltered after interaction with a molecule, the photon is scattered and has the
same frequency as the incident photon, this is known are Rayleigh scattering or elastic scattering.
If energy is transferred from either the molecule to the photon or from the photon to the
molecule, the scattered photon has less or more energy than the incident photon, respectively, in
a process is known as Raman scattering (i.e., inelastic scattering). When energy is transferred
from the photon to the molecule, the molecule will be left in a higher energy level given rise to
Stokes lines. When energy is transferred from the molecule to the photon, the molecule must
already be in an excited state so that it can return to a lower state after giving up energy to the
photon, giving rise to anti-Stokes lines. Accordingly, if a photon has a lower frequency (i.e.,
lower energy) than the incident light, a change in the vibrational mode of the sample molecule
will occur, this is known as the Stokes-Raman shift. Simultaneous absorption of an incident
51
photon and the emission of a Raman-scattered photon with a shift in wavelength will correspond
to vibrational level energy differences in the molecule (Raman shift).
As noted above, Raman scattering occurs at wavelengths shifted from the original
incident light by the energies of the vibrational mode of the sample. The change in the
polarizability of an induced molecular dipole must result from vibrational motion for Raman
scattering activity. Raman spectroscopy provides a characteristic signal for certain molecular
bonds. The position of the band depends on specific vibrational modes and is a very sensitive
technique for determining differences in molecular structure. The plurality of Raman shifts in the
region from about ~1000 to 1800 cm-1
is usually complex and unique to a particular material,
hence, collectively called the “fingerprint region”. In Raman spectral plots, scattered intensity as
a function of the energy difference between the scattered photons and the incident photons are
shown. Since each molecule has its own characteristic Raman spectrum, the Raman spectrum
can determine the composition of the sample. The typical spectrum shows a series of peaks
shifted by a unique characteristic vibrational frequency associated with a specific chemical
compound. The concentration of the molecule is generally proportional to the intensity of the
bands. Raman spectroscopy can be in vivo or in vitro, and is a nondestructive vibrational
technique for providing dynamic and structural information on molecules.
A monochromatic laser beam is typically used as the incident light for Raman
spectroscopy. The gain or loss in photon energy corresponds to the difference in the final and
initial vibrational energy levels of the molecules that are participating in the interaction. The
Raman shifts are represented in wavenumber with the unit of inverse centimeter (cm-1
), noting
that the Raman shifts (i.e., positions) are independent of the excitation source wavelength.
Raman peaks are associated with the vibration of a particular chemical bond or a single

52
functional group in the molecule and are specific and provide direct information about the
composition.
One advantage of using Raman spectroscopy is it can provide information on the
structure, concentration and interaction of biochemical molecules in their environments within
intact cells and tissues. Raman spectroscopy has the ability to provide the above information in a
non-destructive way and without homogenization, extraction, or the use of dyes, labels of other
contrast enhancing agents. Raman spectroscopy can also be used to study the interaction of
biological molecules and nanoparticles. Nanoparticles can pass through cell and nuclear
membranes and are used to affect cell structure and cause damage to specific cells. Through
nanoparticles designed to bind to particular biological molecules, individual molecules can be
monitored as well as destroyed in the case of cancer treatment.
Raman spectra of solids when compared to those solids in solution are more complex and
almost always sharper. In solid samples, the frequencies of the bands are shifted as compared to
those in the liquid phase. When molecules are in a solution, the intermolecular forces are random
and are variable since adjacent molecules are continuously colliding. The violence of the
collisions and the shift of the frequencies of the intermolecular vibrations result in broadening of
bands. The weakness of Raman spectrum of water and the relative ease with which low
frequencies can be measured are two advantages in molecules of biological importance of
Raman spectroscopy for measuring vibrational spectra.
2.1.2.1 Raman micro-spectroscopy
Raman micro-spectroscopy, in which both the excitation and the collection of Raman-
scattered light are done with the aid of a microscope objective, can be used to identify and grade
human skin pilomatrixoma. Pilomatrixoma is a benign skin tumor derived from the hair matrix.
Cheng and Liu in 2005 used Raman micro-spectroscopy to confirm that collagen is the
53
predominate compound in normal skin and Pilomatrixoma samples contain a higher content of
tryptophan than normal skin samples.
In one study conducted by Zhang and coworkers in 2008, Raman micro-spectroscopy
was used to investigate the regular variations in organic matrix composition of small yellow
croaker otoliths (small concentrations composed mainly of calcium carbonate found in the
middle ear of fish) and their relation to fish calcification process. Otholiths structures are used
for age determination on a daily or annual scale. By understanding the otholith calcification
process, calcified biominerals such as shells and coral skeletons can be better understood. The
results showed the versatility of Raman micro-spectroscopy technique and provided insight into
the calcification process.
A combination of multimodal multi-photon imaging and Raman micro-spectroscopy can
be used to characterization of structure-constituent correlation of skin without labeling.
Multimodal multi-photon imaging allows the visualization of dermatological features and Raman
micro-spectroscopy allows the identification of the molecule. Contrasts between dermatological
features and molecular specificity are produced without the use of fixation, sectioning or
staining. Immediate illustration of detailed histological changes on intact tissues can be
visualized using these techniques in combination. Therefore, the changes in response to repeated
physical or chemical injuries can be imaged subsequently on the same area. The ability to
visualize multiple tissue structures and characterize the tissue on a molecular level allows
monitoring of tissue changes associated with disease and could allow the outcome of different
therapies to be investigated.
2.1.2.2 Resonance Raman spectroscopy
A particularly sensitive method of Raman spectroscopy is known as resonance Raman
spectroscopy. This method is often used when the vibrations are very weak in regular Raman as

54
these weak vibrations are strongly enhance and measured. Resonance Raman spectroscopy uses
absorption of energy from the excited source at or near an electronic transition in the molecule.
Raman intensity will increase as resonance is approached and the electronic transition
closest to the excitation frequency should contribute the most for similar transition moments.
Also, the relationship between resonance enhancement of a vibration mode, the atomic
displacement, and the molecular electronic transition can also be examined.
Resonance Raman spectroscopy can also be used to obtain a better understanding of
electronic excited state. Coupling between peptide amide groups in proteins may reveal the roles
of peptide bonds through which ground state electron transfer or photo-induced transfer occurs in
proteins. Photochemical studies of aqueous dipeptides suggest that a photo-induced transfer from
the carboxylate group to the peptide bond occurs upon UV irradiation, as related below.
Kinetic UV resonance Raman spectroscopy measurements of the pH dependency of the
activation barrier for trans-cis isomerization of glycine-glycine (Gly-Gly) has been reported by
Holtz, Li, and Asher in 1998. The charge-state dependence of the trans-cis ground state energy
difference was determined. Even the presence of a cis amide linkage was found to significantly
affect the protein structure. Cis-trans isomerization can also slow the folding and refolding
dynamics in proline and non-proline containing proteins. Their results suggested only a modest
impact of the charge state on energy differences and activation barriers for simple amides. This
was surprising since a significant difference in the activation barrier between the different charge
states due to entropic differences in water ordering was expected. The lack of differences may
have resulted from canceling effects.
The insertion of drugs to DNA has been studied by Benevides in 2008, using resonance
Raman spectroscopy. Resonance Raman spectroscopy was chosen because it is sensitive to the

55
structure of drug/DNA compounds, and it is selective, permitting only the observation of bands
corresponding to the vibrations of the chromophore framework. This Raman technique has two
main limitations. Those are: the laser wavelength required to make the excitation can only occur
in the electronic absorption band of the compound and the fluorescent effects of the samples can
sometimes over-shadow the Raman peaks.
Single-crystal UV near-resonance Raman spectroscopy can be used to probe electronic
transitions. Vibrations coupled to the electrons involved in a particular electron transition can be
probed by excitation of the Raman spectra in resonance with a particular electronic transition. If
the particular vibrations probed are localized to a particular region of the molecule, the atomic
localization of an electronic transition can be detected. In one study, (Chen, 1996) single-crystal
UV near-resonance Raman spectroscopy was used to investigate the dipeptide Gly-Gly. They
grew a crystal of hydrated Gly-Gly, determined its crystal structure and measured its Raman
tensor close to resonance. A general method to use pre-resonance single-crystal Raman
measurements to determine the orientation of the transition moments of the resonant excited state
and the next closest excited state as well as the direction of the molecular electronic transition
moments was developed.
For most non-resonance spontaneous Raman scattering experiments, pulsed laser sources
should be avoided whenever a continuous wave (CW) laser source is available. This is because
pulse lasers have much higher peak powers and this may result in significant non-linear optical
phenomenon such as, increased thermal, photochemical, and photo-thermal damage, especially
in solid samples. The heat from pulsed lasers can also lead to sample decomposition, artificially
changed samples, and phase transitions. For solid samples, semiconductors, and biomolecules, as
well as samples that strongly absorb the laser, this problem might be even more overwhelming.

56
Even for CW lasers if the power is too high or the measuring time is too long thermal damage
problems can occur. However, pulsed lasers could be used as the excitation source for Raman
spectroscopy. For thermally unstable solid samples, pulsed lasers can be used as long as the
sample has no strong electronic absorption at the laser wavelength and the energy of the laser is
kept below a certain threshold.
In one study conducted by Sieler and coworkers, the depolarization ratio of Raman bands
was used to infer the electronic transitions which correspond to the coupled molecular vibrations.
Polarized non-resonance and resonance Raman and FTIR spectroscopy were used to measure
model peptides in H2O and D2O at pH/pD values between 1.5 and 12.0 with visible, near UV,
and far UV excitation wavelengths. In Fourier transform-Raman instruments the sample replaces
the source lamp of the near-IR spectrometer. The most important results were for Gly-Gly and
showed that all amide bands as well as the symmetric carboxyl stretch band are doublets. The
amide I doublet resulted from vibrational coupling of the delocalized H2O bending mode with
the internal coordinates of the amide I mode. The amide III doublet resulted from vibrational
coupling between the twisting mode of the C-alpha group and the internal coordinates of the
amide III mode.
2.1.2.3 Surface-enhanced Raman spectroscopy
Raman spectroscopy has also shown to be a valuable instrument in the field of surface
science. Greatly enhanced cross-sections of Raman scattering from molecules adsorbed on a
metal surface was an important discovery that lead to the technique known as surface-enhanced
Raman spectroscopy. Surface-enhanced Raman spectroscopy (SERS) has an advantage over
other techniques since it can provide high quality spectra of samples in water solution and there
is a reduction in the fluorescence background which is often a problem in Raman signals of

57
biological molecules. Detailed analysis of spectra can be compared and Raman bands can be
assigned for specific functional groups contained in these molecules.
SERS also has an advantage in biological applications since it reduces the fluorescent
background which is often a problem in regular Raman scattering of biological molecules. The
mechanism of SERS is not completely understood but can be treated as an electromagnetic or
chemical enhancement. When considered as an electromagnetic mechanism, the resonant
interaction of the incident laser light with the surface plasmon of the SERS-active substrate is
thought to be the cause. When considering SERS as a chemical enhancement, the charge-transfer
transition between the metal surface and molecules adsorbed on it is thought to be the cause.
SERS however, does have a few disadvantages. The experimental conditions of SERS, such as
metal particle size, shape of the metal, and the surface potential of metal colloids are hard to
control. As well as the structure of adsorbed molecules or the nature of adsorption and
distribution of the electromagnetic field on and near the metal surface. Also, vibrational modes
are not intensified equally in SERS. Surface-enhanced Raman spectroscopy, however, does
allow the measurement of most samples at very low levels of detection and provides the
opportunity to investigate the orientation of molecules.
Surface-enhanced resonance Raman spectroscopy (SERRS) is a technique used for the
identification of components of a mixture without separation. SERRS has been shown to be a
more sensitive and specific detection method for the analysis of DNA when compared to
fluorescence. In the detection of DNA with fluorescence is limited due to the broad and
overlapping of the spectra.
2.1.2.4 Raman spectroscopy of peptides and proteins
Vibrational analysis of dipeptides containing alanine and serine has been studied by
Mukhopadhyay in 2008, using Raman spectroscopy. The spectra recorded contain several

58
overlapping bands, so the authors used theoretical geometries for all the dipeptides investigated.
The dipeptides were constructed from a library of amino acids and the dihedral angels were
varied to obtain an energy minimum. Significant differences between the experimental and
calculated frequencies were obtained as well as limited success in reproducibility of the spectra.
The lack of correlation between calculated and experimental frequencies in the amide I and
amide II regions could indicate that these frequencies are influenced greatly by hydrogen bond
and intermolecular coupling effects, showing a strong argument for non-bond interactions
occurring. Finally, Gauss-Cauchy product functions were used to identify the correlating band
assignments and the frequencies. Amide III modes have been proven to be a combination of NH
in-plane bending and CH deformation vibrations. Amide III vibrations also produce a strong
Raman scattering effect and can be related most directly to conformational features of peptides.
Raman investigation has been carried out on α-glycine at different pressures in 2011 by
Sharma and coworkers. To pressures up to 23 GPa, no structural phase transitions were
observed. The changes observed occurred in the slope of NH3 torsional and CO2 bending modes
across 3 GPa suggests subtle structural rearrangements. This results in changes in the nature of
the intra-layer hydrogen bond interaction across this pressure. As in all biological materials,
changes in the hydrogen bonding interactions play a significant role in structural conformation,
though not always resulting in a structural phase transition. Splitting, broadening and intensity
redistribution of various Raman modes under pressure may be due to changes in the
intermolecular coupling.
Amino acids, peptides, and proteins can be modified without any damage to the
molecular structure or conformation using a nucleophilic addition reaction. Raman spectroscopy
can be used to discern site-specific reactions on the amino acids alpha-amines or side group

59
amines. Determining where the modification has taken place is a significant step in the study of
all protein modifications. Quantitative chemical results can also be achieved using Raman
spectroscopy, thus, offering a distinct advantage over ultraviolet-visible assay by showing
exactly the reaction sites.
Another method for accurately describing peptide conformation behavior involves
assuming the solvent is continuous. However, this model may not be adequate for the description
of peptide conformational behavior because of the lack of the explicit directional hydrogen
bonds. Also, for dipeptides glycine-proline (Gly-Pro) and alanine-proline (Ala-Pro), a small
increase of population in Pro isomers is observed with rising temperature. The presence of the
proline ring provide an opportunity to study conformation of peptide side chains which are often
undetectable by other spectroscopic techniques; however, there is a limited influence of the side
chains on the backbone conformation.
Raman spectroscopy can provide diagnostic evidence for reverse turn structure when the
amide I and amide II bands are analyzed. Reverse turn structures can provide important
conformational components of protein structures. In the amide I region, reverse turns have
transitions which overlap with β-sheet structure and not the α-helical structure. Also, in small
peptides, reverse turn structures can generally be distinguished from α-helix, random coil, or β-
sheet structures.
Portable Raman instruments are also available for protein analysis. Portable Raman
instruments are designed to acquire data in field conditions. Pure amino acids in field conditions
have been studied be Culka and coworkers in 2010. This study collected Raman spectra of
astrobiologically important amino acids using two portable Raman instruments in outdoor
conditions. The noise level in the spectra of both instruments was similar when measured during

60
handheld use. Signal to noise was significantly reduced in both instruments when a custom made
holder was used. Their results showed that both instruments provided good quality Raman
spectra that can be used without additional spectral manipulations for the detection of relevant
amino acids. The bandwidth of the Raman bands was larger in the portable instruments than in
typical laboratory instruments, but not so large as to lose spectral information.
Insight into problems in protein structure and misfolding of individual peptide bonds in
diverse environments can be obtained by Raman spectroscopy. A general strategy has been
proposed by Burth in 2001 which is based upon isotope-edited Raman difference spectroscopy.
Using Raman spectra of unlabeled human insulin, three set of crystals containing C in different
locations in the insulin chain has been studied. By subtracting the spectra of known labeled and
unlabeled crystals and labeling two individual peptide links, the precise Amide I location and the
local secondary structures of those bonds were pinpointed. This strategy can be used for other
proteins providing that part of the polypeptide chain is in an ordered environment.
Important biological mechanisms can be explained by structural occurrences such as β-
turns which are important conformational features of proteins and peptides. Normal vibrations of
peptide potential energy distributions and the corresponding Jacobians allow the composition of
the observed amide frequencies to be established.
2.1.2.5 Raman spectroscopy of tissue
Raman spectroscopy has been utilized in the investigation of pathophysiological
transformations in tissues and life cycles of single cells by Volkmer in 2005, since it allows the
characterization of molecular structures. Coherent anti-Stokes Raman scattering (CARS)
microscopy has be developed as a new method of multi-photon imaging. This form of imaging is
based on signals that are specific to a particular molecular vibration. CARS imaging therefore
creates a chemical contrast without the use of labeling. Simultaneous acquisition of images based

61
on multi-photon imaging can allow the visualization of various tissue components with well-
defined localization and contrast. Multi-photon microscopy is non-destructive, deep penetration
and is a powerful tool for biomedical imaging. Some other examples of multi-photon microscopy
are: two-photon excited fluorescence (TPEF), second-harmonic generation (SHG) microscopy,
and sum frequency generation (SFG).
Cell proliferation can also be monitored by Raman spectroscopy. Cultures in the plateau
(non-proliferating) and exponential (proliferating) phases of growth and estimation of the
relative amount of biochemical components in cells and nuclei can be determined through the
use of Raman spectroscopy. Relative amounts and ratios of biochemical components can be used
to detect and quantify reproducible differences and to determine specific biochemical changes
that can be assigned to differences due to cell proliferation.
Raman spectroscopy has the ability to obtain biochemical information from proteins,
nucleic acids, lipids, and carbohydrates in a single acquisition. When appropriate choices of laser
wavelength and power are made, Raman spectroscopy is a noninvasive and nondestructive
technology that can be applied to clinical patients in vivo. The analysis of single cells in vitro can
also be performed since Raman spectroscopy uses high-power focusing objectives, confocal
optics, and sub-micrometer resolution stepping stages.
Biological and biochemical differences between cells in a given population is expected
since cells exist at different points in their cell cycle and cells grown in cultures can have
different confluences. These differences result in spectral variations and in the past, was either
averaged during spectral acquisition or post-processing. Spectral differences between cell
populations can be very subtle and single cell studies have focused on the differences in Raman
spectra between different cell types for example, healthy vs. tumorous. Other Raman microscopy

62
studies have been performed for analyzing a population of a single type of cell for biochemical
differences. Detected spectral changes from cell death via apoptosis and necrosis as well as
spectral differences between live and dead cells and exponentially growing and plateaus phase
cells have all been reported by Notingher and Henery in 2006. Raman spectral study of single
live cells can be conducted to discriminate between cells synchronized in the G0/G1, S, and
G2/M phases of the cell cycle and accurately detected the difference in G0/G1 cells from S and
G2/M cells. Raman microscopy has the capability to detect inherent sources of biochemically-
based spectral variability between single cells of a human tumor cell line cultured in vitro. The
most significant source of Raman spectral variability between cells in a culture can be
confidently attributed to biochemical changes arising from the progression of individual cells
through their mitotic cycle.
Another application of Raman spectroscopy is that it can be used to identify molecular
changes associated with diseased tissue, creating a unique tool for research in areas related to cell
biology and natural tissues. Real time diagnosis of lung cancer has been performed using near
infrared Raman spectroscopy and has been reported by Huang and coworkers in 2003. The
Raman spectra differed significantly between normal and malignant human tumor lung tissues as
well as a difference in parts of lung carcinoma. The tumors showed higher percentage signals for
nucleic acids, tryptophan, and phenylalanine, in comparison to normal tissue. The tumors also
showed lower percentage signals for proline, phospholipids and valine, in comparison with
normal tissue.
Basal cell carcinoma is the most common type of skin cancer and has been studied by
Gniadecka in 2008 using Raman spectroscopy. Normal skin and basal cell carcinoma verified by
histopathology was harvested and analyzed in one study, using near infrared Fourier transform

63
Raman spectroscopy. In the skin cancer samples, alterations in proteins and lipid structures were
apparent. Spectral changes were observed in protein bands, amide I, amide III and CC stretching
and in lipids, CH2 scissoring vibration and CH2 in-plane twist vibration.
Some disadvantages of Raman spectroscopy include the effect of stray light, which if not
removed, can produce a high background signal that can saturate the Raman spectrum. Also,
weak Raman bands can be masked by background scattering from small suspended particles in
solution or liquid samples. If the sample fluoresces under visible light, the Raman spectrum may
be totally obscured. However, the problem of fluorescence emission from the sample can be
reduced or eliminated when the laser excitation is in the near infrared region or the red region.
Also, when the laser beam focus is increased, the Raman intensity increases but this may damage
the sample.
2.1.3 Coupled Raman Spectroscopy and Infrared Spectroscopy
Vibrational frequencies may give rise to IR absorption, Raman scattering or both. When
vibrational frequencies give rise to both, observed wavenumbers will be numerically the same in
Raman and IR, but the intensities will in general be very different. The intensity of Raman line is
a linear function of concentration and the intensity of IR absorption band is a logarithmic
function of the concentration. Raman spectroscopy can provide information complementary to
that obtained from infrared spectroscopy.
The use of experimental Raman and infrared data as well as normal coordinate analysis
has been shown to provide vibrational assignments to frequencies of the lowest energy non-
planar-trans conformer molecule structure. This idea has been applied to study phenylurea and
phenylthiouea molecules by Badawi in 2008. Also in this study, it was reported that the effect of
the steric interactions between the CH3 and NH2 groups in destabilizing the planar structure
should be considered. The CH3 group seems to hinder the conjugation between the C=C and

64
C=O groups and therefore weaken the bond character of the C-C bond in the methyl substituted
compound.
Raman scattering and infrared absorption techniques can also be used to determine
molecular sites in which interactions occur between peptides and other molecules. Hydrophobic
amino acids play an important role in protein folding. In soluble proteins, a hydrophobic pocket
is created that is hardly accessible by the surrounding water. Information on the secondary
structure of peptides and proteins in aqueous solutions can be analyzed by the Amide spectral
regions. The Amide spectral regions are highly sensitive to peptide backbone motions.
Understanding protein structure and folding can be accomplished by determining
conformation preferences of dipeptides in aqueous solution. Depolarized Rayleigh scattering and
Raman spectroscopy has been used by Avignon and coworkers in 2004 to study glycine and
alanine dipeptides in aqueous solution. As well as hydrophobic interactions between side chains,
residue steric interactions, screening of backbone electrostatic interactions and side chain
conformation entropy by solvents have all been suggested to be the cause of conformational
preferences of residues in polypeptides. It was shown that the only electrostatic screening model
was able to explain the conformation preferences of dipeptides. The frequency of the Amide I
band is the most accurate determinable vibrational spectra parameter for peptides in an aqueous
solution. The Amide I band depends on the position and intensity of the components which are
determined by the dipeptide conformation. This vibration can be used to distinguish other
conformations.
2.2 Electronic Spectroscopy
When the energy of the incident radiation equals the electronic transition of the molecule,
absorption occurs and this is known as electronic excitation. Electronic excitation typically
involves a single electron moving from an occupied to an unoccupied orbital resulting in the

65
molecule moving from a ground state to a higher electronically excited state. Many different
electronic transitions are possible and generally electrons will be promoted from the highest
occupied molecular orbital to the lowest unoccupied molecular orbital. Electronic spectroscopy
utilizes the interaction of electromagnetic radiation with the electronic transitions of the molecule
being studied. Three types of electronic spectroscopy are discussed below. Those include
ultraviolet and visible, chrioptical, and fluorescence spectroscopy.
2.2.1 Ultraviolet and Visible Spectroscopy
Ultraviolet (UV) and Visible (VIS) spectroscopy is a highly sensitive technique used in
structure determination to detect the interaction between groups and to study chemical reactions
when functionality is altered. When an electron is promoted from a ground state to an excited
state, the absorption of UV-VIS is measured and typically displayed as a plot of absorbance
intensity versus the wavelength. All organic compounds will absorb light in the UV region and
some absorb light in the VIS region, therefore this method of spectroscopy can be helpful when
organic compounds are studied.
Molecules that are likely to absorb light in the UV-VIS region are known as -electron
functions or atoms where non-bonding valance electrons are found. These areas of light
absorbing groups or functions are known as chromophores. UV-VIS spectroscopy is the best
method for identifying and detecting chromophores. When UV-VIS light is absorbed, dipole-
dipole coupling of chromophores at their excitation state can produced a delocalized excitation.
Delocalized excitation can cause shifting, broadening and splitting of the spectra. These spectra
changes can then be associated with the relative orientation and intensity of the dipole moments
associated with the UV-VIS absorption bands of each chromophore. Overlapping delocalized
excitation transitions occurs when the chromophores interact.

66
2.2.2 Chrioptical Spectroscopy
Optical rotatory dispersion (ORD) and circular dichroism (CD) spectroscopy are both
types of chrioptical spectroscopy. Once an electron is promoted from a ground state to an excited
state orbital, absorption is measured in ORD and CD spectroscopy by measuring the absorption
of left and right circularly polarized light or measuring the refractive indices and taking the
difference. CD spectroscopy is used to detect functional groups and to determine conformation
of molecules. The spectrum is displayed as wavelength on the horizontal axis and the vertical
axis can be displayed as positive or negative. CD spectroscopy has been used for chemical
analysis, biophysical studies, and secondary structure of proteins studies. Chrioptical
spectroscopy is typically limited to only optically active compounds.
2.2.3 Fluorescence Spectroscopy
Some species are capable of absorbing electromagnetic radiation and this causes the
electrons to enter an excited state by absorbing the photons energy. From the ground state, if
enough energy is available, the electron moves to one of the many vibrational states in the
excited electronic state. As the specie transitions from a singlet excited state back to the ground
state, energy is released in the form of light and this is known as fluorescence (phosphorescence
is produced if the transition is from an excited triplet state). If the electron spins are parallel, a
triplet state is possible and usually forms by intersystem crossing from an excited singlet state
rather than by direct excitation from the ground state. If the electron spins are antiparallel the
state is singlet. The energy gap between the excited state and the state that the electron falls will
determine the wavelength of light that is emitted. The emitted photons will have different
energies and therefore different frequencies. The wavelength of light used to excite the species
and the emitted wavelength by the species is tailored to that specific species. Typically an
ultraviolet light is used to excite the electrons in the species. The light being emitted from the

67
species occurs at a lower energy and this can be within or outside the visible spectrum. Also, the
wavelengths of fluorescence are longer than vibrational absorbance. This is because vibrational
relaxation occurs in the excited electron state and the electronic relaxation occurs from the
ground state of the excited electron, causing lower energy electronic relaxations than energy of
absorption. The different frequencies and relative intensities of the emitted light are used to
determine the structure of the different vibrational levels. Very few species in a sample will
fluoresce at a given wavelength, following a specific excitation wavelength, making fluorescence
a very sensitive technique for detecting particular species. At low concentrations the intensity
generally will be proportional to the concentration of the fluorophore. Specie concentrations as
low as one part per trillion can be detected under ideal conditions, making fluorescence
spectroscopy more sensitive than absorbance spectroscopy, which are often used as
complementary techniques. Successful single specie detection experiments, a high degree of
selectivity achieved using a variety of photochemical and instrumental approaches, and
flexibility in measuring a range of solid and liquid samples are all advantages in fluorescence
spectroscopy.
Fluorescence spectroscopy is a nondestructive and sensitive technique that allows the
identification of different aromatic fluorophores with electron-donating functional groups as well
as the study of dynamic properties of the sample under different environmental conditions. The
broadness and position of fluorescence peaks are related to structural components such as
molecular size and content of functional groups. Conventional fluorescence techniques are
helpful in the investigation of the overall composition of humic substances in terms of aliphatic
and aromatic groups showing different structure.

68
Fluorescence spectroscopy is also well established for the analysis of molecular
interactions. Because of its sensitivity to concentration, measurements of peptide solutions can
be obtained at much lower concentrations than NMR measurements, thus allowing direct
measurements of the peptide monomer.
Fluorescence spectroscopy can be used to follow conformational dynamics on a timescale
down to a few nanoseconds. The interaction between the fluorophore and quencher interactions
occur by reorientation through local diffusion inside the volume set by the molecular linker and
yield an upper limit to the observable rate constants for polymers end-to-end contacts. The
interactions can be used as evidence of conformational changes in macromolecules or
macromolecular complexes. In aqueous solutions typically many fluorophore quencher pairs can
induce formation of hydrophobic complexes.
2.2.3.1 Fluorescence excitation-emission matrix spectroscopy
When the light emitted by a sample is measured and the excitation light is at a constant
wavelength, an emission spectrum is collected. An emission map is created when emission
spectra from a range of excitation wavelengths are combined together. This results in emission
intensity as a function of excitation and emission wavelengths. When the emission light
wavelength is held constant and the excitation light is scanned through different wavelengths an
excitation spectrum is collected.
A widely used method for analyzing water samples of different origin and dissolved
organic matter (DOM) in aquatic environments is fluorescence excitation emission matrix
(EEM) spectroscopy. DOM in ground and surface water consists of a variety of organic
compounds. Humic substances and protein related substances are the primary sources of
fluorescence in dissolved organic matter. Fluorescence spectroscopy gives a wide spectrum of
information in very short time and is a very sensitive and selective technique. Fluorescence is

69
very sensitive to low DOM concentrations and to differences in properties and distributions of
fluorophores between similar samples. The excitation and emission ranges reported for humic
substances are 280-380 nm and 350-600 nm respectively. Because of fluorescence sensitivity
and selectivity, it can be applied to small samples without pre-concentration or isolation and is a
rapid, nondestructive method that allows subsequent analyses to be conducted after spectra are
collected.
Fluorescence spectroscopy can be used for determining qualitative aspects of organic
matter character and functional properties. In one study conducted by Weishaar in 2003,
fluorescence spectroscopy was used to assess the effect of changing coagulation pH on organic
matter character, removal and composition. Fluorescence excitation-emission matrix (EEM)
spectra display the intensity of fluorescence within the sample against the excitation wavelengths
and the wavelength at which excited fluorophores emit light. Natural fluorescence (from humic
and fulvic like) and microbial derived organic matter fluorescence (from tryptophan and tyrosine
like) occurs at shorter emission wavelengths. Chlorophyll fluorescence is found at longer
wavelength and is indicative of algae activity. Results of this study show that fluorescence
spectroscopy is an effective technique for the characterization of organic matter in a range of
different treatment conditions. For optimized coagulation conditions, a great reduction in
fluorescence intensity between raw and clarified water was observed.
Fluorescence EEM spectroscopy has been used to determine protein-like, fulvic acid-like
and humic acid-like substances. At low concentrations these materials are directly proportional
to fluorescence intensity and thus fluorescence EEM spectroscopy can be used to assess compost
maturity. The combination of fluorescence spectroscopy with regional integration analysis can
also be used as a tool for determining compost maturity. Unfortunately, classical fluorescence

70
spectroscopy alone does not accurately measure the maturity of compost because it cannot
differentiate from humic and non-humic compounds. Therefore, a combination of fluorescence
EEM with regional integration analysis was used to determine the degree of humic substances in
the compost and hence the compost maturity.
The role of quinones in redox reactivity of DOM is important for the cycling of metals
and the breakdown of natural and contaminated organic matter in anoxic environments. In the
reduction of humic substances by microorganisms, quinone moieties act as electron acceptors.
Quinone-like components are shown to contribute to the EEM spectrum. Unique excitation and
emission curves can also be used to characterize fluorophores. Fluorophores have been compared
with model Quinone. Quinone-like components are shown to contribute to the EEM spectrum.
In general, every fluorescence spectrometer gives device dependent signals. Research has
been conducted to standardize signals based on emission and excitation corrections as well as
quenching and normalization effect corrections. Standardization of data is important so
comparisons of results can be performed. Spectral correction, Raman normalization, and inner
filter effect correction can be applied and compared to fluorescence excitation emission matrix
measurements by different spectrometers.
2.2.3.2 Fluorescence recovery after photobleaching spectroscopy
Fluorescence recovery after photobleaching (FRAP) experiments can provide information
about the mobile fraction of fluorescence molecules and the rate of mobility in a defined
compartment, which can be related to the diffusion time of molecules. FRAP can also be used to
determine protein localization, activity, interactions, conformations changes and dynamics, as
well as following events during cell division and signaling within living cells. In FRAP
experiments, fluorescent molecules are photobleached in a small area of the cell irreversibly by a
high powered focused laser beam. Diffusion of surrounding molecules that were not bleached

71
into the bleached area leads to a recovery of fluorescence and this is recorded at a lower laser
power. FRAP can be used to measure the continuity of membrane compartments and the
behavior of proteins during mitosis.
FRAP spectroscopy can also be applied to measurements of membrane protein laterally
diffused in single cells. Measurements of the lateral diffusion of integral membrane proteins
labeled with fluorescein can show the rate of recovery of fluorescence after bleaching.
Fluorescence has shown to rapidly return to spots bleached by a laser beam in the continuous
fluorescence of cultured cells labeled on the surface.
FRAP spectroscopy has been incorporated in one experimental system by Rabut and
Ellenberg in 2005 for the characterization of structural and molecular mobility. In the
experimental system the authors proposed, transport dynamics are measured by monitoring the
transient behavior of an inhomogeneous distribution of concentration. A high laser power is
exposed to the sample, irreversibly bleaching the fluorophores, producing a spatial distribution of
fluorophores. The recovery of fluorescence is monitored with the same laser at a lower power as
to minimize further bleaching. This technique was applied most successfully to highly purified
solutions of biological macromolecules for measurement of molecular translational diffusion
coefficients.
2.2.3.3 Laser-induced fluorescence spectroscopy
Laser-induced fluorescence (LIF) spectroscopy can be used for the determination of
amino acids and amines in plasma, cells, urine, serum, cell extracts, and biological tissue. This
technique takes advantage of the sensitivity provided by laser excited fluorescence and high
atom density and is useful for detection of a number of elements. In general, LIF is differentiated
from fluorescence spectroscopy as discussed above, by the use of specific, targeted
excitation/emission pairs.

72
In 2008, Kaneta and coworkers used LIF spectroscopy coupled with cyclodextrin-
modified capillary electrophoresis to determine amino acids in urine. Three types of amino acids
were used in one study without the need of pretreatment and with the recovery range of 76-117
%. Conventional analysis was also performed in this study with the limit of quantitation to be
~10 µM for all of the amino acids measured. For analysis of amines and other amino acids not
presented, optimization of separation including buffer concentration, pH, and additives are
necessary.
A variation in fluorescence emission by distance dependent fluorescence quenching
between a fluorophore and a quenching functional group can be monitored by photo-induced
electron transfer spectroscopy. As mentioned above, PET requires van der Waals contact for
efficient quenching. PET quenching can occur though dynamic quenching, occurring transiently
through molecular collisions, or static quenching, occurring in molecular complexes that are
stable for multiple excitation emission cycles. The interaction between the fluorophore and
quencher interactions occur by reorientation through local diffusion inside the volume set by the
molecular linker and yield an upper limit to the observable rate constants for polymers end-to-
end contacts. The interactions can be used as evidence of conformational changes in
macromolecules or macromolecular complexes. In aqueous solutions typically many fluorophore
quencher pairs can induce formation of hydrophobic complexes.
2.2.3.4 Fluorescence spectroscopy using fluorophore manipulation
Some biologically important molecules do not exhibit, to any great extent, analytically
useful properties, such as a high molar absorptivity or electrochemical activity. For these
molecules, sensitive direct detection is difficult. When a sample does not exhibit a measurable
chemical characteristic, manipulation of the sample can be performed. For example, selective
detection of proline is very important and useful for the diagnosis of proline-related diseases.

73
High levels (10-15 times higher than normal) of proline in the blood can cause seizures or
intellectual disability and is known as hyperprolinemia.
A new fluorescence emitting compounds has been synthesized and characterized by
Lerouge and coworkers in 2011. Photo-luminescent neutral and anionic di-carboranyl and tetra-
carboranyl fragments were bonded through CH2 units on different organic functional groups and
their influence on the final molecular properties have been studied. A carborane is a cluster
composed of carbon and boron atoms. Two classifications of carborane are closo- which
represents a complete polyhedron and nido- which represents a polyhedron that is missing one
vertex. All the closo-carborane and nido-carborane derivatives exhibit a blue emission at room
temperature under ultraviolet excitation wavelengths in different solvents. Also, the common
fragment in all of these compounds is the CH2 bridge that occurs between the aromatic ring and
the carborane cage. This seems to prevent π-π stacking and in the opinion of the authors, this is
the key to photoluminescence properties, especially since compounds without this functional
group do not display this feature. The closo-carborane derivatives showed that the maximum
emission depends on several factors such as: the solvent polarity, the substituent (phenyl or
methyl) bonded to the C cluster, and the organic unit bearing the carborane clusters (benzene or
pyridine). Emission results at room temperature showed that the phenyl-closo-carboranyl exhibit
maximum emission intensities between 369 nm and 371 nm, independent of the solvent and the
methyl-closo-carboranyl exhibit maximum emission intensities between 333 nm and 363 nm,
dependent on the solvent.
2.2.3.5 Fluorescence spectroscopy of tissue
Fluorescence, Raman, IR, and reflection/absorption spectroscopy are all techniques for in
situ detection of organic and biological materials in real-time that are non-contact and
noninvasive. Native fluorescence has been shown to differentiate classes or groups of organic

74
molecules and biological materials when excitation occurs at specific wavelengths in the region
of deep UV. Excitation wavelengths between 200-400 nm with emission wavelengths between
270-500 nm can be used to compare fluorescence excitation-emission-matrix spectra of pure
organic materials, microbiological samples, and environmental background materials. Excitation
wavelength greater than 350 nm have shown to provide little spectral information about
biological samples. Optimal excitation wavelength(s) necessary for detection and
differentiability of many organic and biological materials in different environments can be
determined.
In fluorescence spectroscopy and spectral imaging of tissue, several fluorophores present
in tissue provide important biochemical bases for optical contrasts. The fluorescent properties of
most fluorophores present in tissue are correlated with certain pathological conditions and this
allows tissue diagnosis through fluorescence spectroscopy. Some fluorophores that are in tissue
include collagen, elastin, porphyrin, flavin adenine dinucleotide (FAD), and reduced
nicotinamide adenine dinucleotide (NADH). FAD and NADH are two fluorophores that are
electron carriers involved in the metabolic process of cells. Their fluorescence can be used to
determine the reduction-oxidation state of cells, as proven by Drezek and coworkers in 2005.
NADH and FAD also usually have relatively low fluorescence quantum yields and exhibit
relatively weak fluorescence at biological concentrations. Previous studies of cervical tissue
show an increase in NADH fluorescence within the epithelium with progression of abnormal
tissue. Tryptophan fluorescence was also reported to be useful in discriminating malignant
metastatic cancer cells from non-metastatic cells and inflammation from cancer.
A simple method to rapidly measure fluorescence signals and spectral fingerprints of
complex mixtures like tissue is known as synchronous fluorescence spectroscopy. Conventional

75
fluorescence spectroscopy uses either a fixed wavelength excitation to produce an emission
spectrum or a fixed wavelength emission to record an excitation spectrum, while in synchronous
fluorescence spectroscopy a fixed wavelength excitation emission spectrum and the fixed
wavelength emission excitation spectrum are recorded simultaneously. A constant wavelength
interval is maintained throughout the synchronous fluorescence spectrum. The synchronous
method can effectively examine the fluorescence peaks of multiple tissue fluorophores in one
scan, reduce the overlap between fluorescence peaks, and suppress/express the effect of specific
absorption peaks on the shapes of the fluorescence spectra due to hemoglobin by selecting an
appropriate wavelength interval in tissue-like phantoms and ex vivo rat brains. One limitation of
this technique is that the background fluorescence from fiber-optic probes from un-rejected
excitation light could exert a great impact on the spectral shape for small wavelength intervals (<
40 nm) when compared to conventional fluorescence spectroscopy. However, synchronous
fluorescence spectroscopy has shown that it can greatly simplify qualitative interpretations of
fluorescence spectra from tissue or tissue like samples.
Fluorescence imaging in vivo is similar to fluorescence microscopy. They both use
appropriate filters and low light camera to collect fluorescence emission light from samples.
However, in vivo fluorescence imaging works at a macroscopic level and whole-body small
animals instead of cells in culture dishes or slides are imaged. This allows the visualization of
fluorescent emission from fluorophores of biology in intact and native physiological states.
Fluorescent organic, biological and inorganic nanoparticles can be used for in vivo fluorescence
imaging. These nanoparticles serve as a platform to build multifunctional probes for multi-
modality imaging although traditional small-molecule NIR dyes are currently being used.
76
Increases in the availability of fluorescent probes and reports of this technique are showing to be
an important translational tool between basic research and clinical applications.
Reabsorption by the sample can also result in changes in the spectrum. If a part of the
sample absorbs at the wavelength that the fluorophores emits radiation, the sample may absorb
some or all of the photons emitted. Photodecomposition can also occur and will decrease the
intensity of the spectra. Scattered light (from Rayleigh or Raman scattering) effects must also be
considered when fluorescence spectroscopy is used.

77
CHAPTER 3
EXPERIMENTAL METHODS AND PRELIMINARY RESULTS
Using the understanding of light, light-matter interactions, and spectroscopic methods,
this dissertation work seeks to develop and apply new spectroscopic tools for analysis of
biological systems.
As discussed in Chapter 1, a targeted molecular sample may be altered by low intensity
(subablative) ultraviolet (UV) laser radiation such that the resulting optical response, as
measured here by fluorescence emission or Raman scattering, is perturbed. Probing the targeted
sample with conventional optical schemes before and after UV perturbation affords the
opportunity to look for a differential response in the optical signal. The key concept of this work
is the permanent molecular disruption (i.e., bond breakage) of the macro-molecular target and
how that alters the optical probe response, as observed with difference spectroscopy. The
differential laser-induced perturbation spectroscopy (DLIPS) scheme seeks to exploit the
ultraviolet (UV) laser-material interaction with difference spectroscopy to realize a new spectral
dimension that may be used for materials classification or identification of specific structures
(e.g. tissue pathologies).
In this dissertation, deep-UV-laser perturbation of a targeted molecular system in
combination with Raman and fluorescence spectroscopy techniques is explored in order to
extract additional information tied to the UV-laser-material coupling. Through deep-UV-laser
perturbation of a targeted molecular system in combination with traditional spectroscopic probes,
a difference spectrum is used to extract a novel spectral signature following laser perturbation.
The methodology using Raman and fluorescence spectroscopy has been described earlier in
Smith and coworkers in 2011.

78
The DLIPS technique incorporates three complementary techniques to improve upon
previous fluorescence-based biosensing strategies: laser-induced fluorescence emission,
ultraviolet (UV) laser perturbation of tissue, and difference spectroscopy. The perturbation
pulses from the deep-UV excimer laser (193 nm, hv= 6.4 eV) are strongly absorbed by biological
tissue and used to cleave molecular bonds within the extracellular matrix (ECM). Irradiation of
biological matrices at 193 nm can cause photoionization, including strand breakage, locally
denatured sites, interstrand cross-linking, reactions via photo-hydrates, π-dimers, and other
products. (Smith, 2010) In the current work, despite being well below the intensity threshold for
tissue ablation, permanent alteration of the underlying tissue structure is induced, with resulting
changes within the fluorescence spectrum, specifically with respect to photoreactive
biomolecules, as made apparent with the DLIPS scheme. Permanent photochemical changes are
induced despite being below the critical photon flux (~50 mJ/cm2 for ~10 ns pulse width) to
affect material removal. Additionally, because the pre- and post-perturbation spectra are
combined (see Equation 3.1) into a difference spectrum, the DLIPS technique removes unwanted
contributions from unperturbed tissue fluorophores, broadband fluorescence, and importantly,
variations in the emission bands which are unique to the sample, but not necessarily to the
targeted pathology. Equation 3.1 shows the DLIPS spectral response, namely
)(
)()()(
pre
prepost
Em
EmEmDLIPS
(3.1)
where Empre (λ) and Empost (λ) represent the fluorescence emission intensity recorded at each
wavelength before (pre) and following (post) perturbation by the UV excimer laser, respectively.
A negative DLIPS signal corresponds to a reduction in intensity following the photo-
perturbation step, which is generally attributed to the destruction of a corresponding fluorophore.
In contrast, a positive DLIPS signal corresponds to an increase in fluorescence intensity

79
following perturbation, which may indicate destruction of a fluorescence-quenching species
and/or the destruction of a concomitant absorbing compound, thereby allowing more light to
reach the actual fluorophore by removing competing species.
The DLIPS system is shown schematically in Figure 3-1. For all measurements in this
work, fluorescence excitation was accomplished using a Q-switched, frequency-tripled Nd:YAG
laser, while the UV perturbation was accomplished using a 193 nm ArF excimer laser. The 355
nm fluorescence excitation beam was aligned coaxially with the 193 nm perturbation laser using
a dichroic mirror (193 nm) as a beam combiner. Prior to the beam combiner, a variable
attenuator was used to reduce the excimer laser to the desired perturbation intensity. The 355 nm
beam diameter was about 30 % less in diameter than the 193 nm beam (top-hat beam profile) at
the target plane, to ensure complete perturbation of the entire fluorescence probe volume. The
co-linear laser beams were passed through a pierced mirror positioned at 45o to the target plane.
With the 355 nm beam incident on the target, fluorescence emission was redirected by the
pierced mirror and then focused onto a fiber optic bundle using a combination of two 50 mm
diameter UV-grade lenses, where it was passed to a 0.3 m Czerny-Turner spectrometer and
recorded with an intensified CCD (ICCD) array detector. Prior to entering the fiber optic, two
sharp-edge filters were used in series: a high-pass filter designed to block the residual 355 nm
light, and a low-pass filter designed to block any residual 532 nm light remaining from the
frequency-tripling process. With this system, fluorescence emission was successfully collected in
the spectral window between about 390-500 nm. A digital delay generator was also used to
synchronize and control both the ICCD and the 355 nm laser, with a 200 nm window used to
collect the emission.

80
For each target, the Nd:YAG laser (355 nm) was used to excite fluorescence from thin,
solid films. Typically 100 to 200 spectra were recorded and averaged for the sample. This
procedure was applied for analysis of multiple individual spots spread over multiple films. For
each spot, a fluorescence spectrum was recorded, referred to as the pre-perturbation spectrum.
Then an ArF excimer laser (193 nm) aligned coaxially to the 355-nm laser was used to deliver
laser pulses to the same spot. The 100 µJ/pulse excimer laser energy (3 mJ/cm2) was sufficiently
low such that no ablation of the film was realized, as verified by visible microscopy, but the
photon energy (hѵ = 6.4 eV) was sufficient to disrupt the molecular structure via direct bond
breakage. Such a high photon energy equals or exceeds most bond energies, including C-N (3.1
eV), C-O (3.6 eV), C-C (3.6 eV) and C=C (6.3 eV).
Following perturbation with the excimer laser, and a minimum time lag of 30 seconds, an
additional fluorescence spectrum was recorded, referred to as the post-perturbation spectrum.
These two spectra were then subtracted to generate the difference spectrum at each location. This
procedure, which permanently disrupts the molecular matrix of the targeted material, and thereby
alters the optical response, has been applied to selected amino acids, collagenous materials and
an animal model in the current work. These experiments are described in the sections that follow.
Thin films deposited on UV-grade quartz flats were also examined using a confocal
micro-Raman spectrometer (JY Horiba LabRam) with 632.8 nm excitation. A series of pre-
perturbation Raman spectra were recorded, baseline-subtracted, normalized to the strongest
Raman band, and then averaged to produce a single, pre-perturbation Raman spectrum. The same
spots were then each exposed to perturbation pulses from the ArF excimer laser (100 µJ/pulse, 3
mJ/cm2), after which the treated spots were again analyzed with micro-Raman, and the same
measurement procedure applied to produce a single, post-perturbation spectrum. The post-

81
perturbation spectrum was then subtracted from the pre-perturbation spectrum to yield the
DLIPS spectrum. This procedure has been applied to amino acids and collagenous materials and
are described in the sections that follow.
A chemometric software package produced by InfoMetrix called Pirouette 4.5 was used
in this dissertation for exploratory analysis and classification modeling of the amino acids and
collagenous materials studied. Chemometrics is a data collection task, typically involving many
measurements made on many samples, used to explore patterns of association in data, track
properties of materials on continuous basis, and prepare and use multivariate classification
models. Using the chemometric software, hidden patterns in complex data can be revealed by
reducing the information to a more comprehensible form. Possible outliers can also be exposed
and whether there are patterns or trends in the data can be indicated. Exploratory analysis of
multivariate data sets can reveal computationally and graphically, associated patterns within the
data. Reducing large and complex data sets to a suite of best views can also expose possible
outliers. In Pirouette, samples are stored as rows in a matrix and the number of columns is equal
to the number of variables. Transforms operate only on the independent variables while
preprocessing operates on the independent and dependent variables.
Before running a multivariate algorithm, it is often necessary to adjust a data set. Three
transforms were performed upon the amino acids and collagenous materials for both the absolute
Raman and DLIPS Raman data sets. The transforms are a baseline correction, smoothing
correction and division correction. The baseline correction transform corrects offset by
subtracting a profile from each spectrum, in all cases a unique derived curve fit profile was used.
The smoothing transform in Pirouette is based on a Savitzky-Golay polynomial filter. A
convolution is applied to the independent variables in a window containing a center data point

82
and n points on either side. A weighted second-order polynomial is then fit to the 2n+1 points.
The center point is then replaced by the fitted value. In all cases a 13 point smoothing transform
was applied. The division (i.e., divide by) transform used on all data sets is the divide by Sample
1-Norm transform which is also known as area normalization. The normalization factor in this
transform is the area under the sample profile which is calculated by summing the absolute
values of all included variables for each sample.
Since several multivariate algorithms compute results that are driven by variance patterns
in the independent variables, preprocessing is also necessary. Preprocessing was also performed
upon the data sets to mitigate the influence of variable ranges and magnitudes. To all data sets,
mean-centering is the preprocessing technique applied. In mean-centering, the origin of the data
is shifted without the relative relationships between samples being altered. In Pirouette, a mean is
computed for each variable and then subtracted from each data value to produce a mean-centered
matrix.
Principal Component Analysis (PCA) was used as an exploratory technique implemented
by Pirouette. PCA finds linear combinations of the original independent variables that account
for the maximum amount of variation. PCA reduces the dimensionality of the data sets by
retaining only the principal components. Thus, capturing relevant variations and disregarding
certain combinations of irrelevant variations. PCA provides a view of variability which reveals if
there is natural clustering in the data and if there are outlier samples.
Before successful PCA models can be built, outliers must be excluded. The detection of
outliers helps to optimize the number of factors since the original variables with the most loading
has the largest impact upon the factor. Samples falling outside the critical Mahalanobis distance
and critical Sample Residual thresholds are considered potential outliers. Samples exceeding

83
only one threshold slightly are considered normal but samples lying either significantly beyond
one threshold or beyond both are considered outliers. All samples that did not meet the critical
Mahalanobis distance and/or critical Sample Residual thresholds were examined closely before
discarding and rerunning PCA excluding those samples. The sample residual threshold is based
on a 95 % probability limit.. The critical sample residual is defined as:
(3.2)
where the model residual variance and the sample’s residual variance are shown in
equation 3.3 and equation 3.4, respectively.
(3.3)
(3.4)
where is a vector, the ith row of the residual matrix E, defined as the difference between the
sample’s original data and its k factor estimate, :
(3.5)
The Mahalanobis distance is the distance from the multivariate mean computed from the k factor
score vector:
(3.6)

84
where, S is the scores covariance matrix and is the mean score vector. Assuming that the
Mahalanobis distance is normally distributed, using an F distribution, a critical Mahalanobis
distance is defined as:
(3.7)
The classification model used here is based on similarity. Similarity techniques in
classification modeling assume that the closer samples lie in space, the more likely they belong
to the same category. The classification algorithm used here is called K-nearest neighbor (KNN).
The multivariate distance used in KNN is known as the Euclidean distance . The general
expression for this Euclidean distance is:
(3.8)
where a and b are the data vectors of two samples. The KNN algorithm also requires that a class
variable be activated and a maximum k value selected. KNN constructs a model using samples
pre-assigned to a category which is derived from preexisting knowledge of the data. Using the
classification model in which categories are defined by the training set, predictions of the
unknown data set are performed and each unknown is assigned to one and only one category.
For each data set, half of the samples were randomly placed in a training set and half
were designated as the validation set. The categories assigned to the training set were defined
based on clusters found during the exploratory analysis. During model building, the training set
is validated by the agreement between the measured class (m-class) and the predicted class (p-
class) produced from the KNN algorithm. Agreement between the two suggests that the m-class

85
are reasonable. When the two disagree, the cause may be an outlier or an inappropriate k value.
The value of k is the largest number of neighbors to be polled during classification and was set as
less than twice the size of the smallest category.
Using this model to predict classes in the validation set and validate the pre-assigned
classes of the training set were performed. By calculating the Euclidean distance (Equation 3.8)
separating each pair of samples, an individual sample can be assigned to a class which is the
class to which most of the nearest neighbors belong. The number of neighbors polled is defined
by the k value. When the training and validation subsets are both representative of the
investigated population, a quality and reliable model can be built.
3.1 Amino Acids Study
3.1.1 Introduction to Amino Acids
Using Raman and fluorescence spectroscopies, DLIPS was used here to evaluate glycine
(C2H5NO2), L-proline (C5H9NO2), L-alanine (C3H7NO2), glycine-glycine (C4H8N2O3), glycine-
L-proline (C7H12N2O3), and L-alanine-glycine (C5H10 N2 O3). Since amino acids are the building
blocks of all species, their specific spectral signatures can be used to analyze other complex
biological assemblies.
Proteins play a key role in nearly all biological processes by facilitating a wide range of
functions, such as transport and storage of vital substances, coordinated motion, mechanical
support and protection against diseases. In the human body, it is estimated that 100,000 different
kinds of proteins exist. Each protein has a specific physiological function that is specified by the
proteins chemical composition and structure. Proteins in every species are assembled from the
same twenty amino acids. The type, number, and sequence of amino acids in a given protein will
determine the proteins structure. An amino acid is a compound that contains at least one carboxyl
group (-COOH) and one amino group (-NH2). Proteins are formed during a polymerization
86
process that links amino acids. The amino acids link together by a peptide bond formed by
condensation of the amino group of one amino acid with the carboxylic group of another. This
process continues on both ends (involving the NH2 and COOH groups) to produce the polymeric
chemical structures of a protein. Proteins are ubiquitous throughout the cell.
For protein molecules, two common structures, called α-helix and β-pleated can be
distinguished. In the α-helix structure an overall rod-like shape is observed through the
stabilization by intramolecular hydrogen bonds between the NH and CO groups if the proteins
main chain. All CO groups in the main chain of amino acids are hydrogen-bonded to NH groups.
In the β-pleated structure an over sheet shape is observed since almost all of the chain is fully
extended while each chain forms many intermolecular hydrogen bonds with adjacent chains.
Two different types of β-pleated structures are known and are called parallel and antiparallel.
There are however, many proteins whose structures do not correspond to the α-helix or β-pleated
structures. Most proteins have a certain amount of flexibility even though their forces create a
stable structure.
Amino acids in humans are classified as essential or nonessential. Essential amino acids
must be consumed in our diet, while nonessential amino acids are made by the body. Collagen is
the most abundant protein in humans, consisting of mainly aliphatic amino acids; where roughly
every third amino acid in its polypeptide chain is glycine. Alanine and proline are also
nonessential amino acids that are found in abundance in the body, more so than other amino
acids. The structures of glycine, alanine and proline can be seen in Figure 3-2. Also, the
structures of the dipeptides glycine-glycine, glycine-L-proline, and L-alanine-glycine can be seen
in Figure 3-3.

87
Alpha-amino acids are the important amino acids found in living organisms. Peptides and
polypeptides are biopolymers of α-amino acids. In α-amino acids, the –COOH and –NH2 groups
are attached to the same carbon atom which is called an alpha carbon atom. The general structure
of the α-amino acids can be seen in Figure 3-4. The –R groups in amino acids will determine the
structure/function relationship of peptides and proteins as well as allowing enzyme reactions to
occur. Optically active amino acids that are found in living organisms are the L-isomeric forms
(with the exception of phenylalanine that appears in both L- and DL-isomeric forms). Amino
acids found in proteins can also perform additional functions. For example, glycine helps to
trigger the release of oxygen during cell-making processes as well as being important in the
manufacturing of hormones that are responsible for a strong immune system.
Protein structure can be divided into four levels: primary, secondary, tertiary, and
quaternary structure. The primary structure refers to the unique amino acid sequence of the
polypeptide chain. The secondary structure refers to the parts of the polypeptide chain that are
stabilized by intramolecular forces. The tertiary structure involves the three-dimensional
structure stabilized by intermolecular forces that may occur through interactions between amino
acids that a far apart in the polypeptide chain. For protein molecules that contain more than one
polypeptide chain, the quaternary structure must be taken into account to describe the overall
arrangement of the polypeptide chains.
Amino acids that are not associated with proteins or peptides are found free in the body
or in combined states preform specialized functions. In addition to forming proteins, enzymes
and other body tissue, amino acids are also involved and play a crucial role in a variety of
chemical reactions, energy transfer, muscle activity, and energy production cycles.

88
3.1.2 Methods
In this study, each amino acid (see Appendix) was mixed with deionized water at a 1:1
ratio, stirred for 24 hours, and then deposited onto UV-grade quartz flats. The films dried for 24
hours (mg amino acid: ml DI H2O). The DLIPS analysis of 10 individual spots, spread over
multiple films of each amino acid was conducted as described above. An Nd:YAG laser (355
nm) with energy set at 10 μJ was used to excited fluorescence. The excimer laser (193 nm) was
used to deliver a total of 500 laser pulses for amino acids glycine and glycine-glycine, 700 laser
pulses for amino acids L-alanine and L-alanine-glycine, and 600 laser pulses for amino acids L-
proline and glycine-L-proline. Analysis of 4 individual spots for glycine and glycine-glycine
using only the 355 nm laser at 10 μJ was also conducted to determine if any effect was induced
at this wavelength alone in the absence of any 193 nm perturbation.
Analysis of 20 individual spots spread over multiple films of each amino acid was
conducted as described above. The excimer laser (100 µJ/pulse, 3mJ/cm2) was used to deliver a
total of 800 laser pulses for L-alanine, L-alanine-glycine, L-proline, and glycine-L-proline, 500
laser pulses for glycine, and 700 laser pulses for glycine-glycine. Analysis of 4 individual spots
for glycine and glycine-glycine using only the micro-Raman spectrometer with an excitation
wavelength of 632.8 nm was also conducted to determine if any effect was induced at this
wavelength alone.
3.1.3 Results
The traditional preperturbation fluorescence spectrum of each specimen is located in
Figure 3-5. Throughout section 3.1, all amino acids are color-coded and there correspondents can
be seen in Figure 3-6. To show a better comparison between alanine, proline, and glycine and
these amino acids when they are attached to glycine (i.e., L-alanine-glycine, glycine-glycine, and
glycine-L-proline), Figure 3-7, Figure 3-8, and Figure 3-9 were plotted. Figure 3-7 shows the

89
traditional fluorescent preperturbation spectra of L-alanine and L-alanine-glycine. Figure 3-8
shows the traditional fluorescent preperturbation spectra of glycine and glycine-glycine. Figure
3-9 shows the traditional fluorescence preperturbation spectra of L-proline and glycine-L-
proline. The spectra are not corrected for neutral spectral response.
In the traditional fluorescence spectra of the studied amino acids, as graphed above, it can
be seen that no significant difference was present. The DLIPS fluorescence spectrum of each
specimen is located in Figure 3-10. To show a better comparison between alanine, proline, and
glycine and these amino acids when they are attached to glycine, Figure 3-11, Figure 3-12 and
Figure 3-13 were plotted. Figure 3-11 shows the DLIPS spectra of L-alanine (blue) and L-
alanine-glycine (red) after 700 laser pulses. Figure 3-12 shows the DLIPS spectra of glycine
(light blue) and glycine-glycine (orange) after 500 laser pulses. Figure 3-13 shows the DLIPS
spectra of L-proline (green) and glycine-L-proline (violet) after 600 laser pulses. Also, to better
compare alanine, proline and glycine, their DLIPS spectra are plotted in Figure 3-14. Figure 3-15
shows the DLIPS spectra of glycine-glycine, L-alanine-glycine and glycine-L-proline.
Interesting results for the studied amino acids occurs before and after 430 nm. For each
amino acid as a distinctive spectral shape has emerged, and this can be seen in Figure 3-10.
When comparing the DLIPS spectra of the dipeptides with their peptide counterparts, it can be
seen that the slopes after 430 nm, of L-alanine-glycine, glycine-glycine, and glycine-L-proline
are less than L-alanine, glycine, and proline. Before 430 nm, another effect is seen in Figure 3-14
This graph shows the DLIPS spectra of glycine-glycine, L-alanine-glycine and glycine-L-
proline. The slope of glycine-L-proline decreases from 380 nm- 420 nm, while the slopes of
glycine-glycine and L-alanine-glycine increases. With regard to the or zero-crossing point, an
important point needs to be noted. In the perturbation spectra, a negative value is considered a

90
loss in fluorescence, while a positive value represents an increase in fluorescence at that
particular wavelength, as discussed above in the context of chromophores, quenchers and
absorbers.
The traditional preperturbation Raman spectrum of each specimen is located in Figure 3-
16. Also, each spectrum other than proline has been shifted vertically. To show a better
comparison between alanine, proline, and glycine and these amino acids when they are attached
to glycine, Figure 3-17, Figure 3-18, and Figure 3-19 were plotted. Figure 3-17 shows the Raman
preperturbation spectra of L-alanine and L-alanine-glycine. Figure 3-18 shows the Raman
preperturbation spectra of glycine and glycine-glycine. Figure 3-19 shows the Raman
preperturbation spectra of L-proline and glycine-L-proline. The traditional preperturbation,
Raman spectra of each specimen are located in Figures 3-21 thru Figure 3-26. For each
specimen, located on its graph, are labeled DLIPS peaks and their associated wave number, and
band assignment can be found in Tables 3-1 thru Table 3-6. Also, shown in Figure 3-26 are the
DLIPS of all materials studied.
In the absolute Raman preperturbation spectra of L-alanine and L-alanine-glycine, two
common bands were found in both. Those bands are a CC stretch and a CN bend that occurs at
870 cm-1
, and a CN stretch and CH3 perpendicular rock that occurs at 1024 cm-1
. In the absolute
Raman preperturbation spectra of glycine and glycine-glycine only one band was common in
both. That band is a CH bend that occurs at 1453 cm-1
.
In the absolute Raman preperturbation spectra of L-proline and glycine-L-proline, a few
bands were found to represent these two amino acids. Those are: an NH3 rock and a CH bend
that occurs at 1185 cm-1
, a CC stretch and a CH2 rock that occurs at 989 cm-1
, and a CH bend and
a NH rock that occurs at 1270 cm-1
.
91
In the absolute Raman preperturbation spectra of glycine and L-proline, a common band
at 930 cm-1
occurs and is assigned a CC stretch and a CO bend. Also, in comparing the absolute
Raman preperturbation spectra of glycine and glycine-L-proline, two bands are were found to be
present in both. One band occurs at 1054 cm-1
and is assigned to a CN stretch. The second band
occurs at 1413 cm-1
and is assigned to a CO stretch. In comparing the absolute Raman
preperturbation spectra of glycine, alanine, and glycine-glycine, a CH bend occurred in all three
at 1159 cm-1
.
A CC stretch that occurred at 912 cm-1
was apparent in the absolute Raman
preperturbation spectra of glycine-glycine and L-proline. In the absolute Raman preperturbation
spectra of glycine-glycine and L-alanine-glycine, a common band occurred in both at 1260 cm-1
with the band assigned to a CC stretch and a CO bend. The absolute Raman preperturbation
spectra of glycine-glycine, L-alanine-glycine, and glycine-L-proline showed to all shared a
common bond that occurs at 1665 cm-1
and is assigned to a C=O stretch and a NH2 bend. In
addition, the glycine-L-proline and L-alanine-glycine absolute Raman preperturbation spectra
also shared a common band that occurred at 924 cm-1
, which is assigned to a CC stretch and a
CN bend.
Partial component analysis (PCA) was performed for all the traditional Raman and DLIPs
spectra of the amino acids (peptides and dipeptides),as well as for only the peptides and only the
dipeptides. The wavenumber, factors, and band assignment for all the materials studied, only the
peptides, only the dipeptides using traditional Raman spectroscopy, are located in Table 3-7,
Table 3-8, and Table 3-9 respectively. The wavenumber, factors, and band assignment for all the
materials studied, only the peptides, only the dipeptides using the DLIPS method are located in
Table 3-10, Table 3-11, and Table 3-12 respectively.

92
When comparing the traditional Raman technique PCA between the dipeptides and
peptides greatest factors, the only wavenumber in common is at 867 cm-1
(which also appears in
the PCA of all the materials). In comparing the traditional Raman technique PCA between all the
materials studied and only the peptides, the common bands include the following: 855 cm-1
, 867
cm-1
, 897 cm-1
, and 1328 cm-1
. In comparing the traditional Raman technique PCA between all
the materials studied and only the dipeptides, the common bands include the following: 867 cm-1
,
937 cm-1
, 971 cm-1
, 1485 cm-1
, and 1666 cm-1
. Also, 1655 cm-1
was only found in the traditional
Raman technique PCA of all studied materials. In the traditional Raman technique PCA of only
peptides, the unique wavenumbers are 548 cm-1
, 912 cm-1
, 1323 cm-1
, and 1455 cm-1
. In the
traditional Raman technique PCA of only dipeptides, the unique wavenumbers are 1278 cm-1
and
1447 cm-1
.
When comparing the DLIPS method PCA between the dipeptides and peptides greatest
factors, they have no wavenumber in common. In comparing the DLIPS method PCA between
all the materials studied and only the peptides, the common bands include the following: 538 cm-
1, 836 cm
-1, 1323 cm
-1, 1340 cm
-1, 1422 cm
-1. In comparing the DLIPS method PCA between all
the materials studied and only the dipeptides, the common bands include only 963 cm-1
. Also, no
unique wavenumbers were found in the DLIPS method PCA of all studied materials. In the
DLIPS method PCA of only peptides, the unique wavenumbers are 1001 cm-1
and 1367 cm-1
. In
the DLIPS PCA of only dipeptides, the unique wavenumbers are 554 cm-1
, 662 cm-1
, 867 cm-1
,
893 cm-1
, 926 cm-1
, 975 cm-1
, 1070 cm-1
, 1246 cm-1
, and 1666 cm-1
.
Comparison between the DLIPS method and the traditional Raman technique PCA of all
materials studied shows no common factors. For the only peptide cases, similar factors are

93
located at 538 cm-1
and 1323 cm-1
. For the only dipeptide cases, similar factors are located at 867
cm-1
and 1666 cm-1
.
Using the information gathered from the PCA, the K-nearest neighbor (KNN) was
performed for a training set and validation set for (i)all the materials studied (N=6), (ii)only the
peptides (N=3), and (iii)only the dipeptides (N=3) using a traditional Raman technique and the
DLIPS method presented within this dissertation. In Table 3-13 thru Table 3-18 the training sets
and validation sets for the three cases mentioned above using a traditional Raman technique can
be found. In Table 3-19 thru Table 3-24 the training sets and validation sets for the three cases
mentioned above using the DLIPS technique can be found.
The training set of all the materials studied using the traditional Raman technique, shown
in Table 3-13 has no misclassifications. The validation set in Table 3-14 of all the materials
studied shows a misclassification of 5 % of the Proline samples, 100 % of the Ala-Gly samples,
15 % of the Gly-Gly samples, and 45 % of the Gly-Pro samples. The training set of only the
peptides studied and only the dipeptides studied using the traditional Raman technique, revealed
no misclassifications. The validation set of the peptides studied using the traditional Raman
technique shows a misclassification of 5 % of the Proline samples. In the validation set of the
dipeptides using the traditional Raman technique shows a misclassification of 5 % for Gly-Pro.
In the training sets and validation sets of all materials studied, only the peptides studied, and only
the dipeptides studied using the DLIPS method has no misclassifications.
3.1.4 Conclusions
Interesting results occur before and after 430 nm for the studied amino acids in
comparing their DLIPS spectra. For each amino acid as a distinctive spectral shape has emerged.
Before 430 nm, another effect occurs in the DLIPS spectra of glycine-glycine, L-alanine-glycine
and glycine-L-proline. The slope of glycine-L-proline decreases from 380 nm- 420 nm, while the

94
slopes of glycine-glycine and L-alanine-glycine increases. Also, in comparing all absolute
Raman preperturbation spectra, glycine-glycine and L-alanine-glycine had a common band that
occurred at 1260 cm-1
with the band assigned to a CC stretch and a CO bend. Glycine-glycine
and L-alanine-glycine, also showed to have a significant DLIPS value associated with an Amide
III. Therefore, the increasing slope of glycine-glycine and L-alanine-glycine DLIPS spectra from
380 nm thru 420 nm may be attributed to the CC stretch and CO bend that occurs at 1260 cm-1
or
the Amide III which had a significant DLIPS value associated with it, both of which did not
occur in glycine-L-proline. The decreasing slope of glycine-L-proline from 380 nm thru 420 nm
could also be attributed to a CH2 bend, a CH2 wag and/or a NH3 symmetric bend, all of which
were present in the absolute Raman preperturbation spectrum and have a significant DLIPS
value in glycine-L-proline alone.
When comparing the DLIPS spectra of the dipeptides with their peptide counterparts, it
can be seen that the slopes after 430 nm, of L-alanine-glycine, glycine-glycine, and glycine-L-
proline are less than L-alanine, glycine, and L-proline. Again, in comparing these two groups,
the absolute Raman preperturbation spectra of glycine-glycine, L-alanine-glycine, and glycine-L-
proline showed a common bond that occurs at 1665 cm-1
and is assigned to a C=O stretch and a
NH2 bend that was not present in L-alanine, L-proline, or glycine. In addition, the glycine-L-
proline and L-alanine-glycine absolute Raman preperturbation spectra shared a common band at
924 cm-1
, which is assigned to a CC stretch and a CN bend. Therefore, the reason for the
dipeptides having smaller positive slopes after 430 nm than the peptides may be because of the
common bond that occurs at 1665 cm-1
and is assigned to a C=O stretch and a NH2 in the
dipeptides. A key finding is the discrimation power of DLIPS as compared to traditional Raman
alone. Table 3-14 shows significant misclassification of the dipeptides with traditional Raman,

95
while Table 3-20 shows perfect classification of the dipeptides. In Table 3-7 the predominant
factors involve hydrocarbons while Table 3-10 shows the largest factor at 538 cm-1
and is
assigned to an Amide IV. This suggests that the peptide bond was perturbed.
It should be noted, however, that a more complete spectral analysis needs to be obtained
before the slopes of the DLIPS spectra can be directly associated with a photochemical response
that are occurring in the studied amino acids when perturbed by a 193 nm laser. Nevertheless, it
is clear that the DLIPS technique has been successive in differentiating between L-alanine, L-
alanine-glycine, glycine, glycine-glycine, L-proline, and glycine-L-proline. Overall, it is
concluded that the DLIPS does provide a new spectral dimension when examining the
fundamental building blocks of biological tissue, showing promise of the DLIPS scheme for
analysis of more complex specimens.
3.2 Collagenous and Related Biological Materials
3.2.1 Introduction to Collagenous materials
Collagen and elastin are the two major structural protein molecules that form connective
tissues used to protect and support organs. Collagen type IV is found primarily in the deepest
layer of tissue, the basement membrane, which secures the overlying layers of stratified
epithelium. This type of collagen contains about 1400 amino acids and is longer than the fibril
forming collagens (type I, II, II, V, VI). Collagen type IV has an α-helical structure. Collagen
type IV antibodies can be used in the detection of basement membrane loss in carcinomas and
the vascular nature of neoplasms as well as in the classification of soft tissue tumors. One of
collagen type IV antigens is thought to be associated with Goodpasture’s syndrome and collagen
type IV gene coding mutations lead to Alport syndrome. Fibrinogen is one of the three main
components of plasma (globulins and albumin are the other two) however, only 3 % of plasma is

96
made up of fibrinogen. During blood coagulation, fibrinogen is synthesized by the liver and
converted by thrombin into a protein called fibrin. Through processes in the coagulation cascade
that activate zymogen-pro-thrombin to the serine protease thrombin, which converts fibrinogen
into fibrin, fibrin is cross linked by factor XII and a clot is formed. The fibrin is stabilized further
by fibrinolysis inhibitors and binding to several adhesive proteins of various cells. Fibrin can
function as temporary inhibitor of these enzymes by binding specifically to activate coagulation
factors and entrapping them. Injury to collagen and elastin by inflammation is common in
patients with connective tissue diseases.
Inflammation in tissue is a result of an immune system that is directed against one’s own
body tissue (autoimmunity). In autoimmunity, the patient’s immune system is activated against
the body’s own proteins. Therefore, many connective tissue diseases are inflammatory diseases.
Abnormal reactions of the immune system can result in inflammatory and autoimmune diseases.
Abnormal immune system activity arises in autoimmune diseases through the immune systems
inappropriate immune response of the body against species normally present in the body. For a
disease to be regarded as an autoimmune disease direct evidence from transfer of pathogenic
antibody or pathogenic T cells, indirect evidence based on reproduction of the autoimmune
disease in experimental animals and circumstantial evidence from clinical clues must be
presented. Autoimmune diseases can be classified based upon the type of reaction produced by
the normal immune system.
Another prominent feature of many connective tissue diseases is vascular damage and the
circulation autoantibodies. Circulating autoantibodies have been detected in the serum of patients
suffering from systemic lupus erythematosus, (SLE), rheumatoid arthritis (RA), systemic
vasculitis (SV), Kawaskai syndrome (KS), and many other connective tissue diseases. One

97
widely studied autoimmune disease is SLE. SLE is a chronic autoimmune disorder that can
affect every organ system. A lupus band test one of the tests performed to determines if a
patients has SLE. A lupus band test detects Immunoglobulin G (IgG) antibodies located just
below the outer layer of the tissue sample, the dermoepidermal junction. A positive result would
indicate that IgG was present.
An antigen is a substance that is recognized as foreign and provokes an immune
response. The greater the difference between the antigens structure and that of the ‘normal’
tissue structure the greater the immune response against those antigens. The most commonly
encountered antigen-presenting cells are macrophages and dendritic cells. These cells engulf
antigens and degrade them into small fragments that eventually, bind to major histocompatibility
complex (MHC) molecules (cell surface proteins). The antigen-MHC complex will stimulate
lymphocytes to attack that particular antigen. Lymphocytes attack specific antigens through two
different mechanisms. One group called B lymphocytes produce proteins called antibodies.
Antibodies circulate in the bloodstream and penetrate into extracellular fluids, binding to the
antigen that induced the immune response. A second group is called cytotoxic T lymphocytes
(CTLs) bind directly to the cells that are exhibiting antigens on their surface. The targeted
antigens are killed by the CTLs causing them to burst. Natural killer (NK) cells are also a type of
lymphocytes. This type attacks a broad spectrum of abnormal cells but only makes up a small
amount of the total lymphocyte population.
In many types of connective tissue diseases, patients will have unexplained
immunoglobulin abnormalities. For example, high levels of IgA can occur in patients with
rheumatoid arthritis, SLE, and some liver diseases, high levels of IgG can mean a chronic
infection is present, such as AIDS, high levels of Immunoglobulin M (IgM) can mean

98
mononucleosis, rheumatoid arthritis, or kidney damage and high levels of fibrinogen are
associated with cardiovascular disease, but can also occur in the presence of inflammation.
Immunoglobulins are globular proteins, one of the two main protein classes, are mostly soluble
in aqueous solutions and are globe-like in shape. Immunoglobulins (Igs) are secreted and
expressed by activated B lymphocytes. The different classes of Igs in humans are IgA, IgD, IgE,
IgG, and IgM. Igs can be found in the serum, other body fluids, and tissue fluids. All of these
immunoglobulins share a similar structure, but differ in size, charge, amino acid sequence and
glycan content.
Igs also contain a Fab region and a Fc region. The Fab region is concerned with antigen
binding and the Fc region is concerned with the effector functions. Igs are products of the
immune system and bind to antigens through specific sequences on their Fab regions. Once an Ig
is bound to an antigen, a direct effect can occur in which the antibody and antigen are clumped
and the antigen is neutralized or prevented from invading cells or an indirect effect can occur in
which effector functions are released via the Fc regions. Fc effector functions are exclusive to
each heavy chain class present in the Ig. Effector functions include activation of complement and
cell binding of various types. In IgA, IgD, and IgG the Fab and Fc region are separated by a
flexible joint region. In IgE and IgM, instead of a flexible joint, the Fab and Fc region are
separated by an additional CH domain. This results in a restriction of the overall motion of IgE
and IgM.
All Ig molecules consists of two polypeptide chains, heavy chains (H-chain) and light
chains (L-chain), that are linked together by disulphide (S-S) bonds and non-covalent forces. The
chains are composed of Ig domain regions which consist of ~105-130 amino acids arranged in a
β-sheet structure. A variety of amino acid sequences, glycan content, and location and number of

99
glycosylation sites occur in immunoglobulins. Each H-chain is class specific (γ, µ, δ, α, and ε).
Immunoglobulin classes are distinguished by these heavy chain differences. L-chains exist in
two forms: κ-chain and λ-chain. Each immunoglobulin molecule is comprised of κ-chains which
are called Type K, or λ-chains which are called Type L but not both. The L-chains are regulated
differently dependent upon the antigen stimulus. Thus, immunological disturbances that result in
altered immunoglobulin concentrations and light chain ratios (κ/λ), would give abundant insight
and correlation with diseases and disease progression. The three most common immunoglobulins
found in serum are IgA, IgG, and IgM.
Immunoglobulin A (IgA) is an antibody that plays a critical role in mucosal immunity in
its secretory form. IgA antibodies protect the body surfaces that are exposed to outside
substances. IgA is also the most abundant immunoglobulin in the body overall. Therefore, IgA is
found in saliva, tears, synovial fluid, intestinal fluid, and respiratory tract secretions and uses the
mucosal surfaces as a first line of defense in infections that enter through mucosal surfaces. IgA
can also be found in blood, as made by plasma cells, but only in small amounts. Serum IgA is a
monomer but IgA found in secretions is a dimer. When IgA is found in secretions, a single α-
chain of each IgA is disulfide bridged on the hinge region. Non-covalently bonded to the Fc
region is a glycosylated polypeptide chain called a secretory component (SC). Secreted and
circulating IgA antibodies are known to have antiviral properties and can bind to some cells.
Immunoglobulin G (IgG) is an antibody found in all body fluids. They are the smallest
antibody but occur in the largest abundance than any other antibody (75 %-80 %) in serum. IgG
is the major antibody involved in the secondary immune response and serves to activate the
complement system. IgG antibodies are very important in fighting bacterial and viral infections.
IgG is also the only immunoglobulin that can cross the placenta in a pregnant women and is the

100
major component of passive maternal antibody transfer via colostrum and yolk. Interestingly,
patients diagnosed with rheumatoid arthritis (RA) have an increased level of IgG (approximately
3 times normal IgG serum levels) except during pregnancy when the disease goes into remission
and IgG serum levels return to normal. IgG molecules are monomers, categorized into subclasses
whose structures differ in the number of disulfide bonds and length of the hinge region. Binding
of IgG can enhance phagocytosis and bind specifically to Fc receptors on cells can result in an
increased activation of antibodies released.
Immunoglobulin M (IgM) is an antibody found in blood and lymph fluids. IgM is the first
immunoglobulin made by the fetus and is the third most common immunoglobulin in serum.
IgM is also the first immunoglobulin made by virgin B cells, once stimulated by antigens. IgM
appears early in the course of an infection and usually reappears in a lesser quantity if exposure
continues. IgM is produced by B cells and is the primary antibody against A and B antigens on
red blood cells. As with IgG, once IgM is bound to an antigen, the complement system is
activated. IgM antibodies are the largest found in the circulatory system and are mainly
responsible for clumping together microorganisms for eventual eliminating from the body. IgM
antibodies are mainly responsible for red blood cells clumping in blood transfusion of
incompatible blood types. The appearance of IgM antibodies in a patient’s serum indicates a
recent infection and the clarification of the specific IgM antibodies can be used to diagnosis
infectious diseases. IgM antibodies in a neonate’s serum indicated intra-uterine infection.
IgM exists as a pentamer in serum normally, but can also exist as a monomer. IgM as a
pentamer has all identical heavy chains and all identical light chains. In a pentameric form, IgM
has a hinge region that is formed from a protein covalently bound via an S-S bond. IgM in a
monomer form functions as a receptor for antigen on B cells and lacks the hinge region and but

101
has an additional linkage of 20 amino acids. Monomeric IgM is non-covalently bonded to two
additional proteins in the membrane of the B cell and are called α-Ig and β-Ig. These additional
proteins allow contact to occur between surface immunoglobulin and an antigen, which is
required to start antibody secretion.
3.2.2 Methods
Abnormalities in immunoglobulins, collagen and fibrinogen content are strong indicators
of autoimmune diseases. Autoimmune diseases involve a large category of diseases in which
may of the symptoms overlap. Associating these abnormalities with a specific disease or the
progression of a specific disease is of great clinical value. A correlation could result in earlier
prognoses and earlier treatment (if applicable), therefore, decreased morbidity rates and
increased quality of life. In collagen diseases that take a chronic course, increased IgA and IgG
and a normal or diminished IgM concentration occur frequently. However, no distinct
association has been found between immunoglobulin disbalance and a specific disease.
Collagenous material concentrations are not only affected by specific pathological processes,
they can also differ widely between patients with the same disease.
The main goal of this study was to differentiate between the three most common
immunoglobulins (IgA, IgG, and IgM), collagen and fibrinogen through differential laser-
induced perturbation spectroscopy (DLIPS), as described above, with the ultimate goal of
producing an optical tool that will provide clinicians additional insight into autoimmune
diseases. Each collagenous material was examined using fluorescence and Raman spectroscopy.
By comparing the fluorescence intensity before and after perturbation, a difference spectroscopy
was found for each material.
In this study, each collagenous material (See Apandix 1) were mixed with deionized
water, stirred for 24 hours, and then deposited in thin films onto quartz flats. The films dried for

102
24 hours. For each film, 20 individual spots were examined by the DLIPS technique described
above for a fluorescence probe. The excimer delivered 2000 laser pulses to the each of the spots
on the film. The difference between the two spectra was computed for each spot and then
averaged among the ten spots to obtain a spectral signature for each collagenous material. To
determine if the 355 nm laser was altering the samples, measurements were taken without the
excimer laser perturbation.
Raman spectra were also obtained for each film, yielding a unique spectral signature for
each material. A confocal micro-Raman spectrometer, as described above, was used. In this
study, no filter was used, the aperture diameter was set to 250 μm, and the spectral window was
constrained from 300 to 2000 cm-1
. The excimer delivered 1500 laser perturbation pulses to each
of the spots on the film. The data manipulation for the ten spots incorporated pixel correction,
baseline subtraction, and normalization to the strongest Raman band; the spots were then
averaged to obtain a spectral signature for each antibody.
3.2.3 Results
The absolute preperturbation fluorescence spectrum of each specimen is presented in
Figure 3-27. Figure 3.29 shows a closer view of the collagenous materials that are difficult to see
in Figure 3-27 because of the difference in intensities of the each absolute preperturbation
spectrum. Throughout section 3.2, all collagenous materials are color-coded and there
correspondents can be seen in Figure 3-28.
No general distinguishable feature was observed in the absolute fluorescence (this
denotes simply the pre-perturbation fluorescence (i.e., unperturbed) and not the fluorescence
spectrum corrected for instrument response) spectra from the collagenous material study. In
Figure 3-27, interestingly, the absolute preperturbation fluorescence spectra of fibrinogen and
IgG have high intensities in comparison to collagen, IgA, and IgM. The DLIPS fluorescence

103
spectrum of each specimen is located in Figure 3-30. Figure 3-31 shows a closer view of the
collagenous materials that are difficult to see in Figure 3-30 because of the difference in
intensities of the each DLIPS spectrum.
After 2000 laser pulses, the DLIPS spectra of the studied collagenous materials, as shown
in Figure 3-30 seem to follow a similar pattern occurring at different intensities, except for IgM
which occurs at a much higher intensity with a completely different spectral shape. In Figure 3-
30, which shows all specimen except for IgM, a pattern becomes apparent between collagen,
fibrinogen, IgA, and IgG.
To obtain a better understanding of the collagenous materials structures as well as to
enrich their related DLIPS spectra, Raman spectroscopy was used. The absolute preperturbation
Raman spectrum of each specimen is located in Figure 3-32. Again, all collagenous materials are
color-coded and there correspondents can be seen in Figure 3-28. Also, each spectrum other than
IgM has been shifted to show distinction between Raman peaks of each collagenous material.
Each collagenous material is also plotted separately and for each specimen, located on its graph,
is labeled peaks. The associated peak label, wave number, and band assignment can be found in
the table following each Raman preperturbation spectrum. Figure 3-33 and Table 3-25 are
associated with collagen. Figure 3-34 and Table 3-26 are associated with fibrinogen. Figure 3-35,
Figure 3-36, and Figure 3-37 show the absolute preperturbation spectra of IgA, IgG, and IgM,
respectively. Also, Table 3-27, Table 3-28, and Table 3-29 are associated with IgA, IgG, and
IgM, respectively. The DLIPS of all materials studied are located in Figure 3-38.
Partial component analysis (PCA) was performed for all the traditional Raman and DLIPs
spectra of the collagenous materials studied, and only the immunoglobulins. The wavenumber,
factors, and band assignment for all the materials studied, and only the immunoglobulins using
104
traditional Raman spectroscopy are located in Table 3-30 and Table 3-31. The wavenumber,
factors, and band assignment for all the materials studied, and only the Igs using the DLIPS
method are located in Table 3-32, and Table 3-33.
In comparing the traditional Raman technique PCA between all the materials studied and
only the Igs common bands include the following: 360 cm-1
, 411 cm-1
, 489 cm-1
, 735 cm-1
, 1008
cm-1
, 1130 cm-1
, 1302 cm-1
, and 1447 cm-1
. Also, no unique band was found in the traditional
Raman technique PCA of all studied materials. In the traditional Raman technique PCA of only
Igs, the unique wavenumbers are 1240 cm-1
.
In comparing the DLIPS method PCA between all the materials studied and only the Igs,
the common bands include the following: 360 cm-1
, 392 cm-1
, 444 cm-1
, 489 cm-1
, 806 cm-1
,
1008 cm-1
, 1099 cm-1
, 1130 cm-1
, 1240 cm-1
, 1302 cm-1
, and 1447 cm-1
. Also, in the DLIPS
method PCA of all materials studied, the unique wavenumber is 735 cm-1
. In the DLIPS PCA of
only Igs, the unique wavenumber is 1062 cm-1
.
Comparison between the DLIPS method and the traditional Raman technique PCA of all
materials studied shows similar wavenumbers at 360 cm-1
, 489 cm-1
, 735 cm-1
, 1008 cm-1
, 1130
cm-1
, 1302 cm-1
, and 1447 cm-1
. Also, for only the traditional Raman technique PCA of all
materials studied, unique band at 411 cm-1
and 1062 cm-1
appeared. For only the DLIPS method
of all materials studied, unique bands are located at 392 cm-1
, 444 cm-1
, 806 cm-1
, 1099 cm-1
and
1240 cm-1
. For the only Igs cases, similar factors are located at 489 cm-1
, 1008 cm-1
, 1062 cm-1
,
1130 cm-1
, 1240 cm-1
, 1302 cm-1
, and 1447 cm-1
. For only the traditional Raman technique PCA
of only the Igs studied shows unique factors at 360 cm-1
, 411 cm-1
, and 735 cm-1
. Also, for only
the DLIPS method of only the Igs studied shows unique factors at 392 cm-1
, 444 cm-1
, 806 cm-1
,

105
and 1099 cm-1
. As observed with the amino acids, the CN and NCC bands play key roles in the
DLIPS analysis.
Using the information gathered from the PCA, the K-nearest neighbor (KNN) was
performed for a training set and validation set for all the materials studied, and only the Igs using
a traditional Raman technique and the DLIPS method presented within this dissertation.
In Table 3-34 thru Table 3-37 the training sets and validation sets for the cases mentioned
above using a traditional Raman technique can be found. In Table 3-38 thru Table 3-41 the
training sets and validation sets for the cases mentioned above using the DLIPS technique can be
found.
The training set of all the materials studied using the traditional Raman technique, shown
in Table 3-34 has no misclassifications. The validation set in Table 3-35 of all the materials
studied shows a misclassification of 11.7 % of the IgA samples, and 33.3 % of the IgG samples.
The training set of only the Igs using the traditional Raman technique, shown no
misclassifications. The validation set of the Igs studied using the traditional Raman technique
shows a misclassification of 17.65 % of the IgA samples.
In the training set of all materials studied using the DLIPS method shows a
misclassification of 5 % of the IgG samples and 22.22 % of the fibrinogen samples. In the
validation set, a misclassification of 10.5 % of the collagen samples, 21 % of the fibrinogen
samples and 21 % of the IgG samples are shown in Table 3-39. The training set of only the Igs
using the DLIPS methods shows no misclassifications. The validation set in Table 3-40 of the Igs
only studied shows a misclassification of 21 % of the IgG samples. Overall, the DLIPS
performed better for the Ig samples, while traditional Raman did better for the collagen and
fibrinogen when polling all data.

106
3.2.4 Conclusions
The high intensities of the absolute preperturbation fluorescence spectra of fibrinogen
and IgG as well as both of these specimens being the only two affected by the 355 nm laser, may
be attributed to a CC stretch that occurs at 1016 cm-1
and a CH bend and CH2 stretching that
occurs at 1454 cm-1
. These band assignments at these wavelengths were not detected in type IV
collagen, IgA, nor IgM.
The DLIPS spectrum of IgM, which occurs at a much higher intensity and with a
completely different spectral shape than the other studied collagenous material, may be attributed
to the specific band wavenumbers and assignments that were only found in IgM. Those are a CC
bend that occurs at 422 cm-1
, a CN stretch that occurs at 524 cm-1
, and a CH bend and a CN
stretch that occurs at 806 cm-1
, and a CC stretch that occurs at 920 cm-1
, a CH bend and a CN
stretch that occurs at 1035 cm-1
, a CN stretch that occurs at 1156 cm-1
, an Amide III that occurs
at 1260 cm-1
, an Amide II that occurs at 1480 cm-1
, and a C=O stretch and CO2 that occurs at
1594 cm-1
. However, it should also be noted that IgM films used in this study was the only
collagenous material studied which was diluted to a 1:10 ratio to deionized water (1:1 ratio to
deionized water was used for all others presented in this study). Further testing could be done to
determine if the concentration of IgM in the thin film affects the fluorescence intensity.
As mentioned above, the DLIPS spectra of the studied collagenous material seem to
follow a similar pattern occurring at different intensities, except for IgM which occurs at a much
higher intensity with a completely different spectral shape. The cause of this specific pattern may
be related to specific wavenumber and band assignments of molecules found only in type IV
collagen, fibrinogen, IgA and IgG. Those bands are a CN bend that occurs at 394 cm-1
, a NH2
rock that occurs at 735 cm-1
, and a CN stretch and NH3 bend that occurs at 1392 cm-1
.

107
However, the x-axis intercept of the DLIPS fluorescence spectra of type IV collagen,
fibrinogen, IgA and IgG, (i.e., where the intensity changed from negative to positive), was
unique. These x-axis intercepts could be used as a means of differentiation and are listed in Table
3.2.6.
The cause of the different x-axis intercepts may be attributed to a CH bend and CN
stretch that occurs at 1139 cm-1
, which was only seen in fibrinogen, a CC stretch that occurs at
1227 cm-1
, which was only seen in IgA, or to an Amide I and C=O stretch at 1676 cm-1
, which
was only observed in IgG.
In conclusion, DLIPS has shown to be a sensitive technique in which differentiation
between 5 different collagenous materials namely type IV collagen, fibrinogen, IgA, IgG, and
IgM, was achieved. However, it should be noted that a CH bend and a CH2 twist that occurs at
1310 cm-1
, was present in the absolute preperturbation Raman spectra of only type IV collagen,
fibrinogen, IgA, and IgM and a CC stretch that occurs at 1070 cm-1
, in the absolute
preperturbation Raman spectrum of only fibrinogen and IgM, have yet to be associated with any
part of their DLIPS spectra. Clearly the 193 nm excimer strongly couples to the peptide bones
and associated CN-bonding. Further investigations should be conducted to associate these
repeating Raman peaks with a DLIPS spectral response so that a complete picture of type IV
collagen, fibrinogen, IgA, IgG, and IgM can be obtained.
3.3 Animal Model Study
3.3.1 Introduction to Animal Model
Cancer or a malignant neoplasm is a disease whose properties change with time. Cancer
cells divide and grow uncontrollably, forming malignant tumors. Cancer can be caused by the
direct damage of genes or by existing genetic faults within cells. Cell alterations that commonly
occur in cancer cells is a decrease in specialized cell surface structures which are composed of

108
protein and are known as gap junctions. In cell-cell communication, gap junctions join adjacent
cells together in a way that allows small molecules to pass directly from one cell to another.
Once gap junctions disappear from some cells, the cells revert to uncontrolled growth. In cancer
cells, another altered property is the ability of the cells surface functional groups to move more
readily and increases the rate at which they can bind to sugar binding proteins that are highly
specific to their associated sugar functional groups called lectins. A single lectin molecule can
link two cells together by binding to carbohydrate groups exposed on the surface of each cell.
Therefore, the tendency of cancer cells to clump together when exposed to lectin proteins is
enhanced.
Cancer cells can also spread to neighboring tissues and throughout the body. When
considering only the size of circulating cancer cells, which are larger than blood cells, they will
most likely become lodged in the capillaries. The lodged cancer cells can now adhere to or
penetrate through the capillary walls and begin the formation of a metastatic tumor. For most
primary tumors, the first such capillary bed will be in the lungs, which may help explain why the
lungs are a relatively frequent site of metastasis for many kinds of cancer. The pattern of blood
flow in the circulatory system will also determine where cancers cells, floating in the
bloodstream, are likely to accumulate. Cancer cells can also spread to other parts of the body
through the lymphatic system. The bodies flow patterns are important but do not always explain
observed metastatic distributions. The behavior of malignant tumors depends not just on the
traits of cancer cells, but also on interactions between cancers cells and normal cells of the
surrounding host tissue.
In healthy humans, destruction of newly forming cancer cells through the immune system
is a routine event. Cancer simply reflects the failure of an adequate immune response against

109
abnormal cells or the ability of the abnormal cells to exhibit unique antigens that can inhibit an
immune response. However, determining the specific cause of cancer is complex. Cancer
exhibits a variety of antigenic changes which can be present in differing concentrations but are
not unique to a specific cancer.
With a particular focus on the early detection of cancer, advanced optical techniques have
been developed to probe tissue. The interactions between light and biological samples are used
currently in diagnostic medicine with the use of optical microscopy to study tissue samples.
Fluorescence-based techniques have also been developed to probe specific tissue fluorophores,
for example, collagen, nicotinamide adenine dinucleotide (NADH), flavins, and porphyrins.
Drezek and coworker in 2001 studied cervical tissue and showed an increase in NADH
fluorescence within the epithelium with progression of abnormal tissue. Epithelial cell layers are
separated from the underlying tissue by a distinct boundary structure called the basal lamina
layer, which is a thin dense layer of protein-containing material that makes it relatively easy to
determine whether a cancer has begun to spread.
Current methods of cancer detection include screening tests, medical imaging and certain
signs and symptoms. Once cancer is detected, it can be diagnosed by examination of a tissue
sample of the suspect lesions followed by histopathological analysis under visible light
microscopy, which remains the gold standard for disease state confirmation in a large proportion
of cancers.
Cancer is typically treated with surgery, radiation therapy, and chemotherapy. When a
cancer has metastasized to unknown locations, a stimulated immune response against the cancer
cells, wherever they may be located can be employed. Cytokines which are proteins produced by
the body to stimulate immune responses against infectious agents, can be used to treat cancer.

110
Antibodies can also be used to target cancer cell destruction either by themselves or by
linking them to radioactive substances, chemotherapeutic drugs, or other kinds of toxic
substances. Antibodies by themselves, the antibodies bind to the cancer cell surface, where their
presence triggers an immune attack that destroys only those cells to which the antibody is
attached. Antibodies when linked to toxic substances, allows the toxins or radioactivity to be
selectively concentrated at tumor sites by the antibody without accumulating to toxic levels
elsewhere in the body. The basic strategy to develop monoclonal antibodies is to immunize
animals with human cancer tissue and then select those monoclonal antibodies that bind to
antigens on the cancer cell surface. When they are injected into individuals with cancer, these
antibody molecules would be expected to circulate until they encounter cancer cells. Radioactive
antibodies are also useful for determining where cancer cells are localized for monitoring
changes in tumor cell numbers in response to treatment. Chances of survival vary greatly by the
type, location, and degree of cancer proliferation the patient demonstrations at the beginning of
treatment. Cancer can affect people of any age and the risk of developing cancer typically
increases with age, though a few types of cancer are more common in children than adults.
Molecules are correlated with certain pathological conditions and have unique
distributions in tumors. Classes or groups of these organic molecules and biological materials
can be differentiated when excitation occurs at specific wavelengths. Because the
excitation/emission wavelength pair is a combination of the molecular structure and the overall
molecular environment (e.g. biological matrix), fluorescence emission may provide
discrimination among emitting materials.
Common to spectra taken from complex samples, high intensity, broadband fluorescence
responses from tissue often obscure the rich biomolecular information found in lower intensity

111
fluorescence emission bands. As this broadband response could potentially be from a tissue
fluorophore unrelated to disease, targeting specific biomarkers of disease has been challenging
using these techniques. However, the largest hurdle to surmount in translating these spectral
strategies to the clinic has been the significant patient-to-patient variation in fluorescent
properties. This has been shown to be associated with race, age, sex, air temperature, and even
deformation of the tissue when applying the probe. Some patient and sample variability includes:
fluctuations in absolute emission intensity, emission peak shifts, and changes in the scattering
and absorption properties of the tissue, etc. Brookner and coworkers in 2003, for example,
reported variations in peak fluorescence intensities varying by more than a factor of five between
patients while the intra-patient coefficient of variation was less than 25 %. While fluorescence
signals are directly linked to the local molecular structure of the targeted system, there clearly
remains a need for further improvement in optical-based sensing schemes to specifically address
the variations realized with absolute fluorescence intensity.
As mentioned above, the patient-to-patient variability is a known confounding factor for
clinical in situ fluorescence measurements. Although multiple standardization and normalization
techniques have been proposed to combat this issue, it necessarily comes at the cost of lost
information from the collected spectra. In the case of DLIPS, the spectra represents a differential
response measurement from the same location and is in that sense self-referencing in order to
specifically remove variation associated with inter-sample differences. The DMBA, as described
below, model of pathogenesis has been well characterized, particularly with regard to in vivo
models for the evaluation of fluorescence-based techniques to detect and diagnosis cancerous
and pre-cancerous lesion formation.

112
3.3.2 Methods
The main goal of this study was to investigate the DLIPS potential as a precancerous
diagnostic technique. The study was terminated at 11 weeks, prior to the emergence of squamous
cell carcinomas (SCCs) as the goal of the study was not to investigate the biological difference
between cancerous and normal tissue but rather to investigate DLIPS potential as a precancerous
diagnostic technique. Thus tissue comparisons were made between healthy tissue and tissue
during the course of SCC formation due to 7,12-dimethylbenz(a)anthracene (DMBA) initiation
and promotion, as reported recently in Kozikowki, et al. 2001.
Tumor formation on female athymic nude mice, six to eight weeks old, was induced and
promoted by topical application of 7,12-dimethylbenz(a)anthracene (DMBA) in mineral oil at a
concentration of 0.5 % w/w applied topically to the dorsal skin. Typically acetone is used as a
solvent for DMBA but to avoid skin irritation due to repeated acetone administration alone,
mineral oil was used. Application was repeated two to three times per week throughout the 11
week of this study. DMBA application was discontinued if mice began exhibiting signs of
systemic toxicity, particularly weight loss. The untreated mice received topical application of
mineral oil alone.
In this study, analysis of pathological changes in a murine model using the DLIPS
technique as described above was conducted. Prior to all spectral measurements, each mouse was
cleaned with an alcohol and anesthetized using a ketamine/xylazine solution (Phoenix
Pharmaceutical; Lloyd Laboratories) at 10 ml/kg of body weight. Starting in week two of this
study, fluorescence spectra and DLIPS spectra were collected from two spots on each side of two
untreated mice and two DMBA-treated mice (4 spots x 2 mice). An Nd:YAG laser (355 nm)
with energy set at 20 μJ was used to excited fluorescence. The excimer laser (193 nm) was used
to deliver a total of 2500 laser pulses for each spot. Spectra were collected once a week for 11

113
weeks and despite emerging lesions on the DMBA-treated mice by week eight, from skin regions
that appeared to be pathology-free under visual inspection (i.e., visible lesions were avoided). At
the end of this study, all remaining mice were euthanized using an intraperitoneal injection of
Euthasol (Virbac AH).
Tissue comparisons were also made during this study between the untreated and DMBA-
treated tissues. One mouse was selected from each group and was euthanized as described above.
Immediately following euthanasia, the dorsal skin was excised all the way down to the
anteroposterior axis and fixed in formalin (Sigma-Aldrich). Histological slices were either
prepared immediately from these samples or the fixed skin was stored in a 30 % sucrose solution
for later use. Fixed samples were paraffin-embedded, sliced into 5 µm sections, and stained with
hematoxylin and eosin (H&E). The sections were then mounted on glass and analyzed by a
veterinary pathologist, Dr. Castleman of the University of Florida.
3.3.3 Results
At the conclusion of the study, all spectra were visually inspected and 22 individual
spectra (~14% of the total collected) were rejected due to (1) excessive spectral noise and/or no
observable difference in the pre- and post-perturbation spectra; indicative of low Nd:YAG laser
and/or low perturbation laser intensity during the collection process, or (2) due to atypical
spectral appearance (e.g. unusually large negative or positive perturbation) which is indicative of
mouse movement (e.g. twitching) between the pre- and post-perturbation measurements. Given
the considerable variation in absolute fluorescence intensity as compared to the degree of actual
perturbation, any spatial movement of the target during the DLIPS procedure will generate a
spurious response. Only spectra with unambiguous outlier characteristics were omitted during
the screening process.

114
Over the weeks of DMBA application, noticeable changes in shape of DLIPS spectra
emerged (DMBA-treated versus untreated), while these changes are not directly observable in
the fluorescence spectra alone. The average DLIPS spectra at weeks 1-11 for the untreated and
DMBA-treated skin can be seen in Figure 3-39 and Figure 3-40, respectively. Across all acquired
spectra, the most important regions in explaining the differences are: below 400 nm, a peak at
420 nm, and a region of increasing importance at wavelengths above 460 nm.
Additionally, when the untreated spectra and DMBA-treatment spectra are analyzed
separately, unique band regions emerge to potentially explain the observed pathological
progression to lesion formation in the DMBA model as opposed to the skin from the untreated
mice. Primarily, the DMBA-treated skin has an important band between 400 and 420 nm, while
the control skin’s band is below 400 nm. Figure 3-39 thru Figure 3-41 shows the average
traditional fluorescence spectra of untreated and DMBA-treated skins at week 2, week 6, and
week 8. Figure 3-44 thru Figure 3-46 shows DLIPS spectra of the DMBA-treated and untreated
skins at week 2, week 6, and week 8.
Spectral samples at the same time points of the study, illustrate the ability of the DLIPS
technique to exploit internal normalization of the spectra relative to the tissue, and thus revealing
information about the underlying pathology. Both figure sets mentioned above show the
emergence of a noticeable band in the lower wavelengths of the DLIPS spectra throughout the
pathological progression of the DMBA model. This information is either obscured or not
detected using the pre-perturbation fluorescence alone, as the spectra from the skin (both
untreated and DMBA-treated) are dominated by the broad, correlated fluorescence peak centered
on 460 nm. Across all acquired spectra, the most important regions in explaining the differences
are: below 400 nm, a peak at 420 nm, and a region of increasing importance at wavelengths

115
above 460 nm. The entire data set showed significant variability above this wavelength. This
implies that this region may specifically account for variability between control and DMBA-
treated skin using the DLIPS technique.
In Figure 3-47 thru Figure 3-50, representative photomicrographs of the H&E sections of
the skin at four, eight, and eleven weeks of the study are shown. Each photomicrograph is at a
magnification of 150x. Figure 3-45 is from an untreated mouse after week four of the study.
There is normal epidermal thickness with several layers in the stratum corneum. Hair follicles
and sebaceous glands are in normal density within dermal collagen and subcutis. Subsequent
weeks of skin samples from control mice were comparable to the sample at week four. Figure 3-
46 shows the skin after four weeks of DMBA treatment which displayed moderate epidermal
changes including acanthosis and orthokeratotic hyperkeratosus, characterized by thickening of
the stratum spinosum, stratum granulosum, and stratum corneum. Hair follicles were reduced in
density and the dermis in treated areas was almost devoid of sebaceous glands compared to skin
from control mice, while at the same time dermal collagen density was increased. After eight
weeks of topical DMBA application, skin was characterized by more severe acanthosis,
orthokeratotic hyperkeratosis and dermal fibrosis than in skin after four weeks, as shown in
Figure 3-49. Hair follicles were infrequently found in treated areas, and sebaceous glands were
almost completely absent. Squamous cell papillomas were occasionally present in the epidermis
(although not shown in this section). At the conclusion of the study, week 11, the DMBA treated
skin (Figure 3-50) showed more severe epidermal acanthosis and hyperkeratosis. There was also
an increased, but still low density, scattering of squamous cell papillomas throughout the
epidermis. Dermal fibrosis was slightly more severe than in samples from mice at eight weeks of
DMBA treatment. This observed histopathological progression was as previously described

116
when using this model, with inflammation and hyperplasia occurring early, dysplastic lesions
forming at around six weeks of treatment, and later the emergence of papillomas prior to
carcinoma formation.
The spectral data were partitioned into “early” (week 2-4), “middle” (week 5-8), and
“late” (week 9-11) segments, based upon the visual observation of similar pathological states
within those time periods for the DMBA-treated mice. The “early” DMBA-treatment group was
considered pre-pathological as both observational and histological evidence showed only the
earliest stages (inflammation and hyperplasia) of development. The “middle” and “late” periods
were considered definite-pathological because dysplastic lesions and papillomas were visible
during those periods of the study.
3.3.4 Conclusion
As has been shown before, the strong fluorescence peak centered on 460 nm for the
fluorescence spectra can most reasonably be assigned to the tissue fluorophore NADH. While
this is an important tissue fluorophore, and is a primary target of fluorescence tissue assessment,
it serves as a marker of increased cellular metabolism, which is a hallmark of dysplasia, but not
necessarily unique to it. In conjunction with increased cellular metabolism, one of the earliest
markers of pre-cancerous progression is cellular infiltration and the release of growth factors and
cytokines. This unchecked cellular signaling, results in the proliferation of fibroblasts, increased
collagen synthesis, and suppression of collagenase production, with the overall effect of
restructuring the local ECM. These effects suggest that techniques which target collagen
remapping might provide direct diagnostic coupling of the spectra to the pathology. In the
spectral region up to 420 nm, is the most prominent region in explaining the variance when using
DLIPS, and is in the range for emission due to collagen. This agrees with previous work showing
that excimer laser pulses can break collagen amide bonds, resulting in a pronounced difference

117
spectrum band. The proximity to the 460 nm NADH peak could indicate it is simply a residual
region from that emission. Alternatively, it could be related to differential melanin accumulation
in DMBA-treated skin versus untreated samples as this has been shown to be a marker for some
skin cancers. It is also well known that melanin interacts with UV light; hence a unique
differential response under DLIPS interrogation is entirely possible. While this is an interesting
finding, further investigation of individual tissue fluorophores using DLIPS will be necessary in
understanding this response band and its diagnostic merit.
The severe drop in performance for identifying pathology during weeks five through
eight, as further quantified in a detailed chemometic analysis (Kozikowki, et al. 2012) is likely
due to emission fluctuations associated with the data collection process or the particular spots
being interrogated on the back of particular mice. However, the detection performance improved
uniformly with the maturation of the DMBA-induced pathology.
In the age of computer-aided medical diagnostics, techniques that add new information to
the decision-making process (i.e., orthogonal sensing) are invaluable. These findings show
preliminary support for applying this technique as a stand-alone medical diagnostic tool or as a
complementary technique to traditional fluorescence spectroscopy for the detection of pathology
in vivo. Of particular note were the findings that the DLIPS spectra emphasize different spectral
regions and the endogenous pathology detection potential for DLIPS shows superior
performance in this study. This technique couples specifically to morphological changes in the
ECM, which is unique compared to laser-induced fluorescence.
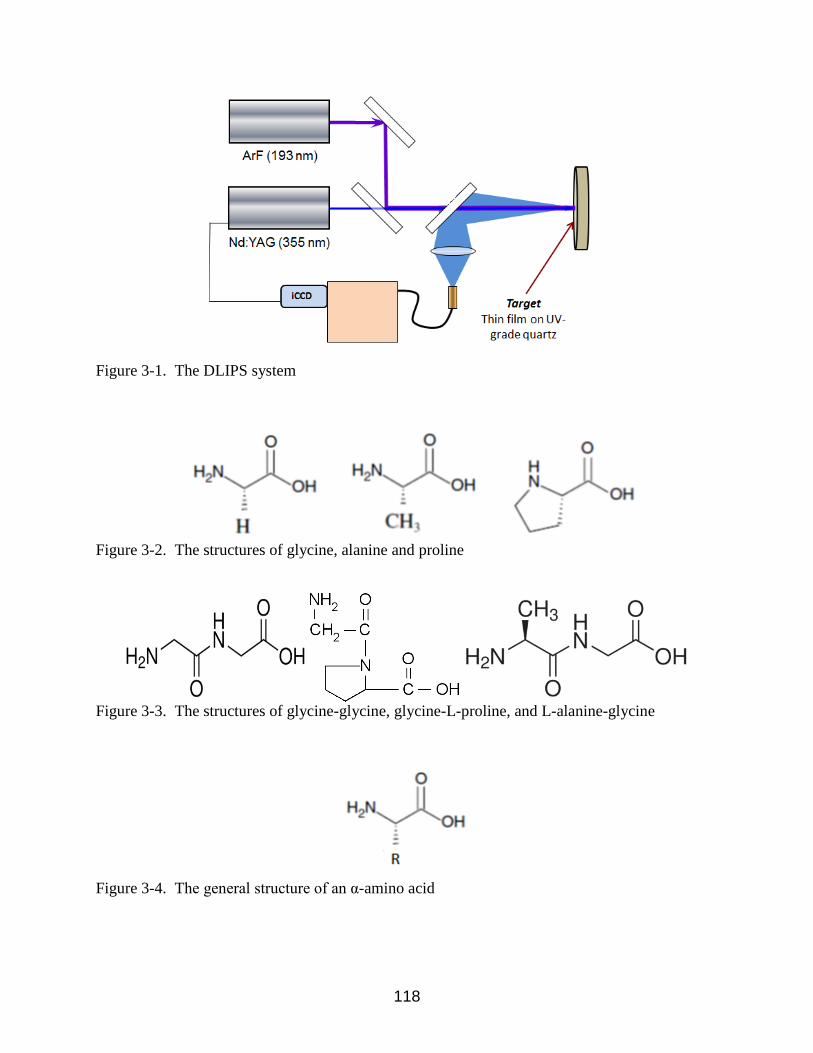
118
Figure 3-1. The DLIPS system
Figure 3-2. The structures of glycine, alanine and proline
Figure 3-3. The structures of glycine-glycine, glycine-L-proline, and L-alanine-glycine
Figure 3-4. The general structure of an α-amino acid

119
Figure 3-5. The traditional fluorescence spectra of the amino acids (i.e., preperturbation)
Figure 3-6. Key of color that represents each studied amino acid
Figure 3-7. The traditional fluorescence spectra of L-alanine (blue) and L-alanine-glycine (red)
(i.e., preperturbation)

120
Figure 3-8. The traditional fluorescence spectra of glycine (light blue) and glycine-glycine
(orange) (i.e., preperturbation)
Figure 3-9. The traditional fluorescence spectra of L-proline (green) and glycine-L-proline
(violet) (i.e., preperturbation)

121
Figure 3-10. The DLIPS spectra of the amino acids
Figure 3-11. The DLIPS spectra of L-alanine (blue) and L-alanine-glycine (red) after 700 laser
pulses
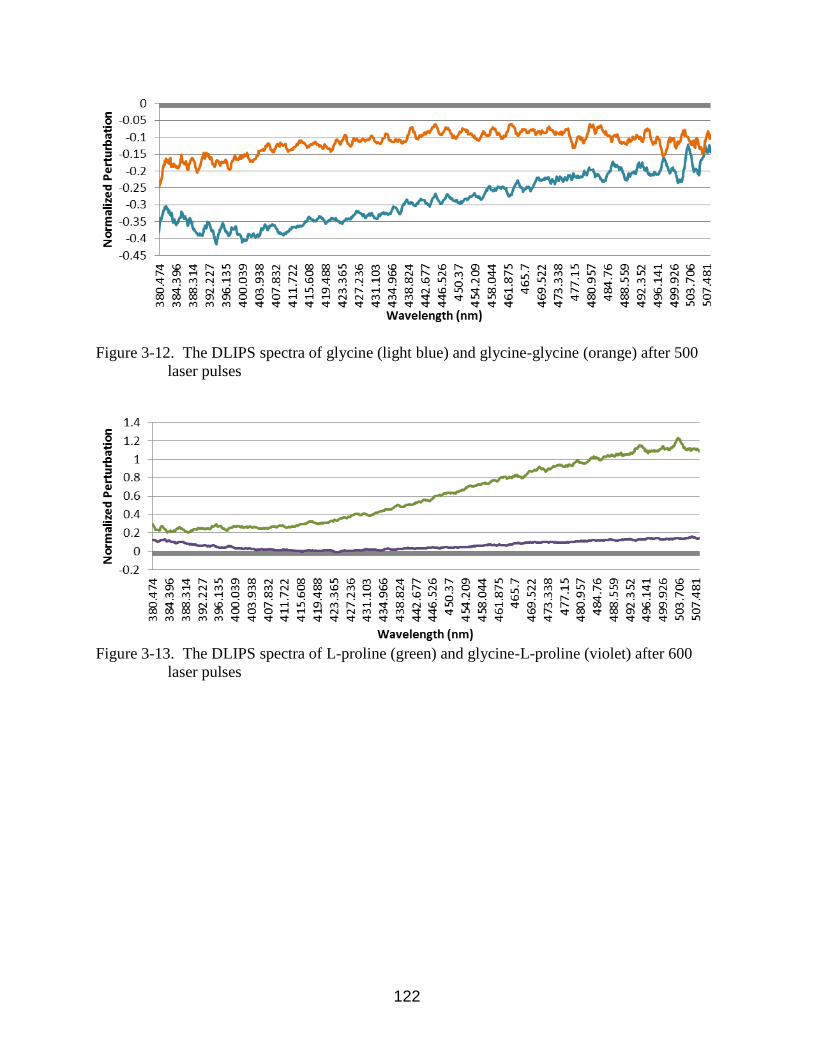
122
Figure 3-12. The DLIPS spectra of glycine (light blue) and glycine-glycine (orange) after 500
laser pulses
Figure 3-13. The DLIPS spectra of L-proline (green) and glycine-L-proline (violet) after 600
laser pulses

123
Figure 3-14. The DLIPS spectra of glycine (light blue) after 500 laser pulses, L-alanine (blue)
after 700 laser pulses and L-proline (green) after 600 laser pulses
Figure 3-15. The DLIPS spectra of glycine-glycine (orange) after 500 laser pulses, L-alanine-
glycine (red) after 700 laser pulses and glycine-L-proline (violet) after 600 laser
pulses
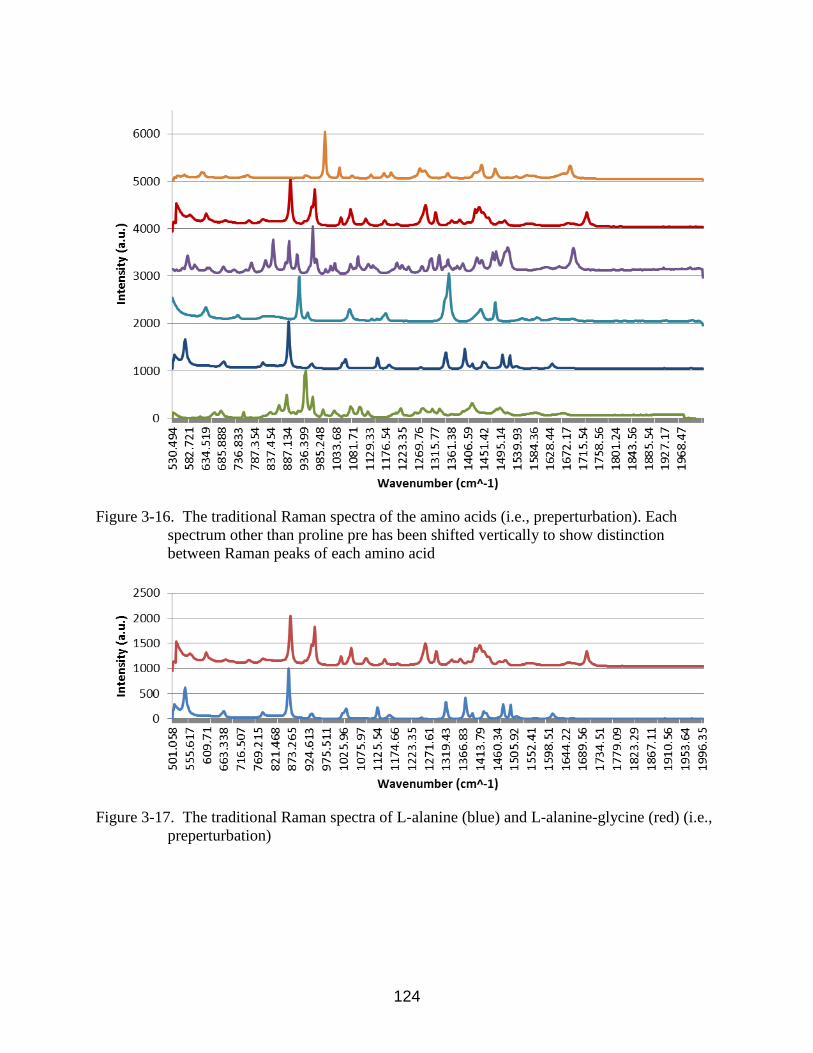
124
Figure 3-16. The traditional Raman spectra of the amino acids (i.e., preperturbation). Each
spectrum other than proline pre has been shifted vertically to show distinction
between Raman peaks of each amino acid
Figure 3-17. The traditional Raman spectra of L-alanine (blue) and L-alanine-glycine (red) (i.e.,
preperturbation)
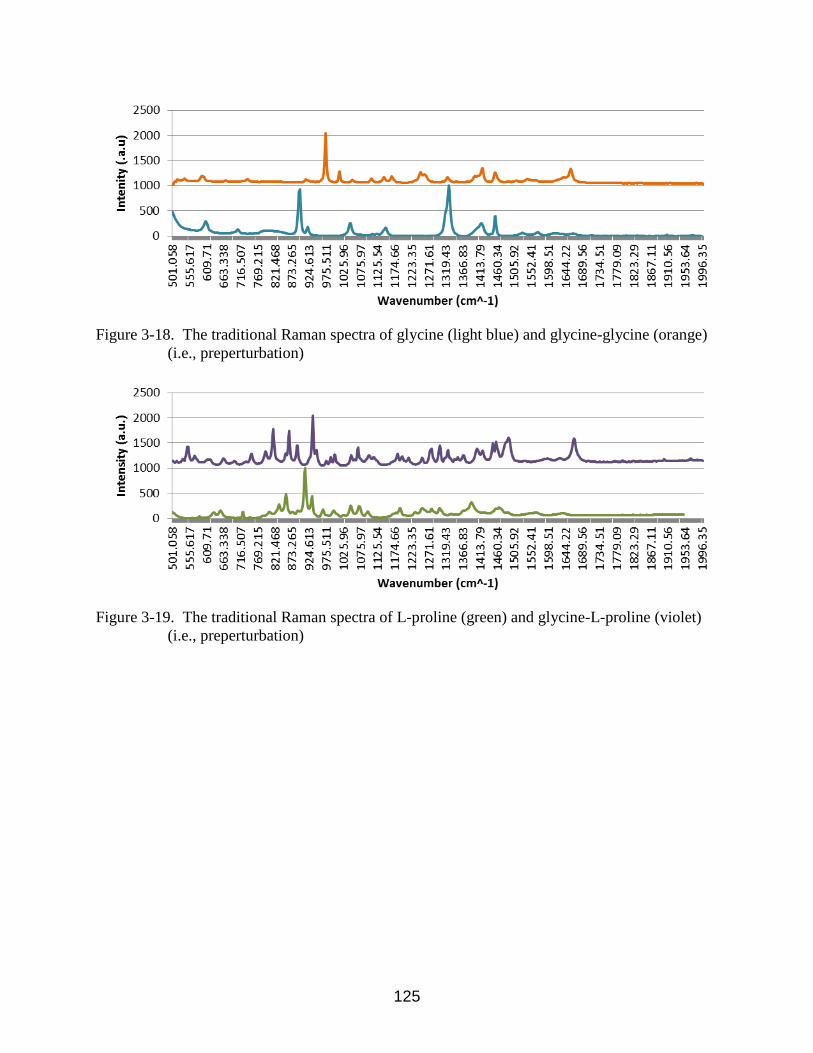
125
Figure 3-18. The traditional Raman spectra of glycine (light blue) and glycine-glycine (orange)
(i.e., preperturbation)
Figure 3-19. The traditional Raman spectra of L-proline (green) and glycine-L-proline (violet)
(i.e., preperturbation)

126
Figure 3-20. The traditional Raman preperturbation (blue) spectrum of L-alanine
Figure 3-21. The traditional Raman preperturbation (red) spectrum of L-alanine-glycine

127
Figure 3-22. The traditional Raman preperturbation (light blue) spectrum of glycine
Figure 3-23. The traditional Raman preperturbation (orange) spectrum of glycine-glycine

128
Figure 3-24. The traditional Raman preperturbation (green) spectrum of L-proline
Figure 3-25. The traditional Raman preperturbation (purple) spectrum of glycine-L-proline

129
Figure 3-26. The DLIPS of the amino acids
Figure 3-27. The traditional fluorescence preperturbation spectra of the collagenous material

130
Figure 3-28. The color that represents each studied collagenous material
Figure 3-29. A close-up view of the absolute fluorescence spectra of the collagenous material.
(Fibrinogen and IgG are not plotted here)
Figure 3-30. The DILPS spectra of the collagenous material after 2000 laser pulses

131
Figure 3-31. A close-up view of the DLIPS spectra of the collagenous material after 2000 laser
pulses. (IgM is not plotted here)
Figure 3-32. The traditional Raman spectra of the collagenous material. Each spectrum other
than IgM has been shifted vertically to show distinction between Raman peaks of
each collagenous material.

132
Figure 3-33. The traditional preperturbation spectrum of collagen
Figure 3-34. The traditional preperturbation spectrum of fibrinogen

133
Figure 3-35. The traditional preperturbation spectrum of the IgA
Figure 3-36. The traditional preperturbation spectrum of IgG

134
Figure 3-37. The traditional preperturbation spectrum of IgM

135
Figure 3-38. The DLIPS of Collagenous and related biological material

136
Figure 3-39. The average DLIPS spectra at weeks 1-11 for the untreated skin

137
Figure 3-40. The average DLIPS spectra at weeks 1-11 for the DMBA-treated skin
Figure 3-41. The average absolute fluorescence for the DMBA-treated (▲) and untreated skin at
week 2

138
Figure 3-42. The average absolute fluorescence for the DMBA-treated (▲) and untreated skin at
week 6
Figure 3-43. The average absolute fluorescence for the DMBA-treated (▲) and untreated skin at
week 8
Figure 3-44. The average DLIPS fluorescence for the DMBA-treated (▲) and untreated skin at
week 2

139
Figure 3-45. The average DLIPS fluorescence for the DMBA-treated (▲) and untreated skin at
week 6
Figure 3-46. The average DLIPS fluorescence for the DMBA-treated (▲) and untreated skin at
week 8
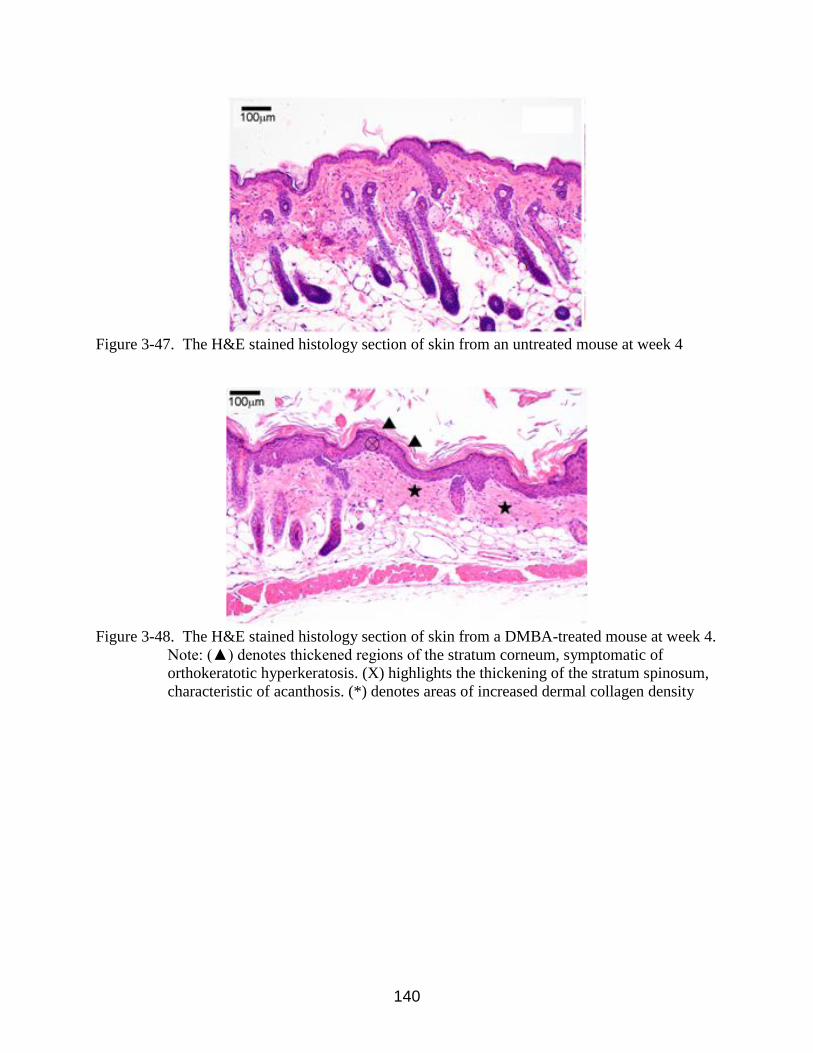
140
Figure 3-47. The H&E stained histology section of skin from an untreated mouse at week 4
Figure 3-48. The H&E stained histology section of skin from a DMBA-treated mouse at week 4.
Note: (▲) denotes thickened regions of the stratum corneum, symptomatic of
orthokeratotic hyperkeratosis. (X) highlights the thickening of the stratum spinosum,
characteristic of acanthosis. (*) denotes areas of increased dermal collagen density

141
Figure 3-49. The H&E stained histology section of skin from a DMBA-treated mouse at week 8.
Note: (▲) denotes thickened regions of the stratum corneum, symptomatic of
orthokeratotic hyperkeratosis. (X) highlights the thickening of the stratum spinosum,
characteristic of acanthosis. (*) denotes areas of increased dermal collagen density
Figure 3-50. The H&E stained histology section through a developed papilloma of skin from a
DMBA-treated mouse at week 11

142
Table 3-1. The band identity, wavenumber, and band assignment for L-alanine
L-Alanine
Band Identity Wavenumber (cm-1
) Band Assignment
A 661 CC stretch, C=O bend
B 781 CO bend
C 870 CC stretch, CN bend (normalization peak)
D 1024 CH3 rock, CN stretch
E 1125 NH2 rock, CH3 rock
F 1159 CH bend
G 1319 CH bend
H 1374 CH3 sym. bend
I 1422 CH3 asym. bend
Table 3-2. The band identity, wavenumber, and band assignment for L-alanine-glycine
L-alanine-glycine
Band Identity Wavenumber (cm-1
) Band Assignment
A 603 CO bend
B 870 CN stretch, CC stretch (normalization peak)
C 942 CN stretch, CC stretch
D 1024 CH3 asym. rock , CN stretch
E 1260 Amide III
F 1291 CH bend
G 1355 CO bend, CH bend
H 1413 CH3 sym. bend
I 1477 Amide II
J 1665 C=O stretch, NH2 bend
Table 3-3. The band identity, wavenumber, and band assignment for glycine
Glycine
Band Identity Wavenumber (cm-1
) Band Assignment
A 706 CH bend
B 897 CC stretch
C 930 CC stretch, CO bend
D 1054 CN stretch
E 1159 CH bend
F 1330 CH bend (normalization peak)
G 1413 CO stretch
H 1453 CH bend

143
Table 3-4. The band identity, wavenumber, and band assignment for glycine-glycine
Glycine-glycine
Band Identity Wavenumber (cm-1
) Band Assignment
A 732 NH2 rock
B 912 CC stretch
C 975 CC stretch (normalization peak)
D 1014 CH bend, CN stretch
E 1142 CH bend, CN stretch
F 1159 CH bend
G 1247 Amide III
H 1260 CC stretch, CO bend
I 1453 CH bend
J 1665 C=O stretch, NH2 bend
Table 3-5. The band identity, wavenumber, and band assignment for L-proline
L-Proline
Band Identity Wavenumber (cm-1
) Band Assignment
A 626 CC bend
B 722 NH2 rock, NH bend
C 853 CN stretch
D 912 CC stretch (normalization peak)
E 930 CC stretch, CO bend
F 989 CC stretch, CH2 rock
G 1047 CN stretch
H 1075 CC stretch
I 1096 CH bend, CN-H2 asym. bend
J 1185 NH3 rock‖ , CH bend
K 1230 CN bend, NH3 rock
L 1278 CH bend, NH rock
M 1384 CO bend

144
Table 3-6. The band identity, wavenumber, and band assignment for glycine-L-proline
Glycine-L-proline
Band Identity Wavenumber (cm-1
) Band Assignment
A 815 CC stretch, CH2 rock
B 867 CC stretch, CH2 stretch
C 924 CC stretch, CN bend (normalization peak)
D 989 CC stretch, CH2 rock
E 1054 CN stretch
F 1185 NH3 rock, CH bend
G 1195 NH3 rock , CN2 bend
H 1206 CC stretch, CO stretch
I 1278 CH bend, NH rock
J 1302 CH2 wag
K 1323 CH2 wag, CH bend
L 1413 CO bend
M 1457 CH2 bend
N 1484 CH2 bend, NH3 sym. bend
O 1665 C=O stretch, NH2 bend
Table 3-7. The wavenumber, factor, and band assignment for all traditional Raman studied
amino acids
All Materials Raman
Wavenumber (cm-1
) Factor Band Assignment
855 2 (-0.1704) CH bend
867 1 (0.1154), 3 (0.1201) CC stretch, CH2 stretch
897 3 (-0.1356) CC stretch
937 1 (0.1651) CC stretch
971 2 ( 0.2252), 3 (0.1252) CC wag
1328 3 (-0.2470) COO sym stretch
1485 1 (0.1371) CH bend, CH wag
1655 2 (0.1237) Amide I (C=O stretch)
1666 1 (0.1270) Amide I (C=C stretch)
Table 3-8. This is the wavenumber, factor, and band assignment for traditional Raman studied
peptides
Gly, Pro, Ala Raman
Wavenumber (cm-1
) Factor Band Assignment
538 2 (-0.1293), 3 (0.1265) Amide IV (NCC bend, C=O
stretch)
855 1 (0.1574), 2 (-0.1874), 3
(0.1889)
CH out of plane bend
867 3 (-0.1276) CC stretch, CH2 stretch
897 1 (-0.1181) CC stretch
912 1 (0.1790), 2 (0.2138) CC stretch
1323 3 (0.2281) CH2 wag, CH bend
1328 1 (-0.2186) COO sym stretch
1455 3 (0.1111) CH3 asym bend

145
Table 3-9. The wavenumber, factor, and band assignment for traditional Raman studied
dipeptides
GlyGly, GlyPro, AlaGly Raman
Wavenumber (cm-1
) Factor Band Assignment
817 1 (0.1039), 3 (0.1520) CC stretch
867 2 (-0.2104) CC stretch, CH2 stretch
937 1 (0.1456) CC stretch
971 1 (-0.1222), 2 (0.1919) CC wag
1278 3 (-0.1068) CH bend, NH rock
1447 3 (0.1053) CH2 bend
1485 1 (0.1328), 3 (-0.1065) CH bend, CH wag
1666 1 (0.1229) Amide I (C=C stretch)
Table 3-10. The wavenumber, factor, and band assignment for all DLIPS studied amino acids
All Materials DLIPS
Wavenumber (cm-1
) Factor Band Assignment
538 2 (-0.2594) Amide IV (NCC bending,
C=O stretch)
836 1 (-0.0697), 3 (-0.1523) CO2 out of plane bend
963 3 (0.0995) CH bend
1323 2 (-0.1443), 3 (0.1261) CH2 wag, CH bend
1340 2 (0.1199), 3 (-0.1171) Amide III (CH2 wag)
1367 2 (0.1106) CH2 twist
1422 2 (0.1231) CH3 asym bend
Table 3-11. The wavenumber, factor, and band assignment for DLIPS studied peptides
Gly, Pro, Ala DLIPS
Wavenumber (cm-1
) Factor Band Assignment
538 2 (-0.2594) Amide IV (NCC bending,
C=O stretch)
836 1 (-0.0814) CO2 out of plane bend
1001 3 (0.0963) CC stretch
1323 2 (-0.1443), 3 (0.1126) CH2 wag, CH bend
1340 2 (0.1199) Amide III (CH2 wag)
1367 2 (0.1106) CH2 twist
1422 2 (0.1231) CH3 asym bend

146
Table 3-12. The wavenumber, factor, and band assignment for all DLIPS studied dipeptides
GlyGly, GlyPro, AlaGly
DLIPS
Wavenumber (cm-1
) Factor Band Assignment
554 1 (-0.0821) CN twist, NH bend
662 1 (-0.0834) Amide IV (NCC bend, C=O
stretch)
867 2 (0.1753), 3 (0.0957) CC stretch, CH2 stretch
893 3 (0.0954) CC stretch
926 2 (-0.0924) CH2 rock
963 2 (0.1381) CH bend
975 2 (-0.1445) CC stretch
1070 3 (0.1401) CC stretch
1246 2 (-0.1116) CH2 twist
1666 3 (-0.1409) Amide I (C=C stretch)
Table 3-13. The predicted class of all materials (i.e., peptides and dipeptides) studied using
traditional Raman within the training set
Raman-Training Set
Glycine Proline Alanine GlyGly GlyPro AlaGly
Glycine (19 spectra) 100% 0% 0% 0% 0% 0%
Proline (18 spectra) 0% 100% 0% 0% 0% 0%
Alanine (18 spectra) 0% 0% 100% 0% 0% 0%
GlyGly (20 spectra) 0% 0% 0% 100% 0% 0%
GlyPro (19 spectra) 0% 0% 0% 0% 100% 0%
AlaGly (15 spectra) 0% 0% 0% 0% 0% 100%
Table 3-14. The predicted class of all materials (i.e., peptides and dipeptides) studied using
traditional Raman within the validation set
Raman-Validation Set
Glycine Proline Alanine GlyGly GlyPro AlaGly
Glycine (20 spectra) 100% 0% 0% 0% 0% 0%
Proline (20 spectra) 0% 95% 5% 0% 0% 0%
Alanine (20 spectra) 0% 0% 100% 0% 0% 0%
GlyGly (20 spectra) 0% 15% 0% 85% 0% 0%
GlyPro (20 spectra) 0% 65% 0% 0% 25% 20%
AlaGly (20 spectra) 0% 65% 35% 0% 0% 0%
Table 3-15. The predicted class of the peptides studied using traditional Raman within the
training set
Raman-Training Set
Glycine Proline Alanine
Glycine (19 spectra) 100% 0% 0%
Proline (18 spectra) 0% 100% 0%
Alanine (18 spectra) 0% 0% 100%

147
Table 3-16. The predicted class of the peptides studied using traditional Raman within the
validation set
Raman-Validation Set
Glycine Proline Alanine
Glycine (20 spectra) 100% 0% 0%
Proline (20 spectra) 0% 95% 5%
Alanine (20 spectra) 0% 0% 100%
Table 3-17. The predicted class of the dipeptides studied using traditional Raman within the
training set
Raman-Training Set
GlyGly GlyPro AlaGly
GlyGly (20 spectra) 100% 0% 0%
GlyPro (19 spectra) 0% 100% 0%
AlaGly (15 spectra) 0% 0% 100%
Table 3-18. The predicted class of the dipeptides studied using traditional Raman within the
validation set
Raman-Validation Set
GlyGly GlyPro AlaGly
GlyGly (20 spectra) 100% 0% 0%
GlyPro (20 spectra) 0% 95% 5%
AlaGly (20 spectra) 0% 0% 100%
Table 3-19. The predicted class of all materials (i.e., peptides and dipeptides) studied using the
DLIPS method within the training set
DLIPS-Training Set
Glycine Proline Alanine GlyGly GlyPro AlaGly
Glycine (15 spectra) 100% 0% 0% 0% 0% 0%
Proline (20 spectra) 0% 100% 0% 0% 0% 0%
Alanine (16 spectra) 0% 0% 100% 0% 0% 0%
GlyGly (19 spectra) 0% 0% 0% 100% 0% 0%
GlyPro (20 spectra) 0% 0% 0% 0% 100% 0%
AlaGly (14 spectra) 0% 0% 0% 0% 0% 100%
Table 3-20. The predicted class of all materials (i.e., peptides and dipeptides) studied using the
DLIPS method within the validation set
DLIPS-Validation Set
Glycine Proline Alanine GlyGly GlyPro AlaGly
Glycine (16 spectra) 100% 0% 0% 0% 0% 0%
Proline (20 spectra) 0% 100% 0% 0% 0% 0%
Alanine (20 spectra) 0% 0% 100% 0% 0% 0%
GlyGly (20 spectra) 0% 0% 0% 100% 0% 0%
GlyPro (20 spectra) 0% 0% 0% 0% 100% 0%
AlaGly (15 spectra) 0% 0% 0% 0% 0% 100%

148
Table 3-21. The predicted class of the peptides studied using the DLIPS method within the
training set
DLIPS-Training Set
Glycine Proline Alanine
Glycine (15 spectra) 100% 0% 0%
Proline (20 spectra) 0% 100% 0%
Alanine (16 spectra) 0% 0% 100%
Table 3-22. The predicted class of the peptides studied using the DLIPS method within the
validation set
DLIPS-Validation Set
Glycine Proline Alanine
Glycine (16 spectra) 100% 0% 0%
Proline (20 spectra) 0% 100% 0%
Alanine (20 spectra) 0% 0% 100%
Table 3-23. The predicted class of the dipeptides studied using the DLIPS method within the
training set
DLIPS-Training Set
GlyGly GlyPro AlaGly
GlyGly (19 spectra) 100% 0% 0%
GlyPro (20 spectra) 0% 100% 0%
AlaGly (14 spectra) 0% 0% 100%
Table 3-24. The predicted class of the dipeptides studied using the DLIPS method within the
validation set
DLIPS-Validation Set
GlyGly GlyPro AlaGly
GlyGly (20 spectra) 100% 0% 0%
GlyPro (20 spectra) 0% 100% 0%
AlaGly (15 spectra) 0% 0% 100%
Table 3-25. The band identity, wavenumber, and band assignment for collagen
Collagen
Band Identity Wavenumber (cm-1
) Band Assignment
A 392 CN bend
B 735 NH2 rock (normalization peak)
C 1310 CH2 twist, CH bend
D 1392 CN stretch, NH3 bend

149
Table 3-26. The band identity, wavenumber, and band assignment for fibrinogen
Fibrinogen
Band Identity Wavenumber (cm-1
) Band Assignment
A 392 CN bend
B 735 NH2 rock (normalization peak)
C 1016 CC stretch
D 1070 CC stretch
E 1139 CH bend, CN stretch
F 1310 CH2 twist, CH bend
G 1392 CN stretch, NH3 bend
H 1454 CH bend, CH2 stretching
Table 3-27. The band identity, wavenumber, and band assignment for IgA
IgA
Band Identity Wavenumber (cm-1
) Band Assignment
A 392 CN bend
B 735 NH2 rock (normalization peak)
C 1227 CC stretching
D 1310 CH2 twist, CH bend
E 1392 CN stretch, NH3 bend
Table 3-28. The band identity, wavenumber, and band assignment for IgG
IgG
Band Identity Wavenumber (cm-1
) Band Assignment
A 392 CN bend
B 735 NH2 rock (normalization peak)
C 1016 CC stretch
D 1392 CN stretch, NH3 bend
E 1454 CH bend, CH2 stretching
F 1676 Amide I, C=O stretch
Table 3-29. The band identity, wavenumber, and band assignment for IgM
IgM
Band Identity Wavenumber (cm-1
) Band Assignment
A 422 CC bend
B 524 CN stretch
C 806 CH bend, CN stretch (normalization peak)
D 920 CC stretch
E 1035 CH bend, CN stretch
F 1070 CC stretch
G 1156 CN stretch
H 1260 Amide III
I 1310 CH2 twist, CH bend
J 1480 Amide II
K 1594 C=O stretch, CO2 bend

150
Table 3-30. The wavenumber, factor, and band assignment for all traditional Raman technique
studied materials
All Materials Raman
Wavenumber (cm-1
) Factor Band Assignment
360 1 (0.1002) CC stretch
411 1 (0.1161) NH2 wag
489 1 (0.0885) CO2 rock
735 1 (-0.1017), 3 (0.1431) NH2 rock
1008 2 (0.1067) CO stretch, CC stretch
1062 3 (-0.1148) CH3 rock
1130 2 (0.1104), 3 (-0.2016) CC stretch, CH2 rock
1302 2 (0.1141), 3 (-0.1868) CH2 wag
1447 2 (-0.1087), 3 (-0.1261) CH2 bend
Table 3-31. The wavenumber, factor, and band assignment for only the Igs traditional Raman
technique studied materials
Igs only Raman
Wavenumber (cm-1
) Factor Band Assignment
360 1 (0.0991) CC stretch
411 1 (0.1155) NH2 wag
489 1 (0.0882) CO2 rock
735 1 (-0.0898), 3 (0.1431) NH2 rock
1008 2 (0.1164) CO stretch, CC stretch
1062 3 (-0.1148) CH3 rock
1130 3 (-0.2016) CC stretch, CH2 rock
1240 2 (0.0837) Amide III(CH2 wag, CN
stretch)
1302 3 (-0.1868) CH2 wag
1447 2 (0.0857), 3 (-0.1261) CH2 bend
Table 3-32. The wavenumber, factor, and band assignment for all the DLIPS method studied
materials
All Materials DLIPS
Wavenumber (cm-1
) Factor Band Assignment
360 1 (0.1009) CC stretch
392 1 (0.1089) CN bend
444 1 (0.1038) NCC bend
489 1 (0.0949) CO2 rock
735 3 (-0.0949) NH2 rock
806 3 (-0.0966) CH bend, CN stretch
1008 2 (0.1062) CO stretch, CC stretch
1099 3 (0.0845) CH2 wag, CN stretch
1130 3 (0.1807) CC stretch, CH2 rock
1240 2 (0.0899) Amide III
1302 3 (0.1590) CH2 wag
1447 3 (0.1143) CH2 bend
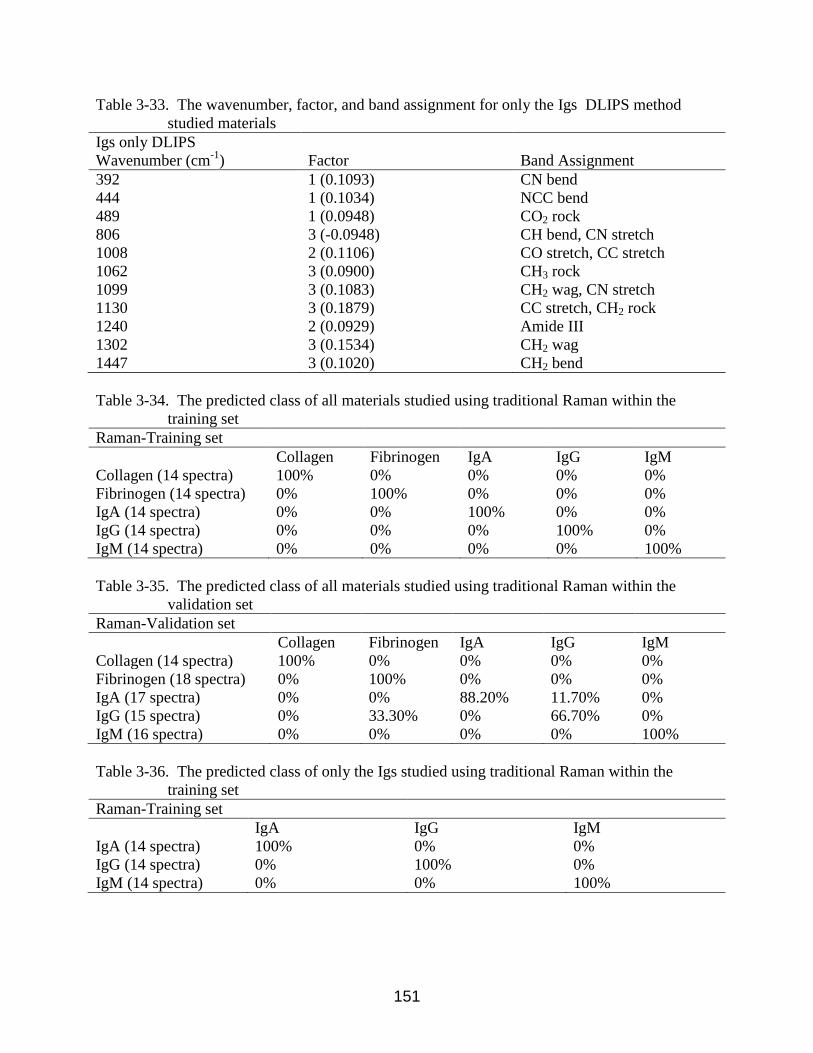
151
Table 3-33. The wavenumber, factor, and band assignment for only the Igs DLIPS method
studied materials
Igs only DLIPS
Wavenumber (cm-1
) Factor Band Assignment
392 1 (0.1093) CN bend
444 1 (0.1034) NCC bend
489 1 (0.0948) CO2 rock
806 3 (-0.0948) CH bend, CN stretch
1008 2 (0.1106) CO stretch, CC stretch
1062 3 (0.0900) CH3 rock
1099 3 (0.1083) CH2 wag, CN stretch
1130 3 (0.1879) CC stretch, CH2 rock
1240 2 (0.0929) Amide III
1302 3 (0.1534) CH2 wag
1447 3 (0.1020) CH2 bend
Table 3-34. The predicted class of all materials studied using traditional Raman within the
training set
Raman-Training set
Collagen Fibrinogen IgA IgG IgM
Collagen (14 spectra) 100% 0% 0% 0% 0%
Fibrinogen (14 spectra) 0% 100% 0% 0% 0%
IgA (14 spectra) 0% 0% 100% 0% 0%
IgG (14 spectra) 0% 0% 0% 100% 0%
IgM (14 spectra) 0% 0% 0% 0% 100%
Table 3-35. The predicted class of all materials studied using traditional Raman within the
validation set
Raman-Validation set
Collagen Fibrinogen IgA IgG IgM
Collagen (14 spectra) 100% 0% 0% 0% 0%
Fibrinogen (18 spectra) 0% 100% 0% 0% 0%
IgA (17 spectra) 0% 0% 88.20% 11.70% 0%
IgG (15 spectra) 0% 33.30% 0% 66.70% 0%
IgM (16 spectra) 0% 0% 0% 0% 100%
Table 3-36. The predicted class of only the Igs studied using traditional Raman within the
training set
Raman-Training set
IgA IgG IgM
IgA (14 spectra) 100% 0% 0%
IgG (14 spectra) 0% 100% 0%
IgM (14 spectra) 0% 0% 100%
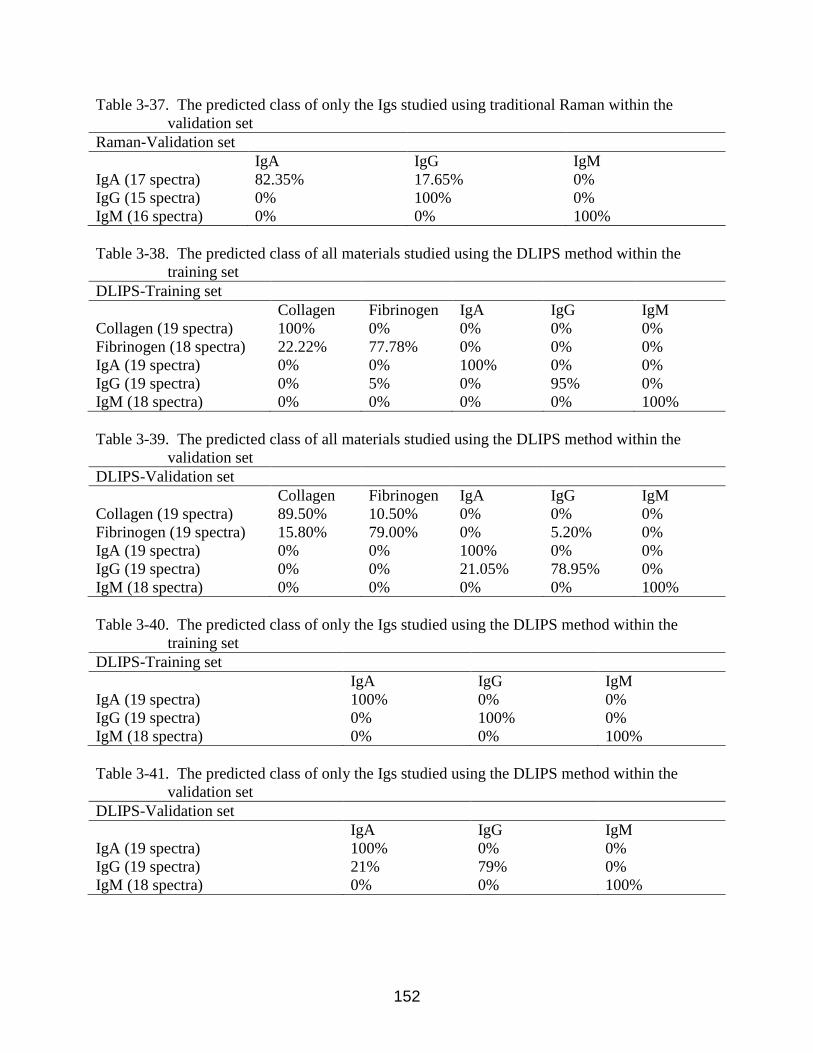
152
Table 3-37. The predicted class of only the Igs studied using traditional Raman within the
validation set
Raman-Validation set
IgA IgG IgM
IgA (17 spectra) 82.35% 17.65% 0%
IgG (15 spectra) 0% 100% 0%
IgM (16 spectra) 0% 0% 100%
Table 3-38. The predicted class of all materials studied using the DLIPS method within the
training set
DLIPS-Training set
Collagen Fibrinogen IgA IgG IgM
Collagen (19 spectra) 100% 0% 0% 0% 0%
Fibrinogen (18 spectra) 22.22% 77.78% 0% 0% 0%
IgA (19 spectra) 0% 0% 100% 0% 0%
IgG (19 spectra) 0% 5% 0% 95% 0%
IgM (18 spectra) 0% 0% 0% 0% 100%
Table 3-39. The predicted class of all materials studied using the DLIPS method within the
validation set
DLIPS-Validation set
Collagen Fibrinogen IgA IgG IgM
Collagen (19 spectra) 89.50% 10.50% 0% 0% 0%
Fibrinogen (19 spectra) 15.80% 79.00% 0% 5.20% 0%
IgA (19 spectra) 0% 0% 100% 0% 0%
IgG (19 spectra) 0% 0% 21.05% 78.95% 0%
IgM (18 spectra) 0% 0% 0% 0% 100%
Table 3-40. The predicted class of only the Igs studied using the DLIPS method within the
training set
DLIPS-Training set
IgA IgG IgM
IgA (19 spectra) 100% 0% 0%
IgG (19 spectra) 0% 100% 0%
IgM (18 spectra) 0% 0% 100%
Table 3-41. The predicted class of only the Igs studied using the DLIPS method within the
validation set
DLIPS-Validation set
IgA IgG IgM
IgA (19 spectra) 100% 0% 0%
IgG (19 spectra) 21% 79% 0%
IgM (18 spectra) 0% 0% 100%

153
Table 3-42. The value of the x-axis intercept of type IV collagen, fibrinogen, IgA, and IgG
Collagenous Material X-axis Intercept Wavelength (nm)
Type IV Collagen 390
Fibrinogen 500
IgA 420
IgG 450

154
CHAPTER 4
SUMMARY OF RESEARCH AND PROPOSAL OF FUTURE WORK
4.1. Summary of Research
The focus of this ongoing research is to analyze biological materials using the differential
laser-induced perturbation spectroscopy (DLIPS) technique. The DLIPS sensing scheme
incorporates three complementary techniques to improve upon previous fluorescence-based
biosensing strategies: laser-induced fluorescence emission or Raman scattering, ultraviolet (UV)
laser perturbation of the biological material, and difference spectroscopy. The intimate coupling
of the perturbing UV light source to the biological matrix molecular structures of abnormal tissue
(e.g. dysplastic precancerous cells) will respond differently than normal tissue structure. The
proposed technique of DLIPS examines differences in fluorescence response or Raman response
hence the resulting differential response will potentially avoid the major limitation of the current
biosensing schemes, namely the significant variations in the absolute optical response, as
generally observed in patient-to-patient populations. In summary, the DLIPS technique takes
advantage of the specificity of laser-tissue coupling in combination with difference spectroscopy
to offer an essential step forward in biodetection and/or bioimaging. Throughout this work, the
DLIPS sensing approach has provided significant enhancements in sensitivity and specificity,
which ultimately are necessary to function in real-world (i.e., complex backgrounds)
environments.
Traditional fluorescence and Raman-based biosensing schemes are intimately linked to
the local cellular structure. The strong fluorescence peak centered on 460 nm for the
fluorescence spectra recorded for the mice skin, can most reasonably be assigned to the tissue
fluorophore nicotinamide adenine dinucleotide (NADH). While this is an important tissue
fluorophore, and is a primary target of fluorescence tissue assessment, it serves as a marker of

155
increased cellular metabolism, which is a hallmark of dysplasia, but not necessarily unique to it.
In conjunction with increased cellular metabolism, one of the earliest markers of pre-cancerous
progression is cellular infiltration and the release of growth factors and cytokines. This
unchecked cellular signaling, results in the proliferation of fibroblasts, increased collagen
synthesis, and suppression of collagenase production, with the overall effect of restructuring the
local extra cellular matrix (ECM). These effects suggest that techniques which target collagen
remapping might provide direct diagnostic coupling of the spectra to the pathology. Hence in
principle the development of neoplastic disease and cellular change are potentially detectable in
the optical response.
However, the variability of the fluorescence and Raman response among patient
populations in real-world environments, as well as the often broadband nature of biological
fluorescence (i.e., spectrally broad and lacking in spectrally sharp features) has severely limited
their applicability to date. Significant patient-to-patient variation in fluorescent and optical
properties has been shown to be associated with race, age, sex, air temperature, and even
deformation of the tissue when applying the probe. Patient and sampling variability includes:
fluctuations in absolute emission intensity, emission peak shifts, and changes in the scattering
and absorption properties of the tissue, among other effects.
A truly new methodology that provides improved sensitivity and/or specificity is highly
desirable and could be used for in situ and in vivo cancer screening, detection of biological
pathogens for biodefense, as well as food (e.g. pathogen detection) and building safety. The
benefits of improved screening and earlier diagnosis are the promoting of earlier interdiction, and
therefore primary caregivers need new instruments and methods to continue pushing forward the
time lines for disease detection and diagnosis. Of particular utility are strategies that reduce the

156
need for highly trained personnel and healthcare infrastructure to support screening and
diagnosis, instead offering sample-to-answer capabilities at the point of care (POC).
In the DLIPS scheme, a combination of optical probing (e.g. fluorescence or Raman), UV
photochemical perturbation, and repeat optical probing to realize a powerful new spectral
dimension based on difference spectroscopy that will be strongly coupled to the local
biomolecular matrix thereby providing a differential response with expectations of enhanced
sensitivity and specificity. In this technique, the perturbation pulses from the deep-UV excimer
laser (193 nm, 6.4 eV) are strongly absorbed by biological tissue and while no direct ablation is
realized, a single photon of 193 nm radiation exceeds nearly all bond energies in the biological
matrix; hence permanent photochemistry is induced despite being below the critical photon flux
to affect material removal. The permanent alteration of the underlying material structure will
result in changes within the fluorescence spectrum, specifically with respect to photoreactive
biomolecules. The perturbation pulses are used to cleave molecular bonds and the irradiation of
biological matrices at 193 nm can cause photoionization, including strand breakage, locally
denatured sites, interstrand cross-linking, reactions via photo-hydrates, π-dimers, and other
products.
In summary of the DLIPS technique, this method may mitigate unwanted contributions
from unperturbed biological material fluorophores, broadband fluorescence, and importantly,
variations in fluorescence emission bands which are unique to the patient, but not necessarily to
the targeted pathology. The complexity of the local fluorescence environment provides the
opportunity for the perturbing UV radiation to affect a unique change to the resulting
fluorescence or Raman response. Also, the specificity of coupling to important photosensitive
157
biomarkers of early pathological changes has promise to mitigate the substantial noise due to
inter-patient variations.
In summary, the work reported here has demonstrated that the biological matrix (collagen
and amino acids) have been altered by low intensity ultraviolet radiation (primarily 193 nm) such
that the resulting fluorescence and Raman scatter properties are perturbed. Probing the biomatrix
with fluorescence monitoring both before and after perturbation with the deep UV light source
affords the opportunity to look for a differential response (i.e., difference spectroscopy), as
demonstrated in an amino acids, a collagenous materials, and an animal model study. The
spectral regions where the fluorescence signal was particularly enhanced or suppressed due to
excimer perturbation, for each of the above studies, were assigned to a particular biological
fluorophores found in the literature.
For each amino acid studied, a distinctive spectral shape has immerged. Before 430 nm,
another effect occurs in the DLIPS spectra of glycine-glycine, L-alanine-glycine and glycine-L-
proline. The slope of glycine-L-proline decreases from 380 nm- 420 nm, while the slopes of
glycine-glycine and L-alanine-glycine increases. Also, in comparing all absolute Raman
preperturbation spectra, glycine-glycine and L-alanine-glycine had a common band that occurred
at 1260 cm-1
with the band assigned to a CC stretch and a CO bend. Glycine-glycine and L-
alanine-glycine, also showed to have a significant DLIPS value associated with an Amide III.
Therefore, the increasing slope of glycine-glycine and L-alanine-glycine DLIPS spectra from
380 nm thru 420 nm may be attributed to the CC stretch and CO bend that occurs at 1260 cm-1
or
the Amide III which had a significant DLIPS value associated with it, both of which did not
occur in glycine-L-proline. The decreasing slope of glycine-L-proline from 380 nm thru 420 nm
could also be attributed to a CH2 bend, a CH2 wag and/or a NH3 symmetric bend, all of which

158
were present in the absolute Raman preperturbation spectrum and have a significant DLIPS
value in glycine-L-proline alone.
In the amino acids study, when comparing the DLIPS spectra of the dipeptides with their
peptide counterparts, it can be seen that the slopes after 430 nm, of L-alanine-glycine, glycine-
glycine, and glycine-L-proline are less than L-alanine, glycine, and L-proline. Again, in
comparing these two groups, the absolute Raman preperturbation spectra of glycine-glycine, L-
alanine-glycine, and glycine-L-proline showed a common bond that occurs at 1665 cm-1
and is
assigned to a C=O stretch and a NH2 bend that was not present in L-alanine, L-proline, or
glycine. In addition, the glycine-L-proline and L-alanine-glycine absolute Raman preperturbation
spectra shared a common band at 924 cm-1
, which is assigned to a CC stretch and a CN bend.
Therefore, the reason for the dipeptides having smaller positive slopes after 430 nm than the
peptides may be because of the common bond that occurs at 1665 cm-1
and is assigned to a C=O
stretch and a NH2 in the dipeptides.
In the studied collagenous and related biological materials, the DLIPS spectrum of IgM,
which occurs at a much higher intensity and with a completely different spectral shape than the
other studied collagenous material, may be attributed to the specific band wavenumbers and
assignments that were only found in IgM. Those are a CC bend that occurs at 422 cm-1
, a CN
stretch that occurs at 524 cm-1
, and a CH bend and a CN stretch that occurs at 806 cm-1
, and a
CC stretch that occurs at 920 cm-1
, a CH bend and a CN stretch that occurs at 1035 cm-1
, a CN
stretch that occurs at 1156 cm-1
, an Amide III that occurs at 1260 cm-1
, an Amide II that occurs at
1480 cm-1
, and a C=O stretch and CO2 asymmetric stretch that occurs at 1594 cm-1
. However, it
should also be noted that IgM films used in this study was the only collagenous material studied

159
which was diluted to a 1:10 ratio to deionized water (1:1 ratio to deionized water was used for all
others presented in this study).
As mentioned above, the DLIPS spectra of the studied collagenous material seem to
follow a similar pattern occurring at different intensities, except for IgM which occurs at a much
higher intensity with a completely different spectral shape. The cause of this specific pattern may
be related to specific wavenumber and band assignments of molecules found only in type IV
collagen, fibrinogen, IgA and IgG. Those bands are a CN bend that occurs at 394 cm-1, a NH2
rock that occurs at 735 cm-1, and a CN stretch and NH3 bend that occurs at 1392 cm-1.
Interestingly, also in the collagenous materials study, the x-axis intercept of the DLIPS
spectra of type IV collagen, fibrinogen, IgA and IgG, (i.e., were the intensity changed from
negative to positive), was unique. Therefore, the x-axis intercepts of the DLIPS spectra could be
used as a means of differentiation. The cause of the different x-axis intercepts may be attributed
to a CH bend and CN stretch that occurs at 1139 cm-1
, which was only seen in fibrinogen, a CC
stretch that occurs at 1227 cm-1
, which was only seen in IgA, or to an Amide I and C=O stretch
at 1676 cm-1
, which was only observed in IgG.
In the animal model study, a promising preliminary evaluation of DLIPS for the in vivo
detection of disease was presented. DLIPS has shown to offer a new source of unique
information and serves as a convenient probe for ECM structure that was previously inaccessible
when exciting natural fluorescence at 355 nm, as it has been noted that at this excitation
wavelength it is not possible to resolve collagen fluorescence from that of NADH. Of particular
note were the findings that the DLIPS spectra emphasize different spectral regions and the
endogenous pathology detection potential for DLIPS showed superior performance. The DLIPS
technique coupled specifically to morphological changes in the ECM, which is unique compared

160
to laser-induced fluorescence. It was demonstrated that this technique is primarily sensitive to
changes induced by the pathology model.
In summary, these findings show preliminary support for applying this technique as a
stand-alone medical diagnostic tool or as a complementary technique to traditional fluorescence
or Raman spectroscopy for the early detection of biological material changes in vivo. However,
in pursuit of fully understanding the DLIPS spectra response, its assignments, and its diagnostic
merit, further investigation using DLIPS will be necessary. Association of all parts of a
biological materials absolute preperturbation Raman spectrum, which shows the molecular
structure, with all parts of its corresponding DLIPS spectrum would give a complete picture of
the biological materials photochemical response as well as creating a method of comparing and
contrasting similar biological material DLIPS spectra.
4.2. Proposal of Future Work
The long-term vision for this work is to develop the DLIPS technology into a clinical
system that impacts disease morbidity and mortality by facilitating earlier, non-invasive
diagnosis and staging of diseases. Specifically, the future work proposed here is to develop and
test the DLIPS system as well as continue to push the technology to other spectral domains,
further investigate the fluorophores responsible for the spectral changes under DLIPS detection,
therefore, increasing the amount of information obtained about the interrogated biological
material.
To accomplish these goals, the proposed future work includes the refinement of this
technique in animal and collagen-based material studies, through the introduction of in situ
Raman spectroscopy, a fiber probe, and a tunable laser into the DLIPS scheme.
Through the introduction of in situ Raman spectroscopy into the DLIPS scheme, a
specimen could be analyzed using Raman spectroscopy in the exact location as the specimen is

161
perturbed. This would mean that the pre and postperturbation Raman spectra represent the effect
on exact same area (i.e., some ensemble of molecules) before and after it is perturbed. In the
current Raman DLIPS scheme, the specimen is moved in between the pre and postperturbation
spectra which create difficulties in spot realignment.
The current laser-material interface will be transformed to allow for minimally invasive
sensing of biological material. Especially for future animal studies, a fiber probe must be custom
designed and manufactured for the DLIPS scheme and applications. The fiber probe must be
capable of detection and excitation, as well as a probe composition of fibers that are capable of
transmitting deep-UV radiation down to a value of 193 nm. Typically, standard optical probes
are composed of silica fibers and radiation below 300 nm (deep-UV) degrades there
transmission. As transmission degrades, the light absorption in the fiber increases and data loses
validity. Also, the excitation energy should be directed to the region in front of the detection
fiber to insure that the region of overlap between the excitation and emission fibers is optimized,
resulting in the complete detection of all emissions. To maximize the UV throughput, the probe
length should be as short as the assembly allows. The fiber housing materials and adhesives
should also be considered in designing the probe. Ocean Optics sells an Xtreme Solarization-
resistance optical fiber (XSR) which has silica-core fibers that are doped with fluorine to
mitigate the solarizing effects of UV radiation and provides a customizing option in probe fibers.
Therefore, a custom fiber probe can be manufactured to these specifications in a timely manner.
A tunable laser is a laser in which the output wavelength can be changed. Adding a
tunable laser to the DLIPS system will result in extending the biosensing capabilities of the
DLIPS technique. The emission intensities can now be a function of excitation wavelength a
function of emission wavelength or in an emission map, a function of excitation and emission

162
wavelengths. Because the excitation/emission wavelength pair is a combination of the molecular
structure and the overall molecular environment (e.g. biological matrix), the DLIPS fluorescence
spectra, when compared over a range of excitation wavelengths may provide an additional
method for discrimination among biological materials or increase the abilities of the current
DLIPS technique.
In addition, for the DLIPS with a Raman probe, careful analysis of the peak position
should also be performed. For example, the 897 cm-1
peak of glycine in Figure 3-26 shows a
structure suggesting a true peak shift. Such peak shifts may reveal additional new information
about the perturbations, and may have diagnostic information themselves.
Finally, in addition to using PCA analysis for classification and for identification of
bond-cleavage, as done in this work, PCA could be explored for quantitative analysis of targeted
species. For example, can IgA be isolated at different concentration levels in a collagen matrix.
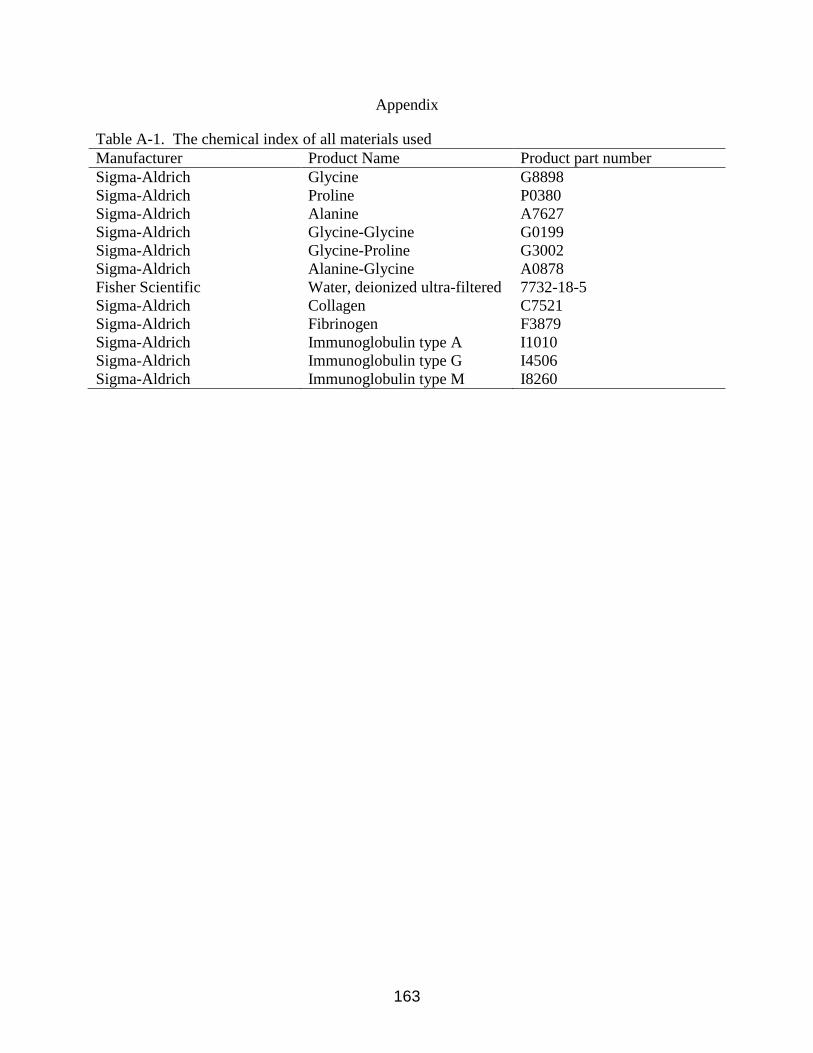
163
Appendix
Table A-1. The chemical index of all materials used
Manufacturer Product Name Product part number
Sigma-Aldrich Glycine G8898
Sigma-Aldrich Proline P0380
Sigma-Aldrich Alanine A7627
Sigma-Aldrich Glycine-Glycine G0199
Sigma-Aldrich Glycine-Proline G3002
Sigma-Aldrich Alanine-Glycine A0878
Fisher Scientific Water, deionized ultra-filtered 7732-18-5
Sigma-Aldrich Collagen C7521
Sigma-Aldrich Fibrinogen F3879
Sigma-Aldrich Immunoglobulin type A I1010
Sigma-Aldrich Immunoglobulin type G I4506
Sigma-Aldrich Immunoglobulin type M I8260

164
LIST OF REFERENCES
Alfano, R., Tata, D., Cordero, J., Tomashefsky, P., Longo, F., Alfano, M., "Laser induced
fluorescence spectroscopy from native cancerous and normal tissue," Journal of Quantum
Electronics 20, 1507-1511 (1984).
Apitz, I., Vogel, A., “Material ejection in nanosecond Er:YAG laser ablation of water, liver, and
skin,” Applied Physics A 81, 329-338 (2005).
Arnold, N., Bityurin, N., “Model for laser-induced thermal degradation and ablation of
polymers,” Applied Physics A 68, 615-625 (1999).
Arnold, J., Dwek, R., Rudd, P., Sim, R., “Mannan binding lectin and its interaction with
immunoglobulins in health and in disease,” Immunology Letters 106, 103-110 (2006).
Asher, S., Ludwig, M., Johnson, C., “UV resonance Raman excitation profiles of the aromatic
amino acids,” Journal of American Chemical Society 108, 3186-3197 (1986).
Badawi, H., “Structural stability, C-N internal rotations and vibrational spectral analysis of non-
planar phenylurea and phenylthiourea,” Spectrochimica Acta Part A. Molecular and
Biomolecular Spectroscopy 72, 523-527 (2008).
Bailey, A., Paul, R., Knott, L., "Mechanisms of maturation and ageing of collagen," Mechanisms
of Aging and Development 106, 1-56 (1998).
Bakker, H., Imhof, J., Mul, N., Ballieux, R., “Disbalance of immunoglobulins the clinical
importance of increased serum levels of immunoglobulin –A and –G in combination with normal
or diminished immunoglobulin –M concentrations,” Clinica Chimica Acta 16, 195-198 (1967).
Barth, A., “The infrared absorption of amino acid side chains,” Progress in Biophysics and
Molecular Biology 74, 141-173 (2000).
Bhartia, R., Hug, W., Salas, E., Reid, R., Sijapati, K., Tsapin, A., Abbey, W., Nealson, K., Lane,
A., Conrad, P., "Classification of organic and biological material with deep ultraviolet
excitation," Journal of Applied Spectroscopy 62, 1070-1077 (2008).
Bieroza, M., Baker, A., Bridgeman, J., “Assessment of low pH coagulation performance using
fluorescence spectroscopy,” Journal of Environmental Engineering 137, 596-601 (2011).
Birdwell, J., Valsara, K., “Characterization of dissolved organic matter in fogwater by excitation-
emission matrix fluorescence spectroscopy,” Atmospheric Environment 44, 3246-3253 (2010).
Bottiroli, G., Croce, A., Locatelli, D., Marchesini, R., Pignoli, E., Tomatis, S., Cuzzoni, C.,
DiPalma, S., Dalfante, M., Spinelli, P., "Natural fluorescence of normal and neoplastic human
colon: A comprehensive “ex vivo” study," Lasers in Surgery and Medicine 16, 48-60 (1995).

165
Brookner, C., Utzinger, U., Follen, M., Richards-Kortum, R., Cox, D., Atkinson, E., "Effects of
biographical variables on cervical fluorescence emission spectra," Journal of Biomedical Optics
8, 479-483 (2003).
Brownstein, M., Hoffman, R., Levenson, R., Milner, T., Dowell, M., Williams, P., White, G.,
Gaigalas, A., Hwang, J., "Biophotonic Tools in Cell and Tissue Diagnostics," Journal of
Research of the National Institute of Standards and Technology 112, 139-152 (2007).
Budhavaram, N., Barone, J., “Quantifying amino acid and protein substitution using Raman
spectroscopy,” Journal of Raman Spectroscopy 42, 355-362 (2011).
Budesinsky, M., Danecek, P., Bednarova, L., Kapitan, J., Baumruk, V., Bour, P., “Comparison
of quantitative conformer analyses by nuclear magnetic resonance and Raman optical activity for
model dipeptides,” Journal of Physical Chemistry A 112, 8633-8640 (2008).
Budesinsky, M., Sebestik, J., Bednarova, L., Baumruk, V., Safarik, M., Bour, P.,
“Conformational properties of the Pro-Gly motif in the D-Ala-L-Pro-Gly-D-Ala model peptide
explored by a statistical analysis of the NMR, Raman, and Raman optical activity spectra,”
Journal of Organic Chemistry 73, 1481-1489 (2008).
Calabro, K., Curtis, A., Galarneau, J., Krucker, T., Bigio, I., "Gender variations in the optical
properties of skin in murine animal models," Journal of Biomedical Optics 16, 011008 (2011).
Calvert, J., Pitts, Jr., J., Photochemistry. New York: John Wiley and Sons, Inc., 1966.
Carletti, P., Roldan, M., Francioso, O., Nardi, S., Sanchez-Cortes, S., “Structural characterization
of humic-like substances with conventional and surface-enhanced spectroscopic techniques,”
Journal of Molecular Structure 982, 169-175 (2010).
Chakravarti, D., Pelling, J., Cavalieri, E., Rogan, E., "Relating aromatic hydrocarbon-induced
DNA adducts and c-H-ras mutations in mouse skin papillomas: The role of apurinic sites,"
Proceedings of the National Academy of Science 92, 10422-10426 (1995).
Chang, R., General Chemistry. New York: McGraw-Hill Companies Inc., 2003.
Chatterjee, B., Kang, D., Herceg, E., Trenary, M., “Comparison of experimental and calculated
infrared spectra of aminocarbynes on the Pt(111) surface,” Journal of Chemical Physics
119,10930-10941 (2003).
Chen, R., Chadwick, D., Lieberman, S., “The application of time-resolved spectrofluorometry to
measuring benthic fluxes of organic compounds,” Organic Geochemistry 26, 67-77 (1997).
Chen, W., Barteles, K., Liu, H., Nordquist, R., “Laser-photothermal effect on skin tissue-
damage and recovery,” Journal of X-Ray Science and Technology 14, 207-216 (2006).

166
Chen, X., Li, P., Holtz, J., Chi, Z., Pajcini, V., Asher, S., Kelly, L., “Resonance Raman
examination of the electronic excited state of glycglycing and other dipeptides: Observation of a
carboxylate amide charge transfer transition,” Journal of American Chemical Society 118,
9705-9715 (1996).
Cheng, W., Lui, M., “Micro-Raman spectroscopy used to identify and grade human skin
pilomatrixoma,” Microscopy Research and Technique, 68, 75-79 (2005).
Chwirot, B., Kowalska, M., Sypniewska, N., Michniewicz, Z., Gradziel, M., "Spectrally resolved
fluorescence imaging of human colonic adenomas," Journal of Photochemistry and Photobiology
B: Biology 50, 174-183 (1999).
Coghlan, L., Utzinger, U., Drezek, R., Heintzelmann, D., Zuluaga, A., Brookner, C., Richards-
Kortum, R., Gimenez-Conti, I., Follen, M., "Optimal fluorescence excitation wavelengths for
detection of squamous intra-epithelial neoplasia: results from an animal model," Optics Express
7, 436-446 (2000).
Coghlan, L., Utzinger, U., Richards-Kortum, R., Brookner, C., Zuluaga, A., Gimenez-Conti, I.,
Follen, M., "Fluorescence Spectroscopy of Epithelial Tissue Throughout the Dysplasia-
Carcinoma Sequence in an Animal Model: Spectroscopic Changes Precede Morphologic
Changes," Lasers in Surgery and Medicine 29, 1-10 (2001).
Cory, R., McKnight, D., “Fluorescence spectroscopy reveals ubiquitous presence of oxidized and
reduced quinones in dissolved organic matter,” Environmental Science and Technology 39,
8142-8148 (2005).
Culka, A., Jehlicka, J., Edwards, H., “Acquisition of Raman spectra of amino acids using
portable instruments: Outdoor measurements and comparison,” Spectrochimica Acta Part A 77,
978-983 (2010).
Diagaradjane, P., Yaseen, M., Yu, J., Wong, M., Anvari, B., "Autofluorescence Characterization
for the Early Diagnosis of Neoplastic Changes in DMBA/TPA-Induced Mouse Skin
Carcinogenesis," Lasers in Surgery and Medicine 37, 382-395 (2005).
Dong, J., Wan, Z., Chu, Y., Nakagawa, S., Katsoyannis, P., Weiss, M., Carey, P., “Isotope-edited
Raman spectroscopy of proteins: A general strategy to probe individual peptide bonds with
application to insulin,” Journal of American Chemical Society 123, 7919-7929 (2001).
Doose, S., Neuweiler, H., Sauer, M., “Fluorescence quenching by photoinduced electron
transfer: a report for conformational dynamics of macromolecules,” Chemphyschem: A
European Journal of Chemical Physics and Physical Chemistry 10, 1389-1398 (2009).
Drezek, R., Sokolov, K., Utzinger, U., Boiko, I., Malpica, A., Follen, M., Richards-Kortum, R.,
"Understanding the contributions of NADH and collagen to cervical tissue fluorescence spectra:
Modeling, measurements, and implications," Journal of Biomedical Optics 6, 385-396 (2001).

167
Edidin, M., Zagyansky, Y., Lardner, T., “Measurement of membrane protein lateral diffusion in
single cells,” Science 191, 466-468 (1976).
Eichhorn, R., "Early diagnosis of melanotic melanoma based on laser-induced melanin
fluorescence," Journal of Biomedical Optics 14, 33-34 (2009).
Eker, C., Rydell, R., Svanberg, K., Andersson-Engels, S., "Multivariate analysis of laryngeal
fluorescence spectra recorded in vivo," Lasers in Surgery and Medicine 28, 259-266 (2001).
Engelhard, M., Gerwert, K., Hess, B., Kreutz, W., Siebert, F., “Light-driven protonation changes
of internal aspartic acids of bacteriorhodopsin: An investigation by static and time-resolved
infrared difference spectroscopy using [4-13
C]aspartic acid labeled purple membrane,” Journal of
Biochemistry 24, 400-408 (1985).
Fox, J., Tu, A., Hruby, V., Mosberg, H., “Raman study of crystalline peptides containing β
turns,” Journal of Biochemistry and Biophysics 221, 628-631 (1981).
Funovics, M., Weissleder, R., Mahmood, U., "Catheter-based in Vivo Imaging of Enzyme
Activity and Gene Expression: Feasibility Study in Mice1," Radiology 231, 659-666 (2004).
Gelder, J., Gussem, K., Vandenabeele, P., Moens, L., “Reference database of Raman spectra of
biological molecules,” Journal of Raman Spectroscopy 38, 1133-1147 (2007).
Goletz, C., Wagner, M., Grubel, A., Schmidt, W., Korf, N., Wermer, P., “Standardization of
fluorescence excitation-emission-matrices in aquatic milieu,” Talanta 85, 650-656 (2011).
Gordon, G., Berry, G., Liang, X., Levine, B., Herman, B., “Quantitative fluorescence resonance
energy transfer measurements using fluorescence microscopy,” Biophysical Journal 74, 2702-
2713 (1998).
Gorner, H., "Photochemistry of DNA and related biomolecules: quantum yields and
consequences of photoionization," Journal of Photochemistry and Photobiology 26, 117-139
(1994).
Gortzak-Uzan, L., Jimenez, W., Nofech-Mozes, S., Ismiil, N., Khalifa, M., Dube, V., Rosen, B.,
Murphy, J., Laframboise, S., Covens, A., "Sentinel lymph node biopsy vs. pelvic
lymphadenectomy in early stage cervical cancer: Is it time to change the gold standard?,"
Gynecologic Oncology 116, 28-32 (2010).
Gniadecka, M., Wulf, H., “Diagnosis of basal cell carcinoma by Raman spectroscopy,” Journal
of Raman Spectroscopy 28, 125-129 (1997).
Grdadolnik, J., Grdadolnik, S., Avbelj, F., “Determination of conformational preferences of
dipeptides using vibrational spectroscopy,” Journal of Physical Chemistry Part B 112, 2712-2718
(2008).

168
Grossman, W., “Raman spectroscopy,” Analytical Chemistry 48, 261-268 (1976).
Hahn, D., Omenetto, N., “Laser-induced breakdown spectroscopy (LIBS), Part I: Review of
basic diagnostic and plasma-particle interactions: Still-challenging issues within the analytical
plasma community,” Applied Spectroscopy 64, 336A-366A (2010).
Haque, M., Harris, M., Meghji, S., Barrett, A., "Immunolocalization of cytokines and growth
factors in oral submucous fibrosis," Cytokine 10, 713-719 (1998).
Haringsma, J., Tytgat, G., "Fluorescence and autofluorescence," Bailliere's Clinical
Gastroenterology 13, 1-10 (1999).
He, X., Xi, B., Wei, Z., Jiang, Y., Yang, Y., An, D., Cao, J., Liu, H., “Fluorescence excitation-
emission matrix spectroscopy with regional integration analysis for characterizing composition
and transformation of dissolved organic matter in landfill leachates,” Journal of Hazardous
Materials 190, 293-299 (2011).
Hernandez, B., Pfluger, F., Nsangou, M., Ghomi, M., “Vibrational analysis of amino acids and
short peptides in hydrated media. IV. Amino acids with hydrophobic side chains: L-alanine, L-
valine, and L-isoleucine,” Journal of Physical Chemistry Part B 113, 3169-3178 (2009).
Holtz, J., Li, P., Asher, S., “UV resonance Raman studies of Cis-to-Trans isomerization of gly-
cy-glycine derivatives,” Journal of American Chemical Society 121, 3762-3766 (1999).
Horneffer, V., Linz, N., Vogel, A., “Principles of laser-induced separation and transport of living
cells,” Journal of Biomedical Optics 12, 054016 (2007).
Huang, T., McWilliams, Z., “Near-infrared Raman spectroscopy for optical diagnosis of lung
cancer,” International Journal of Cancer 107, 047-1052 (2003).
Hudson, B., Reedere, S., Tryggvason, K., “Type IV Collagen: Structure, Gene Organization, and
Role in Human Diseases,” Journal of Biological Chemistry 268, 26033-26036 (1992).
Jalsovszky, G., Holly, S., “Vibrational analysis of the dipeptides containing alanine and serine,”
Vibrational Spectroscopy 8, 279-291 (1995).
Jares-Erijman, E., Jovin, T., “FRET imaging,” Nature Biotechnology 21, 1387-1395 (2003).
Jenkins, A., Larsen, R., Williams, T., “Characterization of amino acids using Raman
spectroscopy,” Spectrochimica Acta Part A 61, 1585-1594 (2005).
Jesneck, J., Nolte, L., Baker, J., Floyd, C., Lo, J., "Optimized approach to decision fusion of
heterogeneous data for breast cancer diagnosis," Journal of Medical Physics 33, 2945-2954
(2006).

169
Jhan, J., Chang, W., Chen, H., Lee, Y., Wu, M., Chen, C., Liau, I., “Integrated multiple multi-
photon imaging and Raman spectroscopy for characterizing structure-constituent correlation of
tissues,” Optics Express 16, 16431-16442 (2008).
Journee-de, J., Keunen, J., “Thermotherapy in the management of choroidal melanoma,”
Progress in Retinal and Eye Research 21, 303-317 (2002).
Kaminaka, S., Yamazaki, H., “Near-infrared multichannel Raman spectroscopy toward real-time
in vivo cancer diagnosis,” Journal of Raman Spectroscopy 33, 498-502 (2002).
Kaneta, T., Maeda, H., Miyazaki, M., Miyake, R., Izaki, H., Sakoda, Y., Kinoshita, S., Imasaka,
T., “Determination of amino acids in urine by cyclodextrin-modified capillary electrophoresis-
laser-induced fluorescence detection,” Journal of Chromatographic Science 46, 712-716 (2008).
Kim, G., Kim, H., “Highly selective and sensitive fluorescence turn-on probe for proline,”
Tetrahedron Letters 51, 4670-4672 (2010).
Kim, J., Son, C., Jeon, Y., Choe, W., “Synthesis and characterization of poly(aspartic acid)
derivatives conjugated with various amino acids,” Journal of Polymer Research 18, 881-890
(2011).
Kitai, M., Popkov, V., Semchischen, V., Kharizov, A., “The physics of UV laser cornea
ablation,” Journal of Quantum Electronics 27, 302-307 (1991).
Kleinsmith, L., Principles of Cancer Biology. San Francisco: Pearson Education, Inc., 2006.
Knappe, V., Frank, F., Rohde, E., “Principles of lasers and biophotonic effects,” Photomedicine
and Laser Surgery 22, 411-417 (2004).
Kollias, N., Gillies, R., Moran, M., Kochevar, I., Anderson, R., "Endogenous Skin Fluorescence
Includes Bands that may Serve as Quantitative Markers of Aging and Photoaging," The Journal
of Investigative Dermatology 111, 776-780 (1998).
Kollias, N., Zonios, G., Stamatas, G., "Fluorescence spectroscopy of skin," Vibrational
Spectroscopy 28, 17-23 (2002).
Koller, T., Iseli, H., Donitzky, C., Ing, D., Papadopoulos, N., Seiler, T., “Topography-guided
surface ablation for Forme Fruste Keratoconus,” Ophthalmology 113, 2198-2202 (2006).
Koppel, D., Axelrod, D., Schiessinger, J., Elson, E., Webb, W., “Dynamics of fluorescence
marker concentration as a probe of mobility,” Biophysical Journal 16, 1315-1329 (1976).
Kozikowski, R., Lee, J., Sorg, B., Smith, S., Hahn, D., Castleman, W., “ Comparative evaluation
of differential laser-induced perturbation spectroscopy as a technique to discriminate emerging
skin pathology,” Journal of Biomedical Optics 17, 67-79 (2012).

170
Kuper, S., Modaressi, S., Stuke, M., “Photofragmentation pathways of a PMMA model-
Compound under UV Excimer laser ablation conditions,” Journal of Physical Chemistry 94,
7514-7518 (1990).
Lagant, P., Loucheux-Lefebvre, M., “Raman spectra and normal vibrations of dipeptides. I.
Glycylglycine,” Journal of Biopolymers 22, 1267-1283 (1983).
Lagant, P., Loucheux-Lefebvre, M., “Raman spectra and normal vibrations of dipeptides. II.
Glycyl-L-Proline,” Journal of Biopolymers 22, 1285-1300 (1983).
Lagant, P., Vergoten, G., Fleury, G., Loucheux-Lefebvre, M., “Raman spectroscopy and normal
vibrations of peptides,” European Journal of Biochemistry 139, 137-148 (1984).
Lakowicz, J., Principles of Fluorescence Spectroscopy (Springer, New York, 2006).
Lam, C., Chui, S., Leung, N., Li, E., Lai, K., “Light chain ratios of serum immunoglobulins in
disease,” Clinical Biochemistry 24, 283-287 (1991).
Lerouge, F., Ferrer-Ugalde, A., Vinas, C., Teixidor, F., Sillanpaa, R., Abreu, A., Xochitiotzi, E.,
Farfan, N., Santillan, R., Nunez, R., “Synthesis and fluorescence emission of neutral and anionic
di- and tetra-carboranyl compounds,” Dalton Transactions 40, 7541-7550 (2011).
Li, F., Cao, Q., Lu, Y., Xue, G., “The FT-Raman study of 4-aminophenyl ammonium
dithiocabamate adsorption state on different silver surface,” Spectroscopy Letters 30, 451-458
(1997).
Li, X., Eckard, J., Shah, R., Malluck, C., Frenkel, K., "Interleukin-1alpha Up-Regulation In Vivo
by a Potent Carcinogen 7,12-Dimethylbenz(a)anthracene (DMBA) and Control of DMBA-
induced Inflammatory Responses," Cancer Research 62, 417-423 (2002).
Liu, Q., Grant, G., Vo-Dinh, T., “Investigation of synchronous fluorescence method in
multicomponent analysis in tissue,” Journal of Selected Topics in Quantum Electronics 16, 927-
940 (2010).
Macaskill, A., Chernonosov, A., Koval, V., Lukyanets, E., Fedorova, O., Smith, W., Faulds, K.,
Graham, D., “Quantitative surface-enhanced resonance Raman scattering of phthalocyanine-
labeled oligonucleotides,” Nucleic Acids Research 35, 1-6 (2007).
Mahadevan, A., Mitchell, M., Silva, E., Thomsen, S., Richards-Kortum, R., "Study of the
fluorescence properties of normal and neoplastic human cervical tissue," Lasers in Surgery and
Medicine 13, 647-655 (1993).
Mansfield, S., Gotch, A., Harms, G., Johnson, C., Larive, C., “Complementary analysis of
peptide aggregation by NMR and time-resolved laser spectroscopy,” Journal of Physical
Chemistry 103, 2262-2269 (1999).
171
Martin, S., Wood, A., McRobbie, M., Mazilu, M., McDonald, M., Samuel, I., Herrington, C.,
"Fluorescence spectroscopy of an in vitro model of human cervical precancer identifies
neoplastic phenotype," International Journal of Cancer 120, 1964-1970 (2007).
Massin, J., Dayoub, W., Mulatier, J., Aronica, C., Bretonniere, Y., Andraud, C., “Near-infrared
solid-state emitters based on isophorone: Synthesis, crystal structure and spectroscopic
properties,” Chemistry of Materials 23, 862-873 (2011).
Matthews, Q., Jirasek, A., Lum, J., Duan, X., Brolo, A., “Variability in Raman spectra of single
human tumor cells cultured in vitro: correlation with cell cycle and culture confluency,” Applied
Spectroscopy 64, 871-887 (2010).
Meyer, A., Meyer, B., Morrison, J., Pepler, W., "Calcium, Collagen, Elastin and hexosamine
levels in the arteries of whites and Bantu," South African Medical Journal 39, 1017-1020 (1965).
Miller, J., “Some recent advances in fluorescence spectroscopy,” Analytical Letters 39, 851-862
(2006).
Miomandre, F., LePicier, E., Munteanu, S., Galangau, O., Audibert, J., Meallet-Renault, R.,
Audebert, P., Pansu, R., “Electrochemical monitoring of the fluorescence emission of tetrazine
and bodipy dyes using total internal reflection fluorescence microscopy coupled to
electrochemistry,” Applied Materials and Interfaces 3, 690-696 (2011).
Mitchell, M., Cantor, S., Ramanujam, N., Tortolero-Luna, G., Richards-Kortum, R.,
"Fluorescence Spectroscopy for Diagnosis of Squamous Intraepithelial Lesions of the Cervix,"
Obstetrics & Gynecology 93, 462-470 (1999).
Moragas, A., Garcia-Bonafe, M., Sans, M., Toran, N., Huguet, P., Martin-Plata, C., "Image
analysis of dermal collagen changes during skin aging," Analytical and Quantitative Cytology
and Histology 20, 493-499 (1998).
Moreira, L., Silvira Jr., L., Santos, F., Lyon, J., Rocka, R., Zangaro, R., Villaverde, A., Pacheco,
M., “Raman spectroscopy: A powerful technique for biochemical analysis and diagnosis,”
Spectroscopy: An International Journal 22, 1-19 (2008).
Movasaghi, Z., Rehman, S., Rehman, I., “Raman Spectroscopy of Biological Tissues,” Applied
Spectroscopy Reviews 46, 492-542 (2005).
Murli, C., Sharma, S., Karmakar, S., Sikka, S., “α-Glycine under high pressures: a Raman
scattering study,” Physica Part B 339, 23-30 (2003).
Nelson, M., Futscher, B., Kinsella, T., Wymer, J., Bowden, G., "Detection of mutant Ha-ras
genes in chemically initiated mouse skin epidermis before the development of benign tumors,"
Proceedings of the National Academy of Science 92, 6398-6402 (1992).
Niemz, M., Laser-Tissue Interactions. Germany: Springer-Verlag Berlin Heidelberg, 1996.
172
Palaniappan, P., Pramod, K., “Raman spectroscopic investigation on the microenvironment of
the liver tissue of zebrafish (danio rerio) due to titanium dioxide exposure,” Vibrational
Spectroscopy 56, 146-153 (2011).
Palmer, G., Zhu, C., Breslin, T., Xu, F., Gilchrist, K., Ramanujam, N., "Comparison of
Multiexcitation Fluorescence and Diffuse Reflectance Spectroscopy for the Diagnosis of Breast
Cancer," Biomedical Engineering Transactions 50, 1233-1242 (2003).
Pajcini, V., Chen, X., Bormett, R., Geib, S., Li, P., Asher, S., Lidiak, E., “Gly-cly-glycine Pi-Pi*
acid charge-transfer transition-moment orientations- near-resonance Raman single-crystal
measurements,” Journal of American Chemical Society 118, 9716-9726 (1996).
Pathak, I., Davis, N., Hsiang, Y., Quenville, N., Palcic, B., "Detection of squamous neoplasia by
fluorescence imaging comparing porfimer sodium fluorescence to tissue autofluorescence in the
hamster cheek-pouch model," American Journal of Surgery 170, 423-426 (1995).
Pedrotti, F., Pedrotti, L., Introduction to Optics. New Jersey: Prentice-Hall Inc., 1987.
Peiris, B., Budman, H., Moresoli, C., Legge, R., “Acquiring reproducible fluorescence spectra of
dissolved organic matter at very low concentrations,” Water Science and Technology 60, 1385-
1392 (2009).
Peng, Q., Juzeniene, A., Chen, J., Svaasand, L., Warloe, T., Giercksky, K., Moan, J., “Lasers in
medicine,” Reports on Progress in Physics 71, 1-28 (2008).
Pitschke, M., Prior, R., Haupt, M., Riesner, D., "Detection of single amyloid β-protein
aggregates in the cerebrospinal fluid of Alzheimer's patients by fluorescence correlation
spectroscopy," Nature Medicine 4, 832-834 (1998).
Podstawka, E., Ozaki, Y., Proniewicz, L., “Part I: Surface-enhanced Raman spectroscopy
investigation of amino acids and their homodipeptides adsorbed on colloidal silver,” Applied
Spectroscopy 58, 570-581 (2004).
Pradhan, A., Pal, P., Durocher, G., Villeneuve, L., Balassy, A., Babai, F., Gaboury, L.,
Blanchard, L., "Steady state and time-resolved fluorescence properties of metastatic and non-
metastatic malignant cells from different species," Journal of Photochemistry and Photobiology
B 31, 101-112 (1995).
Prasad, P., Introduction to Biophotonics. New Jersey: John Wiley and Sons, Inc., 2003.
Quintanilla, M., Brown, K., Ramsden, M., Balmain, A., "Carcinogen-specific mutation and
amplification of Ha-ras during mouse skin carcinogenesis," Nature 322, 78-80 (1986).
Ramanujam, N., "Fluorescence Spectroscopy of Neoplastic and Non-neoplastic Tissues,"
Neoplasia 2, 89-117 (2000).

173
Ramanujam, N., Follen-Mitchell, M., Mahadevan-Jansen, A., Thomsen, S., Staerkel, G.,
Malpica, A., Wright, T., Atkinson, N., Richards-Kortum, R., "Cervical precancer detection using
multivariate statistical algorithm based on laser-induced fluorescence spectra at multiple
excitation wavelengths," Journal of Photochemistry and Photobiology 64, 720-735 (1996).
Rao, J., Dragulescu-Andrasi, A., Yao, H., “Fluorescence imaging in vivo: recent advances,”
Current Opinion in Biotechnology 18, 17-25 (2007).
Ravery, V., Dominique, S., Panhard, X., Toublanc, M., Boccon-Gibod, L., Boccon-Gibod, L.,
"The 20-Core Prostate Biopsy Protocol--A New Gold Standard?," The Journal of Urology 179,
504-507 (2008).
Rechberger, T., Postawski, K., Jakowicki, J., Gunja-Smith, Z., Woessner, J., "Role of fascial
collagen in stress urinary incontinence," American Journal of Obstetrics and Gynecology 179,
1511-1514 (1998).
Reits, E., Neefjes, J., “From fixed to FRAP: measuring protein mobility and activity in living
cells,” Nature Cell Biology 3, 145-147 (2001).
Richards-Kortum, R., Mitchell, M., Ramanujam, N., Mahadevan, A., Thomsen, S., "In vivo
fluorescence spectroscopy: potential for non-invasive, automated diagnosis of cervical
intraepothelial neoplasia and use as a surrogate endpoint biomarker," Journal of Cellular
Biochemistry 19, 111-119 (1994).
Roldan, M., Corrado, G., Francioso, O., Snachez-Cortes, S., “Interaction of soil humic acids with
herbicide paraquat analyzed by surface-enhanced Raman scattering and fluorescence
spectroscopy on silver plasmonic nanoparticles,” Analytica Chimica Acta 699, 87-95 (2011).
Ryan, R., Wolf, T., Spetzler, R., Coons, S., Fink, Y., Preul, M., “Application of a flexible CO(2)
laser fiber for neurosurgery: laser-tissue interactions,” Journal of Neurosurgery 112, 434-443
(2010).
Short, K., Carpenter, S., Freyer, J., Mourant, J., “Raman spectroscopy detects biochemical
changes due to proliferation in mammalian cell cultures,” Biophysical Journal 88, 4274-4288
(2005).
Sieler, G., Schweitzer-Stenner, R., Holtz, J., Pajcini, V., Asher, S., “Different conformers and
protonation states of dipeptides probed by polarized Raman UV-Resonance Raman, and FTIR
spectroscopy,” Journal of Physical Chemistry Part B 103, 372-384 (1999).
Singh, V., Rai, A., “Prospects for laser-induced breakdown spectroscopy for biomedical
applications: a review,” Lasers in Medical Science 26, 673-687 (2011).
Smith, S., Buchanan, K., Hahn, D., Excimer laser-induced perturbation spectroscopy: an
approach to biosensing (SPIE, 2010).
174
Smith, S., Shanyfelt, L., Buchanan, K., Hahn, D., "Differential laser-induced perturbation
spectroscopy using a deep-ultraviolet excimer laser," Optical Letters 36, 2116-2118 (2011).
Song, S., Xiong, C., Zhou, M., Lu, W., Huang, Q., Ku, G., Zhaeo, J., Flores Jr., L., Ni, Y., Li, C.,
“Small-animal PET of tumor damage induced by photothermal ablation with 64Cu-bis-DOTA-
hypericin,” Journal of Nuclear Medicine 52, 792-799 (2011).
Taubert, A., Napoli, A., Meier, W., “Self-assembly of reactive amphiphilic block copolymers as
minetics for biological membranes,” Current Opinion in Chemical Biology 8, 598-603 (2004).
Thumanu, K., Tanthanuch, W., Ye, D., Sangmalee, A., Lorthongpanich, C., Parnpai, R., Heraud,
P., "Spectroscopic signature of mouse embryonic stem cell-derived hepatocytes using
synchrotorn Fourier transform infrared microspectroscopy," Journal of Biomedical Optics 16, 5-
57 (2011).
Tseng, S., Bargo, P., Durkin, A., Kollias, N., "Chromophore concentrations, absorption and
scattering properties of human skin in-vivo," Optics Express 17, 14599-14617 (2009).
Tsiklis, N., Kymionis, G., Kounis, G., Naoumidi, I., Pallikaris, I., “Photorefractive keratectomy
using solid state laser 213 and Excimer laser 193 nm: A randomized, contralateral, comparative,
experimental study,” Investigative Ophthalmology and Visual Science 49, 1415-1420 (2008).
Veld, D., Witjes, M., Sterenborg, H., Roodenburg, J., "The status of in vivo autofluorescence
spectroscopy and imaging for oral oncology," Oral oncology 41, 117-131 (2005).
Vogel, A., Apitz, I., Freidank, S., Dijkink, R., “Sensitive high-resolution with-light Schlieren
technique with a large dynamic range for the investigation of ablation dynamics,” Optics Letters
31, 1812-1814 (2006).
Vogel, A., Lorenz, K., Horneffer, V., Huttmann, G., Smolinski, D., Gebert, A., “Mechanisms of
laser-induced dissection and transport of histologic specimens,” Biophysical Journal 93, 4481-
4500 (2007).
Vogel, A., Noack, J., Huttman, G., Paltauf, G., “Mechanisms of femtosecond laser nanosurgery
of cells and tissues,” Applied Physics Part B 81, 1015-1047 (2005).
Vogel, A., Venuqopalan, V., “Mechanisms of pulsed laser ablation of biological tissues,”
Chemical Reviews 103, 577-644 (2003).
Wang, C., Tsai, T., Chen, H., Chang, S., Chen, C., Chiang, C., "Autofluorescence spectroscopy
for in vivo diagnosis of DMBA-induced hamster buccal pouch pre-cancers and cancers," Journal
of Oral Pathology and Medicine 32, 18-24 (2003).
Wolpert, M., Hellwig, P., “Infrared spectra and molar absorption coefficients of the 20 alpha
amino acids in aqueous solutions in the spectral range from 1800 to 500 cm-1
,” Spectrochimica
Acta Part A 64, 987-1001 (2005).

175
Woods, G., Simpson, M., Koerner, P., Napoli, A., Simpson, A., “HILIC-NMR: Towards the
identification of individual molecular components in dissolved organic matter,” Environmental
Science and Technology 45, 3880-3886 (2011).
Xiaojuan, Y., Huaimin, G., Jiwei, W., “Surface-enhanced Raman spectrum of Gly-Gly adsorbed
on the silver colloidal surface,” Journal of Molecular Structure 977, 56-61 (2010).
Yang, S., Gao, Y., Song, Y., Liu, J., Yang, C., Liu, J., Wang, Z., Zhang, X., “The study of the
participation of basement membrane zone antibodies in the formation of the lupus band in
systemic lupus erythematosus,” International Journal of Dermatology 43, 420-427 (2004).
Yavas, O., Schilling, A., Bischof, J., Boneberg, J., Leiderer, P., “Bubble nucleation and pressure
generation during laser cleaning of surfaces,” Applied Physics A 64, 331-339 (1997).
Yu, G., Freedman, T., Nafie, L., “Experimental measurement and ab initio calculation of Raman
optical activity of L-alanine and its deuterated isotopomers,” Journal of Physical Chemistry 99,
835-843 (1995).
Yu, G., Wu, M., Luo, Y., Yang, X., Ran, W., Shen, Q., “Fluorescence excitation-emission
spectroscopy with regional integration analysis for assessment of compost maturity,” Waste
Management 31, 1729-1736 (2011).
Zenklusen, J., Stockman, S., Fischer, S., Conti, C., Gimenez-Conti, I., "Transforming growth
factor-beta 1 expression in Syrian hamster cheek pouch carcinogenesis," Molecular
Carcinogenesis 9, 10-16 (1994).
Zhang, F., Cai, W., Sun, Z., Zhang, J., “Regular variations in organic matrix composition of
small yellow croaker (Pseudociaena polyactis) otoliths: an in situ Raman microspectroscopy and
mapping study,” Journal of Analytical and Bioanalytical Chemistry 390, 777-782 (2008).
Zhang, J., Feng, Z., Li, M., Chen, J., Xu, Q., Lian, Y., Li, C., “Raman spectroscopic
investigation of solid samples using a low-repetition-rate pulsed Nd:YAG laser as the excitation
source,” Journal of Applied Spectroscopy 61, 38-48 (2007).
Zhu, C., Burnside, E., Sisney, G., Salkowski, L., Harter, J., Yu, B., Ramanujam, N.,
"Fluorescence Spectroscopy: An Adjunct Diagnostic Tool to Image-Guided Core Needle Biopsy
of the Breast," Biomedical Engineering Transactions 56, 2518-2528 (2009).
Zhu, G., Zhu, X., Fan, Q., Wan, X., “Raman spectra of amino acids and their aqueous solutions,”
Spectrochimica Acta Part A 78, 1187-1195 (2011).
176
BIOGRAPHICAL SKETCH
Sarah Elizabeth Smith was born in Martin Kentucky to James C. Smith and Jerri E.
Smith. She graduated from Morehead State University in Morehead Kentucky in May of 2007
with a Bachelor of Science in physics. Upon completion, she attended West Virginia University
and graduated with a Master of Science in aerospace engineering with thesis in 2009. The work
presented here is in culmination of the research carried out during her PhD studies at the
University of Florida.