Embed Size (px)
Citation preview

Discussion PaPer series
IZA DP No. 10436
Alexander Muravyev
Boards of Directors in Russian Publicly Traded Companies in 1998-2014:Structure, Dynamics and Performance Effects
December 2016

Schaumburg-Lippe-Straße 5–953113 Bonn, Germany
Phone: +49-228-3894-0Email: [email protected] www.iza.org
IZA – Institute of Labor Economics
Discussion PaPer series
Any opinions expressed in this paper are those of the author(s) and not those of IZA. Research published in this series may include views on policy, but IZA takes no institutional policy positions. The IZA research network is committed to the IZA Guiding Principles of Research Integrity.The IZA Institute of Labor Economics is an independent economic research institute that conducts research in labor economics and offers evidence-based policy advice on labor market issues. Supported by the Deutsche Post Foundation, IZA runs the world’s largest network of economists, whose research aims to provide answers to the global labor market challenges of our time. Our key objective is to build bridges between academic research, policymakers and society.IZA Discussion Papers often represent preliminary work and are circulated to encourage discussion. Citation of such a paper should account for its provisional character. A revised version may be available directly from the author.
IZA DP No. 10436
Boards of Directors in Russian Publicly Traded Companies in 1998-2014:Structure, Dynamics and Performance Effects
December 2016
Alexander MuravyevHigher School of Economics, Saint-Petersburg Campus and IZA

AbstrAct
IZA DP No. 10436 December 2016
Boards of Directors in Russian Publicly Traded Companies in 1998-2014:Structure, Dynamics and Performance Effects*
This paper provides new evidence on the structure, dynamics and performance effects of
corporate boards in publicly traded companies in Russia. It takes advantage of a new and
unique longitudinal dataset of virtually all Russian companies whose shares were traded
in the RTS/MICEX/MOEX over 1998-2014. The analysis highlights a number of strong
trends in the evolution of boards of directors, such as the declining participation of insider
directors and the increasing participation of foreign and female directors. It also shows
that board characteristics are linked to company performance (the market-to-book ratio,
Tobin’s Q, ROE and ROA), suggesting that boards of directors play a non-trivial role in
corporate governance in Russia. Testing for structural breaks in the relationship between
board composition and firm performance provides some evidence of the changing role of
corporate boards over time.
JEL Classification: G34, L22
Keywords: board of directors, publicly traded companies, corporate performance, Russia
Corresponding author:Alexander MuravyevIZAP.O. Box 724053072 BonnGermany
E-mail: [email protected]
* The author would like to thank Natalia Kulipanova and Timur Redzhepov from the MOEX market data team for
providing the necessary data on stock trades on the MICEX/MOEX. The author is also grateful to Maxim Dudnik,
Anna Fadeeva, Evgenia Goncharova, Olga Levina, Daria Morozova, Yulia Shmelyova and Michail Shnaubelt for the
excellent research assistance. The paper has benefited from discussions with Irina Berezinets, Tatiana Dolgopyatova,
Tatiana Garanina, Irina Ivashkovskaya, Yulia Ilina and Carsten Sprenger as well as from comments by two anonymous
reviewers. The usual caveat applies.

2
1. Introduction
According to a widespread definition, corporate governance “deals with the ways in which
suppliers of finance to corporations assure themselves of getting a return on their investment”
(Shleifer and Vishny, 1997, p. 737). Failures of corporate governance, resulting in managerial slack
and shortages in external financing, have often been named among the key factors that impede
productivity improvements on the micro level and economic growth on the macro level. This is
certainly true of the countries of Central and Eastern Europe (Bergloef and von Thadden, 1999;
McGee, 2008). Estrin and Wright (1999), for example, argue that the problems of transition in the
former USSR are strongly related to the delays in introducing effective corporate governance.
There are several mechanisms that help to realign the interests of managers with those of
shareholders or the interests of large shareholders with those of minority owners. These include
product market competition, the market for corporate control, managerial remuneration,
institutional shareholders and the board of directors, among others. Among such mechanisms, the
board of directors – an institution specifically devised to mitigate governance conflicts within a
firm – is often regarded as playing a key role (Nordberg, 2011). Not surprisingly, the issues of
board structure and processes – defined in terms of board size, the presence of non-executive
independent directors, separation of the posts of the chairman and the CEO, gender composition
and the establishment of various committees – have been central to recent corporate governance
debates and reforms across the globe. Interestingly, substantial controversy regarding many of
these aspects of corporate boards persists in the empirical literature, even though the bulk of the
available evidence comes from a relatively homogenous group of rich countries, primarily the US
and Western Europe. Much less is known about the countries of Central and Eastern Europe and
other emerging markets, most likely due to the lack of high quality micro-data from the region (e.g.
Ararat et al., 2014).
In this paper, we study the structure, dynamics and performance effects of corporate boards
in Russian publicly traded companies over 1998-2014. Although a number of papers have focused
on the structural characteristics of Russian corporate boards and even tried to evaluate their effect
on firm performance, no existing study simultaneously (a) provides a long-term perspective, (b)
relies on a representative sample of large Russian companies traded on the stock market and (c)
applies modern econometric techniques. We highlight this gap in a brief survey of the existing
3
literature on Russian corporate boards published in both English and Russian. Our subsequent
analysis attempts to fill this gap.
Importantly, the contribution our analysis is potentially larger than filling this particular gap
for a single country. The reason is that Russia provides an excellent laboratory for studying
corporate governance issues, including those related to corporate boards, due to (a) enormous
governance problems, (b) large economic shocks that repeatedly hit the country’s economy and (c)
extensive reforms of corporate governance introduced in recent decades. For example, regarding
Russia, Shleifer and Vishny (1997) note that in the mid-1990s company managers had immense
opportunities to divert both profits and assets to themselves. Goetzmann et al. (2003, p. 27) even
labeled Russia “a Wild West of corporate control”. In the last two decades, the country has been
hit by several large shocks: the crises in 1998 and 2008 and a recession commencing in 2014.
Finally, Russia has been actively reshaping its corporate governance environment, including the
extensive amendments to the Federal Law “On joint-stock companies”, especially in 2001, as well
as the adoption of the corporate governance codes in 2002 and 2014. In sum, Russian data contain
substantial variation in economic and governance variables and therefore could be effectively used
to answer questions of general interest, in addition to country-specific ones.
The empirical analysis in this paper is based on a new and unique longitudinal dataset that
was hand-collected by us. The dataset covers all Russian companies that were traded on the Russian
stock market (the RTS, the MICEX as well as the MOEX since the merger of the first two in 2011)
over 17 years, from 1998 to 2014.1 The data on corporate boards and other company characteristics
are taken from the firms’ quarterly reports to the regulator.2 These data contain information on full
names, years of birth, ownership stakes and places of work over the previous five years for (nearly)
all directors sitting on the supervisory boards of Russian public companies. They also provide
information on the executive bodies of Russian firms, which allows us to identify, for example,
inside and outside directors. The number of company-years in the constructed dataset is close to
4,000, while the number of records (director positions) approaches 40,000.
1 The RTS stands for the Russian Trading System, which was created as an over-the-counter market in 1995 and
subsequently transformed into a stock exchange with the largest coverage of Russian stocks. The MICEX denotes the
Moscow Interbank Stock Exchange, the largest (in terms of the volume of trades) stock market in the 2000s. The
MOEX stands for the Moscow Exchange created as a result of the merger between the RTS and the MICEX in
December 2011. 2 The Federal Commission on Securities Market (1996-2004), the Federal Financial Markets Service (2004-2013) and
the Central Bank of Russia (since 2013).
4
Using these new and unique data, the paper attempts to answer several research questions.
First, what are the key structural characteristics of corporate boards in publicly traded companies
in Russia? Second, what are the dynamics of these characteristics in the turbulent economic
environment of the last two decades? Third, how are these structural characteristics related to
company performance? Finally, is there evidence of the changing role of Russian corporate boards
over the last two decades?
Our findings document the ubiquity of medium-sized boards, the prevalence of non-
executive directors, small ownership stakes held by board members and a relatively small
representation of female and foreign directors. We also find that board composition in Russian
firms significantly changed during the period under study, with the main trends being the reduction
of board size, the decline in director ownership and the increase in the proportion of female and
foreign directors (at least until 2008). The characteristics of corporate boards proved to be related
to company performance. For example, there seems to be a positive association between market-
based performance measures on the one hand and the proportion of foreign directors as well as
directors’ appointments in other firms on the other. In contrast, the evidence in favor of outside and
female director representation as well as director stock ownership is relatively weak. There are also
signs of changes in the functioning of corporate boards: The structural characteristics of boards
have different effects on firm performance in 1998-2001 compared with the baseline period of
2002-2008; there is also some evidence that the 2009-2014 period is different from the baseline.
The remainder of this paper is organized as follows. In section 2, we provide a brief
institutional background regarding boards of directors in Russian companies. Section 3 offers a
survey of academic articles focusing on Russian corporate boards. Section 4 describes the data. In
Section 5, we discuss the methodological approaches of the study. Subsequently, Section 6
describes the results pertaining to the structure and dynamics of boards, whereas Section 7 presents
the main results of our econometric analysis. Finally, section 8 draws some conclusions.
2. Institutional background: Boards of directors in Russian firms
The key features of the governance structure of Russian companies are set in the Civil Code,
adopted in 1994, as well as the Federal Law N 208 FZ “On joint-stock companies”, passed in 1995,
both of which have since undergone numerous changes and amendments. There are additional
regulations adopted by government and its agencies, as well as by stock exchanges, some of which

5
are optional. The most prominent example of the latter is the Code of Corporate Conduct adopted
by Russia’s Federal Commission on Securities Markets (see FCSM, 2002). Introduced in 2002, the
code provided a set of voluntary commitments by corporate stakeholders, including shareholders
and managers of companies. In 2014, this code was replaced by the Code of Corporate Governance
developed by the Central Bank of Russia (see CBR, 2014), which significantly expanded the list
of “best practices” and clarified their meaning (see, e.g. Braendle, 2015).
As in most countries across the world, the two main bodies responsible for the governance
of companies in Russia are the general shareholder meeting and the board of directors. Russia
belongs to the group of countries that allow both one- and two-tier corporate boards (Ferreira and
Kirchmaier, 2013). In either case, companies have to establish a supervisory board (often simply
called “board of directors” in Russian) and an executive body, which may be represented by a
unitary CEO (typically called “general director” in Russian) or a collective executive body
(management board) that includes the CEO.3 In the latter case, law explicitly requires companies
to define the authority of the collective executive body in their corporate charters. From now on,
following the letter of law and most of the literature, we will associate the term “board of directors”
with the supervisory board.4
The board of directors is responsible for the overall governance of the company and acts
under the authority granted to it by law and the corporate charter. In particular, the board of
directors is responsible for setting priorities for company operations, convening general
shareholder meetings and setting their agenda, deciding on bond issues, putting forward
recommendations on the amount of dividends, as well as other matters. Depending on the corporate
charter, the appointment and dismissal of the executive body may be the responsibility of either
the board of directors or the shareholder meeting. Certain strategic issues such as large transactions
have to receive unanimous approval of the board members. Importantly, the boards of directors in
Russian companies have no executive functions.
3 More precisely, the board of directors (supervisory council) is not mandatory for companies with fewer than 50
shareholders (article 64 of the Federal Law “On joint-stock companies”). This rule has no implications for our analysis
because we study publicly traded firms, which have hundreds and thousands of shareholders. 4 The term “board of directors” is understood as the supervisory board in Iwasaki (2008), Muravyev et al. (2014) and
most studies published in national journals. However, the cross-country study by Ferreira and Kirchmaier (2013),
which includes Russia, defines this term as a combination of both tiers, the supervisory and management boards.

6
Russian corporate law contains provisions regulating the size and composition of corporate
supervisory boards, as well as the procedure of their election (article 66 of the Federal Law “On
joint-stock companies”). The key regulations are summarized below:
• The minimum number of directors is set at five (this norm has applied since 2004). In
addition, companies with more than 10,000 voting shareholders must have no fewer than nine
directors, while companies with 1,000 to 10,000 voting shareholders must have at least seven
directors.
• Members of the board of directors are elected at a shareholder meeting for the period until
the next annual shareholder meeting, which is to be held between March and June each year. Board
members may be reelected an unlimited number of times. These norms imply that staggered boards
are not allowed in Russia.
• The board is elected by cumulative voting, which ensures the representation of small
blockholders. Under cumulative voting, the number of votes of each shareholder is multiplied by
the number of directors on the board, whereby all such votes can be cast for one or several
candidates running for the election.
• If a company has a collective executive body (management board), its members cannot
occupy more than 25% of seats on the board of directors.
In Russia, the regulations concerning board composition have been relatively slack. For
example, the 1995 law does not contain any explicit provisions regarding the representation of
independent directors on boards (e.g. the number or proportion of such directors) and it only
provides a relatively loose definition of independence.5 Some rules concerning board composition
are imposed by the Russian and foreign exchanges. For example, the MICEX listing rules that took
effect on October 1, 2005 required the presence of at least three independent directors on the
corporate boards of companies included in the quotation list of the first (highest) level. The set of
criteria employed by the MICEX to identify independent directors is somewhat stricter than that
used in the law. Further provisions regarding board composition are contained in the corporate
governance codes from 2002 and 2014, with the most recent code having relatively elaborated
criteria for board independence. Nonetheless, many of the rules remain lax; for example, the
composition of the board of directors “should be balanced” along dimensions such as director
5 According to the law, independent directors are those who do not have executive posts in the company, are not among
close relatives of the executives and are not among the affiliated persons of the company (except for the membership
in the supervisory board).

7
experience, knowledge and professional skills. Most importantly, the rules introduced in the
corporate governance codes are not binding and can be avoided by companies at no explicit cost.
3. Review of the literature on corporate boards in Russia
Despite Russia being a major emerging market, relatively little is known about its corporate boards
and their effect on company performance in particular. Overall, no more than two dozen academic
articles have scrutinized the issue using sample data and statistic/econometric tools. This scarcity
of evidence was already noted in the mid-2000s (e.g. Iwasaki, 2008), but as we show below, not
much has changed since then.
In order to position our study within the existing literature, we conducted a comprehensive
search of articles that deal with boards of directors in Russian firms. In particular, we screened all
international academic journals indexed in the Web of Science, Scopus and EconLit as well as all
Russian journals indexed by the Russian Science Citation Index over 2000-2015.6 For space
reasons, we report full details of this survey in Appendix A. Overall, we found only eight(!) articles
in international journals that provide substantial empirical evidence on Russian corporate boards
and four additional articles with a multi-country focus including some results for Russia.7
Additionally, seven articles were found in Russian journals. The research questions asked in these
studies are very diverse: from determinants of board composition (e.g. Basargin and Perevalov,
2000; Iwasaki, 2008) to the effect of board structure on audit fees (Prokofieva and Miniandy, 2011).
Nevertheless, the dominating theme is the relationship between (some of) the structural
characteristics of corporate boards and company performance (14 papers out of 19).
The samples and data sources are very diverse. In particular, earlier studies tended to rely
on original surveys using convenience and “quasi-random” samples that are unlikely to be
representative of the population or important sub-populations of Russian firms (Basargin and
Perevalov, 2000; Judge et al., 2003; Peng et al., 2003).8 Several papers rely on the large-scale
6 The Russian Science Citation Index is a joint product of the Web of Science and the Scientific Electronic Library,
www.elibrary.ru, as accessed on November 29, 2016. 7 The latter group includes Przybyłowski et al. (2011), Ivashkovskaya and Stepanova (2011), Saeed et al. (2014) and
Aras (2015). 8 The focus of some studies on medium-sized firms, often in the manufacturing industry and from a few regions only
is very misleading. The Russian privatization created many open joint-stock companies that would not have emerged
as public companies in a normal market environment. These firms had very concentrated ownership structures and
were out of the stock market, but their governance bodies, reporting requirements, etc. were patterned after the classic
public widely held company.
8
survey by Hitotsubashi University and the Higher School of Economics, which involved stratified
sampling among industrial and communications enterprises with more than 100 employees from
64 regions (Iwasaki, 2008, 2013, 2014; Frye and Iwasaki, 2011). More recent analyses tend to draw
samples from the population of companies traded on the stock market (e.g. Maslennikova and
Stepanova, 2010; Stepanova and Kouzmin, 2011). In these cases, the exact sample composition is
typically affected by the coverage of Russian firms in specific databases (e.g. Bloomberg, Osiris
and Ruslana) as well as the availability of detailed data on corporate boards, ownership and key
financials. In some studies published in national journals, the procedure of sample selection is not
fully transparent (Ilchyuk, 2006; Stepanova and Balkina, 2013).
The sample size in all such studies is below 1,000; the largest one (over 800 firms) comes
from the survey by Hitotsubashi University and the Higher School of Economics (Iwasaki, 2008).
The data are mostly cross-sectional: only eight studies feature panel data. The two panel data
analyses that rely on a reasonably large number of observations (approaching 1,000) are Muravyev
et al. (2014), which is a study of dual-class stock firms traded on the stock market, and Dulyak
(2015), which samples large firms, both traded and non-traded. The number of periods in the panel
data studies is typically small, with the largest being 12 years in Muravyev et al. (2014).
The small sample sizes, cross-sectional nature and unavailability of “hard” data often
impose severe restrictions on the empirical methods available to the researcher. For example, the
lack of key financials in some surveys forces the authors to rely on second-best (and even
subjective!) measures of firm performance, such as the frequency of dividend payments (Frye and
Iwasaki, 2011) and Likert-scale indicators of year-to-year changes in profits (Peng et al., 2003) or
the position of the firm relative to the industry (Judge et al., 2003). More recent analyses focusing
on the link between board characteristics and firm performance use more traditional accounting-
and market-based indicators such as ROE and Tobin’s Q. Interestingly, many Russian authors
choose a single performance indicator and do not present any sort of comparative analysis (e.g.
Ilchyuk (2006) relies on the profit margin and Berezinets et al. (2013) employ Tobin’s Q).
Regarding the methods used, six papers rely on simple regression analysis that does not go
beyond OLS, eight papers are based on the standard fixed- and random-effects estimators, while
seven papers present (or at least refer to) the results obtained using more advanced econometric
techniques, such as the Heckman selection and Tobit models, 2SLS and quantile regression. The
9
issue of endogeneity (broadly understood as encompassing reverse causation, omitted variables
and measurement error) is not discussed in most studies.
The results of these analyses are difficult to summarize in a compact form due to the
different research questions asked. Nevertheless, we can illustrate the variety of findings for one
key research question concerning the effect of non-executive and independent directors on firm
performance. This issue is raised, at least indirectly, in 12 papers, of which eight papers report
some positive association between the number and/or proportion of such directors on the board and
firm performance, two papers find that non-executive/independent directors make no difference
and the remaining two papers provide some evidence of a negative role of non-
executive/independent directors.
Overall, our brief survey of studies of Russian corporate boards suggests that the analyses
are often based on small, non-representative and/or not very interesting samples, the data employed
are usually cross-sectional and when panel data are used, they typically only span a few periods.
Performance measures are often non-conventional, with very few papers relying on market-based
indicators. The findings are diverse and not very consistent across the studies. Overall, we conclude
that the evidence remains scarce and weak, although recent papers show notable progress towards
better sampling strategies and more developed methodologies of empirical analysis, whereby their
findings appear increasingly credible.
4. Data
The empirical analysis in this paper is based on a novel hand-collected dataset of publicly traded
Russian companies over 1998-2014.9 Specifically, we sample all companies whose shares were
listed/traded on the RTS and/or the MICEX as well as the MOEX since the merger of the first two
in 2011.10 Importantly, a company enters the sample if its shares were traded/listed on the last
working day of each calendar year, whereby its year-end market capitalization can be (at least
theoretically) computed.
9 Mandatory disclosure requirements for Russian companies (the obligation to publish the so-called quarterly reports
using a standardized template) were only introduced in 1998. Prior to that, information on corporate boards was
fragmentary and only available for a few firms. Therefore, it is virtually impossible to find micro-data that would allow
exploring further back into the history of Russian corporate governance than 1998. 10 We thus exclude companies whose operations were mostly in Russia but whose shares were only traded abroad, e.g.
in London or Frankfurt (examples being Globaltrans, Integra Group and Rambler Media Limited).

10
Several additional filters are applied to the sample. First, we drop companies that were
traded on the RTS board, a small and rather illiquid over-the-counter market. Second, we restrict
our attention to non-financial firms, dropping banks and other financial institutions from the
sample. Companies from the financial sector are identified by the first two digits in their industry
code (“okved” in Russian); all companies with the main two-digit code equal to 65, 66 or 67 are
excluded. Therefore, the sample is the entire population of Russian non-financial firms publicly
traded on the Russian stock exchanges over 17 years, from 1998 to 2014. The overall number of
firms in the sample is 575, although the average number of firms traded in a given year is only 235.
This gives the number of relevant observations just below 4,000. However, the real estimation
sample is somewhat smaller (typically around 3,000 observations) due to missing data on one or
another key variable.
For all sampled firms, we collect basic information such as the postal address and industry
affiliation, details regarding their corporate boards, management bodies and ownership structures.
The principal source of the data is the companies’ quarterly reports to the regulator and their annual
reports. Most of the necessary information was assembled from the SKRIN and SPARK databases
(www.skrin.ru and www.spark-interfax.ru, respectively; both links valid as of November 29,
2016). These sources provide data from quarterly and annual reports of the companies in semi-
processed and aggregated forms. The information on corporate boards, management bodies and
ownership is extracted from the second quarter reports (which are usually prepared in early July
and contain data as of June 30). This ensures that the data reflect the results of the general
shareholder meetings held between March and June each year (e.g. the data capture the
appointment of new CEOs and new boards of directors that typically run the firm for most of the
calendar year). Therefore, by construction our board variables contain predetermined values with
respect to year-end stock-type variables such as market capitalization.
Using this data collection procedure, we obtain a large array of variables characterizing
various aspects of firms’ operations. In particular, we have information on the distribution of
ownership among large shareholders (the reporting threshold in Russia is 5%), the ownership stakes
of affiliated persons (including the CEO and other directors, regardless of the size of their stakes)
and the composition of corporate boards (including directors’ names, years of birth and positions
held during the previous five years). Using these sources, we generate the most important variables

11
describing corporate ownership patterns, the size and composition of corporate supervisory boards
as well as the characteristics of CEOs and, where relevant, management boards.
We augment these data with key financials of each sampled firm, again using the SKRIN
and SPARK databases as principal sources. For earlier periods (1998-2002), we also consult the
“Alba” and “Gnosis” databases, which contain data from the firms’ financial reports. We use
consolidated data whenever possible; only in the case of their non-existence or unavailability we
rely on non-consolidated data.11
The financial variables are not deflated as they are used in the form of ratios. The only
exception is sales revenues, the natural logarithm of which is employed as a measure of firm size.
We convert this variable to the 1998 Rubles using the annual producer price index (for
manufacturing) available from the Russian Statistical Agency (www.gks.ru; link valid as of
November 29, 2016).
Regarding stock exchange data, we have daily trading data from the RTS archives (these
were available until 2014 on the RTS website, www.rts.ru) as well as the MOEX/MICEX (detailed
data were kindly provided to us by the MOEX market data team). From these data, we can retrieve
the closing prices on the last trading day of each year, market capitalization12 and liquidity
measures such as the number of transactions and bid-ask spreads.
The basic characteristics of the sample are shown in Figure 1. The distribution of
observations over time is fairly even (Panel A); the decline in the early-2000s and the subsequent
increase in 2005/6 are largely due to the reorganization of two sectors, telecommunications and
power utilities, pushed by government. In the former case, there was a wave of mergers of regional
telecommunication companies, with the number of telecommunication companies in the sample
dropping from 78 in 2001 to a mere 16 in 2003. In the latter case, there was a series of splits of
local monopolies into power generating and distribution companies, with a wave of horizontal
mergers in the sector following shortly thereafter.
Firms from three sectors, namely power utilities, manufacturing and telecommunications,
represent more than half of the sample (Panel B). As noted above, there is a substantial reduction
in the number (and also in the fraction) of telecommunication companies, especially after 2002, a
11 The main results of the study only marginally change when we replace consolidated financial data with non-
consolidated ones for all firms. 12 The RTS archives do not provide market capitalization data before 2003. These missing values are computed as the
product of the closing price and the number of shares at the year-end. The information on the number of shares was
obtained from the quarterly reports of the companies.

12
notable increase in the number of power utilities in the mid-2000s, when they amounted to 40% of
the sample, as well as a gradual increase in the number of companies in the service sector
(wholesale and retail trade, real estate and other services). Further details are available in Appendix
B.
The geographic classification of the sampled firms is based on the so-called federal districts
introduced in 2000 by president Putin. The only change that we make to the federal district map is
to separate Moscow and St. Petersburg from the Central and North-Western Districts, respectively
(Panel C). The Central region and Moscow dominate the sample. Interestingly, the share of the
Central region and Moscow increase over time, from 15.7% in 1998 to almost 38% in 2014,
probably reflecting the general trend towards centralization of economic activity in the country.
Further details are available in Appendix B.
The data at hand allow us to define a number of key variables characterizing corporate
boards and firm performance. The definitions of the variables and their descriptive statistics are
shown in Table 1. While the construction of most of the variables is straightforward (e.g. the
number of directors, total ownership stake of directors, performance measures), some require extra
work. For example, insider directors are identified based on (a) their presence on the management
board (by matching the names on the two boards) and (b) their current employment in the firm in
other capacities (by checking the biographies). The gender of directors is identified based on
patronymic names, which in Russian have gender-specific endings (usually “-ovich” for men and
“-ovna” for women). The gender of directors for which patronymic names were not available (e.g.
foreigners) was identified based on first names and in some cases by consulting extra sources on
the internet (e.g. company websites). Thus, the computer processing of the data was supplemented
by manual checks when necessary.
Regarding financial variables, we exclude observations with negative equity. We
subsequently clean the variables measuring firm performance of outliers by winsorizing 2.5% of
observations in each tail of the relevant distribution. The results of the analysis only marginally
change if these observations are deleted rather than being winsorized. The dynamics of the financial
variables (see Figure 2) follow the macroeconomic trends as well as the dynamics of the Russian
stock market (e.g. Tobin’s Q was growing in the 2000s, dropped in 2008 and recovered in the
subsequent years). This suggests good quality of the collected financial data.

13
5. Methods
The empirical part of this paper relies on the tools of descriptive analysis as well as statistics and
econometrics. In particular, the tools of descriptive analysis are used to summarize key variables
characterizing corporate governance in publicly traded Russian companies and trace their dynamics
during the two decades.
In order to investigate how the characteristics of corporate boards are related to firm
performance, we adopt a simple regression framework in which board variables (those on the right-
hand side of the regression model) are related to the standard measures of performance (the left-
hand side variables). The latter will include both market-based indicators (Tobin’s Q and the
market-to-book ratio, both logarithmized) and accounting indicators (ROA and ROE).
To explore the relationship between the board and firm performance, we consider a standard
econometric model that can be written as follows:
Perfit = αi + Xitδ + Witβ + γt + εit, i=1,…, N; t=1,…,T. (1)
where Perfit stands for the performance of firm i in year t (the market-to-book ratio, Tobin's Q,
contemporaneous as well as one-year-ahead ROE and ROA13), αi is a firm-specific intercept, the
vector Xit includes variables characterizing the corporate board of firm i in year t, the vector Wit
denotes a set of control variables used in similar analyses (e.g. firm size, leverage and ownership)
and γt is a time effect. The firm-specific effects αi help to control for unobserved time-invariant
characteristics of firms that may affect firm performance. Overall, the set of control variables Wit
(as well as firm and time fixed effects) aim to ensure that the ceteris paribus conditions, which are
central for interpreting the link between board structure and firm performance in a causal sense,
hold.
We use several estimation techniques to uncover the link between board structure and
performance. The baseline is the fixed-effects (FE) regression, which provides consistent estimates
regardless of the correlation of αi with the other regressors. Subsequently, we switch to the random-
effects (RE) estimator, which is more efficient than the FE one but requires uncorrelatedness of αi
with the regressors. We test the consistency of the RE estimator using the robust version of the
13 The rationale for using one-year-ahead variables is that accounting-based performance measures might react to
changes in the board structure with substantial delays, as compared with market-based performance indicators (e.g.
Carton and Hofer, 2006). Using one-year-ahead accounting-based measures also makes our board variables
predetermined with respect to performance, which is not true in the case of contemporaneous performance measures.

14
Hausman test.14 In all cases, we estimate (1) using the cluster robust estimator of variance, which
addresses potential heteroskedasticity and within-cluster correlation of the error terms.
Finally, given that the financial performance of a business firm is often viewed as a
stochastic process, we consider a model with a lagged dependent variable. Our dynamic model
takes the following form:
Perfit = αi +ηPerfit-1 + Xitδ + Witβ + γt + εit, i=1,…, N; t=2,…,T. (2)
where Perfit-1 denotes the lagged performance of firm i.
In general, the presence of the lagged dependent variable on the right-hand side of the model
makes the FE estimator not only biased but also inconsistent. To address this issue, we make use
of the dynamic panel data (DPD) estimator, in particular its two-step system GMM version
(Blundell and Bond, 1998; Roodman, 2009). It combines equations in differences of the variables
(instrumented by lagged levels) with equations in levels of the variables (instrumented by lagged
differences). In addition to solving the problem of endogeneity of the lagged dependent variable,
this estimator also allows tackling the potential endogeneity of other right-hand side variables.
Therefore, it is particularly appealing when traditional instrumental variables are not available.15
We will consider the variables that characterize corporate boards – Xit – as endogenous and use
their second lags as instruments.16
The reliability of the DPD results crucially depends on the assumption that the instruments
are valid. This can be checked with the help of the Hansen test of overidentifying restrictions,
which we will report together with the main estimates. A rejection of the null hypothesis would
indicate inconsistent estimates. In addition, we will also report test statistics for second-order serial
correlation in the error process (the Arellano-Bond test). In a DPD context, second-order serial
correlation is at odds with the assumption that the instruments are orthogonal to the errors.
The selection of variables for the regression model (vectors Xit and Wit) is based on
theoretical considerations, previous empirical work (including on Russia) and data availability. In
14 Stata command “rhausman”, see Kaiser (2014). 15 It should be noted that some recent papers raise concerns about the benefits of the DPD estimators in the context of
corporate finance and governance studies. For example, the simulations by Dang et al. (2015) show that the GMM
estimators are unreliable as well as quite sensitive to the presence of unobserved heterogeneity, residual serial
correlation and changes in control parameters. 16 Instrumenting the other firm-level variables (those included in Wit) as well as using additional lags as instruments is
problematic given the already large number of endogenous regressors, many time periods and relatively few units
(firms). In our setting, it is easy to get the number of instruments well above the number of units, which violates the
usual rule of thumb for the system GMM estimator (Roodman, 2009).

15
particular, we consider all possible characteristics of corporate boards available in the dataset, with
some of them entering the baseline model and others (especially those with a significant number
of missing values) employed in the extensions. In terms of control variables, we characterize the
management body of the firm by two variables: a dummy for a unitary CEO and a variable for the
number of managers (which naturally takes the value of one in the case of a unitary CEO). We also
control for key characteristics of the ownership structure of Russian firms as well as the dual-class
stock structure of equity. As is standard in corporate finance and governance studies, we also
include financial leverage and firm size. Next, we include a dummy for the issue of ADRs and a
measure of liquidity (in the regressions with market-based indicators of company performance).
The latter is potentially important as liquidity is known to affect share prices (e.g. Amihud and
Mendelson, 1986) and hence market capitalization, while most Russian companies are rather
illiquid. Finally, in the RE regressions, we include dummies for the macro regions and industries.
These time-invariant control variables naturally drop out in the FE regressions. Further details on
the selection of variables and choice of the functional form are provided in Appendix C.
6. Structure and dynamics of corporate boards
The key characteristics of corporate boards, which are summarized in Table 1 as well as Figures
3-5, allow us to identify a number of interesting patterns.17 First, the distribution of the number of
directors shows large spikes at 7, 9 and 11 directors, which are the thresholds established in
corporate law for companies with specific numbers of shareholders (see Section 2). This pattern is
consistent with the broad conclusion in Iwasaki (2008, p. 544) that “the majority of Russian firms
retain boards at the lower limit of membership stipulated by the corporate law” derived for non-
listed companies.
Second, the proportion of insider directors on boards is 22%, which conforms to the norm
of law that insiders cannot occupy more than 25% of the seats on the board. However, there are
many cases in which the threshold is exceeded, due to the presence on boards of managers and
other employees who are not members of the management body (the working definition of insider
directors used in our analysis is broader than that in law, as the latter only focuses on the members
of the executive board). Related to this, the share of directors who are strictly not independent is
17 More detailed statistics on the evolution of corporate boards in the companies sampled are shown in Appendix D.
16
28%.18 The distribution has a similar shape to that of insider directors, as expected: The two
variables differ by directors with ownership stakes greater than 1% (and there are few such persons)
as well as by directors who are government employees, which also constitute a relatively small
category. Indeed, they only occupy 5% of the seats on average.
Third, the fraction of women directors amounts to 12.4% and about 40% of the firms do
not have any women on the board. Foreign directors are fairly rare; their fraction is just 5.3% on
average. Most firms do not have any foreigners on the board. The average age of the members of
the board is 45.4 years, although the range of this variable is remarkable, from 26 to 68 years. On
average, directors hold two directorships, but the range is again large, from one to 35. The
proportion of new directors appointed in a given year amounts to about one-third, although this
does not necessarily mean that the boards are completely renewed every three years. The rotation
seems to be more concentrated among outsider directors.
The total ownership stake of directors is very small: the mean equals 2.71% and the median
is just 0.005%. There are only a few cases with substantial ownership by directors. Insider directors
own more than outsider directors; the averages amount to 1.52% and 1.19%, respectively, while
the medians are equal to zero in both cases.
Our final remarks about board composition are related to the characteristics of the chairmen.
First, their ownership stakes are low, at less than 1% on average. Most of the chairmen are outsiders
(which is in line with the recommendations of the corporate governance codes). They are slightly
older than the average director (48.3 versus 45.4 years, respectively). Only 6% of them are women
(compared with 12.4% among all directors) and only 3% are foreigners (compared with 5.3%
among all directors).
The dynamics of these characteristics, which are visualized in Figures 4 and 5, allow us to
distinguish several interesting trends. First, Figure 4 suggests a general tendency to elect smaller
boards. The largest boards were observed in the early 2000s (9.3 directors, on average); more recent
years saw the numbers below 8.5. Second, the share of insider directors experienced a sharp decline
until 2005, from 35% to a mere 15%; since then, it has been slightly growing. Third, the data show
an upward trend in the proportion of female directors, from less than 10% at the end of the 1990s
18 This category comprises insider directors, those related to the government and those holding at least 1% of shares
of the company. While this category is non-conventional, it is the only extended category that we can define based on
the data at hand. The complement to this category encompasses both independent and grey directors. Importantly, the
data do not allow us to identify independent directors based on any of the conventional definitions used in Russia and
internationally.

17
to over 14% in more recent years. The proportion of foreign directors steeply increased between
1998 and 2008, from 2% to nearly 8%, before stabilizing around 7% after the global crisis of 2008.
Fourth, and perhaps most interesting, the average age of directors follows a U-shape pattern with
a clear minimum in 2005-2006. In 1998, the average age was above 48 years, in 2005 it was close
to 43 years and in 2014 it was close to 48 years again. While one may hypothesize that this pattern
reflects a peak in director turnover in the early-2000s, this conjecture is not supported by the data.
The peak of director turnover occurred around the 2008 crisis and was accompanied by an increase
in the average age of directors. Fifth, the average number of posts per director has an inverted U-
shape form, with a clear maximum in the middle of the first decade of the new century. The
industry-level analysis indicates that this spike was largely driven by the split of the regional power
utilities into multiple firms, in which corporate boards overlapped to a considerable extent. Finally,
the total ownership stake of directors declined until 2004, before stabilizing in 2004-2008 and
increasing thereafter, especially in the 2010s.
The dynamics of key variables characterizing the chairmen are similar to those for all
directors (see Figure 5). One notable exception is the declining fraction of chairwomen after 2002,
from the maximum of 12% in 2000-2001 to a mere 5% in recent years.
It is worth noting that the above pictures result from two effects: trends in the structure of
corporate boards per se and changes in the composition of the sample over time. Therefore, it is
important to look at the dynamics of the variables in a subsample of firms that have been
continuously traded on the Russian stock exchange (overall, there are 46 such firms in the sample).
Such an examination suggests that the trends in many of the key variables are similar to those
observed in the full sample (the details can be found in Appendix E). This is true of the size of the
board, the number of posts per director, the average age of directors and the fractions of female
and foreign directors. The trends are distinct for the total ownership stake of directors (among the
continuously traded firms, there is no spike in this variable in recent years) and the proportion of
insider directors (which declines over time among the continuously traded firms). Thus, the
dynamics of these variables in the full sample are likely to be driven by changes in the population
of publicly traded companies over time. In terms of chairmen, we observe virtually no females in
this post among the continuously traded firms and a notable drop in the proportion of foreign
chairmen after 2012. Moreover, there is no evidence of the increasing participation of the chairmen
in company equity in recent years.
18
The remarkable variation – both across companies and over time – documented here will
be explored in the next section in an attempt to establish statistical relationships between board
characteristics and company performance.
7. Performance effects of corporate boards
Table 2 shows the results of estimating the baseline model using the FE approach. The columns of
the table correspond to the performance measures chosen: the market-to-book ratio, Tobin’s Q,
ROE, one-year-ahead ROE, ROA and one-year-ahead ROA.19 These baseline results indicate a
non-linear relationship between board size and accounting-based performance. We observe the
maximum performance at about 11 directors.20 It is worth noting that the number of firms with a
board size exceeding 11 is relatively small, given that the number 11 corresponds to the 90%
percentile of the distribution of board size. Therefore, it may be more appropriate to interpret the
estimated quadratic function as a monotonic relationship with some curvature. In particular, there
seems to be an increasing but diminishing effect of board size on accounting-based performance.
The relationship between board size and market-based performance seems to follow a U-shaped
pattern, although it lacks statistical significance.
The fraction of insider directors on the board has no effect on market-based performance.
While being unrelated to current accounting performance, it is negatively associated with one-year-
ahead accounting measures. The result is in line with most of the studies that generally fail to
provide convincing evidence on the pros and cons of insider directors versus outsider directors.
Interestingly, the share of outsider directors in the company’s equity is positively related to both
market- and accounting-based performance measures. For insider directors’ ownership stakes, the
effect is mostly statistically insignificant, except in the case of contemporaneous performance,
where the coefficient is positive and statistically significant. This latter results may indicate the
lack of emphasis by insiders on the long-term objectives of the firm.
The fraction of foreign directors is positively related to the market-to-book ratio and
Tobin’s Q, albeit the relevant coefficient is statistically insignificant in the latter case. The fraction
of directors who are related to government has no effect on either accounting- or market-based
performance. Interestingly, the fraction of female directors is positively related to market-based
19 In these and all other regressions, the market-based performance measures are logarithmized. 20 This is based on the turning point of the quadratic function in board size; for example, 0.032/(2*0.022)=8 for ROE
and 0.030/(2*0.001)=15 for ROA.

19
performance as well as contemporaneous ROE. Similar results concerning the proportion of
females on the corporate boards of Russian firms were reported by Berezinets et al. (2013). Given
the relatively small fraction of women directors in Russian companies, this finding suggests that
increasing the gender diversity of the boards may improve their performance.
The average age of directors as well as the intra-firm variance have no effect on firm
performance regardless of how it is measured. The average number of posts held by the firm’s
directors is positively related to the market-to-book ratio and Tobin’s Q, but has no effect on the
accounting measures. The market seems to react favorably to the appointment of directors who are
executives/directors in other firms, perhaps because posts in other firms may be viewed as a signal
of the director’s good quality (e.g. Muravyev et al., 2016).
Regarding firms’ management bodies, there is some evidence that a unitary executive body
represented by a CEO (in contrast with a management board) is not a good idea. In particular, the
coefficient on the unitary CEO dummy is negative and statistically significant in the regressions
with the market-to-book ratio and one-year-ahead ROE.
Most of the control variables are statistically significant and have the expected signs.
However, some seem to be wrongly signed. In particular, the estimated coefficient on the dual-
class stock dummy is positive and statistically significant in the regressions with market-based
performance measures, which runs contrary to the theoretical and empirical findings that issuing
multiple classes of shares is generally a bad idea (e.g. Hart, 1995; Maury and Pajuste, 2005). We
attribute this result to the fact that the coefficient is estimated on a handful of observations (the
within variation in this variable is very small as most firms in the sample do not change their
structure of equity by introducing non-voting stock or converting it into voting one).
Estimating the baseline models using the RE estimator provides similar results.21 In
particular, this is true of the effects of the variables regarding director ownership, the number of
posts and the proportions of female and foreign directors. Additionally, we observe a negative
effect of the average age of directors and no effect of the management body structure. Interestingly,
the dummy for dual-class stock firms now has a negative and statistically significant coefficient in
the regressions with market-based measures of firm performance, confirming our presumption that
most variation in this variable is between (cross-sectional) rather than within (time-series).
21 They are available in Appendix F.
20
However, the (robust version of) the Hausman test rejects the RE estimator. Therefore, in what
follows we rely on the FE regressions.
Table 3 shows the estimated results for the baseline models augmented with the
characteristics of chairmen. The coefficients on the newly-included variables are statistically
insignificant, both individually and jointly (see the F-test reported at the foot of the table). The only
exception is the coefficient on the dummy for insider chairmen in the regression with the market-
to-book ratio, which is positive and statistically significant at the 10% level. Finally, despite a
significant drop in the number of observations, our previous findings survive the specification
change. We conclude that chairmen do not play an important role in Russian firms and thus our
subsequent analysis excludes the characteristics of chairmen from the list of regressors.
In a similar vein, there is no statistically significant relationship between the proportion of
new directors appointed to the board on the one hand and contemporaneous as well as one-year-
ahead performance of firms on the other.22
Next, we test for the presence of structural breaks in the relationship between board
characteristics and firm performance. In addition to the main variables characterizing corporate
boards, the regression models now incorporate their interactions with two dummy variables, one
for the 1998-2001 period and the other for the 2009-2014 period. We expect the structural break in
2001-2002 due to the major changes in the Russian corporate law and the adoption of the Code of
Corporate Conduct in 2002.23 The second potential structural break is associated with the effect of
the 2008 financial crisis and the wave of legislative activity in its aftermath, such as the adoption
of the laws on consolidated financial reporting and insider information.24
The estimation results are shown in Table 4. As noted above, the baseline period is 2002-
2008 and we compare it with the periods of 1998-2001 and 2009-2014. We run F-tests for the
statistical significance of the two sets of the interacted variables (the results of the tests are shown
at the foot of the table). The results provide some support to the hypothesis that the effect of board
characteristics on firm performance varies over time. For example, the effect of board size is less
pronounced in 1998-2001 compared to the other periods. The negative effect of the average age of
directors is only visible after 2008. While these are examples of the relationships that strengthen
22 The results are available in Appendix F. 23 The significance of the 2001 changes in corporate law is shown, for example, in Muravyev (2013). 24 The years 2008-2009 are regarded as an important milestone in the evolution of Russian corporate boards in the
study by Dulyak (2012).

21
over time, other estimates suggest a declining role of particular factors. This is especially true in
the case of female directors (the association with firm performance becomes weaker over time) and
to some extent regarding foreign directors. Finally, some effects may change sign, as is the case
with the ownership stake of insider directors. In the first period before 2002, the point estimate is
0.043, whereas in the baseline period it drops to -0.019 and more recently the effect is essentially
absent (the point estimate is 0.001).
As noted above, these differential effects may be related to the profound changes in the
economic and institutional environment, which influence the role of various corporate governance
mechanisms, including the board of directors, in Russia. However, they may also be driven by the
firms’ gradual optimization of their governance structures, in the spirit of Demsetz and Lehn
(1985).25 In this context, in order to estimate the true effect of board characteristics on firm
performance, one needs to remove the endogenous component in the board variables. As discussed
in Adams et al. (2010), this is a non-trivial task.
As noted in the methodology section, we attempt to tackle the problem using the DPD
estimator, which accounts for the potential persistency of firm financial performance and
endogeneity of board variables. Table 5 shows the estimation results obtained using the two-step
system GMM version of this estimator. The models pass the Hansen test of overidentifying
restrictions and the Arellano-Bond test for the second-order autocorrelation in the errors, as
witnessed by the appropriate p-values reported at the foot of the table. The estimation results
suggest that firm financial performance exhibits considerable persistency, with the coefficient on
the lagged dependent variable being in the range of 0.286 to 0.536. Most importantly, several of
the findings obtained using the standard FE estimator survive this modification of the original
model, with the estimated coefficients remaining significant both economically and statistically.
This is generally the case with foreign ownership, board size and the number of posts held by
directors. However, some of the previously reported results are found to be non-robust. Most
notably, the positive effect of female directors documented earlier in the analysis is no longer
statistically significant, regardless of the dependent variable used. The same is true of the effect of
ownership by directors, both insiders and outsiders. Alternative specifications of the DPD
25 In particular, Demsetz and Lehn (1985, p. 1155) argue that “the structure of corporate ownership varies
systematically in ways that are consistent with value maximization”, which implies the endogeneity of ownership in
firm performance regressions.
22
estimator, for example, with more lags, confirm these results.26 We interpret these findings as
testifying the endogenous nature of the board variables in Russian data. This conclusion implies
that the results of many of the previous analyses of Russian corporate boards that did nothing or
little to address endogeneity may be invalid or should be treated with caution at least.
8. Summary and conclusion
Based on a unique dataset that covers virtually all publicly traded Russian companies over 1998-
2014, our analysis has arrived at several important conclusions.
First, it shows the key structural characteristics of corporate boards in Russian companies,
in particular the ubiquity of medium-sized boards, the prevalence of non-executive directors, small
ownership stakes held by board members and a relatively small representation of female and
foreign directors. In determining the structure of corporate boards, companies adhere to the
thresholds established by law, which is particularly visible in the case of board size.
Second, our data also show that board composition in Russian firms significantly changed
during the period under study. The main trends are a reduction of board size, a decline in director
ownership and an increase in the proportion of female directors and foreign directors (at least, until
2008). The share of insider directors declined, at least until the mid-2000s. The data also suggest
substantial rejuvenation of the boards until the mid-2000s. Since then, the average age of directors
sitting on corporate boards of publicly traded firms in Russia has increased.
Third, several characteristics of corporate boards are related to company performance.
There is a positive association between company performance on the one hand and the fraction of
foreign directors on the other, for which the evidence is quite robust. The appointment of directors
who hold directorships in other firms also seems to improve firm value. The evidence in favor of
insider-outsider director representation and female director representation as well as regarding
ownership by outsider directors is not very robust. In particular, the DPD analysis treating board
variables as endogenous indicates the lack of statistical significance of the respective variables.
Nevertheless, our findings cast doubts on the widely held belief that boards play a limited role in
most Russian companies (e.g. Dolgopyatova et al., 2016).
26 The estimates for the specification with the second and third lags of endogenous variables as instruments are
available in Appendix F.
23
Fourth, the analysis provides evidence of changes in the functioning of Russian corporate
boards. Indeed, the structural characteristics of corporate boards have different effects on firm
performance in 1998-2001 compared with the baseline period of 2002-2008; there is also some
evidence that the 2009-2014 period is different. Some features of corporate boards have evidently
gained in importance (e.g. board size and the within-firm variance of director age) while others
have lost significance (e.g. the proportion of female and foreign directors).
In addition, the results differ depending on whether performance is measured using market-
or accounting-based indicators. This may stem from the fact that different performance measures
characterize different aspects of the firm’s operations. One issue is that the contemporaneous
accounting-based indicators are of a short-term nature, while the market-based indicators reflect
the long-term performance of the firm. Another issue is that different performance indicators may
capture different redistributive aspects within firms, in particular investor expropriation (e.g.
Kuznetsov and Muravyev, 2001). Indeed, the market-based indicators reflect company value for
small shareholders and incorporate the risks of expropriation of small shareholders by large owners,
while the accounting-based measures may fail to do so. Overall, the results clearly suggest that
focusing on a single performance measure is insufficient, at least in the Russian context.
Several caveats are due. First, the data used in this study represent some sort of a
compromise between the wide coverage of firms and greater detail for each firm. As the disclosure
requirements become stricter over time, increasingly more interesting details appear in the annual
and quarterly reports as well as other documents submitted by Russian companies to the regulator
and stock exchanges. However, it is very difficult to collect such information in earlier periods. A
notable example is the virtual lack of data on board committees, at least until the mid-2000s.
Another example is the lack of information necessary to identify independent directors in
accordance with the broad list of criteria set by recent regulations, the 2014 corporate governance
code in particular. By focusing on the 17-year period from 1998 to 2014, we have to discard some
of the important aspects of Russian corporate boards. In this respect, further research may advance
by collecting and analyzing more detailed data from more recent periods.
Second, our study is of an exploratory nature, with an important aim of tracing various
characteristics of corporate boards over a long period and analyzing their relationship with firm
performance. This limits our attention to other important issues. For example, we do not investigate
the determinants of changes of board composition in Russia. Addressing this issue would require

24
a comprehensive review of the legal and business environments in the country, which is more
appropriate for a separate paper. Next, although we have experimented with a large number of
econometric specifications, there is a scope for more consideration of specific governance
variables. For example, in the case of female directors it is common to consider dummy variables
for the presence of at least one/two/three women on the board, in addition to the proportion of
female directors. This can be motivated by the critical mass theory suggesting that the effect of
female directors may only become significant when firms appoint several (typically, three) women
to the board. Further research may also accomplish this task.
Third, and most important, we acknowledge the limits in the interpretation of our findings
in the causal sense, although we made every effort in terms of controlling for various important
characteristics of firms, including those unobserved by the researcher (via the firm fixed effects),
as well as by resorting to the DPD analysis that tackles endogeneity with the help of instruments
from within the panel dataset. Therefore, further research could focus on addressing endogeneity
issues using exogenous shocks to the corporate governance variables, such as the introduction of
mandatory rules regarding independent directors, gender balance and the like (e.g. Ahern and
Dittmar, 2012).
9. References
Adams, R. B., Hermalin, B. E. and Weisbach, M. S. (2010) The Role of Boards of Directors in
Corporate Governance: A Conceptual Framework and Survey. Journal of Economic Literature,
48(1): 58-107.
Ahern, K. R., and Dittmar, A. K. (2012) The changing of the boards: The impact on firm valuation
of mandated female board representation. The Quarterly Journal of Economics, 127(1): 137-197.
Amihud, Y., and H. Mendelson (1986) Asset Pricing and the Bid-Ask Spread. Journal of Financial
Economics, 17(2): 223–49.
Ararat, M., S. Claessens and B. Yurtoglu (2014) Report on the First 10 Years of the Emerging
Markets Corporate Governance Research Network (EMCGN). International Finance Corporation,
Washington DC.
Aras, G. (2015) The Effect of Corporate Governance Practices on Financial Structure in Emerging
Markets: Evidence from BRICK Countries and Lessons for Turkey. Emerging Markets Finance
and Trade, 51(sup2), S5-S24.
Basargin, V., and Perevalov, Yu. (2000) Analysis of the Regularities in the Formation of Corporate
Control at Privatized Enterprises. Problemy Prognozirovaniya, 5: 120-138.
Berezinets, I. Ilina, Y. and A. Cherkasskaya (2013) Board Structure and Financial Performance of
Russian Public Companies. Vestnik Sankt-Peterburgskogo Universiteta: Seriya Menedzhment, 2:
3-52.

25
Berglof, E. and von Thadden, E.-L. (2000) The changing corporate governance paradigm:
Implications for developing and transition economies. In: "Corporate Governance and
Globalization" Long Range Planning Issues, Edward Elgar Publishing LTD: 275-307.
Black, B., de Carvalho, A. G., and Gorga, E. (2012) What matters and for which firms for corporate
governance in emerging markets? Evidence from Brazil (and other BRIK countries). Journal of
Corporate Finance, 18(4): 934–952.
Blundell, R., and Bond, S. (1998) Initial conditions and moment restrictions in dynamic panel data
models. Journal of Econometrics, 87(1), 115-143.
Bokov, V, and Vernikov, A. (2008) Quality of Governance and Bank Valuation in Russia: An
Empirical Study. Korporativnye Finansy, 3(7): 5-17.
Braendle U.C. (2015) New corporate governance norms for Russia – What will change? Corporate
Board: Role, Duties and Composition, 11(1): 21-29.
Carton, R. B., and Hofer, C.W. (2006) Measuring organizational performance: Metrics for
entrepreneurship and strategicmanagement research. Cheltenham, UK: Elgar.
CBR (2014) Corporate Governance Code. Central Bank of Russia. Moscow.
http://www.cbr.ru/sbrfr_new/files/legislation/letters/2014/Inf_apr_1014.pdf, accessed on
November 29, 2016.
Coles, J. L., Daniel, N. D., and Naveen, L. (2008) Boards: Does One Size Fit All? Journal of
Financial Economics, 87(2): 329-356.
Dang, V. A., Kim, M., and Shin, Y. (2015) In search of robust methods for dynamic panel data
models in empirical corporate finance. Journal of Banking and Finance, 53, 84-98.
Demirbas, D. and Yukhanaev, A. (2011) Independence of board of directors, employee relation
and harmonisation of corporate governance: Empirical evidence from Russian listed companies.
Employee Relations, 33(4): 444-471.
Dolgopyatova, T. G., Libman, A., & Yakovlev, A. A. (2016). The Unintended Benefits of
Empowering Boards in Conglomerates: The Case Study of Afk Sistema. Higher School of
Economics Research Paper No. WP BRP, 49, Moscow.
Dolgopyatova, T., Libman, A., Petrov, I., and A. Yakovlev (2015) The Role of a Board of Directors
In Russian Growing Companies: A Case of Joint Stock Financial Corporation “Sistema”.
Rossiyskiy Zhurnal Menedzhnemta 13(1) and 13(2)
Dulyak, Y. (2012) The Evolution of the Board of Directors Role in Russian Companies.
Korporativnye Finansy, 21(1): 24-32.
Dulyak, Y. (2013) Qualitative analysis of the boards of directors role in Russian companies: a
number of in-depth interviews. Korporativnye Finansy, 26(2): 22-32.
Dulyak, Y. (2015) Empirical Analysis of the Boards of Directors’ Impact on the Corporate
Performance of Russian Companies. Ekonomicheskaya Politika, 10, 126-148.
Estrin, S., and Wright, M. (1999) Corporate governance in the former Soviet Union: An overview.
Journal of Comparative Economics, 27(3): 398-421.
FCSM (2002) Code of Corporate Conduct. Federal Commission on the Securities Market.
Moscow. http://www.ecgi.org/codes/documents/final_code_english.pdf, accessed on November
29, 2016.

26
Ferreira, D. and Kirchmaier, T. (2013) Corporate boards in Europe: size, independence and gender
diversity. In Boards and Shareholders in European Listed Companies: Facts, Context and Post-
Crisis Reforms, eds. M. Belcredi and G. Ferrarini, Cambridge University Press, Cambridge, pp.
191-224.
Frye, T. M., and Iwasaki, I. (2011) Government directors and business–state relations in
Russia. European Journal of Political Economy, 27(4), 642-658.
Goetzmann, W. N., Spiegel, M., and Ukhov, A. (2003) Modeling and measuring Russian corporate
governance: The case of Russian preferred and common shares (No. w9469). National Bureau of
Economic Research.
Hart, O. (1995). Firms, contracts, and financial structure. Clarendon Press.
Ilchyuk, K. (2006) Study of the econometric link between performance and board structure in
Russian companies over 1999-2004. Audit i finansovy analiz, 4: 80-89.
Ivashkovskaya I., and Stepanova A. (2011) Does Strategic Corporate Performance Depend on
Corporate Financial Architecture? Empirical Study of European, Russian and Other Emerging
Market’s Firms. Journal of Management and Governance, 15: 603-616.
Iwasaki, I. (2008) The determinants of board composition in a transforming economy: Evidence
from Russia. Journal of corporate finance, 14(5): 532-549.
Iwasaki, I. (2013) Firm-level determinants of board system choice: Evidence from
Russia. Comparative Economic Studies, 55(4): 636-671.
Iwasaki, I. (2014) Global financial crisis, corporate governance, and firm survival: The Russian
experience. Journal of Comparative Economics,42(1): 178-211.
Judge, W. Q., Naoumova, I., and Koutzevol, N. (2003) Corporate governance and firm
performance in Russia: an empirical study. Journal of World Business, 38(4): 385-396.
Kaiser, B. (2014) RHAUSMAN: Stata module to perform a (cluster-)robust Hausman test,
University of Bern.
Kokoreva, M., and Stepanova, A. (2012) Financial Architecture and Corporate Performance:
Evidence from Russia. Korporativnye Finansy, 2(22): 34–44.
Kuznetsov, P., and Muravyev, A. (2001) Ownership concentration and firm performance in Russia:
the case of blue chips of the stock market. Acta Oeconomica, 51(4): 469-488.
Law on Joint-Stock Companies (1995). http://cis-legislation.com/document.fwx?rgn=1465 as
accessed on November 29, 2016.
Lehman, E., Weigand, J., 2000. Does the governed corporation perform better? Governance
structures and corporate performance in Germany. European Finance Review 4, 157--195.
Maslennikova, M., and Stepanova, A. (2010) The Influence of Ownership Structure over Corporate
Performance in Russia and Brazil. Korporativnye Finansy, 3(15): 35-46.
Maury, B., and Pajuste, A. (2005) Multiple large shareholders and firm value. Journal of Banking
& Finance, 29(7): 1813-1834.
McGee, R. W. (ed.) (2008) Corporate Governance in Transition Economies. New York, Springer.
Melkumov, D. (2009) Institutional background as a determinant of boards of directors’ internal
and external roles: The case of Russia. Journal of World Business, 44(1): 94-103.

27
Muravyev, A. (2013) Investor Protection and the Value of Shares: Evidence from Statutory Rules
Governing Variations of Shareholders’ Class Rights in an Emerging Market. Journal of Law,
Economics, and Organization, 29 (6): 1344-1383.
Muravyev, A., Berezinets, I., and Ilina, Y. (2014) The structure of corporate boards and private
benefits of control: evidence from the Russian stock exchange. International Review of Financial
Analysis, 34: 247-261.
Muravyev, A., Talavera, O., and Weir, C. (2016) Performance effects of appointing other firms’
executive directors to corporate boards: an analysis of UK firms. Review of Quantitative Finance
and Accounting, 46(1), 25-45.
Nordberg, D. (2011) Corporate Governance: Principles and Issues. Sage Publications, London.
Peng, M. W., Buck, T. and Filatotchev, I. (2003) Do outside directors and new managers help
improve firm performance? An exploratory study in Russian privatization. Journal of World
Business, 38(4): 348-360.
Prokofieva, M., and Muniandy, B. (2011) Board Composition and Audit Fee: Evidence from
Russia. Corporate Ownership and Control Journal, 8(2): 551-565.
Przybyłowski, M., Aluchna, M., and Zamojska, A. (2011) Role of independent supervisory board
members in Central and Eastern European countries. International Journal of Disclosure and
Governance, 8(1): 77-98.
Roodman, D. (2009) How to do xtabond2: An introduction to difference and system GMM in Stata.
Stata Journal, 9(1), 86-136.
Saeed, A., Belghitar, Y., and Yousaf, A. (2016) Firm-level determinants of gender diversity in the
boardrooms: Evidence from some emerging markets. International Business Review.
Shleifer, A. and Vishny, R. (1997) A Survey of Corporate Governance. Journal of Finance 52(2):
737–783.
Stepanova, A., and Balkina, E. (2013) Corporate Financial Architecture at different lifecycle
stages: Performance Effect in Russia. Korporativnye Finansy, 3(27): 4-20.
Stepanova, A., and Kouzmin, C. (2011) Corporate Governance and Operational Efficiency:
Evidence from Russia. Korporativnye Finansy, 4(20): 24-39.

28
FIGURES AND TABLES
Figure 1. Basic characteristics of the sample.
Panel A. Distribution of observations by year.
Panel B. Distribution of observations by industry.
Panel C. Distribution of observations by macro-region.
0
.02
.04
.06
.08
Fra
ction
2000 2005 2010 2015
23.35%
21.07%
12.09%
11.55%
11.55%
8.016%
7.568%
3.381%
1.411%
Electricity, gas & water Manufacturing
Communications Real estate & other services
Wholesale & retail trade Mining
Metallurgy Transport
Other
24.36%
15.07%
12.67%11.53%
10.5%
6.807%
6.158%
5.598%
4.657%
2.642%
Volga Moscow city
Central Urals
Siberian St. Petersburg city
Southern Far Eastern
North-Western North Caucasus

29
Figure 2. Dynamics of firm performance indicators.
Panel A: Market-to-book ratio. Panel B: Tobin’s Q.
Panel C: ROE. Panel D: ROA.

30
Figure 3. Distribution of key characteristics of corporate boards.
Panel A. Board size (Number of directors). Panel B. Share of insider directors.
Panel C. Share of state-related directors. Panel D. Share of not independent directors.
Panel E. Share of female directors. Panel F. Share of foreign directors.
Panel G. Average age of directors, years. Panel H. Total ownership by directors, %.
0.1
.2.3
.4
Fra
ctio
n
0 5 10 15 20 25
0
.05
.1.1
5.2
.25
Fra
ctio
n
0 .2 .4 .6 .8 1
0.2
.4.6
.8
Fra
ctio
n
0 .2 .4 .6 .8
0
.05
.1.1
5.2
Fra
ctio
n
0 .2 .4 .6 .8 1
0.1
.2.3
.4
Fra
ctio
n
0 .2 .4 .6 .8 1
0.2
.4.6
.8
Fra
ctio
n
0 .2 .4 .6 .8
0
.02
.04
.06
.08
Fra
ctio
n
20 30 40 50 60 70
0.2
.4.6
.81
Fra
ctio
n
0 20 40 60 80 100
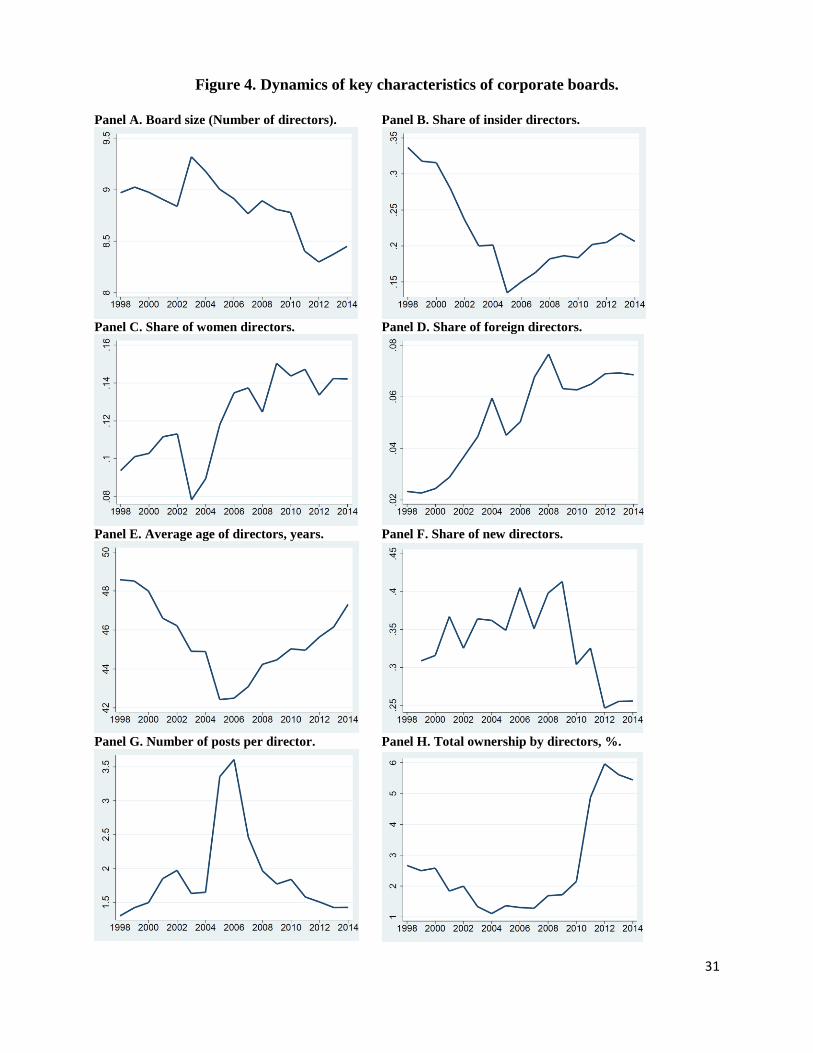
31
Figure 4. Dynamics of key characteristics of corporate boards.
Panel A. Board size (Number of directors). Panel B. Share of insider directors.
Panel C. Share of women directors. Panel D. Share of foreign directors.
Panel E. Average age of directors, years. Panel F. Share of new directors.
Panel G. Number of posts per director. Panel H. Total ownership by directors, %.

32
Figure 5. Dynamics of key characteristics of board chairmen.
Panel A. Share of insider chairmen. Panel B. Share of chairwomen.
Panel C. Share of foreign chairmen. Panel D. Average age of chairmen, years.
Panel E. Ownership by chairmen, %.
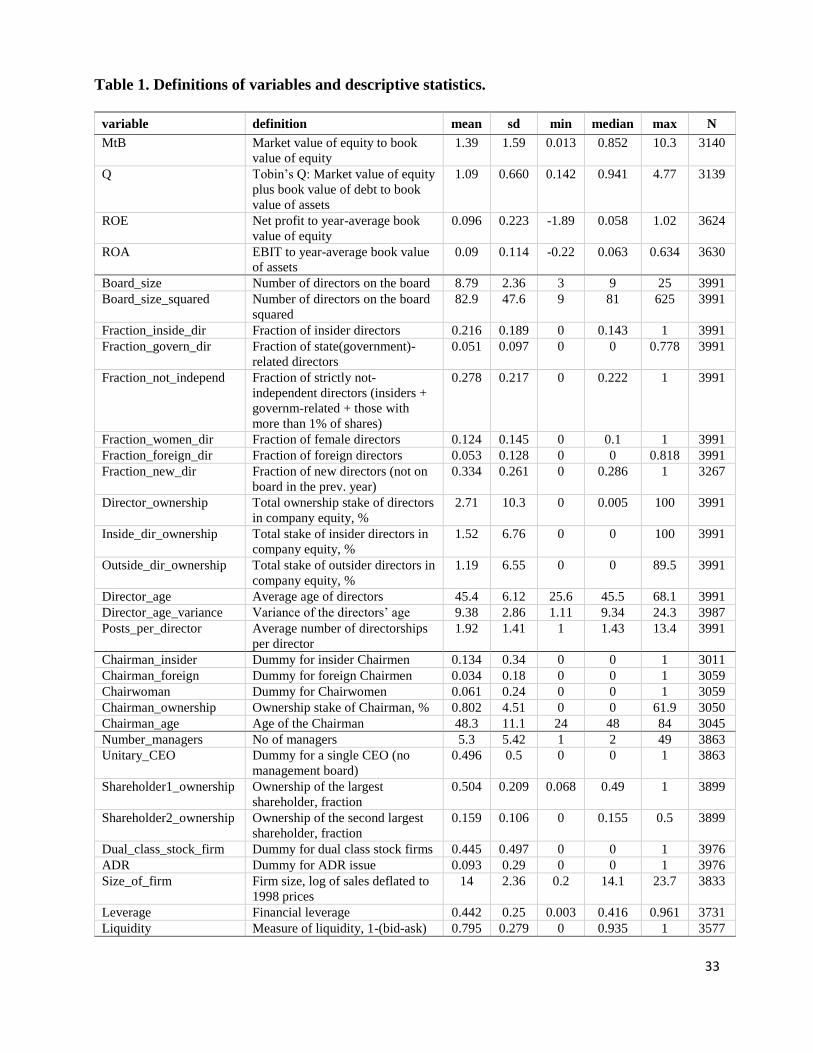
33
Table 1. Definitions of variables and descriptive statistics.
variable definition mean sd min median max N
MtB Market value of equity to book
value of equity
1.39 1.59 0.013 0.852 10.3 3140
Q Tobin’s Q: Market value of equity
plus book value of debt to book
value of assets
1.09 0.660 0.142 0.941 4.77 3139
ROE Net profit to year-average book
value of equity
0.096 0.223 -1.89 0.058 1.02 3624
ROA EBIT to year-average book value
of assets
0.09 0.114 -0.22 0.063 0.634 3630
Board_size Number of directors on the board 8.79 2.36 3 9 25 3991
Board_size_squared Number of directors on the board
squared
82.9 47.6 9 81 625 3991
Fraction_inside_dir Fraction of insider directors 0.216 0.189 0 0.143 1 3991
Fraction_govern_dir Fraction of state(government)-
related directors
0.051 0.097 0 0 0.778 3991
Fraction_not_independ Fraction of strictly not-
independent directors (insiders +
governm-related + those with
more than 1% of shares)
0.278 0.217 0 0.222 1 3991
Fraction_women_dir Fraction of female directors 0.124 0.145 0 0.1 1 3991
Fraction_foreign_dir Fraction of foreign directors 0.053 0.128 0 0 0.818 3991
Fraction_new_dir Fraction of new directors (not on
board in the prev. year)
0.334 0.261 0 0.286 1 3267
Director_ownership Total ownership stake of directors
in company equity, %
2.71 10.3 0 0.005 100 3991
Inside_dir_ownership Total stake of insider directors in
company equity, %
1.52 6.76 0 0 100 3991
Outside_dir_ownership Total stake of outsider directors in
company equity, %
1.19 6.55 0 0 89.5 3991
Director_age Average age of directors 45.4 6.12 25.6 45.5 68.1 3991
Director_age_variance Variance of the directors’ age 9.38 2.86 1.11 9.34 24.3 3987
Posts_per_director Average number of directorships
per director
1.92 1.41 1 1.43 13.4 3991
Chairman_insider Dummy for insider Chairmen 0.134 0.34 0 0 1 3011
Chairman_foreign Dummy for foreign Chairmen 0.034 0.18 0 0 1 3059
Chairwoman Dummy for Chairwomen 0.061 0.24 0 0 1 3059
Chairman_ownership Ownership stake of Chairman, % 0.802 4.51 0 0 61.9 3050
Chairman_age Age of the Chairman 48.3 11.1 24 48 84 3045
Number_managers No of managers 5.3 5.42 1 2 49 3863
Unitary_CEO Dummy for a single CEO (no
management board)
0.496 0.5 0 0 1 3863
Shareholder1_ownership Ownership of the largest
shareholder, fraction
0.504 0.209 0.068 0.49 1 3899
Shareholder2_ownership Ownership of the second largest
shareholder, fraction
0.159 0.106 0 0.155 0.5 3899
Dual_class_stock_firm Dummy for dual class stock firms 0.445 0.497 0 0 1 3976
ADR Dummy for ADR issue 0.093 0.29 0 0 1 3976
Size_of_firm Firm size, log of sales deflated to
1998 prices
14 2.36 0.2 14.1 23.7 3833
Leverage Financial leverage 0.442 0.25 0.003 0.416 0.961 3731
Liquidity Measure of liquidity, 1-(bid-ask) 0.795 0.279 0 0.935 1 3577
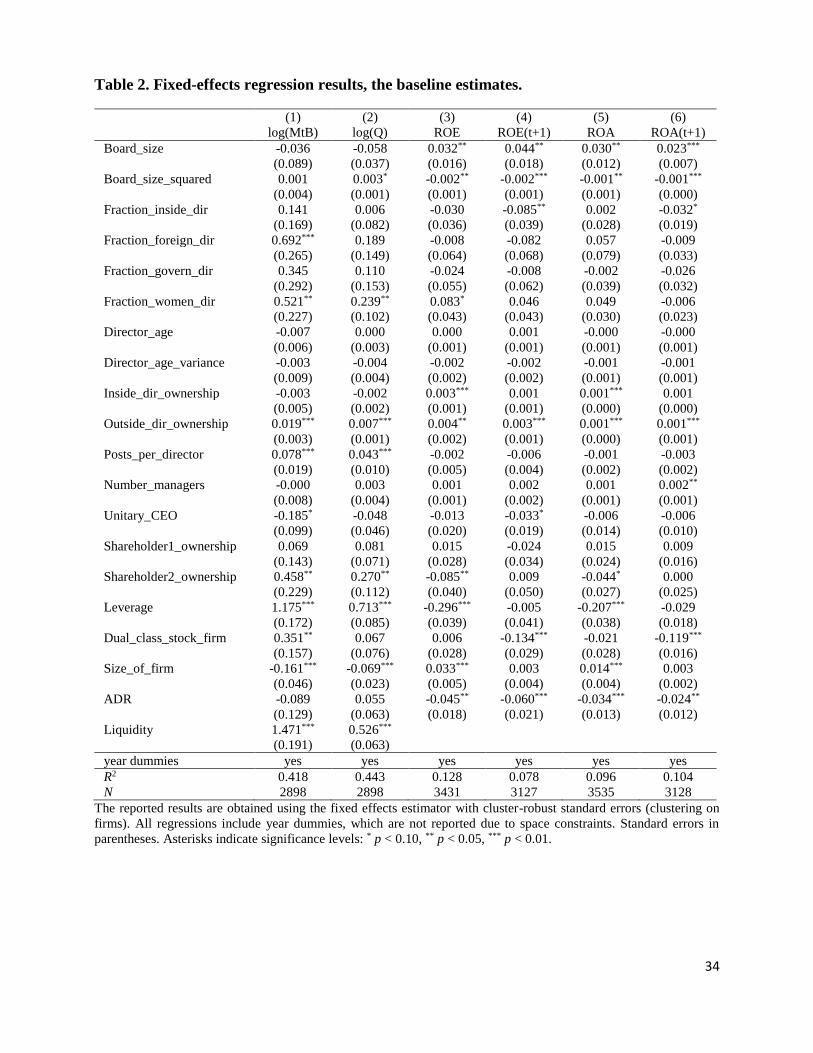
34
Table 2. Fixed-effects regression results, the baseline estimates.
(1) (2) (3) (4) (5) (6)
log(MtB) log(Q) ROE ROE(t+1) ROA ROA(t+1)
Board_size -0.036 -0.058 0.032** 0.044** 0.030** 0.023***
(0.089) (0.037) (0.016) (0.018) (0.012) (0.007)
Board_size_squared 0.001 0.003* -0.002** -0.002*** -0.001** -0.001***
(0.004) (0.001) (0.001) (0.001) (0.001) (0.000)
Fraction_inside_dir 0.141 0.006 -0.030 -0.085** 0.002 -0.032*
(0.169) (0.082) (0.036) (0.039) (0.028) (0.019)
Fraction_foreign_dir 0.692*** 0.189 -0.008 -0.082 0.057 -0.009
(0.265) (0.149) (0.064) (0.068) (0.079) (0.033)
Fraction_govern_dir 0.345 0.110 -0.024 -0.008 -0.002 -0.026
(0.292) (0.153) (0.055) (0.062) (0.039) (0.032)
Fraction_women_dir 0.521** 0.239** 0.083* 0.046 0.049 -0.006
(0.227) (0.102) (0.043) (0.043) (0.030) (0.023)
Director_age -0.007 0.000 0.000 0.001 -0.000 -0.000
(0.006) (0.003) (0.001) (0.001) (0.001) (0.001)
Director_age_variance -0.003 -0.004 -0.002 -0.002 -0.001 -0.001
(0.009) (0.004) (0.002) (0.002) (0.001) (0.001)
Inside_dir_ownership -0.003 -0.002 0.003*** 0.001 0.001*** 0.001
(0.005) (0.002) (0.001) (0.001) (0.000) (0.000)
Outside_dir_ownership 0.019*** 0.007*** 0.004** 0.003*** 0.001*** 0.001***
(0.003) (0.001) (0.002) (0.001) (0.000) (0.001)
Posts_per_director 0.078*** 0.043*** -0.002 -0.006 -0.001 -0.003
(0.019) (0.010) (0.005) (0.004) (0.002) (0.002)
Number_managers -0.000 0.003 0.001 0.002 0.001 0.002**
(0.008) (0.004) (0.001) (0.002) (0.001) (0.001)
Unitary_CEO -0.185* -0.048 -0.013 -0.033* -0.006 -0.006
(0.099) (0.046) (0.020) (0.019) (0.014) (0.010)
Shareholder1_ownership 0.069 0.081 0.015 -0.024 0.015 0.009
(0.143) (0.071) (0.028) (0.034) (0.024) (0.016)
Shareholder2_ownership 0.458** 0.270** -0.085** 0.009 -0.044* 0.000
(0.229) (0.112) (0.040) (0.050) (0.027) (0.025)
Leverage 1.175*** 0.713*** -0.296*** -0.005 -0.207*** -0.029
(0.172) (0.085) (0.039) (0.041) (0.038) (0.018)
Dual_class_stock_firm 0.351** 0.067 0.006 -0.134*** -0.021 -0.119***
(0.157) (0.076) (0.028) (0.029) (0.028) (0.016)
Size_of_firm -0.161*** -0.069*** 0.033*** 0.003 0.014*** 0.003
(0.046) (0.023) (0.005) (0.004) (0.004) (0.002)
ADR -0.089 0.055 -0.045** -0.060*** -0.034*** -0.024**
(0.129) (0.063) (0.018) (0.021) (0.013) (0.012)
Liquidity 1.471*** 0.526***
(0.191) (0.063)
year dummies yes yes yes yes yes yes
R2 0.418 0.443 0.128 0.078 0.096 0.104
N 2898 2898 3431 3127 3535 3128
The reported results are obtained using the fixed effects estimator with cluster-robust standard errors (clustering on
firms). All regressions include year dummies, which are not reported due to space constraints. Standard errors in
parentheses. Asterisks indicate significance levels: * p < 0.10, ** p < 0.05, *** p < 0.01.
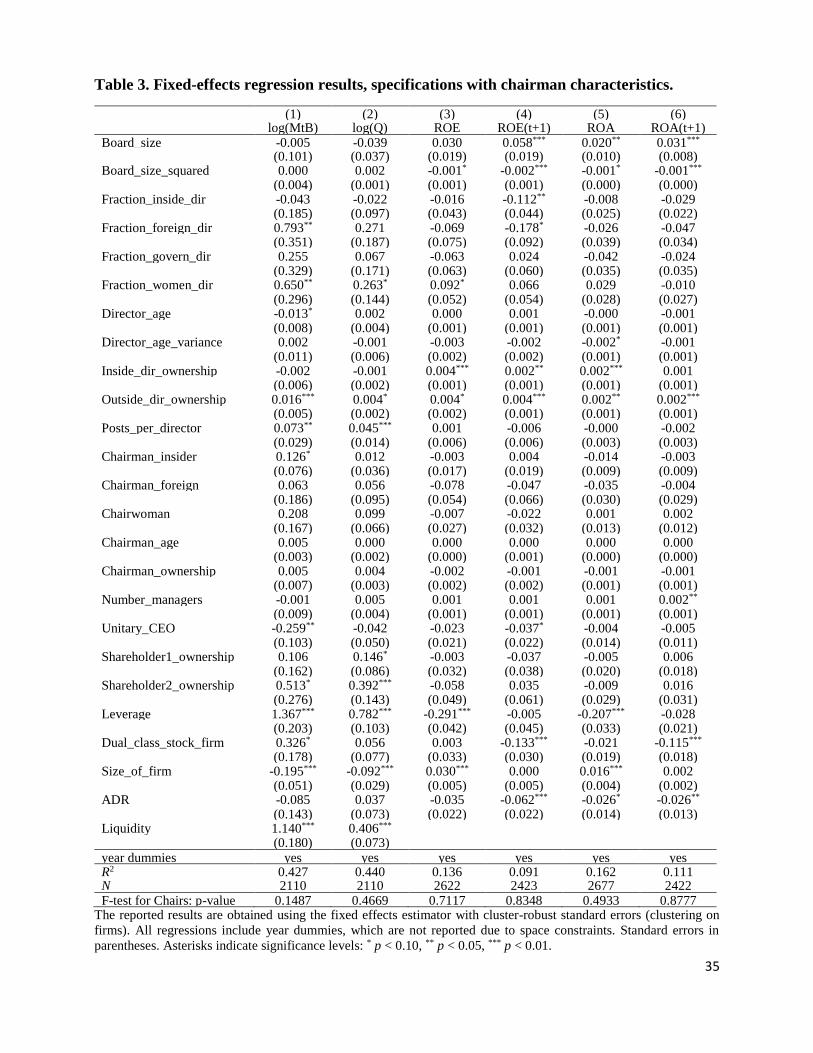
35
Table 3. Fixed-effects regression results, specifications with chairman characteristics.
(1) (2) (3) (4) (5) (6) log(MtB) log(Q) ROE ROE(t+1) ROA ROA(t+1) Board_size -0.005 -0.039 0.030 0.058*** 0.020** 0.031*** (0.101) (0.037) (0.019) (0.019) (0.010) (0.008) Board_size_squared 0.000 0.002 -0.001* -0.002*** -0.001* -0.001*** (0.004) (0.001) (0.001) (0.001) (0.000) (0.000) Fraction_inside_dir -0.043 -0.022 -0.016 -0.112** -0.008 -0.029 (0.185) (0.097) (0.043) (0.044) (0.025) (0.022) Fraction_foreign_dir 0.793** 0.271 -0.069 -0.178* -0.026 -0.047 (0.351) (0.187) (0.075) (0.092) (0.039) (0.034) Fraction_govern_dir 0.255 0.067 -0.063 0.024 -0.042 -0.024 (0.329) (0.171) (0.063) (0.060) (0.035) (0.035) Fraction_women_dir 0.650** 0.263* 0.092* 0.066 0.029 -0.010 (0.296) (0.144) (0.052) (0.054) (0.028) (0.027) Director_age -0.013* 0.002 0.000 0.001 -0.000 -0.001 (0.008) (0.004) (0.001) (0.001) (0.001) (0.001) Director_age_variance 0.002 -0.001 -0.003 -0.002 -0.002* -0.001 (0.011) (0.006) (0.002) (0.002) (0.001) (0.001) Inside_dir_ownership -0.002 -0.001 0.004*** 0.002** 0.002*** 0.001 (0.006) (0.002) (0.001) (0.001) (0.001) (0.001) Outside_dir_ownership 0.016*** 0.004* 0.004* 0.004*** 0.002** 0.002*** (0.005) (0.002) (0.002) (0.001) (0.001) (0.001) Posts_per_director 0.073** 0.045*** 0.001 -0.006 -0.000 -0.002 (0.029) (0.014) (0.006) (0.006) (0.003) (0.003) Chairman_insider 0.126* 0.012 -0.003 0.004 -0.014 -0.003 (0.076) (0.036) (0.017) (0.019) (0.009) (0.009) Chairman_foreign 0.063 0.056 -0.078 -0.047 -0.035 -0.004 (0.186) (0.095) (0.054) (0.066) (0.030) (0.029) Chairwoman 0.208 0.099 -0.007 -0.022 0.001 0.002 (0.167) (0.066) (0.027) (0.032) (0.013) (0.012) Chairman_age 0.005 0.000 0.000 0.000 0.000 0.000 (0.003) (0.002) (0.000) (0.001) (0.000) (0.000) Chairman_ownership 0.005 0.004 -0.002 -0.001 -0.001 -0.001 (0.007) (0.003) (0.002) (0.002) (0.001) (0.001) Number_managers -0.001 0.005 0.001 0.001 0.001 0.002** (0.009) (0.004) (0.001) (0.001) (0.001) (0.001) Unitary_CEO -0.259** -0.042 -0.023 -0.037* -0.004 -0.005 (0.103) (0.050) (0.021) (0.022) (0.014) (0.011) Shareholder1_ownership 0.106 0.146* -0.003 -0.037 -0.005 0.006 (0.162) (0.086) (0.032) (0.038) (0.020) (0.018) Shareholder2_ownership 0.513* 0.392*** -0.058 0.035 -0.009 0.016 (0.276) (0.143) (0.049) (0.061) (0.029) (0.031) Leverage 1.367*** 0.782*** -0.291*** -0.005 -0.207*** -0.028 (0.203) (0.103) (0.042) (0.045) (0.033) (0.021) Dual_class_stock_firm 0.326* 0.056 0.003 -0.133*** -0.021 -0.115*** (0.178) (0.077) (0.033) (0.030) (0.019) (0.018) Size_of_firm -0.195*** -0.092*** 0.030*** 0.000 0.016*** 0.002 (0.051) (0.029) (0.005) (0.005) (0.004) (0.002) ADR -0.085 0.037 -0.035 -0.062*** -0.026* -0.026** (0.143) (0.073) (0.022) (0.022) (0.014) (0.013) Liquidity 1.140*** 0.406*** (0.180) (0.073) year dummies yes yes yes yes yes yes R2 0.427 0.440 0.136 0.091 0.162 0.111 N 2110 2110 2622 2423 2677 2422 F-test for Chairs: p-value 0.1487 0.4669 0.7117 0.8348 0.4933 0.8777
The reported results are obtained using the fixed effects estimator with cluster-robust standard errors (clustering on
firms). All regressions include year dummies, which are not reported due to space constraints. Standard errors in
parentheses. Asterisks indicate significance levels: * p < 0.10, ** p < 0.05, *** p < 0.01.

36
Table 4. Fixed-effects regression results, specifications with structural breaks.
(1) (2) (3) (4) (5) (6)
log(MtB) log(Q) ROE ROE(t+1) ROA ROA(t+1)
Board_size -0.028 -0.033 0.050** 0.059** 0.035*** 0.026***
(0.115) (0.055) (0.021) (0.026) (0.014) (0.009)
Board_size*bf02 0.004 -0.010 -0.049** -0.039* -0.002 -0.013
(0.153) (0.084) (0.024) (0.024) (0.014) (0.011)
Board_size*af08 0.031 0.010 0.017 -0.004 -0.005 0.005
(0.160) (0.075) (0.027) (0.033) (0.020) (0.013)
Board_size_squared 0.001 0.001 -0.003*** -0.003** -0.002*** -0.001***
(0.005) (0.002) (0.001) (0.001) (0.001) (0.000)
Board_size_squared*bf02 -0.000 0.001 0.003** 0.002* 0.000 0.001
(0.006) (0.003) (0.001) (0.001) (0.001) (0.001)
Board_size_squared*af08 -0.000 0.000 -0.000 0.000 0.000 -0.000
(0.008) (0.004) (0.001) (0.002) (0.001) (0.001)
Fraction_inside_dir -0.194 -0.105 -0.065 -0.054 -0.034 -0.022
(0.212) (0.113) (0.044) (0.047) (0.030) (0.027)
Fraction_inside_dir*bf02 0.073 -0.162 0.089 -0.001 0.069 0.008
(0.374) (0.198) (0.067) (0.076) (0.043) (0.042)
Fraction_inside_dir*af08 0.458* 0.082 0.046 -0.050 0.033 -0.011
(0.244) (0.128) (0.058) (0.064) (0.042) (0.032)
Fraction_foreign_dir 0.534 0.256 -0.020 -0.125 0.010 -0.016
(0.375) (0.227) (0.079) (0.092) (0.057) (0.044)
Fraction_foreign_dir*bf02 2.775*** 1.070** 0.266* 0.088 0.077 -0.023
(0.824) (0.523) (0.138) (0.144) (0.072) (0.057)
Fraction_foreign_dir*af08 0.571 0.047 0.039 0.098 0.139 0.031
(0.425) (0.258) (0.078) (0.076) (0.101) (0.035)
Fraction_govern_dir -0.091 -0.188 0.013 0.102 0.017 0.003
(0.330) (0.193) (0.072) (0.064) (0.046) (0.036)
Fraction_govern_dir*bf02 0.993* 0.309 -0.193** -0.220*** -0.134** -0.118**
(0.581) (0.329) (0.077) (0.075) (0.053) (0.050)
Fraction_govern_dir*af08 0.031 0.252 0.103 0.021 0.101 0.070
(0.508) (0.271) (0.102) (0.162) (0.079) (0.066)
Fraction_women_dir 0.789** 0.468*** 0.042 0.001 0.011 -0.025
(0.339) (0.174) (0.053) (0.056) (0.031) (0.030)
Fraction_women_dir*bf02 1.909** 0.700* -0.005 -0.003 0.051 0.054
(0.743) (0.386) (0.084) (0.097) (0.055) (0.065)
Fraction_women_dir*af08 -0.738* -0.437** 0.083 0.032 0.068 0.003
(0.434) (0.198) (0.068) (0.071) (0.054) (0.034)
Director_age -0.010 -0.000 0.001 0.000 0.001 -0.000
(0.009) (0.004) (0.002) (0.001) (0.001) (0.001)
Director_age*bf02 0.018 0.015 -0.000 -0.000 0.000 0.002
(0.018) (0.009) (0.002) (0.002) (0.002) (0.001)
Director_age*af08 -0.018** -0.012*** -0.003 -0.001 -0.003** -0.002**
(0.009) (0.005) (0.002) (0.002) (0.001) (0.001)
Director_age_variance 0.009 0.002 0.001 -0.001 0.002 -0.001
(0.014) (0.008) (0.003) (0.003) (0.002) (0.001)
Director_age_variance*bf02 0.006 -0.007 0.002 -0.000 0.001 0.001
(0.024) (0.014) (0.004) (0.004) (0.002) (0.002)
Director_age_variance*af08 0.003 0.007 -0.007** -0.005 -0.007** -0.000
(0.017) (0.009) (0.003) (0.004) (0.003) (0.002)
Inside_dir_ownership -0.019*** -0.009*** 0.001 0.000 0.001 0.001*
(0.007) (0.002) (0.002) (0.001) (0.001) (0.001)
Inside_dir_ownership*bf02 0.062*** 0.025* 0.002 0.002 0.003 0.001
(0.021) (0.013) (0.004) (0.002) (0.002) (0.001)
Inside_dir_ownership*af08 0.020** 0.010*** 0.002 -0.000 0.001 -0.001

37
(0.008) (0.003) (0.002) (0.001) (0.001) (0.001)
Outside_dir_ownership 0.017*** 0.006*** 0.003** 0.003*** 0.002*** 0.001**
(0.004) (0.002) (0.001) (0.001) (0.001) (0.001)
Outside_dir_ownership*bf02 0.100* 0.030 0.001 0.002 -0.001 0.001
(0.058) (0.044) (0.003) (0.002) (0.001) (0.001)
Outside_dir_ownership*af08 0.007 0.003 0.000 0.001 -0.000 -0.000
(0.009) (0.004) (0.001) (0.002) (0.001) (0.001)
Posts_per_director 0.153*** 0.100*** 0.007 0.000 0.005** 0.002
(0.023) (0.012) (0.005) (0.004) (0.002) (0.002)
Posts_per_director*bf02 -0.098 -0.041 -0.008 -0.017 0.006 -0.009
(0.082) (0.043) (0.011) (0.013) (0.007) (0.007)
Posts_per_director*af08 0.126* -0.015 -0.004 -0.005 -0.009 -0.007
(0.065) (0.024) (0.010) (0.011) (0.006) (0.005)
Number_managers -0.010 -0.003 0.000 0.002 0.001 0.002**
(0.008) (0.004) (0.001) (0.002) (0.001) (0.001)
Unitary_CEO -0.131 -0.034 -0.000 -0.016 0.001 0.001
(0.094) (0.047) (0.019) (0.020) (0.014) (0.010)
Shareholder1_ownership 0.216 0.161** 0.037 -0.037 0.031 0.004
(0.147) (0.072) (0.028) (0.034) (0.024) (0.016)
Shareholder2_ownership 0.692*** 0.404*** -0.085** -0.004 -0.041 -0.001
(0.250) (0.118) (0.040) (0.049) (0.028) (0.023)
Leverage 1.069*** 0.667*** -0.305*** -0.016 -0.208*** -0.031*
(0.176) (0.090) (0.040) (0.042) (0.039) (0.018)
Dual_class_stock_firm 0.266* 0.013 0.011 -0.107*** -0.036 -0.103***
(0.153) (0.074) (0.028) (0.029) (0.026) (0.016)
Size_of_firm -0.180*** -0.081*** 0.033*** 0.004 0.014*** 0.002
(0.041) (0.022) (0.005) (0.004) (0.004) (0.002)
ADR 0.189 0.195*** -0.021 -0.002 -0.018 -0.006
(0.125) (0.063) (0.016) (0.018) (0.011) (0.012)
Liquidity 1.604*** 0.597***
(0.191) (0.068)
bf02 -1.655 -0.824 0.217 0.221 -0.040 -0.029
(1.329) (0.679) (0.169) (0.172) (0.105) (0.091)
af08 0.146 0.332 0.010 0.083 0.162* 0.047
(0.865) (0.429) (0.161) (0.188) (0.091) (0.071)
R2 0.292 0.265 0.107 0.038 0.084 0.072
N 2898 2898 3431 3127 3535 3128
F-test for 2002-, p-value 0.0014 0.2769 0.0953 0.0353 0.1523 0.0480
F-test for 2008+, p-value 0.0100 0.0066 0.1615 0.8975 0.0168 0.0405
The reported results are obtained using the fixed effects estimator with cluster-robust standard errors (clustering on
firms). Each variable characterizing the board of directors enters the model directly and also in the form of interactions
with a pre-2002 dummy (variable bf02) and a post-2008 dummy (variable af08). The coefficients on the interacted
variables therefore show the deviations of the estimated effects in 1998-2001 and 2009-2014 from the baseline level,
which is associated with 2002-2008. Standard errors in parentheses. Asterisks indicate significance levels: * p < 0.10, ** p < 0.05, *** p < 0.01.

38
Table 5. GMM-SYS dynamic panel data regressions results.
(1) (2) (3) (4)
log(MtB) log(Q) ROE ROA
Lagged_dependent_var 0.456*** 0.536*** 0.286*** 0.431***
(0.038) (0.039) (0.055) (0.042)
Board_size -0.053 -0.030 0.048** 0.018
(0.100) (0.047) (0.023) (0.012)
Board_size_squared 0.003 0.001 -0.002** -0.001*
(0.005) (0.002) (0.001) (0.001)
Fraction_inside_dir 0.057 0.206** 0.092 0.035
(0.228) (0.097) (0.058) (0.031)
Fraction_foreign_dir 1.082*** 0.410*** 0.051 0.062*
(0.300) (0.148) (0.074) (0.037)
Fraction_govern_dir 0.811* 0.408 0.053 0.053
(0.417) (0.259) (0.063) (0.041)
Fraction_women_dir 0.472 0.091 0.114 0.047
(0.325) (0.144) (0.074) (0.033)
Director_age 0.005 0.002 -0.003 -0.001
(0.008) (0.004) (0.002) (0.001)
Director_age_variance -0.019 -0.013* -0.005 -0.002
(0.016) (0.008) (0.003) (0.001)
Inside_dir_ownership 0.002 -0.001 0.001 0.000
(0.005) (0.003) (0.001) (0.001)
Outside_dir_ownership 0.004 -0.000 0.002 0.001
(0.007) (0.003) (0.001) (0.001)
Posts_per_director 0.102*** 0.047*** -0.018*** -0.012***
(0.025) (0.011) (0.006) (0.003)
Number_managers -0.002 -0.000 -0.000 0.000
(0.006) (0.002) (0.001) (0.001)
Unitary_CEO 0.074 -0.003 0.014 0.008
(0.063) (0.028) (0.014) (0.007)
Shareholder1_ownership -0.244** -0.084 -0.035 -0.036***
(0.121) (0.058) (0.027) (0.013)
Shareholder2_ownership 0.018 0.017 -0.027 -0.028
(0.177) (0.092) (0.044) (0.023)
Leverage 0.880*** 0.357*** -0.119*** -0.085***
(0.104) (0.046) (0.025) (0.011)
Dual_class_stock_firm -0.070 -0.034 0.017 0.010*
(0.052) (0.022) (0.012) (0.005)
Size_of_firm -0.047** -0.024** 0.019*** 0.012***
(0.022) (0.011) (0.004) (0.002)
ADR 0.072 0.061* 0.004 -0.001
(0.083) (0.035) (0.014) (0.008)
Liquidity 0.662*** 0.341***
(0.148) (0.057)
Year dummies yes yes yes yes
AB test for AR(2), p-value 0.753 0.124 0.137 0.014
Hansen test, p-value 0.567 0.705 0.491 0.535
N 2392 2391 2901 2908
The reported results are obtained using the two-step system GMM estimator for dynamic panel data (DPD) with second
lags of endogenous regressors playing the role of instruments. All regressions include year dummies, which are not
reported due to space constraints. Robust standard errors are in parentheses. Asterisks indicate significance levels: * p
< 0.10, ** p < 0.05, *** p < 0.01.

39
APPENDICES
Appendix A. Review of previous studies on corporate boards in Russian companies.
Table 1 provides an overview of the empirical papers that deal with boards of directors in Russian
companies. For this particular survey we apply the following selection criteria. First, to ensure good
quality of the studies included in the analysis we only consider articles published in peer-reviewed
academic journals, both international (in English) and national (in Russian), between 2000 and
2015. For international publications, we restrict ourselves to empirical articles in academic journals
indexed in the Web of Science, Scopus and EconLit, excluding journals mentioned in the Jeffry
Beal list of potential, possible or probable predatory scholarly open-access publishers/journals
(https://scholarlyoa.com/, accessed on November 29, 2016). For sources in Russian, we require
that they are original articles published in national journals included in the Russian Science Citation
Index.27 Unpublished (working) papers, chapters in books as well as reports by international
organizations (e.g. OECD) or audit and consultancy firms (e.g. PWC and KPMG) are excluded
from the survey.
Second, the relevant articles are identified using key words “corporate board” and/or “board
of directors” as well as “Russia”. In addition to that, we examine all sources mentioned in the lists
of references of the identified articles as well as papers giving citations to the identified articles.
This allows us to find works that contain substantial results on corporate boards even if these works
do not exclusively focus on boards of directors.
Third, we restrict our attention to empirical papers that are based on sample data (with the
number of observations equal or greater than 30) and apply the tools of regression analysis. This
excludes conceptual papers that contain no empirical analysis, such as Melkumov (2009),
monographic studies (e.g. Dolgopyatova et al., 2015), other purely qualitative analyses (e.g.
Dulyak 2013). Papers based on extremely small samples (Bokov and Vernikov, 2008), studies
claiming the use of statistical/regression analysis but presenting no relevant results (Kokoreva and
Stepanova, 2012), as well as those relying on descriptive tools and simple statistical methods, such
as Demirbas and Yukhanaev (2011) are also ignored.
27 The database of the Scientific Electronic Library, www.elibrary.ru.

40
Finally, multi-country studies are generally included if they contain substantial results
regarding corporate boards in Russia. Of course, the last criterion is rather vague and for that reason
we prefer to be as inclusive as possible. For example, we include the paper by Przybylowski et al.
(2011) even though the size of the Russian sample is just 10 companies (the overall sample consists
of 40 firms). However, despite the presence of the terms “board of directors” and “Russia” in the
key words, we exclude Black et al. (2012) as, in contrast to other countries studied, it has almost
no information on Russian boards.

41
Appendix A Table 1. Review of previous studies on corporate boards in Russian companies.
N Authors and title Main research
questions Data sources and sample
Data: type,
period, no
obs.
Methods and key variables Main results
International journals, Russia only studies
1 Judge, Naoumova,
Koutzevol (2003)
Corporate governance
and firm performance
in Russia: an
empirical study
Relationship between
board structure and
firm performance.
Questionnaire-based survey.
Convenience sample of Russian
managers from Tartarstan,
Bashkortostan and the Moscow
region.
116 questionnaires distributed,
113 questionnaires received, only
45 with complete data
Cross-
sectional data
from 2002.
No. obs.=45.
Descriptive and regression
analysis (OLS).
Main dep. var.: first principal
component of the 8 items
relating the firm to its
competitors and measured by
five-point Likert scale.
Informal CEO duality is negatively
related to firm performance.
The more the firms engage in
retrenchment activities, the more
negative the relationship between
proportion of inside directors and firm
performance.
Retrenchment strategy was positively
related to overall firm performance
2 Peng, Buck and
Filatotchev (2003) Do
outside directors and
new managers help
improve firm
performance? An
exploratory study in
Russian privatization
Tests two standard
agency theory
hypotheses, namely,
(1) outside board
members and (2) new
managers are
positively related to
firm performance.
Questionnaire-based survey.
“Quasi-random” sample of
industrial firms in six major
industrial regions.
314 responses, of which 230 from
open JSC.
Cross-
sectional data
from late 1995
and early
1996. Max
No. obs.=303.
Ordered probit regression
analysis.
Dep. vars.: relative changes in
pre-tax profits and return on
investment measured by seven-
point Likert scale.
No evidence that the presence of
outside directors and new managers is
associated with improved firm
performance.
Casts doubt on the global validity of the
agency theory.
3 Iwasaki (2008) The
determinants of board
composition in a
transforming
economy: Evidence
from Russia
Determinants of
corporate board
composition
(especially, outsider
directorship) and its
relation to special
features of corporate
law, privatization and
business groups.
Questionnaire-based survey by
Hitotsubashi University and the
Higher School of Economics.
Stratified sampling of industrial
and communications enterprises
with more than 100 employees
from 64 regions.
859 firms sampled, 822 complete
responses from top managers.
Cross-
sectional data
from 2005.
No. obs.=730.
Descriptive, correlation and
regression analysis (Tobit and
2SLS models as well as quantile
regression, and Heckman two-
step model).
Dep. var.: the proportion of
outsider directors.
Boards are formed in accordance with
the economic and organizational logics
applied to mature capitalist economies.
Bargaining variables are major
determinants Russia's legal system and
its peculiarities as a transition economy
have a certain influence on board
composition.
4 Frye and Iwasaki
(2011) Government
directors and
business–state
relations in Russia
Impact of government
directors on corporate
boards for firm
behavior.
Same as in Iwasaki (2008) Same as in
Iwasaki
(2008).
Descriptive, statistical,
regression analysis (OLS,
probit, Heckman selection
models).
Dep.vars.: firm performance
(frequency of dividend
payments); the degree of
compliance with the corp. gov.
code; benefit provision from
firms to the state and vice versa.
Government directors on corporate
boards are consistent with a “collusion”
ideal type of relations between firms
and the state than with a managerial
discipline or rent-extraction ideal type.
The state sends directors to firms that
both extract resources from the state,
but that also provide important benefits
and services to the state.

42
5 Prokofieva and
Muniandy (2011)
Board Composition
and Audit Fee:
Evidence from Russia
Does board
composition (presence
of independent
directors and state
representatives)
influence audit fee in
the Russian capital
market?
Top 147 non-finance companies
listed on Russian Trading System
(RTS) stock exchange which
disclose the information regarding
their audit fees according to
Osiris Database.
Data hand collected from publicly
available Russian annual reports,
financial statements and company
announcements.
Cross-
sectional data
from 2008,
No. obs.=147.
Standard regression analysis
(OLS).
Dep.var.: natural log of audit
fees charged to the client.
Audit fees are positively associated
with the presence of an independent
chairman, as well as with the proportion
of independent directors and State
representatives on the board. This is
consistent with the demand-side
perspective of audit services: good
corporate governance practices demand
for a higher level of audit assurance and
result in higher audit fees.
6 Iwasaki (2013) Firm-
Level Determinants of
Board System Choice:
Evidence from Russia
The determinants of
the choice and size of
the collective
executive board, a
core element of the
multi-tier board
system of Russian
firms.
Same as in Iwasaki (2008) Same as in
Iwasaki
(2008)
Regression analysis: probit and
maximum likelihood sample
selection models.
Dep.vars.: dummy for a
collective executive board; size
of the executive board.
Company executives’ need for a
collective management system drives
the formation of a collective executive
board. Outside investors are generally
indifferent toward its adoption as a
means to strengthening control over top
management. Russian firms in the
pursuit of the internationalization of
their business activities tend to avoid
the establishment of a collective
executive board.
7 Iwasaki (2014) Global
financial crisis,
corporate governance,
and firm survival: The
Russian experience
Corporate governance
the determinants of
survival of Russian
firms around the 2008
financial crisis.
Same as in Iwasaki (2008) plus a
follow-up survey conducted
between October and December
of 2009.
Same as in
Iwasaki
(2008);
follow-up
survey in
2009.
Regression analysis based on
the Cox proportional hazard
model.
Dep. var.: firm survival.
Independence of company’s
governance bodies, their human
resource abundance, and influence over
corporate management affect the
survival probability of the surveyed
firms.
The board and the audit committee are
likely to play a vital role in reducing the
potential exit risk.
There is a significant difference in the
viewpoints of economic logic for firm
survival held by independent firms and
group companies.
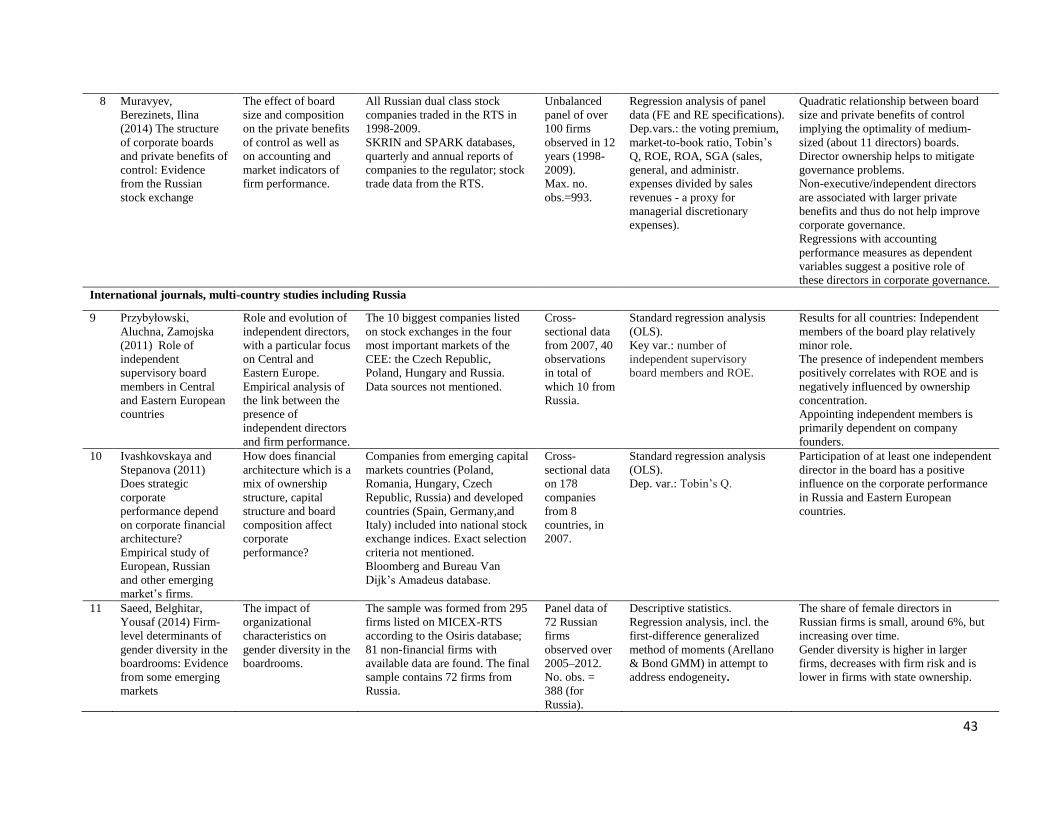
43
8 Muravyev,
Berezinets, Ilina
(2014) The structure
of corporate boards
and private benefits of
control: Evidence
from the Russian
stock exchange
The effect of board
size and composition
on the private benefits
of control as well as
on accounting and
market indicators of
firm performance.
All Russian dual class stock
companies traded in the RTS in
1998-2009.
SKRIN and SPARK databases,
quarterly and annual reports of
companies to the regulator; stock
trade data from the RTS.
Unbalanced
panel of over
100 firms
observed in 12
years (1998-
2009).
Max. no.
obs.=993.
Regression analysis of panel
data (FE and RE specifications).
Dep.vars.: the voting premium,
market-to-book ratio, Tobin’s
Q, ROE, ROA, SGA (sales,
general, and administr.
expenses divided by sales
revenues - a proxy for
managerial discretionary
expenses).
Quadratic relationship between board
size and private benefits of control
implying the optimality of medium-
sized (about 11 directors) boards.
Director ownership helps to mitigate
governance problems.
Non-executive/independent directors
are associated with larger private
benefits and thus do not help improve
corporate governance.
Regressions with accounting
performance measures as dependent
variables suggest a positive role of
these directors in corporate governance.
International journals, multi-country studies including Russia
9 Przybyłowski,
Aluchna, Zamojska
(2011) Role of
independent
supervisory board
members in Central
and Eastern European
countries
Role and evolution of
independent directors,
with a particular focus
on Central and
Eastern Europe.
Empirical analysis of
the link between the
presence of
independent directors
and firm performance.
The 10 biggest companies listed
on stock exchanges in the four
most important markets of the
CEE: the Czech Republic,
Poland, Hungary and Russia.
Data sources not mentioned.
Cross-
sectional data
from 2007, 40
observations
in total of
which 10 from
Russia.
Standard regression analysis
(OLS).
Key var.: number of
independent supervisory
board members and ROE.
Results for all countries: Independent
members of the board play relatively
minor role.
The presence of independent members
positively correlates with ROE and is
negatively influenced by ownership
concentration.
Appointing independent members is
primarily dependent on company
founders.
10 Ivashkovskaya and
Stepanova (2011)
Does strategic
corporate
performance depend
on corporate financial
architecture?
Empirical study of
European, Russian
and other emerging
market’s firms.
How does financial
architecture which is a
mix of ownership
structure, capital
structure and board
composition affect
corporate
performance?
Companies from emerging capital
markets countries (Poland,
Romania, Hungary, Czech
Republic, Russia) and developed
countries (Spain, Germany,and
Italy) included into national stock
exchange indices. Exact selection
criteria not mentioned.
Bloomberg and Bureau Van
Dijk’s Amadeus database.
Cross-
sectional data
on 178
companies
from 8
countries, in
2007.
Standard regression analysis
(OLS).
Dep. var.: Tobin’s Q.
Participation of at least one independent
director in the board has a positive
influence on the corporate performance
in Russia and Eastern European
countries.
11 Saeed, Belghitar,
Yousaf (2014) Firm-
level determinants of
gender diversity in the
boardrooms: Evidence
from some emerging
markets
The impact of
organizational
characteristics on
gender diversity in the
boardrooms.
The sample was formed from 295
firms listed on MICEX-RTS
according to the Osiris database;
81 non-financial firms with
available data are found. The final
sample contains 72 firms from
Russia.
Panel data of
72 Russian
firms
observed over
2005–2012.
No. obs. =
388 (for
Russia).
Descriptive statistics.
Regression analysis, incl. the
first-difference generalized
method of moments (Arellano
& Bond GMM) in attempt to
address endogeneity.
The share of female directors in
Russian firms is small, around 6%, but
increasing over time.
Gender diversity is higher in larger
firms, decreases with firm risk and is
lower in firms with state ownership.
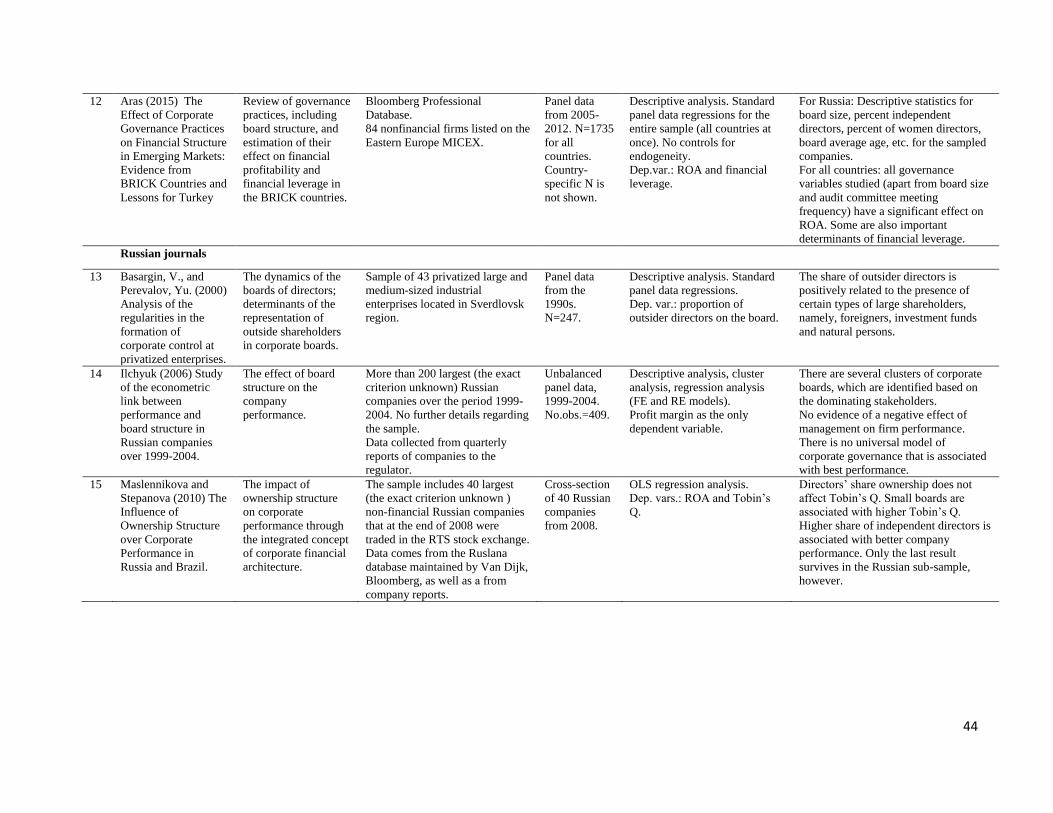
44
12 Aras (2015) The
Effect of Corporate
Governance Practices
on Financial Structure
in Emerging Markets:
Evidence from
BRICK Countries and
Lessons for Turkey
Review of governance
practices, including
board structure, and
estimation of their
effect on financial
profitability and
financial leverage in
the BRICK countries.
Bloomberg Professional
Database.
84 nonfinancial firms listed on the
Eastern Europe MICEX.
Panel data
from 2005-
2012. N=1735
for all
countries.
Country-
specific N is
not shown.
Descriptive analysis. Standard
panel data regressions for the
entire sample (all countries at
once). No controls for
endogeneity.
Dep.var.: ROA and financial
leverage.
For Russia: Descriptive statistics for
board size, percent independent
directors, percent of women directors,
board average age, etc. for the sampled
companies.
For all countries: all governance
variables studied (apart from board size
and audit committee meeting
frequency) have a significant effect on
ROA. Some are also important
determinants of financial leverage. Russian journals
13 Basargin, V., and
Perevalov, Yu. (2000)
Analysis of the
regularities in the
formation of
corporate control at
privatized enterprises.
The dynamics of the
boards of directors;
determinants of the
representation of
outside shareholders
in corporate boards.
Sample of 43 privatized large and
medium-sized industrial
enterprises located in Sverdlovsk
region.
Panel data
from the
1990s.
N=247.
Descriptive analysis. Standard
panel data regressions.
Dep. var.: proportion of
outsider directors on the board.
The share of outsider directors is
positively related to the presence of
certain types of large shareholders,
namely, foreigners, investment funds
and natural persons.
14 Ilchyuk (2006) Study
of the econometric
link between
performance and
board structure in
Russian companies
over 1999-2004.
The effect of board
structure on the
company
performance.
More than 200 largest (the exact
criterion unknown) Russian
companies over the period 1999-
2004. No further details regarding
the sample.
Data collected from quarterly
reports of companies to the
regulator.
Unbalanced
panel data,
1999-2004.
No.obs.=409.
Descriptive analysis, cluster
analysis, regression analysis
(FE and RE models).
Profit margin as the only
dependent variable.
There are several clusters of corporate
boards, which are identified based on
the dominating stakeholders.
No evidence of a negative effect of
management on firm performance.
There is no universal model of
corporate governance that is associated
with best performance.
15 Maslennikova and
Stepanova (2010) The
Influence of
Ownership Structure
over Corporate
Performance in
Russia and Brazil.
The impact of
ownership structure
on corporate
performance through
the integrated concept
of corporate financial
architecture.
The sample includes 40 largest
(the exact criterion unknown )
non-financial Russian companies
that at the end of 2008 were
traded in the RTS stock exchange.
Data comes from the Ruslana
database maintained by Van Dijk,
Bloomberg, as well as а from
company reports.
Cross-section
of 40 Russian
companies
from 2008.
OLS regression analysis.
Dep. vars.: ROA and Tobin’s
Q.
Directors’ share ownership does not
affect Tobin’s Q. Small boards are
associated with higher Tobin’s Q.
Higher share of independent directors is
associated with better company
performance. Only the last result
survives in the Russian sub-sample,
however.

45
16 Stepanova and
Kouzmin (2011)
Corporate governance
and operational
efficiency: evidence
from Russia.
The impact of
corporate governance
on operational
efficiency of Russian
companies.
Russian companies that were
publicly traded on the MICEX in
2007.
54 companies in total.
Factiva database, company
reports and database of the
Laboratory of corporate finance
of the Higher School of
Economics.
Cross-
sectional data
from 2007.
No. obs.=54.
Regression analysis: Tobit
model.
Dependent variable: Firm
efficiency as measured using
frontier efficiency methods
(DEA and SFA).
Larger ownership stakes in the hands of
board members are associated with
poorer performance of firms.
Larger ownership stakes in the hands of
managers are associated with improved
performance of firms.
17 Berezinets, Ilina,
Cherkasskaya (2013)
Board Structure and
Financial
Performance of
Russian Public
Companies.
The relationship
between board
structure and financial
performance of
Russian public
companies, measured
by the market-based
indicator – Tobin’s Q.
Russian companies that were
traded at the RTS through the
period 2007-2011.
Data are assembled from the
SKRIN database.
Unbalanced
panel, 207
companies
over 5 years
(2007 to
2011), with
834 obs. in
total.
Regression analysis: FE
models.
The only dependent variable is
Tobin’s Q.
Non-linear association between board
size and Tobin’s Q (minimum at 11
directors). Gender diversity is
positively linked with Tobin’s Q.
No relation between the number of
independent directors and Tobin’s Q.
The presence on the board of audit
committee, remuneration committee,
and strategy committee does not affect
company performance.
18 Stepanova and
Balkina (2013)
Corporate financial
architecture at
different lifecycle
stages: Performance
effect in Russia
The relationship
between the corporate
financial architecture
and strategic
performance of
Russian companies
measured by Tobin’s
Q.
All Russian non-financial
companies in operation for at
least 6 years with enough data to
compute sales growth rates
between 2002 and 2011.
The initial sample includes 261
firms. The final sample includes
only 81 firms.
Key financials are taken from
Worldscope. Corporate
governance data are taken from
the annual and quarterly reports.
Unbalanced
panel data of
81 companies
and 8 years;
No. obs.=477.
Regression analysis: FE
models.
The only dependent variable is
Tobin’s Q (market
capitalization plus book value
of debt divided by total assets).
The effect of board characteristics on
company performance differs
depending on the stage of the
company’s life cycle. Overall, board
independence is positively associated
with company performance. However,
this effect is negative for companies in
the recession stage.
19 Dulyak (2015)
Empirical Analysis of
the Boards of
Directors’ Impact on
the Corporate
Performance of
Russian Companies
The impact of board
composition and
structure as well as of
personal
characteristics of the
board members on
corporate
performance.
The universe includes medium-
sized and large non-financial
firms (with sales revenues at least
400 mln Rubles) registered as
open joint-stock companies (not
necessarily public) and in
operation for at least 5 years
(3789 firms). A random sample of
200 firms is drawn. The data are
assembled from the SPARK-
Interfax database.
Panel data of
200 Russian
large and
medium joint-
stock
companies in
2007-2011.
No. obs.=738.
Fixed-effects regressions.
Dependent variables: economic
profit and return on assets.
Firm performance depends on a number
of characteristics of corporate boards
(the share of executive directors, the
number of directors with the working
experience in the same industry,
chairman working in the boards of other
companies).

46
Appendix B. Additional descriptive statistics.
Appendix B Table 1. Industry composition of the sample over time.
Industry 1998 1999 2000 2001 2002 2003 2004 2005 2006 2007 2008 2009 2010 2011 2012 2013 2014 Total
Mining 17 14 17 18 17 17 16 17 17 15 16 19 17 20 19 18 18 292
8.33 7.00 7.14 7.17 7.87 10.06 9.88 7.20 6.72 5.30 6.13 7.12 6.37 7.09 7.28 7.76 8.53 7.31
Manufacturing 42 40 43 49 41 42 39 37 44 49 59 59 61 66 57 55 50 833 20.59 20.00 18.07 19.52 18.98 24.85 24.07 15.68 17.39 17.31 22.61 22.10 22.85 23.40 21.84 23.71 23.70 20.86
Metallurgy 12 14 17 18 12 13 11 14 15 17 21 21 22 22 20 15 15 279
5.88 7.00 7.14 7.17 5.56 7.69 6.79 5.93 5.93 6.01 8.05 7.87 8.24 7.80 7.66 6.47 7.11 6.99
Electricity, gas & water 37 37 47 51 48 48 48 97 92 95 59 58 59 60 54 44 43 977 18.14 18.50 19.75 20.32 22.22 28.40 29.63 41.10 36.36 33.57 22.61 21.72 22.10 21.28 20.69 18.97 20.38 24.47
Wholesale & retail trade 8 8 10 9 8 8 10 31 39 46 46 45 46 48 43 41 32 478
3.92 4.00 4.20 3.59 3.70 4.73 6.17 13.14 15.42 16.25 17.62 16.85 17.23 17.02 16.48 17.67 15.17 11.97
Transport 6 6 6 8 7 8 6 7 8 8 8 7 8 8 8 8 8 125
2.94 3.00 2.52 3.19 3.24 4.73 3.70 2.97 3.16 2.83 3.07 2.62 3.00 2.84 3.07 3.45 3.79 3.13
Communications 64 62 77 78 66 16 16 14 15 15 15 15 14 7 8 8 8 498
31.37 31.00 32.35 31.08 30.56 9.47 9.88 5.93 5.93 5.30 5.75 5.62 5.24 2.48 3.07 3.45 3.79 12.47
Real estate & other 18 19 21 20 17 17 16 19 22 38 36 40 36 39 39 32 28 457
services 8.82 9.50 8.82 7.97 7.87 10.06 9.88 8.05 8.70 13.43 13.79 14.98 13.48 13.83 14.94 13.79 13.27 11.45
Other 0 0 0 0 0 0 0 0 1 0 1 3 4 12 13 11 9 54
0.00 0.00 0.00 0.00 0.00 0.00 0.00 0.00 0.40 0.00 0.38 1.12 1.50 4.26 4.98 4.74 4.27 1.35
Total 204 200 238 251 216 169 162 236 253 283 261 267 267 282 261 232 211 3,993
100.0 100.0 100.0 100.0 100.0 100.0 100.0 100.0 100.0 100.0 100.0 100.0 100.0 100.0 100.0 100.0 100.0 100.0
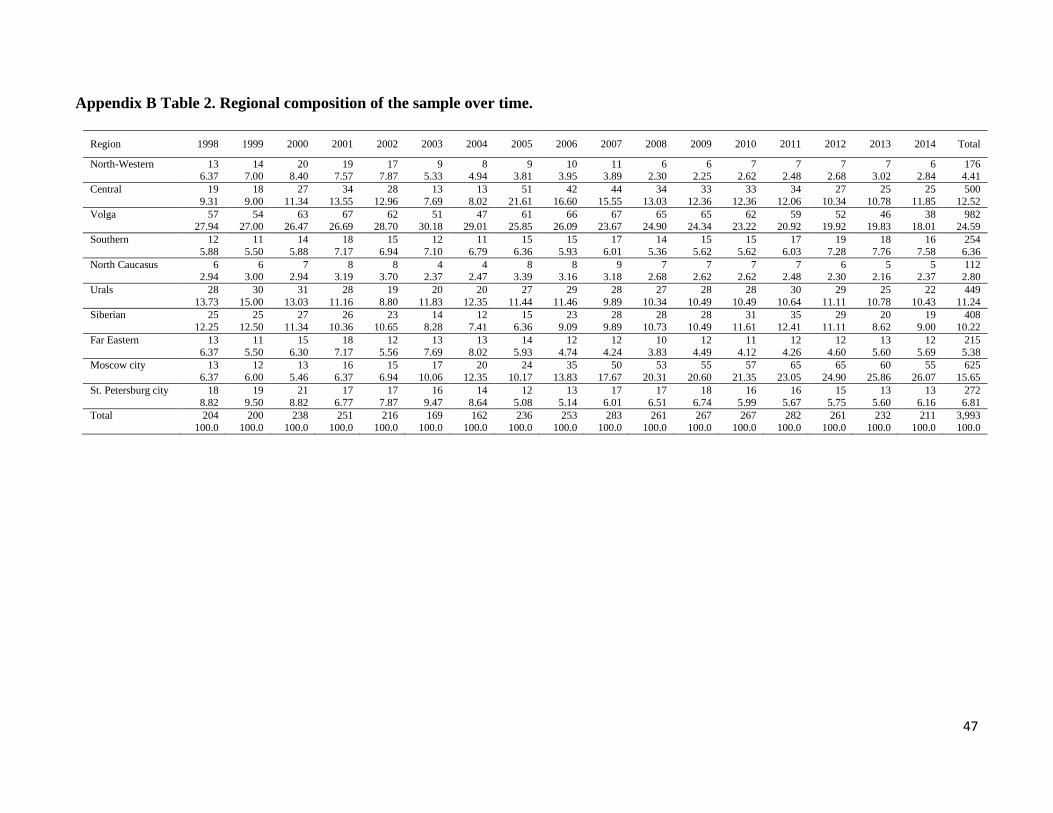
47
Appendix B Table 2. Regional composition of the sample over time.
Region 1998 1999 2000 2001 2002 2003 2004 2005 2006 2007 2008 2009 2010 2011 2012 2013 2014 Total
North-Western 13 14 20 19 17 9 8 9 10 11 6 6 7 7 7 7 6 176 6.37 7.00 8.40 7.57 7.87 5.33 4.94 3.81 3.95 3.89 2.30 2.25 2.62 2.48 2.68 3.02 2.84 4.41
Central 19 18 27 34 28 13 13 51 42 44 34 33 33 34 27 25 25 500
9.31 9.00 11.34 13.55 12.96 7.69 8.02 21.61 16.60 15.55 13.03 12.36 12.36 12.06 10.34 10.78 11.85 12.52
Volga 57 54 63 67 62 51 47 61 66 67 65 65 62 59 52 46 38 982 27.94 27.00 26.47 26.69 28.70 30.18 29.01 25.85 26.09 23.67 24.90 24.34 23.22 20.92 19.92 19.83 18.01 24.59
Southern 12 11 14 18 15 12 11 15 15 17 14 15 15 17 19 18 16 254
5.88 5.50 5.88 7.17 6.94 7.10 6.79 6.36 5.93 6.01 5.36 5.62 5.62 6.03 7.28 7.76 7.58 6.36
North Caucasus 6 6 7 8 8 4 4 8 8 9 7 7 7 7 6 5 5 112 2.94 3.00 2.94 3.19 3.70 2.37 2.47 3.39 3.16 3.18 2.68 2.62 2.62 2.48 2.30 2.16 2.37 2.80
Urals 28 30 31 28 19 20 20 27 29 28 27 28 28 30 29 25 22 449
13.73 15.00 13.03 11.16 8.80 11.83 12.35 11.44 11.46 9.89 10.34 10.49 10.49 10.64 11.11 10.78 10.43 11.24
Siberian 25 25 27 26 23 14 12 15 23 28 28 28 31 35 29 20 19 408
12.25 12.50 11.34 10.36 10.65 8.28 7.41 6.36 9.09 9.89 10.73 10.49 11.61 12.41 11.11 8.62 9.00 10.22
Far Eastern 13 11 15 18 12 13 13 14 12 12 10 12 11 12 12 13 12 215
6.37 5.50 6.30 7.17 5.56 7.69 8.02 5.93 4.74 4.24 3.83 4.49 4.12 4.26 4.60 5.60 5.69 5.38
Moscow city 13 12 13 16 15 17 20 24 35 50 53 55 57 65 65 60 55 625
6.37 6.00 5.46 6.37 6.94 10.06 12.35 10.17 13.83 17.67 20.31 20.60 21.35 23.05 24.90 25.86 26.07 15.65
St. Petersburg city 18 19 21 17 17 16 14 12 13 17 17 18 16 16 15 13 13 272
8.82 9.50 8.82 6.77 7.87 9.47 8.64 5.08 5.14 6.01 6.51 6.74 5.99 5.67 5.75 5.60 6.16 6.81
Total 204 200 238 251 216 169 162 236 253 283 261 267 267 282 261 232 211 3,993
100.0 100.0 100.0 100.0 100.0 100.0 100.0 100.0 100.0 100.0 100.0 100.0 100.0 100.0 100.0 100.0 100.0 100.0
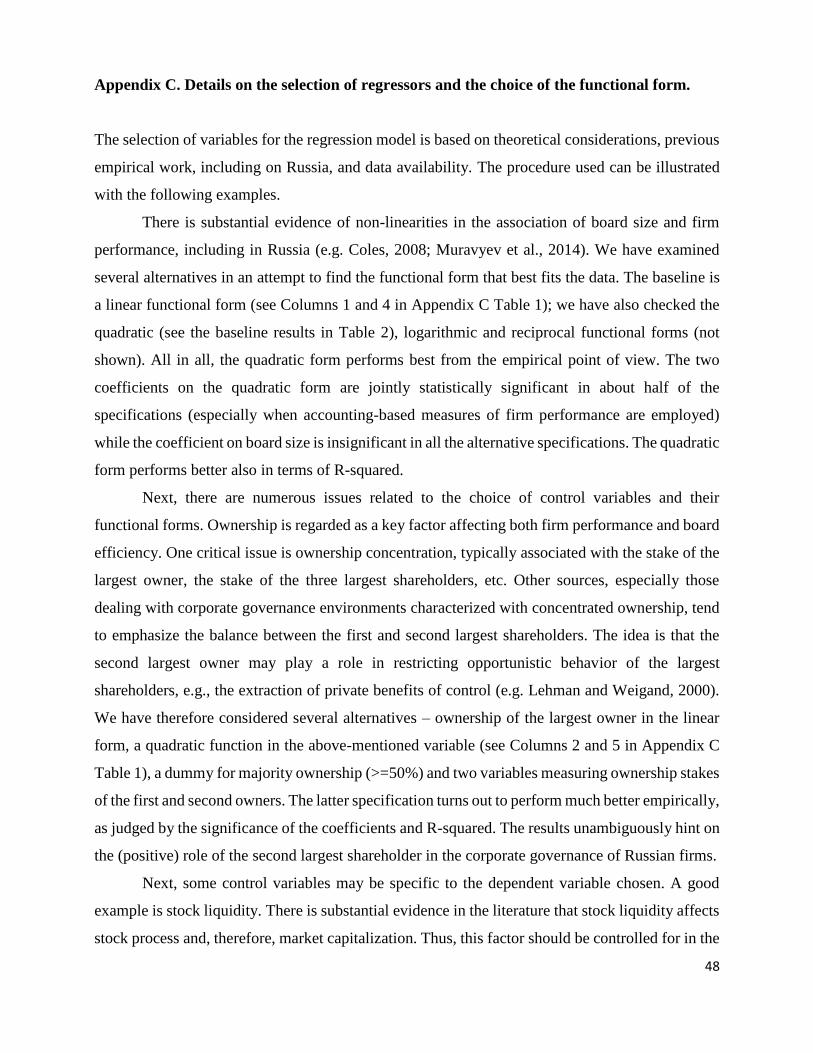
48
Appendix C. Details on the selection of regressors and the choice of the functional form.
The selection of variables for the regression model is based on theoretical considerations, previous
empirical work, including on Russia, and data availability. The procedure used can be illustrated
with the following examples.
There is substantial evidence of non-linearities in the association of board size and firm
performance, including in Russia (e.g. Coles, 2008; Muravyev et al., 2014). We have examined
several alternatives in an attempt to find the functional form that best fits the data. The baseline is
a linear functional form (see Columns 1 and 4 in Appendix C Table 1); we have also checked the
quadratic (see the baseline results in Table 2), logarithmic and reciprocal functional forms (not
shown). All in all, the quadratic form performs best from the empirical point of view. The two
coefficients on the quadratic form are jointly statistically significant in about half of the
specifications (especially when accounting-based measures of firm performance are employed)
while the coefficient on board size is insignificant in all the alternative specifications. The quadratic
form performs better also in terms of R-squared.
Next, there are numerous issues related to the choice of control variables and their
functional forms. Ownership is regarded as a key factor affecting both firm performance and board
efficiency. One critical issue is ownership concentration, typically associated with the stake of the
largest owner, the stake of the three largest shareholders, etc. Other sources, especially those
dealing with corporate governance environments characterized with concentrated ownership, tend
to emphasize the balance between the first and second largest shareholders. The idea is that the
second largest owner may play a role in restricting opportunistic behavior of the largest
shareholders, e.g., the extraction of private benefits of control (e.g. Lehman and Weigand, 2000).
We have therefore considered several alternatives – ownership of the largest owner in the linear
form, a quadratic function in the above-mentioned variable (see Columns 2 and 5 in Appendix C
Table 1), a dummy for majority ownership (>=50%) and two variables measuring ownership stakes
of the first and second owners. The latter specification turns out to perform much better empirically,
as judged by the significance of the coefficients and R-squared. The results unambiguously hint on
the (positive) role of the second largest shareholder in the corporate governance of Russian firms.
Next, some control variables may be specific to the dependent variable chosen. A good
example is stock liquidity. There is substantial evidence in the literature that stock liquidity affects
stock process and, therefore, market capitalization. Thus, this factor should be controlled for in the

49
regressions with Tobin’s Q and the market-to-book ratio. However, from the theory viewpoint there
is little rational for using it as a control variable in regressions with ROE and ROE. This turns to
be the case empirically: while the measure of liquidity chosen is positively and statistically
significantly associated with Tobin’s Q and the market-to-book ratio, it has zero effect on ROE and
ROA (e.g., Column 6 in Appendix C Table 1). We therefore include this control variable only in
the regressions with the market-based performance measures.
Finally, the regressions with the market-based performance measures may accommodate
an additional control variable that captures contemporaneous profitability of the firm. In such a
setting, the interpretation of the coefficients on the board structure variables is conditional on the
accounting performance of the firm: controlling for ownership, size, leverage, etc. and (!) current
profitability, what is the effect of board size, etc. on the firm’s market value? As might be expected,
the coefficients on such variables measuring firm profitability are positive and statistically
significant; however, the inclusion of these additional controls leaves the key coefficients of
interest only marginally affected (e.g., Column 3 in Appendix C Table 1). We therefore follow the
golden rule suggesting, other things being equal, more parsimonious models and do not include
ROE and ROA as regressors in the specifications with Tobin’s Q and the market-to-book ratio.
Appendix C Table 1. Alternative specifications of the model. Fixed-effects regressions.
(1) (2) (3) (4) (5) (6)
log(Q) log(Q) log(Q) ROA ROA ROA
Board_size 0.002 -0.061* -0.066* -0.000 0.016** 0.015*
(0.013) (0.036) (0.036) (0.002) (0.008) (0.008)
Fraction_inside_dir -0.024 -0.022 -0.009 -0.021 -0.021 -0.018
(0.082) (0.083) (0.083) (0.019) (0.019) (0.020)
Fraction_foreign_dir 0.180 0.197 0.188 -0.011 -0.014 -0.009
(0.148) (0.150) (0.144) (0.032) (0.032) (0.034)
Fraction_govern_dir 0.111 0.103 0.112 -0.052* -0.051* -0.039
(0.159) (0.153) (0.153) (0.029) (0.029) (0.031)
Fraction_women_dir 0.247** 0.241** 0.247** 0.024 0.027 0.028
(0.104) (0.102) (0.102) (0.024) (0.023) (0.024)
Director_age 0.000 -0.000 0.001 -0.000 -0.000 -0.000
(0.003) (0.003) (0.003) (0.001) (0.001) (0.001)
Director_age_variance -0.003 -0.003 -0.002 -0.001 -0.001 -0.001
(0.004) (0.004) (0.004) (0.001) (0.001) (0.001)
Director_ownership 0.003* 0.003* 0.003 0.001*** 0.001*** 0.001***
(0.002) (0.002) (0.002) (0.000) (0.000) (0.000)
Posts_per_director 0.043*** 0.043*** 0.045*** 0.000 0.000 0.000
(0.010) (0.009) (0.010) (0.002) (0.002) (0.002)
Number_managers 0.004 0.003 0.002 0.001 0.001* 0.001
(0.004) (0.004) (0.004) (0.001) (0.001) (0.001)
Unitary_CEO -0.045 -0.058 -0.046 0.008 0.010 0.006
(0.045) (0.046) (0.044) (0.011) (0.011) (0.011)
Shareholder1_ownership 0.088 0.151 0.076 0.001 0.029 0.004
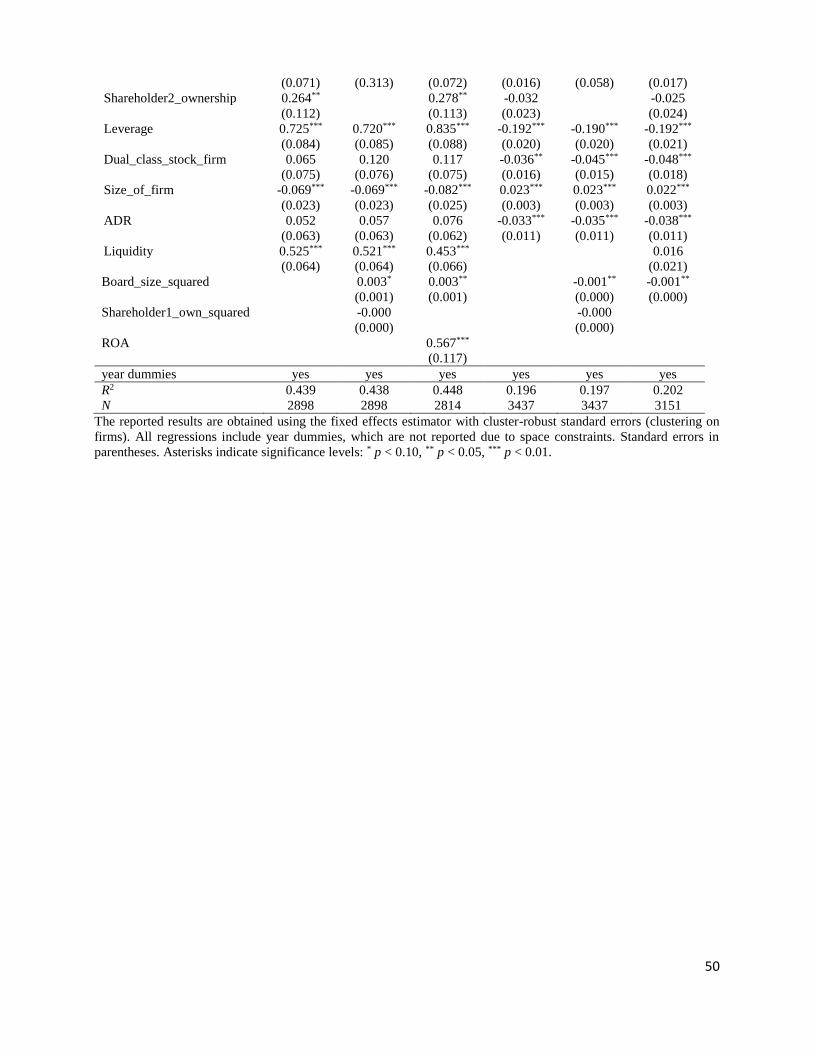
50
(0.071) (0.313) (0.072) (0.016) (0.058) (0.017)
Shareholder2_ownership 0.264** 0.278** -0.032 -0.025
(0.112) (0.113) (0.023) (0.024)
Leverage 0.725*** 0.720*** 0.835*** -0.192*** -0.190*** -0.192***
(0.084) (0.085) (0.088) (0.020) (0.020) (0.021)
Dual_class_stock_firm 0.065 0.120 0.117 -0.036** -0.045*** -0.048***
(0.075) (0.076) (0.075) (0.016) (0.015) (0.018)
Size_of_firm -0.069*** -0.069*** -0.082*** 0.023*** 0.023*** 0.022***
(0.023) (0.023) (0.025) (0.003) (0.003) (0.003)
ADR 0.052 0.057 0.076 -0.033*** -0.035*** -0.038***
(0.063) (0.063) (0.062) (0.011) (0.011) (0.011)
Liquidity 0.525*** 0.521*** 0.453*** 0.016
(0.064) (0.064) (0.066) (0.021)
Board_size_squared 0.003* 0.003** -0.001** -0.001**
(0.001) (0.001) (0.000) (0.000)
Shareholder1_own_squared -0.000 -0.000
(0.000) (0.000)
ROA 0.567***
(0.117)
year dummies yes yes yes yes yes yes
R2 0.439 0.438 0.448 0.196 0.197 0.202
N 2898 2898 2814 3437 3437 3151
The reported results are obtained using the fixed effects estimator with cluster-robust standard errors (clustering on
firms). All regressions include year dummies, which are not reported due to space constraints. Standard errors in
parentheses. Asterisks indicate significance levels: * p < 0.10, ** p < 0.05, *** p < 0.01.

51
Appendix D. Additional descriptive statistics for the board variables.
Appendix D Table 1. Detailed descriptive statistics of the board variables over time.
1998 1999 2000 2001 2002 2003 2004 2005 2006 2007 2008 2009 2010 2011 2012 2013 2014 Total
Number of mean 8.97 9.03 8.97 8.9 8.84 9.32 9.18 9 8.91 8.77 8.89 8.81 8.78 8.4 8.3 8.38 8.45 8.79 directors p50 9 9 9 9 9 9 9 9 9 9 9 9 9 8 8 8 8 9
min 5 4 5 5 5 3 4 5 3 4 4 5 4 5 3 5 4 3
max 23 25 19 18 17 17 17 17 17 15 15 15 15 15 15 15 15 25
sd 2.62 2.75 2.54 2.35 2.32 2.58 2.41 2.19 2.17 2.18 2.23 2.26 2.19 2.3 2.33 2.33 2.34 2.36
N 204 200 238 251 216 169 162 236 253 283 261 267 267 282 261 231 211 3992
Ownership mean 0.366 0.346 0.338 0.238 0.254 0.179 0.141 0.186 0.181 0.162 0.222 0.232 0.28 0.737 0.942 0.874 0.832 0.389
stake of a p50 0.057 0.0444 0.0472 0.0357 0.0263 0.0044 0.0009 0 0 0 0 0 0 0 0 0 0 0.0005 director min 0 0 0 0 0 0 0 0 0 0 0 0 0 0 0 0 0 0
max 8.14 8.65 7.79 8.4 8.37 8.98 8.52 17.9 17.9 12.8 12.8 8.89 10.6 20 20 11.5 12.9 20
sd 1.07 1.14 1.11 0.858 0.958 0.862 0.75 1.31 1.25 1.01 1.23 1.17 1.4 2.54 2.87 2.4 2.27 1.61
N 204 200 238 251 216 169 162 236 253 283 261 267 267 282 261 231 211 3992
Total mean 2.67 2.5 2.58 1.84 2 1.33 1.11 1.36 1.31 1.28 1.69 1.72 2.15 4.88 5.96 5.63 5.44 2.71
ownership p50 0.495 0.406 0.455 0.32 0.216 0.04 0.0086 0 0 0 0 0 0 0 0 0 0 0.0047 stake of min 0 0 0 0 0 0 0 0 0 0 0 0 0 0 0 0 0 0
directors max 52.5 54.7 54.5 58.8 58.6 44.9 51.1 89.5 89.5 89.5 89.5 61.5 74.2 100 100 64.6 70.4 100
sd 6.94 7.6 8 6.14 7.1 5.49 5.18 8.11 7.49 7.54 8.91 8.1 10.1 15.6 16.9 14.9 14.4 10.3
N 204 200 238 251 216 169 162 236 253 283 261 267 267 282 261 231 211 3992
Average mean 1.25 1.48 1.5 1.82 2.07 1.59 1.68 3.51 3.58 2.42 1.9 1.74 1.81 1.62 1.59 1.41 1.45 1.93
number of p50 1 1 1 1 1 1 1 1 1 1 1 1 1 1 1 1 1 1
posts held min 1 1 1 1 1 1 1 1 1 1 1 1 1 1 1 1 1 1
by directors max 5 6 5 8 9 7 9 21 35 25 20 14 12 6 8 7 6 35
sd 0.646 1.04 0.98 1.47 1.98 1.14 1.38 4.89 5.36 3.4 1.93 1.62 1.74 1.14 1.18 0.969 1.01 2.45
N 204 200 238 251 216 169 162 236 253 283 261 267 267 282 261 231 211 3992
Proport. of mean 0.337 0.318 0.316 0.28 0.236 0.2 0.201 0.135 0.15 0.163 0.182 0.186 0.184 0.202 0.205 0.217 0.206 0.216
insider p50 0.333 0.286 0.286 0.273 0.182 0.143 0.143 0.111 0.111 0.125 0.143 0.143 0.143 0.143 0.143 0.143 0.143 0.143
directors min 0 0 0 0 0 0 0 0 0 0 0 0 0 0 0 0 0 0
max 1 1 1 0.889 0.889 0.889 0.889 0.889 0.8 1 1 1 1 1 1 1 0.933 1
sd 0.198 0.182 0.179 0.161 0.157 0.175 0.177 0.164 0.15 0.163 0.19 0.188 0.184 0.193 0.204 0.208 0.19 0.189
N 204 200 238 251 216 169 162 236 253 283 261 267 267 282 261 231 211 3992
Proport. of mean 0.0927 0.0888 0.0885 0.0659 0.065 0.077 0.0713 0.034 0.0329 0.0372 0.0436 0.0511 0.0475 0.0348 0.027 0.0241 0.0199 0.0511
government p50 0.0718 0.0718 0.0801 0 0 0 0 0 0 0 0 0 0 0 0 0 0 0
represent. min 0 0 0 0 0 0 0 0 0 0 0 0 0 0 0 0 0 0
max 0.6 0.533 0.556 0.667 0.636 0.778 0.778 0.556 0.556 0.455 0.467 0.429 0.429 0.556 0.556 0.429 0.444 0.778
sd 0.118 0.109 0.108 0.116 0.121 0.138 0.122 0.0768 0.0743 0.0882 0.0845 0.084 0.082 0.0752 0.0679 0.0665 0.0612 0.0966
N 204 200 238 251 216 169 162 236 253 283 261 267 267 282 261 231 211 3992
Prop. of mean 0.443 0.421 0.416 0.352 0.311 0.288 0.275 0.174 0.188 0.207 0.232 0.246 0.242 0.257 0.253 0.26 0.242 0.278 directors p50 0.429 0.429 0.429 0.308 0.286 0.222 0.222 0.111 0.143 0.143 0.167 0.182 0.2 0.211 0.2 0.2 0.182 0.222
who are not min 0 0 0 0 0 0 0 0 0 0 0 0 0 0 0 0 0 0
independent max 1 1 1 1 1 0.909 0.909 0.889 0.8 1 1 1 1 1 1 1 0.933 1
sd 0.228 0.202 0.196 0.194 0.192 0.23 0.215 0.19 0.173 0.189 0.209 0.201 0.201 0.215 0.214 0.22 0.198 0.217
N 204 200 238 251 216 169 162 236 253 283 261 267 267 282 261 231 211 3992

52
1998 1999 2000 2001 2002 2003 2004 2005 2006 2007 2008 2009 2010 2011 2012 2013 2014 Total
Average age mean 48.6 48.5 48 46.6 46.2 44.9 44.9 42.4 42.5 43.1 44.2 44.5 45 45 45.6 46.2 47.3 45.4 of directors p50 48.8 48.6 47.9 46.6 46 44.4 44.7 41.9 42.6 42.6 44.4 44.3 44.9 44.8 45.3 45.3 46.6 45.5
min 32 37.1 36.3 34.9 32.3 33.6 33.4 29.8 27.4 29.2 28.3 28.8 29.1 25.6 27.8 28.8 31 25.6
max 60 60.2 60.4 55.7 57.1 59.5 61.1 60 63.2 60.7 64.2 64 66.7 62.3 66.5 67.1 68.1 68.1
sd 4.66 4.33 4.3 4.16 4.22 5.2 5.26 6.1 6.59 6.09 6.48 6.5 6.72 6.82 6.41 6.45 6.36 6.12
N 204 200 238 251 216 169 162 236 253 283 261 267 267 282 261 231 211 3992
Variance of mean 8.86 9.17 9.67 10 10.1 9.89 9.59 9.5 9.47 9.82 9.16 9.04 9.05 8.93 9.25 9.04 9.06 9.38 directors' p50 8.98 9.18 9.43 10.1 9.92 9.8 9.59 9.62 9.38 9.74 9.14 9.16 9.03 8.89 9.32 8.88 8.83 9.34
age min 2.85 2.73 3.99 5.21 3.03 3.34 2.78 2.92 2.62 1.89 1.35 1.11 1.7 1.41 1.41 1.72 1.72 1.11
max 16.4 16.5 17.1 16.6 18.6 16.8 16.5 17.1 15.6 16.7 17.7 24.3 24.3 24.3 24.3 24.3 18.2 24.3
sd 2.46 2.53 2.58 2.43 2.61 2.49 2.49 2.58 2.68 2.85 2.96 3.12 3.01 3.15 3.15 3.23 3.26 2.86
N 203 200 238 251 216 168 162 236 253 283 261 267 267 282 261 231 209 3988
Proport. of mean 0.0937 0.101 0.103 0.112 0.113 0.0784 0.0895 0.118 0.135 0.137 0.125 0.15 0.144 0.147 0.134 0.143 0.142 0.124 women p50 0.0333 0.0909 0.1 0.111 0.0833 0 0.0909 0.111 0.111 0.111 0.0909 0.111 0.111 0.111 0.111 0.111 0.111 0.1
directors min 0 0 0 0 0 0 0 0 0 0 0 0 0 0 0 0 0 0
max 0.444 0.444 0.429 0.571 0.571 0.556 0.75 0.6 0.667 1 1 1 1 1 0.8 0.8 0.8 1
sd 0.117 0.116 0.11 0.125 0.14 0.113 0.116 0.121 0.139 0.154 0.164 0.176 0.161 0.176 0.144 0.15 0.155 0.145
N 204 200 238 251 216 169 162 236 253 283 261 267 267 282 261 231 211 3992
Proport. of mean 0.0233 0.0227 0.0244 0.0289 0.0367 0.0446 0.0595 0.0451 0.0503 0.0677 0.0766 0.0632 0.0627 0.0649 0.069 0.0695 0.0685 0.0527
foreign p50 0 0 0 0 0 0 0 0 0 0 0 0 0 0 0 0 0 0 directors min 0 0 0 0 0 0 0 0 0 0 0 0 0 0 0 0 0 0
max 0.667 0.444 0.462 0.571 0.625 0.7 0.636 0.571 0.571 0.571 0.667 0.714 0.714 0.818 0.818 0.8 0.727 0.818
sd 0.0749 0.0737 0.0705 0.0782 0.102 0.122 0.138 0.117 0.118 0.141 0.156 0.142 0.142 0.151 0.158 0.151 0.149 0.129
N 204 200 238 251 216 169 162 236 253 283 261 267 267 282 261 231 211 3992
Proport. of mean 0.309 0.316 0.367 0.325 0.364 0.362 0.349 0.405 0.351 0.398 0.413 0.304 0.326 0.246 0.255 0.255 0.334
new p50 0.286 0.286 0.333 0.286 0.333 0.321 0.333 0.375 0.333 0.333 0.364 0.273 0.286 0.2 0.182 0.2 0.286
directors min 0 0 0 0 0 0 0 0 0 0 0 0 0 0 0 0 0
max 1 1 1 0.857 1 1 0.778 1 1 1 1 1 1 1 1 1 1
sd 0.225 0.225 0.228 0.208 0.253 0.24 0.214 0.274 0.277 0.309 0.327 0.262 0.279 0.224 0.261 0.224 0.261
N 0 176 208 215 208 162 160 155 195 243 227 237 233 225 228 204 191 3267

53
Appendix E Figure 1. Dynamics of key characteristics of boards, firms with 17 obs.
Panel A. Board size (Number of directors). Panel B. Share of insider directors.
Panel C. Share of women directors. Panel D. Share of foreign directors.
Panel E. Average age of directors, years. Panel F. Share of new directors.
Panel G. Number of posts per director. Panel H. Total ownership by directors, %.
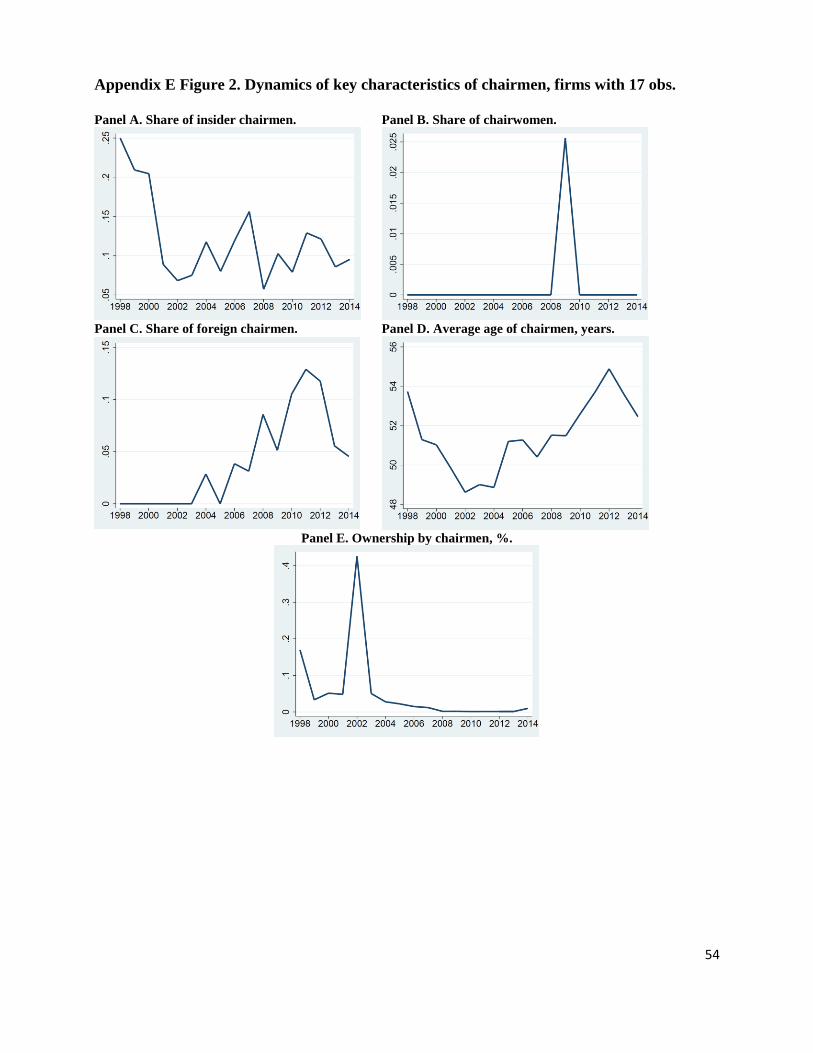
54
Appendix E Figure 2. Dynamics of key characteristics of chairmen, firms with 17 obs.
Panel A. Share of insider chairmen. Panel B. Share of chairwomen.
Panel C. Share of foreign chairmen. Panel D. Average age of chairmen, years.
Panel E. Ownership by chairmen, %.

55
Appendix F. Additional estimation results
Appendix F Table 1. Random-effects regression results, the baseline model.
(1) (2) (3) (4) (5) (6)
log(MtB) log(Q) ROE ROE(t+1) ROA ROA(t+1)
Board_size -0.020 -0.041 0.016 0.020 0.017* 0.013**
(0.068) (0.030) (0.011) (0.012) (0.009) (0.005)
Board_size_squared 0.001 0.002 -0.001* -0.001* -0.001* -0.001**
(0.003) (0.001) (0.001) (0.001) (0.000) (0.000)
Fraction_inside_dir 0.170 0.031 0.003 -0.036 0.012 -0.013
(0.146) (0.072) (0.030) (0.032) (0.022) (0.016)
Fraction_foreign_dir 0.967*** 0.367*** 0.029 -0.007 0.059 0.018
(0.216) (0.125) (0.050) (0.053) (0.057) (0.026)
Fraction_govern_dir 0.227 0.052 0.018 0.024 0.030 -0.007
(0.278) (0.140) (0.043) (0.050) (0.029) (0.026)
Fraction_women_dir 0.409** 0.159* 0.085** 0.027 0.047* -0.015
(0.202) (0.091) (0.037) (0.036) (0.027) (0.019)
Director_age -0.012** -0.003 -0.002** -0.001 -0.001** -0.001
(0.005) (0.003) (0.001) (0.001) (0.001) (0.001)
Director_age_variance -0.006 -0.005 -0.001 -0.002 -0.001 -0.001*
(0.008) (0.004) (0.002) (0.002) (0.001) (0.001)
Inside_dir_ownership 0.001 0.001 0.002** 0.001 0.001** 0.001
(0.004) (0.002) (0.001) (0.001) (0.000) (0.000)
Outside_dir_ownership 0.015*** 0.005*** 0.002** 0.002** 0.001** 0.001**
(0.003) (0.002) (0.001) (0.001) (0.000) (0.000)
Posts_per_director 0.069*** 0.035*** -0.004 -0.008** -0.003 -0.004**
(0.016) (0.008) (0.004) (0.004) (0.002) (0.002)
Number_managers 0.003 0.003 0.000 0.001 0.001 0.001*
(0.008) (0.003) (0.001) (0.001) (0.001) (0.001)
Unitary_CEO -0.087 -0.021 0.009 -0.006 0.000 0.001
(0.084) (0.039) (0.017) (0.016) (0.012) (0.008)
Shareholder1_ownership 0.094 0.090 -0.003 -0.021 0.015 0.007
(0.126) (0.064) (0.026) (0.030) (0.022) (0.014)
Shareholder2_ownership 0.492** 0.266** -0.038 0.043 -0.026 0.005
(0.213) (0.106) (0.039) (0.045) (0.026) (0.023)
Leverage 1.154*** 0.690*** -0.170*** -0.006 -0.146*** -0.044***
(0.135) (0.065) (0.029) (0.030) (0.022) (0.013)
Dual_class_stock_firm -0.198*** -0.114*** 0.006 0.011 0.006 0.004
(0.076) (0.038) (0.015) (0.014) (0.011) (0.008)
Size_of_firm -0.107*** -0.047*** 0.025*** 0.010*** 0.014*** 0.007***
(0.029) (0.015) (0.003) (0.003) (0.003) (0.001)
ADR -0.010 0.074 -0.039** -0.034** -0.028*** -0.017*
(0.112) (0.056) (0.015) (0.016) (0.010) (0.009)
Liquidity 1.545*** 0.586***
(0.164) (0.056)
Year dummies yes yes yes yes yes yes
Regional dummies yes yes yes yes yes yes
Industry dummies yes yes yes yes yes yes
R2 (overall) 0.4042 0.4171 0.1229 0.1051 0.1631 0.2123
N 2898 2898 3431 3127 3535 3128
Hausman test: p-value 0.0732 0.0191 0.0003 0.0020 0.0015 0.0006
The reported results are obtained using the random effects estimator with cluster-robust standard errors (clustering on
firms). All regressions include year, regional and industry dummies, which are not reported due to space constraints.
Standard errors in parentheses. Asterisks indicate significance levels: * p < 0.10, ** p < 0.05, *** p < 0.01.

56
Appendix F Table 2. Fixed-effects regression results, specifications with the fraction of new
directors.
(1) (2) (3) (4) (5) (6)
log(MtB) log(Q) ROE ROE(t+1) ROA ROA(t+1)
Board_size -0.083 -0.069 0.056*** 0.071*** 0.033** 0.029***
(0.097) (0.047) (0.019) (0.024) (0.016) (0.009)
Board_size_squared 0.004 0.003 -0.003*** -0.003*** -0.001* -0.001***
(0.004) (0.002) (0.001) (0.001) (0.001) (0.000)
Fraction_inside_dir -0.090 -0.011 -0.028 -0.089* 0.005 -0.027
(0.181) (0.089) (0.041) (0.046) (0.030) (0.021)
Fraction_foreign_dir 0.702** 0.264* 0.022 -0.048 0.078 0.012
(0.272) (0.155) (0.070) (0.078) (0.086) (0.038)
Fraction_govern_dir 0.254 0.049 -0.000 -0.030 0.007 -0.059*
(0.306) (0.157) (0.064) (0.073) (0.044) (0.032)
Fraction_women_dir 0.555** 0.300*** 0.081* 0.035 0.057* -0.006
(0.220) (0.109) (0.045) (0.049) (0.034) (0.025)
Director_age -0.003 0.001 -0.001 0.001 -0.000 0.000
(0.007) (0.003) (0.001) (0.001) (0.001) (0.001)
Director_age_variance 0.005 -0.004 -0.001 -0.001 -0.000 -0.001
(0.009) (0.005) (0.002) (0.002) (0.001) (0.001)
Inside_dir_ownership -0.001 -0.001 0.003** 0.001 0.001** 0.001
(0.007) (0.002) (0.001) (0.001) (0.001) (0.001)
Outside_dir_ownership 0.017*** 0.005*** 0.003** 0.003*** 0.001* 0.001**
(0.004) (0.002) (0.001) (0.001) (0.001) (0.001)
Posts_per_director 0.081*** 0.038*** -0.007 -0.008 -0.005* -0.004*
(0.019) (0.011) (0.005) (0.005) (0.002) (0.002)
Fraction_new_directors -0.002 0.013 -0.024 0.017 -0.006 0.014*
(0.077) (0.034) (0.017) (0.021) (0.012) (0.008)
Number_managers 0.001 0.004 0.000 0.002 0.001 0.002*
(0.009) (0.004) (0.002) (0.002) (0.001) (0.001)
Unitary_CEO -0.145 -0.032 -0.018 -0.017 -0.009 -0.002
(0.106) (0.046) (0.022) (0.020) (0.015) (0.011)
Shareholder1_ownership 0.110 0.081 0.016 -0.002 0.026 0.024
(0.149) (0.078) (0.031) (0.033) (0.026) (0.017)
Shareholder2_ownership 0.510** 0.345*** -0.080* 0.006 -0.037 0.002
(0.213) (0.124) (0.044) (0.055) (0.028) (0.028)
Leverage 1.075*** 0.640*** -0.319*** -0.017 -0.214*** -0.033
(0.176) (0.095) (0.044) (0.050) (0.048) (0.021)
Dual_class_stock_firm 0.453*** 0.094 -0.049 -0.122*** -0.051* -0.103***
(0.162) (0.082) (0.030) (0.031) (0.029) (0.016)
Size_of_firm -0.172*** -0.071*** 0.031*** 0.004 0.013*** 0.003
(0.052) (0.026) (0.006) (0.006) (0.004) (0.002)
ADR -0.071 0.071 -0.043** -0.064*** -0.035** -0.026**
(0.139) (0.069) (0.020) (0.022) (0.014) (0.011)
Liquidity 0.934*** 0.453***
(0.161) (0.069)
R2 0.412 0.423 0.122 0.072 0.083 0.102
N 2483 2483 2887 2576 2924 2577
The reported results are obtained using the fixed effects estimator with cluster-robust standard errors (clustering on
firms). All regressions include year dummies, which are not reported due to space constraints. Standard errors in
parentheses. Asterisks indicate significance levels: * p < 0.10, ** p < 0.05, *** p < 0.01.
57
Appendix F Table 3. GMM-SYS dynamic panel data regressions results.
(1) (2) (3) (4)
log(MtB) log(Q) ROE ROA
Lagged_dependent_var 0.445*** 0.502*** 0.305*** 0.442***
(0.037) (0.037) (0.049) (0.038)
Board_size -0.050 -0.028 0.031 0.013
(0.094) (0.046) (0.020) (0.011)
Board_size_squared 0.003 0.001 -0.002* -0.001
(0.004) (0.002) (0.001) (0.001)
Fraction_inside_dir 0.256 0.203** 0.037 -0.001
(0.182) (0.086) (0.047) (0.025)
Fraction_foreign_dir 0.975*** 0.340*** -0.023 0.011
(0.251) (0.130) (0.063) (0.031)
Fraction_govern_dir 0.862** 0.315 0.074 0.049
(0.387) (0.214) (0.062) (0.038)
Fraction_women_dir 0.319 0.056 0.100 0.042
(0.290) (0.128) (0.062) (0.026)
Director_age 0.005 0.003 -0.002 -0.000
(0.007) (0.004) (0.002) (0.001)
Director_age_variance -0.021* -0.020*** -0.003 -0.001
(0.012) (0.006) (0.003) (0.001)
Inside_dir_ownership 0.003 -0.000 0.001 0.000
(0.006) (0.003) (0.001) (0.001)
Outside_dir_ownership 0.004 0.000 0.002 0.001
(0.006) (0.002) (0.001) (0.001)
Posts_per_director 0.109*** 0.047*** -0.018*** -0.012***
(0.023) (0.011) (0.006) (0.002)
Number_managers -0.004 -0.001 -0.001 -0.000
(0.006) (0.003) (0.001) (0.001)
Unitary_CEO 0.044 -0.013 0.014 0.007
(0.061) (0.029) (0.013) (0.006)
Shareholder1_ownership -0.202* -0.065 -0.045* -0.039***
(0.118) (0.058) (0.027) (0.012)
Shareholder2_ownership 0.020 0.003 -0.035 -0.028
(0.181) (0.090) (0.042) (0.022)
Leverage 0.899*** 0.385*** -0.118*** -0.085***
(0.101) (0.048) (0.024) (0.010)
Dual_class_stock_firm -0.060 -0.034 0.017 0.008
(0.051) (0.023) (0.011) (0.005)
Size_of_firm -0.045** -0.022** 0.021*** 0.012***
(0.020) (0.009) (0.003) (0.002)
ADR 0.078 0.077** 0.001 -0.003
(0.078) (0.036) (0.014) (0.008)
Liquidity 0.680*** 0.350***
(0.158) (0.061)
year dummies yes yes yes yes
AB test for AR(2), p-value 0.785 0.092 0.164 0.014
Hansen test, p-value 1.000 1.000 1.000 1.000
N 2392 2391 2901 2908
The reported results are obtained using the two-step system GMM estimator for dynamic panel data (DPD) with second
and third lags of endogenous regressors playing the role of instruments. All regressions include year dummies, which
are not reported due to space constraints. Robust standard errors are in parentheses. Asterisks indicate significance
levels: * p < 0.10, ** p < 0.05, *** p < 0.01.