Embed Size (px)
Citation preview
Discussion PaPer series
IZA DP No. 10682
Abu SiddiqueMichael Vlassopoulos
Competitive Preferences and Ethnicity:Experimental Evidence from Bangladesh
mArch 2017
Any opinions expressed in this paper are those of the author(s) and not those of IZA. Research published in this series may include views on policy, but IZA takes no institutional policy positions. The IZA research network is committed to the IZA Guiding Principles of Research Integrity.The IZA Institute of Labor Economics is an independent economic research institute that conducts research in labor economics and offers evidence-based policy advice on labor market issues. Supported by the Deutsche Post Foundation, IZA runs the world’s largest network of economists, whose research aims to provide answers to the global labor market challenges of our time. Our key objective is to build bridges between academic research, policymakers and society.IZA Discussion Papers often represent preliminary work and are circulated to encourage discussion. Citation of such a paper should account for its provisional character. A revised version may be available directly from the author.
Schaumburg-Lippe-Straße 5–953113 Bonn, Germany
Phone: +49-228-3894-0Email: [email protected] www.iza.org
IZA – Institute of Labor Economics
Discussion PaPer series
IZA DP No. 10682
Competitive Preferences and Ethnicity:Experimental Evidence from Bangladesh
mArch 2017
Abu SiddiqueUniversity of Southampton
Michael VlassopoulosUniversity of Southampton and IZA
AbstrAct
mArch 2017IZA DP No. 10682
Competitive Preferences and Ethnicity:Experimental Evidence from Bangladesh*
In many countries, ethnic minorities have a persistent disadvantageous socioeconomic
position. We investigate whether aversion to competing against members of the ethnically
dominant group could be a contributing factor to this predicament. We conducted a
lab-in-the-field experiment in rural Bangladesh recruiting males from the ethnic majority
(Bengali) and an underprivileged ethnic minority group (Santal) that is severely discriminated
against. We randomly assign participants into groups with different ethnic composition
and elicit a measure of their competitiveness. We find that when compelled to compete,
there are no ethnic differences in performance and that both ethnic groups perform better
in ethnically-mixed groups than in homogeneous groups. We also find that the ethnic
composition of the group of competitors is an important determinant of competitive entry
and its effect varies by ethnic group. Members of the ethnic minority group are less likely
to compete in groups where they are a numerical minority than when all competitors
are co-ethnic, whereas the reverse is true for members of the ethnic majority group. This
difference is not explained by heterogeneity in performance, risk preferences, beliefs about
relative ability or various socioeconomic characteristics; instead, observed behavior seems
to be driven by ethnic differences in preference for interethnic competition.
JEL Classification: C9, C91, C93, J15
Keywords: competitiveness, group composition, ethnicity, minority, identity, stereotypes, lab-in-the-field experiment
Corresponding author:Michael VlassopoulosDepartment of EconomicsSocial SciencesUniversity of SouthamptonSouthampton, SO17 1BJUnited Kingdom
E-mail: [email protected]
* We are very grateful to Costantine Sedikides for very thoughtful comments and discussions, as well as seminar participants at Birmingham, the Discrimination at Work Conference in Rotterdam and the 6th International ACCER Workshop in Duisburg. We thank Md. Golam Faruk Sarker and Ashrai (NGO) for their support. We also thank Tahmid Hasan, Arif Hossain, Shamirul Islam and Nazmul Sakib for excellent research assistance. This work has received financial support from the Economic and Social Research Council, UK.
1 Introduction
A number of recent studies have found ample evidence of gender differences in
competitive preferences (Croson and Gneezy, 2009; Niederle and Vesterlund, 2011).1
Subsequent studies have shown that measures of competitiveness elicited experimentally
can explain economic outcomes outside the laboratory such as career and educational
choices, earnings and investment decisions (Buser et al., 2014; Zhang, 2013; Reuben
et al., 2015; Berge et al., 2015; Flory et al., 2014).2 Like women, ethnic minorities in
many countries and contexts (e.g. African Americans in the US, Roma in Europe, in-
digenous people in various parts of the world) also fare badly in the labor market and
are lagging behind the respective ethnically dominant group in various socioeconomic
indicators. Extending the insight about the explanatory power of competitive prefer-
ences for gender differences, one could conjecture that competitive preferences might
help us understand the persistent disadvantageous position of ethnic minorities. That
is, if members of ethnic minority groups are reluctant to compete against members of the
ethnically dominant group, they might be refraining from taking actions, such as, invest-
ing in education, applying for positions of authority or accessing scarce resources that
would help them elevate their socioeconomic status. A good starting point to address
these issues is to examine empirically whether differences in preferences for interethnic
competition exist between the majority (dominant) and minority (subordinate) ethnic
groups, which is the main aim of this paper.
We conducted a lab-in-the-field experiment in rural Bangladesh, drawing partici-
pants from the ethnic majority (Bengali) and a minority group (Santal). Bangladesh is
a suitable context for our purposes, as it is home to many ethnic minority/indigenous
communities that do severely poorly in several socioeconomic outcomes and are subject
to exploitation and discrimination by members of the ethnic majority group.3 In this
1Findings from this growing literature suggest that women and men react to competition differently,with women exhibiting distaste for competition and performing less well in competitive environments(Gneezy et al., 2003; Niederle and Vesterlund, 2007), while a handful of studies have further providedevidence that both women and men dislike competing against men in particular (Datta Gupta et al.,2013; Geraldes, 2016).
2Zhang (2013) and Buser et al. (2014) find that students who are more inclined towards competitionare more likely to take competitive high school entry exams and opt to choose prestigious study tracks.Also, exhibiting competitive tendencies in the lab has been shown to be associated with higher (expectedand actual) earnings and working in high-paying industries (Reuben et al., 2015, 2017), as well asinvesting more in businesses in the field (Berge et al., 2015). Finally, Flory et al. (2014) provide fieldexperimental evidence that women are less likely to apply for jobs in which compensation is based onrelative performance.
3See, for example, AIPP (2007) and Roy (2012) for unfair treatments of ethnic minorities inBangladesh. We describe these in detail in Section 2.
2

environment, it is very likely that the two ethnic groups are indoctrinated from a young
age to form opposing stereotypes regarding non-co-ethnic members: Santals grow up to
believe that they are inferior to the majority ethnic group, while the latter are nurtured
to look-down-upon the minority group.4 Consequently, this socialization process could
shape the norms surrounding interethnic interactions, including attitudes towards en-
gaging in competition with each other. Indeed, recent studies have shown that culture,
socialization, the local environment, social and economic institutions and even local work
experiences play significant role in the shaping of competitive preferences (Gneezy et al.,
2009; Booth and Nolen, 2012; Cardenas et al., 2012; Andersen et al., 2013; Leibbrandt
et al., 2013; Zhang, 2015; Booth et al., 2016). We, thus, expect that given the ethnic
background of our setting, the two ethnic groups will have developed tastes for intereth-
nic competition that mirror the clear hierarchical relationship that exists between them.
In the experiment, we randomly assign participants into groups of six, and we
obtain a measure of their competitive preferences following the design of Niederle and
Vesterlund (2007). In particular, we first ask our participants to perform a simple manual
task (separating lentils from rice) under a piece-rate and then a competitive compensa-
tion scheme (winner-take-all tournament). In a third stage, we ask them to select their
preferred compensation scheme, which reveals their preferences with respect to compe-
tition. Our experimental design involves three treatment groups: a homogeneous group
where subjects are all co-ethnics, a group where ethnic minority people are a numerical
minority (2 to 4), and a ‘reversed’ group where ethnic minority people are a numerical
majority (4 to 2). Ethnicity in our context is easily identifiable by physical markers and
hence is unambiguous. Thus, even though ethnic composition was never discussed in the
course of the experiment, our subjects could easily identify the ethnicity of their group
members and hence the ethnic composition of their group. We expect that while there
should not be an overall difference in competitive inclination towards co-ethnics across
the two ethnic groups, in ethnically diverse groups, we would see ethnic differences in
preferences for engaging in competition.
We find that in the compulsory tournament stage, there are no ethnic differences
in performance and that both ethnic groups perform better in ethnically-mixed groups
than in homogeneous groups. This suggests that participants are more willing to in-
ternalize the negative externality their effort imposes on a group of co-ethnics under a
4Tribal minorities are seen as ‘inferior races’ by the ethnic majority (Hardiman, 1987; Bal, 2007),which is believed to be a product of multi-generational socialization process (Barndt, 2007). On childreninternalizing socialized lies regarding superiority and inferiority, Joseph R. Barndt (2007, p. 125) says,“...If I am consciously and unconsciously taught from the moment of my birth that I am inferior (superior)and a member of an inferior (superior) race, I will believe and act according to this message.”
3
relative performance incentive scheme and is consistent with previous lab and field evi-
dence of an in-group bias in people’s social preferences (Bandiera et al., 2005; Chen and
Li, 2009). We also find that ethnic composition of group of competitors is an important
determinant of self-selection into the competitive scheme is stage 3. Despite the fact
that overall competitiveness is similar across ethnic groups, group composition affects
tournament entry decisions by members of the two ethnic groups differently. When com-
pared to choices made in homogeneous groups, members of the ethnic minority show a
distaste for competition in groups where they are a minority, whereas ethnic majority
members demonstrate a preference for competition in groups where they are a minority.
To be more precise, ethnic minorities are 25 percentage points less likely to compete in
groups where they are a minority (decrease of 60 percent) than when all competitors
are co-ethnic, whereas ethnic majorities are 22 percentage points more likely to compete
in groups where they are a minority (increase of 80 percent) than when all competitors
are co-ethnic. We show that these patterns are not explained by heterogeneity in task
proficiency, risk preferences, beliefs about relative ability on the task, or a host of de-
mographic characteristics. Hence, our study points to participants from the two ethnic
groups having a genuinely different attitude toward entering competitive environments
in which the pool of potential competitors is multiethnic.
Beyond the literature on competitive preferences mentioned above, our study con-
nects to the literature on social identity, the formation of stereotypes and their impact
on behavior that has a long history in psychology and sociology (Tajfel, 2010; Green-
wald and Banaji, 1995; Steele and Aronson, 1995; Shih et al., 1999). In economics,
the seminal paper by Akerlof and Kranton (2000) introduces a theoretical framework
that connects social identity based on social differences, e.g. race, class, ethnicity, etc.
with economic behavior and outcomes. More recently, experimental studies have shown
that making ethnic or racial identity salient affects risk and time preferences (Benjamin
et al., 2010), and induced group identity affects social preferences (Chen and Li, 2009).
Furthermore, a few more recent studies have shown experimentally that social identity
can affect the performance of a deprived group or the treatment that they receive from
out-group members. In particular, two related studies of caste in India find that publicly
revealing the social identity of the lower-caste diminishes their performance in a cogni-
tive task (Hoff and Pandey, 2006, 2014), while Afridi et al. (2015) find similar effects
for rural workers in China. Finally, Fershtman and Gneezy (2001) find that behavior in
experimental games (trust, dictator, ultimatum game) conducted with opponents from
different ethnic groups in Israel to be consistent with ethnic stereotypes. Our results
extend this line of research by showing that ethnic group identity (majority or minority)
4

matters for one’s willingness to engage in interethnic competition.
This paper is organized as follows. Section 2 provides background on the ethnic
minority group studied. Section 3 describes the design of our study and the hypotheses
to be tested. In Section 4, we present our results. Section 5 concludes.
2 Background on Ethnic Groups in Bangladesh
In Bangladesh, besides the ethnic majority group (Bengali) there are around 45
different indigenous/tribal communities that constitute about 2 million of the country’s
total population of 150 million, including many of the country’s extreme poor (IMF,
2013; People’s Republic of Bangladesh, 2016). These groups are culturally, racially,
ethnically and linguistically distinct from the majority Bengali population, and are the
most persecuted of all minorities.5 They have restricted access to basic social services
such as health, food and nutrition, education, employment, justice and politics (AIPP,
2010; Roy, 2012; IMF, 2013), and are subject to extortion by the ethnic majority land
grabbers (Roy, 2012). They also receive unfair prices for their products (AIPP, 2010)
and have been at the receiving end of crimes for generations (Roy, 2012; D’Costa, 2014).
Illegal dispossession of tribal people from their lands is widespread (in both Bangladesh
and India) where the dispossessed receive nominal to no compensation in some instances,
even though the State Acquisition and Tenancy Act 1950 (Section 97, 1950) strictly
prohibits alienation of such lands. Figure 1 illustrates the geographic concentration of
the tribal population in Bangladesh.
Ethnic minority participants in our study are entirely comprised of people who iden-
tified themselves as Santals - the second most populous tribal community in Bangladesh.6
Santals predominantly reside in Rajshahi, Dinajpur, Chapai Nawabganj and Borgra dis-
tricts in the north-western region of Bangladesh, although the largest portion of Santals
lives in Jharkhand of India (Ali, 1998; Cavallaro and Rahman, 2009; Ahmed, 2010). Like
the ethnic majority people in Bangladesh, Santals also follow patriarchy (Upadhyay and
Pandey, 1993). They have their own tribal religion (worship a Supreme Deity called
Thakur) (Risley, 1891), although many also follow Hinduism or Christianity; the ethnic
majority Bengali, however, follow Islam (86.6 percent) (People’s Republic of Bangladesh,
2016). The majority of Santals are involved in farming, working for landlords as day
5Tribal people in India face similar treatments by the ethnic majority population (Kijima, 2006; Shah,2007; Bhengra et al., 1999).
6Three of the most populous tribal communities in Bangladesh are the Chakma, the Marma and theSantal; the former two are usually known as ‘hill-people’ (live in high altitudes) and the latter is knownas ‘plains-dwelling’ (live in the plains).
5
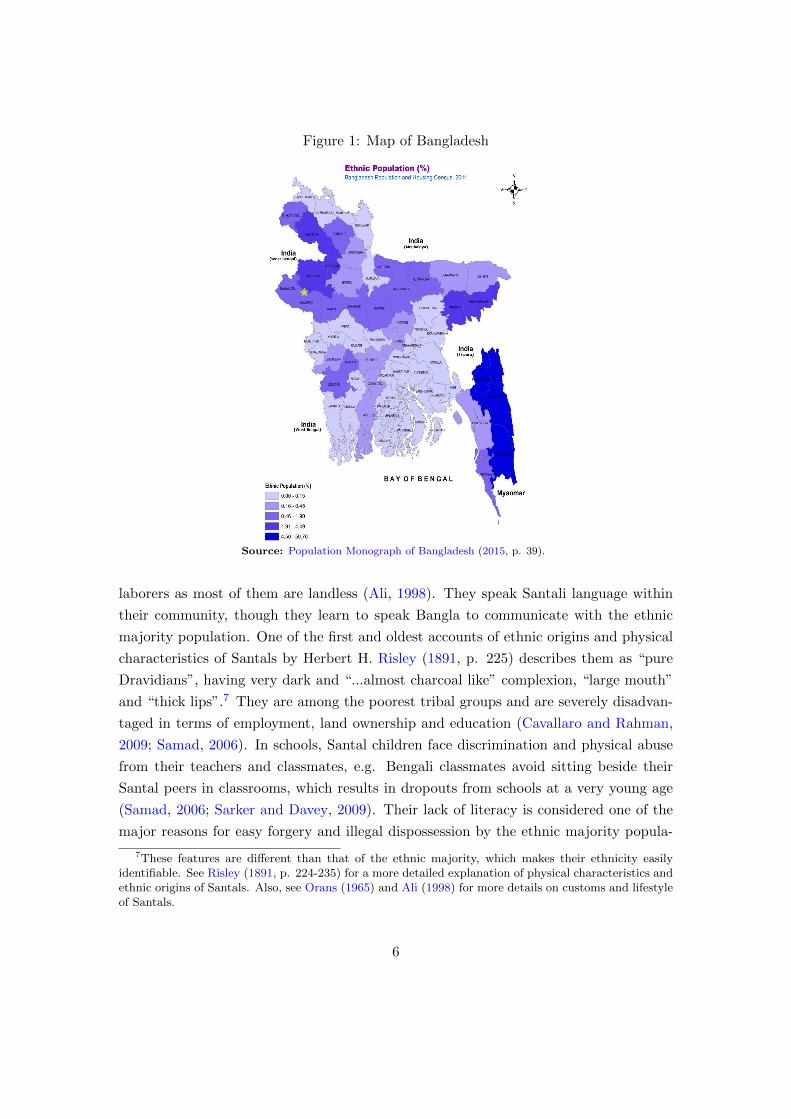
Figure 1: Map of Bangladesh
Source: Population Monograph of Bangladesh (2015, p. 39).
laborers as most of them are landless (Ali, 1998). They speak Santali language within
their community, though they learn to speak Bangla to communicate with the ethnic
majority population. One of the first and oldest accounts of ethnic origins and physical
characteristics of Santals by Herbert H. Risley (1891, p. 225) describes them as “pure
Dravidians”, having very dark and “...almost charcoal like” complexion, “large mouth”
and “thick lips”.7 They are among the poorest tribal groups and are severely disadvan-
taged in terms of employment, land ownership and education (Cavallaro and Rahman,
2009; Samad, 2006). In schools, Santal children face discrimination and physical abuse
from their teachers and classmates, e.g. Bengali classmates avoid sitting beside their
Santal peers in classrooms, which results in dropouts from schools at a very young age
(Samad, 2006; Sarker and Davey, 2009). Their lack of literacy is considered one of the
major reasons for easy forgery and illegal dispossession by the ethnic majority popula-
7These features are different than that of the ethnic majority, which makes their ethnicity easilyidentifiable. See Risley (1891, p. 224-235) for a more detailed explanation of physical characteristics andethnic origins of Santals. Also, see Orans (1965) and Ali (1998) for more details on customs and lifestyleof Santals.
6

tion (Sarker and Davey, 2009). In this regard, Cavallaro and Rahman (2009, p. 204)
stated:
“... in Bangladesh the Santals face discrimination from the majority community,
and the Bangla speaking population and the government has done little to help the
Santals protect themselves from the continuous land grabbing and dispossessions. Indeed
there is a feeling among the minority people of Bangladesh that they are continuously
being overlooked in favor of the majority group in all facets of life. These include
employment opportunities and education. These issues have led to a deep sense of social
insecurity.”
3 The Experiment
3.1 Recruitment and Procedures
We conducted a lab-in-the-field experiment (Gneezy and Imas, 2016) in the summer
of 2016 in six different multi-ethnic villages in the Rajshahi district of rural Bangladesh.
We recruited our participants from the two distinct ethnic groups that populate these
villages: the ethnic majority Bengali and the ethnic minority Santal. In total, 252 male
adults of equal proportion from the two ethnic groups participated in our experiments.
Our subjects came from fourteen different multi-ethnic villages; although multi-ethnic,
segregation within villages is commonplace, as Santal/Bengali houses cluster around
their co-ethnics (each cluster is known as a para) (Ali, 1998). In these villages, 19
percent of the population (and households) are Santals whereas the rest are the ethnic
majority Bengali.8 Also, exogamy or interethnic marriages are not prevalent. People
tend to work collectively with their co-ethnics, i.e. generally with family, extended
family or relatives, but not with their non-co-ethnic fellow villagers. Since all villagers
are considerably poor and do not posses the capacity to hire others for work, members of
one ethnic group do not employ members of the other; hence, personal and professional
attachments are trivial among members of the two ethnic groups.
Participants were recruited through in-person advertisements: experiment helpers
of both ethnicities visited random marketplaces, houses, and crop fields, and advertised
our experiment by reading out an experiment advert. Through the advert, people were
informed about the pecuniary incentives involved, the conditions for participation and
the location for registration. Initial registration was carried out in seven different loca-
tions where we also set up our laboratories. During registration, participants were only
asked to provide their full name, age, and ethnicity. Prospective subjects also had the
8We obtain these figures from the Household Survey Report 2012 assembled by Ashrai, an NGO.
7

option to choose their preferred location and time for a session from seven different loca-
tion options. All people chose their initial registration location as their preferred location
for their experiment session. This was expected because all seven of our locations are
quite far from one another, which was intentionally done to minimize contamination.
Furthermore, people were also expected to know each other because our villages are
small, so some degree of social networks within and across ethnic groups were expected.
After the initial registrations were complete, potential subjects were given a piece
of paper that contained their name, age, and ethnicity, which they were asked to bring
to the laboratory. Registration was done on a first-come-first basis, so people who were
registered were all invited to the experiment and any ‘extra’ arrivals at the registration
desk were asked to go to our next registration location on another day to register for
a session. In total, 296 people were initially registered (four extra for each session). In
the experimental sessions, participants were also enrolled in the lab on a first-come-first
basis. Four over-recruited individuals for each session were asked to leave with a show-up
fee. All people who initially registered arrived at the lab on time.
The location of each lab was a central place in the village, e.g. either primary
schools, churches or public office spaces. Upon arrival, participants were asked to form a
queue outside the lab, on a first-come-first basis. Five minutes prior to the experiment’s
start time, participants were asked to enter the lab and report to the enrolment table,
one by one. At enrolment, they were asked to hand in their initial registration paper
as well as state their full name and ethnicity, and then based on that information, they
were asked to pick their ID numbers from a bowl. In order to ensure that we had the
desired number of Santals and Bengalis in each group, we prepared two bowls with ID
numbers; one for Santals, in which IDs were matched with seats that were only for
Santal participants, and another for Bengali participants. After randomly picking their
ID numbers, they were taken to their respective seats by our assistants.
3.2 Experimental Design
The experiment follows the standard experimental protocol of eliciting competi-
tive preferences developed by Niederle and Vesterlund (2007). We introduce two main
changes: (i) we implemented a different task that is more appropriate for the participant
pool in hand, and (ii) we manipulated the ethnic composition of the groups to which
participants were randomly assigned to, in order to test for whether the ethnic affiliation
of competitors matters for willingness to compete.
The task used in this experiment was separating red lentils from white rice grains.
Specifically, each person received a bowl with a mixture of rice and lentils, and another
8

empty bowl to place the separated lentils.9 We used red colored bowls for separated
lentils so that color of lentils matches with the bowl and make it difficult for our subjects
to count/guess the other person’s score. Each separated lentil won participants points,
while each rice grain picked along with lentils made them lose points. Hence, performance
is measured by the number of lentils minus any rice grains placed in the red bowl.
This task was selected because it was very simple to explain and implement. Since
most of the participants were uneducated and from the unskilled labor force, with the
majority of them working as farmers, a task involving everyday grains and pulses was
comprehensible to our average participant. In addition, this task was ethnicity neutral
(as was found in a pilot and further established in the first stage of the experiment), so no
differences in ability were expected across ethnicity. Furthermore, our subjects were all
men coming from patriarchal societies where women are mostly considered homemakers
and are involved in cooking, so men were expected to know very little about cooking
and hence sorting rice and lentils. So, this task was completely new to our subjects, as
also confirmed in the exit survey. See Appendix B for a detailed explanation of the task
and experimental instructions.
Each session lasted about ninety minutes and was attended in equal proportions by
members of the two ethnic groups. Therefore, by design, our sample is balanced across
ethnicity in all sessions and the experiment overall.
Participants were assigned to groups of six and each session had four groups in total.
Thus, twenty-four participants in total participated in each session, of which half were
Santals and half Bengalis.10 In the lab, there were four big rectangular tables with six
chairs around, so each group was assigned to a table. By varying the ethnic composition
of a group, our design involves three group treatments: homogeneous, majority, and
minority. A homogeneous group was composed of participants from a single ethnicity,
i.e. either they had six Santals or six Bengalis in the group. Mixed groups comprised
participants of both ethnic identities. They either had two Santals and four Bengalis
(i.e. a group where Santals are a numerical minority) or four Santals and two Bengalis
(i.e. a group where Santals are a numerical majority). Moreover, in mixed groups, a
minority member of that group was always seated next to or in front of their ethnic
peer. For example, a Bengali in a minority group was always seated next to or in front
9The mix was always one-fifth lentils and four-fifth rice in terms of volume. Since lentils are smallerand lighter than rice grains, this ratio gave us a near fifty-fifty ratio of numbers of rice and lentils ineach bowl.
10The only exception was one session where there were twelve participants in mixed groups, a Santal-majority (where Santals are a numerical majority) and a Santal-minority (where Santals are a numericalminority).
9
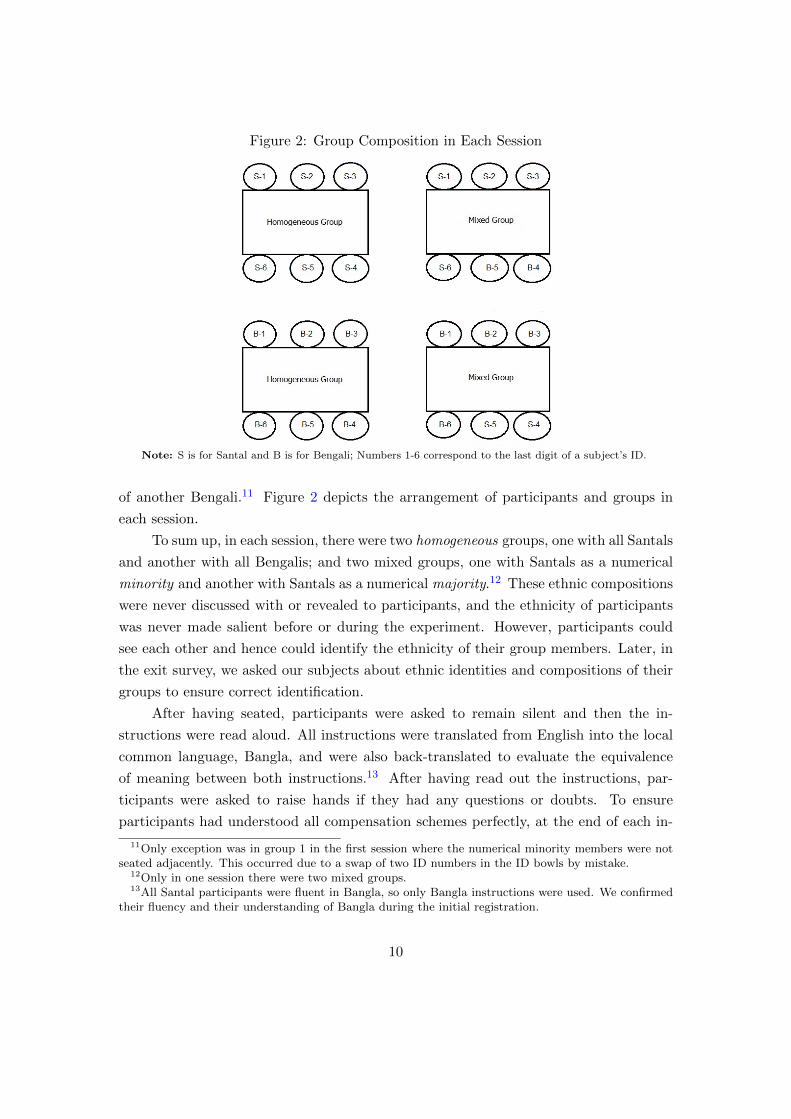
Figure 2: Group Composition in Each Session
Note: S is for Santal and B is for Bengali; Numbers 1-6 correspond to the last digit of a subject’s ID.
of another Bengali.11 Figure 2 depicts the arrangement of participants and groups in
each session.
To sum up, in each session, there were two homogeneous groups, one with all Santals
and another with all Bengalis; and two mixed groups, one with Santals as a numerical
minority and another with Santals as a numerical majority.12 These ethnic compositions
were never discussed with or revealed to participants, and the ethnicity of participants
was never made salient before or during the experiment. However, participants could
see each other and hence could identify the ethnicity of their group members. Later, in
the exit survey, we asked our subjects about ethnic identities and compositions of their
groups to ensure correct identification.
After having seated, participants were asked to remain silent and then the in-
structions were read aloud. All instructions were translated from English into the local
common language, Bangla, and were also back-translated to evaluate the equivalence
of meaning between both instructions.13 After having read out the instructions, par-
ticipants were asked to raise hands if they had any questions or doubts. To ensure
participants had understood all compensation schemes perfectly, at the end of each in-
11Only exception was in group 1 in the first session where the numerical minority members were notseated adjacently. This occurred due to a swap of two ID numbers in the ID bowls by mistake.
12Only in one session there were two mixed groups.13All Santal participants were fluent in Bangla, so only Bangla instructions were used. We confirmed
their fluency and their understanding of Bangla during the initial registration.
10
struction, a range of frequently asked questions and their answers were also read out to
participants. They were advised to listen to them very carefully and were told to raise
hands if they had any questions or doubts. Then, after answering any questions, the
experimenter asked the participants to rub their hands twice and then gave the signal
to start the task. After 60 seconds, participants had to stop performing the task and
immediately put their hands up (the same as when someone is called to surrender).14
Participants were informed at the start of the experiment that they would perform the
task in three stages and one of these stages would be randomly chosen for payment.
Additionally, participants received detailed instruction on each stage only prior to per-
forming the task in that stage and were never given feedback on absolute or relative
performance between stages. At the end, participants were told how well they had done
in each stage, but they were not informed about their relative performance. The incen-
tive structure of each stage is laid out below.
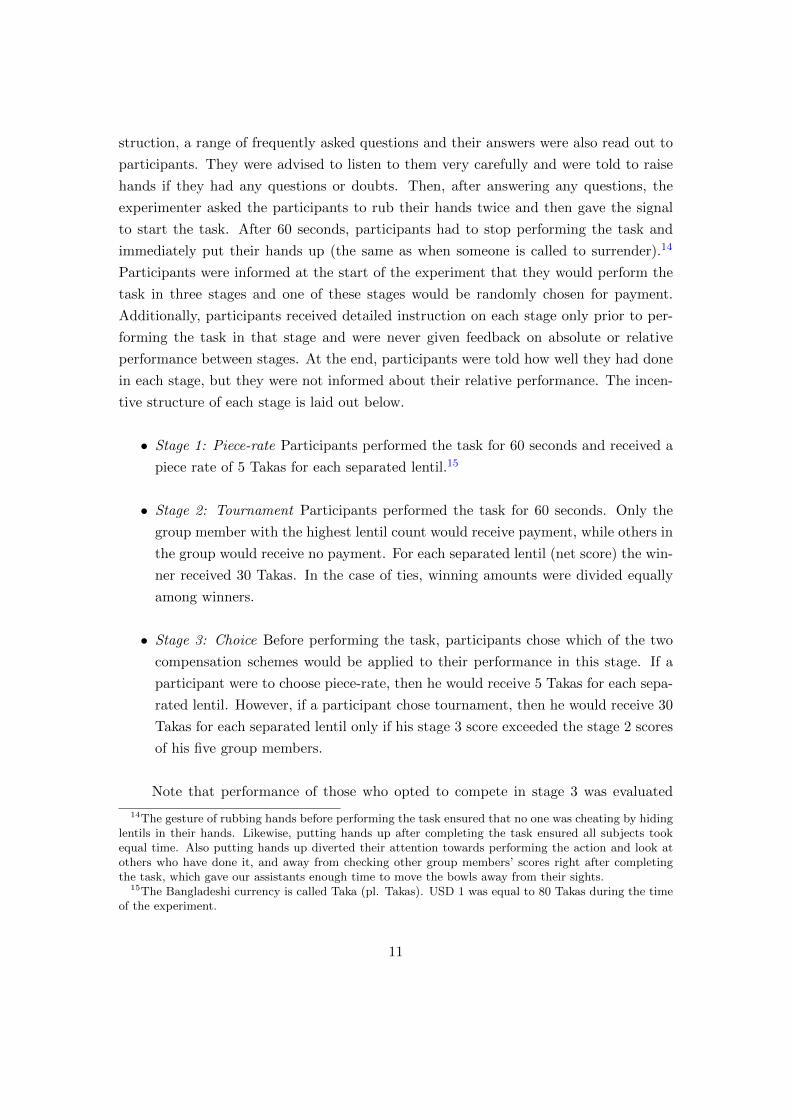
• Stage 1: Piece-rate Participants performed the task for 60 seconds and received a
piece rate of 5 Takas for each separated lentil.15
• Stage 2: Tournament Participants performed the task for 60 seconds. Only the
group member with the highest lentil count would receive payment, while others in
the group would receive no payment. For each separated lentil (net score) the win-
ner received 30 Takas. In the case of ties, winning amounts were divided equally
among winners.
• Stage 3: Choice Before performing the task, participants chose which of the two
compensation schemes would be applied to their performance in this stage. If a
participant were to choose piece-rate, then he would receive 5 Takas for each sepa-
rated lentil. However, if a participant chose tournament, then he would receive 30
Takas for each separated lentil only if his stage 3 score exceeded the stage 2 scores
of his five group members.
Note that performance of those who opted to compete in stage 3 was evaluated
14The gesture of rubbing hands before performing the task ensured that no one was cheating by hidinglentils in their hands. Likewise, putting hands up after completing the task ensured all subjects tookequal time. Also putting hands up diverted their attention towards performing the action and look atothers who have done it, and away from checking other group members’ scores right after completingthe task, which gave our assistants enough time to move the bowls away from their sights.
15The Bangladeshi currency is called Taka (pl. Takas). USD 1 was equal to 80 Takas during the timeof the experiment.
11
against those who had already competed under the competitive compensation scheme in
stage 2. Therefore, beliefs regarding choices of others in stage 3 would not affect some-
one’s decision to enter into competition. Moreover, choice of entering into competition
would not affect payments of other participants, which ruled out the possibility of im-
posing negative externalities on others by winning in stage 3 (Niederle and Vesterlund,
2007). In addition, it also ensured that consequences, such as fear of being punished by
other group members outside the lab would not affect choice.
It should also be mentioned that all assistants were male Bengalis working as an-
thropology researchers (who were well respected among villagers) from a local public
university in collaboration with a local NGO, which was also well respected and trusted
for providing micro-loans, eradicating poverty and fighting for human rights for the
needy. We can thus be confident that behavior of Santals would not be affected by fear
of being discriminated by experimenters in terms of payment.
3.3 Confidence and Risk Preferences
The decision to enter into competition in stage 3 could be affected by individuals’
beliefs about their relative performance in their group. So, to control for this we elicited
these beliefs for performance in stage 2, the compulsory tournament stage, paying partici-
pants for correct reports.16 Another important factor that might affect one’s willingness
to compete in stage 3 is attitudes towards risk. We elicited risk attitudes through a
standard risk game (Gneezy and Potters, 1997; Gneezy et al., 2009), immediately after
completing stage 3.17
16Immediately after stage 2, we randomly asked our participants to go to the registration desk, oneby one, where we showed them a picture with six heads. Heads were arranged vertically where thetopmost head represented the ‘best’ (or rank 1) and that at the bottom represented the ‘worst’ (or rank6) performer in stage 2. Participants only had to point to a head with their finger, and then return totheir respective desks. They received 50 Takas if their guesses were correct and no money if incorrect.See Appendix B for the heads’ arrangements.
17In this one-shot independent game, we asked our subjects to bet a proportion [0, 100] of theirendowment of 100 units, or 20 Takas, into a lottery. The bet had a fifty-fifty chance of winning whichwas determined by a coin toss. Subjects received six times the amount invested if there was a headbut lost the bet money if there was a tail. If the proportion of the bet was less than 100 percent,then subjects received the remaining un-bet amount, irrespective of the coin-toss outcome. FollowingGneezy et al. (2009), stakes in the risk game overlap the stakes in the competitiveness game, wherein theinitial endowment is equivalent to the payment for separating four lentils under the piece-rate scheme.Likewise, the maximum payoff is equivalent to the payment for separating the same amount of lentilsunder the tournament scheme. After the instruction was read aloud, subjects were asked to raise handsif they had any queries. Then, after clearing any confusions, the experimenter asked the subjects to goto the registration desk, one by one, in random order, where they were asked to state their risk choices.The coin toss was performed immediately after a bet was placed and the outcome of the toss was alwaysconfirmed by the subject. See Appendix B for the Risk Game instructions. Registration desks werelocated outside the lab room (though on few occasions it was inside when the room was large enough),
12
3.4 Exit Survey and Payment
After completing the risk game, participants were asked to go to an assistant to
complete an exit survey. For each subject, we obtained data on their socioeconomic
background and some other individual level data, namely marital status, the level of
intercultural competence, land possessions, handedness and so on. In addition to money
earned from the games, each subject received a show-up fee of 100 Takas. For 90 min-
utes of their time, our average subject earned about 1.5 times more (320 Takas) than
their average daily income (207 Takas) and six times more than the daily national min-
imum wage (Minimum Wage Board Bangladesh, 2015). At the end of the experiment,
participants were paid in cash, individually and in private.
3.5 Hypotheses
We formulate three hypotheses. The first hypothesis concerns performance in the
first stage of the experiment. Since our study is concerned with ethnic differences in
preferences for competing on a task, it is important that the chosen task is not associ-
ated with an ethnic stereotype attached to a specific group. Indeed, we selected a simple
manual task that was expected to be novel and neutral to participants of both ethnicities
and hence we do not expect (and pretests confirmed this) to see any ethnic differences
in performance in the first stage of the experiment.
Hypothesis 1: There is no difference in performance across ethnic groups in the
piece-rate stage.
Our second hypothesis concerns performance in the tournament stage. Here, we
expect participants to perform differently in homogeneous and mixed treatments. This
is because under a tournament scheme an individual’s effort negatively affect others, so
subjects are more likely to internalize the negative externality their effort imposes on a
group of co-ethnics as opposed to that of non-co-ethnics (Bandiera et al., 2005).
Hypothesis 2: In the tournament stage, performance would be lower in homoge-
neous treatment than in mixed treatments.
Our last hypothesis, concerns behavior in the third stage. Given the power struc-
ture that connects the two ethnic groups, we expect the ethnic minority Santals to
respond differently to the ethnic composition of potential competitors than the ethnic
so other subjects could not see or hear any risky choices and outcomes that were made at the desk.Hence, choices for risky bets were individual decisions that did not affect decisions or payoffs of others,which is analogous to the mechanism of making choices in stage 3.
13
majority Bengalis.
Hypothesis 3: (i) Santals would be less willing to compete in mixed treatments;
(ii) Bengalis would be more willing to compete in mixed treatments.
This hypothesis is consistent with the evidence from the literature on gender dif-
ferences in competitive preferences, which has found that the gender of a competi-
tor significantly affects one’s inclination towards competition (Booth and Nolen, 2012;
Datta Gupta et al., 2013; Geraldes, 2016).
4 Results
4.1 Participant Summary Statistics
Table 1 presents summary statistics of the participants’ characteristics that we col-
lected through the exit survey by ethnic group. The average age of our participants
is around 36 years, the average education attainment is in the range of 5-6 years, and
around 80 percent of the participants were married at least once. None of these char-
acteristics is significantly different across the two ethnic groups. However, the average
daily income and land possessions of Bengalis are significantly higher than those of San-
tals. It means that, as expected, Santals are rather poorer and from a lower social class,
as land holdings are good indicators of one’s social status in a village (Rao, 2001). An-
other good indicator of socioeconomic status is one’s family background. Santal parents
are significantly less educated and their fathers’ earn less than Bengali fathers, while
the opposite is true of their mothers.18 Note, however, that these comparisons rely on
information on parental income reported by only about half of participants.
With regards to the occupation of participants, around 60 percent of Bengalis
and 80 percent of Santals engage in farming; this difference is statistically significant
according to a Pearson’s Chi-Squared test (CS-test hereinafter) (p < 0.01). The rest are
either students, owners of small businesses or working in other non-farming areas such
as weaving baskets, making bamboo furniture and so on. In terms of income, farmers
earn significantly less than non-farmers according to a two sided Mann-Whitney U test
(MW-test hereinafter) (p < 0.01).19
Almost all participants were able to correctly identify the ethnicity of members in
18This difference may be explained by the fact that Bengali women (who are Muslims) are mostlyhomemakers and hence might engage in paid-work less than Santal women.
19It should be noted that, since students have no income and are better educated than individuals whoare working, income and education have a negative relationship in our sample. In addition, the majorityof farmers work as day laborers for a fixed daily wage, which is independent of educational attainment.
14
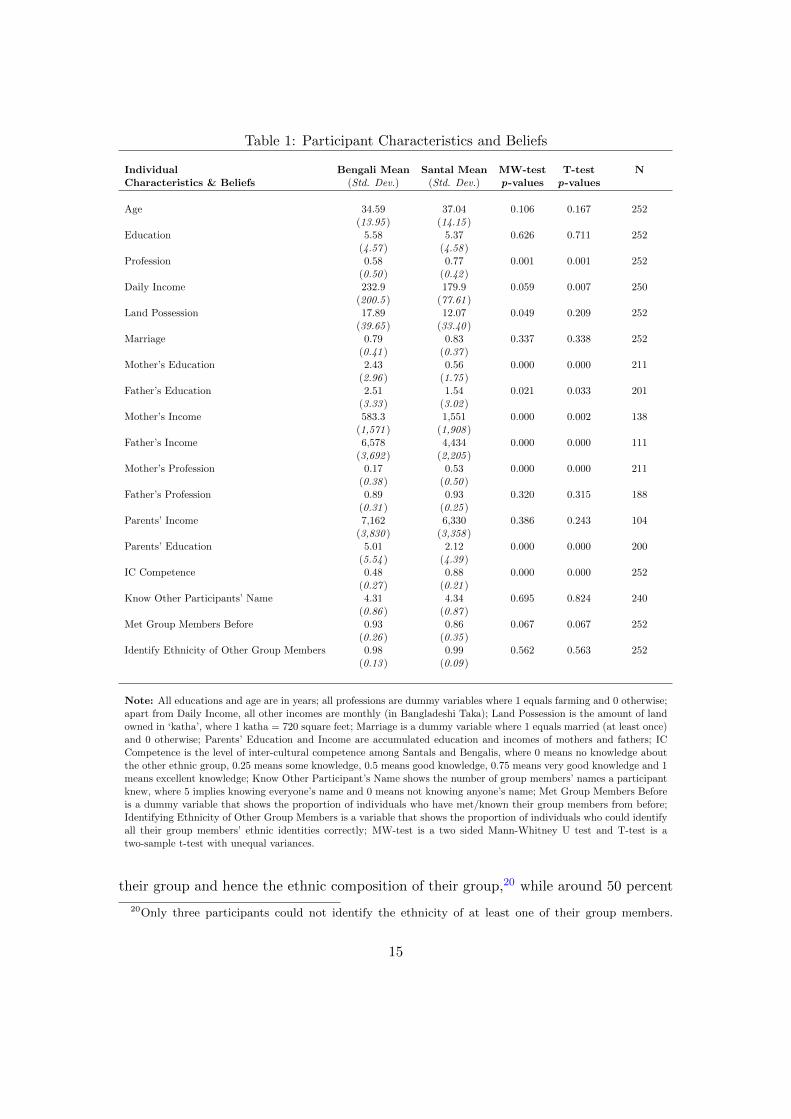
Table 1: Participant Characteristics and Beliefs
Individual Bengali Mean Santal Mean MW-test T-test NCharacteristics & Beliefs (Std. Dev.) (Std. Dev.) p-values p-values
Age 34.59 37.04 0.106 0.167 252(13.95 ) (14.15 )
Education 5.58 5.37 0.626 0.711 252(4.57 ) (4.58 )
Profession 0.58 0.77 0.001 0.001 252(0.50 ) (0.42 )
Daily Income 232.9 179.9 0.059 0.007 250(200.5 ) (77.61 )
Land Possession 17.89 12.07 0.049 0.209 252(39.65 ) (33.40 )
Marriage 0.79 0.83 0.337 0.338 252(0.41 ) (0.37 )
Mother’s Education 2.43 0.56 0.000 0.000 211(2.96 ) (1.75 )
Father’s Education 2.51 1.54 0.021 0.033 201(3.33 ) (3.02 )
Mother’s Income 583.3 1,551 0.000 0.002 138(1,571 ) (1,908 )
Father’s Income 6,578 4,434 0.000 0.000 111(3,692 ) (2,205 )
Mother’s Profession 0.17 0.53 0.000 0.000 211(0.38 ) (0.50 )
Father’s Profession 0.89 0.93 0.320 0.315 188(0.31 ) (0.25 )
Parents’ Income 7,162 6,330 0.386 0.243 104(3,830 ) (3,358 )
Parents’ Education 5.01 2.12 0.000 0.000 200(5.54 ) (4.39 )
IC Competence 0.48 0.88 0.000 0.000 252(0.27 ) (0.21 )
Know Other Participants’ Name 4.31 4.34 0.695 0.824 240(0.86 ) (0.87 )
Met Group Members Before 0.93 0.86 0.067 0.067 252(0.26 ) (0.35 )
Identify Ethnicity of Other Group Members 0.98 0.99 0.562 0.563 252(0.13 ) (0.09 )
Note: All educations and age are in years; all professions are dummy variables where 1 equals farming and 0 otherwise;apart from Daily Income, all other incomes are monthly (in Bangladeshi Taka); Land Possession is the amount of landowned in ‘katha’, where 1 katha = 720 square feet; Marriage is a dummy variable where 1 equals married (at least once)and 0 otherwise; Parents’ Education and Income are accumulated education and incomes of mothers and fathers; ICCompetence is the level of inter-cultural competence among Santals and Bengalis, where 0 means no knowledge aboutthe other ethnic group, 0.25 means some knowledge, 0.5 means good knowledge, 0.75 means very good knowledge and 1means excellent knowledge; Know Other Participant’s Name shows the number of group members’ names a participantknew, where 5 implies knowing everyone’s name and 0 means not knowing anyone’s name; Met Group Members Beforeis a dummy variable that shows the proportion of individuals who have met/known their group members from before;Identifying Ethnicity of Other Group Members is a variable that shows the proportion of individuals who could identifyall their group members’ ethnic identities correctly; MW-test is a two sided Mann-Whitney U test and T-test is atwo-sample t-test with unequal variances.
their group and hence the ethnic composition of their group,20 while around 50 percent
20Only three participants could not identify the ethnicity of at least one of their group members.
15
of our subjects knew all five names of their group members and around 80 percent knew
at least four of them. There is no significant difference in these measures across eth-
nic groups (MW-test p = 0.57 and p = 0.70 respectively). We also asked participants
some questions to assess their knowledge of the other ethnic group’s culture. We call
this the level of intercultural competence (Fantini, 2010).21 There is a significant dif-
ference in intercultural competence across ethnic groups (MW-test p < 0.01), with the
Santals displaying significantly better knowledge about their non-co-ethnic peers. All
background characteristics, and in particular the ones that differ across ethnicity that
we have underlined here, will be directly controlled for in our regression analysis.
We next turn to experimentally elicited characteristics. In terms of beliefs regarding
relative performance in the tournament stage, we compute the perceived probability of
winning the tournament in stage 2 following Sutter et al. (2016). We construct a dummy
variable which equals 1 if a subject has reported a perceived rank of either 1 or 2 for
his own performance in stage 2 and 0 otherwise. One’s perceived probability of winning
in the compulsory tournament can be a proxy for the probability of winning in the
discretionary tournament in stage 3, assuming no expected increase in ability from stage
2 to 3. There are no significant differences across group compositions and ethnic groups
in this measure (CS-test p > 0.10 for all). See Table 1 in Appendix A for the summary
and test results. Summary of guessed ranks is available in Table 2 in Appendix A.
Finally, Table 2 summarizes elicited risk attitudes by ethnic group. The two ethnic
groups demonstrate almost identical attitude towards risk (CS-test p = 0.543).22 We
also control for these elicited attributes in our regression analysis.
Excluding these three participants from our analysis does not affect the main results of the paper.21Our questions are a very simplified version of Fantini’s intercultural competence assessment ques-
tions, focusing only on the ‘awareness dimension’ of individuals. During the exit survey, we asked foursimple questions regarding the opposite culture and produced a score from 0 to 1 for each participant,by assigning 0.25 to each correct answer.
22Since the Risk Game was conducted as a separate ‘bonus’ game which took place immediately afterthe main game ended, participants knew they were not part of their group any longer prior to makingrisky investment decisions. Also, participants made their risky decisions individually and away fromtheir group table, so group composition should not have affected their behavior. However, test resultssuggest otherwise. Between ethnic groups tests show that Santals, who were in a homogeneous treatment,invested significantly more than Bengalis (CS-test p = 0.011); investments in other groups, however, werenot significantly different between ethnicity (CS-test p > 0.10 for all other groups). Likewise, withinethnic groups tests show that Santals from the homogeneous treatment invested significantly more thantheir co-ethnics in majority and minority treatment groups. Although among Bengali subjects, allinvestments were equal (CS-test p > 0.10 for all).
16
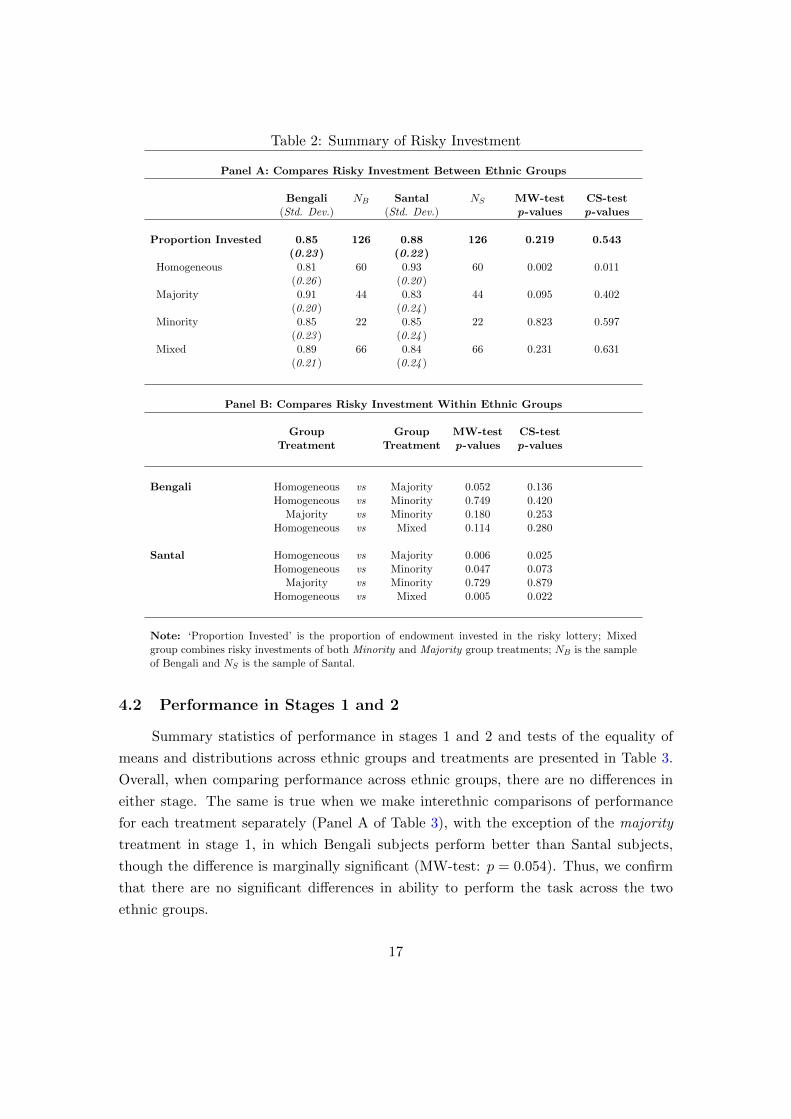
Table 2: Summary of Risky Investment
Panel A: Compares Risky Investment Between Ethnic Groups
Bengali NB Santal NS MW-test CS-test(Std. Dev.) (Std. Dev.) p-values p-values
Proportion Invested 0.85 126 0.88 126 0.219 0.543(0.23) (0.22)
Homogeneous 0.81 60 0.93 60 0.002 0.011(0.26 ) (0.20 )
Majority 0.91 44 0.83 44 0.095 0.402(0.20 ) (0.24 )
Minority 0.85 22 0.85 22 0.823 0.597(0.23 ) (0.24 )
Mixed 0.89 66 0.84 66 0.231 0.631(0.21 ) (0.24 )
Panel B: Compares Risky Investment Within Ethnic Groups
Group Group MW-test CS-testTreatment Treatment p-values p-values
Bengali Homogeneous vs Majority 0.052 0.136Homogeneous vs Minority 0.749 0.420
Majority vs Minority 0.180 0.253Homogeneous vs Mixed 0.114 0.280
Santal Homogeneous vs Majority 0.006 0.025Homogeneous vs Minority 0.047 0.073
Majority vs Minority 0.729 0.879Homogeneous vs Mixed 0.005 0.022
Note: ‘Proportion Invested’ is the proportion of endowment invested in the risky lottery; Mixedgroup combines risky investments of both Minority and Majority group treatments; NB is the sampleof Bengali and NS is the sample of Santal.
4.2 Performance in Stages 1 and 2
Summary statistics of performance in stages 1 and 2 and tests of the equality of
means and distributions across ethnic groups and treatments are presented in Table 3.
Overall, when comparing performance across ethnic groups, there are no differences in
either stage. The same is true when we make interethnic comparisons of performance
for each treatment separately (Panel A of Table 3), with the exception of the majority
treatment in stage 1, in which Bengali subjects perform better than Santal subjects,
though the difference is marginally significant (MW-test: p = 0.054). Thus, we confirm
that there are no significant differences in ability to perform the task across the two
ethnic groups.
17

Figure 3: Performance: Comparing Performances Within Ethnic Groups
Note: Each bar represents the mean score of participants in Stages 1 and 2 with 95 percent confidence interval.
We next examine whether there are across treatment differences in performance in
stage 1; see Graph A in Figure 3 for a visualization of these differences for each ethnic
group separately. What emerges is a similar pattern for both ethnic groups: perfor-
mance is higher in the mixed (majority and minority) treatments than the homogeneous
treatment, though the differences are statistically significant only for Bengalis (tests are
reported in Panel B of Table 3). The fact that in mixed groups performance is higher
when compensation is not competitive is surprising.
Regarding stage 2 performance, we find a similar pattern as in stage 1 (see Figure 3;
Graph B). For both ethnic groups, performance in majority and minority treatments is
higher compared to the homogeneous treatment. Furthermore, the difference in perfor-
mance between homogeneous and mixed treatments is statistically significant for both
ethnic groups, when we pool scores from majority and minority treatments together
(MW-test: p = 0.071 for Santals and p < 0.01 for Bengalis).23 This finding is expected
in this stage with a competitive incentive structure in place, as participants may be more
likely to internalize the negative externality imposed on their co-ethnic as opposed to
members of the other ethnicity.
23There is no statistically significant difference in performance across the majority and the minoritytreatments (MW-test: p > 0.10 for both ethnic groups).
18

Table 3: Summary of Performance in Stages 1 and 2
Panel A: Compares Performance Between Ethnic Groups
Mean Score Mean Score Mean Score MW-test T-test Mean Score Mean Score Mean Score MW-test T-test Nof Bengali & Santal of Bengali of Santal p-values p-values of Bengali & Santal of Bengali of Santal p-values p-values
(Std. Dev.) (Std. Dev.) (Std. Dev.) (Std. Dev.) (Std. Dev.) (Std. Dev.)
Stage 1 23.93 24.10 23.77 0.566 0.720 Stage 2 25.97 25.73 26.21 0.904 0.602 252(7.19) (7.67) (6.69) (7.36) (7.71) (7)
Homogeneous 22.17 21.72 22.62 0.242 0.446 Homogeneous 24.34 23.78 24.90 0.383 0.301 120(6.43 ) (6.51 ) (6.37 ) (5.88 ) (6.35 ) (5.38 )
Majority 25.53 26.55 24.52 0.054 0.214 Majority 27.63 27.80 27.45 0.871 0.847 88(7.60 ) (8.22 ) (6.87 ) (8.20 ) (8.61 ) (7.86 )
Minority 25.55 25.68 25.41 0.707 0.903 Minority 27.11 26.91 27.32 0.526 0.873 44(7.32 ) (7.85 ) (6.93 ) (8.34 ) (8.23 ) (8.64 )
Mixed 25.54 26.26 24.82 0.057 0.271 Mixed 27.45 27.5 27.41 0.662 0.950 132(7.48 ) (8.05 ) (6.85 ) (8.22 ) (8.44 ) (8.07 )
Panel B: Compares Performance Within Ethnic Groups
Group Group MW-test T-test Group Group MW-test T-testTreatment Treatment p-values p-values Treatment Treatment p-values p-values
Stage 1 Stage 2
Bengali Homogeneous vs Majority 0.000 0.002 Bengali Homogeneous vs Majority 0.006 0.011Homogeneous vs Minority 0.005 0.042 Homogeneous vs Minority 0.024 0.117
Majority vs Minority 0.605 0.680 Majority vs Minority 0.989 0.687Homogeneous vs Mixed 0.000 0.001 Homogeneous vs Mixed 0.002 0.006
Santal Homogeneous vs Majority 0.363 0.153 Santal Homogeneous vs Majority 0.051 0.067Homogeneous vs Minority 0.163 0.108 Homogeneous vs Minority 0.444 0.230
Majority vs Minority 0.629 0.626 Majority vs Minority 0.658 0.951Homogeneous vs Mixed 0.185 0.064 Homogeneous vs Mixed 0.071 0.041
Note: Mixed group combines scores of both Minority and Majority group treatments; N is the total sample size, wherein ethnic groups are in equal proportions in each group composition; MW-test isthe two sided Mann-Whitney U test; T-test is the unpaired t-test with unequal variances; test p-values are comparing performance differences between ethnic groups in Panel A and within ethnic groupsin Panel B.
19
Comparing performance across stages 1 and 2, we see a significant performance
improvement from stage 1 to stage 2 for both ethnic groups (Wilcoxon signed-rank test
(SR-test): p < 0.01 for both). Among Bengalis, this improvement is entirely driven by
members of the homogeneous group, however, this is not the case among Santals. See
Table 3 in Appendix A for the summary and test results. The increase in performance
moving from piece-rate to competitive incentive is consistent with existing studies on
performance and competitiveness, which show that participants, on average, perform
significantly better in tournaments as compared to piece-rate schemes (Gneezy et al.,
2003; Niederle and Vesterlund, 2007; Buser et al., 2014).
In summary, we find no significant differences, overall or by treatment, in perfor-
mance across the two ethnic groups, which is consistent with the first hypothesis. At
the same time, we do see that for both groups performance is higher in ethnically-mixed
as compared to homogeneous treatments, which provides strong evidence for the second
hypothesis.
4.3 Competitive Choice
Overall, we do not find any differences in competitive choices across ethnic groups
in stage 3. As shown in Table 4, an equal fraction of Santals and Bengalis (37 percent)
opted to compete in the choice stage (CS-test: p = 0.896). However, when we look across
treatments, we see some marked differences between the two ethnic groups. In partic-
ular, in homogeneous treatment more Santals opted to compete (CS-test: p = 0.087),
whereas in minority treatment more Bengalis opted to compete (CS-test: p = 0.026).
Considering all treatment groups, there is a completely reverse pattern in competitive
choices made by the two ethnic groups, which is evident in Figure 4. We see that San-
tals choose to compete the most in homogeneous treatment and the least in minority
treatment, whereas this relationship is reversed for Bengalis, who opted to compete the
most in minority treatment and the least in homogeneous treatment.24 While half of
Bengalis chose to compete in a minority treatment, only 18 percent of Santals opted
to compete in that same treatment, and for both ethnic groups, these differences are
statistically significant when compared against choices made in homogeneous treatment
(CS-test: p = 0.067 for Bengalis and p = 0.036 for Santals), which is consistent with our
final hypothesis.
This implies that as groups get more populated by Santals, Bengalis show higher
tendency to compete; on the other hand, as the number of Bengalis increases in a group,
Santals are less likely to compete. It is noteworthy that for the Bengalis the pattern
24Tests of treatment differences for each ethnic group are presented in Panel B of Table 4.
20

Figure 4: Competitive Choice: Comparing Choices Within Ethnic Groups
Note: Each bar represents the proportion of participants who opted to compete in stage 3 with 95 percent
confidence interval. Homogeneous is a group composition where all individuals are co-ethnics; Majority is a
group composition where either Santals or Bengalis are numerical majorities; Minority is a group composition
where either Santals or Bengalis are numerical minorities.
of entry across treatment we see in Figure 4 is consistent with performance in stage 2,
namely, there is more entry in the mixed treatment that performed better in stage 2
than the homogeneous treatment. For the Santals, however, it is not, as we see more
entry in the homogeneous treatment that performed the worst in stage 2.
To probe further what drives the patterns underscored above, it is instructive to
examine whether there are differences between ethnic group within treatment or within
ethnic group between treatment in the optimality of the decisions made in this stage,
both for entrants and non-entrants. We first examine those who opted to compete. Out
of the total 93 competitors in stage 3, 47 were Santals and 46 were Bengalis, of which,
10 Santals (21 percent of Santal competitors) and 13 Bengalis (28 percent of Bengali
competitors) won; there is no statistically significant difference in the probability of win-
ning conditional on entry across ethnic groups (CS-test: p = 0.438). We also find no
significant difference in winning conditional on entering in any other pairwise compar-
ison, whether between ethnic groups within treatment or within ethnic group between
treatments. These results suggest that the patterns of competitive entry underlined
above cannot be explained by differences in the optimality of the decision of entrants.
Summary and test results are available in Table 4 in Appendix A.
21

Table 4: Summary of Competitive Choice
Panel A: Compares Competitive Choice Between Ethnic Groups
Proportion of NB Proportion of NS MW-test CS-testBengali Santal p-values p-values
(Std. Dev.) (Std. Dev.)
Compete 0.37 126 0.37 126 0.896 0.896(0.48) (0.49)
Homogeneous 0.28 60 0.43 60 0.088 0.087(0.45 ) (0.50 )
Majority 0.41 44 0.39 44 0.829 0.828(0.50 ) (0.49 )
Minority 0.50 22 0.18 22 0.028 0.026(0.51 ) (0.39 )
Mixed 0.44 66 0.32 66 0.153 0.151(0.50 ) (0.47 )
Panel B: Compares Competitive Choice Within Ethnic Groups
Group Group MW-test CS-testTreatment Treatment p-values p-values
Bengali Homogeneous vs Majority 0.182 0.180Homogeneous vs Minority 0.069 0.067
Majority vs Minority 0.486 0.483Homogeneous vs Mixed 0.070 0.069
Santal Homogeneous vs Majority 0.633 0.631Homogeneous vs Minority 0.037 0.036
Majority vs Minority 0.095 0.093Homogeneous vs Mixed 0.184 0.182
Note: ‘Compete’ is a dummy variable and is equal to 1 if the individual opted to compete and 0 otherwise;
Mixed group pools both Minority and Majority groups together; NB is the Bengali sample; NS is the Santal
sample; test p-values are comparing choices horizontally.
Turning attention to those who opted not to compete, it turns out that for 22 out of
159 participants (12 Santals or 13 percent of Santal non-competitors and 10 Bengalis or
15 percent of Bengali non-competitors) this was not the optimal decision, as they would
have won the tournament had they selected to enter.25 There is no statistically significant
difference in this regard between the two ethnic groups (CS-test: p = 0.623). Looking
25Participants who would have won in stage 3 are the participants who chose not to compete butoutperformed their group competitors’ stage 2 score in stage 3. Hence, if they had chosen to compete,they would have won in the choice stage.
22
at ethnic group differences by treatment, we see that in the minority treatment, Santals
are more likely to be in this group than Bengalis, the difference being near-marginally
significant (CS-test: p = 0.153). Therefore, there is some evidence of suboptimal non-
entry of the Santals in the minority treatment relative to Bengalis in the same position.
Table 5 in Appendix A contains the summary and test results of non-entrants who would
have won in stage 3 if they had opted to compete.
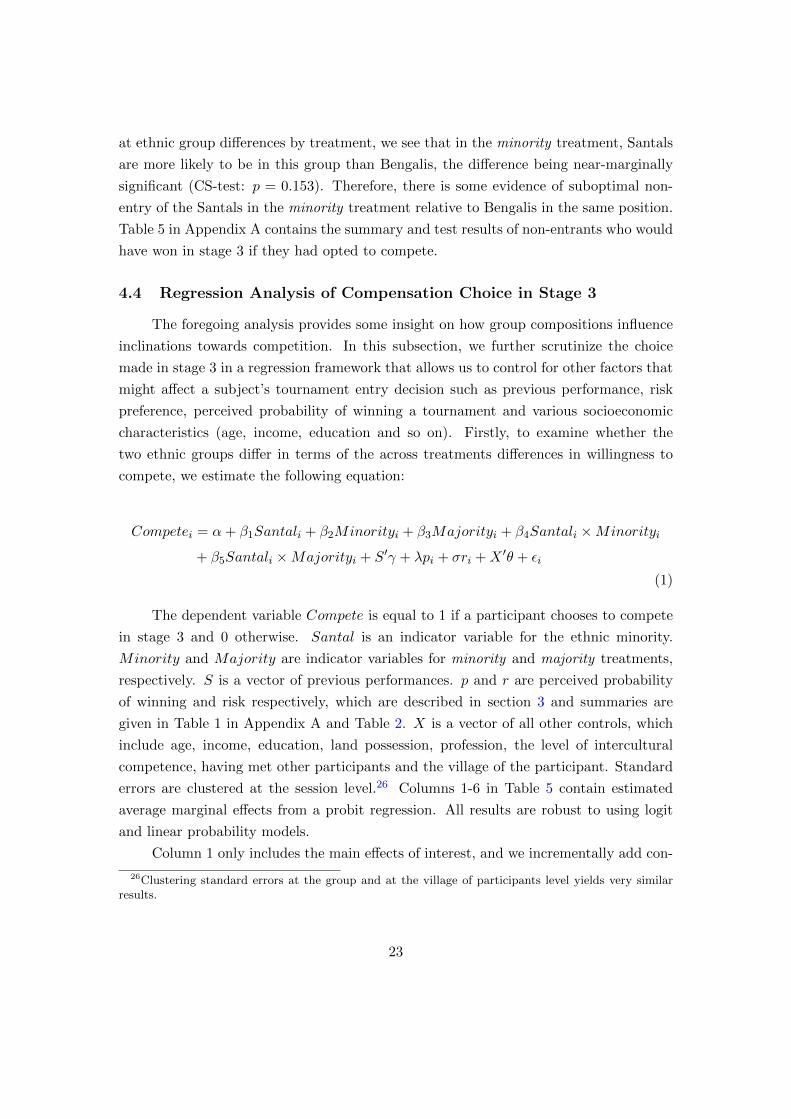
4.4 Regression Analysis of Compensation Choice in Stage 3
The foregoing analysis provides some insight on how group compositions influence
inclinations towards competition. In this subsection, we further scrutinize the choice
made in stage 3 in a regression framework that allows us to control for other factors that
might affect a subject’s tournament entry decision such as previous performance, risk
preference, perceived probability of winning a tournament and various socioeconomic
characteristics (age, income, education and so on). Firstly, to examine whether the
two ethnic groups differ in terms of the across treatments differences in willingness to
compete, we estimate the following equation:
Competei = α+ β1Santali + β2Minorityi + β3Majorityi + β4Santali ×Minorityi
+ β5Santali ×Majorityi + S′γ + λpi + σri +X ′θ + εi
(1)
The dependent variable Compete is equal to 1 if a participant chooses to compete
in stage 3 and 0 otherwise. Santal is an indicator variable for the ethnic minority.
Minority and Majority are indicator variables for minority and majority treatments,
respectively. S is a vector of previous performances. p and r are perceived probability
of winning and risk respectively, which are described in section 3 and summaries are
given in Table 1 in Appendix A and Table 2. X is a vector of all other controls, which
include age, income, education, land possession, profession, the level of intercultural
competence, having met other participants and the village of the participant. Standard
errors are clustered at the session level.26 Columns 1-6 in Table 5 contain estimated
average marginal effects from a probit regression. All results are robust to using logit
and linear probability models.
Column 1 only includes the main effects of interest, and we incrementally add con-
26Clustering standard errors at the group and at the village of participants level yields very similarresults.
23
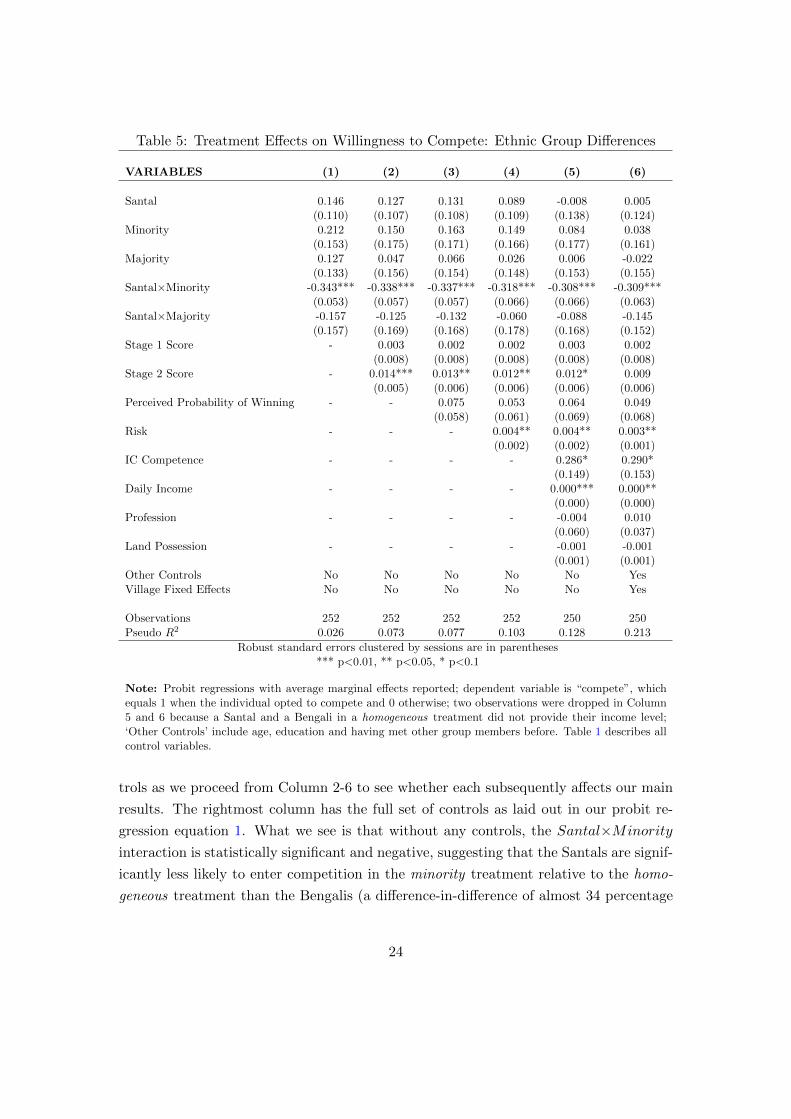
Table 5: Treatment Effects on Willingness to Compete: Ethnic Group Differences
VARIABLES (1) (2) (3) (4) (5) (6)
Santal 0.146 0.127 0.131 0.089 -0.008 0.005(0.110) (0.107) (0.108) (0.109) (0.138) (0.124)
Minority 0.212 0.150 0.163 0.149 0.084 0.038(0.153) (0.175) (0.171) (0.166) (0.177) (0.161)
Majority 0.127 0.047 0.066 0.026 0.006 -0.022(0.133) (0.156) (0.154) (0.148) (0.153) (0.155)
Santal×Minority -0.343*** -0.338*** -0.337*** -0.318*** -0.308*** -0.309***(0.053) (0.057) (0.057) (0.066) (0.066) (0.063)
Santal×Majority -0.157 -0.125 -0.132 -0.060 -0.088 -0.145(0.157) (0.169) (0.168) (0.178) (0.168) (0.152)
Stage 1 Score - 0.003 0.002 0.002 0.003 0.002(0.008) (0.008) (0.008) (0.008) (0.008)
Stage 2 Score - 0.014*** 0.013** 0.012** 0.012* 0.009(0.005) (0.006) (0.006) (0.006) (0.006)
Perceived Probability of Winning - - 0.075 0.053 0.064 0.049(0.058) (0.061) (0.069) (0.068)
Risk - - - 0.004** 0.004** 0.003**(0.002) (0.002) (0.001)
IC Competence - - - - 0.286* 0.290*(0.149) (0.153)
Daily Income - - - - 0.000*** 0.000**(0.000) (0.000)
Profession - - - - -0.004 0.010(0.060) (0.037)
Land Possession - - - - -0.001 -0.001(0.001) (0.001)
Other Controls No No No No No YesVillage Fixed Effects No No No No No Yes
Observations 252 252 252 252 250 250Pseudo R2 0.026 0.073 0.077 0.103 0.128 0.213
Robust standard errors clustered by sessions are in parentheses*** p<0.01, ** p<0.05, * p<0.1
Note: Probit regressions with average marginal effects reported; dependent variable is “compete”, whichequals 1 when the individual opted to compete and 0 otherwise; two observations were dropped in Column5 and 6 because a Santal and a Bengali in a homogeneous treatment did not provide their income level;‘Other Controls’ include age, education and having met other group members before. Table 1 describes allcontrol variables.
trols as we proceed from Column 2-6 to see whether each subsequently affects our main
results. The rightmost column has the full set of controls as laid out in our probit re-
gression equation 1. What we see is that without any controls, the Santal×Minority
interaction is statistically significant and negative, suggesting that the Santals are signif-
icantly less likely to enter competition in the minority treatment relative to the homo-
geneous treatment than the Bengalis (a difference-in-difference of almost 34 percentage
24
points), while Santals in the minority treatment are 20 percentage points less likely to
enter competition than the Bengalis in the same treatment. As we add to the specifica-
tion previous performances, perceived probability of winning a tournament and attitudes
towards risk in Columns 2-4, respectively, we observe a small reduction in the size of the
marginal effect which remains though large and negative.27 When we further add back-
ground characteristics such as daily income, profession, land possession and knowledge
regarding other culture as controls (Column 5) as well as other controls (Column 6), our
main marginal effects of interest remain robustly negative and sizeable.28 With a full
set of controls, in Column (6), the difference in competitive inclination between Santals
in a minority treatment and a homogeneous treatment is 30.9 percentage points less
than the difference in competitive inclination between Bengali in a minority treatment
and a homogeneous treatment. Note that this difference-in-difference is fully accounted
by the across ethnic group difference in the minority treatment as the across ethnic
group difference in the homogeneous treatment has been reduced almost to zero. Hence,
with regard to ethnic differences, our regression results are consistent with our third
hypothesis.
Next, to obtain a clear picture of the size of the group composition effects, we es-
timate another probit regression model for each ethnic group separately. Table 6 shows
our estimated results: Columns S1-S3 for Santals and Columns B1-B3 for Bengalis. As
expected, we observe heterogeneous effects of group composition across the two ethnic
groups. Results for the Santal subsample, presented in Columns S1-S3, suggest that
Santals in both minority and majority treatments are less likely to enter competition
than if they are in the homogeneous treatment. The size of the estimated differences
increase in size and statistical significance as we add controls in Columns S2 and S3,
such that, with a full set of controls, we find that Santals in the minority treatment
are 41.3 percentage points less likely to compete than Santals in the homogeneous treat-
ment. Likewise, Santals in the majority treatment are 29.9 percentage points less likely
to compete than Santals in homogeneous treatment. Of the rest of the controls, inter-
27Our results are robust to using guessed rank (see Table 2 in Appendix A for summary statistics)or the difference between actual and guessed rank (a measure of overconfidence used in Niederle andVesterlund (2007) and other subsequent studies) as a measure of beliefs about relative ability insteadof the perceived probability of winning. Also, controlling for the average score of adjacent peers (thoseseated next to, in front of and in the adjacent corner of a subject a well as all peers in the group) instage 2 does not affect the results.
28When we also add stage 3 performance as a control, with a full set of controls, it has no significanteffect on choosing to compete (p = 0.895) and leaves the average marginal effects of minority treatmentsand all other effects unchanged. This suggests, the anticipation of performing better/worse did not affecttournament entry decisions. Also, instead of village dummies, using percentage of Santal population (orhousehold) for each village of participants yields identical results.
25
cultural knowledge seems to be the only one to have substantial explanatory power over
competitive entry.
Results for the Bengali subsample, presented in Columns B1-B3, imply a reverse
relationship as depicted in Figure 4. Bengalis are more likely to compete in minority
and majority treatments than their co-ethnics in the homogeneous treatment; however,
the difference is not statistically significant, and it reduces in size as we add controls
in Columns B2-B3. Further, it seems, for Bengalis, income and risk preferences explain
almost all their tournament entry decisions. Other factors, including overconfidence and
intercultural knowledge factors, fail to explain tournament entry decisions by the ethnic
majority members.
5 Conclusion
This paper extends the literature on competitive preferences by exploring whether
there are differences in competitive choices across members of the dominant and of a
vulnerable ethnic minority group in rural Bangladesh. By varying the ethnic composition
of the group of competitors, we find that members of the ethnic minority group are more
averse to competing in mixed-ethnicity groups than in groups of co-ethnics. We find the
opposite pattern for members of the ethnic majority group, that is, they are more keen
to compete in ethnically mixed groups than in homogeneous ones.
How important quantitatively are the ethnic differences in competitiveness that
we find? After accounting for the influence of past performance, beliefs about relative
performance, risk attitudes and socioeconomic characteristics, our regression analysis
indicates that Santals in the minority treatment are 31 percentage points less likely to
enter competition than the Bengalis in the same treatment, while Santals in the minority
treatment are 41 percentage points less likely to enter competition than Santals in the
homogeneous treatment. For comparison, the estimated gender gap is typically found
to be about 30 percentage points (Niederle and Vesterlund, 2007), so the quantitative
effect found here would appear to be of the same or greater magnitude than the gender
gap.
The aversion to interethnic competition by the ethnic minority group may have its
roots in the self-perception of the value of the ethnic identity of the particular group and
the associated stereotypes that it evokes. Since, historically, one ethnic group has op-
pressed the other and the two have rarely coexisted peacefully, we might expect that the
two ethnic groups have developed different identities and stereotypes. Assigning ethnic
minority members into a group dominated by ethnic majority members might invoke
26
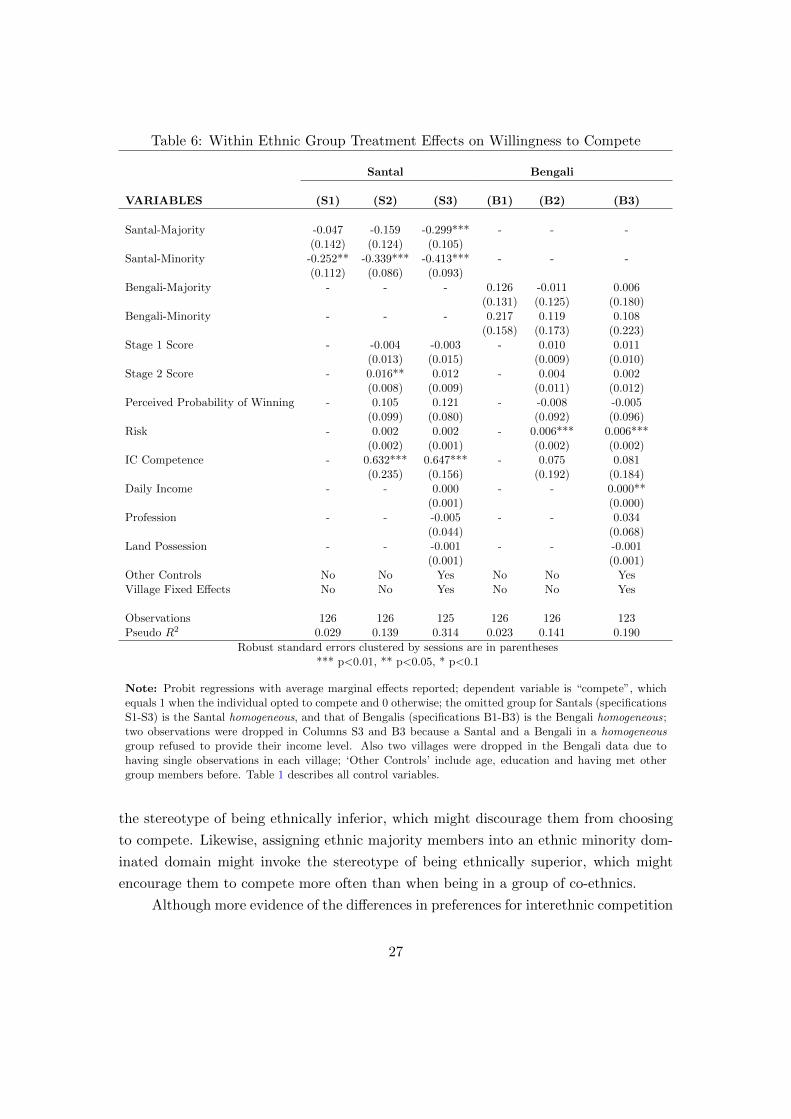
Table 6: Within Ethnic Group Treatment Effects on Willingness to Compete
Santal Bengali
VARIABLES (S1) (S2) (S3) (B1) (B2) (B3)
Santal-Majority -0.047 -0.159 -0.299*** - - -(0.142) (0.124) (0.105)
Santal-Minority -0.252** -0.339*** -0.413*** - - -(0.112) (0.086) (0.093)
Bengali-Majority - - - 0.126 -0.011 0.006(0.131) (0.125) (0.180)
Bengali-Minority - - - 0.217 0.119 0.108(0.158) (0.173) (0.223)
Stage 1 Score - -0.004 -0.003 - 0.010 0.011(0.013) (0.015) (0.009) (0.010)
Stage 2 Score - 0.016** 0.012 - 0.004 0.002(0.008) (0.009) (0.011) (0.012)
Perceived Probability of Winning - 0.105 0.121 - -0.008 -0.005(0.099) (0.080) (0.092) (0.096)
Risk - 0.002 0.002 - 0.006*** 0.006***(0.002) (0.001) (0.002) (0.002)
IC Competence - 0.632*** 0.647*** - 0.075 0.081(0.235) (0.156) (0.192) (0.184)
Daily Income - - 0.000 - - 0.000**(0.001) (0.000)
Profession - - -0.005 - - 0.034(0.044) (0.068)
Land Possession - - -0.001 - - -0.001(0.001) (0.001)
Other Controls No No Yes No No YesVillage Fixed Effects No No Yes No No Yes
Observations 126 126 125 126 126 123Pseudo R2 0.029 0.139 0.314 0.023 0.141 0.190
Robust standard errors clustered by sessions are in parentheses*** p<0.01, ** p<0.05, * p<0.1
Note: Probit regressions with average marginal effects reported; dependent variable is “compete”, whichequals 1 when the individual opted to compete and 0 otherwise; the omitted group for Santals (specificationsS1-S3) is the Santal homogeneous, and that of Bengalis (specifications B1-B3) is the Bengali homogeneous;two observations were dropped in Columns S3 and B3 because a Santal and a Bengali in a homogeneousgroup refused to provide their income level. Also two villages were dropped in the Bengali data due tohaving single observations in each village; ‘Other Controls’ include age, education and having met othergroup members before. Table 1 describes all control variables.
the stereotype of being ethnically inferior, which might discourage them from choosing
to compete. Likewise, assigning ethnic majority members into an ethnic minority dom-
inated domain might invoke the stereotype of being ethnically superior, which might
encourage them to compete more often than when being in a group of co-ethnics.
Although more evidence of the differences in preferences for interethnic competition
27
is needed, a few pointers for policy stem from the findings we have. While policies
to improve workplace diversity would be a good starting point, policy makers could
also target improving competitiveness of members of minority groups through education
and awareness. Educating minority members regarding self-worth, self-esteem and self-
importance, and increasing public awareness to break negative stereotypes associated
with minority members might improve their competitive attitude towards the dominant
group. These possibilities remain interesting avenues for future research.
References
Afridi, F., Li, S. X., and Ren, Y. (2015). Social Identity and Inequality: The Impact of
China’s Hukou System. Journal of Public Economics, 123:17–29.
Ahmed, K. (2010). Defining ‘Indigenous’ in Bangladesh: International Law in Domestic
Context. International Journal on Minority and Group Rights, 17(1):47–73.
AIPP (2007). A Brief Account of Human Rights Situation of the Indigenous Peoples in
Bangladesh. Asian Indigenous Peoples Pact Report.
AIPP (2010). Traditional Livelihoods and Indigenous Peoples. Asia Indigenous Peoples
Pact Foundation, Chiang Mai, Thailand.
Akerlof, G. A. and Kranton, R. E. (2000). Economics and Identity. The Quarterly
Journal of Economics, 115(3):715–753.
Ali, A. (1998). Santals of Bangladesh. Institute of Social Research & Applied Anthro-
pology, West Bengal.
Andersen, S., Ertac, S., Gneezy, U., List, J. A., and Maximiano, S. (2013). Gender,
Competitiveness, and Socialization at a Young Age: Evidence from a Matrilineal and
a Patriarchal Society. The Review of Economics and Statistics, 95(4):1438–1443.
Bal, E. (2007). ‘They Ask If We Eat Frogs’: Garo Ethnicity in Bangladesh. Institute of
Southeast Asian Studies, Singapore.
Bandiera, O., Barankay, I., and Rasul, I. (2005). Social Preferences and the Response
to Incentives: Evidence from Personnel Data. The Quarterly Journal of Economics,
120(3):917–962.
Barndt, J. R. (2007). Understanding and Dismantling Racism. Fortress Press.
28

Benjamin, D. J., Choi, J. J., and Strickland, A. J. (2010). Social Identity and Preferences.
American Economic Review, 100(4):1913–28.
Berge, L. I. O., Bjorvatn, K., Pires, A. J. G., and Tungodden, B. (2015). Competitive
in the Lab, Successful in the Field? Journal of Economic Behavior & Organization,
118:303–317.
Bhengra, R., Bijoy, C. R., and Luithui, S. (1999). The Adivasis of India. Minority Rights
Group International.
Booth, A. and Nolen, P. (2012). Choosing to Compete: How Different are Girls and
Boys? Journal of Economic Behavior & Organization, 81(2):542–555.
Booth, A. L., Fan, E., Meng, X., and Zhang, D. (2016). Gender Differences in Willingness
to Compete: The Role of Culture and Institutions. IZA Discussion Paper.
Buser, T., Niederle, M., and Oosterbeek, H. (2014). Gender, Competitiveness and Career
Choices. The Quarterly Journal of Economics, 129(3):1409–1447.
Cardenas, J. C., Dreber, A., Von Essen, E., and Ranehill, E. (2012). Gender Differences
in Competitiveness and Risk Taking: Comparing Children in Colombia and Sweden.
Journal of Economic Behavior & Organization, 83(1):11–23.
Cavallaro, F. and Rahman, T. (2009). The Santals of Bangladesh. The Linguistics
Journal, 4(2):192–220.
Chen, Y. and Li, S. X. (2009). Group Identity and Social Preferences. American Eco-
nomic Review, 99(1):431–457.
Croson, R. and Gneezy, U. (2009). Gender Differences in Preferences. The Journal of
Economic Literature, 47(2):448–474.
Datta Gupta, N., Poulsen, A., and Villeval, M. C. (2013). Gender Matching and Com-
petitiveness: Experimental Evidence. Economic Inquiry, 51(1):816–835.
D’Costa, B. (2014). Marginalization and Impunity: Violence Against Women and Girls
in the Chittagong Hill Tracts. International Work Group for Indigenous Affairs.
Fantini, A. E. (2010). A Central Concern: Developing Intercultural Competence. In Fan-
tini, A. E., editor, SIT Occasional Papers Series: Addressing Intercultural Education,
Training & Service. SIT, Brattleboro, Vermont.
29
Fershtman, C. and Gneezy, U. (2001). Discrimination in a Segmented Society: An
Experimental Approach. The Quarterly Journal of Economics, 116(1):351–377.
Flory, J. A., Leibbrandt, A., and List, J. A. (2014). Do Competitive Workplaces Deter
Female Workers? A Large-Scale Natural Field Experiment on Job-Entry Decisions.
The Review of Economic Studies, 82(1):122–155.
Geraldes, D. (2016). Women Dislike Competing Against Men. Working Paper.
Gneezy, U. and Imas, A. (2016). Lab in the Field: Measuring Preferences in the Wild.
In Banerjee, A. and Duflo, E., editors, Handbook of Field Experiments. Elsevier.
Gneezy, U., Leonard, K. L., and List, J. A. (2009). Gender Differences in Competition:
Evidence from a Matrilineal and a Patriarchal Society. Econometrica, 77(5):1637–
1664.
Gneezy, U., Niederle, M., and Rustichini, A. (2003). Performance in Competitive En-
vironments: Gender Differences. The Quarterly Journal of Economics, 118(3):1049–
1074.
Gneezy, U. and Potters, J. (1997). An Experiment on Risk Taking and Evaluation
Periods. The Quarterly Journal of Economics, 122(2):631–645.
Greenwald, A. G. and Banaji, M. R. (1995). Implicit Social Cognition: Attitudes, Self-
Esteem and Stereotypes. Psychological Review, 102(1):4.
Hardiman, D. (1987). The Coming of the Devi: Adivasi Assertion in Western India.
Oxford University Press.
Hoff, K. and Pandey, P. (2006). Discrimination, Social Identity, and Durable Inequalities.
American Economic Review, 96(2):206–211.
Hoff, K. and Pandey, P. (2014). Making Up People – The Effect of Identity on Perfor-
mance in a Modernizing Society. Journal of Development Economics, 106:118–131.
IMF (2013). Bangladesh: Poverty Reduction Strategy Paper 2013. IMF Country Report
No. 13/63.
Kijima, Y. (2006). Caste and Tribe Inequality: Evidence from India, 1983–1999. Eco-
nomic Development and Cultural Change, 54(2):369–404.
30

Leibbrandt, A., Gneezy, U., and List, J. A. (2013). Rise and Fall of Competitiveness
in Individualistic and Collectivistic Societies. Proceedings of the National Academy of
Sciences, 110(23):9305–9308.
Minimum Wage Board Bangladesh (2015). http://mwb.gov.bd/. Online; Accessed May
24, 2016.
Niederle, M. and Vesterlund, L. (2007). Do Women Shy Away from Competition? Do
Men Compete Too Much? The Quarterly Journal of Economics, 122(3):1067–1101.
Niederle, M. and Vesterlund, L. (2011). Gender and Competition. Annual Review of
Economics, 3(1):601–630.
Orans, M. (1965). The Santal: A Tribe in Search of a Great Tradition. Wayne State
University Press, Detriot, Michigan.
People’s Republic of Bangladesh (2016). http://www.bangladesh.gov.bd/. Online;
Accessed January 31, 2017.
Population Monograph of Bangladesh (2015). Population Density and Vulnerability: A
Challenge for Sustainable Development of Bangladesh. Ministry of Planning.
Rao, V. (2001). Celebrations as Social Investments: Festival Expenditures, Unit Price
Variation and Social Status in Rural India. Journal of Development Studies, 38(1):71–
97.
Reuben, E., Sapienza, P., and Zingales, L. (2015). Taste for Competition and the Gender
Gap Among Young Business Professionals. Working Paper.
Reuben, E., Wiswall, M., and Zafar, B. (2017). Preferences and Biases in Educational
Choices and Labour Market Expectations: Shrinking the Black Box of Gender. The
Economic Journal.
Risley, H. H. (1891). The Castes and Tribes of Bengal: Volume II. Harvard Library:
Bengal Secretariat Press.
Roy, R. D. (2012). Country Technical Notes on Indigenous Peoples’ Issues: People’s
Republic of Bangladesh. IFAD Country Report.
Samad, M. (2006). The Santals in Bangladesh: Problems, Needs and Development
Potentials. Journal of Ethnic Affairs, 2:9–13.
31

Sarker, P. and Davey, G. (2009). Exclusion of Indigenous Children from Primary Ed-
ucation in the Rajshahi Division of Northwestern Bangladesh. International Journal
of Inclusive Education, 13(1):1–11.
Section 97 (1950). State Acquisition and Tenancy Act - East Bengal Act no. XXVIII of
1950. http://bdlaws.minlaw.gov.bd/pdf_part.php?id=241/.
Shah, A. (2007). The Dark Side of Indigeneity?: Indigenous People, Rights and Devel-
opment in India. History Compass, 5(6):1806–1832.
Shih, M., Pittinsky, T. L., and Ambady, N. (1999). Stereotype Susceptibility: Identity
Salience and Shifts in Quantitative Performance. Psychological Science, 10(1):80–83.
Steele, C. M. and Aronson, J. (1995). Stereotype Threat and the Intellectual Test
Performance of African Americans. Journal of Personality and Social Psychology,
69(5):797–811.
Sutter, M., Glatzle-Rutzler, D., Balafoutas, L., and Czermak, S. (2016). Cancelling Out
Early Age Gender Differences in Competition: An Analysis of Policy Interventions.
Experimental Economics, 19(2):412–432.
Tajfel, H. (2010). Social Identity and Intergroup Relations. Cambridge University Press.
Upadhyay, V. S. and Pandey, G. (1993). History of Anthropological Thought. Concept
Publishing Company, New Delhi.
Zhang, Y. J. (2013). Can Experimental Economics Explain Competitive Behavior Out-
side the Lab? Working Paper.
Zhang, Y. J. (2015). Culture, Institutions, and the Gender Gap in Competitive Inclina-
tion: Evidence from the Communist Experiment in China. Working Paper.
32
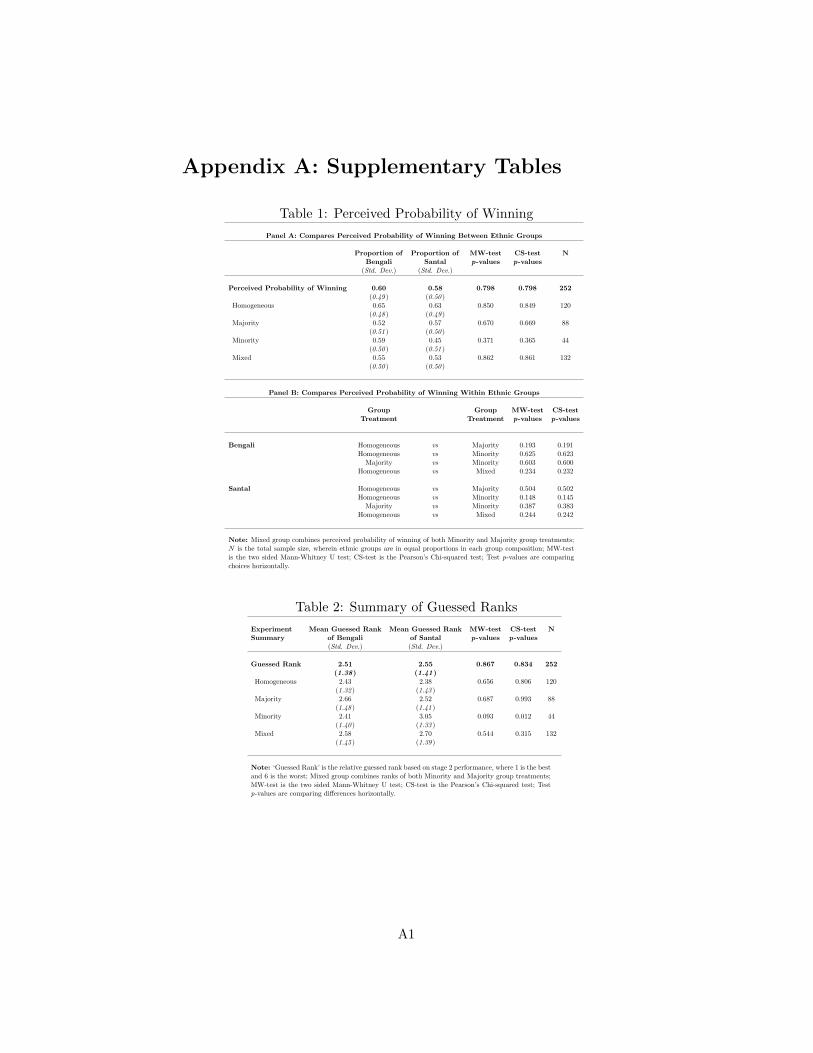
Appendix A: Supplementary Tables
Table 1: Perceived Probability of Winning
Panel A: Compares Perceived Probability of Winning Between Ethnic Groups
Proportion of Proportion of MW-test CS-test NBengali Santal p-values p-values
(Std. Dev.) (Std. Dev.)
Perceived Probability of Winning 0.60 0.58 0.798 0.798 252(0.49 ) (0.50 )
Homogeneous 0.65 0.63 0.850 0.849 120(0.48 ) (0.49 )
Majority 0.52 0.57 0.670 0.669 88(0.51 ) (0.50 )
Minority 0.59 0.45 0.371 0.365 44(0.50 ) (0.51 )
Mixed 0.55 0.53 0.862 0.861 132(0.50 ) (0.50 )
Panel B: Compares Perceived Probability of Winning Within Ethnic Groups
Group Group MW-test CS-testTreatment Treatment p-values p-values
Bengali Homogeneous vs Majority 0.193 0.191Homogeneous vs Minority 0.625 0.623
Majority vs Minority 0.603 0.600Homogeneous vs Mixed 0.234 0.232
Santal Homogeneous vs Majority 0.504 0.502Homogeneous vs Minority 0.148 0.145
Majority vs Minority 0.387 0.383Homogeneous vs Mixed 0.244 0.242
Note: Mixed group combines perceived probability of winning of both Minority and Majority group treatments;N is the total sample size, wherein ethnic groups are in equal proportions in each group composition; MW-testis the two sided Mann-Whitney U test; CS-test is the Pearson’s Chi-squared test; Test p-values are comparingchoices horizontally.
Table 2: Summary of Guessed Ranks
Experiment Mean Guessed Rank Mean Guessed Rank MW-test CS-test NSummary of Bengali of Santal p-values p-values
(Std. Dev.) (Std. Dev.)
Guessed Rank 2.51 2.55 0.867 0.834 252(1.38) (1.41)
Homogeneous 2.43 2.38 0.656 0.806 120(1.32 ) (1.43 )
Majority 2.66 2.52 0.687 0.993 88(1.48 ) (1.41 )
Minority 2.41 3.05 0.093 0.012 44(1.40 ) (1.33 )
Mixed 2.58 2.70 0.544 0.315 132(1.45 ) (1.39 )
Note: ‘Guessed Rank’ is the relative guessed rank based on stage 2 performance, where 1 is the bestand 6 is the worst; Mixed group combines ranks of both Minority and Majority group treatments;MW-test is the two sided Mann-Whitney U test; CS-test is the Pearson’s Chi-squared test; Testp-values are comparing differences horizontally.
A1
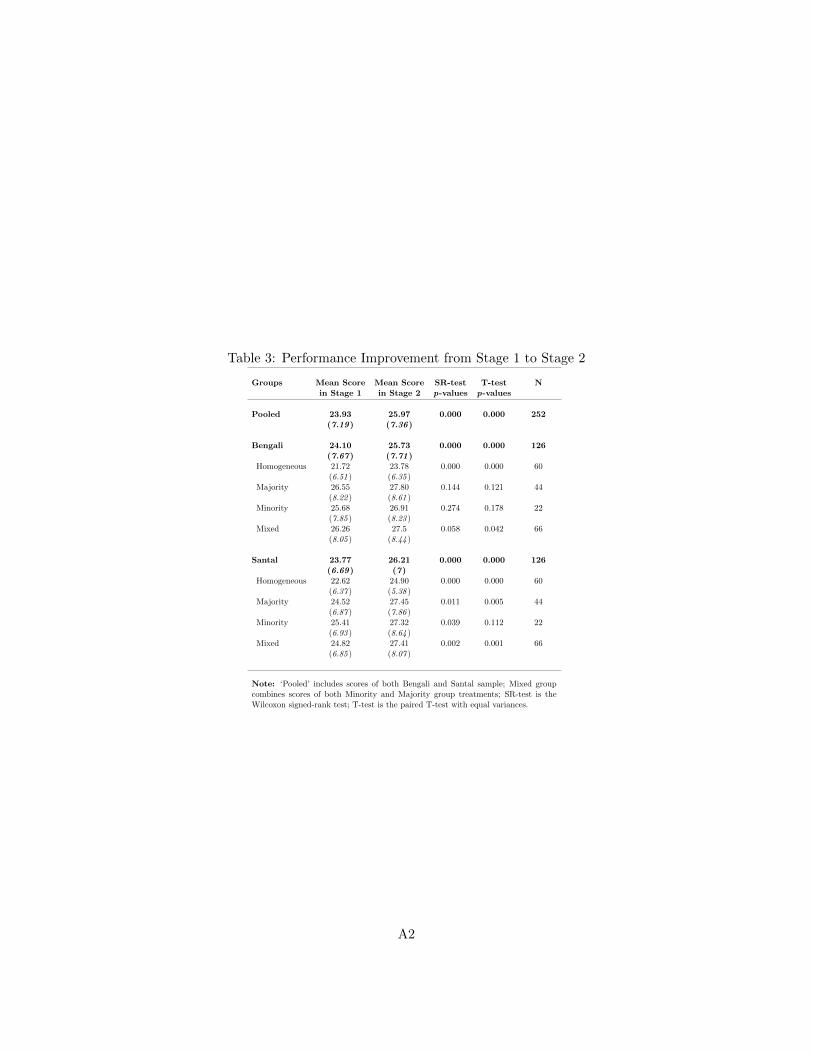
Table 3: Performance Improvement from Stage 1 to Stage 2
Groups Mean Score Mean Score SR-test T-test Nin Stage 1 in Stage 2 p-values p-values
Pooled 23.93 25.97 0.000 0.000 252(7.19) (7.36)
Bengali 24.10 25.73 0.000 0.000 126(7.67) (7.71)
Homogeneous 21.72 23.78 0.000 0.000 60(6.51 ) (6.35 )
Majority 26.55 27.80 0.144 0.121 44(8.22 ) (8.61 )
Minority 25.68 26.91 0.274 0.178 22(7.85 ) (8.23 )
Mixed 26.26 27.5 0.058 0.042 66(8.05 ) (8.44 )
Santal 23.77 26.21 0.000 0.000 126(6.69) (7)
Homogeneous 22.62 24.90 0.000 0.000 60(6.37 ) (5.38 )
Majority 24.52 27.45 0.011 0.005 44(6.87 ) (7.86 )
Minority 25.41 27.32 0.039 0.112 22(6.93 ) (8.64 )
Mixed 24.82 27.41 0.002 0.001 66(6.85 ) (8.07 )
Note: ‘Pooled’ includes scores of both Bengali and Santal sample; Mixed groupcombines scores of both Minority and Majority group treatments; SR-test is theWilcoxon signed-rank test; T-test is the paired T-test with equal variances.
A2

Table 4: Participants Who Chose to Compete and Won
Panel A: Compares Entrants Who Won Between Ethnic Groups
Experiment Proportion of N Proportion of NB Proportion of NS MW-test CS-testSummary Bengali & Santal Bengali Santal p-values p-values
(Std. Dev.) (Std. Dev.) (Std. Dev.)
Those Who Won 0.25 93 0.28 46 0.21 47 0.438 0.435(0.43) (0.46) (0.41)
Homogeneous 0.26 43 0.29 17 0.23 26 0.646 0.642(0.44 ) (0.47 ) (0.43 )
Majority 0.26 35 0.33 18 0.18 17 0.296 0.289(0.44 ) (0.49 ) (0.39 )
Minority 0.20 15 0.18 11 0.25 04 0.778 0.770(0.41 ) (0.40 ) (0.50 )
Mixed 0.24 50 0.28 29 0.19 21 0.490 0.485(0.43 ) (0.45 ) (0.40 )
Panel B: Compares Entrants Who Won Within Ethnic Groups
Experiment Group Group MW-test CS-testSummary Treatment Treatment p-values p-values
Bengali Homogeneous vs Majority 0.806 0.803Homogeneous vs Minority 0.510 0.503
Majority vs Minority 0.384 0.376Homogeneous vs Mixed 0.896 0.894
Santal Homogeneous vs Majority 0.672 0.669Homogeneous vs Minority 0.934 0.933
Majority vs Minority 0.742 0.736Homogeneous vs Mixed 0.740 0.737
Note: ‘Those Who Won’ is the fraction of people who chose to compete and won; hence, it is the win rate of entrants; Panel Acompares winners between ethnic groups; Panel B compares winners within ethnic groups; N is the total sample of those who choseto compete; NB is the sample of Bengali who chose to enter competition; NS is the sample of Santal who chose to enter competition;MW-test is the two sided Mann-Whitney U test; CS-test is the Pearson’s Chi-squared test.
A3
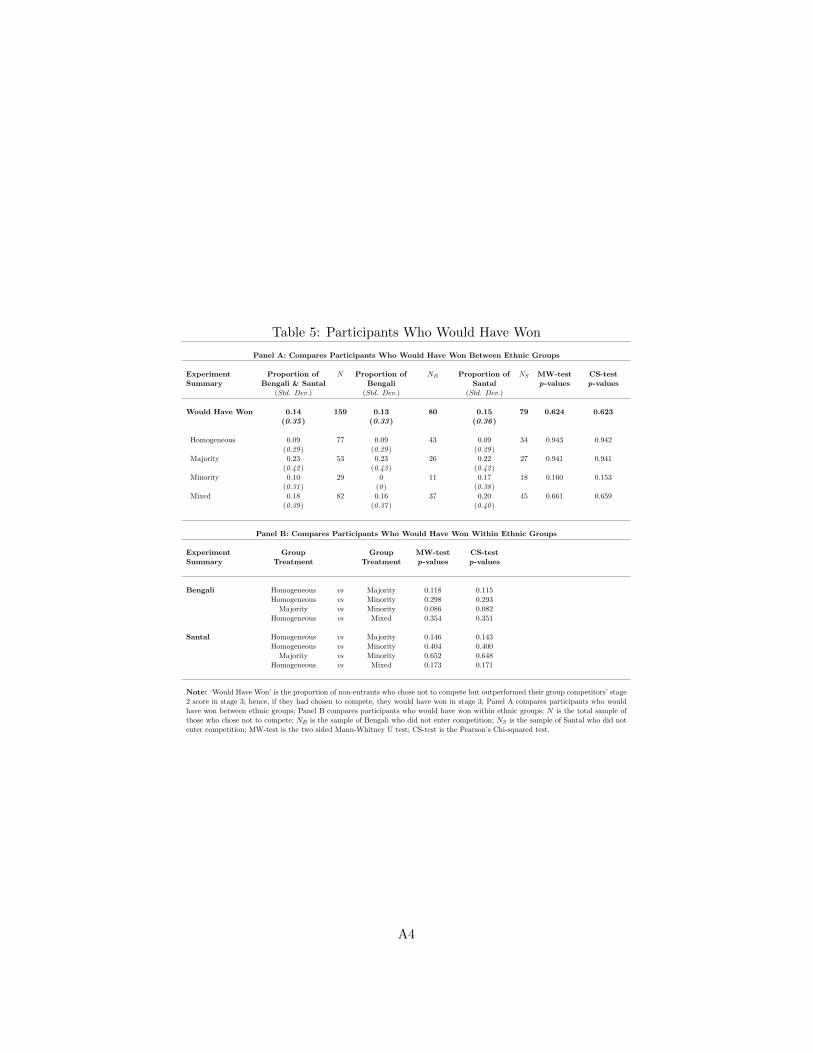
Table 5: Participants Who Would Have Won
Panel A: Compares Participants Who Would Have Won Between Ethnic Groups
Experiment Proportion of N Proportion of NB Proportion of NS MW-test CS-testSummary Bengali & Santal Bengali Santal p-values p-values
(Std. Dev.) (Std. Dev.) (Std. Dev.)
Would Have Won 0.14 159 0.13 80 0.15 79 0.624 0.623(0.35) (0.33) (0.36)
Homogeneous 0.09 77 0.09 43 0.09 34 0.943 0.942(0.29 ) (0.29 ) (0.29 )
Majority 0.23 53 0.23 26 0.22 27 0.941 0.941(0.42 ) (0.43 ) (0.42 )
Minority 0.10 29 0 11 0.17 18 0.160 0.153(0.31 ) (0 ) (0.38 )
Mixed 0.18 82 0.16 37 0.20 45 0.661 0.659(0.39 ) (0.37 ) (0.40 )
Panel B: Compares Participants Who Would Have Won Within Ethnic Groups
Experiment Group Group MW-test CS-testSummary Treatment Treatment p-values p-values
Bengali Homogeneous vs Majority 0.118 0.115Homogeneous vs Minority 0.298 0.293
Majority vs Minority 0.086 0.082Homogeneous vs Mixed 0.354 0.351
Santal Homogeneous vs Majority 0.146 0.143Homogeneous vs Minority 0.404 0.400
Majority vs Minority 0.652 0.648Homogeneous vs Mixed 0.173 0.171
Note: ‘Would Have Won’ is the proportion of non-entrants who chose not to compete but outperformed their group competitors’ stage2 score in stage 3; hence, if they had chosen to compete, they would have won in stage 3; Panel A compares participants who wouldhave won between ethnic groups; Panel B compares participants who would have won within ethnic groups; N is the total sample ofthose who chose not to compete; NB is the sample of Bengali who did not enter competition; NS is the sample of Santal who did notenter competition; MW-test is the two sided Mann-Whitney U test; CS-test is the Pearson’s Chi-squared test.
A4
Appendix B: Experimental Instructions
General Instructions
Welcome to this study of decision making. The experiment will take
about 60 minutes during which you will be asked to play some basic games.
There will be three stages with three different instructions. But all in-
structions are very simple, and if you follow them carefully, you can earn a
considerable amount of money. Out of these three stages, you will only be
paid according to one stage, which will be determined at the end using a
lottery. For showing up today you will receive 100 Takas. All the money you
earn will be paid to you, privately and in cash, at the end after you complete
a short exit survey. You will also be told how well you have scored in the
payoff stage at the end, in private. This experiment will only be considered
complete when you complete the exit survey. If you fail to complete the exit
survey, then you will only receive the show-up fee.
The game is to separate lentils from a mix of rice and lentils, and then
gather those separated lentils into an empty bowl. Each lentil separated will
earn you money but each rice grain picked will lose you money. In short,
lentils will win you money but rice will lose you money. So, you have to be
careful not to separate rice along with lentils. There will be three stages and
each stage will last for 60 seconds or 1 minute. Instructions for each stage
are different and will be read aloud before each stage.
If you do not agree to take part in this experiment, then please raise
your hand now. If you do not raise your hand, then we will assume you
do not have any questions regarding the nature of this study and we will
proceed to collect consents. If you do not want to participate, then you will
only receive the show-up fee. Only people who participate will receive any
money they earn during the experiment along with the show up fee.
Now, to better understand our instructions, we will readout some fre-
quently asked questions and their answers to you. Please listen carefully.
• What do you need to separate from the mix, lentils or rice? [Answer:
Lentils]
B1

• What will earn you money, lentils or rice? [Answer: Lentils]
• What will lose you money, lentils or rice? [Answer: Rice]
• How many stages does this experiment have? [Answer: Three]
• For how many stages will you be paid at the end? [Answer: One]
• How will the payment-stage be determined at the end of the experi-
ment? [Answer: By a lottery ]
• What do you have to do if you have a question or want to withdraw?
[Answer: Raise hand ]
• Will you receive money if you decide to leave? [Answer: No]
Instruction: Stage 1
In this stage, you will have to separate lentils from a mix of rice and
lentils which is in the bowl right in front of you. You have to pick lentils
and put it into the empty bowl. For each lentil separated, you will earn 5
Takas but, if you also separate rice and put it into the empty bowl, where
you are supposed to keep lentils only, then you will lose 5 Takas for each
grain of rice. In short, each lentil will earn you 5 Takas and each rice will
lose you 5 Takas.
So, if you separate 2 lentils, you will get 10 Takas. If you separate
5 lentils, you will get 25 Takas. If you separate 10 lentils, you will get 50
Takas. But if you separate 10 lentils along with 1 grain of rice, you will get
45 Takas, because you lose 5 Takas for separating 1 grain of rice. If you
separate 10 lentils along with 10 grains of rice, you will get 0 Takas or no
money, because you lose 50 Takas for separating 10 grains of rice. If you
separate 10 lentils along with 11 rice, you still get no money, because you
cannot earn less than zero. Therefore, the more lentils you pick, the more
money you will earn.
You have 60 seconds to complete this task. We will tell you when to
start and when to stop performing the task. Please stop immediately when
we ask you to stop. If you do not stop, then you will not earn anything from
this stage.
Now, to better understand our instructions, we will readout some fre-
B2
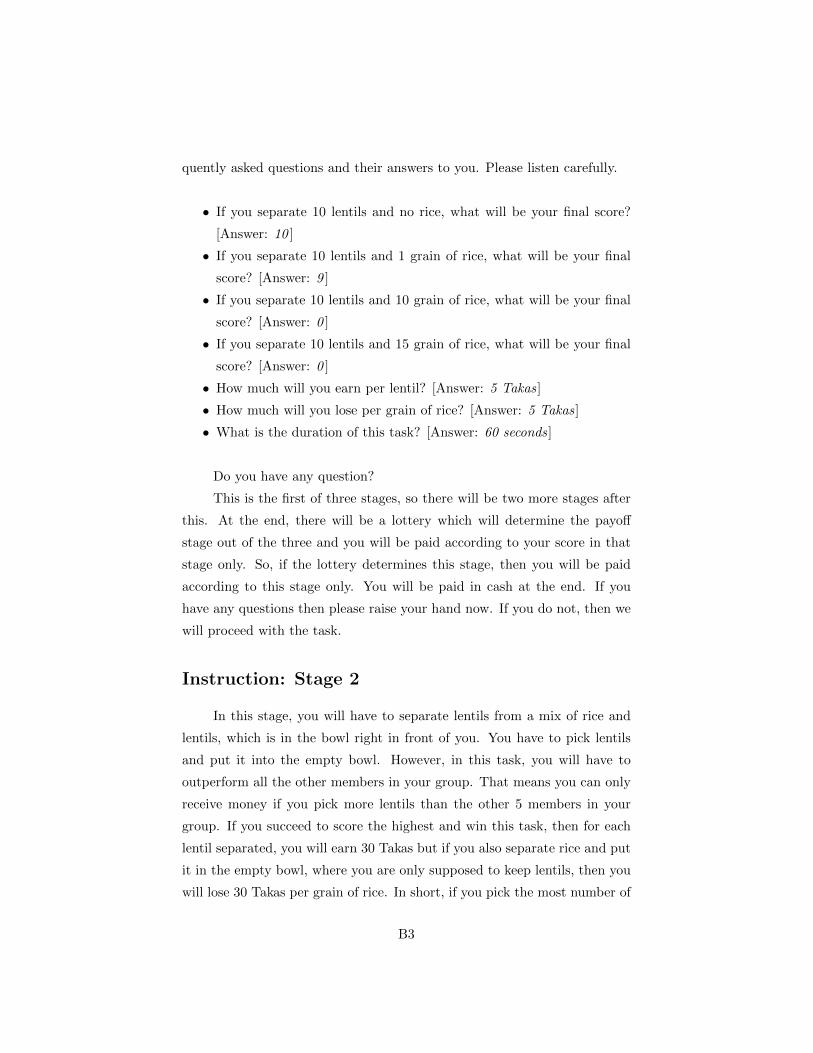
quently asked questions and their answers to you. Please listen carefully.
• If you separate 10 lentils and no rice, what will be your final score?
[Answer: 10 ]
• If you separate 10 lentils and 1 grain of rice, what will be your final
score? [Answer: 9 ]
• If you separate 10 lentils and 10 grain of rice, what will be your final
score? [Answer: 0 ]
• If you separate 10 lentils and 15 grain of rice, what will be your final
score? [Answer: 0 ]
• How much will you earn per lentil? [Answer: 5 Takas]
• How much will you lose per grain of rice? [Answer: 5 Takas]
• What is the duration of this task? [Answer: 60 seconds]
Do you have any question?
This is the first of three stages, so there will be two more stages after
this. At the end, there will be a lottery which will determine the payoff
stage out of the three and you will be paid according to your score in that
stage only. So, if the lottery determines this stage, then you will be paid
according to this stage only. You will be paid in cash at the end. If you
have any questions then please raise your hand now. If you do not, then we
will proceed with the task.
Instruction: Stage 2
In this stage, you will have to separate lentils from a mix of rice and
lentils, which is in the bowl right in front of you. You have to pick lentils
and put it into the empty bowl. However, in this task, you will have to
outperform all the other members in your group. That means you can only
receive money if you pick more lentils than the other 5 members in your
group. If you succeed to score the highest and win this task, then for each
lentil separated, you will earn 30 Takas but if you also separate rice and put
it in the empty bowl, where you are only supposed to keep lentils, then you
will lose 30 Takas per grain of rice. In short, if you pick the most number of
B3

lentils, then each lentil will earn you 30 Takas. But if you cannot outperform
your group members, then you will earn no money from this task. In case
of a tie, the winning amount will be divided equally.
So, if you score the highest by picking 10 lentils, with all the other 5
members picking less than 10 lentils, then you will get 300 Takas and others
will get no money. If you pick 10 lentils and 1 grain of rice and another
member of your group picks 10 lentils but no rice, then it will mean that the
other member has picked more lentils than you did, which means you lost
the task and you will earn no money. That member, on the other hand, will
win the task and will get 300 Takas with other members earning no money.
If you score 11 lentils with 1 grain of rice and another member scores 10
lentils with no rice, then your score will be tied with that member and the
winning amount will be divided equally. In this case, each tied winner will
earn 150 Takas, with others earning no money at all.
Only the winner(s) will earn money, while the losers will get no money
from this task. Therefore, the more lentils you pick compared to your group
members, the higher your chances will be to win the task and earn 30 Takas
per lentil.
You have 60 seconds to complete this task. We will tell you when to
start and when to stop performing the task. Please stop immediately when
we ask you to stop. If you do not stop, then you will not earn anything from
this stage.
Now, to better understand our instructions, we will readout some fre-
quently asked questions and their answers to you. Please listen carefully.
• Will you win the task if you pick the maximum number of lentils in
your group? [Answer: Yes]
• Will you win the task if your group members pick more lentils than
you? [Answer: No]
• What do you have to do to win this task and to win money? [Answer:
Pick the highest number of lentils]
• If you separate 10 lentils and another group member separates 11
lentils, then who will win this task, you or your group member? [An-
swer: Group member ]
B4
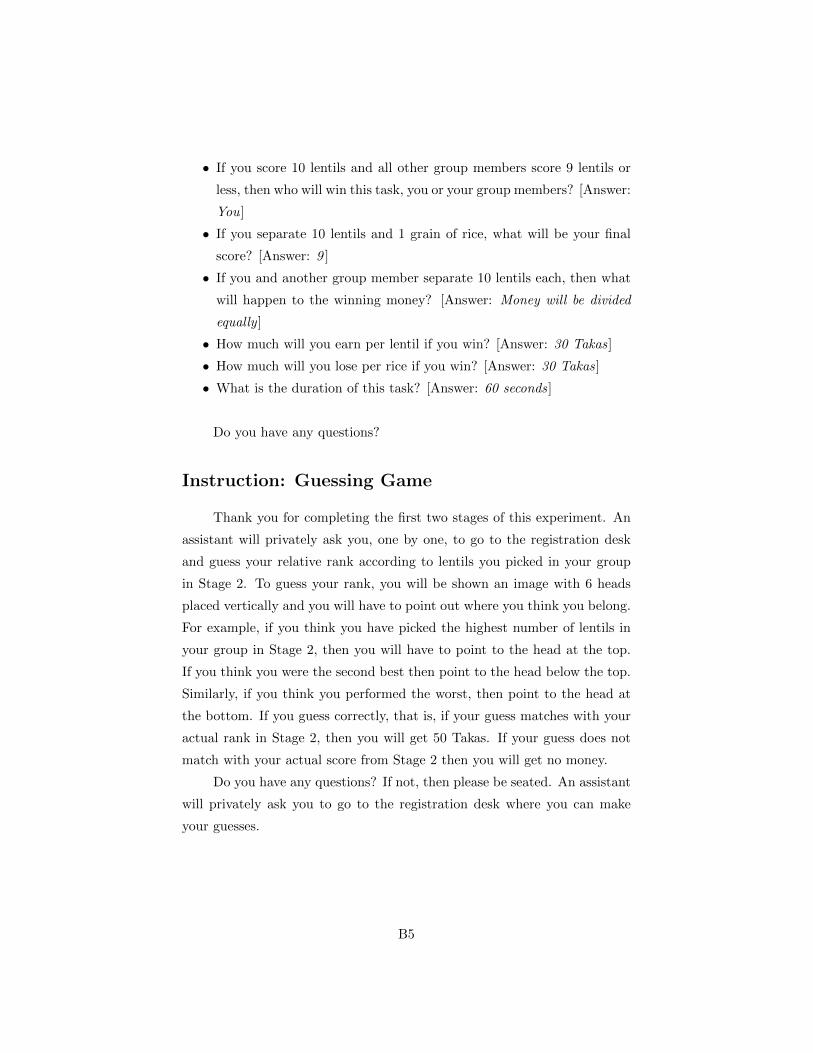
• If you score 10 lentils and all other group members score 9 lentils or
less, then who will win this task, you or your group members? [Answer:
You]
• If you separate 10 lentils and 1 grain of rice, what will be your final
score? [Answer: 9 ]
• If you and another group member separate 10 lentils each, then what
will happen to the winning money? [Answer: Money will be divided
equally ]
• How much will you earn per lentil if you win? [Answer: 30 Takas]
• How much will you lose per rice if you win? [Answer: 30 Takas]
• What is the duration of this task? [Answer: 60 seconds]
Do you have any questions?
Instruction: Guessing Game
Thank you for completing the first two stages of this experiment. An
assistant will privately ask you, one by one, to go to the registration desk
and guess your relative rank according to lentils you picked in your group
in Stage 2. To guess your rank, you will be shown an image with 6 heads
placed vertically and you will have to point out where you think you belong.
For example, if you think you have picked the highest number of lentils in
your group in Stage 2, then you will have to point to the head at the top.
If you think you were the second best then point to the head below the top.
Similarly, if you think you performed the worst, then point to the head at
the bottom. If you guess correctly, that is, if your guess matches with your
actual rank in Stage 2, then you will get 50 Takas. If your guess does not
match with your actual score from Stage 2 then you will get no money.
Do you have any questions? If not, then please be seated. An assistant
will privately ask you to go to the registration desk where you can make
your guesses.
B5

Instruction: Stage 3
In this stage, you will have to separate lentils from a mix of rice and
lentils, which is in the bowl right in front of you. You have to pick lentils
B6
and put it into the empty bowl. However, before performing the task, we
will now ask you to choose one of the two options according to which you
wish to be paid in this stage. The two options are:
Option 1:
If you choose this option, you will get 5 Takas for each lentil you pick
and lose 5 Takas for each rice grain you pick. So, this is exactly like the first
task you completed. If you pick 2 lentils, then you will get 10 Takas. If you
pick 10 lentils, then you will get 50 Takas. But if you pick 10 lentils along
with 1 grain of rice, then you will get 45 Takas, because you lose 5 Takas
for picking 1 grain of rice. Therefore, the more lentils you pick, the more
money you will earn.
Option 2:
If you choose this option, you will only earn money if your score is
higher than your group members’ scores from Stage 2. If you succeed to
surpass your group members’ lentil count from Stage 2, then you will get 30
Takas for each lentil you pick but also you will lose 30 Takas for every rice
you pick. If you do not manage to score higher than your group members’
scores from Stage 2, then you will earn no money in this task. So, this is
very much like the second task you completed, but now you will try to pick
more lentils than what your group members picked in the second stage.
So, if you pick 10 lentils, which is also higher than all other 5 members’
scores from Stage 2, then you will win this task and you will get 300 Takas.
If you pick 10 lentils, which is not higher than all 5 group members’ scores
from Stage 2, then you will lose this task and you will not get any money.
Therefore, the more lentils you pick compared to your group members’ score
in Stage 2, the higher your chances will be to win the task and earn 30 Takas
per lentil.
You have 60 seconds to complete this task. We will tell you when to
start and when to stop performing the task. Please stop immediately when
we ask you to stop. If you do not stop, you will not earn anything from this
stage.
B7
Now, to better understand our instructions, we will readout some fre-
quently asked questions and their answers to you. Please listen carefully.
• In which option do you earn 5 Takas per lentil? [Answer: Option 1 ]
• In which option do you need to score higher than your group members’
score from Stage 2 in order to win money? [Answer: Option 2 ]
• In which option do you earn 30 Takas per lentil if you score higher
than your group members’ scores from Stage 2? [Answer: Option 2 ]
• If you choose Option 1, then how much will you earn per lentil? [An-
swer: 5 Takas]
• If you choose Option 2, and pick more lentils than your group members’
scores from Stage 2, then how much will you earn per lentil? [Answer:
30 Takas]
• If you choose Option 2, and pick less lentils than your group members’
scores from Stage 2, then will you win any money? [Answer: No]
• What is the duration of this task? [Answer: 60 seconds]
This is the final stage of this experiment. After this task, there will
be a lottery which will determine the payoff stage and you will be paid
according to your score in that stage only. You will be told how well you
have performed in that stage and will be paid in cash at the end. If you have
any questions, please raise your hand. If you do not, then we will proceed
with the task.
Do you have any questions? If not, then an experimenter will ask you
privately to go to the registration desk and make your choice on how you
want to be paid: according to Option 1 or Option 2?
Instruction: Risk Game
Welcome to this study of decision-making. This is a bonus game which
will take about 15 minutes. The instructions are simple, and if you follow
them carefully, you can earn a considerable amount of money. All the money
you earn is yours to keep and will be paid to you, in cash, immediately after
the experiment ends.
B8

At the beginning of this experiment, you will receive 20 Takas. You
are asked to choose the portion of this amount (between 0 and 20) that you
wish to invest in a risky option. The rest of the money will be accumulated
in your total balance.
The risky investment: there is an equal chance that the investment will
fail or succeed. If the investment fails, you lose the amount you invested. If
the investment succeeds, you receive 6 times the amount invested.
How do we determine if you win? After you have chosen how much
you wish to invest, we will toss a coin to determine whether you win or lose.
If the coin comes up heads, you win 6 times the amount you chose to invest.
If the coin comes up tails, you lose the amount invested.
Examples
• If you choose to invest nothing, you will get the 20 Takas for sure.
That is, the coin flip would not affect your profits.
• If you choose to invest all of the 20 Takas, then if the coin comes up
heads, you win 120 Takas, and if the coin comes up tails, you win
nothing and end up with 0.
• If you choose to invest 10 Takas, then if the coin comes up heads, you
win 70 Takas, and if the coin lands on tails, you end up with 10 Takas.
Do you have any questions? If not, then an experimenter will ask you
privately to go to the registration desk and make your choice on how much
you want to bet in the lottery.
B9