Embed Size (px)
Citation preview
Discussion PaPer series
IZA DP No. 10639
Laura B. NolanDavid E. BloomRamnath Subbaraman
Legal Status and Deprivation in India’s Urban Slums: An Analysis of Two Decades of National Sample Survey Data
mArch 2017
Any opinions expressed in this paper are those of the author(s) and not those of IZA. Research published in this series may include views on policy, but IZA takes no institutional policy positions. The IZA research network is committed to the IZA Guiding Principles of Research Integrity.The IZA Institute of Labor Economics is an independent economic research institute that conducts research in labor economics and offers evidence-based policy advice on labor market issues. Supported by the Deutsche Post Foundation, IZA runs the world’s largest network of economists, whose research aims to provide answers to the global labor market challenges of our time. Our key objective is to build bridges between academic research, policymakers and society.IZA Discussion Papers often represent preliminary work and are circulated to encourage discussion. Citation of such a paper should account for its provisional character. A revised version may be available directly from the author.
Schaumburg-Lippe-Straße 5–953113 Bonn, Germany
Phone: +49-228-3894-0Email: [email protected] www.iza.org
IZA – Institute of Labor Economics
Discussion PaPer series
IZA DP No. 10639
Legal Status and Deprivation in India’s Urban Slums: An Analysis of Two Decades of National Sample Survey Data
mArch 2017
Laura B. NolanMathematica Policy Research
David E. BloomHarvard T.H. Chan School of Public Health and IZA
Ramnath SubbaramanPUKAR, Brigham and Women’s Hospital, and Harvard Medical School

AbstrAct
IZA DP No. 10639 mArch 2017
Legal Status and Deprivation in India’s Urban Slums: An Analysis of Two Decades of National Sample Survey Data*
In India, 52–98 million people live in urban slums, and 59% of slums are “non-notified”
or lack legal recognition by the government. In this paper, we use data on 2,901 slums
from four waves of the National Sample Survey (NSS) spanning almost 20 years to test the
hypothesis that non-notified status is associated with greater deprivation in access to basic
services, thereby increasing vulnerability to poor health outcomes. To quantify deprivation
for each slum, we construct a basic services deprivation score (BSDS), which includes
variables that affect health, such as access to piped water, latrines, solid waste disposal,
schools, and health centers. In a regression analysis, we find a robust association between
non-notified status and greater deprivation after controlling for other variables. Our analysis
reveals a progressive reduction in deprivation the longer a slum has been notified. In
addition, data from the 2012 NSS show that, despite suffering from greater deprivation,
non-notified slums were much less likely to receive financial aid from government slum
improvement schemes. Our findings suggest that legally recognizing non-notified slums
and targeting government aid to these settlements may be crucial for improving health
outcomes and diminishing urban disparities.
JEL Classification: I14, I15, I18, I19
Keywords: slums, legal status, notified, deprivation, basic services, health, water, sanitation, India
Corresponding author:David E. BloomHarvard T.H. Chan School of Public Health665 Huntington AvenueBoston, Massachusetts 02115USA
Email: [email protected]
* We are grateful to Sharmila Murthy (Suffolk University Law School), S.V. Subramanian (Harvard T.H. Chan School of Public Health), and German Rodriguez (Princeton University) for feedback on earlier manuscript drafts. Ramnath Subbaraman was supported by a Fogarty Global Health Equity Scholars Fellowship (NIAID R25 TW009338) and a Harvard KL2/CMeRIT award (KL2 TR001100).
4
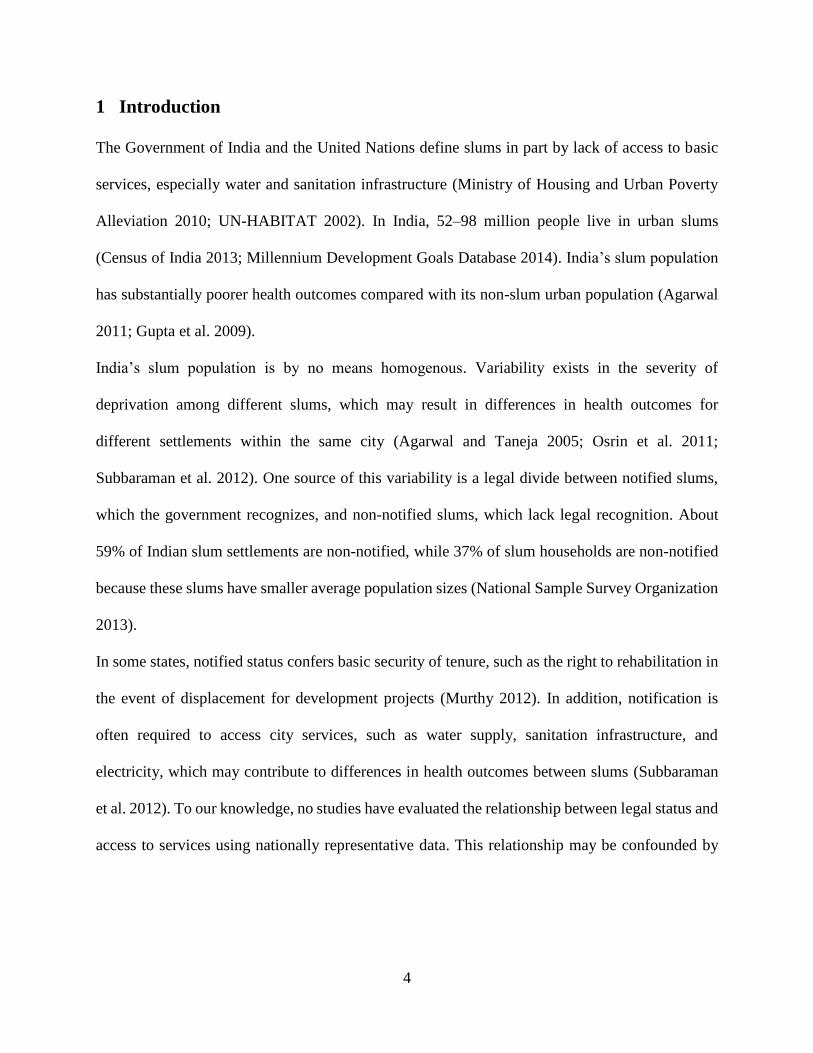
1 Introduction
The Government of India and the United Nations define slums in part by lack of access to basic
services, especially water and sanitation infrastructure (Ministry of Housing and Urban Poverty
Alleviation 2010; UN-HABITAT 2002). In India, 52–98 million people live in urban slums
(Census of India 2013; Millennium Development Goals Database 2014). India’s slum population
has substantially poorer health outcomes compared with its non-slum urban population (Agarwal
2011; Gupta et al. 2009).
India’s slum population is by no means homogenous. Variability exists in the severity of
deprivation among different slums, which may result in differences in health outcomes for
different settlements within the same city (Agarwal and Taneja 2005; Osrin et al. 2011;
Subbaraman et al. 2012). One source of this variability is a legal divide between notified slums,
which the government recognizes, and non-notified slums, which lack legal recognition. About
59% of Indian slum settlements are non-notified, while 37% of slum households are non-notified
because these slums have smaller average population sizes (National Sample Survey Organization
2013).
In some states, notified status confers basic security of tenure, such as the right to rehabilitation in
the event of displacement for development projects (Murthy 2012). In addition, notification is
often required to access city services, such as water supply, sanitation infrastructure, and
electricity, which may contribute to differences in health outcomes between slums (Subbaraman
et al. 2012). To our knowledge, no studies have evaluated the relationship between legal status and
access to services using nationally representative data. This relationship may be confounded by

5
characteristics other than legal status that may cause deprivation, such as state government
policies, the type of land on which a slum is located, or a slum’s population size.
To investigate the contribution of legal status to deprivation in access to services, we analyze data
from India’s National Sample Survey (NSS), which collects information on socioeconomic,
industrial, agricultural, and housing indicators. The NSS collected cross-sectional data on slums
in India in four survey waves spanning nearly 20 years. The NSS is the only national-level survey
that routinely collects information on the legal status of slums, providing a unique opportunity to
evaluate the relationship between legal status and deprivation over time. Other surveys, such as
the Census of India, have been criticized for undercounting non-notified slums (Ministry of
Housing and Urban Poverty Alleviation 2010).
In this paper, we first discuss trends in slum notification and access to basic services over two
decades. Second, we describe deprivation in India’s slums over time by combining indicators for
access to services into a composite basic services deprivation score (BSDS). Third, we identify
risk factors for deprivation using a multilevel regression model to test the hypothesis that legal
status is independently associated with deprivation. Finally, we identify factors associated with
slums receiving government financial aid to understand whether resources for slum improvement
are being targeted to the communities most in need.
2 Methods
(i) Data Sources and Descriptive Statistics
We use the 49th (1993), 58th (2002), 65th (2008—2009), and 69th (2012) NSS rounds, which provide
nationally representative cross-sectional data on 2,901 slums across all survey rounds. One
limitation of these surveys is that they capture information on entire slum settlements (rather than
6
on individuals or households). The surveys therefore describe living conditions for the majority of
residents in each slum and do not provide information on heterogeneity within each settlement.
To ensure we correctly interpreted the datasets, we first successfully replicated descriptive
statistics contained in publicly available reports on these NSS waves, with the exception of select
statistics from the 1993 report (National Sample Survey Organization 1997; 2003; 2010; 2013).
We estimated 40 more slums (a 0.04% difference) and 147,472 more slum households (a 2%
difference) at a national level than were reported in the 1993 report. These minor inconsistencies
may be due to differences between the publicly available NSS data and those used to create the
report or to small rounding errors in the survey weights.
For most descriptive statistics and the regression models, we restricted our analyses to 10 states
with at least 10 observations (i.e., 10 slums) in each survey year, since this minimum number
facilitates better estimates of state-level effects. The states included in the analysis are Andhra
Pradesh, Bihar, Delhi, Gujarat, Karnataka, Madhya Pradesh, Maharashtra, Orissa, Tamil Nadu,
and West Bengal. This restriction results in a sample of 2,411 slums across all survey years. Further
restriction to slums with no missing information for variables in the analyses results in a final
sample of 2,390 slums for the 10 states.
We generated descriptive statistics by using survey weights to estimate the total number of slums
in the 10 states. We then estimated the percent of slums with different types of legal status and that
lack access to key basic services, stratified by survey year, to gain insights into trends over time.
(ii) Basic Services Deprivation Score
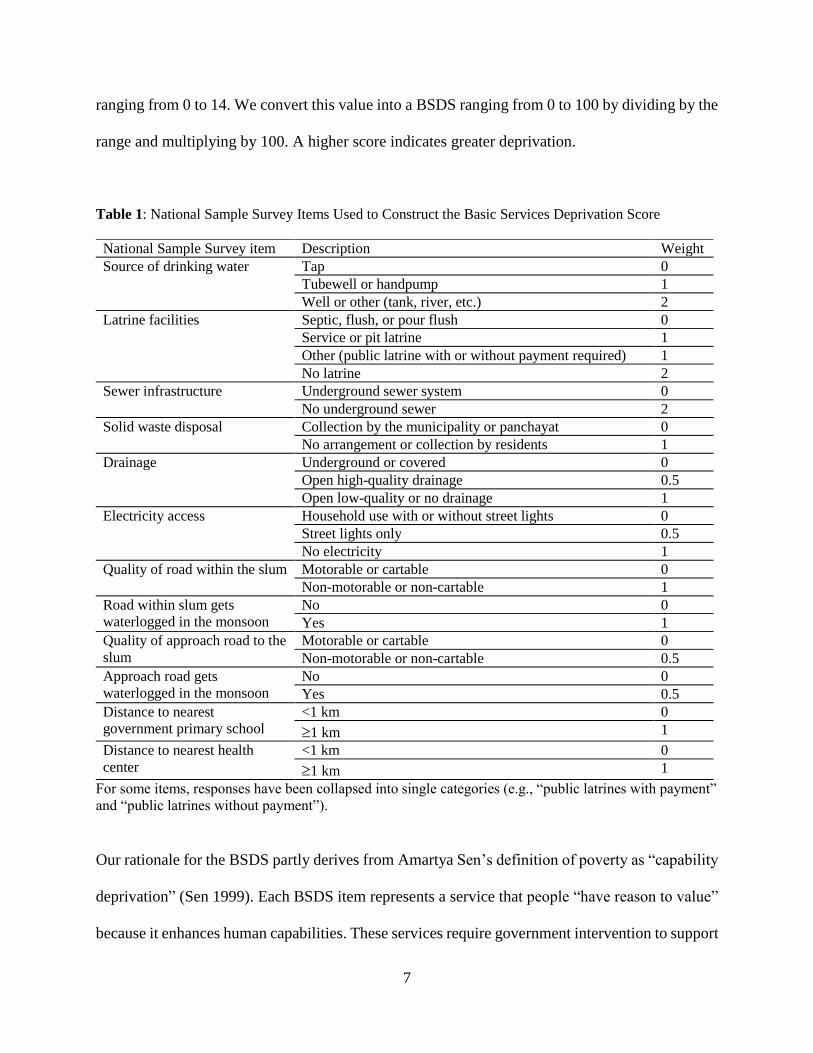
The outcome in regression analysis 1 is a 12-item index of “deprivation” called the Basic Services
Deprivation Score (BSDS). The item weights in Table 1 allow us to calculate a value for each slum
7
ranging from 0 to 14. We convert this value into a BSDS ranging from 0 to 100 by dividing by the
range and multiplying by 100. A higher score indicates greater deprivation.
Table 1: National Sample Survey Items Used to Construct the Basic Services Deprivation Score
National Sample Survey item Description Weight
Source of drinking water Tap 0
Tubewell or handpump 1
Well or other (tank, river, etc.) 2
Latrine facilities Septic, flush, or pour flush 0
Service or pit latrine 1
Other (public latrine with or without payment required) 1
No latrine 2
Sewer infrastructure Underground sewer system 0
No underground sewer 2
Solid waste disposal Collection by the municipality or panchayat 0
No arrangement or collection by residents 1
Drainage Underground or covered 0
Open high-quality drainage 0.5
Open low-quality or no drainage 1
Electricity access Household use with or without street lights 0
Street lights only 0.5
No electricity 1
Quality of road within the slum Motorable or cartable 0
Non-motorable or non-cartable 1
Road within slum gets
waterlogged in the monsoon
No 0
Yes 1
Quality of approach road to the
slum
Motorable or cartable 0
Non-motorable or non-cartable 0.5
Approach road gets
waterlogged in the monsoon
No 0
Yes 0.5
Distance to nearest
government primary school
<1 km 0
1 km 1
Distance to nearest health
center
<1 km 0
1 km 1
For some items, responses have been collapsed into single categories (e.g., “public latrines with payment”
and “public latrines without payment”).
Our rationale for the BSDS partly derives from Amartya Sen’s definition of poverty as “capability
deprivation” (Sen 1999). Each BSDS item represents a service that people “have reason to value”
because it enhances human capabilities. These services require government intervention to support
8
infrastructure or service delivery (in the case of waterlogging, the items serve as surrogate
indicators of the quality of sewer and drainage infrastructure). Absence of any of these services
may result in deprivation by adversely affecting quality of life. For example, a study found that
deprivation faced by households in a Mumbai slum—measured using a “slum adversity index”
that includes many BSDS items—is strongly associated with psychological distress (Subbaraman
et al. 2014).
All BSDS items are also strongly associated with physical health. We weight water and sanitation
items more heavily in the BSDS because these have the strongest relationship with health
outcomes, such as infant mortality and child nutrition levels (Bartram and Cairncross 2010).
Diarrheal illness is strongly associated with water and sanitation access, and diarrhea is one of the
top causes of morbidity and mortality for children under five years of age who live in slums
(Choudhary and Jayaswal 1989; Gladstone et al. 2008). Transitioning from an unimproved water
supply to a high-quality piped supply leads to an average reduction in diarrheal illness of 80%,
while access to sanitation infrastructure leads to an average reduction of 70% (Wolf et al. 2014).
We weight other BSDS items less heavily because their association with health outcomes is not as
robust; however, deprivation with regard to any of the items can cause poor health. Lack of solid
waste collection increases risk of diarrhea, dengue, and leptospirosis (Hagan et al. 2016; Hayes et
al. 2003). Lack of government provision of electricity may lead slum residents to create poorly
wired connections, increasing the risk of electrocution and fires (Subbaraman et al. 2012). Greater
distance of slums from health facilities is associated with lower immunization rates (Ghei et al.
2010). Greater distance from schools can adversely affect mothers’ educational attainment, which
is associated with adverse child health outcomes (Agarwal and Srivastava 2009).
9
We explore whether the results are robust to model specification and BSDS scoring methodology
by constructing the following alternative models, which are presented in the Appendix: (1) a model
in which legal status is represented as a dichotomous variable (i.e., “notified” or “non-notified)
rather than as a continuous variable (i.e., number of years notified); (2) a model in which factor
analysis using a polychoric correlation matrix is used to weight the different variables in the BSDS;
(3) a model in which the BSDS is constructed using scoring weights derived from a regression
model of items correlated with infant mortality identified through a separate analysis of the
National Family Health Survey-3 (NFHS-3) (IIPS and Macro International 2007); and (4) a model
in which the “state” variable is included as a fixed effect (as compared to the multilevel model in
the primary analysis, in which slums are nested within states).
Factor analysis is used to either reduce a large number of variables (into a score, for example), or
detect the structure and relationship between variables in order to classify them. We use factor
analysis to reduce the 12 characteristics of slums described in Table 5 into a BSDS, employing a
polychoric correlation matrix procedure because all variables are dichotomous. We transform the
resulting index into a final BSDS ranging between 0 and 100 by subtracting each value by the
minimum, dividing by the range, and multiplying by 100.
To use scoring weights derived from the NFHS-3, we first identified all variables in the NFHS-3
births that are equivalent to an NSS survey item in Table 1. These variables were source of drinking
water, type of toilet facility, and sewer access. We recoded these NFHS-3 variables to be as
consistent with the response options for the matching NSS variables as possible. To obtain the
weights for each response item for each of the variables, we estimate a regression model of infant
mortality on each item, restricting the sample to only include children in slums in the NFHS-3
dataset. The regression model standard errors are clustered at the household level because there
10
can be more than one child under 5 years of age in a household. The coefficients from this
regression serve as the BSDS weights, which we applied to and summed across the matching
variables in the NSS, resulting in a BSDS for each slum. As with the factor analysis, this value
was transformed into a final BSDS ranging from 0 to 100 by subtracting each score by the
minimum, dividing by the range, and multiplying by 100. Since this (NFHS-3) version of the
BSDS score contains fewer variables than the other scoring options, its variation is smaller than
the other scoring methodologies’.
(iii) Regression Analysis 1—Predictors of Deprivation in Access to Basic Services
The BSDS is the outcome (dependent variable) in this analysis. The independent variable of
interest is legal status, represented as the number of years a slum has been notified (a continuous
variable), with 0 years indicating that the slum is non-notified. In an additional regression analysis
that is not included in this paper, we alternatively represented legal status as a dichotomous
variable (notified vs. non-notified) and found qualitatively similar results (findings available upon
request).
Other independent variables include (1) the number of households in the slum (per every 100
household increase); (2) ownership of the land the slum is on (e.g., local government, central
government, or private); (3) the slum’s location within the city (i.e., fringe or central); (4) type of
area around the slum (i.e., residential, commercial, or industrial); and (5) whether the slum has a
community association. We control for the survey year as a fixed effect in the model. We include
quadratic (squared) terms for “years notified” and for “number of households in the slum,” as
quadratic terms for these variables were significant at the 5% level.

11
India is a federal country with different policies at the national, state, and local levels. To
understand the influence of state policies (i.e., the “state effect”), we built a multilevel model
because NSS data are reported in a hierarchical fashion, with slums “nested” within states.
Differences in slum deprivation across states are represented by cluster-level intercepts in the
model. Multilevel analysis also allows estimation of the proportion of variation in the BSDS that
is accounted for by clustering of slums within states (i.e., intra-class correlation).
We also evaluated how much of the variation in the BSDS is accounted for by legal status and
other variables. Using a generalized version of Cohen’s F2 effect size measure, we assess changes
in the adjusted R2 for the full model when each independent variable is excluded. To understand
the proportion of variation attributable to the state variable, we compare the multilevel model to
one without the state random effect.
(iv) Regression Analysis 2—Predictors of Receiving Financial Support through a Slum
Improvement Scheme
Using 2012 NSS data from 706 slums in the 10 largest states, we investigate whether financial
support for slum improvement provided by the central government has been equitably distributed.
The 2012 NSS asked whether each slum “benefited from the Jawaharlal Nehru National Urban
Renewal Mission (JNNURM), the Rajiv Awas Yojana (RAY), or any other slum improvement
scheme” (National Sample Survey Organization, 2013). The answer to this question (“yes” or
“no”) is the outcome (dependent variable) in the multilevel logistic regression model. This
question was not asked in NSS surveys prior to 2012.
We include legal status as a dichotomous independent variable (i.e., “notified” or “non-notified”),
because, unlike in regression analysis 1, we are trying to understand whether each slum’s current
12
legal status (rather than the length of time it has been notified) influences the odds of receiving
financial support. We include the BSDS as an independent variable to understand whether severity
of deprivation influences the odds of receiving support. We divide the BSDS into three categories:
low (30), medium (31–60), and high (>60) deprivation. We also include the other covariates from
regression analysis 1 in this model.
3 Results
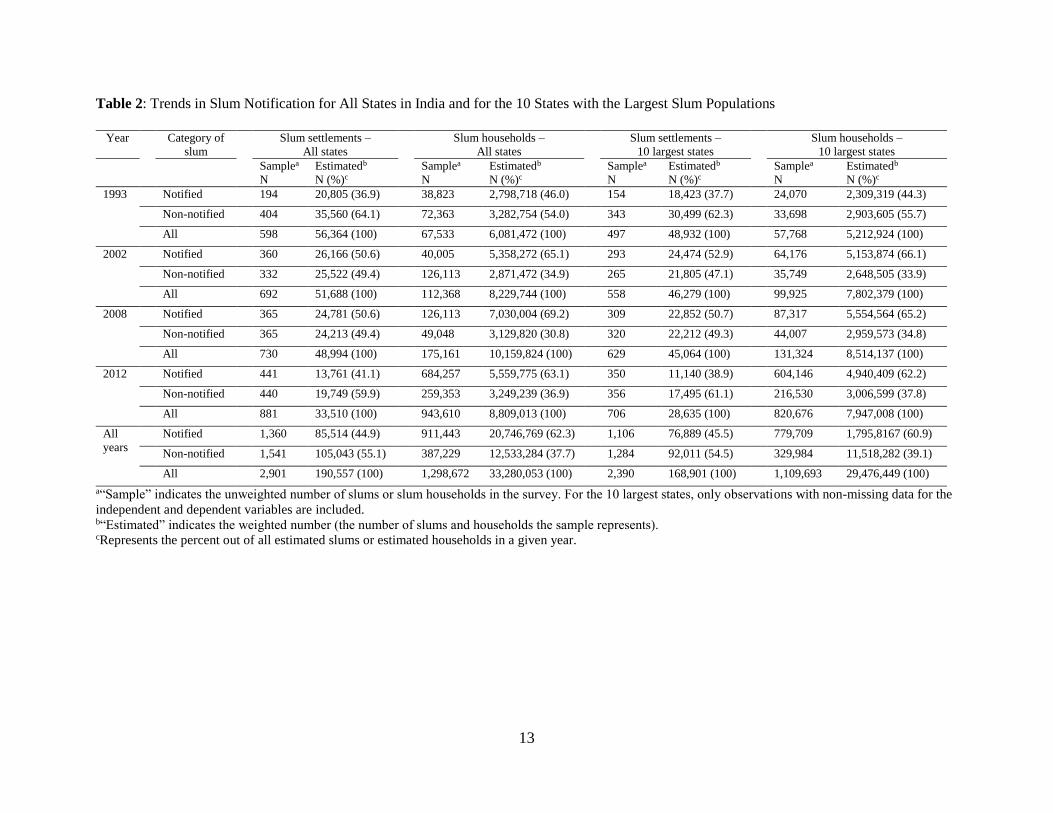
(i) Trends in Slum Notification over Two Decades
The number of non-notified slums at the national level and in the 10 states with the largest slum
populations decreased between 1993 and 2012; however, the percent of all slums that are non-
notified declined from 1993 to 2002, but then plateaued and increased between 2008 and 2012.
With regard to slum households, both the number and percent of non-notified households at the
national level and in the 10 states decreased from 1993 to 2002, but then plateaued and increased
between 2008 and 2012 (Table 2).
13
Table 2: Trends in Slum Notification for All States in India and for the 10 States with the Largest Slum Populations
Year Category of
slum
Slum settlements –
All states
Slum households –
All states
Slum settlements –
10 largest states
Slum households –
10 largest states
Samplea
N
Estimatedb
N (%)c
Samplea
N
Estimatedb
N (%)c
Samplea
N
Estimatedb
N (%)c
Samplea
N
Estimatedb
N (%)c
1993 Notified 194 20,805 (36.9) 38,823 2,798,718 (46.0) 154 18,423 (37.7) 24,070 2,309,319 (44.3)
Non-notified 404 35,560 (64.1) 72,363 3,282,754 (54.0) 343 30,499 (62.3) 33,698 2,903,605 (55.7)
All 598 56,364 (100) 67,533 6,081,472 (100) 497 48,932 (100) 57,768 5,212,924 (100)
2002 Notified 360 26,166 (50.6) 40,005 5,358,272 (65.1) 293 24,474 (52.9) 64,176 5,153,874 (66.1)
Non-notified 332 25,522 (49.4) 126,113 2,871,472 (34.9) 265 21,805 (47.1) 35,749 2,648,505 (33.9)
All 692 51,688 (100) 112,368 8,229,744 (100) 558 46,279 (100) 99,925 7,802,379 (100)
2008 Notified 365 24,781 (50.6) 126,113 7,030,004 (69.2) 309 22,852 (50.7) 87,317 5,554,564 (65.2)
Non-notified 365 24,213 (49.4) 49,048 3,129,820 (30.8) 320 22,212 (49.3) 44,007 2,959,573 (34.8)
All 730 48,994 (100) 175,161 10,159,824 (100) 629 45,064 (100) 131,324 8,514,137 (100)
2012 Notified 441 13,761 (41.1) 684,257 5,559,775 (63.1) 350 11,140 (38.9) 604,146 4,940,409 (62.2)
Non-notified 440 19,749 (59.9) 259,353 3,249,239 (36.9) 356 17,495 (61.1) 216,530 3,006,599 (37.8)
All 881 33,510 (100) 943,610 8,809,013 (100) 706 28,635 (100) 820,676 7,947,008 (100)
All
years
Notified 1,360 85,514 (44.9) 911,443 20,746,769 (62.3) 1,106 76,889 (45.5) 779,709 1,795,8167 (60.9)
Non-notified 1,541 105,043 (55.1) 387,229 12,533,284 (37.7) 1,284 92,011 (54.5) 329,984 11,518,282 (39.1)
All 2,901 190,557 (100) 1,298,672 33,280,053 (100) 2,390 168,901 (100) 1,109,693 29,476,449 (100)
a“Sample” indicates the unweighted number of slums or slum households in the survey. For the 10 largest states, only observations with non-missing data for the
independent and dependent variables are included. b“Estimated” indicates the weighted number (the number of slums and households the sample represents). cRepresents the percent out of all estimated slums or estimated households in a given year.

14
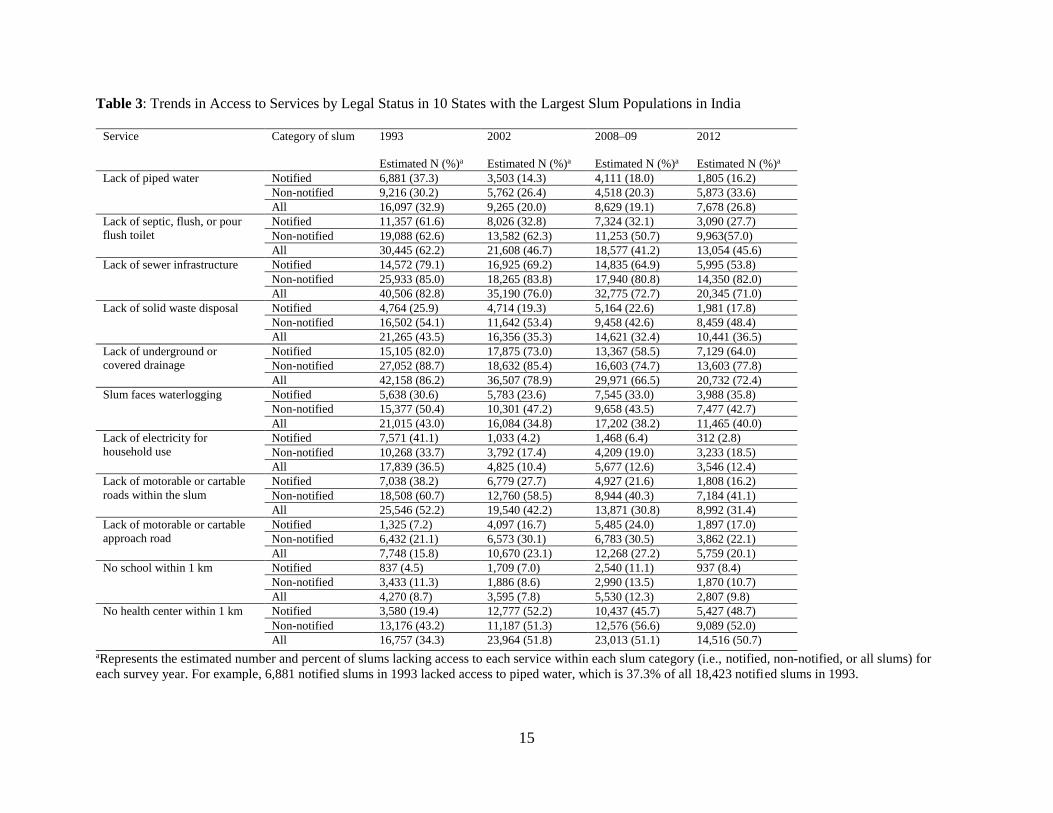
(ii) Trends in Access to Basic Services over Two Decades
In the 10 states with the largest slum populations, most indicators show a decrease in the percent
of slums experiencing lack of access to services from 1993 to 2012 (Table 3). The percent
experiencing deprivation increased during this time period for only three indicators: lack of a
motorable or cartable approach road, lack of a school within one kilometer, and lack of a health
center within one kilometer.
15
Table 3: Trends in Access to Services by Legal Status in 10 States with the Largest Slum Populations in India
Service Category of slum 1993
Estimated N (%)a
2002
Estimated N (%)a
2008–09
Estimated N (%)a
2012
Estimated N (%)a
Lack of piped water Notified 6,881 (37.3) 3,503 (14.3) 4,111 (18.0) 1,805 (16.2)
Non-notified 9,216 (30.2) 5,762 (26.4) 4,518 (20.3) 5,873 (33.6)
All 16,097 (32.9) 9,265 (20.0) 8,629 (19.1) 7,678 (26.8)
Lack of septic, flush, or pour
flush toilet
Notified 11,357 (61.6) 8,026 (32.8) 7,324 (32.1) 3,090 (27.7)
Non-notified 19,088 (62.6) 13,582 (62.3) 11,253 (50.7) 9,963(57.0)
All 30,445 (62.2) 21,608 (46.7) 18,577 (41.2) 13,054 (45.6)
Lack of sewer infrastructure Notified 14,572 (79.1) 16,925 (69.2) 14,835 (64.9) 5,995 (53.8)
Non-notified 25,933 (85.0) 18,265 (83.8) 17,940 (80.8) 14,350 (82.0)
All 40,506 (82.8) 35,190 (76.0) 32,775 (72.7) 20,345 (71.0)
Lack of solid waste disposal Notified 4,764 (25.9) 4,714 (19.3) 5,164 (22.6) 1,981 (17.8)
Non-notified 16,502 (54.1) 11,642 (53.4) 9,458 (42.6) 8,459 (48.4)
All 21,265 (43.5) 16,356 (35.3) 14,621 (32.4) 10,441 (36.5)
Lack of underground or
covered drainage
Notified 15,105 (82.0) 17,875 (73.0) 13,367 (58.5) 7,129 (64.0)
Non-notified 27,052 (88.7) 18,632 (85.4) 16,603 (74.7) 13,603 (77.8)
All 42,158 (86.2) 36,507 (78.9) 29,971 (66.5) 20,732 (72.4)
Slum faces waterlogging Notified 5,638 (30.6) 5,783 (23.6) 7,545 (33.0) 3,988 (35.8)
Non-notified 15,377 (50.4) 10,301 (47.2) 9,658 (43.5) 7,477 (42.7)
All 21,015 (43.0) 16,084 (34.8) 17,202 (38.2) 11,465 (40.0)
Lack of electricity for
household use
Notified 7,571 (41.1) 1,033 (4.2) 1,468 (6.4) 312 (2.8)
Non-notified 10,268 (33.7) 3,792 (17.4) 4,209 (19.0) 3,233 (18.5)
All 17,839 (36.5) 4,825 (10.4) 5,677 (12.6) 3,546 (12.4)
Lack of motorable or cartable
roads within the slum
Notified 7,038 (38.2) 6,779 (27.7) 4,927 (21.6) 1,808 (16.2)
Non-notified 18,508 (60.7) 12,760 (58.5) 8,944 (40.3) 7,184 (41.1)
All 25,546 (52.2) 19,540 (42.2) 13,871 (30.8) 8,992 (31.4)
Lack of motorable or cartable
approach road
Notified 1,325 (7.2) 4,097 (16.7) 5,485 (24.0) 1,897 (17.0)
Non-notified 6,432 (21.1) 6,573 (30.1) 6,783 (30.5) 3,862 (22.1)
All 7,748 (15.8) 10,670 (23.1) 12,268 (27.2) 5,759 (20.1)
No school within 1 km Notified 837 (4.5) 1,709 (7.0) 2,540 (11.1) 937 (8.4)
Non-notified 3,433 (11.3) 1,886 (8.6) 2,990 (13.5) 1,870 (10.7)
All 4,270 (8.7) 3,595 (7.8) 5,530 (12.3) 2,807 (9.8)
No health center within 1 km Notified 3,580 (19.4) 12,777 (52.2) 10,437 (45.7) 5,427 (48.7)
Non-notified 13,176 (43.2) 11,187 (51.3) 12,576 (56.6) 9,089 (52.0)
All 16,757 (34.3) 23,964 (51.8) 23,013 (51.1) 14,516 (50.7)
aRepresents the estimated number and percent of slums lacking access to each service within each slum category (i.e., notified, non-notified, or all slums) for
each survey year. For example, 6,881 notified slums in 1993 lacked access to piped water, which is 37.3% of all 18,423 notified slums in 1993.
16
However, these trends differ based on legal status, with notified slums experiencing greater
reductions in deprivation for most indicators compared with non-notified slums (Table 3). For the
services that are most vital for health—water, sewer, and toilet access—the percent of slums
without access fell among notified slums, while the percent of slums without access grew worse
(in the case of water) or essentially remained stable (for sewers and toilets) among non-notified
slums. For other indicators (electricity, drainage, and a functional road within the slum), the
percent without access declined for both notified and non-notified slums, but notified slums
experienced considerably greater reductions in deprivation. In 2012, for every basic service
assessed by the NSS, a greater proportion of non-notified slums lacked access as compared with
notified slums (Table 3).
By providing a composite measure of deprivation, the BSDS allows for analysis of general trends
in deprivation over time in the 10 states with the largest slum populations. Including data for slums
across all survey rounds, Figure 1 shows that the BSDS has a relatively normal distribution. The
distribution of scores is right-skewed for the sub-sample of notified slums and left-skewed for the
sub-sample of non-notified slums, suggesting that, on average, notified slums have less deprivation
in access to basic services than non-notified slums.

17
Figure 1: Histograms of the Distribution of the BSDS in the 10 States with the Largest Slum Populations
Evaluation of the average BSDS in different survey years reveals widening disparity in deprivation
between notified and non-notified slums. In 1993, there was no significant difference between the
mean BSDS for notified and non-notified slums (p=0.103) (Table 4). For notified slums, the mean
BSDS declined 34% between 1993 and 2012 (p <0.001), whereas the mean BSDS for non-notified
slums declined 8%, which is not statistically significant (p=0.146) (Figure 1). In other words, on
average, disparity in deprivation between notified and non-notified slums has emerged and
widened. For non-notified slums, deprivation in access to services has not declined meaningfully
over two decades.

18
Table 4: Basic Services Deprivation Score (BSDS) in All Slums, Notified Slums, and Non-Notified Slums in 10 States in India with the Largest Slum Populations
Year BSDS in All Slums
(Sample N=2,390;
Estimated
N=168,901)
Mean (SE)
BSDS in Notified
Slums (Sample
N=1,106; Estimated
N=76,889)
Mean (SE)
BSDS in Non-
Notified Slums
(Sample N=1,284;
Estimated N=92,011)
Mean (SE)
p-value for the
difference in mean
BSDS between
notified and non-
notified slums
1993 49.2 (1.37) 45.9 (2.91) 51.2 (1.48) 0.103
2002 41.3 (1.21) 33.5 (1.41) 50.0 (1.80) <0.001
2008 38.8 (1.07) 33.3 (1.44) 44.5 (1.53) <0.001
2012 40.5 (1.89) 30.1 (1.90) 47.1 (1.45) <0.001
SE=standard error.

19
Figure 2: Trends in the Basic Services Deprivation Score in 10 States with the Largest Slum Populations,
1993–2012
(iii) Predictors of Deprivation in Access to Basic Services
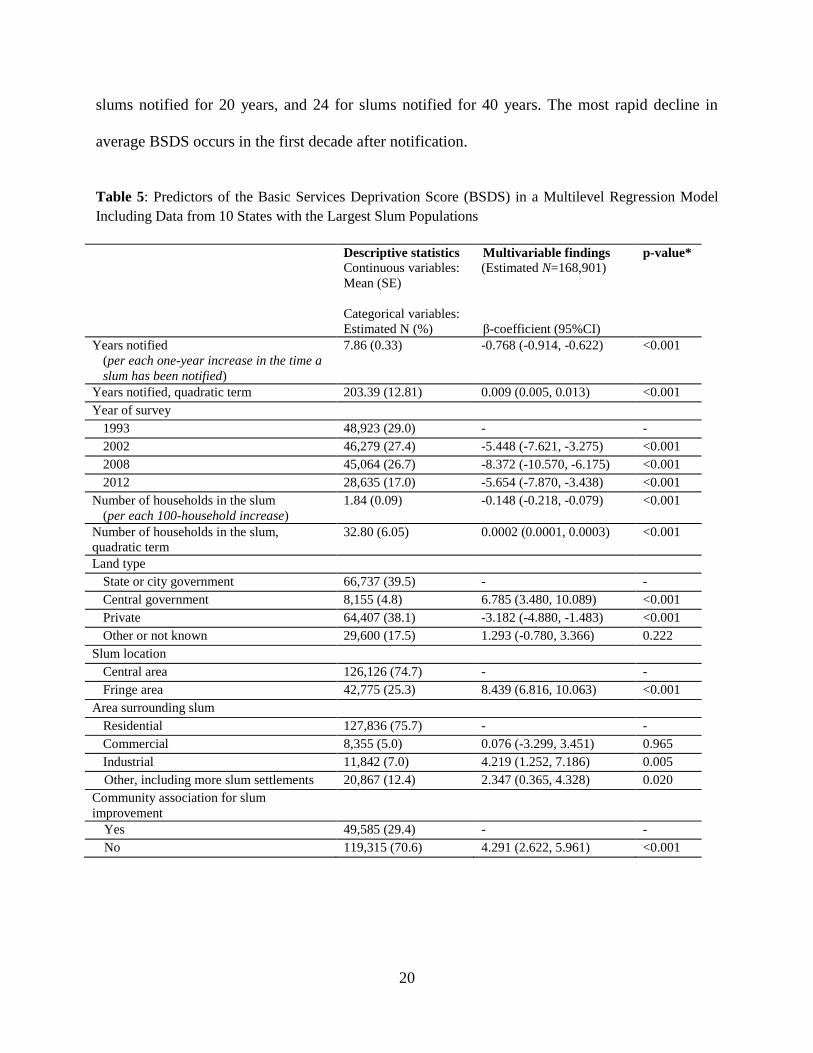
In the multilevel regression model, legal status (i.e., number of years of notification) has a
substantial association with BSDS, even after controlling for covariates (Table 5). Every additional
year of notification is associated with a 0.768 point decline in BSDS (p<0.001). A quadratic term
for years notified is significant, suggesting a non-linear association in which the magnitude of
decline in BSDS lessens with increasing years of notification. A scatterplot based on the regression
model—with a fitted line estimating the predicted BSDS with increasing years of notification—
illustrates this non-linear association (Figure 2). After controlling for covariates, the predicted
BSDS is 50 for slums that have never been notified, 39 for slums notified for 10 years, 35 for
51,2 50,0
44,547,1
45,9
33,533,3
30,1
0
10
20
30
40
50
60
1993 2002 2008 2012
Mea
n B
asic
Ser
vice
s D
epri
vati
on
Sco
re
Survey Year
Non-notified slums
Notified slums
20
slums notified for 20 years, and 24 for slums notified for 40 years. The most rapid decline in
average BSDS occurs in the first decade after notification.
Table 5: Predictors of the Basic Services Deprivation Score (BSDS) in a Multilevel Regression Model
Including Data from 10 States with the Largest Slum Populations
Descriptive statistics Continuous variables:
Mean (SE)
Categorical variables:
Estimated N (%)
Multivariable findings
(Estimated N=168,901)
β-coefficient (95%CI)
p-value*
Years notified
(per each one-year increase in the time a
slum has been notified)
7.86 (0.33) -0.768 (-0.914, -0.622) <0.001
Years notified, quadratic term 203.39 (12.81) 0.009 (0.005, 0.013) <0.001
Year of survey
1993 48,923 (29.0) - -
2002 46,279 (27.4) -5.448 (-7.621, -3.275) <0.001
2008 45,064 (26.7) -8.372 (-10.570, -6.175) <0.001
2012 28,635 (17.0) -5.654 (-7.870, -3.438) <0.001
Number of households in the slum
(per each 100-household increase)
1.84 (0.09) -0.148 (-0.218, -0.079) <0.001
Number of households in the slum,
quadratic term
32.80 (6.05) 0.0002 (0.0001, 0.0003) <0.001
Land type
State or city government 66,737 (39.5) - -
Central government 8,155 (4.8) 6.785 (3.480, 10.089) <0.001
Private 64,407 (38.1) -3.182 (-4.880, -1.483) <0.001
Other or not known 29,600 (17.5) 1.293 (-0.780, 3.366) 0.222
Slum location
Central area 126,126 (74.7) - -
Fringe area 42,775 (25.3) 8.439 (6.816, 10.063) <0.001
Area surrounding slum
Residential 127,836 (75.7) - -
Commercial 8,355 (5.0) 0.076 (-3.299, 3.451) 0.965
Industrial 11,842 (7.0) 4.219 (1.252, 7.186) 0.005
Other, including more slum settlements 20,867 (12.4) 2.347 (0.365, 4.328) 0.020
Community association for slum
improvement
Yes 49,585 (29.4) - -
No 119,315 (70.6) 4.291 (2.622, 5.961) <0.001

21
Constant - 51.422 (45.641, 57.202) <0.001
State random effects
Andhra Pradesh 23,703 (14.0) -5.027 (-6.367, -3.688) <0.001
Bihar 7,322 (4.3) 16.844 (14.309, 19.379) <0.001
Delhi 10,029 (5.9) -6.997 (-9.274, -4.719) <0.001
Gujarat 10,266 (6.1) 1.413 (-0.356, 3.182) 1.000
Karnataka 11,437 (6.8) -5.227 (-7.092, -3.361) <0.001
Madhya Pradesh 11,661(6.9) 2.725 (1.081, 4.369) 0.212
Maharashtra 52,045 (30.8) -9.079 (-10.037, -8.122) <0.001
Orissa 4,574 (2.7) 13.213 (10.817, 15.609) <0.001
Tamil Nadu 13,022 (7.7) 0.484 (-1.148, 2.117) 1.000
West Bengal 24,841 (14.7) -8.349 (-9.659, -7.039) <0.001
Variance of the random intercept (p-value) 73.911 (<0.001)
Variation in BSDS attributable to state
(intra-class correlation)
19.43%
*p-values for random effects are corrected for multiple comparisons (multiplied by the number of comparisons and
capped at 1.00). Confidence intervals for random effects are corrected to allow readers to make multiple
comparisons between states (Goldstein and Healy 1995)
Figure 3: Scatterplot and Fitted Line Estimating the Relationship between Years of Notification and the
Basic Service Deprivation Score (BSDS) after Adjusting for Covariates in a Multilevel Regression Model.
The 2002, 2008, and 2012 survey years are associated with a significantly lower BSDS compared
with 1993 (Table 5). Larger slum size (in households) is significantly associated with a lower

22
BSDS, and the quadratic term suggests a non-linear relationship in which the magnitude of
decrease in BSDS declines as slum size increases. As compared with slums on city or state
government land, slums on central government land have a significantly higher BSDS, and slums
on private land have a lower average BSDS. Slums on the fringes of cities have a significantly
higher BSDS on average than those in central areas. Having a community slum improvement
association is significantly associated with a lower BSDS. In the multilevel model, Andhra
Pradesh, Delhi, Karnataka, Maharashtra, and West Bengal have significantly lower BSDS on
average, while Bihar and Orissa have significantly higher average BSDS.
Evaluating the model R2 with and without each independent variable shows that legal status
explains the largest percent of variance in the BSDS (9.3%). Other covariates explain a smaller
proportion of the variance, including the state random effect (5.0%), slum location in a central or
fringe area (4.4%), survey year (2.4%), land ownership (1.9%), presence or absence of a
community association (1.0%), number of households (0.7%), and type of area surrounding the
slum (0.5%).
Tables A1-A4 in the Appendix to this manuscript present the results of four alternative approaches
to this analysis of the relationship between notification and deprivation in access to basic services.
All four alternative approaches to the primary analysis result in similar findings. The regression
results are qualitatively similar regardless of both the way the BSDS is constructed and the way
legal status is defined (i.e., as a continuous or dichotomous variable).
In Table A1, legal status is represented as a dichotomous variable (i.e., “notified” or “non-notified”
at time of the survey) in a multilevel model using the primary BSDS definition described in Table
1. The findings suggest that, on average, notified slums have a BSDS that is 10.5 points lower than
23
non-notified slums. Findings for the other covariates are qualitatively similar, with the exception
of slums in Madhya Pradesh having a significantly higher BSDS on average in this model.
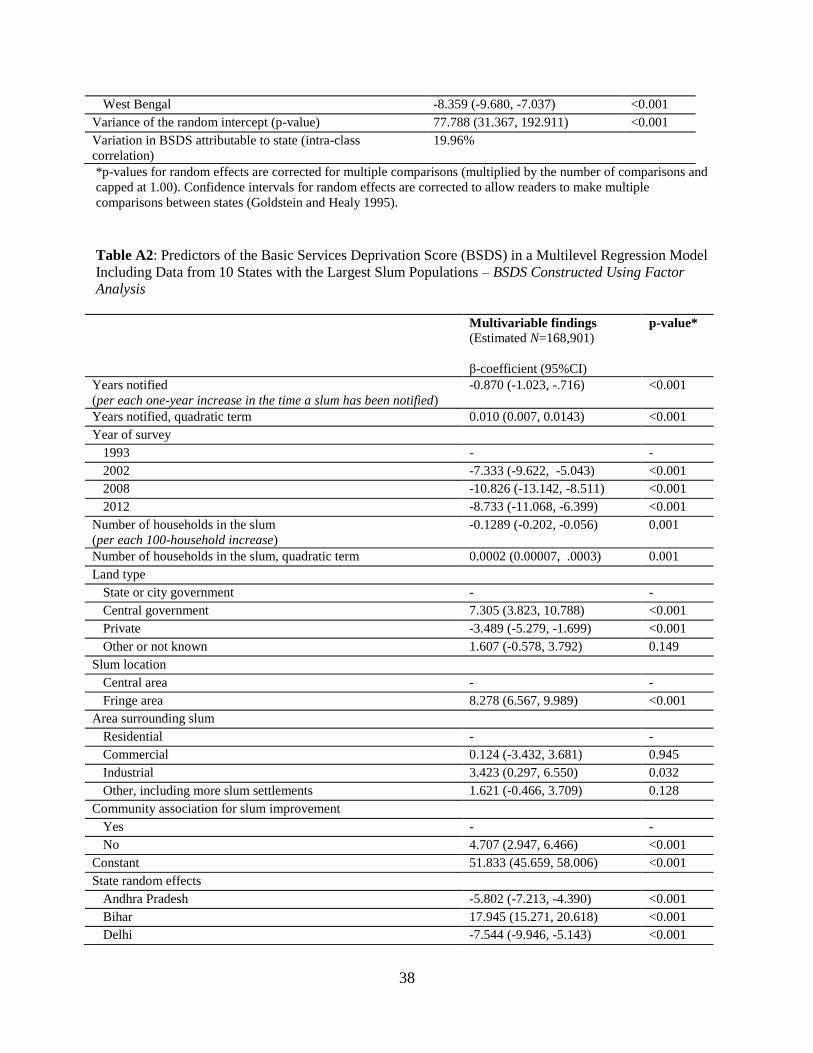
Table A2 presents a multilevel model in which the BSDS is constructed using the same variables
as in Table 1, but these variables are weighted using factor analysis. In this model, each year of
notification is associated with an average 0.870 point decline in BSDS, and this relationship is
non-linear. Findings for the other covariates are qualitatively similar to the findings in Table 5.
Table A3 presents a multilevel model in which the BSDS is constructed using a smaller number
of variables that were identified and weighted based on a separate analysis of data from the NFHS-
3. In this model, each year of notification is associated with an average 0.829 point decline in
BSDS, and this relationship is non-linear. Findings for the other covariates are qualitatively similar
to the findings in Table 5.
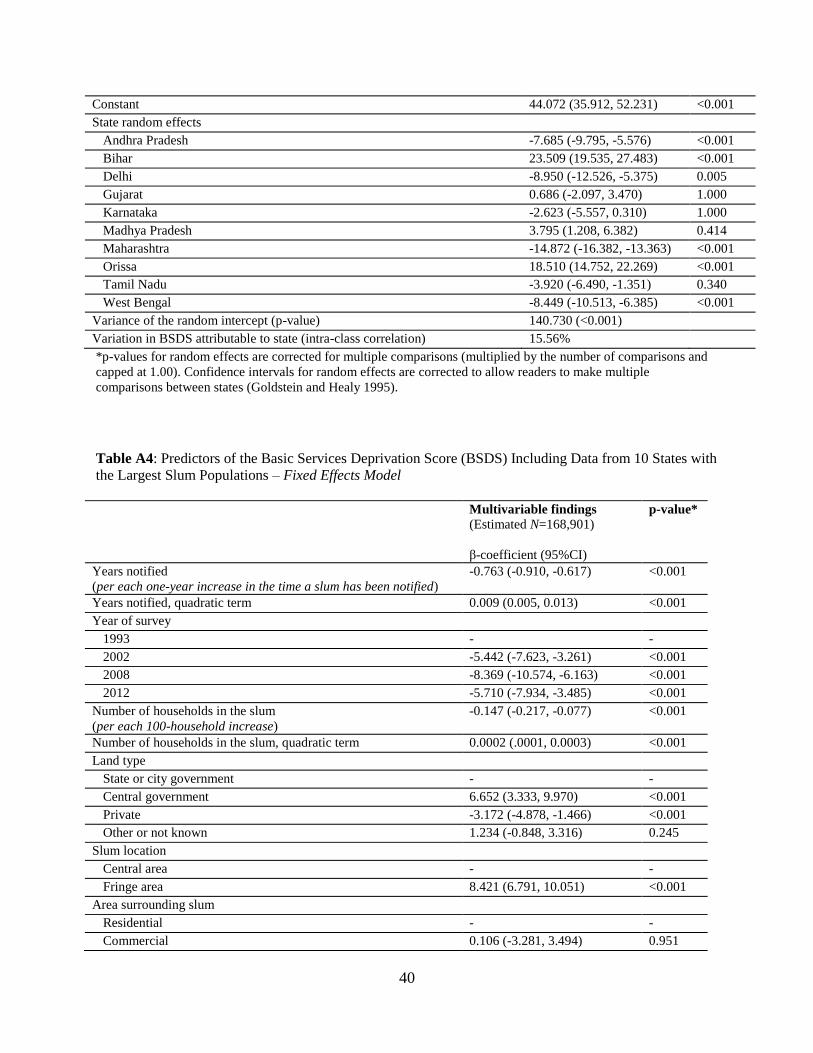
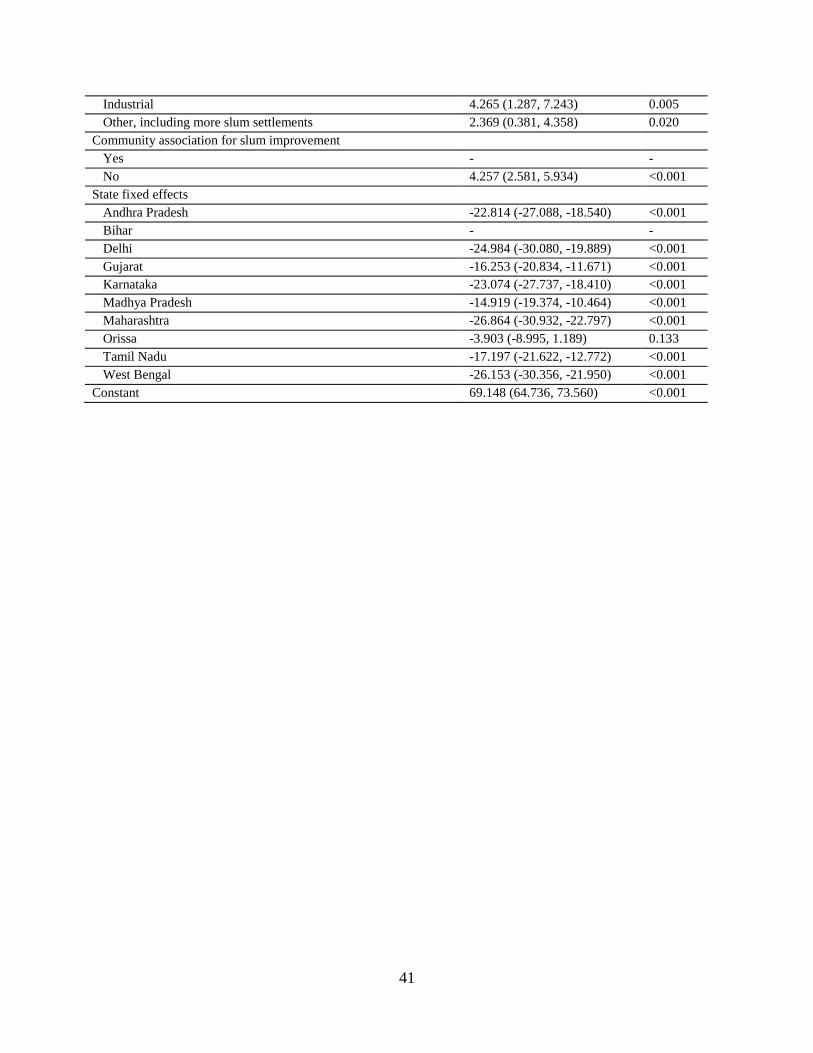
Table A4 presents a fixed effects model using the primary BSDS definition described in Table 1.
In this model, each year of notification is associated with an average 0.763 point decline in BSDS,
and this relationship is non-linear. Findings for most other covariates are qualitatively similar to
the findings in Table 5; however, since this is not a multilevel model, states were compared to
Bihar as a reference group. Slums in all states except Orissa have a significantly lower BSDS on
average as compared to slums in Bihar.
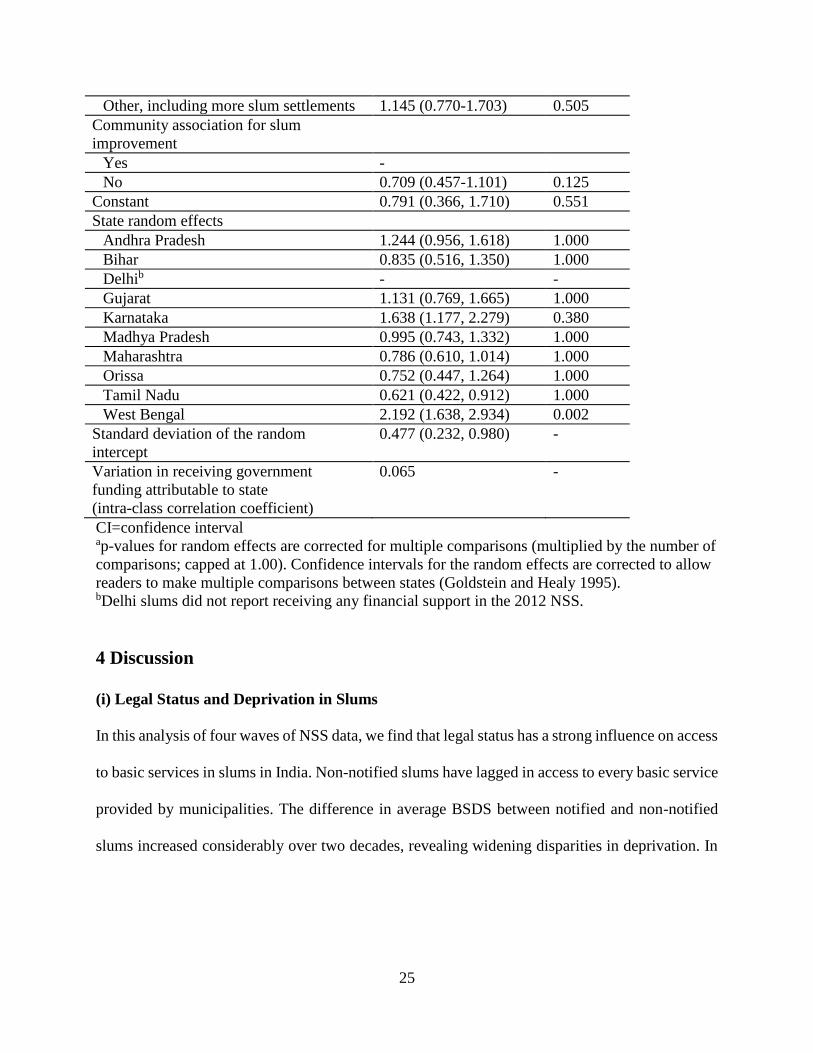
(iv) Predictors of Receiving Financial Support for Slum Improvement
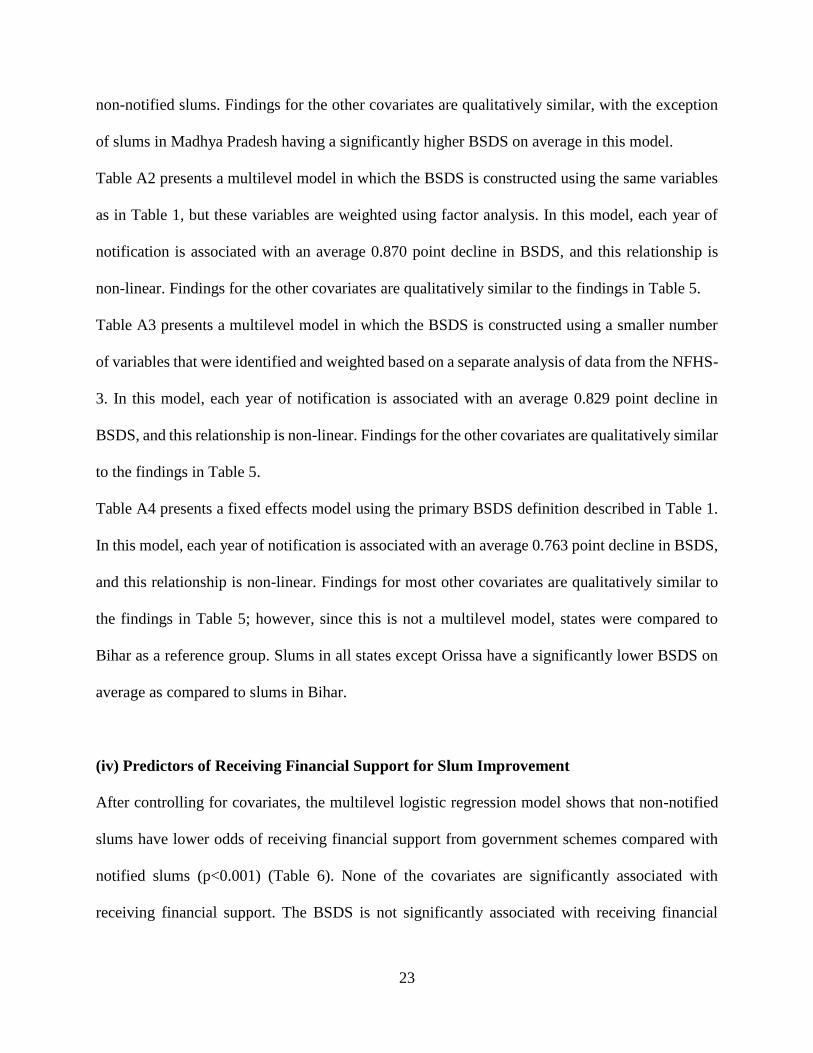
After controlling for covariates, the multilevel logistic regression model shows that non-notified
slums have lower odds of receiving financial support from government schemes compared with
notified slums (p<0.001) (Table 6). None of the covariates are significantly associated with
receiving financial support. The BSDS is not significantly associated with receiving financial
24
support, suggesting that funding has not been distributed based on the severity of a slum’s
deprivation. Slums in West Bengal had significantly higher odds of receiving financial support
compared with slums in other states.
Table 6: Predictors of Receiving Financial Support from Government Slum Improvement Schemes in a
Multilevel Logistic Regression Model Using Data from the 2012 NSS
Predictors Multivariable findings
(N=706, Estimated
N=28,635)
Odds ratio (CI)
p-valuea
Notified
Yes -
No 0.379 (0.246, 0.584) <0.001
BSDS
Low (≤30) -
Medium (31–60) 1.013 (0.671, 1.529) 0.951
High (>61) 0.723 (0.390, 1.341 0.304
Number of households in the slum
<100 -
101–300 0.933 (0.526,1.655) 0.814
301–800 1.251 (0.702, 2.228) 0.447
>801 0.854 (0.449, 1.622) 0.629
Land type
Public local government -
Public central government 0.321 (0.088, 1.166) 0.084
Private 0.875 (0.584, 1.312) 0.519
Other or not known 0.941 (0.529, 1.674) 0.836
Slum location
Central area -
Fringe area 1.019 (0.686, 1.515) 0.925
Type of area surrounding slum
Residential -
Commercial 0.395 (0.129, 1.208) 0.103
Industrial 0.699 (0.270-1.811) 0.461
25
Other, including more slum settlements 1.145 (0.770-1.703) 0.505
Community association for slum
improvement
Yes -
No 0.709 (0.457-1.101) 0.125
Constant 0.791 (0.366, 1.710) 0.551
State random effects
Andhra Pradesh 1.244 (0.956, 1.618) 1.000
Bihar 0.835 (0.516, 1.350) 1.000
Delhib - -
Gujarat 1.131 (0.769, 1.665) 1.000
Karnataka 1.638 (1.177, 2.279) 0.380
Madhya Pradesh 0.995 (0.743, 1.332) 1.000
Maharashtra 0.786 (0.610, 1.014) 1.000
Orissa 0.752 (0.447, 1.264) 1.000
Tamil Nadu 0.621 (0.422, 0.912) 1.000
West Bengal 2.192 (1.638, 2.934) 0.002
Standard deviation of the random
intercept
0.477 (0.232, 0.980) -
Variation in receiving government
funding attributable to state
(intra-class correlation coefficient)
0.065 -
CI=confidence interval ap-values for random effects are corrected for multiple comparisons (multiplied by the number of
comparisons; capped at 1.00). Confidence intervals for the random effects are corrected to allow
readers to make multiple comparisons between states (Goldstein and Healy 1995). bDelhi slums did not report receiving any financial support in the 2012 NSS.
4 Discussion
(i) Legal Status and Deprivation in Slums
In this analysis of four waves of NSS data, we find that legal status has a strong influence on access
to basic services in slums in India. Non-notified slums have lagged in access to every basic service
provided by municipalities. The difference in average BSDS between notified and non-notified
slums increased considerably over two decades, revealing widening disparities in deprivation. In

26
fact, the average BSDS for non-notified slums remained statistically unchanged between 1993 and
2012, suggesting no reduction in the severity of deprivation faced by non-notified slums.
Of greatest concern is that disparities in access to services that are crucial for health increased the
most. The percent of non-notified slums without piped water increased from 1993 to 2012, while
the percent of notified slums without piped water declined. Similarly, the percent of non-notified
slums without sewer infrastructure remained essentially unchanged, while the percent of notified
slums without sewer infrastructure decreased substantially.
The multilevel regression analysis shows that the association between legal status and deprivation
is significant even after controlling for other factors that could explain the severity of deprivation.
The number of years a slum has been notified explains more of the variance in BSDS than any
other factor. Most convincingly, we find a progressive non-linear reduction in deprivation the
longer that a slum is notified, with benefits accruing most rapidly in the first decade after
notification.
Providing legal recognition may therefore be a powerful intervention for improving access to basic
services, thereby improving health outcomes in slums. Prior studies have focused on how legal
recognition may motivate slum residents to improve the quality of their homes, due to lower threat
of eviction (Field 2005; Gandelman 2010; Nakamura 2016). Our findings suggest that the benefits
of legal recognition extend well beyond improvements in housing quality. By eliminating legal
barriers to government provision of services, notification may serve as a gateway to accessing
entitlements that are vital for life—including water, sanitation, electricity, schools, and health
centers. Even if service delivery is suboptimal, notification confers basic rights and social
27
recognition upon slum residents, empowering them to mobilize collectively to claim these
entitlements (Appadurai 2001).
(ii) Barriers to Reducing Deprivation in Non-Notified Slums
Our analysis reveals two other concerning trends with implications for deprivation in India’s
slums. First, despite the strong association between notification and reduced deprivation, progress
on notification seems to have stalled and reversed after 2008. Between 2008 and 2012, the number
of non-notified slum households in India and the percent of all slum households that were non-
notified increased. Why progress in notification has stalled is unclear, though some argue that
neoliberal ideology has undermined the public’s perception of slum residents as legitimate urban
citizens (Bhan 2014). If this represents the start of a longer-term trend, reversal of progress in slum
notification could slow the decline of deprivation in cities and increase inter-slum disparities
(between notified and non-notified slums) and intra-urban disparities (between slum and non-slum
populations).
A second barrier to reducing deprivation is that, despite greater average deprivation in non-notified
slums, these slums were less likely to receive government financial aid. In addition, provision of
government aid has no association with the severity of deprivation in a slum. While schemes like
the JNNURM do not list legal status as a formal barrier to receiving support, in practice, non-
notified status may serve as a hurdle that prevents these schemes from helping communities that
need this aid the most.
28
(iii) Other Predictors of Deprivation in Slums
Our analysis highlights additional factors that influence deprivation. Slums on central government
land (as compared with city or state land) experience greater deprivation. India’s constitution
designates certain areas in cities (including railways, airports, and seaports) as being under the
legal jurisdiction of the central government. India’s central government has no official policy for
providing slums with legal recognition (Gangan 2010). Unlike city and state governments, which
face democratic pressure to extend services to slums, the central government is not held
accountable for the living conditions of slum residents through elections (Murthy 2012). Even
when city governments are motivated to extend services to slums on central government land, they
cannot do so without a “no objection certificate” from central government authorities. As a result,
slums on central government land—despite having existed for decades in some cases—often suffer
from severe deprivation (Juneja 2001; Subbaraman et al. 2012).
Another factor associated with lower average deprivation is having a community association. This
finding affirms studies highlighting the role that slum dwellers’ federations and similar
organizations play in empowering communities to negotiate for services from local governments
(Appadurai 2001; Patel et al. 2012).
Smaller slums, slums on city fringes, and slums in industrial areas suffer from greater deprivation.
Slums on the city periphery or in industrial areas generally attract newer migrants, who may not
be as politically empowered as longer established populations. Furthermore, slum residents are
often relocated to peripheries of cities after episodes of home demolition, so the greater deprivation
in these slums could partly reflect a “penalty” resulting from displacement.
29
(iv) Limitations of the Analysis
This observational study is not designed to determine whether the association between legal status
and deprivation is causal. The NSS does not follow the same slums longitudinally, which would
provide a better understanding of the temporal relationship between notification and deprivation.
This association could be due to reverse causation. For example, slums with lower levels of
deprivation could have greater collective efficacy to lobby for notified status. However, our finding
that the average BSDS declines with increasing years of notification highlights a “dose-dependent”
association that strengthens the likelihood of a causal relationship (Bradford Hill 1965). In
addition, case studies highlight lack of security of tenure as a barrier to accessing services in slums,
suggesting that a causal relationship is plausible (Murthy 2012; Subbaraman et al. 2012).
Confounding or mediating variables linked both with legal status and BSDS could also partly
explain this association. For example, non-notified slums may be more likely to attract recent
migrants who do not have the financial resources to afford a home in a notified slum. These
individuals might have lower motivation to get access to basic services, fewer financial resources
to pay for private connections to services, or lower collective efficacy to lobby officials to provide
services.
Furthermore, the NSS data assume that all households within a slum have the same legal status.
However, in some settings, households within a slum may be heterogeneous with regard to legal
status. For example, in Mumbai, individual slum households may gain legal recognition and access
to services based on whether the family was living in the home prior to a specified cut-off date
(Bjorkman 2014). As a result, slums in Mumbai may have a mix of notified and non-notified
households. The NSS collected community-level information, which limits our understanding of
30
the influence of this household-level variability on deprivation.
We must therefore consider whether “ecological fallacy”—the misattribution of community-level
associations to household-level relationships—affects the interpretation of our results. We believe
that this bias is limited for a few reasons. First, legal recognition is designated at the community
level in most settings. Second, in settings where legal status is heterogeneous within slums, the
NSS probably correctly classified slums based on whether most households in that slum fit the
designated legal category. Because many services require community-scale infrastructure
development, if most households in a slum are non-notified, surrounding notified households are
also likely to partly suffer from the “neighborhood-level” effects of deprivation (Lilford et al.
2016).
Finally, if heterogeneity in legal status exists within slums that the NSS did not capture, this biases
our findings toward the null hypothesis that legal status has no association with the BSDS. In other
words, the magnitude of this association could be greater than is reported in our analysis. Future
large-scale surveys, such as the NSS and the National Family Health Survey, should include robust
measures of legal status at the household level to better understand the relationship between legal
status and deprivation for people living in slums.
5 Conclusions
Lack of legal recognition seems to be an intractable issue for slums in India and globally. Millions
of urban citizens remain “off the map” from the standpoint of political and social recognition
(Subbaraman et al. 2012). Many governments justify failing to extend basic services to slum

31
residents using the concept of “opportunistic influx”—the idea that provision of services might
encourage greater migration from rural areas, thereby paradoxically increasing urban deprivation.
This argument is rooted in older academic theories that claim that providing jobs and improving
living standards for the urban poor would accelerate urban unemployment and poverty through
increased migration (Harris and Todaro 1970). However, these theories have fallen out of favor
because they are supported by little empirical evidence. A substantial proportion of urban
population growth occurs in situ and is not due to rural-urban migration. Moreover, extensive
evidence suggests that provision of basic services enhances human capabilities and economic
growth (Marx et al. 2013; Sen 1999). Despite the absence of evidence to support the theory of
opportunistic influx, many government policies remain stuck in a state of inertia, leaving non-
notified slums in a legal limbo, sometimes for decades (Marx et al. 2013).
Our study adds to a growing literature suggesting that lack of legal recognition perpetuates urban
inequality in housing conditions, quality of life, and health outcomes (Nakamura 2016;
Subbaraman et al. 2012, 2014). Providing legal recognition could be a powerful strategy for
reducing deprivation and suffering by transforming slum residents into urban citizens with
fundamental rights.
Where governments are unwilling to provide legal recognition, strategies for partial extension of
services to slums without providing security of tenure may be one avenue around the policy trap.
For example, a recent Bombay High Court ruling disentangled the right to water from land tenure
by ordering Mumbai’s city corporation to provide basic access to water for non-notified slums
(Subbaraman and Murthy 2015). Given the stalling of progress on slum notification in India,
32
disentangling service delivery and security of tenure may provide an alternative strategy for
reducing deprivation.
Finally, non-notified slums have been less likely to receive support from government schemes
aimed at reducing urban disparities. Given that legal status is demonstrated to be a strong marker
of deprivation, current government schemes for improving life in cities, such as the Smart Cities
Mission and the Atal Mission for Rejuvenation and Urban Transformation (AMRUT), should
target resources to non-notified slums. Alternatively, mapping the severity of deprivation in
different slums—using evidence-based metrics that correlate with health outcomes—could help
target financial support to communities most in need (Osrin et al. 2011). Increasing notification
and better targeting of financial support may be key strategies for reducing deprivation, poor health
outcomes, and suffering for people living in slums in India.
33
References
Agarwal, S. (2011): "The state of urban health in India; comparing the poorest quartile to the rest
of the urban population in select states and cities," Environment and Urbanization, Vol 23, No
1, pp 13-28.
Agarwal, S. and A. Srivastava. (2009): "Social determinants of children's health in urban areas in
India," Journal of Health Care for the Poor and Underserved, Vol 20, Supplement No 4, pp
68-89.
Agarwal, S. and S. Taneja. (2005): "All slums are not equal: child health conditions among the
urban poor," Indian Pediatrics, Vol 42, No 3, pp 233-244.
Appadurai, A. (2001): "Deep democracy: urban governmentality and the horizon of politics,"
Environment and Urbanization, Vol 13, No 2, pp 23-43.
Bartram, J. and S. Cairncross. (2010): "Hygiene, sanitation, and water: forgotten foundations of
health," PLoS Medicine, Vol 7, No 11, pp e1000367.
Bhan, G. (2014): "The impoverishment of poverty: reflections on urban citizenship and inequality
in contemporary Delhi," Environment and Urbanization, Vol 26, No 2, pp 547-560.
Bjorkman, L. (2014): "Becoming a slum: from municipal colony to illegal settlement in
liberalization-era Mumbai," International Journal of Urban and Regional Research, Vol 38,
No 1, pp 38-59.
Bradford Hill, A. (1965): "The environment and disease: association or causation?" Proceedings
of the Royal Society of Medicine, Vol 58, No 5, pp 295-300.
Census of India. (2013): "Primary census 2011 abstract for slums," New Delhi: Office of the
Registrar General and Census Commissioner. Available at:
http://www.censusindia.gov.in/2011-Documents/Slum-26-09-13.pdf [Accessed 19 September
2016].
Choudhary, S. R. and O. N. Jayaswal. (1989): "Infant and early childhood mortality in urban slums
under ICDS scheme," Indian Pediatrics, Vol 26, No 6, pp 544-549.
Field, E. (2005): "Property rights and investment in urban slums," Journal of the European
Economic Association, Vol 3, No 2-3, pp 279-290.
34
Gandelman, N. (2010): "Property rights and chronic diseases: evidence from a natural experiment
in Montevideo, Uruguay 1990–2006," Economics & Human Biology, Vol 8, No 2, pp 159-167.
Gangan, S. (2010): "Maharashtra CM Ashok Chavan to Centre: have a slum policy like we do,"
DNA, 22 August 2010. Available at: http://www.dnaindia.com/mumbai/report_maharashtra-
cm-ashok-chavan-to-centre-have-a-slum-policy-like-we-do_1426904 [Accessed 19
September 2016].
Ghei, K., S. Agarwal, M. A. Subramanyam, and S. V. Subramanian. (2010): "Association between
child immunization and availability of health infrastructure in slums in India," Archives of
Pediatrics and Adolescent Medicine, Vol 164, No 3, pp 243-249.
Gladstone, B. P., J. P. Muliyil, S. Jaffar, J. G. Wheeler, A. Le Fevre, M. Iturriza-Gomara, J. J.
Gray, A. Bose, M. K. Estes, D. W. Brown, and G. Kang. (2008): "Infant morbidity in an Indian
slum birth cohort," Archives of Disease in Childhood, Vol 93, No 6, pp 479-484.
Goldstein, H. and M. Healy. (1995): "The graphical presentation of a collection of means," Journal
of the Royal Statistical Society, Vol 158, No 1, pp 175-177.
Gupta, K., F. Arnold, and H. Lhungdim. (2009): "Health and living conditions in eight Indian
cities: national family health survey (NFHS-3), 2005–06," Mumbai: International Institute for
Population Sciences.
Hagan, J. E., P. Moraga, F. Costa, N. Capian, G. S. Ribeiro, E. A. Wunder, R. D. M. Felzemburgh,
R. B. Reis, N. Nery, F. S. Santana, D. Fraga, B. L. dos Santos, A. C. Santos, A. Queiroz, W.
Tassinari, M. S. Carvalho, M. G. Reis, P. J. Diggle, and A. I. Ko. (2016): "Spatiotemporal
determinants of urban leptospirosis transmission: four-year prospective cohort study of slum
residents in Brazil," PLoS Neglected Tropical Diseases, Vol 1, No 1, pp e0004275.
Harris, J. and M. Todaro. (1970): "Migration, unemployment, and development: a two-sector
analysis," The American Economic Review, Vol 60, No 1, pp 126-142.
Hayes, J. M., E. Garcia-Rivera, R. Flores-Reyna, G. Suarez-Rangel, T. Rodriguez-Mata, R. Coto-
Portillo, R. Baltrons-Orellana, E. Mendoza-Rodriguez, B. F. De Garay, J. Jubis-Estrada, R.
Hernandez-Argueta, B. J. Biggerstaff, and J. G. Rigau-Perez. (2003): "Risk factors for
infection during a severe dengue outbreak in El Salvador in 2000," American Journal of
Tropical Medicine and Hygiene, Vol 69, No 6, pp 629-633.

35
International Institute for Population Sciences (IIPS) and Macro International. (2007): "National
Family Health Survey-3, 2005-2006," Mumbai: IIPS.
Juneja, N. (2001): "Primary education for all in the city of Mumbai, India: the challenge set by
local actors," Paris: UNESCO.
Lilford, R. J., Oyebode, O., Satterthwaite, D., Melendez-Torres, G. J., Chen, Y. F., Mberu, B.,
Watson, S., Sartori, J., Ndugwa, R., Caiaffa, W., Haregu, T., Capon, A., Saith, R., Ezeh, A.
(2016): "Improving the health and welfare of people who live in slums," Lancet, 16 October
2016. Available at: http://www.thelancet.com/pdfs/journals/lancet/PIIS0140-6736(16)31848-
7.pdf [Accessed 31 October 2016].
Marx, B., T. Stoker, and T. Suri. (2013): "The economics of slums in the developing world,"
Journal of Economic Perspectives, Vol 27, No 4, pp 187-210.
Millennium Development Goals Database. (2014): "Slum population in urban areas of India,"
Geneva: United Nations. Available at: http://mdgs.un.org/unsd/mdg/Data.aspx [Accessed 19
September 2016].
Ministry of Housing and Urban Poverty Alleviation. (2010): "Report of the committee on slum
statistics/census," New Delhi: Government of India.
Murthy, S. L. (2012): "Land security and the challenges of realizing the human right to water and
sanitation in the slums of Mumbai, India," Health and Human Rights Journal, Vol 14, No 2,
pp 61-73.
Nakamura, S. (2016): "Revealing invisible rules in slums: the nexus between perceived tenure
security and housing investment," Habitat International, Vol 53, pp 151-162.
National Sample Survey Organization. (1997): "Slums in India. NSS 49th round. January–June
1993," New Delhi: Ministry of Statistics.
National Sample Survey Organization. (2003): "Condition of urban slums. NSS 58th round. July–
December 2002," New Delhi: Ministry of Statistics and Programme Implementation.
National Sample Survey Organization. (2010): "Some characteristics of urban slums. NSS 65th
round. July 2008–June 2009," New Delhi: Ministry of Statistics and Programme
Implementation.
36
National Sample Survey Organization. (2013): "Key indicators of urban slums in India. NSS 69th
round. July–December 2012," New Delhi: Ministry of Statistics and Programme
Implementation.
Osrin, D., S. Das, U. Bapat, G. A. Alcock, W. Joshi, and N. S. More. (2011): "A rapid assessment
scorecard to identify informal settlements at higher maternal and child health risk in Mumbai,"
Journal of Urban Health, Vol 88, No 5, pp 919-932.
Patel, S., C. Baptist, and C. D'Cruz. (2012): "Knowledge is power—informal communities assert
their right to the city through SDI and community-led enumerations," Environment and
Urbanization, Vol 24, No 1, pp 13-26.
Sen, A. (1999): "Development as freedom," Oxford: Oxford University Press.
Subbaraman, R. and S. Murthy. (2015): "The right to water in the slums of Mumbai, India,"
Bulletin of the World Health Organization, Vol 93, No 11, pp 815-816.
Subbaraman, R., L. Nolan, T. Shitole, K. Sawant, S. Shitole, K. Sood, J. Ghannam, T. S.
Betancourt, D. E. Bloom, and A. Patil-Deshmukh. (2014): "The psychological toll of slum
living in Mumbai, India: a mixed methods study," Social Science and Medicine, Vol 119c, pp
155-169.
Subbaraman, R., J. O'Brien, T. Shitole, S. Shitole, K. Sawant, D. E. Bloom, and A. Patil-
Deshmukh. (2012): "Off the map: the health and social implications of being a non-notified
slum in India," Environment and Urbanization, Vol 24, No 2, pp 643-663.
UN-HABITAT. (2002): "Expert group meeting on urban indicators: secure tenure, slums, and a
global sample of cities," Nairobi: UN-HABITAT.
Wolf, J., A. Pruss-Ustun, O. Cumming, J. Bartram, S. Bonjour, S. Cairncross, T. Clasen, J. M.
Colford, V. Curtis, J. De France, L. Fewtrell, M. C. Freeman, B. Gordon, P. R. Hunter, A.
Jeandron, R. B. Johston, D. Mausezahl, C. Mathers, M. Neira, and J. P. Higgins. (2014):
"Assessing the impact of drinking water and sanitation on diarrhoeal disease in low- and
middle-income settings: systematic review and meta-regression," Tropical Medicine and
International Health, Vol 19, No 8, pp 928-942.

37
Appendix
Table A1: Predictors of the Basic Services Deprivation Score (BSDS) in a Multilevel Regression Model
Including Data from 10 States with the Largest Slum Populations – Legal Status as a Dichotomous Variable
Multivariable findings
(Estimated N=168,901)
β-coefficient (95%CI)
p-value*
Notified
No - -
Yes -10.546 (-12.092, -9.001) <0.001
Year of survey
1993 - -
2002 -5.496, (-7.691, -3.301) <0.001
2008 -8.810 (-11.020, -6.599) <0.001
2012 -6.621 (-8.842, -4.401) <0.001
Number of households in the slum
(per each 100-household increase)
-0.172 (-0.242, -0.102) <0.001
Number of households in the slum, quadratic term 0.0002 (0.0001,0 .0003) <0.001
Land type
State or city government - -
Central government 6.467 (3.129, 9.806) <0.001
Private -3.158 (-4.872, -1.444) <0.001
Other or not known 1.198 (-0.896, 3.293) 0.262
Slum location
Central area - -
Fringe area 8.850 (7.214, 10.486) <0.001
Area surrounding slum
Residential - -
Commercial 0.397 (-3.007, 3.800) 0.819
Industrial 4.689 (1.699, 7.679) 0.002
Other, including more slum settlements 2.146 (0.150, 4.142) 0.035
Community association for slum improvement
Yes - -
No 4.058 (2.367, 5.750) <0.001
Constant 52.384 (46.451, 58.317) <0.001
State random effects
Andhra Pradesh -5.188 (-6.539, -3.836) <0.001
Bihar 17.293 (14.734, 19.852) <0.001
Delhi -7.370 (-9.669, -5.071) <0.001
Gujarat 1.495 (-0.291, 3.280) 1.000
Karnataka -4.984 (-6.866, -3.101) 0.002
Madhya Pradesh 3.398 (1.739, 5.057) 0.044
Maharashtra -9.560 (-10.526, -8.595) <0.001
Orissa 13.413 (10.994, 15.832) <0.001
Tamil Nadu -0.139 (-1.786, 1.509) 1.000
38
West Bengal -8.359 (-9.680, -7.037) <0.001
Variance of the random intercept (p-value) 77.788 (31.367, 192.911) <0.001
Variation in BSDS attributable to state (intra-class
correlation)
19.96%
*p-values for random effects are corrected for multiple comparisons (multiplied by the number of comparisons and
capped at 1.00). Confidence intervals for random effects are corrected to allow readers to make multiple
comparisons between states (Goldstein and Healy 1995).
Table A2: Predictors of the Basic Services Deprivation Score (BSDS) in a Multilevel Regression Model
Including Data from 10 States with the Largest Slum Populations – BSDS Constructed Using Factor
Analysis
Multivariable findings
(Estimated N=168,901)
β-coefficient (95%CI)
p-value*
Years notified
(per each one-year increase in the time a slum has been notified)
-0.870 (-1.023, -.716) <0.001
Years notified, quadratic term 0.010 (0.007, 0.0143) <0.001
Year of survey
1993 - -
2002 -7.333 (-9.622, -5.043) <0.001
2008 -10.826 (-13.142, -8.511) <0.001
2012 -8.733 (-11.068, -6.399) <0.001
Number of households in the slum
(per each 100-household increase)
-0.1289 (-0.202, -0.056) 0.001
Number of households in the slum, quadratic term 0.0002 (0.00007, .0003) 0.001
Land type
State or city government - -
Central government 7.305 (3.823, 10.788) <0.001
Private -3.489 (-5.279, -1.699) <0.001
Other or not known 1.607 (-0.578, 3.792) 0.149
Slum location
Central area - -
Fringe area 8.278 (6.567, 9.989) <0.001
Area surrounding slum
Residential - -
Commercial 0.124 (-3.432, 3.681) 0.945
Industrial 3.423 (0.297, 6.550) 0.032
Other, including more slum settlements 1.621 (-0.466, 3.709) 0.128
Community association for slum improvement
Yes - -
No 4.707 (2.947, 6.466) <0.001
Constant 51.833 (45.659, 58.006) <0.001
State random effects
Andhra Pradesh -5.802 (-7.213, -4.390) <0.001
Bihar 17.945 (15.271, 20.618) <0.001
Delhi -7.544 (-9.946, -5.143) <0.001

39
Gujarat 2.462 (0.597, 4.328) 0.665
Karnataka -4.484 (-6.451, -2.517) 0.015
Madhya Pradesh 2.300 (0.567, 4.032) 0.651
Maharashtra -10.197 (-11.206, -9.188) <0.001
Orissa 14.261 (11.735, 16.788) <0.001
Tamil Nadu -0.231 (-1.952, 1.491) 1.000
West Bengal -8.710 (-10.091, -7.329) <0.001
Variance of the random intercept (p-value) 84.676 (34.139, 210.024) <0.001
Variation in BSDS attributable to state (intra-class correlation) 19.92%
*p-values for random effects are corrected for multiple comparisons (multiplied by the number of comparisons and
capped at 1.00). Confidence intervals for random effects are corrected to allow readers to make multiple
comparisons between states (Goldstein and Healy 1995).
Table A3: Predictors of the Basic Services Deprivation Score (BSDS) in a Multilevel Regression Model
Including Data from 10 States with the Largest Slum Populations – BSDS Constructed and Weighted Based
on an Analysis of the NFHS-3
Multivariable findings
(Estimated N=168,901)
β-coefficient (95%CI)
p-value*
Years notified
(per each one-year increase in the time a slum has been notified)
-0.829 (-1.059, -0.598) <0.001
Years notified, quadratic term 0.009 (0.004, 0.015) 0.001
Year of survey
1993 - -
2002 -5.293 (-8.723, -1.864) 0.002
2008 -7.913 (-11.381, -4.445) <0.001
2012 -4.569 (-8.066, -1.072) 0.010
Number of households in the slum
(per each 100-household increase)
-.148593 (-0.258, -0.039) 0.008
Number of households in the slum, quadratic term 0.0002 (0.00002, .0003) 0.029
Land type
State or city government - -
Central government 7.171 (1.956, 12.386) 0.007
Private -5.165 (-7.845, -2.484) <0.001
Other or not known -0.325 (-3.596, 2.946) 0.846
Slum location
Central area - -
Fringe area 10.047 (7.484, 12.609) <0.001
Area surrounding slum
Residential - -
Commercial -0.981 (-6.308, 4.345) 0.718
Industrial 6.617 (1.935, 11.299) 0.006
Other, including more slum settlements 2.794 (-0.334, 5.921) 0.080
Community association for slum improvement
Yes - -
No 3.822 (1.187, 6.458) 0.004
40
Constant 44.072 (35.912, 52.231) <0.001
State random effects
Andhra Pradesh -7.685 (-9.795, -5.576) <0.001
Bihar 23.509 (19.535, 27.483) <0.001
Delhi -8.950 (-12.526, -5.375) 0.005
Gujarat 0.686 (-2.097, 3.470) 1.000
Karnataka -2.623 (-5.557, 0.310) 1.000
Madhya Pradesh 3.795 (1.208, 6.382) 0.414
Maharashtra -14.872 (-16.382, -13.363) <0.001
Orissa 18.510 (14.752, 22.269) <0.001
Tamil Nadu -3.920 (-6.490, -1.351) 0.340
West Bengal -8.449 (-10.513, -6.385) <0.001
Variance of the random intercept (p-value) 140.730 (<0.001)
Variation in BSDS attributable to state (intra-class correlation) 15.56%
*p-values for random effects are corrected for multiple comparisons (multiplied by the number of comparisons and
capped at 1.00). Confidence intervals for random effects are corrected to allow readers to make multiple
comparisons between states (Goldstein and Healy 1995).
Table A4: Predictors of the Basic Services Deprivation Score (BSDS) Including Data from 10 States with
the Largest Slum Populations – Fixed Effects Model
Multivariable findings
(Estimated N=168,901)
β-coefficient (95%CI)
p-value*
Years notified
(per each one-year increase in the time a slum has been notified)
-0.763 (-0.910, -0.617) <0.001
Years notified, quadratic term 0.009 (0.005, 0.013) <0.001
Year of survey
1993 - -
2002 -5.442 (-7.623, -3.261) <0.001
2008 -8.369 (-10.574, -6.163) <0.001
2012 -5.710 (-7.934, -3.485) <0.001
Number of households in the slum
(per each 100-household increase)
-0.147 (-0.217, -0.077) <0.001
Number of households in the slum, quadratic term 0.0002 (.0001, 0.0003) <0.001
Land type
State or city government - -
Central government 6.652 (3.333, 9.970) <0.001
Private -3.172 (-4.878, -1.466) <0.001
Other or not known 1.234 (-0.848, 3.316) 0.245
Slum location
Central area - -
Fringe area 8.421 (6.791, 10.051) <0.001
Area surrounding slum
Residential - -
Commercial 0.106 (-3.281, 3.494) 0.951
41
Industrial 4.265 (1.287, 7.243) 0.005
Other, including more slum settlements 2.369 (0.381, 4.358) 0.020
Community association for slum improvement
Yes - -
No 4.257 (2.581, 5.934) <0.001
State fixed effects
Andhra Pradesh -22.814 (-27.088, -18.540) <0.001
Bihar - -
Delhi -24.984 (-30.080, -19.889) <0.001
Gujarat -16.253 (-20.834, -11.671) <0.001
Karnataka -23.074 (-27.737, -18.410) <0.001
Madhya Pradesh -14.919 (-19.374, -10.464) <0.001
Maharashtra -26.864 (-30.932, -22.797) <0.001
Orissa -3.903 (-8.995, 1.189) 0.133
Tamil Nadu -17.197 (-21.622, -12.772) <0.001
West Bengal -26.153 (-30.356, -21.950) <0.001
Constant 69.148 (64.736, 73.560) <0.001