Embed Size (px)
Citation preview

KTH Elektro- och systemteknik
Diagnostics of Oil-Impregnated Paper Insulation Systems by Utilizing Lightning and
Switching Transients
ROYA NIKJOO
Licentiate Thesis Stockholm, Sweden 2014

ii
TRITA-EE 2014:018 KTH School of Electrical Engineering ISSN 1653-5146 SE-100 44 Stockholm ISBN 978-91-7595-097-6 SWEDEN
Akademisk avhandling som med tillstånd av Kungl Tekniska Högskolan framlägges till offentlig granskning för avläggande av teknologie licentiatexamen tisdagen den 29 april 2014 klockan 13.00 i H21, Teknikringen 33, Kungl Tekniska Högskolan, Stockholm.
© Roya Nikjoo, april 2014
Tryck: Universitetsservice US AB
iii
Abstract
Development of the power grid towards a more reliable and smarter system requires frequent
on-line monitoring of the power components. Power transformers and their bushings are particularly important components in a power transmission system and their insulation degradation may lead to catastrophic failures. Time consuming and costly replacement of these components raise the importance of their frequent monitoring. A fault in a power transformer bushing can also involve in the failure of the transformer. Therefore, on-line diagnostics of power transformers and their bushings is of great interest. Several methods exist for diagnostics of these components. However, some of them can only be done off-line in maintenance periods, and the existing on-line methods generally provide less information, especially on the internal solid insulation parts.
In this project, a new technique for on-line diagnostics of the power transformer and the bushing insulation is proposed. In this technique, natural transients happening in the power system such as lightning and switching surges can be used as stimuli for on-line dielectric response measurements. This technique can provide information on insulation close to what Dielectric Spectroscopy offers in off-line measurements. The wide-ranging frequency content of power system transients is their advantage for being used as stimuli when measuring the Dielectric Response. The response can have particular signatures due to different types of defects in the insulation varying with frequency.
Oil-impregnated paper as a major insulation component in power transformer and its bushing has been investigated in this project. Moisture content and temperature, as two important degradation factors in this type of insulation, have been studied to evaluate the performance of the proposed technique in the diagnostics of the oil-impregnated paper. The results are verified with the dielectric response obtained through commercial instruments. The results show that the proposed technique has the ability to track the changes in dielectric response due to the moisture content and temperature. Measurements were done at both high voltage (40 kV) and low voltage (10 V) levels, and the corresponding circuit models to achieve reasonable accuracy for the results are discussed.
Moving on from the material samples, a further study was done on three service-aged 150 kV bushings to investigate the feasibility of the technique on the diagnostics of power transformer bushings. Their dielectric response measured by the transient stimuli showed good agreement with their response obtained by the commercial instruments. The effect of the transformer winding on the transient response of the bushing is a further aspect of the real conditions for on-line diagnostics. This has been investigated through the simulation of transient models for transformers and bushings, and possible solutions for distinguishing the responses are presented.
The proposed new on-line diagnostics technique by utilizing natural transients can provide information about the insulation system in a certain range of frequency without interrupting the operation or requiring an external voltage source. However, the validity range of the results depends on the bandwidth of the applied transients and other measurement considerations. This approach can be valuable in frequent monitoring of dielectric properties of the power transformers and their bushings as a complement to the other available on-line techniques.
Keywords: Capacitance, Dielectric Response, Loss tangent, Moisture content, Oil-impregnated
paper, Temperature, Transformer Bushing, Transients

iv

v
Acknowledgements
I am grateful to all those who have helped and supported me during my work.
My deepest appreciation goes to my main supervisor, Assoc. Prof. Hans Edin and my co-supervisor Dr. Nathaniel Taylor whose patience, encouragement and professional guidance means a lot to me during this research. This work would not be completed without their support and guidance. I also express my gratitude to Prof. Rajeev Thottappillil for motivating me a lot in my career and social area.
I am very fortunate to have a lot of friends in KTH Electric Power Divisions and I’m greatly indebted to all of them who create a wonderful and friendly atmosphere to work in and I would like to give my special thanks to Nadja Jäverberg, an angel who was the first person I turned to for help and who always supported me in research and daily life.
I extend my sincere thanks to my friends in my research group who have been supportive and helpful a lot in my whole study: Patrick Janus, Xiaolei Wang, Respicius Clemence Kiiza, and Mohamad Ghaffarian Niasar.
Also, thanks to Prof. Tord Bengtsson and Dr. Dierk Bormann from ABB for providing great feedback and guidance.
Many thanks to Mr. Peter Lönn for his continuous support in maintaining computers and providing software and Ms. Carin Norberg for financial administration.
The project is funded by the SweGRIDS, the Swedish Centre for Smart Grids and Energy Storage. It is a partnership of academia, industry and public utilities, with major funding from the Swedish Energy Agency as well as the corporate partners, which is gratefully acknowledged. The project is also part of KIC-InnoEnergy through the CIPOWER innovation project.
Last but not least, I would like to express my gratitude to my family for all their continuous support, encouragement, and endless love to me.
Thanks to all of you! Roya Nikjoo Stockholm, April 2014

vi

vii
List of Publications: The thesis is based on the following papers:
I. R. Nikjoo, N. Taylor, R. Clemence Kiiza, M. Ghaffarian, X. Wang and H. Edin, ''Insulation Condition Diagnostics of Oil-impregnated Paper by Utilizing Power System Transients'', ISH, Korea, 2013.
II. R. Nikjoo, N. Taylor, R. Clemence Kiiza and H. Edin, ''Dielectric Response of Oil-
impregnated Paper by Utilizing Lightning and Switching Transients'', submitted to IEEE Transactions on Dielectrics and Electrical Insulation.
III. R. Nikjoo, N. Taylor, R. Clemence Kiiza, M. Ghaffarian and H. Edin, ''Dielectric
Response of Aged Transformer Bushings Utilizing Power system Transients'', ISGT, Denmark, 2013.
IV. R. Nikjoo and H. Edin, "Effect of Transformer Winding on the Transient Response
of Power Transformer Bushings," International Conference on Lightning Protection, Vienna, 2012.
Paper related to the project, but not included in this thesis:
V. R. Nikjoo, N. Taylor, M. Ghaffarian and H. Edin, ''Dielectric Response Measurement of Power Transformer Bushing by Utilizing High Voltage Transients'', CEIDP, Canada, 2012.

viii
ix
Contents
1 Introduction ......................................................................................................... 1 1.1 Background ................................................................................................... 1 1.2 Motivation of the study ................................................................................. 1 1.3 Aim of the project ......................................................................................... 2 1.4 Method .......................................................................................................... 2 1.5 Thesis outline ................................................................................................ 3 1.6 Author’s contributions .................................................................................. 3
2 Transients in Power System................................................................................ 5 3 Insulation Diagnostic methods: Power transformers and their bushings ....... 7
3.1 Off-line Diagnostics ...................................................................................... 9 3.1.1 Chemical techniques................................................................................. 9 3.1.2 Electrical diagnostic methods ................................................................... 9
3.2 On-line Monitoring ..................................................................................... 10 4 Experimental evaluation method ..................................................................... 13
4.1 Dielectric Response .................................................................................... 13 4.2 Temperature effect ...................................................................................... 15 4.3 Dielectric Spectroscopy by Utilizing Power System Transients ................. 15
4.3.1 Application ............................................................................................. 15 4.3.2 Circuit Modeling .................................................................................... 16
5 Experimental Results on Oil-impregnated paper ........................................... 23 5.1 Low Voltage measurement ......................................................................... 23
5.1.1 Experimental set up ................................................................................ 23 5.1.2 Sample preparation ................................................................................. 24 5.1.3 Humidity control process ....................................................................... 25 5.1.4 Measurement consideration .................................................................... 26 5.1.5 Results on moisture content effect ......................................................... 27 5.1.6 Temperature effect ................................................................................. 31 5.1.7 Discussion .............................................................................................. 32
5.2 High voltage measurement ......................................................................... 34
x
5.2.1 Experimental set up ................................................................................ 34 5.2.2 Sensitivity analysis ................................................................................. 36 5.2.3 Results .................................................................................................... 37 5.2.4 Discussion .............................................................................................. 37
6 Experimental Results on HV Transformer Bushings ..................................... 39 6.1 Dielectric response of HV transformer bushings ........................................ 39 6.2 Experimental set up .................................................................................... 39 6.3 Results ........................................................................................................ 39
6.3.1 Discussion .............................................................................................. 42 6.4 Effect of Transformer Winding on the Transient Response of Power
Transformer Bushings .................................................................................................. 42 6.4.1 Discussion .............................................................................................. 48
7 Summary of Publications .................................................................................. 49 8 Conclusions and Future Work ......................................................................... 51
8.1 Conclusions ................................................................................................ 51 8.2 Future work ................................................................................................. 52
Bibliography ............................................................................................................... 53

1
1 Introduction
1.1 Background Reliability of power components in the electric power system is of great importance
for grid operators and electricity consumers. Condition-based assessments are done to avoid failure in the components [1]. Most of the failures originate from the insulation degradation. Power components such as power transformers are very expensive components that have a vital role in the power transmission system. Their lifetime can be around 60 years if they have proper maintenance. But there are different conditions and factors that cause aging of these components and reduce their electrical strength. Therefore, often monitoring and diagnostic tools become important for avoiding costly and time consuming failures and replacements. A lot of studies have been done on power transformer aging and the degradation mechanisms involved [2]-[6]. Several tools and methods are presented on diagnostics of power transformers and their bushings [7]-[13]. They can be categorized as off-line and on-line diagnostic methods [14]-[16]. Off-line techniques can be used only during the planned service period of the transformer, which takes place around every decade. The long gap between service periods is a drawback for off-line diagnostic methods. Development of “smarter” and more reliable power grids requires frequent and automated monitoring of these important components [17]. Therefore, applicable on-line methods get more interesting. However, most of the on-line methods cannot provide as much information as off-line methods because of performance limitations. Condition assessments of power transformers are mostly done through several on-line methods [18]-[20] because; decision making must be done according to majority agreements between different techniques.
Dielectric Spectroscopy (DS) as an electrical technique can provide a lot of information about the insulation [7],[8],[21]. However, it has a limitation in the sense that it cannot be applied on-line during the operation of the power component. It provides dielectric response of the insulation system over a wide range of frequency. It is appropriate especially for complex or solid insulations like oil-impregnated paper. Different insulation defects cause different changes in the dielectric response of the insulation with frequency. This characteristic adds value to the results obtained by dielectric spectroscopy for condition assessment.
1.2 Motivation of the study In conventional dielectric spectroscopy, a wide range of frequencies mainly below 1
kHz is applied to the test object, and the current response is measured by a precise electrometer. To get similar information from the insulation as this method in a possible

2
on-line technique, a source with a wide range of frequency is desired. Natural transients like lightning and switching surges are inevitable phenomena happening in the electric power system [22]. When they reach to the terminal of power components like power transformers and their bushings, the surge voltage can excite the power component. Their spectrum has a wide range of frequency in some ways different from the frequency ranges that are used in the conventional dielectric spectroscopy. However, they can play as natural stimuli to the insulation system to provide information on the status of the insulation. Frequent occurrence of these transients like switching of capacitor banks helps to get more frequent dielectric response of the component rather than off-line dielectric spectroscopy.
1.3 Aim of the project The aim of this thesis is to develop a dielectric response method that is based on
applied voltage waveforms similar to the ones used in standard lightning and switching impulse tests. The developed method should be applicable in the future as an on-line diagnostic method based on stimuli from naturally occurring over-voltage transients in the electric power system.
The objective is to evaluate the usefulness of the method on oil impregnated paper insulation of the kind that is common in high voltage power transformers and bushings. The sensitivity of the method to temperature variations and signatures of insulation degradation such as the moisture content in the paper is investigated.
1.4 Method To reach the mentioned aim, measurement of applied voltage and response current,
and post processing of the signals are performed on small oil-impregnated paper samples and full-scale bushings. Because of the presence of high frequency components in the applied signal, several parameters and conditions can affect the accuracy of the results. In order to have a simple measurement set up for response current measurement a shunt can be used [23]. The reason behind using a shunt is its ability to measure all signals with both high and low frequency components. Some other devices, such as Pearson or Rogowski coils, that are commonly used for capturing high frequency transients are not considered, as they do not have sufficient accuracy in measuring low frequency components. Therefore, by using a proper shunt, a good level of accuracy is achievable in measurement of dielectric response current. Specification criteria for shunt selection are also presented in this thesis. Measurement of the applied transient in the field is out of the scope of the thesis. Recent work on this topic can be found in [24]. Data acquisition is also done with an oscilloscope with high sampling rate and high bandwidth to avoid the problems that can affect the precision. Modeling of all involved elements in the circuit and measurement of their transfer function is another important matter in feasibility of the method. Processing of measured signal to achieve the dielectric response of the insulation system is done through a Matlab code and necessary functions.

3
1.5 Thesis outline This thesis contains eight chapters and Papers I-IV written on most of the
achievements mentioned in the main body of the thesis. Chapter 2 contains information on different types of transients that occur in the power
system with their important specifications valuable in this research such as their duration and frequency ranges.
Chapter 3 describes recent achievements in diagnostics of power transformers and their bushings. Different methods both for off-line and on-line conditions are presented and discussed. Their application, advantages and disadvantages are briefly presented.
In Chapter 4 the theoretical concept of dielectric spectroscopy is presented. Then the proposed technique for obtaining dielectric response utilizing natural transients and its application is explained. Also, measurement circuit considerations to fulfill the feasibility of the technique are discussed in this chapter.
Chapter 5 contains the results from oil-impregnated paper by applying low voltage and high voltage transients to the test sample. The first part investigates the ability of the technique in detection of moisture content and temperature in the oil-impregnated paper by applying LV impulses. The second part presents the results on oil-impregnated paper through HV impulses.
In Chapter 6, results on the real power transformer bushings from three different phases of a transformer taken out of service after 50 years are demonstrated. The proposed technique is performed to get the dielectric response of the bushings. Then to check the possible problems in getting the bushings response while they are connected to the transformer winding, some simulation results in Electromagnetic Transient Program (EMTP-Rv) are presented.
Chapter 7 summarizes papers I to IV. In Chapter 8 conclusion of the presented work and suggestions for future work are
defined.
1.6 Author’s contributions The author is fully responsible for papers I-IV. The results in Paper I to IV were
developed by the author, other PhD students in the Insulation Diagnostic group participated in the discussion of some measurement results.
The entire work was supervised by Assoc. Prof. Hans Edin and Dr. Nathaniel Taylor as co-supervisor.

4

5
2 Transients in Power System
Transients refer to phenomena that occur in electrical power systems and may have different origins like lightning discharges and switching operations from circuit breakers. They would have a short duration from a micro second to several seconds. Classification of these transients can be done in several ways. If the origin of the transients would be addressed, two categories can be defined: 1. Atmospheric origin 2. Switching origin. Electromagnetic and Electromechanical transients are another type of classification for transients, based on their origin. The first one is caused by the interaction of the electric and magnetic field and the latter refers to the mechanical and electrical interaction in rotating machines [22]. Waveform shapes of transients can be a base for another group of classification. Impulsive, oscillatory and multiple transients can define this type of classification [25]. The impulsive transients are sudden changes in voltage or current that can be defined with their rise and decay time. An example of this type of transient is a lightning impulse. Transients with damped oscillation are considered as oscillatory, such as capacitor bank energizing. Overlapping of several transients is called multiple transients and is more common during current interruption and restrike [26].
Classification of transients regarding their frequency spectrum is another way of representing the power system transients. This type of classification is more of interest in this project.
Very fast front surges with frequency range of 100 kHz to 50 MHz usually refers to the switching operations in Gas Insulated Substations (GIS). The duration of such surges is less than 3 ms and usually they are superimposed by oscillations. The next type of disturbance in power system with short rise time of hundreds of nanoseconds or some microseconds is lightning. Lightning strikes in the vicinity of power networks can induce overvoltage on transmission lines. Direct lightning strikes can also happen to the transmission lines and cause transients in power systems.
When circuit breakers and disconnectors operate in the power network, switching transients occur. Transient currents flow in the system by closing operation of switches and transient recovery voltage appears over the terminals by opening operation of switches. Depending on the components in the system around the switching devices, the shape of the waves, their frequency, phase and oscillation will change [27].
A brief look at the different categories of the transients regarding their time duration is done in Table 2.1. However, more detailed type of transients with their most common frequency range is shown in Table 2.2. High frequency transients originate from electromagnetic phenomena and low frequency ones happen from electromechanical origin. There is a specific categorization suggested by CIGRE Working Group 33.02.1

6
that classifies the transients in four groups according to their frequency ranges presented in Table 2.3.
Table 2.1: Time duration of transient phenomena in Electrical system [22] Nature of the transient phenomena Time Duration Lightning 0.1µs-1ms Switching 10 µs to less than a second Sub synchronous Resonance 0.1 ms-5s Transient Stability 1 ms-10s Dynamic Stability, long term dynamics 0.5-1000s Tie line regulation 10-1000s Daily load management, operator actions Up to 24h
Table 2.2: Frequency ranges of transients [22] Origin of Transients Frequency Range Restrikes on disconnectors and faults in GIS 100 kHz–50 MHz Lightning surges 10 kHz–3 MHz Multiple restrikes in circuit breakers 10 kHz–1 MHz Transient recovery voltage: Terminal faults 50/60 Hz–20 kHz Short-line faults 50/60 kHz–100 kHz Fault clearing 50/60 Hz–3 kHz Fault initiation 50/60 Hz–20 kHz Fault energization 50/60 Hz–3 kHz Load rejection 0.1 Hz–3 kHz Transformer energization (dc) 0.1 Hz–1 kHz Ferroresonance (dc) 0.1 Hz–1 kHz
Table 2.3: Transient classification according to transients [22] group Frequency range for
representation Shape resignation Representation mainly
for 1 0.1 Hz–3 kHz Low frequency
oscillation Temporary
overvoltages 2 50/60 Hz–20 kHz Slow front surges Switching overvoltages 3 10 kHz–3 MHz Fast front surges Lightning overvoltages 4 100 kHz–50 MHz Very fast front
surges Restrike
overvoltages,GIS All mentioned transients can be possible choices to be used as stimuli to measure the
dielectric response of the power components’ insulation system. Their respective frequency ranges defines the frequency components that can be provided in the obtained dielectric response due to each type of transients.
7
3 Insulation Diagnostic methods: Power transformers and their bushings
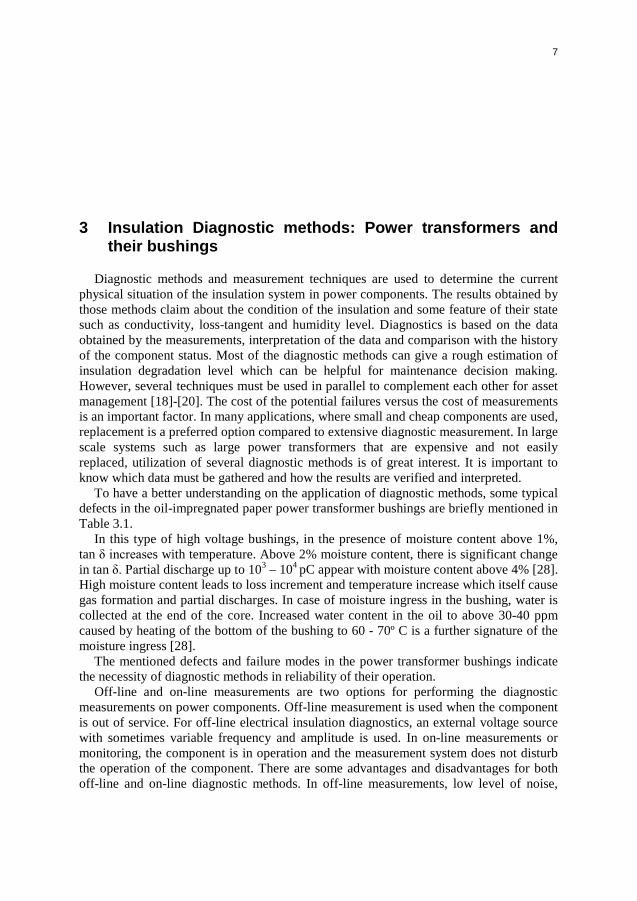
Diagnostic methods and measurement techniques are used to determine the current physical situation of the insulation system in power components. The results obtained by those methods claim about the condition of the insulation and some feature of their state such as conductivity, loss-tangent and humidity level. Diagnostics is based on the data obtained by the measurements, interpretation of the data and comparison with the history of the component status. Most of the diagnostic methods can give a rough estimation of insulation degradation level which can be helpful for maintenance decision making. However, several techniques must be used in parallel to complement each other for asset management [18]-[20]. The cost of the potential failures versus the cost of measurements is an important factor. In many applications, where small and cheap components are used, replacement is a preferred option compared to extensive diagnostic measurement. In large scale systems such as large power transformers that are expensive and not easily replaced, utilization of several diagnostic methods is of great interest. It is important to know which data must be gathered and how the results are verified and interpreted.
To have a better understanding on the application of diagnostic methods, some typical defects in the oil-impregnated paper power transformer bushings are briefly mentioned in Table 3.1.
In this type of high voltage bushings, in the presence of moisture content above 1%, tan δ increases with temperature. Above 2% moisture content, there is significant change in tan δ. Partial discharge up to 103 – 104 pC appear with moisture content above 4% [28]. High moisture content leads to loss increment and temperature increase which itself cause gas formation and partial discharges. In case of moisture ingress in the bushing, water is collected at the end of the core. Increased water content in the oil to above 30-40 ppm caused by heating of the bottom of the bushing to 60 - 70º C is a further signature of the moisture ingress [28].
The mentioned defects and failure modes in the power transformer bushings indicate the necessity of diagnostic methods in reliability of their operation.
Off-line and on-line measurements are two options for performing the diagnostic measurements on power components. Off-line measurement is used when the component is out of service. For off-line electrical insulation diagnostics, an external voltage source with sometimes variable frequency and amplitude is used. In on-line measurements or monitoring, the component is in operation and the measurement system does not disturb the operation of the component. There are some advantages and disadvantages for both off-line and on-line diagnostic methods. In off-line measurements, low level of noise,

8
accessibility to some part of the component and better measurement of some features such as small current are the advantages. On the other hand, on-line methods are not restricted to the maintenance periods and give this opportunity to measure the features at in-service conditions like operation temperature and voltage stress. Both off-line and on-line measurements are complementary and give the trend of the changes in the insulation for condition monitoring and asset management. For some components such as power transformer bushings, comparison of the results for each phase with other phases which are in the same ambient condition can also be useful in diagnostics of them. Considering the trend of the changes in the parameters of the insulation and their relative values is a useful way for diagnostics especially in on-line measurements to decrease the needed sensitivity for instrument calibration.
Table 3.1: Typical defects and failure modes of HV bushings [28]
Component Defect Failure Mode Condenser core
(Primary defects) Residual Moisture Poor impregnation Wrinkles in the paper Delaminated paper
Ionization Gassing Thermal runaway
Condenser core
(Aging defects) Overstressing Short circuit layer Ingress of moisture Graphite ink migration Dielectric overheating
Puncture Explosion
Condenser core
(Aging, Bulk nature defects)
Aging of oil-paper body Thermal unstable oil Gas unstable oil Oversaturation
Flashover Explosion
Core surface Contamination Moisture contamination Aging
Partial discharge Surface discharge Gassing
Oil and oil-impregnated paper Internal Porcelain surface Deposited impurities Taps Shorted electrodes
Not grounded Partial discharge
External porcelain Cracks Contamination Surface discharge
Flashover

9
3.1 Off-line diagnostics Power transformers are expensive components with costly and time consuming
replacement. Therefore, monitoring of them and their bushings has great value. Insulation degradation is an origin of most of failures in these components. Oil- impregnated paper is a major insulation in power transformers and their bushings. It degrades faster at higher operating temperature and its degradation accelerates in the presence of moisture. Several chemical and electrical diagnostic methods are available for on-line and off-line monitoring of power transformers. Some of the most commonly used techniques are addressed in this chapter.
3.1.1 Chemical techniques Moisture analysis of oil by Karl Fischer titration is done to determine the moisture
content of the oil; through different equilibrium curves [29], the moisture content of the paper can be estimated. Near Infrared spectroscopy (NIR) is also used for determination of oil-impregnated paper moisture content [9].
Dissolved Gas Analysis (DGA) is another chemical technique that is widely used for fault detection by analysis of dissolved gases in transformer oil. These gases can be produced by degradation of the oil and the solid insulation such as paper and pressboard. Healthy transformers should have less than 0.05 ml of combustible gases per 100 ml of oil, and a trivial amount of higher hydrocarbon gases [2]. Three main sources of fault gases are: corona and partial discharge, thermal over-heating and arcing.
An IEEE standard has issued more detailed information on list of gases and relation of their amount to the type of faults [3].
Degree of Polymerization (DP) measurement is a way to determine the mechanical properties of cellulose and is also used as a diagnostic tool for condition assessment of transformers [4].
Furan analysis by chromatography is another diagnostic method for transformer paper [5]. Furans are a major product of paper degradation.
3.1.2 Electrical diagnostic methods Electrical diagnostic methods are categorized as Time Domain and Frequency
Domain. Polarization and Depolarization Current (PDC) measurement is a time domain diagnostic method. This measurement is based on applying step voltage for long time such as 10 000 seconds. Polarization current through the insulation, affected by different polarization mechanisms with different time constants in the insulation, is measured. The conductivity of the insulation also contributes to the current. Then, by short-circuiting the object, a discharge (depolarization) current flows, in the opposite direction. This current does not have a contribution from conduction. Insulation properties show an effect on the polarization and depolarization current. PDC is mostly used to determine moisture content of oil-impregnated paper and oil conductivity [30], [31].
Frequency Domain Spectroscopy (FDS) gives dielectric properties such as loss-tangent as a function of frequency. A sinusoidal voltage with varied frequency is applied to the test object, and the total current is measured through the object. From the measured
10
voltage and current, the impedance of the object is calculated as a function of the frequency.
Return Voltage Measurement (RVM) is another time-domain method that has a quite similar procedure to PDC. The voltage placed over dielectric after opening the short circuited DC applied voltage is called return voltage. This voltage is produced by bound charges under the effect of polarization [10], [11]. The RVM method is also useful but more sensitive to systematic errors than the other two methods [8].
The disadvantage of time domain measurement techniques such as PDC and RVM versus frequency domain spectroscopy FDS is their sensitivity to disturbances of the DC source. These techniques are mostly useful at low frequencies with high loss dielectrics [32].
FDS is a narrow band technique that can increase the accuracy of the results by filtering. For low frequencies, it takes long time to perform the measurement because of several sinusoidal periods that must be recorded. Therefore, this technique is more preferable at high frequencies. However, recently a new accelerating FDS measurement is proposed by measuring multiple sinusoidal oscillations simultaneously [12].
3.2 On-line Monitoring Off-line diagnostics are mostly done in the maintenance periods of power
transformers. On the other hand, to have reliable power systems, on-line monitoring of these components gets necessary. There are some on-line methods besides the off-line diagnostics for condition assessment of power transformers to implement monitoring and evaluating the trend of the changes in their insulation system. Also, a considerable percentage of power transformer failures is caused by failure of their bushings. Some of the most common used on-line monitoring techniques for both power transformer and its bushing are summarized in Table 3.2 [14], [15].
Table 3.2: on-line monitoring techniques for power transformers and their bushings
Technique Application Dissolved gas analysis Detecting certain key gases in the oil that
can help in the detection and identification of incipient fault conditions
Moisture in oil Moisture, heat and oxygen are key conditions that indicate accelerated degradation of cellulose
Oil temperature Overheating can cause transformer failure. Oil temperature beside other parameters can determine overall temperature condition of transformer
Partial discharge measurement Significant increase in level or rate of PD can indicate changes inside transformers which may lead to complete breakdown.

11
Load current and voltage Maximum loading of transformers is restricted by the temperature. On-line monitoring of current and voltage coupled with temperature measurements can provide a means to gauge thermal performance.
Insulation Power Factor Power factor of leakage current from the applied AC voltage indicate dielectric loss
Relative Tan Delta And Relative Capacitance Measurements at power frequency
Relative tan delta and capacitance measurement of one unit to other similar ones installed in the same station. Comparing sufficient number of instrument transformers with each other can indicate changes in one unit compared to other similar ones.
Acoustic Monitoring For detection and location of PD Bushing Power Factor And Capacitance Measurements
It can be done through sum current method [14] or voltage tap of bushing [16]. Sum current is unique for each set of bushings and their condition can be evaluated through the changes in the sum current phase.

12
13
4 Experimental evaluation method
4.1 Dielectric Response This section provides the theory behind the calculation of the involved parameters in
the diagnostics of oil-impregnated paper insulation systems. Dielectric polarization is a dynamic behavior of dielectric material in the presence of
electric field E. In good insulation, polarization is the dominant factor in the current measured through the insulation. Electric displacement D increases by Polarization, P:
0D E Pε= + (4.1)
where, ε0 is permittivity of free space. Dielectric polarization is a consequence of positive and negative charge displacement. Several polarization mechanisms are defined in dielectrics. There exist mechanisms so fast that they have no dynamics in our frequency range of interest. Dipolar polarization is a slower mechanism which belongs to permanent dipoles that get excited in an electric field. In the presence of electric field, the dipoles will only be partly oriented and still a linear relation between E and P can be assumed [33]. Interfacial polarization is a slow phenomenon that commonly appears in combinations of different dielectric materials such as oil-impregnated paper. The difference between dielectric properties in the materials forces charges to move into the interfaces. Another mechanism is polarization by hopping charge carriers in which dipoles are created at localized hopping site. In all of these mechanisms, the electric field cannot force the charges to escape from the material [33]. The time dependence of polarization can be defined as a function of dielectric response function f(t). This is a decaying function in time and relates polarization P to an electric field E:
( ) ( ) ( )00
t
P t f t E t dε τ τ= −∫ (4.2)
Beside the polarization, conductivity of the dielectrics also takes part in current density generated in the dielectric by the applied electric field E. The current density j(t) is defined as the sum of conduction and total displacement current:
14
( ) ( ) ( )0
dD tj t E t
dtσ= + (4.3)
where σ0 is the DC conductivity of the material. By replacing the electric displacement and polarization formula in (4.3), the current density can be written as:
( ) ( ) ( ) ( ) ( )0 0 00
tdE t dj t E t f t E t ddt dt
σ ε ε τ τ= + + −∫ (4.4)
Dielectric properties can be defined also in the frequency domain. By the Fourier transform, the current density in the time domain can be transformed to the frequency domain. Assume an ideal plate capacitor with an area A and gap distance d filled by a dielectric. By replacing the electric field with the applied voltage .V d E= and the current density with current .I j A= , the relation between current and voltage phasors is shown in terms of the complex capacitance:
( ) ( ) ( )( ) ( )I j C jC Vω ω ω ω ω= −′ ′′ (4.5)
where the real part Cʹ refers to a capacitive effect and imaginary part Cʺ refers to a loss effect in the dielectric. The complex capacitance is geometry dependent and can be written in terms of the geometric capacitance C0 and the complex dielectric permittivity ε(ω) :
( ) ( ) ( ) ( )0C C jC Cω ω ω ε ω′ ′ =′= − (4.6)
Geometric capacitance is also known as vacuum capacitance. This is the capacitance of the pair of electrodes without any dielectric within their gap.
Usually dielectric loss is shown by a quantity that is geometry-independent and is termed the loss tangent:
tan CC
δ′′′
= (4.7)
in which δ is the dielectric loss angle. It is a material property that can be obtained by measurement of voltage and current.
To obtain the dielectric response of the insulation system, a voltage is applied to the system, and the current that flows through the insulation is measured. From the measured current and voltage, insulation properties such as tan δ, Cʹ and Cʺ can be calculated. To have more accurate measurement, surface currents must be avoided. A guarded test-cell helps to reduce the effect of surface currents.
15
High voltage equipment such as power transformers and their bushing have a complex insulation system of oil and paper. The dielectric response of such components is mostly used for condition assessment rather than finding material properties. Condition assessment is done by comparing the dielectric response of the component with past results or other similar components.
4.2 Temperature effect Dielectric response is a temperature dependent characteristic. This dependency
originates from the fact that DC conductivity and polarization processes both depend on the temperature. In the measurement, it is not possible to differentiate between the current caused by the conductivity from the current caused by the polarization. Therefore apparent loss factor can be defined as:
0,
0
'' ''r App rσε εωε
= + (4.8)
where σ0 is the DC conductivity, ω is the angular frequency and εr′′ is the dielectric loss factor. The value of ε′′r,App is also moisture dependent and increases with increasing moisture content.
In oil-impregnated paper insulation, the loss peak frequency follows the Arrhenius temperature dependence [34] as the following expression which relates the loss peak frequency with the temperature:
( ) ( )a
B 2 1
E 1 1k T T
2 1T T .ep pω ω
− − = (4.9)
where ωp is the peak frequency at temperature T1 or T2, Ea is the activation energy and kB is the Boltzmann constant.
By increase in the temperature compared to the reference temperature, the dielectric response shifts toward higher frequencies by preserving the shape. Arrhenius activation process describes this temperature dependency [35].
4.3 Dielectric Spectroscopy by Utilizing Power System Transients
4.3.1 Application The proposed technique can be used for assessing moisture content and temperature in
the oil-impregnated insulation system such as power transformers and their bushings. Moisture content in the oil-impregnated paper affects the dielectric response in high and low frequencies. Also, by temperature increase, the response shifts to higher frequencies. Loss tangent is a factor that is mostly affected by the moisture content and temperature [36]-[40]. In a complex insulation system such as oil and paper, moisture does not distribute evenly and is temperature dependent. Therefore by analyzing the moisture

16
content of the oil, moisture content of the paper cannot be interpreted directly. In order to estimate the moisture content of the paper and pressboard directly, on-line dielectric spectroscopy during the operation of the transformer must be done. To have accurate on-line dielectric spectroscopy on transformers and their bushings in the field, several parameters must be considered [41].
The existing off-line FDS method and the similar time-domain ones can only be used in maintenance periods and cannot continually monitor the aging trend of the component. The proposed technique in this thesis is the diagnostic technique with the ability of presenting dielectric response during the operation of the transformer more often than off-line methods. By measuring the transients at the terminal of the power transformer bushings as the stimuli voltage and measuring the current through the test tap of the bushings, the complex impedance of the bushing insulation can be calculated.
By a discrete Fourier transform the measured signal with wide range of frequency transforms to phasors and different spectral components get separated. The frequency content of the signals is limited by the level of the noise and bandwidth of the signal. The signal-to-noise ratio must be high and well defined and dielectric response spectrum will be determined by the frequency content of the transient. As a consequence of the duration and damping of transients such as lightning and switching, there is practically no spectrum below 10 Hz. This is a drawback for this method compared to off-line FDS but still moisture content [13] and temperature can show their effect in high frequencies.
4.3.2 Circuit Modeling To check the performance of the proposed technique, several experiments were done in
the laboratory on sample objects. Measurement considerations are described in this section. In order to have accurate measurement, a minimal number of components in the circuit should be used to reduce the complexity of the system and avoid unknown or poorly known parameters in the circuit, and they must be stable and well modelled (Figure 4.1, Figure 4.2). It is worth to mention that all the cables in the measurement circuit apart from very short connections are coaxial cables.
• Response current measurement: shunt When a transient voltage is applied, the current through the insulation is measured
using a shunt impedance. For reconstructing the main signal from the measured voltage from the shunt, all elements in the circuit must be considered.
Magnetic components such as a Pearson coil are avoided in order to reduce the complexity of the circuit; their performance has not been found as accurate as the performance of the shunt for dielectric response measurement.
A parallel combination of resistive and capacitive shunt is used for the measurements. Because of the capacitive nature of the test object, a capacitive shunt is of interest, to maintain the strength of the output signal at all frequencies. In order to control the leakage current and avoiding floating potential, a relatively high resistance is used in parallel with the shunt capacitor [42]. The resistance should not have much lower impedance than the capacitor, even towards the low part of the frequency range, so the capacitor gets the dominant current path.

17
Test Object
L1
Rt CtShunt
Vin
Input impedance of the oscilloscope and
capacitance of coaxial cables
Inductance of cables
0.1µ H
VoutL2 R2
R1
shC
Figure 4.1: Circuit model of the LV measurement system
Test Object
Vin
Input impedance of the oscilloscope and
capacitance of coaxial cables
Inductance of cables
CST
SSS
Cable
Attenuator
Voltage divider
VoutL2
L1
R1
ProtectionCircuit
R2
Shunt
Resistance of cables and
connections
shC
Figure 4.2: Circuit model of the HV measurement system
• Coupling path and Cables Because of the high accuracy that is needed for dielectric response measurement,
parameters such as cable inductances and stray capacitance at high frequency also
18
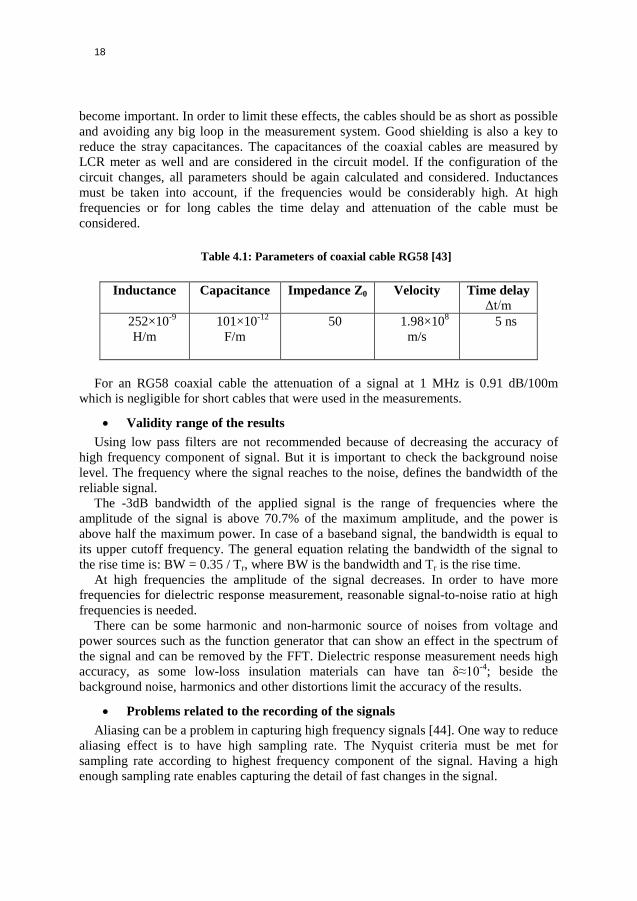
become important. In order to limit these effects, the cables should be as short as possible and avoiding any big loop in the measurement system. Good shielding is also a key to reduce the stray capacitances. The capacitances of the coaxial cables are measured by LCR meter as well and are considered in the circuit model. If the configuration of the circuit changes, all parameters should be again calculated and considered. Inductances must be taken into account, if the frequencies would be considerably high. At high frequencies or for long cables the time delay and attenuation of the cable must be considered.
Table 4.1: Parameters of coaxial cable RG58 [43]
Inductance
Capacitance
Impedance Z0 Velocity Time delay Δt/m
252×10-9 H/m
101×10-12 F/m
50 1.98×10⁸ m/s
5 ns
For an RG58 coaxial cable the attenuation of a signal at 1 MHz is 0.91 dB/100m
which is negligible for short cables that were used in the measurements.
• Validity range of the results Using low pass filters are not recommended because of decreasing the accuracy of
high frequency component of signal. But it is important to check the background noise level. The frequency where the signal reaches to the noise, defines the bandwidth of the reliable signal.
The -3dB bandwidth of the applied signal is the range of frequencies where the amplitude of the signal is above 70.7% of the maximum amplitude, and the power is above half the maximum power. In case of a baseband signal, the bandwidth is equal to its upper cutoff frequency. The general equation relating the bandwidth of the signal to the rise time is: BW = 0.35 / Tr, where BW is the bandwidth and Tr is the rise time.
At high frequencies the amplitude of the signal decreases. In order to have more frequencies for dielectric response measurement, reasonable signal-to-noise ratio at high frequencies is needed.
There can be some harmonic and non-harmonic source of noises from voltage and power sources such as the function generator that can show an effect in the spectrum of the signal and can be removed by the FFT. Dielectric response measurement needs high accuracy, as some low-loss insulation materials can have tan δ≈10-4; beside the background noise, harmonics and other distortions limit the accuracy of the results.
• Problems related to the recording of the signals Aliasing can be a problem in capturing high frequency signals [44]. One way to reduce
aliasing effect is to have high sampling rate. The Nyquist criteria must be met for sampling rate according to highest frequency component of the signal. Having a high enough sampling rate enables capturing the detail of fast changes in the signal.

19
Using an anti-aliasing filter that attenuates signals above the Nyquist frequency is another solution to avoid aliasing. But still in practice this may distort the desired frequency contents. Its response should also get modeled in the circuit which itself increase the complexity of the circuit.
Another problem that may occur in the measurements and affects the results is crosstalk. Coupling of wires and mutual inductances and capacitances would affect the accuracy of the measured signal. To reduce this effect, distance between the wires must be placed as far as possible and return currents should be encouraged to flow in the same cables as the corresponding outgoing currents. Also, depending on the quality of the oscilloscope or data acquisition system for the high frequency measurement, crosstalk may happen between the input channels. At high voltages, because of dependency of some parameters on voltage, there can be some deviation in measurement according to the crosstalk. But still it is possible to keep the calibration error at sufficiently reasonable level.
• Equipment protection To protect the oscilloscope in case of test object breakdown during application of high
voltage impulses, a protection circuit is used. The chosen protection circuit has an inductance in series with the input and a Zener diode between the input and ground, to restrict both high current and high voltages. The chosen diode must be fast enough to be able to operate in ns scale. Another back-up protection, a gas discharge tube is also placed in parallel with the shunt, but the operation time of this element is in the range of µs. The selection of these elements must be done in a way that they don’t clamp the desired voltage and at the same time they operate at the voltage below the maximum input voltage of the oscilloscope. The transfer function of the protection circuit is plotted in Figure 4.3. The changes in the amplitude and the phase caused by the protection circuit are smaller than the values that can affect the desirable accuracy in this project.
Figure 4.3: Transfer function of the protection circuit
102
104
106
0.997
0.9975
0.998
0.9985
0.999
0.9995
frequency [Hz]
| Vou
t / V
in |
102
104
106
-0.02
-0.01
0
0.01
0.02
0.03
0.04
frequency [Hz]
phas
e shif
t [de
g] Vo
ut w.
r.t. V
in

20
• Data Analysis To extract the considered data (test object complex capacitance) from the measured
signals (Vin, Vout) a simple circuit equation must be solved (Figure 4.1). Two configurations for the circuit model have been considered, refer to the lines
plotted in Figure 4.1: 1) with red dash line 2) with blue dash-dot line. They have been investigated for sensitivity analysis of the elements in the circuit. The network function H(ω) that represents the circuit regarding the first configuration can be written in terms of circuit elements in frequency domain:
( )( )
2
2 2 1
|| Z( ) .
|| ZZ
HZ Z
ZV ZV Z Z Z Z
ω+
= =+ + + +
t shout t
in t t sh test object
(4.10)
where Zt=Rt||Ct, Rt is the input resistance of the oscilloscope and Ct is a parallel combination of input capacitance of the oscilloscope and coaxial cable capacitances. Z1=R1 +jωL1 and Z2=R2 +jωL2 in which R1, R2, L1, and L2 are resistances and inductances of the cable links. Zsh=1/jω shC in which shC is the complex capacitance of the shunt. Then, by simplifying the formula, the impedance of the test object would be:
( )( ) ( )2
2 12
. || Z|| Z
( )Z Z
Z ZZ
Z ZH ZZω
+= − + −
+t t sh
test object t sht
(4.11)
As the aim is to identify the complex capacitance of the test object, a calculation of the admittance is needed.
( ) ( ) 2 2 1
( ).Z ( ). || Z/
HZ H Z
YZ ZZ Z Z
ωω+
=+ − + +
test objectt sh t sh t sh
(4.12)
For the second circuit configuration, the transfer function of the measured signal relates to the other elements in the circuit through the following equation:
( )( )
2
2 1
|| Z( )
|| ZZV Z
HZ ZZ ZV
ω+
= =+ + +
sh t
sh t
out
in test object
(4.13)
Then after simplification of the equation, the test object impedance is defined as:
( ) ( )2 2 1
|| Z|| Z
( )Z
Z ZH
ZZ Z
ω+
= − + −sh tsh ttest object
(4.14)
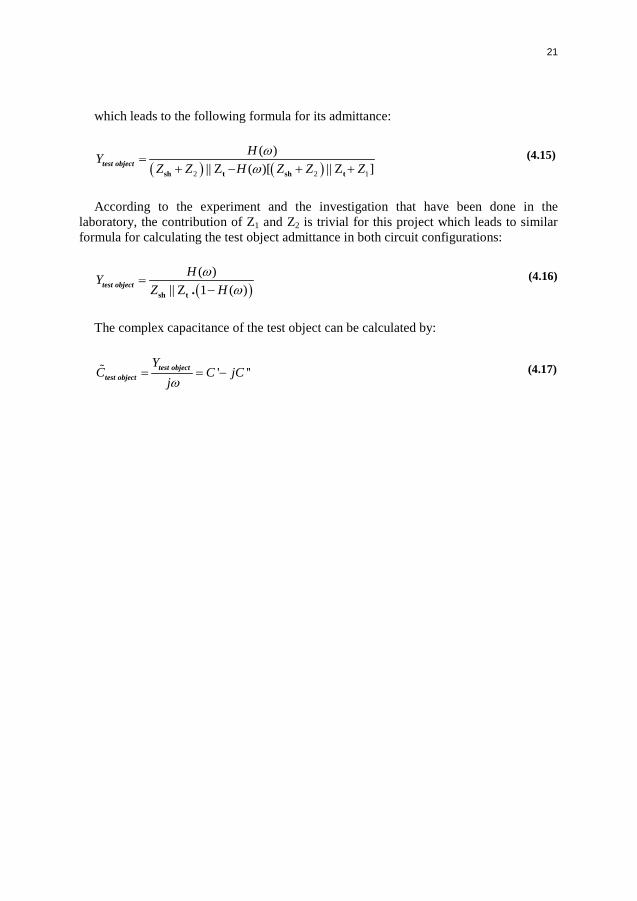
21
which leads to the following formula for its admittance:
( ) ( ) 2 2 1
( )|| Z ( )[ || Z ]
HZ H Z Z
YZ Z
ωω
=+ − + +sh t sh t
test object (4.15)
According to the experiment and the investigation that have been done in the laboratory, the contribution of Z1 and Z2 is trivial for this project which leads to similar formula for calculating the test object admittance in both circuit configurations:
( ) ( )
|| Z 1 ( )Y
ZH
Hω
ω=
−sh ttest object .
(4.16)
The complex capacitance of the test object can be calculated by:
' ''C
YC
jjC
ω= = −
test objecttest object
(4.17)

22
23
5 Experimental Results on Oil-impregnated paper
The major insulation part of the power transformers and their bushings is oil-
impregnated paper. Therefore in order to investigate the effectiveness of the proposed technique in diagnostics of such components, measurement on oil-impregnated paper as a sample object can be a good representative. One of the major problems that causes failure in power transformers and their bushing is degradation of their insulation [45]. Any defects such as partial discharge and moisture in the insulation can decrease the electrical strength and accelerate the aging process. In this chapter the effect of different moisture content levels and temperature on the dielectric response of oil-impregnated paper is investigated. The major aim is to check the performance of condition diagnostics by utilizing power system transients. As it was mentioned before, the chemical techniques that can be used during the operation period of the transformers can only define the moisture content of the paper from equilibrium curves; methods for direct estimation of moisture content on paper insulation are of interest. Moisture and temperature are two effects that make changes in dielectric response both in low and high frequencies. Therefore, their effect at high frequencies must be able to be seen by the proposed technique which mostly covers frequencies above 10 Hz. The results in this chapter are mainly published in paper I and submitted as paper II.
5.1 Low Voltage measurement
5.1.1 Experimental set up In the first part of the experiment, 16 layers of oil-impregnated paper were used as a
sample object. The type of the paper is Munksjö Thermo 70 with a thickness of 100 µm. Steel electrodes with a guard-ring were used in the measurement. The reason for using electrodes with a guard is to avoid surface leakage currents and having homogeneous electric field. Low voltage impulses following the wave shape of standard lightning (1.2/50µs) and switching (250/2500µs) impulses [46] with 10 V peak were applied to the test cell by an Agilent 33120A function generator, Figure 5.1. For investigation of the moisture content, the voltages from the source and shunt were measured on two channels of a Tektronix TDS3052 oscilloscope, using full bandwidth 500 MHz and dc coupling, at a maximum sample rate of 10 MSa/s. The results triggered from 16 impulses were averaged in the oscilloscope. The averaging was done to increase the accuracy of the results which was not achievable with the existing oscilloscope memory. For
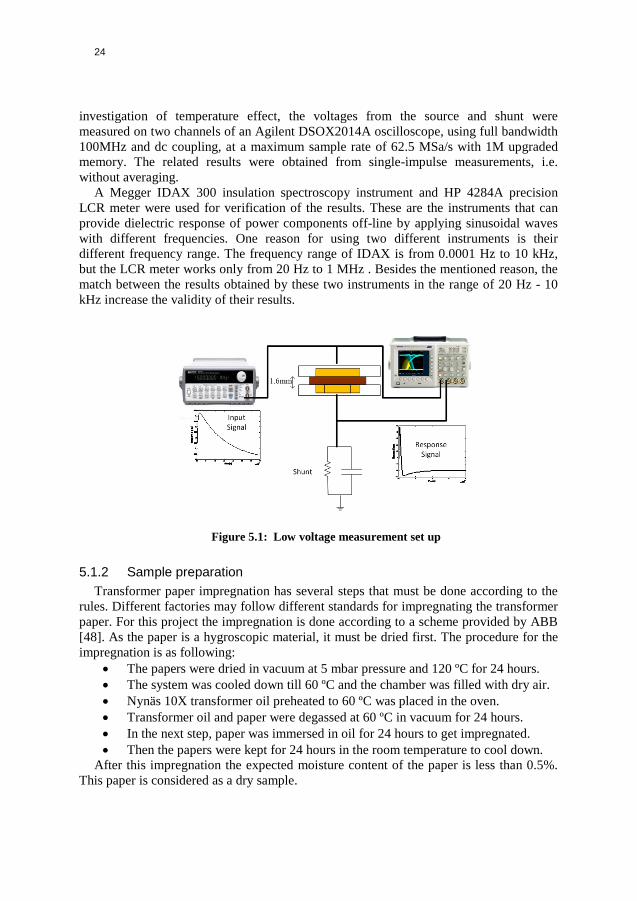
24
investigation of temperature effect, the voltages from the source and shunt were measured on two channels of an Agilent DSOX2014A oscilloscope, using full bandwidth 100MHz and dc coupling, at a maximum sample rate of 62.5 MSa/s with 1M upgraded memory. The related results were obtained from single-impulse measurements, i.e. without averaging.
A Megger IDAX 300 insulation spectroscopy instrument and HP 4284A precision LCR meter were used for verification of the results. These are the instruments that can provide dielectric response of power components off-line by applying sinusoidal waves with different frequencies. One reason for using two different instruments is their different frequency range. The frequency range of IDAX is from 0.0001 Hz to 10 kHz, but the LCR meter works only from 20 Hz to 1 MHz . Besides the mentioned reason, the match between the results obtained by these two instruments in the range of 20 Hz - 10 kHz increase the validity of their results.
Figure 5.1: Low voltage measurement set up
5.1.2 Sample preparation Transformer paper impregnation has several steps that must be done according to the
rules. Different factories may follow different standards for impregnating the transformer paper. For this project the impregnation is done according to a scheme provided by ABB [48]. As the paper is a hygroscopic material, it must be dried first. The procedure for the impregnation is as following:
• The papers were dried in vacuum at 5 mbar pressure and 120 ºC for 24 hours. • The system was cooled down till 60 ºC and the chamber was filled with dry air. • Nynäs 10X transformer oil preheated to 60 ºC was placed in the oven. • Transformer oil and paper were degassed at 60 ºC in vacuum for 24 hours. • In the next step, paper was immersed in oil for 24 hours to get impregnated. • Then the papers were kept for 24 hours in the room temperature to cool down.
After this impregnation the expected moisture content of the paper is less than 0.5%. This paper is considered as a dry sample.

25
5.1.3 Humidity control process To see the effect of the moisture on the dielectric response of oil-impregnated paper,
several moisture levels were investigated. For humidity control of oil-impregnated paper there are some common methods like using a humidity generator or a closed chemical system by saturated salt solution. The closed chemical system is more common. In order to use this method, dried and impregnated papers were placed in a desiccator in presence of saturated salt solutions.
The relative air humidity achieved by three different salts at different temperatures is shown in Table 5.1. These three salts were used to get three different moisture levels in oil-impregnated paper. Dry samples were placed in three desiccators with each of these saturated salts at room temperature (20 - 23 ºC). It takes several days for the system to get to equilibrium at the expected relative humidity. Also, the moisture diffusion time for oil-impregnated paper with 100 µm thickness at room temperature is about 2 hours [47]. Therefore the system was kept for 5 days to ensure the moisture in the paper had reached the desired equilibrium.
There are several ways to determine the moisture content of oil-impregnated paper. Karl Fischer titration is a classic method in chemistry that determines water content in a sample by using coulometric or volumetric titration. This method uses the reaction of water with iodine and sulfur dioxide in the presence of an alcohol and a base. Weighing the sample with a high precision scale before and after humidifying can also determine the moisture content of the paper. According to Table 5.2 [48] a moisture content of 2.4%, 3.0% and 5%, were achieved for the paper from the saturated salt solutions.
Table 5.1: Relative Humidity Variations with Temperature of Saturated Salt Solutions [49]
Salt Relative humidity (%) Temperature (ºC) 10 20 30 40 Lithium chloride 14 12 11 11 Potassium acetate 24 23 23 23 Sodium bromide 58 57 57 57
Table 5.2: Relative air humidity of saturated salts and corresponding moisture content of impregnated paper at room temperature (20ºC) [48]
Salt Relative air humidity (%) at 200C
Moisture content of paper (%)
Lithium chloride 12 2.4
Potassium acetate 23 3.0
Sodium bromide 57 5.5

26
5.1.4 Measurement consideration Shunt selection has been done according to the type of transients that are used as
stimuli and their rise time. The measurement shunt consisted of a parallel 100 kΩ and 1nF resistive and capacitive shunt for measuring the response of the paper sample subjected to lightning impulses, and a 2 nF capacitive shunt was used for measurement of switching responses.
Due to the lower range of frequencies in switching impulses, a different shunt was used from the one for lightning impulses. To have a better understanding of the shunt behavior, the absolute value of the transfer function of the system (H(ω)=Vout/Vin) formed by the test object and the shunt is plotted in Figure 5.2. The test object is supposed to be 16 layers of dry oil-impregnated paper with a capacitance of about 42 pF. The system operates as a high pass filter. This figure shows that the chosen shunt for switching impulses keep the strength of the signal at the lower frequency components compared to one chosen for lightning impulses.
In order to choose a proper shunt which covers all transients that can be captured in the field, the bandwidth of the system consist of the shunt, must be wide enough. The validity range of the dielectric responses obtained by the transients cannot go far beyond their -3 dB bandwidth. For a standard lightning impulse, the -3 dB bandwidth is about 300 kHz and for a switching impulse it is about 2 kHz.
Figure 5.2: Absolute value of transfer function for the shunt and sample object
101
102
103
104
105
106
10-6
10-5
10-4
10-3
10-2
10-1
Frequency [Hz]
Abs
olut
e va
lue
of tr
ansf
er fu
nctio
n |H
( ω)|
Parallel resistive and capacitive shuntCapacitive shunt

27
5.1.5 Results on moisture content effect Results for dielectric response obtained by lightning and switching impulses applied to
the dry and moisturized sample are presented in both Papers I and II. The dielectric response of each sample was measured before and after humidifying, by transient response and by the commercial instruments IDAX and LCR meter.
As was mentioned before, switching responses have lower frequency components compared to the lightning responses and the frequency-range of reliable results depends on the bandwidth of the signal. Therefore, the results are plotted in that reliable range and when the response get further from the bandwidth, the signal to noise ratio get much smaller and is not reliable any more. The results for switching response are plotted up to 2 kHz and for lightning response up to 100 kHz. Due to the frequency range of the IDAX and LCR meter, results from the LCR meters cover lightning response, and results from both IDAX and LCR meter can be used for verification of switching responses, as shown in Figure 5.3 to Figure 5.8.
Comparison of all three samples with their corresponding moisture content is shown in Figure 5.9. The real capacitance of the sample with 3.0% moisture content is lower than the sample with 2.4% moisture content only due to the different paper samples. It is almost impossible to have exactly two similar oil-impregnated paper samples. However, loss tangent as a geometry independent factor can show the correct sequential change due to the moisture levels (Figure 5.9). The ability of the proposed technique through lightning and switching responses in following the trend of the change in status of the paper can be concluded from the both figures.
In oil-impregnated paper with moisture contents below 2%, the change in the loss tangent is not considerable in the frequency range of considered transients. Therefore, it is expected that the detectable moisture level with this technique would be above 2%.
Often, moisture content above 3% is considered as a warning level, but this varies according to the policy of different companies and power grid operators.

28
Figure 5.3: Capacitance of the sample with 2.4% moisture content
Figure 5.4: Loss tangent measured for sample with 2.4% moisture content
102
103
104
105
3.8
4
4.2
4.4
4.6
4.8
5x 10
-11
Frequency (Hz)
C'
[F]
LCR meter- dry sampleLCR meter- sample with moistureIDAX- dry sampleIDAX-sample with moistureSwitching response- dry sampleSwitching response-sample with moistureLightning response- dry sampleLightning response-sample with moisture
101
102
103
104
105
106
-0.02
-0.01
0
0.01
0.02
0.03
0.04
0.05
Frequency (Hz)
tan δ
LCR meter- dry sampleLCR meter- sample with moistureIDAX- dry sampleIDAX-sample with moistureSwitching response- dry sampleSwitching response-sample with moistureLightning response- dry sampleLightning response-sample with moisture

29
Figure 5.5: Capacitance of the sample with 3% moisture content
Figure 5.6: Loss tangent measured for sample with 3% moisture content
102
103
104
105
3.8
4
4.2
4.4
4.6
4.8
5x 10
-11
Frequency [Hz]
C'
[F]
LCR meter- dry sampleLCR meter- sample with moistureIDAX- dry sampleIDAX-sample with moistureSwitching response- dry sampleSwitching response-sample with moistureLightning response- dry sampleLightning response-sample with moisture
101
102
103
104
105
106
-0.03
-0.02
-0.01
0
0.01
0.02
0.03
0.04
0.05
0.06
0.07
Frequency [Hz]
tan δ
LCR meter- dry sampleLCR meter- sample with moistureIDAX- dry sampleIDAX-sample with moistureSwitching response- dry sampleSwitching response-sample with moistureLightning response- dry sampleLightning response-sample with moisture

30
Figure 5.7: Capacitance of the sample with 5.5% moisture content
Figure 5.8: Loss tangent measured for sample with 5.5% moisture content
101
102
103
104
105
106
3
4
5
6
7
x 10-11
Frequency [Hz]
C'
[F]
LCR meter-dry sampleLCR meter-sample with moistureIDAX-dry sampleIDAX-sample with moistureSwitching response-dry sampleSwitching response-sample with moistureLightning response-dry sampleLightning response-sample with moisture
101
102
103
104
105
106
0
0.05
0.1
0.15
0.2
0.25
0.3
Frequency [Hz]
tan δ
LCR meter-dry sampleLCR meter-sample with moistureIDAX-dry sampleIDAX-sample with moistureSwitching response-dry sampleSwitching response-sample with moistureLightning response-dry sampleLightning response-sample with moisture

31
Figure 5.9: Capacitance and loss tangent of all samples with moisture content
5.1.6 Temperature effect To test the proposed technique, on the effect of the temperature, 16 layers of oil-
impregnated paper placed between steel electrodes with a guard-ring and immersed in the transformer oil were tested.
To have the closest results to reality, the temperature effect was investigated on oil-impregnated paper with low level of moisture content. As it was not the aim of this project to see the effect of the moisture and temperature together, the exact moisture content of the paper was not measured. It is expected that the paper has moisture content of less than 0.5% after impregnation.
The test cell was kept in a Weiss Technik climate chamber at room temperature 21ºC. The measurement was done by applying low-voltage lightning and switching impulses
101
102
103
104
105
106
3
4
5
6
7
x 10-11
Frequency [Hz]
C'
[F]
LCR meter-2.4% moistureIDAX-2.4% moistureSw itching response-2.4% moistureLightning response-2.4% moistureLCR meter-3.0% moistureIDAX-3.0% moistureSw itching response-3.0% moistureLightning response-3.0% moistureLCR meter-5.5% moistureIDAX-5.5% moistureSw itching response-5.5% moistureLightning response-5.5% moisture
101
102
103
104
105
106
0
0.05
0.1
0.15
0.2
0.25
0.3
Frequency [Hz]
tan δ
LCR meter-2.4% moistureIDAX-2.4% moistureSw itching response-2.4% moistureLightning response-2.4% moistureLCR meter-3.0% moistureIDAX-3.0% moistureSw itching response-3.0% moistureLightning response-3.0% moistureLCR meter-5.5% moistureIDAX-5.5% moistureSw itching response-5.5% moistureLightning response-5.5% moisture

32
from a function generator to the test cell, with the response currents measured using a shunt. The same shunts were used as in the last section: parallel 100 kΩ and 1 nF resistive and capacitive shunt for lightning responses, and 2 nF capacitive shunt for switching responses.
As a reference measurement, the dielectric response of the sample was also measured by the IDAX and LCR meter.
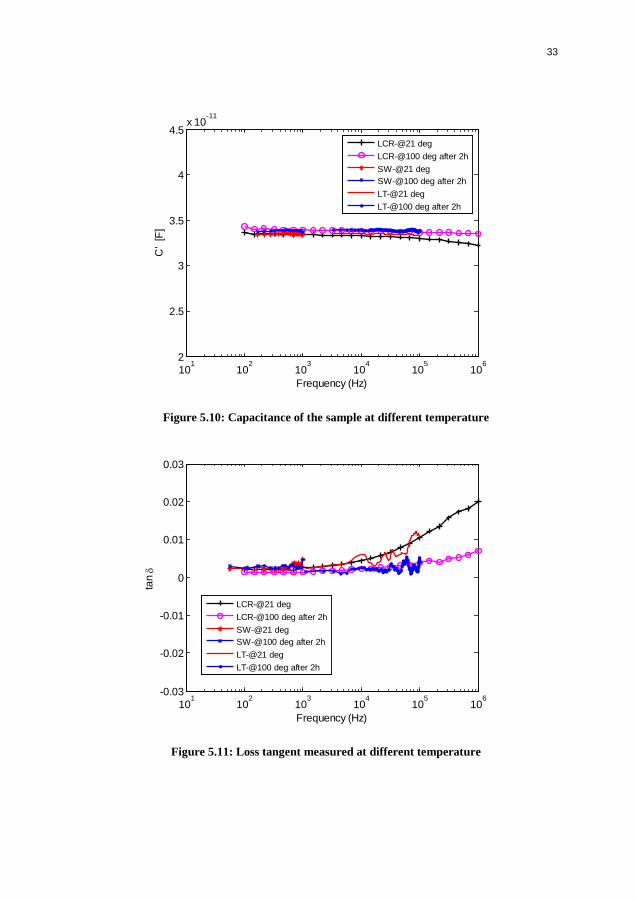
Then the temperature was increased to 100 ºC and kept for two hours at that temperature before making the measurements. The effect of the temperature on the oil-impregnated paper is a shift of the loss-tangent in frequency. Although the change of the dielectric response by only the effect of the temperature is not as much as the effect of the moisture or combination of the temperature and moisture, it still can be seen at high frequencies.
The results are shown in Figure 5.10 and Figure 5.11 for capacitance and loss tangent. As the loss tangents for both temperatures are very close for frequencies less than 1 kHz, the switching response of both are almost the same. However, for higher frequencies, the difference between the results is more visible and can be followed by the lightning responses.
According to the results, the change in the dielectric response of oil-impregnated paper only due to the temperature change is not considerable at the frequency range of considered transients. Through further studies it was found that the sensitivity of obtained dielectric response with transients in detecting the temperature change in the oil-impregnated paper is about 30 degree Celsius.
5.1.7 Discussion Through low voltage measurements, the new diagnostics technique on oil-impregnated
paper examined due to some defects by utilizing transients. Detection of moisture content and temperature as two important defects in oil-impregnated paper insulation investigated. Due to the moisture content and temperature increase, both the capacitance and loss tangent change with frequency. However, the changes caused by the moisture content are more considerable compared to the changes caused by the temperature variation.
According to the results, it can be concluded that dielectric response is achievable by the proposed technique for frequencies above 10 Hz and it can provide information on the dielectric properties similar to FDS. Although, there are some complication that limit the accuracy of the results, still the trend of the changes in the insulation due to the moisture content and temperature can be shown by this technique.
This approach will be valuable in on-line assessment of insulation degradation especially moisture content of oil impregnated paper in power transformers and their bushings.
33
Figure 5.10: Capacitance of the sample at different temperature
Figure 5.11: Loss tangent measured at different temperature
101
102
103
104
105
106
2
2.5
3
3.5
4
4.5x 10
-11
Frequency (Hz)
C'
[F]
LCR-@21 degLCR-@100 deg after 2hSW-@21 degSW-@100 deg after 2hLT-@21 degLT-@100 deg after 2h
101
102
103
104
105
106
-0.03
-0.02
-0.01
0
0.01
0.02
0.03
Frequency (Hz)
tan δ
LCR-@21 degLCR-@100 deg after 2hSW-@21 degSW-@100 deg after 2hLT-@21 degLT-@100 deg after 2h
34
5.2 High voltage measurement
5.2.1 Experimental set up For applying high voltage impulses to the oil-impregnated paper, another set up has
been used. 30 layers of oil-impregnated paper were used, in order to have enough impulse strength against the applied HV impulses. Brass electrodes surrounded by epoxy were used for this experiment. The epoxy helps to avoid surface discharges around the electrodes’ edges. The whole test cell was immersed in the transformer oil, Figure 5.12. To apply standard lightning impulse to the test sample, an impulse generator with 100 kV transformer, a voltage double rectifier and a two-stage impulse part was used.
The same oscilloscope as for the LV measurements, i.e. the Tektronix TDS3052 was used for capturing the signals. The value of the shunt and cable capacitances that is involved in the circuit is changed. In order to keep the oscilloscope input voltage acceptable in spite of the larger current in the shunt, a 0.1 µF capacitance in parallel with a 100 kΩ resistance was used as a shunt. Because of using a higher capacitance with higher voltage tolerance, its value is not as consistent as the smaller ones at high frequencies and the loss would also be higher. Therefore in order to have accurate modeling of the shunt, instead of using its component values, its frequency-dependent complex value measured by the LCR meter is used.
The capacitance of the coaxial cables has been measured and is considered in the circuit. Other components that are included in the high voltage measurement are a voltage divider and attenuator that reduce the voltage to the level which is measurable by the oscilloscope. The transfer functions of the HV divider and the attenuator have also been measured and modelled in the circuit. A high voltage divider with two standard capacitors, 500 pF as high impedance and 152 nF as low impedance capacitance with low loss, is used. The ratio of this divider is 308.3, so the signal needs further reduction to be able to connect it to the oscilloscope.
An attenuator with circuit diagram of Figure 5.13 with attenuation ratio of 30 is used. Its transfer function must be measured and considered in the circuit. This transfer function is measured by applying a sine wave to the attenuator and measuring the input and output voltages. The amplitude and phase of output voltage to the input voltage versus frequency is plotted in Figure 5.14.
Another way to measure high voltage impulses is through wideband high voltage probes. The probe is used after divider with ratio of 1000:1. Because of the voltage level that has been used (more than 40 kV), and overshoots and oscillations, there is a limit for connecting only the probe to the oscilloscope.

35
Figure 5.12: Sample object immersed in the transformer oil
0.999k Ω
52.6 Ω
1 MΩ 140pF
1 MΩ 140pF
1 MΩ 1 MΩ
4 branches
RT=4 MΩCT=34 pF
7 branches
RT=143 kΩCT=740 pF
Vout
Vin
1 MΩ 105pF 105pF 13pFOscilloscope
Figure 5.13: Circuit diagram of the attenuator

36
Figure 5.14: Transfer function of the attenuator
The contribution of the attenuator transfer function and divider ratio in admittance eq. (4.16) from chapter 4 can be shown as:
( )
1 1
1 1sh t
( )* * Y|| 1 ( )* *
atttest object
att
H H Divider ratioZ Z H H Divider ratio
ωω
− −
− −=
− (5.1)
where Hatt is the transfer function of the attenuator.
5.2.2 Sensitivity analysis In order to check sensitivity of the results and their accuracy to the circuit parameters,
calculations have been made on the circuit model of the system. Any element in series with the shunt such as resistance and inductance can affect the accuracy of the results for complex capacitance and in the case of their existence, they must be considered. Also, any deviation in value of the shunt from its real value can change the results. Specifically, the resistive part of the shunt affects the loss tangent more in lower frequencies.
Other things related to the sensitivity analysis were done. Magnification order of the oscilloscope channels and the signal resolution effect can affect the accuracy of the results and specifically the loss tangent.
102
104
106
0.0294
0.0296
0.0298
0.03
0.0302
0.0304
0.0306
0.0308| V
ch2
/ Vch
1 |
Frequency [Hz]10
210
410
6-0.8
-0.6
-0.4
-0.2
0
0.2
0.4
0.6
0.8
1
1.2
Frequency [Hz]
Pha
se s
hift
[deg
] Ch2
w.r.
t. C
h1

37
Test Object
Vin
Input impedance of the oscilloscope and
capacitance of coaxial cables
Inductance of cables
CST
SSS
Cable
Attenuator
Voltage divider
VoutL2
L1
R1
ProtectionCircuit
R2
Shunt
Resistance of cables and
connections
shC
Figure 5.15: HV measurement circuit model
5.2.3 Results By applying HV lightning impulse to the test object and measuring its transient
response through the shunt, the capacitance and loss tangent of the oil impregnated paper can be retrieved by the code considering all circuit parameters. The results are shown in Figure 5.16 and Figure 5.17. There is an acceptable agreement between the results obtained through the lightning response and the results from the LCR meter. The existence of some percentage of error or discrepancy between the methods is inevitable. However, more work can usefully be done to improve the precision of the measurement.
The results are presented for non-defective oil-impregnated paper insulation which has lower loss than degraded insulation. Therefore, it is more probable to detect the dielectric response of degraded insulation with a higher loss with the proposed technique.
5.2.4 Discussion The feasibility of dielectric response measurements on oil-impregnated paper systems
through applying HV lightning impulses was investigated. The measurement was done to check the proposed technique in relevance to a more realistic application. In the high voltage measurement, more components are needed to be modeled comparing to the low voltage measurement. HV divider and attenuator for measurement of the applied impulse must be modeled well to reach to reasonable accuracy for the dielectric response measurements. Electromagnetic compatibility concerns get more important in high voltage measurements. By considering all elements involved in the measurement circuit and the necessary criteria for data acquisition, it is possible to achieve reasonable accuracy in the dielectric response of oil-impregnated paper obtained from applied HV lightning impulses.

38
Figure 5.16: Capacitance of the sample obtained by lightning impulse
Figure 5.17: Loss tangent of the sample obtained by lightning impulse
102
103
104
105
106
8
8.5
9
9.5
10
10.5
11x 10
-11
Frequency (Hz)
C'
[F]
LCR meterHV Lightning response
102
103
104
105
106
-0.1
-0.08
-0.06
-0.04
-0.02
0
0.02
0.04
0.06
0.08
0.1
Frequency (Hz)
tan δ
LCR meterHV Lightning response

39
6 Experimental Results on HV Transformer Bushings
6.1 Dielectric response of HV transformer bushings The aim of the proposed technique, utilizing natural transient for dielectric response
measurement, is to employ it for on-line diagnostics of power components. Specifically, the first type of component on which it is being considered is power transformer bushings. Therefore, after investigation of its feasibility for insulation defect diagnostics in oil-impregnated paper, a similar investigation on real bushings is of interest. The major insulation of the power transformer bushings is oil-impregnated paper. Therefore, it is expected to achieve more or less the same results for the bushings as well as the results for the oil-impregnated paper. Three bushings that had been in service in the power system for 50 years were investigated by the proposed technique. The results in this part are mainly published in Paper III.
6.2 Experimental set up Three 150 kV ASEA oil-impregnated condenser bushings (GEO type from 1962) from
three phases of a power transformer were the test objects of this part of experiment, Figure 6.1. The Agilent 33120A function generator was used to apply lightning and switching impulses to the HV terminal of the bushings. The transient responses of the bushings were measured using a shunt to measure the current from the test tap of the bushings, Figure 6.2. The test tap provides access to the outermost stress-control layer of the condenser bushing, which is isolated from the flange. A parallel resistive and capacitive shunt, 100 kΩ and 4700 pF, was used to measure the transient response of the bushings. These values have been chosen to have an optimum output signal corresponding to the signal bandwidth and test-object capacitance.
6.3 Results The three bushings used in this experiment had been working in three phases of a
transformer and had not shown any documented problem. Their dielectric responses were also found to be almost the same. This similarity is an advantage in finding a defective power transformer bushing from the comparison of the phases during their operation. Most common bushings failure conditions are moisture contamination and partial discharges which lead to an increase in loss tangent and their capacitance [14].

40
By applying standard lightning and switching impulses to the test objects, power transformer bushings, their responses were measured through the shunt. The results for loss tangent and capacitance of all three phases plotted in Figure 6.3-Figure 6.5. The average of the results from lightning and switching responses is around the dielectric responses obtained by IDAX and LCR meter.
Figure 6.1: 150 kV ASEA bushings
Bushing test tap
0 1 2 3 4 5 6 7
x 10-3
0
0.5
1
1.5
2
2.5
3
3.5
4
4.5
time(s)
mea
sure
d si
gnal
0 1 2 3 4
x 10-4
-1
0
1
2
3
4
5
6
7
Time(s)
Mea
sure
d Si
gnal
s
Input Signal
Response Signal
Shunt
Figure 6.2: Measurement set up
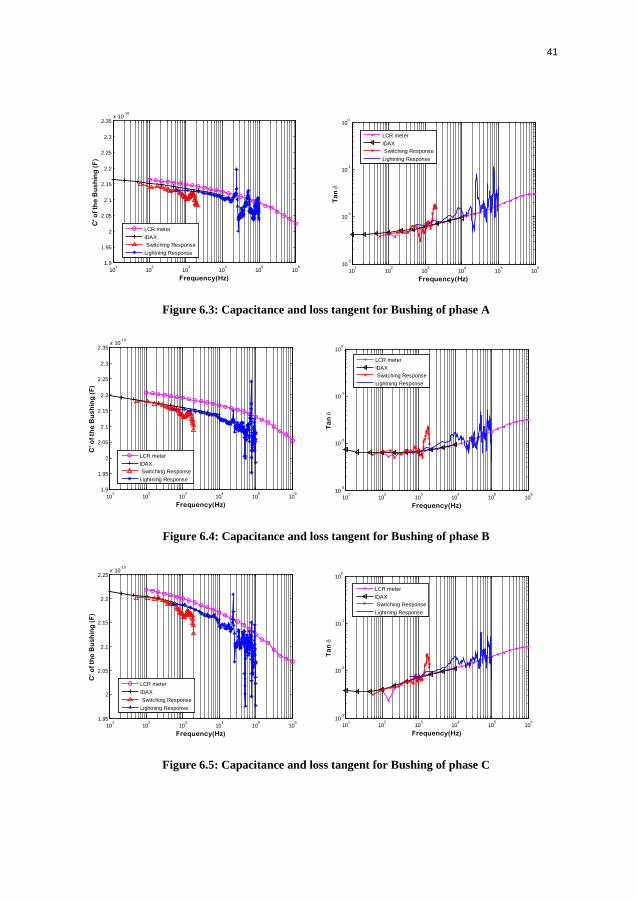
41
Figure 6.3: Capacitance and loss tangent for Bushing of phase A
Figure 6.4: Capacitance and loss tangent for Bushing of phase B
Figure 6.5: Capacitance and loss tangent for Bushing of phase C
101
102
103
104
105
106
1.9
1.95
2
2.05
2.1
2.15
2.2
2.25
2.3
2.35x 10
-10
Frequency(Hz)
C' o
f th
e B
ush
ing
(F
)
LCR meterIDAX Switching ResponseLightning Response
101
102
103
104
105
106
10-3
10-2
10-1
100
Frequency(Hz)
Ta
n δ
LCR meterIDAX Switching ResponseLightning Response
101
102
103
104
105
106
1.9
1.95
2
2.05
2.1
2.15
2.2
2.25
2.3
2.35x 10
-10
Frequency(Hz)
C' o
f th
e B
ush
ing
(F
)
LCR meterIDAX Switching ResponseLightning Response
101
102
103
104
105
106
10-3
10-2
10-1
100
Frequency(Hz)
Ta
n δ
LCR meterIDAX Switching ResponseLightning Response
101
102
103
104
105
106
1.95
2
2.05
2.1
2.15
2.2
2.25x 10
-10
Frequency(Hz)
C' o
f th
e B
ush
ing
(F
)
LCR meterIDAX Switching ResponseLightning Response
101
102
103
104
105
106
10-3
10-2
10-1
100
Frequency(Hz)
Ta
n δ
LCR meterIDAX Switching ResponseLightning Response
42
6.3.1 Discussion To examine the effectiveness of the proposed diagnostic technique on real test objects
for resemblance to the real application, measurements were done on HV power transformer bushings. Bushings have a more complex insulation system than oil-impregnate paper test samples. As the bushings are big objects, some parameters such as stray capacitances can get considerable in the measurement. It was expected to have less certainty in the transient responses obtained from the HV bushings comparing to the oil-impregnate paper test sample. However, the results show acceptable agreement with FDS measurements. Although there are some oscillation in the results, but total average of them is around the dielectric responses obtained by FDS methods. Reaching to the acceptable accuracy of the transient responses on a real object requires well followed electromagnetic compatibility rules. Avoiding inductive and capacitive coupling, using shielded cables and grounding the necessary points are some of these rules. Also, well modeled of all parameters in the measurement circuit is the key for achievement of success in obtaining dielectric responses with high accuracy by utilizing transients.
6.4 Effect of Transformer Winding on the Transient Response of Power Transformer Bushings
Using natural transients in getting the response of the power transformer bushings in an in-service condition leads to some questions about the effect of the transformer on the response. The bushings are connected to the transformer winding while the apparatus is in service. Transient propagation in the bushing is affected by transient propagation in the transformer winding. Therefore in this chapter this effect is investigated. The results in this part are mainly published in paper IV. Several theories are available to describe the wave propagation in the transformer windings, of which standing wave and traveling wave approaches are most famous ones [50],[51]. For modeling of transformer windings, the most popular technique is to use lumped element circuits. This technique has acceptable accuracy for our investigation and is not time consuming. Capacitances and inductances of the winding must be calculated according to the geometry of the transformer [50]. Inter-turn capacitances, capacitance between the layers of the coils and capacitances between the coils and the core or the tank can be calculated [52]. Inter-turn capacitances or combinations of inter-turn and interlayer capacitances can define the series capacitance. On the other hand, capacitances between the coils and the core or the tank represent the capacitances to the ground. Inter-turn capacitances play an important role in the transient response of the transformer winding. Especially at the first moment that the winding is exposed to a steep fronted surge, the current cannot flow along the winding’s conductors because of inductive behavior; however the stray capacitances provide a path for the current to flow.
Due to the existence of mutual inductances and series capacitances between the windings, using the equivalent circuit of the transformer winding in the form of lumped parameter network (Figure 6.6) can determine the impulse distribution accurately [50], [52]-[54] and is used for studying its transient response.
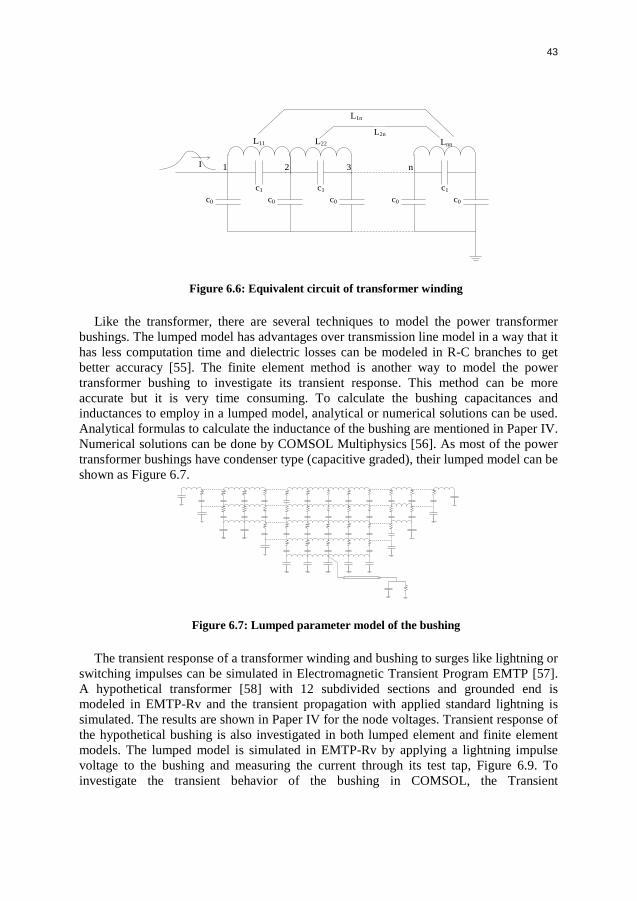
43
c1
c0
c1
c0 c0 c0 c0
c1
L11 L22 Lnn
L2n
L1n
1 2 3 nI
Figure 6.6: Equivalent circuit of transformer winding
Like the transformer, there are several techniques to model the power transformer bushings. The lumped model has advantages over transmission line model in a way that it has less computation time and dielectric losses can be modeled in R-C branches to get better accuracy [55]. The finite element method is another way to model the power transformer bushing to investigate its transient response. This method can be more accurate but it is very time consuming. To calculate the bushing capacitances and inductances to employ in a lumped model, analytical or numerical solutions can be used. Analytical formulas to calculate the inductance of the bushing are mentioned in Paper IV. Numerical solutions can be done by COMSOL Multiphysics [56]. As most of the power transformer bushings have condenser type (capacitive graded), their lumped model can be shown as Figure 6.7.
Figure 6.7: Lumped parameter model of the bushing
The transient response of a transformer winding and bushing to surges like lightning or switching impulses can be simulated in Electromagnetic Transient Program EMTP [57]. A hypothetical transformer [58] with 12 subdivided sections and grounded end is modeled in EMTP-Rv and the transient propagation with applied standard lightning is simulated. The results are shown in Paper IV for the node voltages. Transient response of the hypothetical bushing is also investigated in both lumped element and finite element models. The lumped model is simulated in EMTP-Rv by applying a lightning impulse voltage to the bushing and measuring the current through its test tap, Figure 6.9. To investigate the transient behavior of the bushing in COMSOL, the Transient

44
Electromagnetic Waves (TEMW) interface, under the Radio Frequency module was used, as is described in Paper IV. The transient current calculated by TEMW from the test layer (last foil connected to test tap) is shown in Figure 6.9.
Figure 6.8: Bushing model in COMSOL Multiphysics
Figure 6.9: Bushing current measured through its tap when a lightning impulse is supplied
To be able to investigate the effect of the transformer winding on the transient response of the bushing, a lumped model is only used for both of the bushing and
0 0.2 0.4 0.6 0.8 1
x 10-3
-2
0
2
4
6
8
10
Time [s]
Cur
rent
[A]
Lupmed ModelComsol Model
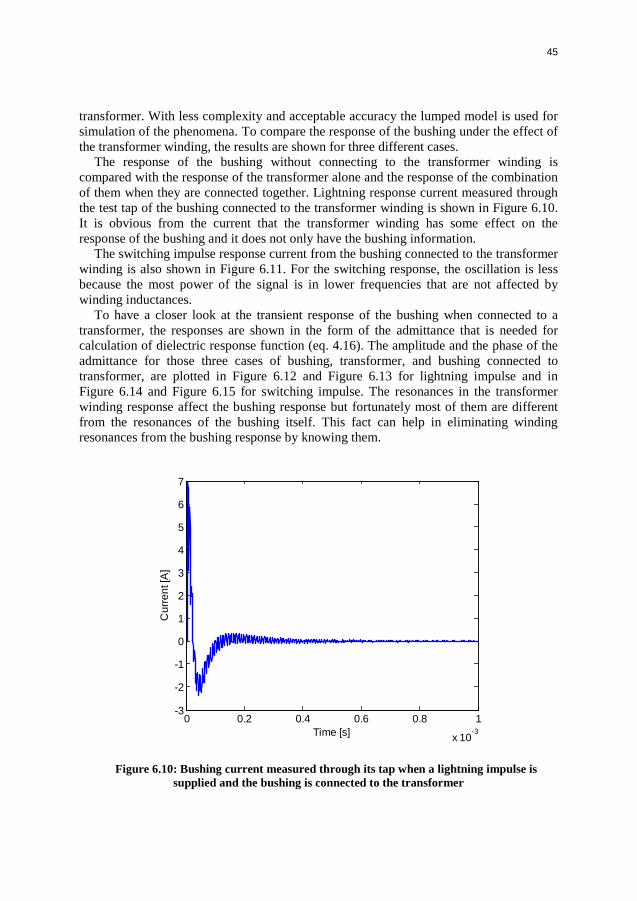
45
transformer. With less complexity and acceptable accuracy the lumped model is used for simulation of the phenomena. To compare the response of the bushing under the effect of the transformer winding, the results are shown for three different cases.
The response of the bushing without connecting to the transformer winding is compared with the response of the transformer alone and the response of the combination of them when they are connected together. Lightning response current measured through the test tap of the bushing connected to the transformer winding is shown in Figure 6.10. It is obvious from the current that the transformer winding has some effect on the response of the bushing and it does not only have the bushing information.
The switching impulse response current from the bushing connected to the transformer winding is also shown in Figure 6.11. For the switching response, the oscillation is less because the most power of the signal is in lower frequencies that are not affected by winding inductances.
To have a closer look at the transient response of the bushing when connected to a transformer, the responses are shown in the form of the admittance that is needed for calculation of dielectric response function (eq. 4.16). The amplitude and the phase of the admittance for those three cases of bushing, transformer, and bushing connected to transformer, are plotted in Figure 6.12 and Figure 6.13 for lightning impulse and in Figure 6.14 and Figure 6.15 for switching impulse. The resonances in the transformer winding response affect the bushing response but fortunately most of them are different from the resonances of the bushing itself. This fact can help in eliminating winding resonances from the bushing response by knowing them.
Figure 6.10: Bushing current measured through its tap when a lightning impulse is supplied and the bushing is connected to the transformer
0 0.2 0.4 0.6 0.8 1
x 10-3
-3
-2
-1
0
1
2
3
4
5
6
7
Time [s]
Cur
rent
[A]
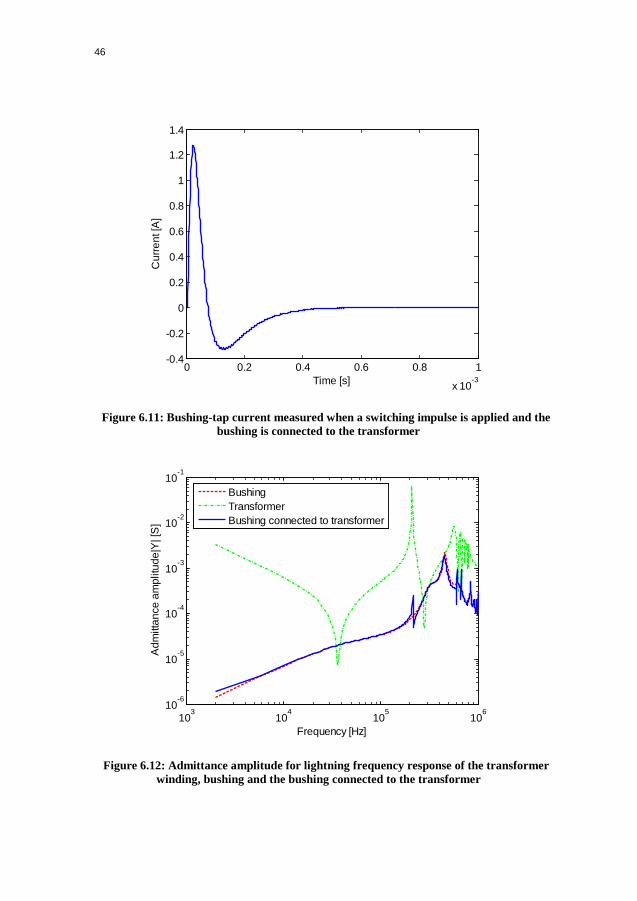
46
Figure 6.11: Bushing-tap current measured when a switching impulse is applied and the bushing is connected to the transformer
Figure 6.12: Admittance amplitude for lightning frequency response of the transformer winding, bushing and the bushing connected to the transformer
0 0.2 0.4 0.6 0.8 1
x 10-3
-0.4
-0.2
0
0.2
0.4
0.6
0.8
1
1.2
1.4
Time [s]
Cur
rent
[A]
103
104
105
106
10-6
10-5
10-4
10-3
10-2
10-1
Frequency [Hz]
Adm
ittan
ce a
mpl
itude
|Y| [
S]
BushingTransformerBushing connected to transformer
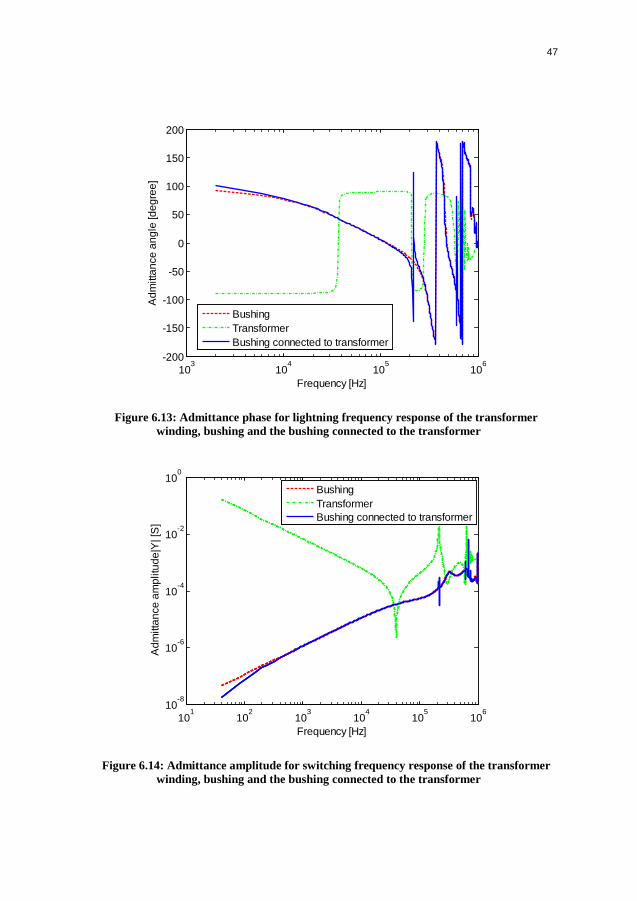
47
Figure 6.13: Admittance phase for lightning frequency response of the transformer winding, bushing and the bushing connected to the transformer
Figure 6.14: Admittance amplitude for switching frequency response of the transformer winding, bushing and the bushing connected to the transformer
103
104
105
106
-200
-150
-100
-50
0
50
100
150
200
Frequency [Hz]
Adm
ittan
ce a
ngle
[deg
ree]
BushingTransformerBushing connected to transformer
101
102
103
104
105
106
10-8
10-6
10-4
10-2
100
Frequency [Hz]
Adm
ittan
ce a
mpl
itude
|Y| [
S]
BushingTransformerBushing connected to transformer

48
Figure 6.15: Admittance phase for switching frequency response of the transformer winding, bushing and the bushing connected to the transformer
6.4.1 Discussion To investigate the challenges for obtaining the dielectric response of the power
transformer bushings through natural transients, they were simulated in an in-service condition connected to the transformer winding. The results show that the transformer winding response affects the bushing response with its resonances. However, more accurate modeling of a real bushing and transformer can be considered later for better investigation. Beside resonances we have deviation in amplitude and the phase of the bushing response at low frequencies which is caused by the transformer response. The history of the transformer can be useful to compensate these deviations but still any change in response of the transformer winding can affect the accuracy of the interpreted results. Another solution to this problem is to perform the current measurement through both the test tap of the bushing and ground end of the transformer winding. In other words, it can be done by supplement simultaneous transient response measurement on the neutral grounding of the transformer. In this case we can collect more information on the bushing and the transformer and by finding the correlation between them the diagnostics accuracy can be improved.
101
102
103
104
105
106
-200
-150
-100
-50
0
50
100
150
200
Frequency [Hz]
Adm
ittan
ce a
ngle
[deg
ree]
BushingTransformerBushing connected to transformer

49
7 Summary of Publications
Paper I
In this paper a new technique for diagnostics of power components with oil-impregnated paper insulation is presented. The possibility of utilizing power system transients as stimuli for dielectric response measurement of the oil-impregnated paper insulation system has been studied. Diagnostics of moisture content as an important failure problem in this type of insulation has been investigated. Several measurement considerations in achieving the reasonable results and their validity range are discussed. The results show that this method can detect the changes in frequency response of the paper responding to the different levels of the moisture content.
Paper II
This paper continues the investigation that has been done in Paper I. A new technique on dielectric spectroscopy measurement by utilizing power transients such as lightning and switching impulses is presented. The experiments were performed on oil-impregnated paper as a major insulation of power transformers and their bushings. The study has been done in both Low Voltage and High Voltage level. Different circuit configuration and consideration according to these two levels are discussed. The capability of the proposed technique in detection of moisture content and temperature as responsible parameters in insulation failure of power transformers and their bushings is investigated. The results show good agreement with the results obtained from off-line commercial instruments for dielectric spectroscopy.
Paper III
In this paper diagnostics of power transformer bushing with a new technique proposed in Paper I and II is presented. Power system transients were used as stimuli to get the dielectric response of three aged power transformer bushings. The effectiveness of the proposed technique has been investigated and the results show its capability in measuring dielectric response of the bushing comparable with off-line methods.

50
Paper IV
In this paper the effect of the transformer winding on the transient response of power transformer bushing is investigated. As the power transformer bushing is connected to the transformer winding, on-line dielectric response measurement of the bushing obtained by power system transients presented in Paper III can be affected by the transformer winding. A transient model of a transformer winding and condenser bushing is presented. The transient response for three different case of 1) transformer winding alone, 2) bushing alone, and 3) bushing connected to transformer has been investigated. According to the results, the transformer winding has a strong effect on the transient response of the bushing, but knowing the resonance frequencies of the transformer winding helps to distinguish the bushing response.

51
8 Conclusions and Future Work
8.1 Conclusions In this thesis a novel technique aiming for on-line diagnostics of power components,
specifically power transformer bushings, has been proposed. As the major insulation of these components is oil-impregnated paper, most of the study has been done on this type of insulation. Lightning and switching impulses are the stimuli from which, the measurement of dielectric response is made in the proposed technique.
The principle usefulness of the technique has been performed through a laboratory measurement circuit where the transient response current of the test objects were measured through a shunt. All measurement requirements, circuit consideration and limits to fulfill the technique with reasonable accuracy have been discussed in this work.
Moisture content and temperature, as two failure parameters for oil-impregnated paper, were investigated to prove the feasibility of the technique for diagnostics. The fairly good agreement of the results with FDS results shows its capability to detect the defects which make changes in the dielectric response at high frequencies. Measurements were done at both HV and LV levels. Therefore, related measurement considerations for both cases have been discussed for achievement of an acceptable level of accuracy and more reliable assessment.
To investigate the application of the proposed technique more akin to what is needed in the field; measurements were also performed on three service-aged power transformer bushings. The results show that this technique provides good view on their insulation condition. However, less certainty obtained in the transient response of the HV bushing as a large sample object in comparison with the oil-impregnate paper test sample.
Then to answer the question about the effect of the transformer winding on the transient response of the bushing, simulations were made of their transient model. The results show that the transformer winding can affect the transient response of the bushing. However, some solutions were suggested to distinguish the response of the bushing from the influence of the transformer.
In general, according to the obtained results, the proposed technique seems promising in monitoring of the insulation of power transformer bushings. The wide frequency range of natural transients is their advantage to be used in the on-line dielectric spectroscopy without interrupting the operation of the power component or requiring an external source.

52
8.2 Future work Further possible work that can be developed as a continuation of this project is
described as follows: • More investigation can be done through sensitivity analysis to look for the
parameters that affect the accuracy and certainty of the responses obtained by the proposed technique on the power transformer bushing.
• For relevance to the real application, high voltage transient responses can be measured on real bushings and the effectiveness of the proposed technique can be investigated by introducing artificial degradation in the bushings. The magnitude of the high voltage transients should be checked for investigation of any non-linear effects.
• The technique can be further developed and installed in field on real power transformer bushings for gain of experience in the field.
• The influence of water (rain) and pollutions on the porcelain or polymeric housing and its influence on the response current should be investigated.
• This approach can be valuable for on-line diagnostics of other power components and other types of insulations, if their frequency response also changes depending on the degradation.
• Effect of protection devices on transients and looking more precisely to the real shape of transients which reach to the terminal of the bushing can be investigated.
• Destructive effect of transients on the aged bushings can be studied. • Energy dissipation of transients in the bushing and its effect on triggering Partial
Discharges is another interesting topic that can be worked on.
53
Bibliography
[1] R.E. James, Q. Su, "Condition Assessment of High Voltage Insulation in Power System
Equipment", The Institution of Engineering and Technology (IET), UK, 2008.
[2] A.M. Emsley and G. C. Stevens, "Review of Chemical Indicators of Degradation of Cellulosic Electrical Paper Insulation in Oil-filled Transformers", IEE Proceedings Science, Measurement and Technology, vol.141, pp. 324-334, 1994.
[3] IEEE, "IEEE Guide for the Interpretation of Gases Generated in Oil-immersed Transformers", IEEE Standard C57.104-1991, pp. 1-30, 1991.
[4] B. Pahlavanpour, M. A. Martins, and A. DePablo, "Experimental Investigation into the Thermal-ageing of Kraft Paper and Mineral Insulating Oil", IEEE International Symposium on Electrical Insulation, Boston, MA, USA, pp. 341-345, 2002.
[5] A. M. Emsley, X. Xiao, R. J. Heywood, and M. Ali, "Degradation of Cellulosic Insulation in Power Transformers. Part 2: Formation of Furan Products in Insulating Oil", IEE Proceedings Science, Measurement and Technology, vol. 147, pp. 110-114, 2000.
[6] L. E. Lundgaard, W. Hansen, D. Linhjell and T. J. Painter, "Aging of Oil-impregnated Paper in Power Transformers", IEEE Transactions on Power Delivery, vol. 19, no. 1, pp. 230-239, 2004.
[7] Walter S. Zaengl, "Dielectric Spectroscopy in Time and Frequency Domain for HV Power Equipment, Part I:Theoretical Considerations", IEEE Electrical Insulation Magazine, vol. 19, no. 5, pp. 5-19, September/October 2003.
[8] U. Gäfvert, L. Adeen, M. Tapper and P. Ghasemi, B. Jonsson, "Dielectric Spectroscopy in Time and Frequency Domain Applied to Diagnostics of Power Transformers", Proceedings of The 6th International Conference on Properties and Applications of Dielectric Materials, China, 2000.
[9] R. Neimanis, L. Lennholm, and R. Eriksson, "Determination of Moisture Content in Impregnated Paper Using Near Infrared Spectroscopy", IEEE Conference on Electrical Insulation and Dielectric Phenomena, pp. 162-165, 1999.
[10] T. K. Saha, "Review of Time Domain Polarisation Measurements for Assessing Insulation Condition in Aged Transformers", IEEE Transactions on Power Delivery, vol. 18, no. 4, pp. 1293 - 1301, 2003.
[11] T. K. Saha, "Review of Modern Diagnostic Techniques for Assessing Insulation Condition in Aged Transformers", IEEE Transactions on Dielectrics and Electrical Insulation, vol. 10, no. 5, October 2003.

54
[12] M. Jaya, D. Geißler and T. Leibfried, "Accelerating Dielectric Response Measurements on Power Transformers—Part I: A Frequency-Domain Approach", IEEE Transactions on Power Delivery, vol. 28, no. 3, pp. 1469- 1473, July 2013.
[13] K. G. N. B. Abeywickrama, Y. V. Serdyuk, S. M. Gubanski, "Exploring Possibilities for Characterization of Power Transformer Insulation by Frequency Response Analysis (FRA) ", IEEE Transactions on Power Delivery, vol. 21, no. 3, pp. 1375-1382, 2006.
[14] D. Chu, A. Lux, "On-Line Monitoring of Power Transformers and Components: A Review of Key Parameters," IEEE Transformer On-Line Monitoring Task Force, 2000.
[15] R. Schwarz, M. Muhr, "Measurement Techniques for Transformer Diagnostic", International Symposium on Electrical Insulating Material, Japan, 2008.
[16] A. Setayeshmehr, A. Akbari, H. Borsi and E.Gockenbach, "On-line Monitoring and Diagnoses of Power Transformer Bushings", IEEE Tranactions. on Dielectrics and Electrical Insulation, vol. 13, no. 3, 2006.
[17] J. Barker, "High Voltage Asset Monitoring for Today’s Smart Grid", ABB report, Monitoring and Smartgrid, June 2013.
[18] M. Puetter, C. Enk, I. Hong, M. Kruger, A. Kraetge, "On Site Measurement on Power Transformers Using the whole Testing Toolbox", 18th international Symposium on High Voltage Engineering, Korea, 2013.
[19] T. McGrail, K.Elkinson,"Asset Management: Power Transformer Fleet Condition Assessment and Risk Management", 18th international Symposium on High Voltage Engineering, Korea, 2013.
[20] M. Wang and A. J. Vandermaar, "Review of Condition Assessment of Power Transformers in Service", IEEE Electrical Insulation Magazine, vol. 18, no. 6, pp 12-25, November/December, 2002.
[21] M. Jaya, T. Leibfried, M. Koch, "Information within the dielectric Response of Power Transformers for Wide Frequency Ranges", IEEE International Symposium on Electrical Insulation, San Diego, 2010.
[22] J. C. Das, "Transients in Electrical Systems", (Analysis, Recognition, and Mitigation), The McGraw-Hill, 2010.
[23] B. Sonerud, T. Bengtsson, J. Blennow, S. M. Gubanski, "Dielectric Response Measurements Utilizing Semi-Square Voltage Waveforms, " IEEE Transactions on Dielectrics and Electrical Insulation, vol. 15, no. 4, pp. 920-926, August 2008.
[24] Joacim Törnqvist, "Non-contact High Voltage Measurements: Modeling and On-site Evaluation", Master of Science thesis, Power Technologies, ABB Corporate Research and Department of Physics, Umeå University, September 23, 2012.
[25] IEEE Recommended Practice for Monitoring Electric Power Quality, IEEE Standard 1159-1995.
[26] M. H. J. Bollen, E. Styvaktakis, and I. Yu-Hua Gu, "Categorization and Analysis of Power System Transients", IEEE Transactions on Power Delivery, vol. 20, no. 3, July 2005
[27] Lou van der Sluis, "Transients in Power System", John Wiley & Sons Ltd, 2001.
55
[28] V. Sokolov, B. Vanin, "Evaluation and Identification of Typical Defects and Failure-Modes of 110-750 KV Bushings", ZTZ-Service Co. report, 2011.
[29] Y. Du, M. Zahn, B. Lesieutre, A. Mamishev, and S. Lindgren, "Moisture equilibrium in transformer paper-oil systems", IEEE Electrical Insulation Magazine, vol. 15, no. 1, pp. 11–20, 1999.
[30] N. A. Muhamad, B.T. Phung, T.R. Blackburn and K.X. Lai, "Polarization and Depolarization Current (PDC) Tests On Biodegradable And Mineral Transformer Oils At Different Moisture Levels", Power Engineering Conference AUPEC, Australia, 2009.
[31] V. D. Houhanessian and W. S. Zaengl, "Time Domain Measurements of Dielectric Response in Oil-Paper Insulation Systems", IEEE International Symposium on Electrical Insulation, Montreal, Quebec, Canada, June 16-19, 1996.
[32] A. Helgeson, Analysis of Dielectric Response Measurement Methods and Dielectric Properties of Resin-Rich Insulation During Processing, PhD thesis, KTH, Stockholm, 2000.
[33] Kuffel et al, High Voltage Engineering, 2nd ed., Newnes 2000.
[34] A. K. Jonscher, Dielectric Relaxation in solids, Chelsea Dielectrics Press, London, UK, 1983.
[35] D. Linhjell, L. Lundgaard, U. Gäfvert, "Dielectric Response of Mineral Oil Impregnated Cellulose and the Impact of Aging", IEEE Transactions on Dielectrics and Electrical Insulation, vol. 14, no. 1, 2007.
[36] X. Chen, P. H. F. Morshuis, B. Lennon, J.J. Smit, "Experimental Investigation on Dielectric Spectroscopy of Insulating Paper and Oil", Annual Report Conference on Electrical Insulation and Dielectric Phenomena (CEIDP), USA, 2010.
[37] I. Fofana, H. Hemmatjou, F. Meghnefi, M. Farzaneh, A. Setayeshmehr, H. Borsi and E. Gockenbach, "On the Frequency Domain Dielectric Response of Oil-paper Insulation at Low Temperatures", IEEE Transactions on Dielectrics and Electrical Insulation, vol. 17, no. 3, pp. 779-806, 2010.
[38] J. Gielniak, A. Graczkowski, S. Gubanski, H.Moranda, H.Moscicka, K. Walczak, "Influence of Thermal Aging on Dielectric Response of Oil-paper Insulation", Materials Science-Poland Journal, vol. 27, no. 4/2, 2009.
[39] J. Hai, Z. Ma, R. Liao, G. Chen and Lijun Yang, "A Comparative Study of Moisture and Temperature Effect on the Frequency Dielectric Response Behavior of Pressboard Immersed in Natural Ester and Mineral Oil", 17th International Symposium on High Voltage Engineering, Hannover, Germany, 2011.
[40] C. Ekanayake, S. M. Gubanski, A. Graczkowski and K. Walczak, "Frequency Response of Oil Impregnated Pressboard and Paper Samples for Esyimating Moisture in Transformer Insulation", IEEE Transactions on Power Delivery, vol. 21, no. 3, pp. 1309-1317, 2006.
[41] J. Blennow, C. Ekanayake, K. Walczak, B. Garcia and S. M. Gubanski, "Fields experiences with measurements of dielectric response in frequency domain for power transformer diagnostics", IEEE Transactions on Power Delivery, vol. 21, no. 2, pp. 681-688, 2006.
[42] X. Xu, "Enhancement in Dielectric Response Characterization of Insulation Materials", Licentiate thesis in High Voltage Engineering, Chalmers University of Technology, Göteborg, Sweden 2013.
56
[43] L. Qian, Z. Shan, "Coaxial Cable Modeling and Verification", A Thesis for the Degree of B.Sc. in Electrical Engineering, Blekinge Institute of Technology, Karlskrona, Sweden, 2012.
[44] B. Sonerud, T. Bengtsson, J. Blennow, S. M. Gubanski, "Noise and Aliasing Aspects in a Multiharmonic-Dielectric-Response-Measurement System," IEEE Transactions on Instrumentation and Measurement, vol. 60, no. 12, pp.3875-3882, December 2011.
[45] Eilert Bjerkan, High Frequency Modeling of Power Transformers: Stresses and Diagnostics, Doctoral Thesis, Faculty of Information Technology, Mathematics and Electrical Engineering Trondheim, May 2005.
[46] High-voltage test techniques – Part 1: General definitions and test requirements, IEC standard 60060-1, ed3.0, 2010.
[47] A. Akbari, S. DehPahlevan, and H. Borsi, "Analyzing dynamic of moisture equilibrium in oil-paper insulation in power transformers for efficient drying," IEEE Conference on Electrical Insulation and Dielectric Phenomena, pp. 545–548, 2006.
[48] J. Cheng, "Broadband Dielectric Properties of Impregnated Transformer Paper Insulation at Various Moisture Contents", Master of Science thesis in Electromagnetic Engineering, KTH, Stockholm, Sweden 2011.
[49] L. B. Rockland, "Saturated Salt Solutions for Static Control of Relative Humidity between 5º and 40º C", Analytical Chemistry Journal, vol. 32, no. 10, September 1960.
[50] S. A. Khaparde, S. V. Kulkarni, "Transformer engineering – Design and Practice", Chapter 7, CRC Press, 2004.
[51] R. Rudenberg, "Electrical shock waves in power systems", Chapter 18-20, Cambridge, Massachusetts, Harvard University press, 1968.
[52] S. Meier, T.Kjellqvist, S. Norrga and H.P. Nee, "Design considerations for Medium Frequency Power Transformers in offshore Wind Farms", 2009
[53] M.Popov, L.V.Sluis, R.P.Smeets, "Analysis of very fast transients in layer type transformer windings", IEEE Transactions on Power Delivery, vol. 22, no. 1, Jan 2007
[54] H.Tavakoli, "An FRA transformer model with application on time domain reflectometry", Doctoral thesis in electromagnetic engineering, KTH, Stockholm, Sweden 2011.
[55] A.Ardito, R.Iorio, G.Santagostino, A.Porrino, "Accurate modeling of capacitively graded bushings for calculation of fast transient overvoltages in GIS", IEEE Transactions on Power Delivery, vol. 7, no. 3, pp. 1316 – 1327, July 1992.
[56] COMSOL documentation, reference guide, November 2008.
[57] A. Morched, L. Martí, and J. Ottevangers, "A high-frequency transformer model for the EMTP ", IEEE Transactions on Power Delivery, vol. 8, no. 3, pp. 1615–1626, Jul. 1993.
[58] R. Kasturi, G.R. K. Murty, "Computation of impulse voltage stresses in transformer windings", IEE Proceedings, vol. 126, no. 5, pp. 397–400, May 1979.


![Consideration of Ester-Based Oils as Replacements for ...aging rate of cellulose insulation can be signi cantly slowed when impregnated with ester uid compared to mineral oil.[12]](https://img.dokumen.tips/doc/110x75/60acdfa9ef223521e636b13c/consideration-of-ester-based-oils-as-replacements-for-aging-rate-of-cellulose.jpg)