Embed Size (px)
Citation preview
University of Rhode Island University of Rhode Island
DigitalCommons@URI DigitalCommons@URI
Open Access Master's Theses
2020
PERFORMANCE OF SILVER NANOPARTICLE-IMPREGNATED PERFORMANCE OF SILVER NANOPARTICLE-IMPREGNATED
CERAMIC WATER FILTERS CERAMIC WATER FILTERS
Zachary Shepard University of Rhode Island, [email protected]
Follow this and additional works at: https://digitalcommons.uri.edu/theses
Recommended Citation Recommended Citation Shepard, Zachary, "PERFORMANCE OF SILVER NANOPARTICLE-IMPREGNATED CERAMIC WATER FILTERS" (2020). Open Access Master's Theses. Paper 1824. https://digitalcommons.uri.edu/theses/1824
This Thesis is brought to you for free and open access by DigitalCommons@URI. It has been accepted for inclusion in Open Access Master's Theses by an authorized administrator of DigitalCommons@URI. For more information, please contact [email protected].
PERFORMANCE OF SILVER NANOPARTICLE-IMPREGNATED CERAMIC
WATER FILTERS
BY:
ZACHARY SHEPARD
A THESIS SUBMITTED IN PARTIAL FULFILLMENT OF THE
REQUIREMENTS FOR THE DEGREE OF
MASTER OF SCIENCE
IN
CIVIL AND ENVIRONMENTAL ENGINEERING
UNIVERSITY OF RHODE ISLAND
2020
MASTER OF SCIENCE THESIS
OF
ZACHARY SHEPARD
APPROVED:
Thesis Committee:
Major Professor Vinka Oyanedel-Craver
Joseph Goodwill
Irene Andreu-Blanco
Nasser H. Zawia
DEAN OF THE GRADUATE SCHOOL
UNIVERSITY OF RHODE ISLAND
2020
ii
ABSTRACT
Ceramic water filters (CWFs) are manufactured in developing communities
worldwide and are designed to remove microorganisms from drinking water. These
filters are low cost, point-of-use, and have been shown to reduce the prevalence of
diarrheal disease. CWFs are manufactured at 50 locations around the globe, each factory
using a different set of raw materials and manufacturing practices. In this study, the state
of the literature encompassing CWF manufacturing and performance assessments was
reviewed to determine areas of potential improvements. A modified form of one of the
potential standard methodologies was then used to analyze the performance of a new
style of CWF with ovoid (curved) walls.
The goal of the literature review was to demonstrate the need for a standardized
performance assessment procedure in the testing of CWFs. The performance of CWFs
can vary greatly between units manufactured in different areas. A standardized
methodology for evaluating CWF performance is necessary in order to determine how
manufacturing differences could change the performance of the final product. The many
variables in manufacturing and testing that can affect the performance of CWFs were
reviewed to determine the major contributors to variations in CWF performance. The
USEPA and WHO performance assessments procedures that are available for CWFs are
discussed and compared. The implementation of a standardized performance
assessment procedure has the potential to improve the performance of CWFs, increase
stakeholder involvement, and improve health in developing communities.
Experimentally, the performance of a ceramic water filter (CWF) with curved
(ovoid) walls developed by Potters without Borders was evaluated. The modified
iii
protocol used in this assessment was the USEPA Guide Standard and Protocol for
Testing Microbiological Water Purifiers, which has yet to be utilized in the literature.
Filters with/without silver nanoparticles (AgNPs) were evaluated for bacterial removal,
turbidity removal, flow rate, and silver leaching. Bacterial and turbidity removal were
high for the ovoid CWFs compared to previous studies. All the CWFs tested here had
flow rates within the acceptable range after they had been saturated. Coated CWFs had
a higher total effluent silver concentration compared to uncoated; coated CWFs also had
increased silver release during testing phases with a higher concentration of total
dissolved solids (challenge phase, 35 ppb). This was compared to the general phase that
had a release of 13 ppb. The procedure demonstrated utility as a reproducible
performance testing technique. X-ray diffraction and mercury intrusion porosimetry
were used to study the ceramic structure in order to explain the high performance of the
CWFs. X-ray photoelectron spectroscopy (XPS), was used to determine that the AgNP
coating on the exterior of the CWFs leached off by the dissolution of the AgNPs during
the general and challenge phases and the release of AgNPs from the ceramic during the
leaching phase.
iv
ACKNOWLEDGEMENTS
I would like to take this opportunity to acknowledge the efforts of my advisor,
Vinka Oyanedel-Craver, for her guidance over the past two years. My successes would
not have been possible without her constant mentoring and assistance. Thank you to
Dr. Oyanedel-Craver for the opportunities and advice she has given me. I would also
like to thank the other members of my thesis committee: Joseph Goodwill and Irene
Andreu-Blanco. Drs. Goodwill and Andreu-Blanco are always willing to lend a helping
hand and give advice, which I greatly appreciate.
I have been fortunate to have lab mates who have been there to offer advice and
assistance throughout my time at URI. Thank you to CJ Spellman, Erika Addison,
Kayla Kurtz, and Dounia Elkhatib for their friendship and support. I would also like to
acknowledge the undergraduate students who have worked with me over the past two
years. Elizabeth Lux, Evan Thompson, Robert Cullen, Alexa Leone, Noura Rayes,
Jacob Bosworth, and Jacob Hunnewell have worked hard and contributed to my
graduate studies. Thanks to everyone in the Water for the World laboratory for their
friendship and assistance.
This work would not have been possible without collaboration between our lab
group and several others at URI. Thank you to everyone who had a hand in this project
including: Zachary Brown, Satu Heiskanen, Dr. Brett Lucht, Dr. Katherine Kelley, and
Dr. Sumanta Das. In the experimental work, we partnered with the Canadian nonprofit,
Potters without Borders. Thank you to Burt Cohen for providing the filters that we
studied and for his collaboration with our project.
v
PREFACE
This thesis is partially written in manuscript format and in accordance with the
University of Rhode Island Graduate School guidelines. There are three sections: a
review paper, a manuscript detailing experimental work performed on ovoid CWFs, and
a conclusion. Chapter 1 is the review paper entitled Performance Assessments of Point-
of-Use Ceramic Water Filters: A Review, which describes the current state of the
literature surrounding the performance assessments of ceramic water filters and Chapter
2 is a manuscript, Performance of Silver Nanoparticle-Impregnated Ovoid Ceramic
Water Filters, which details the study of a new type of ovoid ceramic water filter.
Chapter 3 develops some ideas about future studies that could be completed under this
research.
vi
LIST OF TABLES
ABSTRACT ................................................................................................................... ii
ACKNOWLEDGEMENTS .......................................................................................... iv
PREFACE ...................................................................................................................... v
LIST OF TABLES ........................................................................................................ vi
LIST OF TABLES ...................................................................................................... viii
LIST OF FIGURES ...................................................................................................... ix
PUBLICATION STATUS ............................................................................................. 1
CHAPTER 1 .................................................................................................................. 1
Abstract: ..................................................................................................................... 2
Introduction: ............................................................................................................... 2
Current State of CWF Research.............................................................................. 5
Variability in CWF Structure and Performance: ........................................................ 6
Variability in manufacturing:.................................................................................. 6
Impacts of manufacturing variables in CWF performance ..................................... 8
Performance Assessment of CWFs: ......................................................................... 12
Effect of water chemistry variables on CWF performance .................................. 12
Discussion of the benefits of standardized performance assessments: .................... 19
Important variables in the manufacturing and testing of CWFs ........................... 19
Standardization in testing CWFs .......................................................................... 21
Improving stakeholder involvement in CWF testing ............................................ 22
Practical application of a standardized CWF testing protocol .............................. 24
Conclusion: ............................................................................................................... 25
References: ............................................................................................................... 27
CHAPTER 1 TABLES: ............................................................................................ 32
CHAPTER 1 FIGURES: .......................................................................................... 37
CHAPTER 2 ................................................................................................................ 39
Abstract: ....................................................................................................................... 40
Environmental Significance Statement: ....................................................................... 40
Introduction: ................................................................................................................. 41
Experimental: ............................................................................................................... 43
vii
Performance testing .............................................................................................. 44
Characterization of ceramic matrix....................................................................... 47
Results and discussion: ................................................................................................ 48
Performance Analysis ........................................................................................... 48
Ceramic Characterization ..................................................................................... 54
Conclusion: .................................................................................................................. 55
References: ................................................................................................................... 56
CHAPTER 2 TABLES: ............................................................................................ 62
CHAPTER 2 FIGURES: .......................................................................................... 66
CHAPTER 3: OVERALL CONCLUSION AND RECOMMENDATIONS .............. 73
viii
LIST OF TABLES
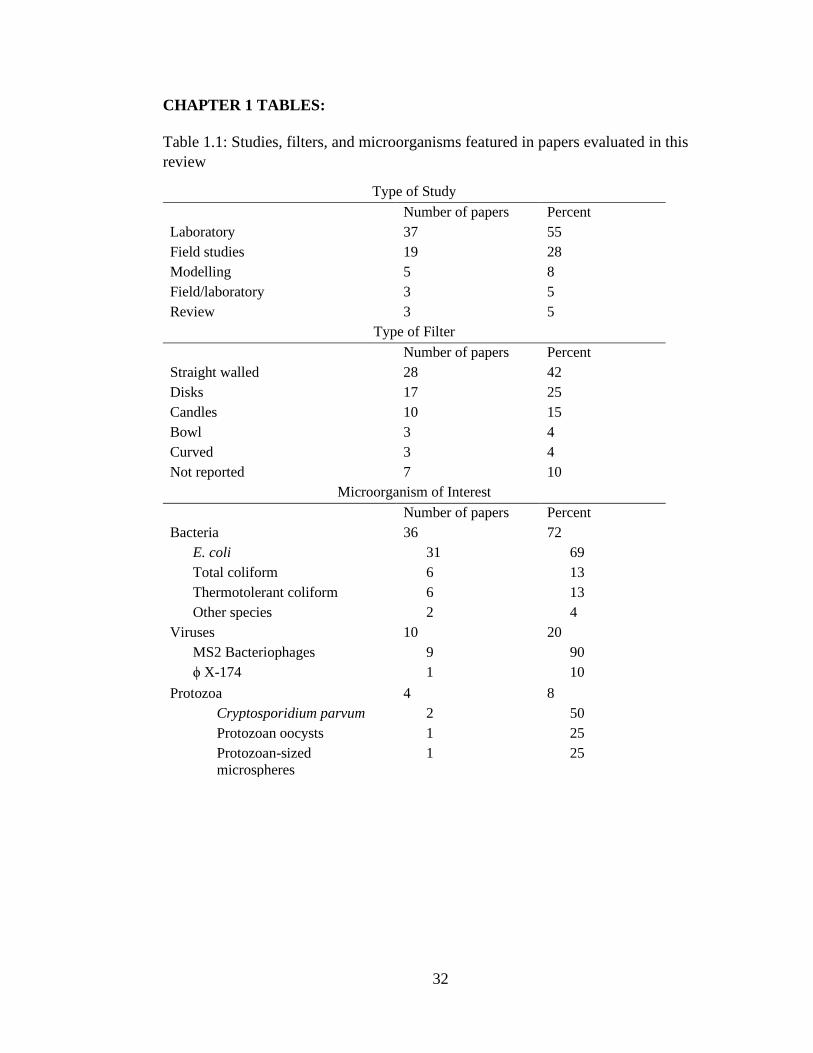
Table 1.1: Studies, filters, and microorganisms featured in papers evaluated in this
review ............................................................................................................................33
Table 1.2: CWF performance data summary ...............................................................34
Table 1.3: Clay minerals and their effect on CWF performance .................................35
Table 1.4: Water quality differences in performance studies .......................................36
Table 1.5: USEPA and WHO Influent Characteristics ................................................37
Table 2.1: Clay constituents of ovoid CWFs ...............................................................63
Table 2.2: EPA requirements and inputs for influent solutions ....................................64
Table 2.3: Reagents for influent solutions ....................................................................65
Table 2.4: Average pore sizes as determined by mercury intrusion porosimetry .........66
ix
LIST OF FIGURES
Figure 1.1: Comparing the effect of manufacturing/testing variables on LRV ...........38
Figure 1.2: Geographic distribution of publications on CWFs ....................................39
Figure 2.1: Experimental set up ...................................................................................67
Figure 2.2: CWF performance data ..............................................................................68
Figure 2.3: Silver leaching ...........................................................................................69
Figure 2.4: Selected XPS spectra .................................................................................70
Figure 2.5: Pore size distributions ................................................................................73
1
PUBLICATION STATUS
This thesis has been used as the foundation for a manuscript submitted to
Environmental Science: Nano. The literature review represents a review paper that has
been submitted to Journal of Hazardous Materials.
CHAPTER 1
MANUSCRIPT-I: PERFORMANCE ASSESSMENTS OF POINT-OF-USE
CERAMIC WATER FILTERS: A REVIEW
Zachary Shepard1, Vinka Oyanedel-Craver1
1Department of Civil & Environmental Engineering, University of Rhode Island,
Kingston, RI, 02881
*Corresponding author: Vinka Craver, [email protected]
2
Abstract:
Ceramic water filters (CWFs) are manufactured in under-served communities
across the world. The performance (measured by microbial removal) of CWFs varies
widely depending on the manufacturing practices and testing conditions used in the
performance assessment. The manufacturing and testing variables that impact CWF
performance are reviewed here. The literature review showed that CWFs tested with
synthetic solutions or manufactured with clay, sawdust, and silver nanoparticles have a
higher removal of microorganisms (LRV) compared to CWFs tested with collected
water or made with locally-sourced clay, rice husks, and silver nitrate. Currently
available standardized performance assessment procedures from the USEPA and WHO
are described and compared. The adoption of either of these procedures would likely
improve the overall performance of CWFs by providing measurements that could guide
the manufacturing process. A performance assessment procedure that could be applied
in the field could increase stakeholder involvement in the study of CWFs, which could
lead to increased use. The practical application of a standardized performance
assessment procedure is also discussed. Overall, the application of a standardized
performance assessment procedure has the potential to improve the performance of
CWFs and lead to improved health in developing communities.
Introduction:
Point-of-use (POU) drinking water treatment technology is designed to provide
safe drinking water at the household level.1,2 These technologies are an alternative in
developing communities where other treatment technologies are costly or impractical.
POU strategies involve treating and storing collected water at the point of consumption.3
3
Ideally, these technologies are low cost and prevent recontamination of the treated
water.4 POU water treatment has been reported to reduce waterborne diseases
(especially among children) by reducing the pathogenic load in drinking water.1,5–7
Ceramic water filters (CWFs) are a type of POU water treatment technology that has
been studied in the literature. CWFs have been shown to be effective against a wide
range of contaminants including bacteria8–11, organic and inorganic chemicals8,
protozoa12, and viruses13–15. This reduction in pathogenic bacteria has led to reduced
diarrheal rates in Colombia11, South Africa9, and Cambodia2, among others. CWFs are
a socially acceptable alternative because they are easy to use, low cost, utilize local
craftsmanship, and do not impart a smell or taste to the water.1,16–18 In terms of
limitations, regular cleaning is required for appropriately functioning CWFs and the
flow rate decreases over the lifetime (about 1-2 years) of the device.1,16,19,20 Also,
microbial removal (the primary performance metric) of CWFs varies depending on the
quality of the materials used in its construction.1,11,21
There are two main antimicrobial mechanisms involved in ceramic water
filtration: physical filtration and inactivation through contact with silver (in nanoparticle
or ionic form). Mechanical filtration is the main method by which water purification is
achieved in CWFs.12–14,22–24 Bacteria are removed from the contaminated water when
they are retained on the surface and within the matrix of the ceramic via size
exclusion.8,25 Membrane filters operate in the same manner, using small pores to block
contaminants that physically cannot fit through them.26,27 Sullivan et al demonstrated
that there is an active layer on the surface of the ceramic that removes roughly 103
4
CFU/gram-ceramic while around 102 CFU/gram-ceramic can be found in the matrix of
uncoated CWFs.8
Silver, usually in nanoparticle form, is added to CWFs in order to improve the
reduction of the microbial load.24,28 Silver nanoparticles (AgNPs) release silver ions,
which interact with thiol functional groups and prevent DNA replication.29 Physical
contact between microbes and AgNPs occurs on the ceramic element, where the coating
prevents biofilm formation.13,24,30,31 AgNPs also release silver ions, which disrupt
cellular functions such as respiration, electron transfer, and DNA replication.29 Silver is
mostly eluted in the ionic form from CWFs, which provides some residual disinfection
in the water storage container.22,32
Even though the performance of CWFs can vary widely, standardized
performance assessment procedure to guide the manufacture of CWFs has yet to be
universally adopted by the field.1,13–15,30,33–37 In this case, “performance assessment”
refers to testing during the manufacturing stage. For CWFs, a standard performance
assessment would guide the manufacturing process toward developing more robust
units by creating a consistent data set for manufacturers and researchers, on which
product improvements can be based. Establishing a standardized performance
assessment would allow for easy comparisons between studies of filters produced at
different factories under different conditions.
The goal of this review is to demonstrate the effect that the variables involved
in manufacturing and testing CWFs have on the reported performance. The role that the
water chemistry of the influent plays on the effectiveness and assessment protocols are
reviewed here. Currently available performance assessment procedures will be
5
evaluated based on their influent chemistry and its potential effect on results, practicality
on the field, and the data provided by following the procedure.
Current State of CWF Research
Many studies have assessed the performance and structure (mineralogy, pore
size distribution, strength, silver sorption, etc) of CWFs. 67 studies were analyzed in
this review. A breakdown of the types of studies, the filter types evaluated, and the
microorganisms of interest can be found in Table 1.1. The percentages presented under
the subcategories of the microorganisms of interest (i.e. E. coli, MS2 bacteriophages,
etc.) are representative of the subcategory. This means that the papers written about E.
coli make up 69% of the papers about bacteria, not 69% of the total.
While these studies have demonstrated the effectiveness of CWFs and provided
important data (microbial removal, silver leaching, flow rate, turbidity reduction), the
performance assessment process has been inconsistent among the studies. This
variability has led to a wide range of microbial removal values while making difficult
to determine the source of this variation. Table 1.2 presents E. coli log removal values
(LRVs) for CWFs in laboratory performance studies. The results presented in Table 1.2
are for CWFs that have been coated in AgNPs. These studies have evaluated CWFs with
a number of different shapes including straight walled (7), disks (3), and curved walls
(1). Both the chemistry of the influent solutions used for the performance assessment
and the production variables (clay source, burnout material, and silver coating) differ
among the studies. Without a unified methodology for performance assessment, studies
such as those presented in Table 1.2 cannot be directly compared.
6
Variability in CWF Structure and Performance:
Approximately 50 CWF factories operate around the globe with technical
assistance provided by Potters for Peace and Potters without Borders.41,42 Local
materials are utilized in the production of CWFs at each of the factories.30,33 The
differences in the local materials used at each location can introduce variability into the
performance of the CWFs.
Variability in manufacturing:
The manufacture of CWFs begins by conditioning both the burnout material and
clay. Burnout materials are locally sourced, low cost, and include sawdust, flour, rice
husks, or peanut shells.28,30 The clay utilized in a CWF is sourced from locally collected
soil.30,33 Both the soil and the sawdust are sieved according to the requirements in each
factory and the availability of sieves.30 Since there is no standard for the sieves used to
process the soil and sawdust, there is a great deal of variability in the grain sizes of those
materials between factories. Factories usually process soil for clay and sawdust by
sieving with meshes that have openings varying 177 to 2000 µm.30 Clay is classified as
soil with a grain size less than 2 µm and sand and silt have grain sizes between 2 and
2000 µm, so the clay utilized in CWF manufacturing is more of a clayey sand.43,44
Processing of the soil in this manner introduces variable sizes of grains into the mixture
used for the filter, which could have an impact on the microbial removal.28 The clayey
sand and burnout are mixed after sieving and water is added to the dry mixture.30 The
amount of burnout material added to a CWF varies between factories and can range
from 5-25% (by weight) of the clay/sawdust mixture.12,30,32,40 The filters are then press-
formed into the correct shape, air dried, and fired in a kiln.30,33 Firing temperatures vary
7
between 600 and 1000°C depending on what the manufacturers find effective for their
specific mix of local clay and burnout material.28,30,33
The final step in the process is coating the filter with silver, which is meant to
prevent the growth of biofilm on the ceramic and provide some residual disinfection.30
Variability in this step comes from the type, amount, and method of silver application.
CWFs are amended with silver nanoparticles (AgNPs) or silver nitrate (AgNO3).30,33,40
In the field, CWFs are coated with solutions of between 100 and 300 ppm silver.30,33
Coating a filter is usually accomplished by painting or dip coating.30,33,45 Silver has also
been fired into the ceramic matrix by mixing it with the clay/burnout mixture prior to
firing.33,39 In the last poll CWF manufacturers (2011), 56% paint on, 33% dip in, and
11% firing in either AgNO3 (17%) or AgNPs (83%).30 More CWF factories utilize
AgNPs compared to AgNO3 because they are associated with better long term
performance.33,39,40 Of the literature reviewed here, 47% of the studies used an AgNP
coating and 22% used AgNO3. The rest of the papers used uncoated CWFs (25%) or
silver of an unidentified species (6%). CWFs in these papers were painted with (59%),
dipped in (7%), or contained fired in (15%) silver. Several studies did not specify the
manner of silver application (19%). As discussed in greater detail in the next section,
the different silver types and application methods can affect the removal of
microorganisms and retention of the silver on the CWF. This has implications for the
health of the user and performance of the CWF.
Each material and process involved in the manufacture of CWFs introduces
some variability into the final product. A discussion of the manner in which the
materials and processes affect different areas of CWF performance and durability can
8
be found in the next section. The variations in each step make the filters produced at
different factories entirely unique. The microbiological removal of filters can vary based
on the variations in materials utilized in the construction phase. After construction and
quality control testing (discussed in detail later), the CWF is ready to be deployed in the
field.
Impacts of manufacturing variables in CWF performance
Each of the variables in CWF manufacturing (clay, burnout material, firing
temperature, and application of silver) affect the performance of CWFs. Oyanedel-
Craver et al demonstrated that clays with a smaller grain size produce filters with a
smaller median pore size (2.03 µm pores for red art vs. 14.3 µm pores for a locally
sourced Mexican clay) and a larger rejection of bacteria (rejection of 99.97% for red art
and 97.86% for Mexico).28 Rayner et al showed that the use of different clay materials
in CWF manufacture can reduce bacterial removal by about 50%.40 The presence of
aluminum and iron oxides in ceramic media increases performance of CWFs by
inactivating and adsorbing microorganisms.46 Clay minerology has also been shown to
effect the strength, plasticity, and sorption of silver of the ceramic.21,47–49 Table 1.3
shows the main mineral components of clays used in six studies of CWFs. The
minerology of the clay used in a CWF affects the bonding of the clay particles and,
therefore, the strength of the ceramic.21 The sorption of silver to the CWF has been
shown to be affected by differences in the smectite fraction of the clay used in the
construction of the filter.21 The cations in pyroxene and albitic phagioclase feldspar
(minerals commonly found in the clays used to make CWFs) create localized positive
charges that attract negatively charged AgNPs.21 Clays with higher amounts of these
9
minerals sorb AgNPs better. Increased sorption means better performance of the filter
over the long term as the silver is released more slowly.
Burnout materials also have an impact on the performance of the filter. The
quantity and grain size of the burnout material affect the porosity of the filter, which
changes the flow rate and the ability of the filter to remove microorganisms.33,48,50
Increasing the amount of burnout material leads to an increased flow rate.32,38 CWFs
made with burnout materials that have been sieved with a finer mesh have a smaller
pore size and a higher removal of microorganisms.51 For example, Rayner et al showed
that CWFs made with sawdust sieved between meshes with 2.38 mm and 1.19 mm
openings have a lower LRV compared to CWFs made with sawdust sieved between
meshes with 0.595 mm and 0.250 mm.51 The LRV for the CWFs made with the larger
sawdust grains was 1.87±0.261 while the CWF made with the smaller grains had an
LRV of 2.06±1.330.51 There are several types of burnout materials (sawdust, rice or
coffee husks, peanut shells, etc) and differences in the type of burnout material has been
shown to affect the performance of the CWF.34,40,51 CWFs made with coffee or rice
husks have a lower removal (LRV=0.96±0.079) compared to CWFs made with sawdust
(LRV=2.37±0.239) because the husks tend to clump together and create larger
pores.34,51
Differences in the firing temperature have been shown affect the flow rate of
CWFs.38 Increasing the firing temperature can increase the flow rate by between 4-8
liters per hour.38 The environment in which CWFs are fired also plays a role in the
performance of CWFs.52 Black ceramics are fired in a reductive atmosphere and have
been shown to have a higher removal of viruses and bacteria than CWFs fired in an
10
oxidative atmosphere.52 CWFs fired in a reductive atmosphere had an LRV of 2.32±0.85
and the same type of CWF fired in an oxidative atmosphere only had an LRV of
0.68±0.62.52
The type and method of silver application are also variables that change the
performance of the filter. Silver is either applied to CWFs as AgNPs or silver nitrate,
AgNO3. There have been several studies examining the difference in performance
between the two. AgNPs show improved performance over the long term when
compared to AgNO3.39 CWFs release AgNO3 rapidly, which increases initial removal
of microorganisms.22,31,40 AgNPs remain adhered to the ceramic surface because they
are trapped in nanoporous structures.40 Ag+ from AgNO3 is rapidly eluted from the
ceramic because it is displaced by cations with a higher valence.40 Rayner et al
demonstrated the greater elution of AgNO3 compared to AgNPs and the effect that it
can have on LRV.40 The desorption of silver from AgNO3 was 20% greater compared
to AgNPs in this study.40 Removal of E. coli by ceramic disks with 0.3 mg silver/g
ceramic was about 1-2 LRV higher for AgNO3 compared to AgNPs coated.40 The higher
removal stems from the continued inactivation of bacteria via interactions with eluted
silver in the effluent of the filter.13,40 This high removal does not last long because all
of the silver ions are eluted from the filter quickly.40 Rayner et al predicted that all of
the silver desorbs in 1 year for a filter coated in AgNO3 and 8 years for a filter coated
in AgNPs.40 These predictions demonstrate that AgNO3 is eluted from the CWFs faster
compared to AgNPs. A CWF coated with a monodisperse solution of small AgNPs more
effectively removes bacteria than a polydisperse solution of large particles.8 Smaller
AgNPs showed increased removal of microorganisms because they have more available
11
surface area.8,39 A monodisperse solution of AgNPs ensures that the majority of the
AgNPs are in the desired size range, so the majority have the highest level of toxicity.8
Casein stabilized AgNPs in Sullivan et al had a higher poly-dispersivity index (PDI)
compared to AgNPs made with rosemary and maltose: 0.58, 0.12, and 0.18 for casein,
rosemary, and maltose AgNPs, respectively.8 Ceramic disks coated with casein AgNPs
had about 0.5 LRV less E. coli removal than rosemary and maltose AgNPs (which had
roughly the same performance) throughout the 11 day study.8
The method by which the silver is applied to the filter also affects its release and
the performance of the filter. CWFs are painted with, dipped in, or fired with silver.30
CWFs are usually painted with AgNPs; capillary action transports the silver
nanoparticles into the small pores.45 When CWFs are dipped into a solution of AgNPs,
the pressure forces the particles into the pores of the ceramic.45 The silver tends to
segregate to the exterior surfaces near the pores in this production scenario.53 No silver
can be found on the inside of the ceramic when dip coating.53 Dipping and painting
release roughly the same amount of silver while firing in releases about 0.3% of that
amount.45 When using AgNO3, the firing in technique has been shown to release less
silver while still providing disinfection.39 5-10 times the amount of silver is required in
order for filters with fired in AgNO3 to have equivalent LRVs to filters with painted
AgNPs.39 This may be applicable in the field because AgNO3 is less expensive than
AgNPs.39 The firing in technique prevents silver from being oxidized, eluted from the
filter during use, or scrubbed off during cleaning.31 It also removes a step in the
manufacturing process by eliminating the need for coating the ceramic.39
12
The filter’s users can also affect the performance of CWFs. Regular maintenance
is essential for the continued use of CWFs.54,55 The microbial removal and flow rate of
CWFs declines over time, but with maintenance this decline can be slowed.55 The
regular maintenance that is required by CWFs has the potential to lead to
recontamination or breakage of the ceramic.20 CWFs usually come with a safe storage
container that holds a reservoir of treated water.9,17,20,24,32 Separating the ceramic from
its safe storage container for cleaning exposes the treated water to recontamination.20
Farrow et al demonstrated that there is a statistically significant difference between log
removal of E. coli by CWFs studied in the field and in the laboratory.56 One of the
reasons for this difference was the users’ interactions with the filter.56 Recontamination
of the water in the safe storage container associated with the CWF frequently occurs
during cleaning of the filter element.56 The manner in which users interact with a CWF
is yet another variable that effects filter performance.
While each of the variables discussed here has an effect on the performance of
the CWF, the most profound variations in performance stem from differences in clay
and burnout materials. The type and quality of clay and burnout materials vary widely
between factories established across the world.30,40 As discussed previously, the
variations in these materials have a large impact on the manufacturing process and the
performance of the final product.
Performance Assessment of CWFs:
Effect of water chemistry variables on CWF performance
In order to study the implications of the current performance assessment
procedures, it is essential to understand the potential effects of the influent water
13
chemistry. Important water chemistry parameters for CWF testing include turbidity,
natural organic matter (NOM), total dissolved solids (TDS), microbial load, pH, and
chlorine concentration. Of these parameters, turbidity, NOM, TDS, and microbial load
have been studied within the context of their effect on microbial removal. Turbid water
increases the removal of viruses by CWFs (via adsorption onto larger particles that are
strained out).15,19 An increase the turbidity of the influent from 0 to 2 NTU leads to an
increase in viral removal from 0.2-0.4 LRV to 1.3-1.4 LRV.15 NOM coats AgNPs,
preventing dissolution and minimizing their toxicity and microbial removal.31,57 In
controlled, laboratory scale testing, AgNPs exhibited lower toxicity in solutions with
high concentrations of divalent cations.58 The survival of E. coli increased from 9% at
10 mg/L Mg+2 to 20% at 1000 mg/L Mg+2.58 Increasing the concentration of Ca+2 from
10 mg/L to 1000 mg/L had a similar effect, increasing the survival rate of E. coli from
3.5% to 20%.58 Differences in the microbial load in CWF testing can also affect
microbial removal, where a higher microbial load increases the measured LRV.59
Turbidity, TDS, pH, and chlorine concentration also have an effect on silver
release. An increased turbidity has been shown to increase silver release.10 Mikelonis et
al reported that the solids in turbid water form complexes with the silver on the filter,
pulling the silver off of the filter.10 Increases in ionic strength (especially the
concentration of divalent cations) and chlorine increase effluent silver
concentrations.10,22,31 When the TDS of the influent solution was increased from 10 mM
to 50 mM NaNO3 in Mittelman et al, the concentration of effluent silver increased from
about 0.1 mg/L to 0.8 mg/L.22 At a constant ionic strength of 10 mM, solutions
containing Mg2+ and Ca2+ caused 2-4 times more silver leaching from AgNP coated
14
filters compared to solutions containing Na+.22 The silver eluted from the AgNP coated
filters was mostly (>90%) ionic.22 An increase in free chlorine residual from 0 to 2 mg/L
increases the effluent silver concentration from AgNP painted disks 2-5 times.31
Increasing the pH of the influent from 7 to 9 has been shown to decrease silver release
by a factor of 7 for AgNP coated CWFs.22
Each of these variables affects the performance of the filters in the field and
during performance assessments. The TDS of the influent solutions is likely the most
important factor in the performance of CWFs. It has a strong influence on the AgNP
coating and can affect silver toxicity and release.22,57 Differences in influent chemistry
between studies and performance assessments make it difficult to determine whether
the source of differences in performance is the CWF or the influent solution.
Previous studies have reported the performance of CWFs under a range of water
chemistry conditions (Table 1.4). Several of these have examined CWFs produced in
the same country under different water chemistry conditions. The removal of E. coli by
these filters ranged from 1.1 to 2.9 LRV.13,14,32 The differences in influent chemistry as
well as manufacturing techniques make comparisons among the studies difficult. This
is particularly apparent in the studies that use surface water for performance assessment.
Table 1.4 shows the water chemistry conditions reported for the studies in Table 1.2 that
utilize collected water. The studies in Table 1.2 that utilize a chemically-defined
throughput, such as phosphate buffer solution, are not included in Table 1.4 As
discussed previously, each of the variables reported in Table 1.4 can affect the
performance of a CWF. As previously discussed, total dissolved solids has an impact
on filter performance, but this parameter is not included in Table 1.4. This is because
15
none of the studies report this parameter. The E. coli LRVs for the filters in these studies
range from 1.1 to 5.6. Since the water quality varies between the studies, it is difficult
to determine if the variations in performance come from variations in the filters or the
influent water chemistry.
Currently available standardized performance assessment procedures
There are two main performance assessment procedures that have been
established: one by the USEPA and the other by the World Health Organization (WHO).
The goals of these procedures are different from the quality control procedures currently
utilized in the field. CWF manufacturers frequently employ a set of quality control
techniques to ensure the quality of their filters before they are sold. These techniques
do not inform the manufacturing process and, therefore, are not performance
assessments as defined here. Most CWF factories perform visual inspections throughout
the manufacturing process.30 Some factories use acoustic quality control by tapping the
filters and listening for resonance present if there are no cracks in the filter.37 The flow
rate of CWFs is used as the primary metric for quality control; CWFs need to have a
flow rate between 1 and 5 L/hr in order to pass this quality control test (specific flow
rate ranges vary by factory).15,20,28,30,36 Filters with flow rates above the acceptable range
are likely cracked and therefore cannot effectively filter out microbial contaminants.30
Quality control performed on the CWFs is important for the delivery of quality CWFs,
but this does little to inform the manufacturing process. Performance assessments
undertaken during the design cycle can improve the manufacturing process.
The USEPA Guide Standard and Protocol for Testing Microbiological Water
Purifiers was published in 1987, but has yet to receive much attention from the CWF
16
field.60 The USEPA guide dictates a 13 day testing period with three different influent
chemistries: general (normal operation), challenge (worst case scenario), and leaching
(stressful conditions for silver coated units).60 The conditions for testing can be found
in Table 1.5. The general water phase was designed to simulate normal operation.60 The
normal operation of a CWF utilizes an influent solution that does not promote the
dissolution of AgNPs or have a detrimental effect on the water production or microbial
removal of the filter. This phase has a low TDS, turbidity, and concentration or NOM
and a roughly neutral pH.60 The challenge water has a higher pH, total organic carbon
(TOC), turbidity, and TDS than the other two testing waters. Increasing the turbidity
can decrease the flow rate and increase removal of microorganisms.15,19,61 The predicted
effect that this influent will have on the release of silver is interesting because of the
pH, turbidity, and TDS. The increased turbidity and TDS will likely increase the release
of silver, but increased pH has been shown to prevent that release.10,22 In our previous
work, we demonstrated that the increase in turbidity and TDS has more of an effect on
silver release than the pH. The leaching phase is the final phase of the USEPA testing.
This phase is designed to the leaching of the silver on the CWF and ensure that excess
silver will not be leached into drinking water.60 The pH is slightly lower in the leaching
phase compared to the general water phase (5.0±0.2), which encourages the release of
silver from the nanoparticles.60 Our previous research using this protocol has
demonstrated that the procedure allows a framework for producing data on a number of
performance metrics including flow rate, turbidity reduction, removal of
microorganisms, and release of silver. One complete performance assessment using the
USEPA protocol CWFs costs $60 USD per filter (based on the cost of the reagents
17
required to complete the analysis). This value reflects the cost of the influent solution
constituents and not the general laboratory equipment required to complete the
procedures.
The World Health Organization (WHO) has also released a performance
assessment procedure similar to the one created by the USEPA (General Testing
Protocol #6: Ceramic Pot Gravity Flow Mechanical Filtration Batch System
Technology (with and without a silver component).62 The time commitment is slightly
shorter than the USEPA procedure (11 days compared to 13 days). One trial of the WHO
protocol costs $67 USD per filter (under the same assumptions as the USEPA protocol).
The WHO procedure provides a framework for data collection that is similar to the
USEPA protocol. A comparison between the influent chemistries used in the USEPA
and WHO performance assessments can be found in Table 1.5. There are several
differences between the USEPA and WHO protocols60,62 One of the most notable
differences between the two protocols is the difference in influent chemistry. The WHO
protocol calls for the addition of alkalinity using sodium bicarbonate, NaHCO3. The
addition of alkalinity in the WHO protocol is designed to buffer the pH of the influent.62
The pH values for the general and challenge influents in the WHO protocol are 7.0±0.5
and 9.0±0.2, respectively.62 The addition of sodium bicarbonate allows the buffering of
the influent pH at the required values for the general and challenge phases.63,64 Only
inorganic acids and bases are allowed to adjust the pH of the USEPA protocol which
makes the targets more difficult to reach. Buffering the influent makes it easier to reach
a consistent pH value.
18
The WHO procedure begins with a conditioning phase. During this phase, 200L
of dechlorinated tap water local to the CWF manufacturer is filtered through the CWF.62
This does not count toward the volume of water filtered during testing and there is no
microbial addition during this phase.62 The addition of the conditioning phase is
interesting because it allows the flow rate to stabilize without requiring labor intensive
sampling. Reducing the amount of sampling reduces the intensity of the work required.
The USEPA and WHO protocols also require the use of different
microorganisms for their performance assessment. The USEPA protocol dictates the use
of Klebsiella terrigena (ATCC 33257), poliovirus 1 (LSc) (ATCC-VR-59), rotavirus
Wa (ATCC-VR-899) or SA-11 (ATCC-VR-2018), and Giardia muris or Giardia
lamblia.60 The WHO requires E. coli (ATCC 11229), MS-2 coliphage (ATCC 15597-
B1) or Salmonalla typhimurium (WG4 NCTC 12484) and phiX-174 coliophage (ATCC
13706-B1), and Cryptosporidium parvum oocysts.62 The WHO procedure also requires
a smaller amount of bacteria added to the influent: 105 CFU/100 mL compared to 107
CFU/100 mL in the EPA study.60,62 The differences in microorganisms between these
two procedures has some implications for their applicability in the field. Klebsiella
terrigena was reclassified Raoultella terrigena after the creation of the EPA document
and is now considered as biosafety level 2 organism by the ATCC.65,66 The strain of E.
coli utilized in the WHO procedure is a biosafety level 1 organism and could safely be
used at a CWF factory. Of course, the EPA protocol could be adapted to incorporate a
safer bacterium as we have done in our previous research.
The final difference between the USEPA and WHO protocols is the presence of
a leaching phase in the USEPA guide. There is no equivalent phase in the WHO
19
protocol. This helps lower the amount of time invested in the performance assessment
testing by two days. The silver leaching phase is, however, an important part of the
CWF performance assessment. Silver coatings are an essential part of the performance
of CWFs and need to be measured in any performance assessment. While accurately
determining the concentration of silver in the effluent of the CWF usually requires
specialized equipment, such as inductively coupled plasma-mass spectrometry19,30,-
optical emission spectroscopy8, or-atomic emission spectroscopy40, there are other
alternatives. Spectrophotometric techniques can be used to quantify silver
concentrations to below the WHO silver consumption limit of 100 ppb.67,68 This means
that silver concentration measurements could be taken at CWF factories during the
design phase to ensure high removal throughout the unit’s lifetime.
Discussion of the benefits of standardized performance assessments:
Important variables in the manufacturing and testing of CWFs
The previous sections have discussed the variables that effect the microbial
removal of CWFs. Table 1.2 contains comparisons between laboratory studies that
examine the ability of CWFs to remove E. coli. Figure 1.1 shows the effect of
manufacturing and testing conditions on measured performance. The types of clay,
burnout material, and silver coating were examined as the manufacturing conditions of
interest. Of the manufacturing parameters examined in Figure 1.1, the clay source
creates the largest variability in LRV. CWFs made with local clays had a range of LRVs
between 1.2 and 5.6. Red Art clay is a commercial blend with a smaller grain size than
the local clays that are normally used in CWF manufacture.28 The studies that utilized
this clay had a much smaller distribution (3.7-4.3 LRV). This distribution is based on
20
the LRVs from two studies examining five CWF samples. The burnout material used in
the construction of a CWF has the most potential to improve the LRV. CWFs made with
sawdust have an average LRV two times that of CWFs made with rice husks. Figure 1.1
demonstrates that a CWF made with clay with a smaller grain size (like Red Art clay),
sawdust, and AgNPs will likely have a higher LRV than a CWF made with different
components.
The testing condition evaluated in Figure 1.1 is the influent solution, comparing
natural water (surface or well water) with synthetic solutions (phosphate buffer solution,
WHO challenge water, etc). Studies utilizing simple, synthetic solutions tend to
overestimate the LRV of CWFs that are deployed in the field and evaluated using natural
water. CWFs studied using synthetic solutions, such as WHO challenge water or
phosphate buffer solution, had a higher average LRV (4.2) compared to CWFs studied
with natural water (2.6). These studies also had a smaller range of LRVs (3.0-5.6)
compared to CWFs that were evaluated using natural water (1.2-4.6). The natural waters
have a range in water chemistry conditions (Table 1.4), which could increase the
variability in LRV measurements. The smaller range of LRV in the synthetic solutions
category shows that a standardized performance technique could be used to reduce
variability in performance assessments. The studies that utilize a chemically defined
throughput eliminate some of the variability seen in studies using natural water and
improve the precision of the LRV. A standardized performance assessment with a
standard influent chemistry, such as the WHO or USEPA protocols, could reduce the
variability even more.
21
Standardization in testing CWFs
The goal of a standardized performance assessment for CWFs is to guide the
manufacturing process in order to improve microbial removal. This review addressed
the many manufacturing and performance assessment variables that can affect the
performance of CWFs. Manufacturing and performance assessment variables lead to
differences in measured removal, evidenced in Table 1.2 where E. coli removal is shown
to range between 1.1 and 5.6 LRV. The studies included in Table 1.2 had variability in
the influent solution, clay origin, burnout material, type of silver, and testing procedures.
With all of these variables present, it is not possible to determine whether the testing
procedure or the CWFs themselves create differences in LRV.
The implementation of a standardized performance assessment procedure, such
as the USEPA or WHO protocols discussed previously, could highlight differences in
CWF performance that are attributable to the manufacturing process.13,36 As discussed
in previous sections, both the manufacturing differences and testing conditions can
affect CWF performance. Standardized testing conditions highlight the manner in which
differences in manufacturing lead to differences in performance. The USEPA and WHO
protocols also provide a framework for testing that allows the evaluation of a number
of different performance metrics. Traditional quality control testing for CWFs only
involves the measurement of flow rate.15,20,28,30,36 The performance assessment
procedures discussed here provide a framework for measuring microbial removal,
turbidity reduction, flow rate, and silver leaching.60,62 The information collected during
the performance testing would improve CWF performance by assisting CWF
manufacturers in selecting raw materials that impart a higher performance to the final
22
product. Performance comparisons between filter factories will help set a standard to
which the manufacturers can hold themselves. A standardized performance assessment
would help manufacturers identify the weaknesses in their process by allowing them to
compare performance data with other manufacturers. When incorporated into the
evaluation of CWFs, these protocols could help shape the manufacture of CWFs by
relating improved performance to manufacturing practices that might differ between
factories.
Both the USEPA and WHO procedures could be applied in the field. The
materials utilized in the protocols can be acquired easily online and all the required
measurements are easy to take with some technical training. The implementation of
either the USEPA or WHO procedures would improve CWF and drinking water quality
in developing communities.30 Focusing on variability in the CWF itself will allow
researchers to guide changes to manufacturing that can improve the microbial removal
of the CWFs. It is difficult to guide manufacturing changes given the current state of
the literature because there is too much variability in the testing solutions.
Improving stakeholder involvement in CWF testing
Social acceptance and education are key factors in the use of CWFs.35 In many
areas, people do not use a CWF because they believe that their water is safe to drink
without treatment.35 In others, they do not know where they could purchase a CWF.69
This demonstrates a lack of stakeholder involvement and understanding in the use of
CWFs. The studies reviewed here have demonstrated a lack of stakeholder involvement
in the assessment of CWF performance, which leads to a disparity between the groups
who analyze CWFs and those who utilize them.
23
The currently available literature evaluates CWFs from around the world on a
variety of different performance metrics including microbial removal, flow rate, and
ceramic strength among many others. 34% of these studies use CWFs or the raw
materials used to make CWFs from Asia, 32% from Central and South America, and
34% from Africa. These are areas in which CWFs are manufactured and used
frequently. Studies on CWFs are rarely developed by communities that manufacture and
utilize CWFs. Figure 1.2 is a geographic breakdown of the areas where studies on CWFs
are performed. This was determined by looking at the contact information for the final
author on the paper. 90% of the publications on CWFs were guided by researchers from
the United States, Canada, and Europe. Only 10% of the studies that evaluate CWFs
have last authors with contact information matching the field study location or the
source of the ceramic materials used in testing. This means that stakeholder involvement
in the development of CWFs is severely limited.
Ideally, the stakeholders would evaluate the performance of a CWFs and guide
the manufacturing process in order to improve the performance based on their goals. A
standardized performance assessment could help increase stakeholder involvement by
empowering filter manufacturers and local researchers to analyze the performance of
CWFs. The members of the community would be able to set and achieve their own
performance goals by evaluating the performance of the filter using a consistent
standard. This would allow community members greater access to the science behind
CWF manufacture and greater control over the valued performance metrics. Increased
stakeholder involvement in the production and performance assessment of CWFs could
lead to greater social acceptance, increased CWF use, and improved health in
24
developing communities. If either the USEPA or WHO procedures were applied at the
factory level, then CWFs could be studied, designed, manufactured, and evaluated by
the stakeholders.
Practical application of a standardized CWF testing protocol
While useful, the USEPA and WHO protocols require a great deal of resources
and time. CWF factories will not be able to test every unit that they produce. The
standard protocols should be utilized at least during factory start up and whenever there
are changes in the manufacturing process (different sources of raw materials, a change
in firing time/temperature, etc.). Ideally, the performance would be measured at regular
intervals specified by the manufacturer. The testing should occur at local laboratories or
universities. If this is not possible, filters could be sent to laboratories abroad. This
should be reduced as much as possible because one of the goals of a standardized
performance assessment is to incorporate the stakeholder in the process. Since the
performance assessments are standardized, manufacturers can be confident that their
filters are being treated the same at any laboratory they choose.
Data sharing is an important aspect of the implementation of a standardized
performance assessment procedure. CWF manufacturers need a method of reporting
their data and making comparisons with other manufacturers. An internet forum is likely
the best way for manufacturers to communicate and share information. This would
allow them to post their data and coordinate with research groups or other
manufacturers. Research groups outside of the stakeholder communities could assist
with higher level measurements and characterization (such as mercury intrusion
porosimetry or X-ray diffraction). An internet forum would also increase access to data
25
for modelling studies. Only 7.5% of the CWF studies reviewed here involved modelling.
Greater access to data sets gathered using standardized methods could provide the
opportunity for more modelling studies to be performed on CWFs. Appropriate data
sharing would allow manufacturers to communicate the processes that improve
microbial removal, which would bring about greater access to clean water and improved
health in developing communities.
Conclusion:
A standardized performance assessment procedure for CWFs has the potential
to positively impact health in developing communities worldwide. The performance of
CWFs varies depending on the materials used in production and the chemistry of the
testing solution. It would be impractical to study the effect of each of the possible
combinations of CWF production materials in a single study. About 40 factories
produce CWFs worldwide and each one utilizes a different set of raw materials. The
standardized performance assessments described here could help manufacturers
recognize practices that improve the performance of CWFs. Standardization of the
protocol used to assess performance would highlight the differences between filters
produced at different factories. This assessment would lead to the production of higher
quality CWFs, which would, in turn, produce higher quality drinking water and
improved health in developing communities. In this review, we explored the many
variables involved in the manufacture and evaluation of CWFs. The benefits of currently
available performance assessment procedures were evaluated. Standardized
performance assessment procedures have the potential improve health in developing
26
communities by improving stakeholder involvement and ensuring the development of
manufacturing processes that produce high quality CWFs.
Supporting Information:
Supplementary data can be found online.
Corresponding Author:
* Dr. Vinka Oyanedel-Craver: [email protected].
Conflicts of Interest:
There are no conflicts of interest to declare.
ACKNOWLEDGMENT
This work was funded by: NSF CBET Award# 1350789.

27
References:
1 M. Sobsey, Managing Water in the Home: Accelerated Health Gains from
Improved Water Supply Water, Sanitation and Health Department of Protection
of the Human Environment World Health Organization Geneva, 2002.
2 D. Loomis, M. D. Sobsey and J. Brown, Local Drinking Water Filters Reduce
Diarrheal Disease in Cambodia: A Randomized, Controlled Trial of the
Ceramic Water Purifier, Am. J. Trop. Med. Hyg., 2008, 79, 394–400.
3 M. D. Sobsey, C. M. Stauber, L. M. Casanova, J. M. Brown and M. M. Elliott,
Point of Use Household Drinking Water Filtration: A Practical, Effective
Solution for Providing Sustained Access to Safe Drinking Water in the
Developing World, Environ. Sci. Technol., 2008, 42, 4261–4267.
4 World Health Organization, Household Water Treatment and Safe Storage: A
Manual for the Participant, Geneva, 2013.
5 L. Fewtrell, R. B. Kaufmann, D. Kay, W. Enanoria, L. Haller and J. M. Colford,
Water, sanitation, and hygiene interventions to reduce diarrhoea in less
developed countries: a systematic review and meta-analysis, Infect. Dis.
(Auckl)., 2005, 5, 42–52.
6 T. Clasen, S. Nadakatti and S. Menon, Microbiological performance of a water
treatment unit designed for household use in developing countries, Trop. Med.
Int. Heal., 2006, 11, 1399–1405.
7 H. Waddington, B. Snilstveit and L. Fewtrell, Water sanitation and hygiene
interventions to combat childhood diarrhoea in developing countries, 2009.
8 R. K. Sullivan, M. Erickson and V. A. Oyanedel-Craver, Understanding the
microbiological, organic and inorganic contaminant removal capacity of
ceramic water filters doped with different silver nanoparticles, Environ. Sci.
Nano, 2017, 4, 2348–2355.
9 L. S. Abebe, J. A. Smith, S. Narkiewicz, V. Oyanedel-Craver, M. Conaway, A.
Singo, S. Amidou, P. Mojapelo, J. Brant and R. Dillingham, Ceramic water
filters impregnated with silver nanoparticles as a point-of-use water-treatment
intervention for HIV-positive individuals in Limpopo Province, South Africa: A
pilot study of technological performance and human health benefits, J. Water
Health, 2014, 12, 288–300.
10 A. M. Mikelonis, D. F. Lawler and P. Passalacqua, Multilevel modeling of
retention and disinfection efficacy of silver nanoparticles on ceramic water
filters, Sci. Total Environ., 2016, 566–567, 368–377.
11 T. Clasen, G. Garcia Parra, S. Boisson and S. Collin, Household-based ceramic
water filters for the prevention of diarrhea: A randomized, controlled trial of a
pilot program in Colombia, Am. J. Trop. Med. Hyg., 2005, 73, 790–795.
12 L. S. Abebe, Y. Su, R. L. Guerrant, N. S. Swami and J. A. Smith, Point-of-Use
Removal of Cryptosporidium parvum from Water: Independent Effects of
Disinfection by Silver Nanoparticles and Silver Ions and by Physical Filtration
in Ceramic Porous Media, Environ. Sci. Technol., 2015, 49, 12958–12967.
13 H. Van der Laan, D. van Halem, P. W. M. H. Smeets, A. I. A. Soppe, J.
Kroesbergen, G. Wubbels, J. Nederstigt, I. Gensburger and S. G. J. Heijman,
Bacteria and virus removal effectiveness of ceramic pot filters with different
28
silver applications in a long term experiment, Water Res., 2014, 51, 47–54.
14 J. Brown and M. D. Sobsey, Microbiological effectiveness of locally produced
ceramic filters for drinking water treatment in Cambodia, J. Water Health,
2010, 8, 1–10.
15 H. Salsali, E. McBean and J. Brunsting, Virus removal efficiency of Cambodian
ceramic pot water purifiers, J. Water Health, 2011, 9, 306–311.
16 A. Pérez-Vidal, J. Diaz-Gómez, J. Castellanos-Rozo, O. L. Usaquen-Perilla, A.
Perez-Vidal, J. Diaz-Gómez, J. Castellanos-Rozo and O. L. Usaquen-Perilla,
Long-term evaluation of the performance of four point-of-use water filters,
Water Res., 2016, 98, 176–182.
17 H. Mohamed, T. Clasen, R. M. Njee, H. M. Malebo, S. Mbuligwe and J.
Brown, Microbiological effectiveness of household water treatment
technologies under field use conditions in rural Tanzania, Trop. Med. Int. Heal.,
2016, 21, 33–40.
18 D. Ren, L. M. Colosi and J. A. Smith, Evaluating the sustainability of ceramic
filters for point-of-use drinking water treatment, Environ. Sci. Technol., 2013,
47, 11206–11213.
19 D. van Halem, Delft University of Technology, 2006.
20 D. van Halem, H. van der Laan, S. G. J. Heijman, J. C. van Dijk and G. L.
Amy, Assessing the sustainability of the silver-impregnated ceramic pot filter
for low-cost household drinking water treatment, Phys. Chem. Earth, 2009, 34,
36–42.
21 V. Oyanedel-Craver, S. Narkiewicz, R. Genovesi, A. Bradshaw and D. Cardace,
Effect of local materials on the silver sorption and strength of ceramic water
filters, J. Environ. Chem. Eng., 2014, 2, 841–848.
22 A. M. Mittelman, D. S. Lantagne, J. Rayner and K. D. Pennell, Silver
Dissolution and Release from Ceramic Water Filters, Environ. Sci. Technol.,
2015, 49, 8515–8522.
23 J. Huang, G. Huang, C. An, Y. He, Y. Yao, P. Zhang and J. Shen, Performance
of ceramic disk filter coated with nano ZnO for removing Escherichia coli from
water in small rural and remote communities of developing regions, Environ.
Pollut., 2018, 238, 52–62.
24 E. N. Kallman, V. A. Oyanedel-Craver and J. A. Smith, Ceramic Filters
Impregnated with Silver Nanoparticles for Point-of-Use Water Treatment in
Rural Guatemala, J. Environ. Eng., 2011, 137, 407–415.
25 A. R. Bielefeldt, K. Kowalski and R. S. Summers, Bacterial treatment
effectiveness of point-of-use ceramic water filters, Water Res., 2009, 43, 3559–
3565.
26 S. Allgeier, Membrane Filtration Guidance Manual, 2005.
27 Malcom Pirnie, CH2M Hill and Separation Processes, Low-pressure Membrane
Filtration for Pathogen Removal: Application, Implementation, and Regulatory
Issues, 2001.
28 V. A. Oyanedel-Craver and J. A. Smith, Sustainable colloidal-silver-
impregnated ceramic filter for point-of-use water treatment, Environ. Sci.
Technol., 2008, 42, 927–933.
29 L. M. Stabryla, K. A. Johnston, J. E. Millstone and L. M. Gilbertson, Emerging
29
investigator series: It’s not all about the ion: Support for particle-specific
contributions to silver nanoparticle antimicrobial activity, Environ. Sci. Nano,
2018, 5, 2047–2068.
30 The Ceramics Manufacturing Working Group, Best Practice Recommendations
for Local Manufacturing of Ceramic Pot Filters for Household Water
Treatment, Atlanta, GA, 2011.
31 B. A. Lyon-Marion, A. M. Mittelman, J. Rayner, D. S. Lantagne and K. D.
Pennell, Impact of chlorination on silver elution from ceramic water filters,
Water Res., 2018, 142, 471–479.
32 D. van Halem, H. van der Laan, A. I. A. Soppe and S. G. J. Heijman, High flow
ceramic pot filters, Water Res., 2017, 124, 398–406.
33 J. Rayner, B. Skinner and D. Lantagne, Current practices in manufacturing
locally-made ceramic pot filters for water treatment in developing countries, J.
Water Sanit. Hyg. Dev., 2013, 3, 252–261.
34 D. Lantagne, M. Klarman, A. Mayer, K. Preston, J. Napotnik and K. Jellison,
Effect of production variables on microbiological removal in locally-produced
ceramic filters for household water treatment, Int. J. Environ. Health Res.,
2010, 20, 171–187.
35 A. Bogler and R. Meierhofer, The challenge of producing and marketing
colloidal silver water filters in Nepal, Water (Switzerland), 2015, 7, 3599–3612.
36 A. Lemons, A. Branz, M. Kimirei, T. Hawkins and D. Lantagne, Assessment of
the quality, effectiveness, and acceptability of ceramic water filters in Tanzania,
J. Water, Sanit. Hyg. Dev., 2016, 6, 195–204.
37 K. J. Lucier, S. E. Dickson-Anderson and C. J. Schuster-Wallace, Effectiveness
of silver and copper infused ceramic drinking water filters in reducing
microbiological contaminants, J. Water Supply Res. Technol. - AQUA, 2017,
66, 528–536.
38 A. I. A. Soppe, S. G. J. Heijman, I. Gensburger, A. Shantz, D. Van Halem, J.
Kroesbergen, G. H. Wubbels and P. W. M. H. Smeets, Critical parameters in
the production of ceramic pot filters for household water treatment in
developing countries, J. Water Health, 2015, 13, 587–599.
39 K. N. Jackson and J. A. Smith, A New Method for the Deposition of Metallic
Silver on Porous Ceramic Water Filters, J. Nanotechnol., 2018, 1–9.
40 J. Rayner, H. Zhang, J. Schubert, P. Lennon, D. Lantagne and V. Oyanedel-
Craver, Laboratory investigation into the effect of silver application on the
bacterial removal efficacy of filter material for use on locally produced ceramic
water filters for household drinking water treatment, ACS Sustain. Chem. Eng.,
2013, 1, 737–745.
41 J. Mally, Potters for Peace, https://pottersforpeace.org/?page_id=8, (accessed 2
May 2019).
42 B. Cohen, Potters Without Borders,
http://www.potterswithoutborders.com/aboutus-2/, (accessed 3 September
2018).
43 M. Konert and J. Vandenberghe, Comparison of laser grain size analysis with
pipette and sieve analysis: a solution for the underestimation of the clay
fraction, Sedimentology, 1997, 44, 523–535.
30
44 S. J. Williams, M. A. Arsenault, B. J. Buczkowski, J. A. Reid, J. G. Flocks, M.
A. Kelp, S. Penland and C. J. Jenkins, Surficial sediment character of the
Louisiana offshore Continental Shelf region: a GIS Compilation,
https://pubs.usgs.gov/of/2006/1195/index.htm, (accessed 5 February 2020).
45 D. Ren and J. A. Smith, Retention and transport of silver nanoparticles in a
ceramic porous medium used for point-of-use water treatment, Environ. Sci.
Technol., 2013, 47, 3825–3832.
46 J. Brown and M. D. Sobsey, Ceramic media amended with metal oxide for the
capture of viruses in drinking water, Environ. Technol., 2009, 30, 379–391.
47 E. Annan, K. Kan-Dapaah, S. T. Azeko, K. Mustapha, J. Asare, M. G. Zebaze
Kana and W. Soboyejo, Clay Mixtures and the Mechanical Properties of
Microporous and Nanoporous Ceramic Water Filters, J. Mater. Civ. Eng., 2016,
28, 04016105.
48 F. O. Ajibade, S. I. Akosile, O. E. Oluwatuyi, T. F. Ajibade, K. H. Lasisi, J. R.
Adewumi, J. O. Babatola and A. M. Oguntuase, Bacteria removal efficiency
data and properties of Nigerian clay used as a household ceramic water filter,
Results Eng., 2019, 2, 100011.
49 L. Hubbel, A. C. Elmore and M. Reidmeyer, Comparison of a native clay soil
and an engineered clay used in experimental ceramic pot filter fabrication,
Water Sci. Technol. Water Supply, 2015, 15, 569–577.
50 J. M. Hagan, N. Harley, D. Pointing, M. Sampson, K. Smith and V. Soam,
Cambodia Ceramic Water Filter Handbook, Version 1.1, Phnom Penh,
Cambodia, 2009.
51 J. Rayner, X. Luo, J. Schubert, P. Lennon, K. Jellison and D. Lantagne, The
effects of input materials on ceramic water filter efficacy for household
drinking water treatment, Water Sci. Technol. Water Supply, 2017, 17, 859–
869.
52 L. Guerrero-Latorre, M. Rusinol, A. Hundesa, M. Garcia-Valles, S. Martinez,
O. Joseph, S. Bofill-Mas, R. Girones, M. Rusiñol, A. Hundesa, M. Garcia-
Valles, S. Martinez, O. Joseph, S. Bofill-Mas and R. Girones, Development of
improved low-cost ceramic water filters for viral removal in the haitian context,
J. Water Sanit. Hyg. Dev., 2015, 5, 28–38.
53 C. Larimer, N. Ostrowski, J. Speakman and I. Nettleship, The segregation of
silver nanoparticles in low-cost ceramic water filters, Mater. Charact., 2010,
61, 408–412.
54 J. Rayner, Loughborough University, 2009.
55 J. Mellor, L. Abebe, B. Ehdaie, R. Dillingham and J. Smith, Modeling the
sustainability of a ceramic water filter intervention, Water Res., 2014, 49, 286–
299.
56 C. Farrow, E. McBean, G. Huang, A. L. Yang, Y. C. Wu, Z. Liu, Z. N. Dai, H.
Y. Fu, T. Cawte and Y. P. Li, Ceramic water filters: A point-of-use water
treatment technology to remove bacteria from drinking water in Longhai City,
Fujian Province, China, J. Environ. Informatics, 2018, 32, 63–68.
57 H. Zhang, V. A. Oyanedel-Craver and J. A. Smith, The effect of natural water
conditions on the anti-bacterial performance and stability of silver nanoparticles
capped with different polymers, Water Res., 2012, 46, 691–699.
31
58 H. Zhang, V. Oyanedel-craver and A. M. Asce, Evaluation of the Disinfectant
Performance of Silver Nanoparticles in Different Evaluation of the Disinfectant
Performance of Silver Nanoparticles in Different Water Chemistry Conditions,
J. Environ. Eng., , DOI:10.1061/(ASCE)EE.1943-7870.0000460.
59 D. Brown, C. Farrow, E. A. McBean, B. Gharabaghi and J. Beauchamp,
Advancing performance evaluation standards for household water treatment
technologies, J. Water Health, 2019, 17, 266–273.
60 S. A. Schaub, C. Gerba, R. Tobin and F. A. Bell, Guide Standard and Protocol
for Testing Microbiological Water Purifiers, 1987.
61 C. Salvinelli, A. C. Elmore, B. R. García Hernandez and K. D. Drake, Ceramic
pot filters lifetime study in coastal Guatemala, J. Water Health, 2017, 15, 145–
154.
62 World Health Organization, General Testing Protocol #6: Ceramic Pot Gravity
Flow Mechanical Filtration Batch System Technology (with and without a
silver component), Geneva, 2014.
63 B. H. Gibbons and J. T. Edsall, Rate of Hydration of Carbon Dioxide and
Dehydration of Carbonic Acid at 25°, J. Biol. Chem., 1963, 238, 3502–3507.
64 G. E. Delroy and E. J. King, A Sodium Carbonate-bicarbonate Buffer for
Alkaline Phosphatases, Biochem. J., 1945, 39, 245.
65 ATCC, Raoultella terrigena (Izard et al.) Drancourt et al. (ATCC 33257),
https://www.atcc.org/products/all/33257.aspx#generalinformation, (accessed 5
December 2019).
66 M. Drancourt, C. Bollet, A. Carta and P. Rousselier, Phylogenetic analyses of
Klebsiella species delineate Klebsiella and Raoultella gen. nov., with
description of Raoultella ornithinolytica comb. nov., Raoultella terrigena comb.
nov. and Raoultella planticola comb. nov., Int. J. Syst. Evol. Microbiol., 2001,
51, 925–932.
67 World Health Organization, Guidelines for Drinking-water Quality, Geneva,
4th edn., 2017.
68 Hach Company, Silver: Colorimetric Method 8120,
https://www.hach.com/silver-reagent-set-colorimetric-
method/product?id=7640178466, (accessed 24 November 2019).
69 D. M. Kahler, N. T. Koermer, A. R. Reichl, A. Samie and J. A. Smith,
Performance and acceptance of novel silver-impregnated ceramic cubes for
drinking water treatment in two field sites: Limpopo province, South Africa and
Dodoma Region, Tanzania, Water (Switzerland), , DOI:10.3390/w8030095.
32
CHAPTER 1 TABLES:
Table 1.1: Studies, filters, and microorganisms featured in papers evaluated in this
review
Type of Study
Number of papers Percent
Laboratory 37 55
Field studies 19 28
Modelling 5 8
Field/laboratory 3 5
Review 3 5
Type of Filter
Number of papers Percent
Straight walled 28 42
Disks 17 25
Candles 10 15
Bowl 3 4
Curved 3 4
Not reported 7 10
Microorganism of Interest
Number of papers Percent
Bacteria 36 72
E. coli 31 69
Total coliform 6 13
Thermotolerant coliform 6 13
Other species 2 4
Viruses 10 20
MS2 Bacteriophages 9 90
ϕ X-174 1 10
Protozoa 4 8
Cryptosporidium parvum 2 50
Protozoan oocysts 1 25
Protozoan-sized
microspheres
1 25

33
Table 1.2: CWF performance data summary Study Influent Solution Clay source Burnout
material
Silver coating When was
LRV
measured?
LRV
(number
of units)
50 Well water or
collected rain
water
Cambodia Rice
husks
70 mg AgNO3 N.R. 3.0±2.1
(n=6)
32 Chlorine-free tap
water or surface
water (the
Netherlands)
Cambodia Rice
husks
110 mg AgNO3 60-85L
125-160L
240-320L
1.7±1.5
1.1±0.4
1.4±0.6
(n=4)
13 Surface water
(the Netherlands)
Cambodia Rice
husks
36 mg AgNO3
110 mg AgNO3
N.R. 1.2±0.6
1.5±1.2
(n=6)
14 Rainwater and
surface water
(Cambodia)
Cambodia Rice
husks
110 mg AgNO3 <100L
>100L
2.9±0.5
2.1±0.1
(n=4)
44 Phosphate buffer
solution
Red art
clay
Sawdust 4.96 mg silver
per clay disk
2-4 pore
volumes
4.3±1.7
(n=3)
8 National
Sanitation
Foundation
challenge water
Red art
clay
Sawdust 0.3 mg AgNP/g
ceramic
12 days 3.75±1.1
(n=2)
16 Deionized water
with dissolved
solids, turbidity,
and E. coli
additions
Colombia N.R. Colloidal silver
(Concentration
not reported)
18 months 4.5±0.7
(n=1)
25 Dechlorinated
tap water spiked
with E. coli
Nicaragua Sawdust 2 mL of 3.2%
colloidal silver
(Microdyne)
solution
8-120L 3.8±1.1
(n=2)
42 Phosphate buffer
solution
Indonesia
Tanzania
Nicaragua
Sawdust
0.3 mg nAg/g 7.2L 4.1±0.6
4.3±0.6
3.0±0.7
(n=2)
34 Surface water
(Saucon Creek,
Bethlehem, PA)
Nicaragua
Sawdust 2 mL of 3.2%
colloidal silver
(Microdyn)
solution
5 weeks 4.6±2.1
(n=3)
37 WHO Challenge
water
Dominican
Republic
Sawdust Variable
amounts of silver
nanoparticles
8-11 days 5.6±1.7
(n=2)
*N.R.-not reported. All LRV are reported for E. coli. When possible, steady state LRV reported. Results
from laboratory made ceramics reported when applicable.
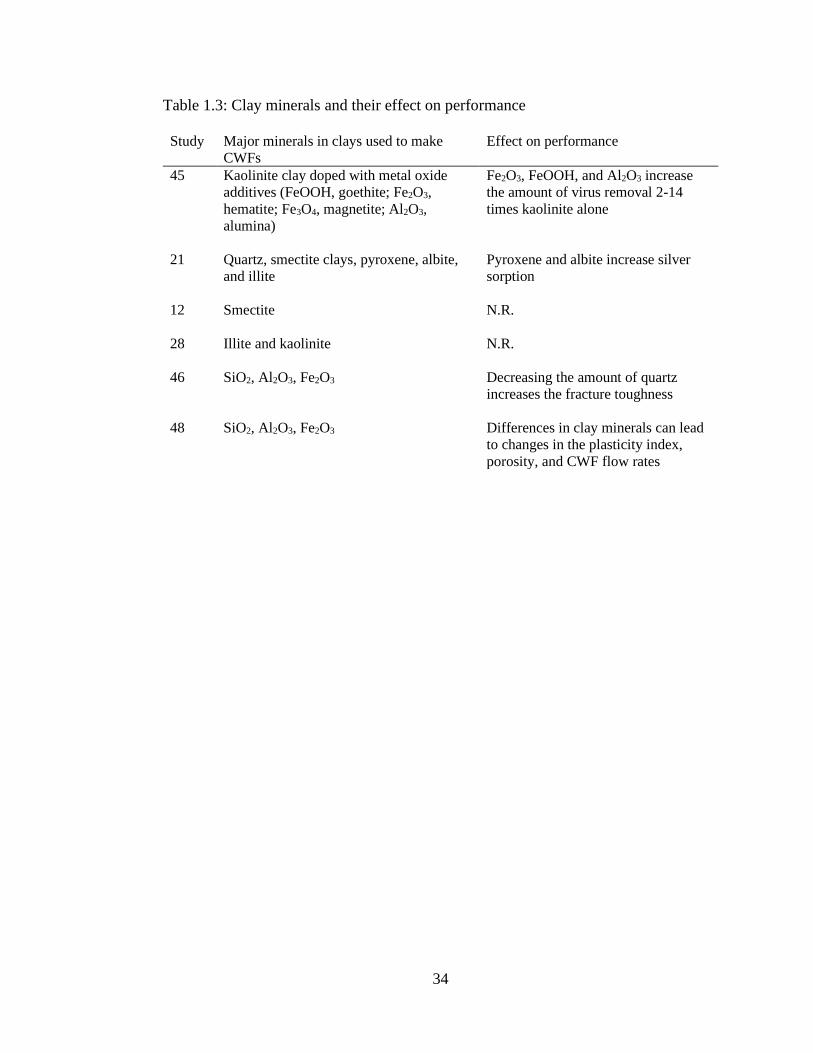
34
Table 1.3: Clay minerals and their effect on performance
Study Major minerals in clays used to make
CWFs
Effect on performance
45 Kaolinite clay doped with metal oxide
additives (FeOOH, goethite; Fe2O3,
hematite; Fe3O4, magnetite; Al2O3,
alumina)
Fe2O3, FeOOH, and Al2O3 increase
the amount of virus removal 2-14
times kaolinite alone
21 Quartz, smectite clays, pyroxene, albite,
and illite
Pyroxene and albite increase silver
sorption
12 Smectite
N.R.
28 Illite and kaolinite
N.R.
46 SiO2, Al2O3, Fe2O3
Decreasing the amount of quartz
increases the fracture toughness
48 SiO2, Al2O3, Fe2O3
Differences in clay minerals can lead
to changes in the plasticity index,
porosity, and CWF flow rates
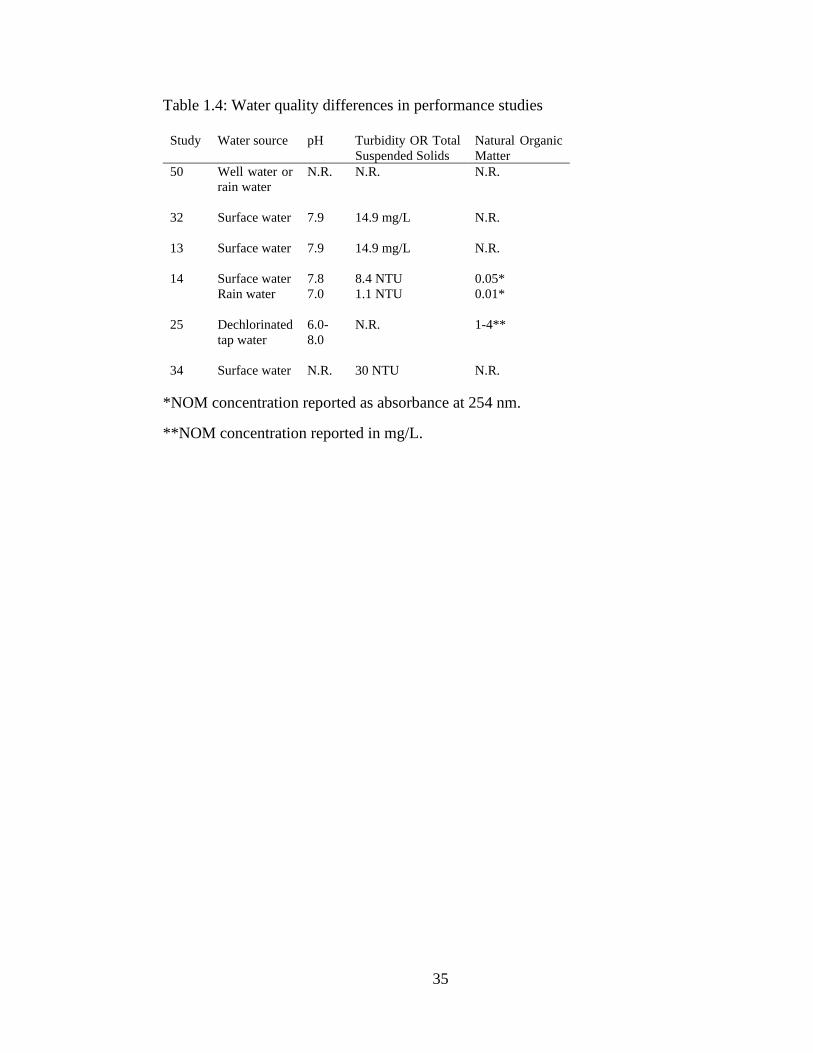
35
Table 1.4: Water quality differences in performance studies
Study Water source pH Turbidity OR Total
Suspended Solids
Natural Organic
Matter
50 Well water or
rain water
N.R. N.R. N.R.
32 Surface water
7.9 14.9 mg/L N.R.
13 Surface water
7.9 14.9 mg/L N.R.
14 Surface water 7.8 8.4 NTU 0.05*
Rain water
7.0 1.1 NTU 0.01*
25 Dechlorinated
tap water
6.0-
8.0
N.R. 1-4**
34 Surface water
N.R. 30 NTU N.R.
*NOM concentration reported as absorbance at 254 nm.
**NOM concentration reported in mg/L.
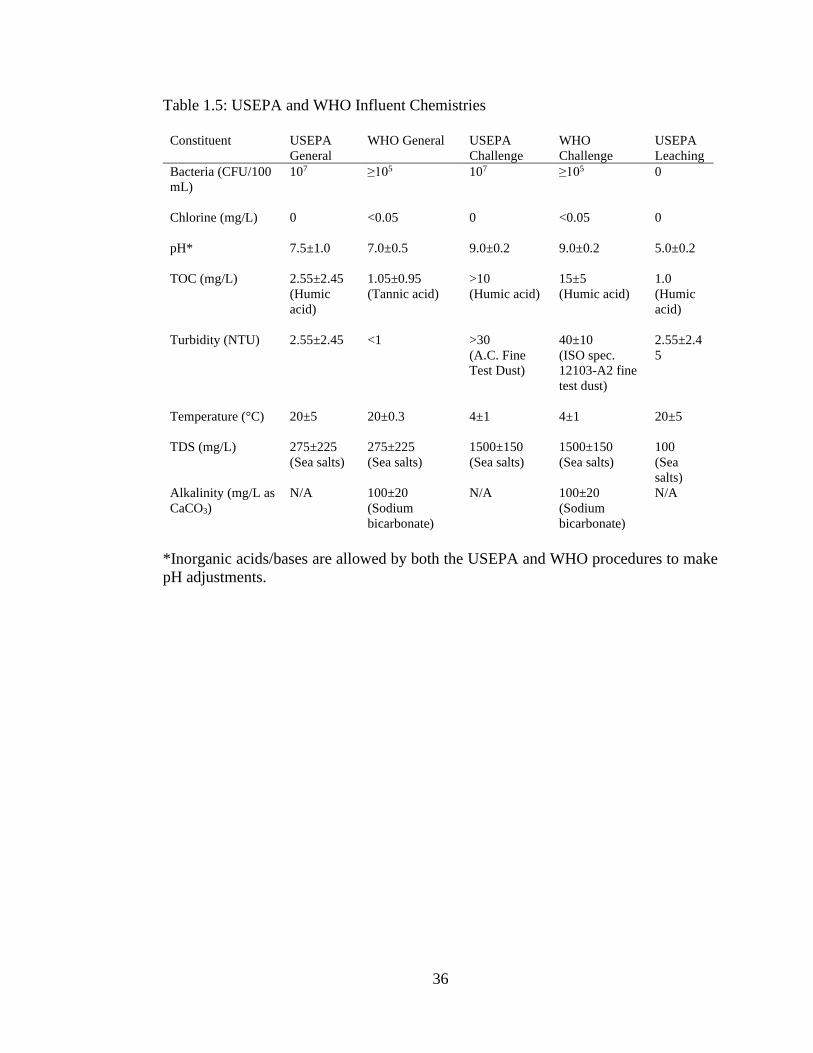
36
Table 1.5: USEPA and WHO Influent Chemistries
Constituent USEPA
General
WHO General USEPA
Challenge
WHO
Challenge
USEPA
Leaching
Bacteria (CFU/100
mL)
107 ≥105 107 ≥105 0
Chlorine (mg/L)
0 <0.05 0 <0.05 0
pH*
7.5±1.0
7.0±0.5
9.0±0.2
9.0±0.2
5.0±0.2
TOC (mg/L) 2.55±2.45
(Humic
acid)
1.05±0.95
(Tannic acid)
>10
(Humic acid)
15±5
(Humic acid)
1.0
(Humic
acid)
Turbidity (NTU) 2.55±2.45 <1 >30
(A.C. Fine
Test Dust)
40±10
(ISO spec.
12103-A2 fine
test dust)
2.55±2.4
5
Temperature (°C) 20±5 20±0.3 4±1
4±1 20±5
TDS (mg/L) 275±225
(Sea salts)
275±225
(Sea salts)
1500±150
(Sea salts)
1500±150
(Sea salts)
100
(Sea
salts)
Alkalinity (mg/L as
CaCO3)
N/A 100±20
(Sodium
bicarbonate)
N/A 100±20
(Sodium
bicarbonate)
N/A
*Inorganic acids/bases are allowed by both the USEPA and WHO procedures to make
pH adjustments.
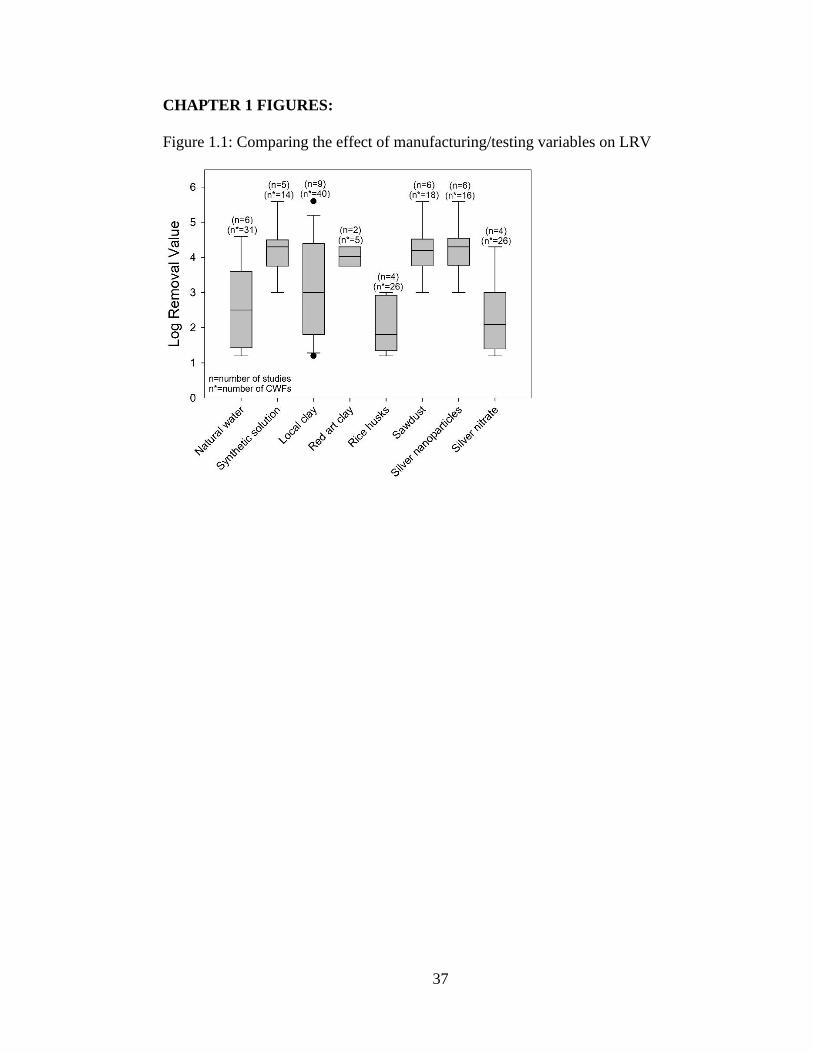
37
CHAPTER 1 FIGURES:
Figure 1.1: Comparing the effect of manufacturing/testing variables on LRV
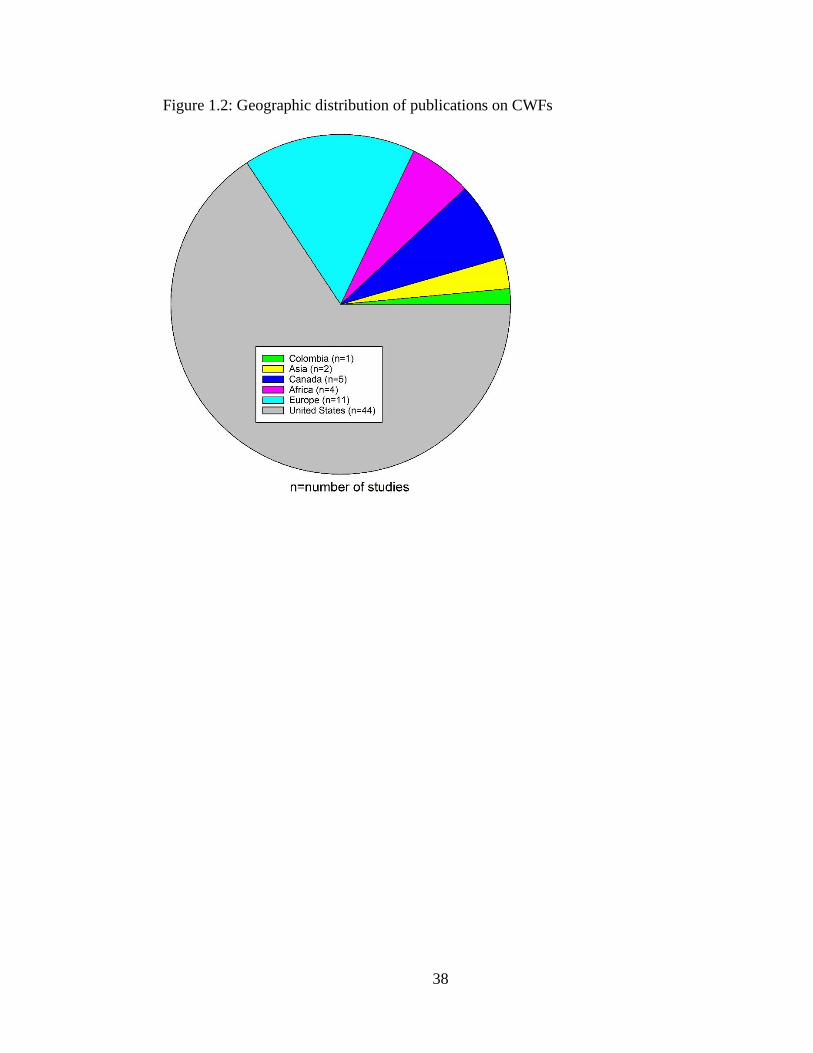
38
Figure 1.2: Geographic distribution of publications on CWFs
39
CHAPTER 2
MANUSCRIPT-II: PERFORMANCE OF SILVER NANOPARTICLE-
IMPREGNATED OVOID CERAMIC WATER FILTERS
Zachary Shepard1, Elizabeth Lux1, Vinka Oyanedel-Craver1
1Department of Civil & Environmental Engineering, University of Rhode Island, Kingston,
RI, 02881
*Corresponding author: Vinka Craver, [email protected]
40
Abstract:
A ceramic water filter (CWF) with curved (ovoid) walls has been developed by
Potters without Borders, a nonprofit that provides technical assistance to CWF factories.
Here, a modified version of the USEPA testing method was used to evaluate the
performance of ovoid CWFs, which have yet to be studied in the literature. Filters
with/without silver nanoparticles (AgNPs) were evaluated for bacterial removal,
turbidity removal, flow rate, and silver leaching. Log removal values (LRVs) for
Escherichia coli for AgNP coated CWFs were 9.5-10.9 LRV while uncoated achieved
8.0-9.8 LRV. All the CWFs tested here had flow rates between 0.8 and 1.3 L/h. The
turbidity of the influent was reduced by the filters throughout the general and challenge
water conditions with removal of 9.1-90.9% and 99.3-99.8%, respectively. Silver-
coated CWFs had a higher total effluent silver concentration compared to uncoated
(coated CWFs had 74% more total silver leaching on average) and had an increased
silver release during the challenge phase (35 ppb) compared to the general phase (13
ppb). The exterior wall coated with AgNPs was shown to leach silver off the ceramic
using X-ray photoelectron spectroscopy, providing evidence that supports the
recommendation to coat only the interior wall of CWFs with AgNPs. The procedure
demonstrated utility as a reproducible performance testing technique. X-ray diffraction
and mercury intrusion porosimetry were used to study the ceramic structure.
Environmental Significance Statement:
Ceramic water filters (CWFs) provide a sustainable source of safe drinking
water in developing communities around the world. This study explores the
41
performance of a new shape of CWF impregnated with silver nanoparticles in a manner
that promotes the sustainable development and use of CWFs.
Introduction:
Point-of-use (POU) water treatment technologies are recognized for providing
low-cost water treatment in developing communities.1 Ceramic water filters (CWFs) are
a type of POU device applied in developing communities because they are manufactured
locally, low cost, and provide effective pathogen removal.2 Many microorganisms are
retained/deactivated by CWFs including (but not limited to) E. coli3, C. parvum4, and
MS2 bacteriophages5. Interventions with CWFs have reduced diarrheal rates in South
Africa (80% reduction), Bolivia (75%), and Colombia (60%) by reducing the
pathogenic load in drinking water.2,6,7
CWF factories have been established across the world with technical assistance
provided by Potters without Borders (PWB) and Potters for Peace (PFP), well-
established nonprofit organizations.8,9 The CWF design utilized most widely in the field
incorporates impregnated colloidal AgNPs and was developed by Dr. Fernando
Mazariegos in Guatemala, 1981.10,11 CWFs are manufactured from locally sourced
materials (clay, sawdust, and water) and local infrastructure (kilns, mills, hydraulic
presses).10,12 Water is added to a mixture of clay and burnout material (usually sawdust
or rice husks) and filters are press-formed from this mixture using a mold.10,12 After
molding, the filters are air dried and fired in a kiln, where peak temperatures can vary
from 600-1000°C depending on the clay/burnout material.3,10,12 Finally, the CWFs are
coated with AgNPs or silver nitrate (AgNO3), which prevent biofilm growth and provide
residual disinfection.10,12,13 Coating with AgNPs increases long term performance
42
compared to AgNO3, but is higher cost and difficult to purchase in developing
communities.12–14
The primary mechanism for microbiological removal in CWFs is mechanical
filtration; microorganisms are removed from the throughput when they are trapped on
the surface and within the matrix of the ceramic.4,5,15–18 Microorganisms are trapped by
the small (1-5 µm in diameter) and tortuous pores of the ceramic matrix.3,18,19 The
second mechanism is inactivation with silver compounds, usually AgNPs. The
inactivation of microorganisms using AgNPs is expressed through several
mechanisms.20 AgNPs release silver ions that target DNA and interfere with
replication.20 The nanoparticle form physically disrupts the cell membrane and produces
reactive oxygen species at the surface of the organism.20 While most of the silver
released from AgNP-coated CWFs is in the dissolved form, there is evidence in the
literature supporting the contribution of both ion and nanoparticle in the inactivation of
microorganisms.16,20
According to PWB and PFP, there are about 40 CWF filter factories established
in developing communities worldwide.8,9 The geometry of the filter varies depending
on where the filter was manufactured.10 The new shape developed by PWB has curved
(ovoid) walls, a flat bottom, and can hold 10L of water.10 Ovoid CWFs are designed
with a thicker wall cross section than a straight-walled filter.21 The increased wall
thickness could improve the durability and microbial removal of the CWF by increasing
the length of the pores. Removal from the mold is easier because the ceramics can be
inverted and dropped onto their lips instead of being pushed out of the bottom, which
could reduce cracking and warping during production.21
43
Here, we utilize a modified version of the USEPA Guide Standard and Protocol
for Testing Microbiological Water Purifiers in the performance assessment of ovoid
CWFs.22 While this standard operating procedure (SOP) has been available since 1987,
to our knowledge it has not been used in the study of CWF performance. One study that
evaluated CWFs did utilize the challenge water chemistry, but not the sampling schedule
or the other influent chemistries of the EPA standard.23 The World Health Organization
(WHO) has also produced a performance assessment that is based on the EPA
procedure.24 One previous study used the WHO challenge water phase for testing CWF
performance.25
The objective of this study was to characterize the performance (using a
standardized performance assessment) and structure of the CWFs provided by PWB.
The performance of the CWFs will be analyzed in terms of bacterial removal, turbidity
reduction, flow rate, and silver leaching. The main objective of the structural
characterization was to determine the fate of silver nanoparticles within the ceramic
matrix. X ray photoelectron spectroscopy was applied to CWFs for the first time in this
study. The minerology and pore size distribution of the ovoid CWFs were also studied
during the characterization phase.
Experimental:
The CWFs used in this study were manufactured by PWB using a mix of
commercial clays (see Table 2.1, Supplemental Information, for details) and sawdust
from a milled hardwood pellet. The firing temperature for these CWFs was 900-925°C,
which is hotter than usual for the PWB factory (usually 885-900°C depending on the
clay/burnout mix).21 The ovoid CWFs were fired using a pitet kiln setter which
44
guarantees consistent air flow during the firing process and greater removal of carbon
from burnout materials.21 Pitet setters are interlocking cones that bear the weight of the
CWF during firing.21 The use of these setters increases the number of ovoid filters that
can be fired in a single run by 30%.21
Four CWFs (used directly after manufacturing) with the new wall shape were
evaluated using a modified version of the EPA protocol. Two of the filters were coated
with 0.3 g AgNPs (roughly 0.2 g on the interior surface and 0.1 g on the exterior surface)
and two were uncoated. The colloidal AgNPs used to coat the filters were Colargol
produced by Argenol (Spain). Colargol silver nanoparticles are synthetized using a
radiation method and are stabilized with casein (70-75% silver content).26,27 These
commercial nanoparticles are popular in the manufacture of CWFs and have been
characterized in previous studies.10,16,18,28–31 They have a surface charge ranging from -
20 to -26 mV.29,32,33 The hydrodynamic diameter of casein coated AgNPs has been
measured with dynamic light scattering and ranges from 45 to 105 nm.16,29,33,34 The
surface charge and hydrodynamic diameter values are based on AgNPs in National
Sanitation Foundation challenge water (pH 6.5 with 1.5 g/L sea salts), collected surface
and ground water, and deionized water. TEM measurements have shown that these
nanoparticles have a diameter between 7-15 nm.18,29,30 CWFs manufactured for this
study were made using between 17-21% wt. sawdust that was screened using a sieve
with 595 and 250 µm openings (manufacturing details in SI).
Performance testing
EPA Guide Standard and Protocol for Testing Microbiological Water Purifiers
dictates a 13 day testing period with three phases (general, challenge, and leaching)
45
defined by the influent solution.22 Table 2.2 contains the EPA requirements for the
influent solutions required for each phase. Table 2.3 contains amounts of the reagents
that were added to deionized water in order to meet the requirements in Table 1. The
materials required for the influent water were purchased from Fisher Scientific and used
as received. The temperature requirements of the EPA protocol (listed in Table 1) could
not be met because of the large volume of influent required each day for testing. All of
the solutions were prepared at room temperature (20-25°C). The influent water for the
general and challenge phases was spiked with 1010 CFU/100mL E. coli K12 (ATCC
23716). Fresh cultured bacteria was added daily to the influent. The bacteria stock
solution preparation and quantification were performed following methodology
previously published.35 The leaching phase is the final phase of the experiment (Days
12 and 13), designed so that researchers can ensure that excessive amounts of silver are
not released from the CWF.22 Before the beginning of the leaching phase, the CWFs
were cleaned by scrubbing with a soft brush and backwashing with a solution containing
10 mM NaNO3, which is has been shown to minimize the release of silver from the
nanoparticles on the ceramic.16
CWF performance was determined in terms of bacterial removal, turbidity
reduction, flow rate, and silver leaching. Flow rate and turbidity measurements are not
required by the EPA protocol, but were performed in addition to EPA testing. CWFs
are used to remove turbidity from water as well as microorganisms and flow rate
measurements are a standard measure of quality control in CWF factories.3,10,12,36 A
total of 19 L of the influent solution was filtered in each filter each day. The influent
addition was performed in four steps: first, 10 L were added during the morning, then 3
46
L at three hour intervals throughout the day. The level to which the filters were filled
with influent solution during the experiment was kept constant throughout the testing.
Samples for bacteria and turbidity determination and flow rate measurements were
collected three times on the first day and once a day for the rest of the testing from the
plastic buckets underneath the CWFs (Figure 2.1). Flow rate was calculated after the
CWFs had been filled the second time. Sampling more frequently on the first day of
testing captures the changing performance of the filter during start up. In this schedule,
samples were acquired more frequently than required by the EPA protocol. The EPA
protocol also requires samplings after 48 hours of stagnation, which was not possible in
this case because filtration in the CWFs cannot be stopped.22
Bacterial concentrations were determined via membrane filtration and
incubation with Millipore Sigma m-FC broth and rosolic acid overnight at 44.5°C.
Colonies of bacteria were counted and results were reported as colony forming units per
100 milliliters (CFU/100 mL).34,35 This methodology for bacterial culture and counting
is allowed in the Guide Standard and Protocol (Section 3.4.1.1).22 Turbidity was
measured using a Hach Turbidimeter and reported in nephelometric turbidity units
(NTU). Samples taken for silver concentration were stored in the refrigerator (or freezer
for long term storage) in light proof containers until they were analyzed by inductively
coupled plasma mass spectrometry (ICP-MS) with a Thermo X series 2 quadrupole ICP-
MS using a Nd-YAG laser ablation system. Effluent samples from days 4, 6, 8, and 13
were filtered using Amicon Ultracel Centrifugal Filters with a pore size of 3 kDa
(UFC800324) in order to separate AgNPs and Ag+. The concentration of silver in the
filtered and unfiltered samples was analyzed via ICP-MS. Due to the high chloride
47
concentrations in the throughput matrix, ICP-MS samples were acidified to 10% with
hydrochloric acid before analysis.37 Statistical significance was determined throughout
performance testing using the Wilcoxon rank sum test, which allows the determination
of statistical significance in smaller data sets.38
Characterization of ceramic matrix
Ceramic characterization was performed by analyzing the CWFs in terms of
minerology (X ray diffraction, XRD), pore size distribution (mercury intrusion
porosimetry, MIP), and distribution of AgNPs within the ceramic matrix (X-ray
photoelectron spectroscopy, XPS). XRD analysis was performed on an Olympus Terra
XRD between 2-theta angles of 5 and 55. The Olympus Terra XRD has an energy
resolution of 200 eV and can detect minerals present at 1% of the sample.39,40 Peaks
acquired during testing were compared to reference peaks using XPowder software.
MIP analysis was performed on an unused CWF with a Quantachrome PoreMaster GT
series (0.2-60,000 psi). Samples (n=2) were taken from the bottom and at intervals up
the wall of the filter. Pore size distributions were determined by calculating the size
fractions as a percentage of the total volume of mercury intruded into the sample. Cross
sectional pieces of the wall of used and unused silver coated and uncoated CWFs were
analyzed to study the fate of AgNPs in the ceramic matrix with a Thermo Scientific K-
Alpha XPS using an Al Kɑ source. Additional CWFs that were not used in the
experiment and were specifically used for imaging supplied the samples from unused
filters. XPS spectra were acquired from 380 to 360 eV at 300 µm intervals across the
cross section. The presence of silver was indicated by peaks that appear at
approximately 367 eV and 373 eV on the XPS spectra.41
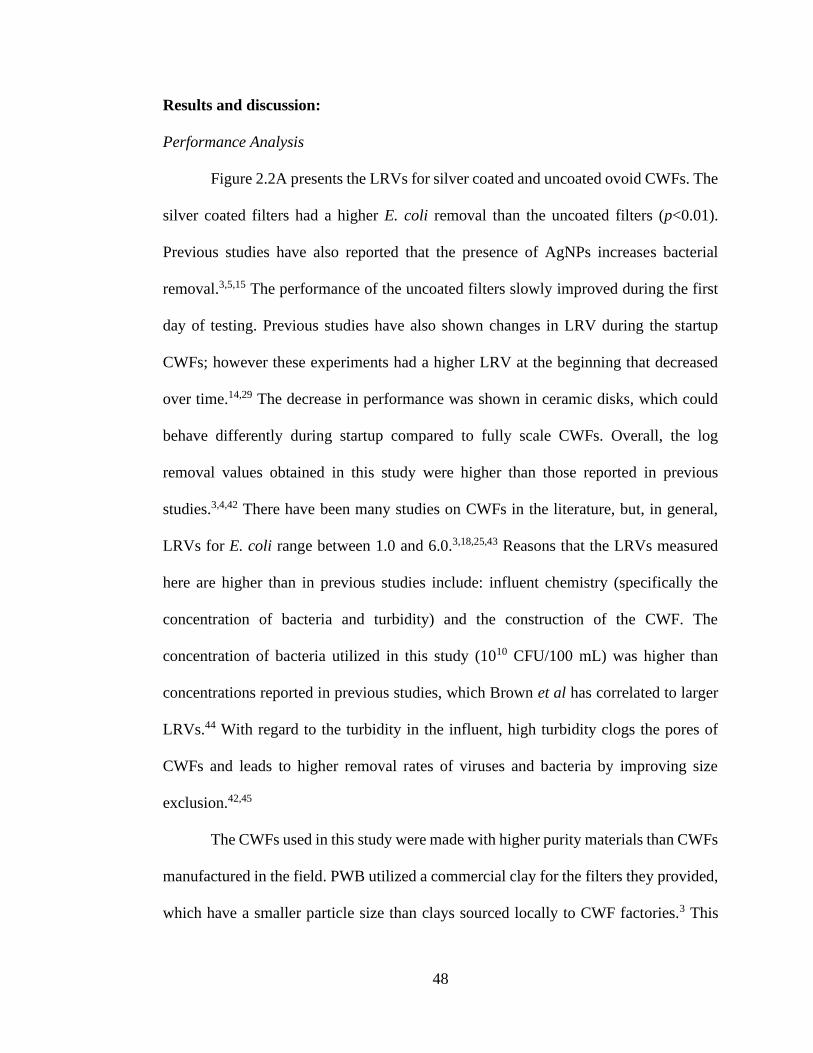
48
Results and discussion:
Performance Analysis
Figure 2.2A presents the LRVs for silver coated and uncoated ovoid CWFs. The
silver coated filters had a higher E. coli removal than the uncoated filters (p<0.01).
Previous studies have also reported that the presence of AgNPs increases bacterial
removal.3,5,15 The performance of the uncoated filters slowly improved during the first
day of testing. Previous studies have also shown changes in LRV during the startup
CWFs; however these experiments had a higher LRV at the beginning that decreased
over time.14,29 The decrease in performance was shown in ceramic disks, which could
behave differently during startup compared to fully scale CWFs. Overall, the log
removal values obtained in this study were higher than those reported in previous
studies.3,4,42 There have been many studies on CWFs in the literature, but, in general,
LRVs for E. coli range between 1.0 and 6.0.3,18,25,43 Reasons that the LRVs measured
here are higher than in previous studies include: influent chemistry (specifically the
concentration of bacteria and turbidity) and the construction of the CWF. The
concentration of bacteria utilized in this study (1010 CFU/100 mL) was higher than
concentrations reported in previous studies, which Brown et al has correlated to larger
LRVs.44 With regard to the turbidity in the influent, high turbidity clogs the pores of
CWFs and leads to higher removal rates of viruses and bacteria by improving size
exclusion.42,45
The CWFs used in this study were made with higher purity materials than CWFs
manufactured in the field. PWB utilized a commercial clay for the filters they provided,
which have a smaller particle size than clays sourced locally to CWF factories.3 This
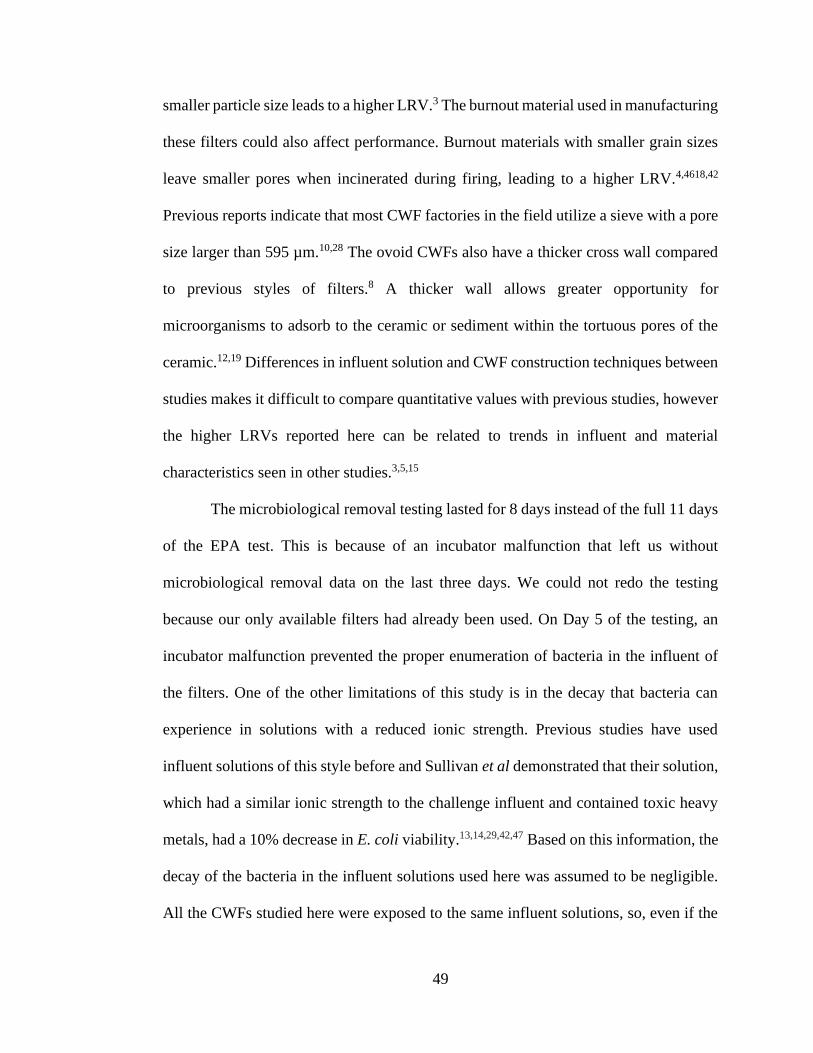
49
smaller particle size leads to a higher LRV.3 The burnout material used in manufacturing
these filters could also affect performance. Burnout materials with smaller grain sizes
leave smaller pores when incinerated during firing, leading to a higher LRV.4,4618,42
Previous reports indicate that most CWF factories in the field utilize a sieve with a pore
size larger than 595 µm.10,28 The ovoid CWFs also have a thicker cross wall compared
to previous styles of filters.8 A thicker wall allows greater opportunity for
microorganisms to adsorb to the ceramic or sediment within the tortuous pores of the
ceramic.12,19 Differences in influent solution and CWF construction techniques between
studies makes it difficult to compare quantitative values with previous studies, however
the higher LRVs reported here can be related to trends in influent and material
characteristics seen in other studies.3,5,15
The microbiological removal testing lasted for 8 days instead of the full 11 days
of the EPA test. This is because of an incubator malfunction that left us without
microbiological removal data on the last three days. We could not redo the testing
because our only available filters had already been used. On Day 5 of the testing, an
incubator malfunction prevented the proper enumeration of bacteria in the influent of
the filters. One of the other limitations of this study is in the decay that bacteria can
experience in solutions with a reduced ionic strength. Previous studies have used
influent solutions of this style before and Sullivan et al demonstrated that their solution,
which had a similar ionic strength to the challenge influent and contained toxic heavy
metals, had a 10% decrease in E. coli viability.13,14,29,42,47 Based on this information, the
decay of the bacteria in the influent solutions used here was assumed to be negligible.
All the CWFs studied here were exposed to the same influent solutions, so, even if the
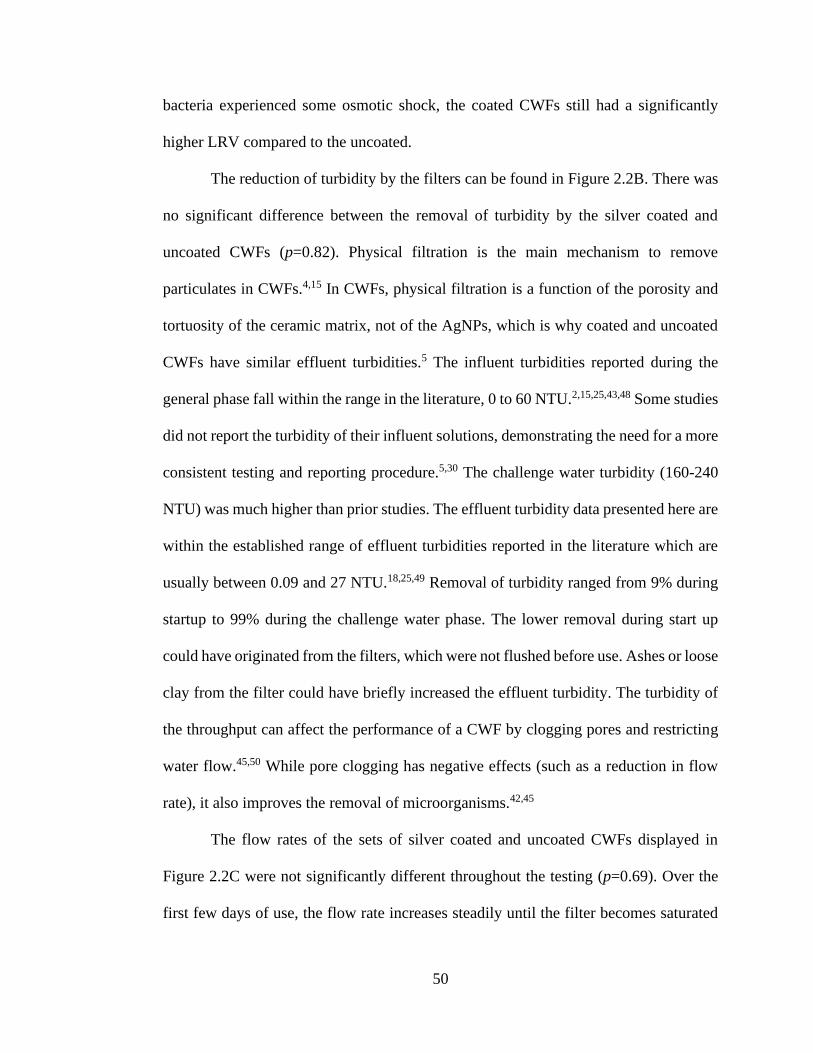
50
bacteria experienced some osmotic shock, the coated CWFs still had a significantly
higher LRV compared to the uncoated.
The reduction of turbidity by the filters can be found in Figure 2.2B. There was
no significant difference between the removal of turbidity by the silver coated and
uncoated CWFs (p=0.82). Physical filtration is the main mechanism to remove
particulates in CWFs.4,15 In CWFs, physical filtration is a function of the porosity and
tortuosity of the ceramic matrix, not of the AgNPs, which is why coated and uncoated
CWFs have similar effluent turbidities.5 The influent turbidities reported during the
general phase fall within the range in the literature, 0 to 60 NTU.2,15,25,43,48 Some studies
did not report the turbidity of their influent solutions, demonstrating the need for a more
consistent testing and reporting procedure.5,30 The challenge water turbidity (160-240
NTU) was much higher than prior studies. The effluent turbidity data presented here are
within the established range of effluent turbidities reported in the literature which are
usually between 0.09 and 27 NTU.18,25,49 Removal of turbidity ranged from 9% during
startup to 99% during the challenge water phase. The lower removal during start up
could have originated from the filters, which were not flushed before use. Ashes or loose
clay from the filter could have briefly increased the effluent turbidity. The turbidity of
the throughput can affect the performance of a CWF by clogging pores and restricting
water flow.45,50 While pore clogging has negative effects (such as a reduction in flow
rate), it also improves the removal of microorganisms.42,45
The flow rates of the sets of silver coated and uncoated CWFs displayed in
Figure 2.2C were not significantly different throughout the testing (p=0.69). Over the
first few days of use, the flow rate increases steadily until the filter becomes saturated
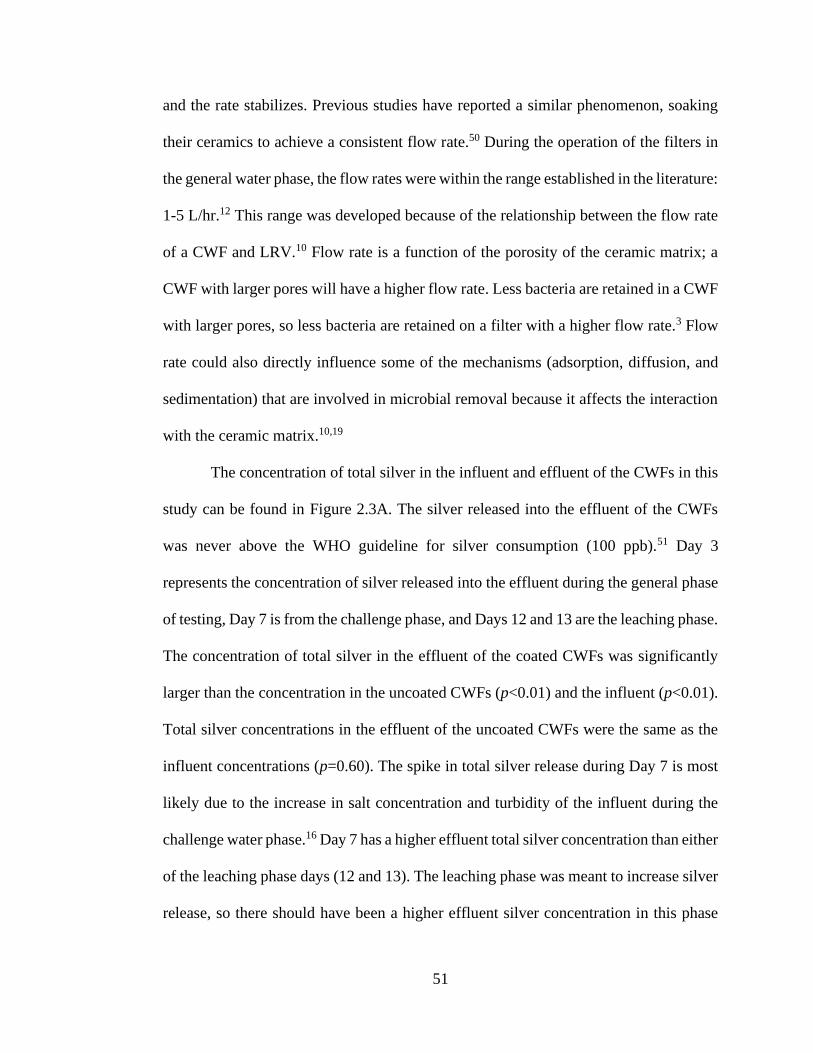
51
and the rate stabilizes. Previous studies have reported a similar phenomenon, soaking
their ceramics to achieve a consistent flow rate.50 During the operation of the filters in
the general water phase, the flow rates were within the range established in the literature:
1-5 L/hr.12 This range was developed because of the relationship between the flow rate
of a CWF and LRV.10 Flow rate is a function of the porosity of the ceramic matrix; a
CWF with larger pores will have a higher flow rate. Less bacteria are retained in a CWF
with larger pores, so less bacteria are retained on a filter with a higher flow rate.3 Flow
rate could also directly influence some of the mechanisms (adsorption, diffusion, and
sedimentation) that are involved in microbial removal because it affects the interaction
with the ceramic matrix.10,19
The concentration of total silver in the influent and effluent of the CWFs in this
study can be found in Figure 2.3A. The silver released into the effluent of the CWFs
was never above the WHO guideline for silver consumption (100 ppb).51 Day 3
represents the concentration of silver released into the effluent during the general phase
of testing, Day 7 is from the challenge phase, and Days 12 and 13 are the leaching phase.
The concentration of total silver in the effluent of the coated CWFs was significantly
larger than the concentration in the uncoated CWFs (p<0.01) and the influent (p<0.01).
Total silver concentrations in the effluent of the uncoated CWFs were the same as the
influent concentrations (p=0.60). The spike in total silver release during Day 7 is most
likely due to the increase in salt concentration and turbidity of the influent during the
challenge water phase.16 Day 7 has a higher effluent total silver concentration than either
of the leaching phase days (12 and 13). The leaching phase was meant to increase silver
release, so there should have been a higher effluent silver concentration in this phase
52
compared to others.22 The water chemistry of the leaching phase is one reason that the
silver release is higher during the challenge phase. Influent solutions with a higher
turbidity and total dissolved solids (such as the challenge water solution) promote silver
release from CWFs.16,30 Another reason for the low release during the leaching phase
could have been the use of the filters in the challenge water phase. The CWFs utilized
in the leaching test had undergone challenge water testing which has a higher
concentration of clay in the influent. This clay could have prevented the release of silver
from the filters. The CWFs were also cleaned in order to prepare them for the leaching
phase. It is possible that the cleaning removed some of the silver and reduced the
effluent silver concentrations.
Samples (n=2) from Days 4, 6, 8, and 13 were filtered using 3 kDa centrifugal
filters and analyzed via ICP-MS to determine whether the silver in the effluent was in
nanoparticle or ionic form (Figure 2.3B). AgNPs were retained on the 3 kDa filter while
ionic silver passed through it. The concentration of silver in the filtered samples was not
significantly different from the concentration of silver in the unfiltered samples
(p=0.43). This indicates that most of the silver in the effluent was in the ionic form.
Previous studies have shown the higher concentration of dissolved silver compared to
the nanoparticle phase.16 Figure 2.3B shows that the percentage of ionic silver as a
proportion of total silver varies between Day 8 and Day 13. This change stems from the
change in ionic strength of the influent solutions between the challenge and leaching
phases. Negatively charged nanoparticles, such as the AgNPs used here, detach from
quartz in transport columns due to a decrease in the ionic strength of the
throughput.16,52,53 The challenge influent had a higher ionic strength than the leaching
53
influent and the main mineral in the CWFs studied here was determined to be quartz
(see characterization section for more details). This decrease in ionic strength could
have led to a greater elution of silver nanoparticles, which changed the ratio of ionic to
total silver between days 8 and 13.
X ray photoelectron spectroscopy (XPS) was used to determine the fate of the
AgNPs painted on the surface of the ceramic filters. Cross sectional pieces of the wall
from used and unused CWFs were analyzed using this technique. The used samples had
undergone the performance assessment described within this paper. XPS spectra were
acquired at 300 µm intervals over the entire cross section. Selected XPS spectra
acquired in this analysis can be found in Figure 2.4A-D. XPS analysis of a silver-coated,
unused CWF (Figure 2.4A) indicates surface layers that are 2419 µm and 1512 µm deep
on the interior and exterior, respectively, of the CWF wall. These results agree with
information provided by the manufacturer and previous studies. PWB applies most of
the colloidal silver to the interior of the filters.21 One previous study used EDS SEM to
show that silver tends to segregate to a 50-180 µm surface layer in unused ceramic
filters.54 A cross section of a silver coated filter that had been used in the performance
assessment showed silver peaks for the first 1524 µm on the interior side and a band of
silver in the middle of the ceramic wall from 10368 to 11283 µm. Figure 2.4B shows a
selection of the spectra that were collected from the used, silver coated cross section.
The peaks in the spectra collected at 1100 µm and 10700 µm indicate the presence of
silver nanoparticles with peaks at 367 eV and 373 eV. The band of silver was located in
the middle of the cross section and was much more concentrated than the other bands.
The silver peaks from this band were much more clearly defined than the other peaks
54
(Figure 2.4B, 10700 µm). The band on the exterior surface layer was missing from the
sample from the used CWF (Figure 2.4B). This was most likely washed away during
testing and cleaning. This result is supported by a prior study by Mittelman et al, which
demonstrated that the initial elution of silver comes primarily from the exterior surface
of the CWF.16 The elution of silver from the exterior surface indicates that
manufacturers may be able to skip this step of the process. CWFs with an AgNP coating
on the interior of the CWF may be just as effective as those with both interior and
exterior surface coatings. Uncoated CWFs (both used and unused) did not indicate the
presence of silver.
Ceramic Characterization
XRD results showed that the main mineral in the CWF was quartz (SiO2). Our
results agree with previous research, which has shown that the main mineral in most
CWFs is quartz, regardless of where the clay is mined.27 Other minerals found in the
CWFs studied here include: muscovite (KAl2(SiAlO10)(OH)2), hematite (Fe2O3), and
albite (NaAlSi3O8). Illites are hydrated muscovite and incorporation of this class of clay
minerals imparts a high flexural strength to CWFs.27 Clays enhanced with hematite have
an increased sorption of bacteriophages in small scale, batch adsorption testing and the
presence of albite in the CWF matrix can affect the sorption of AgNPs.27,55 Albite has a
negative surface charge that adsorbs cations, which, in turn, attract AgNPs.27 The XRD
results show that the CWFs studied here are made using a more highly purified type of
clay than would normally be found in the field. As mentioned previously, CWFs made
with more highly purified clays are more effective at removing microorganisms.3 CWF
factories usually utilize locally sourced, low purity clays.
55
The pore size distribution of a CWF is an important parameter because size
exclusion is one of the two main mechanisms by which bacteria are removed from the
influent.2,4 Filters with smaller pores have been shown to remove more bacteria than
those with larger pores.3 Pore sizes are affected by a number of variables including the
type and quantity of burnout material and the particle size of the clay.3,18 Figure 2.5
shows that most of the pores in the CWFs are less than 2 µm in diameter, which is in
the size range of bacteria that are removed by CWFs. The pore size distributions
measured here are similar to those that have been established in the literature and do not
vary greatly as a function of wall height.3,11,18,19 80% of the pores in the CWF were less
than 5 µm in diameter, which is similar to the 75% pore fraction previously established
for Red Art ceramic filters.3 Red Art ceramic filters are made of Red Art clay, which is
a commercial clay blend with a very narrow grain size distribution. CWFs and ceramic
disks made with Red Art clay have been used as control samples in many studies.3,14,29,56
Table 2.4 presents the average pore diameters (1.87 to 2.56 µm) of the samples taken
from an unused CWF.
Conclusion:
The first objective of this study was to analyze the performance of ovoid CWFs
as designed and manufactured by PWB. The ovoid CWFs produced by PWB exhibit a
greater removal of E. coli compared to previously studied models. The flow rates were
within the appropriate range and the turbidity was reduced drastically by the filters.
Silver leaching never exceeded the WHO standards during the testing of the filters. The
XPS characterization demonstrated the distribution of silver nanoparticles through the
matrix of the CWF. The exterior surface coating of AgNPs leached off of the CWF,
56
indicating that this coating could be eliminated from the CWF without diminishing the
performance of the filter. A modified version of the USEPA Guide Standard and
Protocol for Testing Microbiological Water Purifiers was used to analyze the
performance of the ovoid CWFs. The consistency of this performance assessment would
allow researchers to build up a body of knowledge that could be used to target
improvements in manufacturing. The characterization data was able to describe the
mineralogical composition and pore size distribution, which informed the mechanisms
involved in the microbiological removal of the CWFs.
Supporting Information:
Supplementary images, procedure details, and data can be found online.
Corresponding Author:
* Dr. Vinka Oyanedel-Craver: [email protected].
Conflicts of Interest:
There are no conflicts of interest to declare.
ACKNOWLEDGMENT
This work was funded by: NSF CBET Award# 1350789. Special thanks to Kevin
Broccolo, Burt Cohen, Dr. Dawn Cardace, Dr. Brett Lucht, Zachary Brown, Satu
Heiskanen, Dr. Katherine Kelley, and Dr. Sumanta Das.
References:
1 D. Ren, L. M. Colosi and J. A. Smith, Evaluating the sustainability of ceramic
filters for point-of-use drinking water treatment, Environ. Sci. Technol., 2013,
47, 11206–11213.
2 L. S. Abebe, J. A. Smith, S. Narkiewicz, V. Oyanedel-Craver, M. Conaway, A.
57
Singo, S. Amidou, P. Mojapelo, J. Brant and R. Dillingham, Ceramic water
filters impregnated with silver nanoparticles as a point-of-use water-treatment
intervention for HIV-positive individuals in Limpopo Province, South Africa: A
pilot study of technological performance and human health benefits, J. Water
Health, 2014, 12, 288–300.
3 V. A. Oyanedel-Craver and J. A. Smith, Sustainable colloidal-silver-
impregnated ceramic filter for point-of-use water treatment, Environ. Sci.
Technol., 2008, 42, 927–933.
4 L. S. Abebe, Y. Su, R. L. Guerrant, N. S. Swami and J. A. Smith, Point-of-Use
Removal of Cryptosporidium parvum from Water: Independent Effects of
Disinfection by Silver Nanoparticles and Silver Ions and by Physical Filtration
in Ceramic Porous Media, Environ. Sci. Technol., 2015, 49, 12958–12967.
5 H. Van der Laan, D. van Halem, P. W. M. H. Smeets, A. I. A. Soppe, J.
Kroesbergen, G. Wubbels, J. Nederstigt, I. Gensburger and S. G. J. Heijman,
Bacteria and virus removal effectiveness of ceramic pot filters with different
silver applications in a long term experiment, Water Res., 2014, 51, 47–54.
6 T. F. Clasen, J. Brown, S. Collin, O. Suntura and S. Cairncross, Reducing
diarrhea through the use of household-based ceramic water filters: A
randomized, controlled trial in rural Bolivia, Am. J. Trop. Med. Hyg., 2004, 70,
651–657.
7 T. Clasen, G. Garcia Parra, S. Boisson and S. Collin, Household-based ceramic
water filters for the prevention of diarrhea: A randomized, controlled trial of a
pilot program in Colombia, Am. J. Trop. Med. Hyg., 2005, 73, 790–795.
8 B. Cohen, Potters Without Borders,
http://www.potterswithoutborders.com/aboutus-2/, (accessed 3 September
2018).
9 J. Mally, Potters for Peace, https://pottersforpeace.org/?page_id=8, (accessed 2
May 2019).
10 The Ceramics Manufacturing Working Group, Best Practice Recommendations
for Local Manufacturing of Ceramic Pot Filters for Household Water
Treatment, Atlanta, GA, 2011.
11 D. S. Lantagne, Investigation of the Potters for Peace Colloidal Silver
Impregnated Ceramic Filter Report 1: Intrinsic Effectiveness, Allston, MA,
USA, 2001.
12 J. Rayner, B. Skinner and D. Lantagne, Current practices in manufacturing
locally-made ceramic pot filters for water treatment in developing countries, J.
Water Sanit. Hyg. Dev., 2013, 3, 252–261.
13 J. Rayner, H. Zhang, J. Schubert, P. Lennon, D. Lantagne and V. Oyanedel-
Craver, Laboratory investigation into the effect of silver application on the
bacterial removal efficacy of filter material for use on locally produced ceramic
58
water filters for household drinking water treatment, ACS Sustain. Chem. Eng.,
2013, 1, 737–745.
14 K. N. Jackson and J. A. Smith, A New Method for the Deposition of Metallic
Silver on Porous Ceramic Water Filters, J. Nanotechnol., 2018, 1–9.
15 J. Brown and M. D. Sobsey, Microbiological effectiveness of locally produced
ceramic filters for drinking water treatment in Cambodia, J. Water Health,
2010, 8, 1–10.
16 A. M. Mittelman, D. S. Lantagne, J. Rayner and K. D. Pennell, Silver
Dissolution and Release from Ceramic Water Filters, Environ. Sci. Technol.,
2015, 49, 8515–8522.
17 J. Huang, G. Huang, C. An, Y. He, Y. Yao, P. Zhang and J. Shen, Performance
of ceramic disk filter coated with nano ZnO for removing Escherichia coli from
water in small rural and remote communities of developing regions, Environ.
Pollut., 2018, 238, 52–62.
18 E. N. Kallman, V. A. Oyanedel-Craver and J. A. Smith, Ceramic Filters
Impregnated with Silver Nanoparticles for Point-of-Use Water Treatment in
Rural Guatemala, J. Environ. Eng., 2011, 137, 407–415.
19 D. van Halem, Delft University of Technology, 2006.
20 L. M. Stabryla, K. A. Johnston, J. E. Millstone and L. M. Gilbertson, Emerging
investigator series: It’s not all about the ion: Support for particle-specific
contributions to silver nanoparticle antimicrobial activity, Environ. Sci. Nano,
2018, 5, 2047–2068.
21 Personal communication with Burt Cohen, Potters without Borders.
22 S. A. Schaub, C. Gerba, R. Tobin and F. A. Bell, Guide Standard and Protocol
for Testing Microbiological Water Purifiers, 1987.
23 A. Pérez-Vidal, J. Diaz-Gómez, J. Castellanos-Rozo, O. L. Usaquen-Perilla, A.
Perez-Vidal, J. Diaz-Gómez, J. Castellanos-Rozo and O. L. Usaquen-Perilla,
Long-term evaluation of the performance of four point-of-use water filters,
Water Res., 2016, 98, 176–182.
24 World Health Organization, General Testing Protocol #6: Ceramic Pot Gravity
Flow Mechanical Filtration Batch System Technology (with and without a
silver component), Geneva, 2014.
25 K. J. Lucier, S. E. Dickson-Anderson and C. J. Schuster-Wallace, Effectiveness
of silver and copper infused ceramic drinking water filters in reducing
microbiological contaminants, J. Water Supply Res. Technol. - AQUA, 2017,
66, 528–536.
26 Potters without Borders, 2018, 1–2.
27 V. Oyanedel-Craver, S. Narkiewicz, R. Genovesi, A. Bradshaw and D. Cardace,
59
Effect of local materials on the silver sorption and strength of ceramic water
filters, J. Environ. Chem. Eng., 2014, 2, 841–848.
28 J. Rayner, Loughborough University, 2009.
29 R. K. Sullivan, M. Erickson and V. A. Oyanedel-Craver, Understanding the
microbiological, organic and inorganic contaminant removal capacity of
ceramic water filters doped with different silver nanoparticles, Environ. Sci.
Nano, 2017, 4, 2348–2355.
30 A. M. Mikelonis, D. F. Lawler and P. Passalacqua, Multilevel modeling of
retention and disinfection efficacy of silver nanoparticles on ceramic water
filters, Sci. Total Environ., 2016, 566–567, 368–377.
31 H. Zhang, V. Oyanedel-craver and A. M. Asce, Evaluation of the Disinfectant
Performance of Silver Nanoparticles in Different Evaluation of the Disinfectant
Performance of Silver Nanoparticles in Different Water Chemistry Conditions,
J. Environ. Eng., , DOI:10.1061/(ASCE)EE.1943-7870.0000460.
32 F. Faghihzadeh, N. M. Anaya, C. Astudillo-Castro and V. A. Oyanedel-Craver,
Kinetic, metabolic and macromolecular response of bacteria to chronic
nanoparticle exposure in continuous culture, Environ. Sci. Nano, 2018, 5, 1386–
1396.
33 H. Zhang, V. A. Oyanedel-Craver and J. A. Smith, The effect of natural water
conditions on the anti-bacterial performance and stability of silver nanoparticles
capped with different polymers, Water Res., 2012, 46, 691–699.
34 N. M. Anaya, F. Faghihzadeh, N. Ganji, G. Bothun and V. Oyanedel-Craver,
Comparative study between chemostat and batch reactors to quantify membrane
permeability changes on bacteria exposed to silver nanoparticles, Sci. Total
Environ., 2015, 565, 841–848.
35 US EPA, Method 1604: Total Coliforms and Escherichia coli in Water by
Membrane Filtration Using a Simultaneous Detection Technique (MI Medium),
Washington, DC, 2002.
36 M. du Preez, R. M. Conroy, J. A. Wright, S. Moyo, N. Potgieter and S. W.
Gundry, Short Report: Use of Ceramic Water Filtration in the Prevention of
Diarrheal Disease: A Randomized Controlled Trial in Rural South Africa and
Zimbabwe, Am. J. Trop. Med. Hyg., 2008, 79, 696–701.
37 P. Gaines, Common Problems with Ag, As, S, Ba,, Pb, and Cr,
https://www.inorganicventures.com/common-problems-ag-s-ba-pb-and-cr,
(accessed 19 December 2018).
38 P. D. Bridge and S. S. Sawilowsky, Increasing Physicians’ Awareness of the
Impact of Statistics on Research Outcomes: Comparative Power of the t-test
and Wilcoxon Rank-Sum Test in Small Samples Applied Research, J. Clin.
Epidemiol., 1999, 52, 229–235.
39 Olympus Corporation, Terra Portable XRD, https://www.olympus-
60
ims.com/en/xrf-xrd/mobile-benchtop-xrd/terra/, (accessed 31 May 2019).
40 D. Blake, D. Vaniman, C. Achilles, R. Anderson, D. Bish, T. Bristow, C. Chen,
S. Chipera, J. Crisp, D. Des Marais, R. T. Downs, J. Farmer, S. Feldman, M.
Fonda, M. Gailhanou, H. Ma, D. W. Ming, R. V. Morris, P. Sarrazin, E.
Stolper, A. Treiman and A. Yen, Characterization and calibration of the
CheMin mineralogical instrument on Mars Science Laboratory, Space Sci. Rev.,
2012, 170, 341–399.
41 A. Zielińska, E. Kowalska, J. W. Sobczak, I. Łacka, M. Gazda, B. Ohtani, J.
Hupka and A. Zaleska, Silver-doped TiO2 prepared by microemulsion method:
Surface properties, bio- and photoactivity, Sep. Purif. Technol., 2010, 72, 309–
318.
42 D. van Halem, H. van der Laan, A. I. A. Soppe and S. G. J. Heijman, High flow
ceramic pot filters, Water Res., 2017, 124, 398–406.
43 D. Lantagne, M. Klarman, A. Mayer, K. Preston, J. Napotnik and K. Jellison,
Effect of production variables on microbiological removal in locally-produced
ceramic filters for household water treatment, Int. J. Environ. Health Res.,
2010, 20, 171–187.
44 D. Brown, C. Farrow, E. A. McBean, B. Gharabaghi and J. Beauchamp,
Advancing performance evaluation standards for household water treatment
technologies, J. Water Health, 2019, 17, 266–273.
45 H. Salsali, E. McBean and J. Brunsting, Virus removal efficiency of Cambodian
ceramic pot water purifiers, J. Water Health, 2011, 9, 306–311.
46 J. Rayner, X. Luo, J. Schubert, P. Lennon, K. Jellison and D. Lantagne, The
effects of input materials on ceramic water filter efficacy for household
drinking water treatment, Water Sci. Technol. Water Supply, 2017, 17, 859–
869.
47 A. R. Bielefeldt, K. Kowalski and R. S. Summers, Bacterial treatment
effectiveness of point-of-use ceramic water filters, Water Res., 2009, 43, 3559–
3565.
48 J. Brown, M. Sobsey and S. Proum, Use of Ceramic Water Filters in
Cambodia, 2007.
49 C. Salvinelli, A. C. Elmore, B. R. García Hernandez and K. D. Drake, Ceramic
pot filters lifetime study in coastal Guatemala, J. Water Health, 2017, 15, 145–
154.
50 C. Salvinelli, A. C. Elmore, M. R. Reidmeyer, K. D. Drake and K. I. Ahmad,
Characterization of the relationship between ceramic pot filter water production
and turbidity in source water, Water Res., 2016, 104, 28–33.
51 World Health Organization, Guidelines for Drinking-water Quality, Geneva,
4th edn., 2017.
61
52 Y. Wang, Y. Li, J. D. Fortner, J. B. Hughes, L. M. Abriola and K. D. Pennell,
Transport and retention of nanoscale C60 aggregates in water-saturated porous
media, Environ. Sci. Technol., 2008, 42, 3588–3594.
53 T. Phenrat, J.-J. Kim, F. Fagerlund, T. Illangasekare, R. D. Tilton and G. V.
Lowry, Particle size distribution, concentration, and magnetic attraction affect
transport of polymer-modified Fe(0) nanoparticles in sand columns, Environ.
Sci. Technol., 2009, 43, 5079–5085.
54 C. Larimer, N. Ostrowski, J. Speakman and I. Nettleship, The segregation of
silver nanoparticles in low-cost ceramic water filters, Mater. Charact., 2010,
61, 408–412.
55 J. Brown and M. D. Sobsey, Ceramic media amended with metal oxide for the
capture of viruses in drinking water, Environ. Technol., 2009, 30, 379–391.
56 D. Ren and J. A. Smith, Retention and transport of silver nanoparticles in a
ceramic porous medium used for point-of-use water treatment, Environ. Sci.
Technol., 2013, 47, 3825–3832.
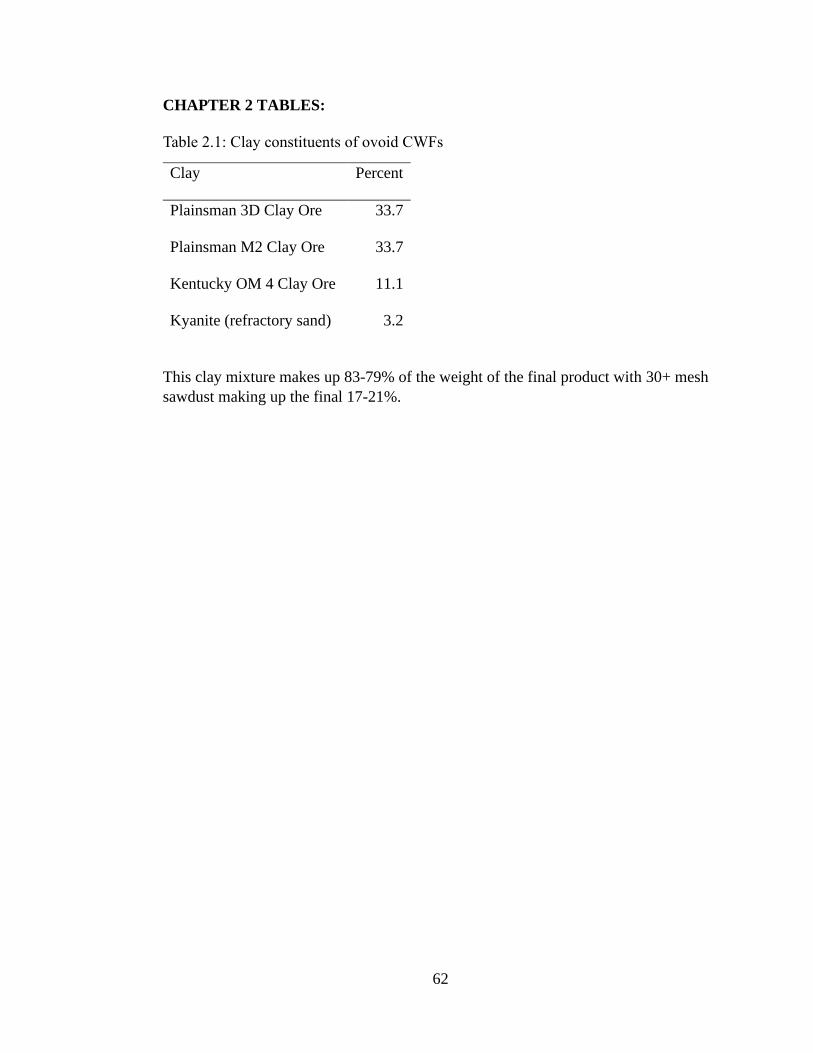
62
CHAPTER 2 TABLES:
Table 2.1: Clay constituents of ovoid CWFs
Clay Percent
Plainsman 3D Clay Ore 33.7
Plainsman M2 Clay Ore 33.7
Kentucky OM 4 Clay Ore 11.1
Kyanite (refractory sand) 3.2
This clay mixture makes up 83-79% of the weight of the final product with 30+ mesh
sawdust making up the final 17-21%.
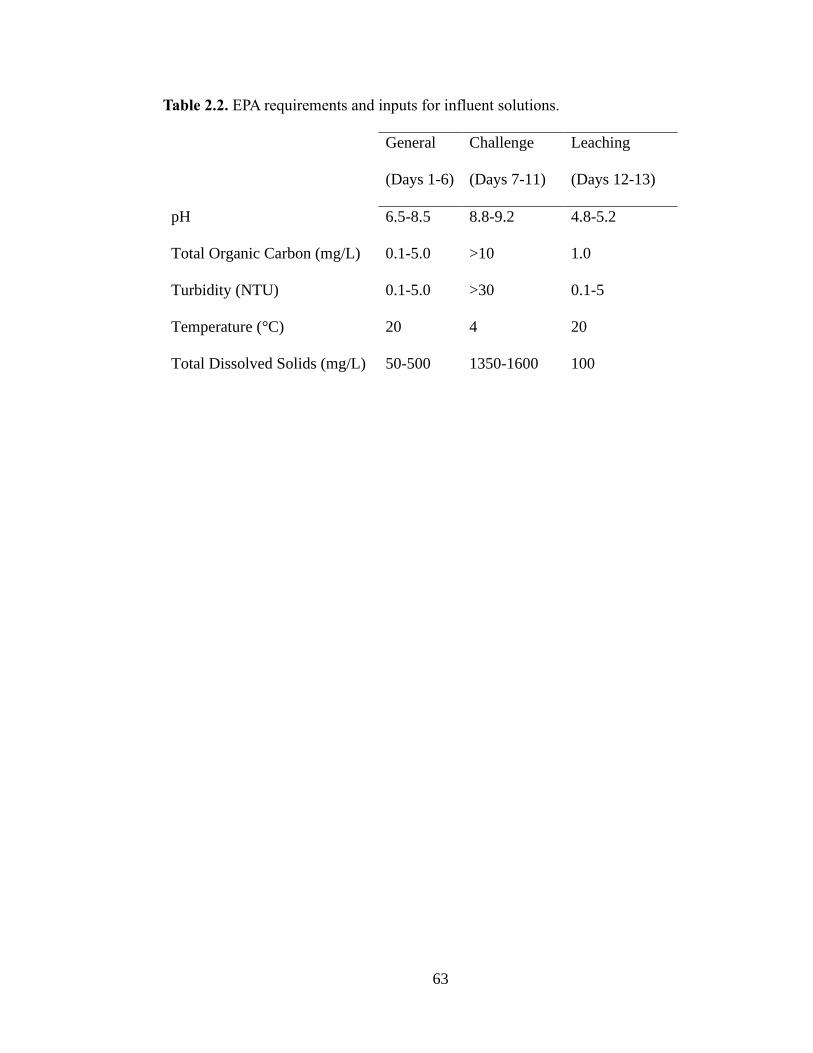
63
Table 2.2. EPA requirements and inputs for influent solutions.
General
(Days 1-6)
Challenge
(Days 7-11)
Leaching
(Days 12-13)
pH 6.5-8.5 8.8-9.2 4.8-5.2
Total Organic Carbon (mg/L) 0.1-5.0 >10 1.0
Turbidity (NTU) 0.1-5.0 >30 0.1-5
Temperature (°C) 20 4 20
Total Dissolved Solids (mg/L) 50-500 1350-1600 100

64
Table 2.3. Reagents for influent solutions
General Input Challenge Input Leaching Input
Days 1-6 7-11 12-13
pH N/A adjusted with NaOH adjusted with HCl
E. coli K12
(ATCC 25404) 109 CFU/L 109 CFU/L 0 CFU/L
Total Organic Carbon 3 mg/L humic acid 15 mg/L humic acid 1.0 mg/L humic acid
Turbidity N/A 330 mg/L kaolinite N/A
Temperature (°C) N/A N/A N/A
Total Dissolved Solids 300 mg/L sea salt 1500 mg/L sea salt 100 mg/L sea salt
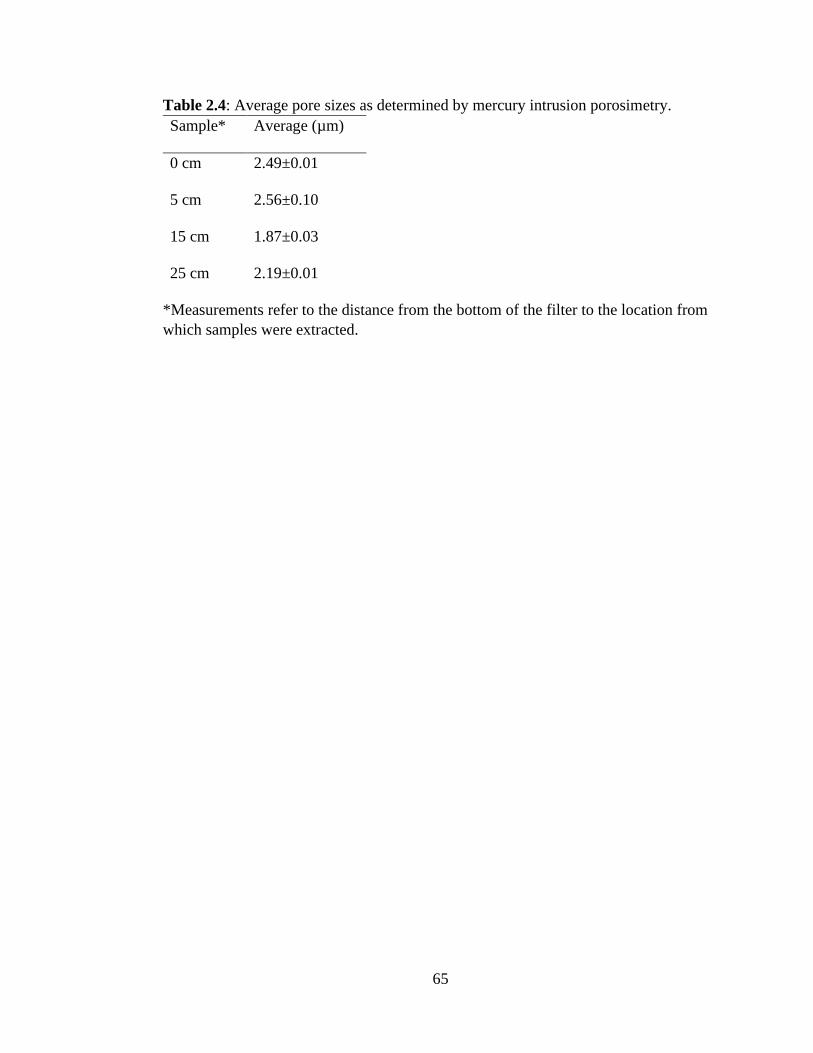
65
Table 2.4: Average pore sizes as determined by mercury intrusion porosimetry.
Sample* Average (µm)
0 cm 2.49±0.01
5 cm 2.56±0.10
15 cm 1.87±0.03
25 cm 2.19±0.01
*Measurements refer to the distance from the bottom of the filter to the location from
which samples were extracted.
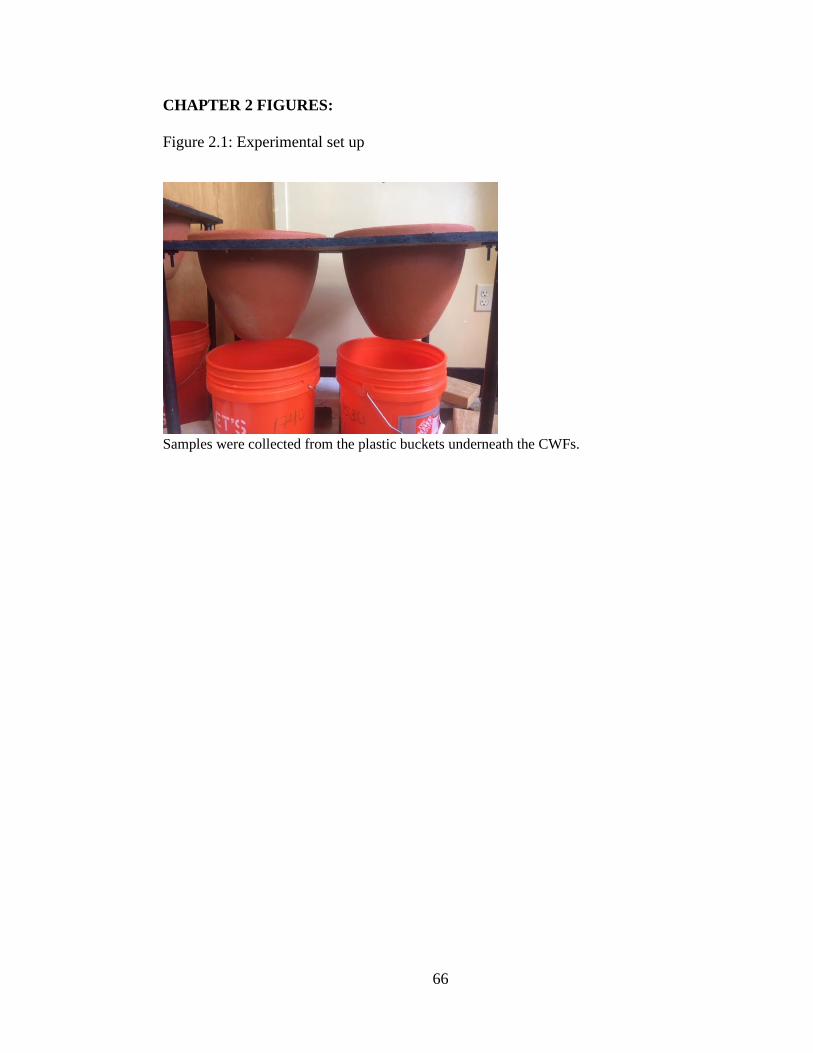
66
CHAPTER 2 FIGURES:
Figure 2.1: Experimental set up
Samples were collected from the plastic buckets underneath the CWFs.
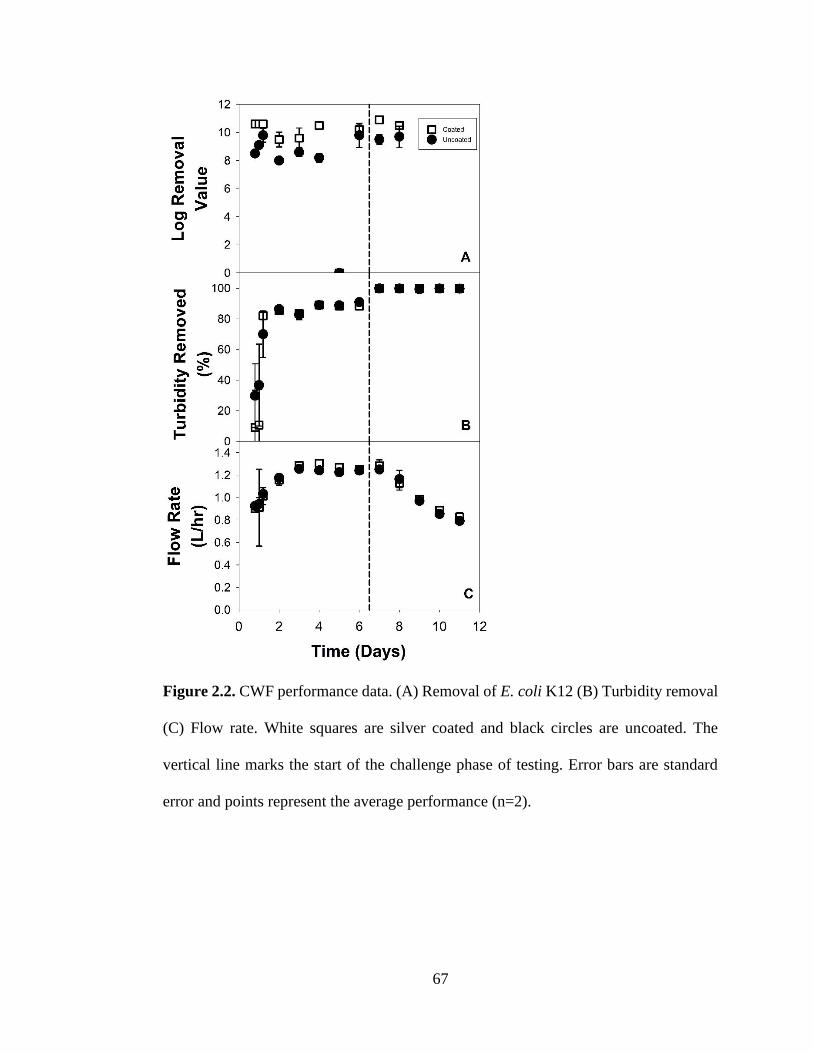
67
Figure 2.2. CWF performance data. (A) Removal of E. coli K12 (B) Turbidity removal
(C) Flow rate. White squares are silver coated and black circles are uncoated. The
vertical line marks the start of the challenge phase of testing. Error bars are standard
error and points represent the average performance (n=2).
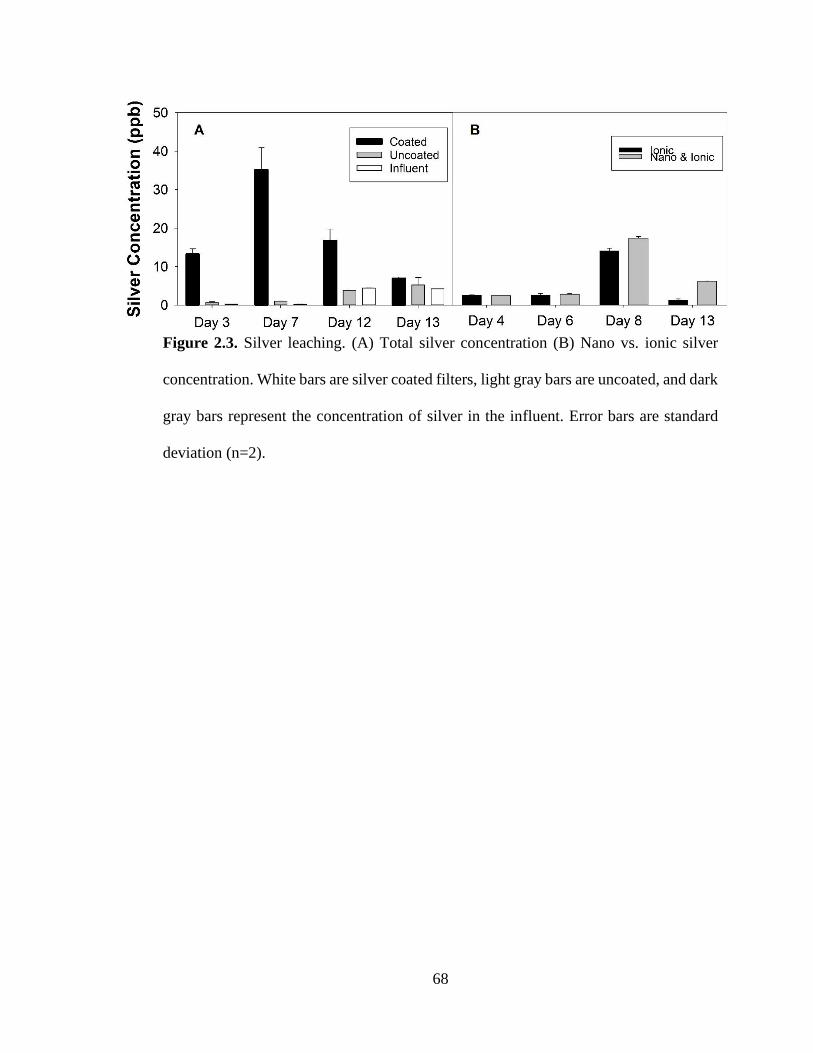
68
Figure 2.3. Silver leaching. (A) Total silver concentration (B) Nano vs. ionic silver
concentration. White bars are silver coated filters, light gray bars are uncoated, and dark
gray bars represent the concentration of silver in the influent. Error bars are standard
deviation (n=2).
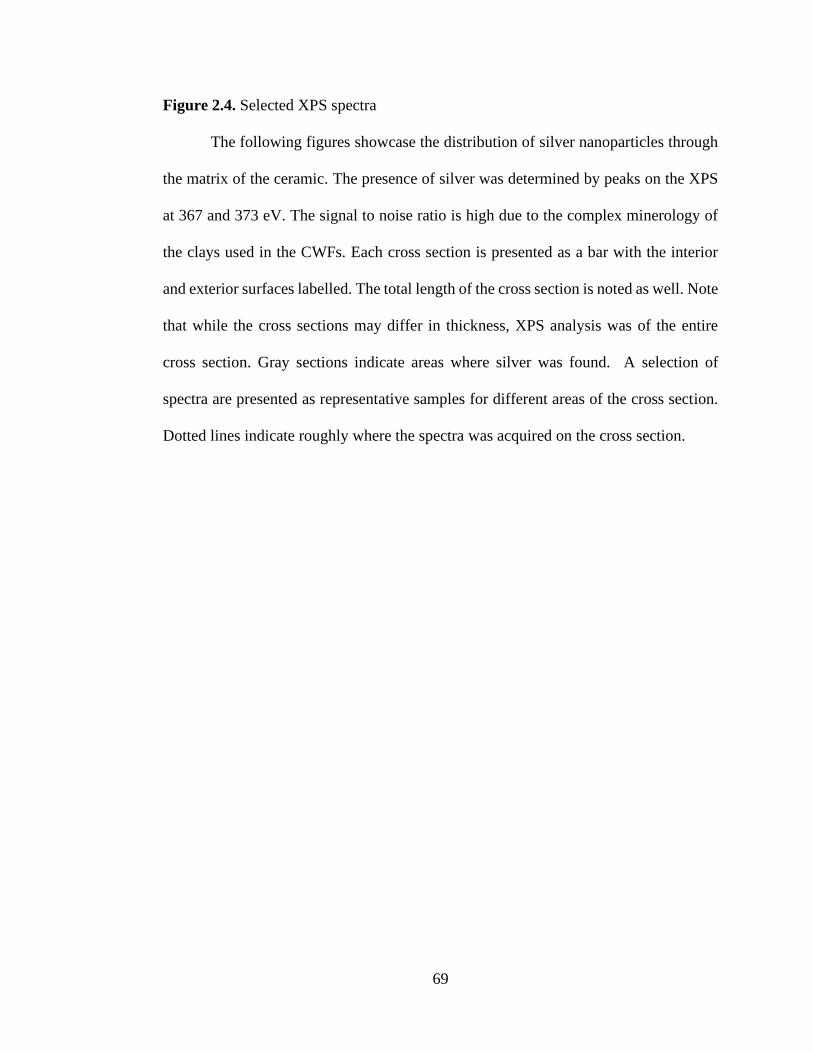
69
Figure 2.4. Selected XPS spectra
The following figures showcase the distribution of silver nanoparticles through
the matrix of the ceramic. The presence of silver was determined by peaks on the XPS
at 367 and 373 eV. The signal to noise ratio is high due to the complex minerology of
the clays used in the CWFs. Each cross section is presented as a bar with the interior
and exterior surfaces labelled. The total length of the cross section is noted as well. Note
that while the cross sections may differ in thickness, XPS analysis was of the entire
cross section. Gray sections indicate areas where silver was found. A selection of
spectra are presented as representative samples for different areas of the cross section.
Dotted lines indicate roughly where the spectra was acquired on the cross section.
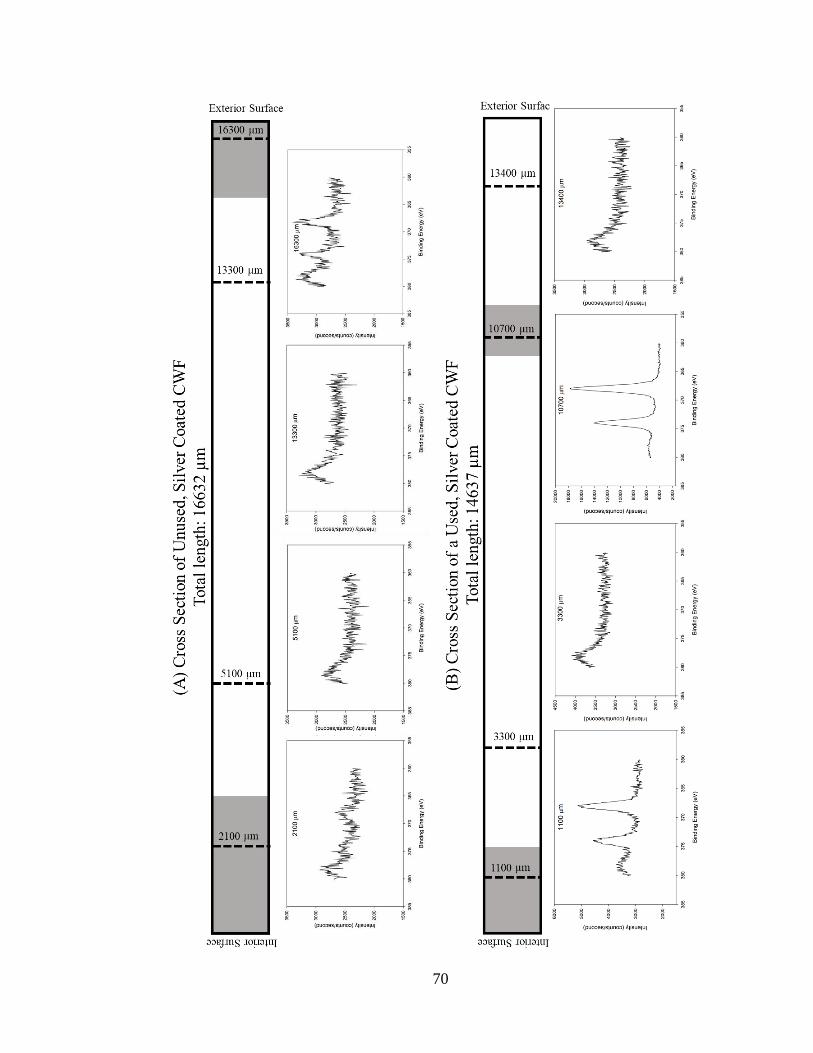
70
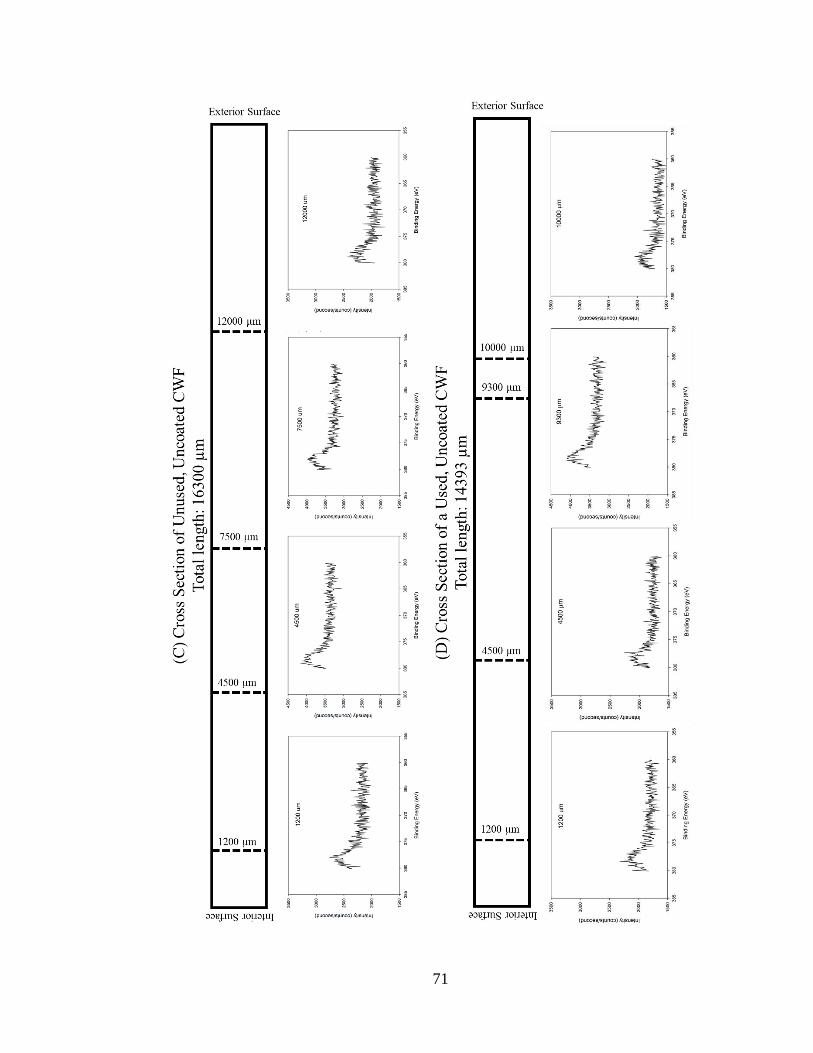
71
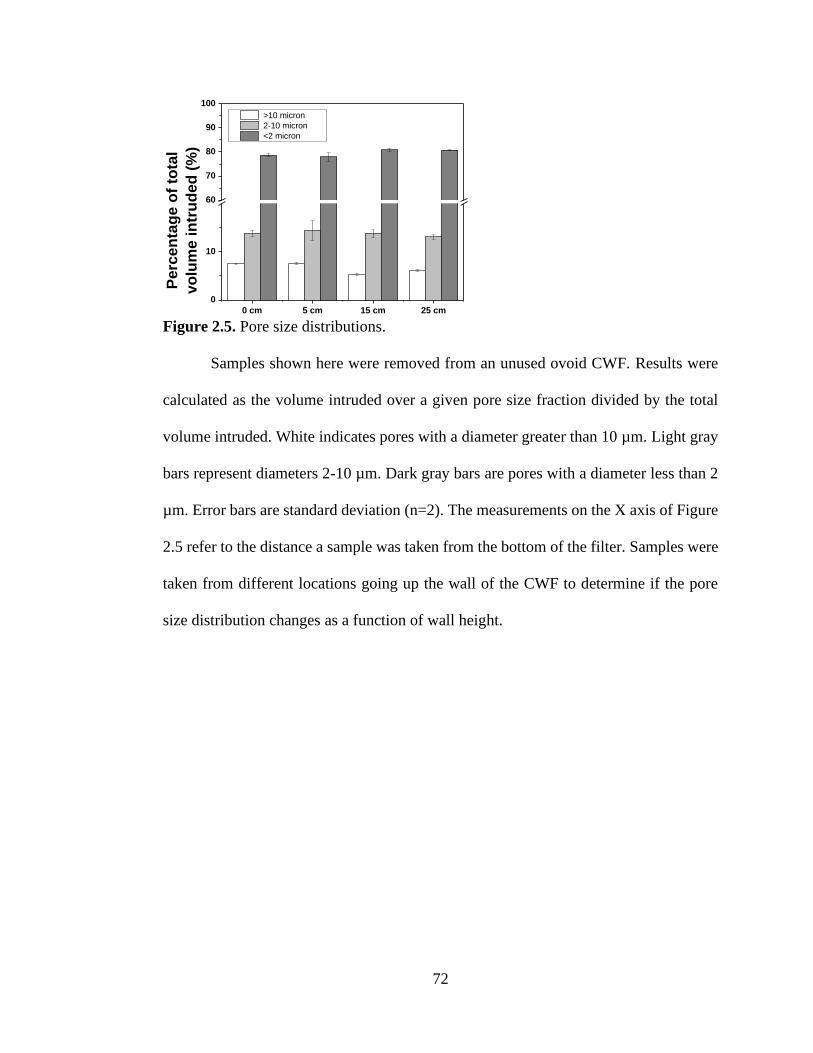
72
0 cm 5 cm 15 cm 25 cm
0
10
60
70
80
90
100
Perc
en
tag
e o
f to
tal
vo
lum
e i
ntr
ud
ed
(%
)
>10 micron
2-10 micron
<2 micron
Figure 2.5. Pore size distributions.
Samples shown here were removed from an unused ovoid CWF. Results were
calculated as the volume intruded over a given pore size fraction divided by the total
volume intruded. White indicates pores with a diameter greater than 10 µm. Light gray
bars represent diameters 2-10 µm. Dark gray bars are pores with a diameter less than 2
µm. Error bars are standard deviation (n=2). The measurements on the X axis of Figure
2.5 refer to the distance a sample was taken from the bottom of the filter. Samples were
taken from different locations going up the wall of the CWF to determine if the pore
size distribution changes as a function of wall height.
73
CHAPTER 3: OVERALL CONCLUSION AND RECOMMENDATIONS
Chapters 1 and 2 reviewed the potential for standardized ceramic water filter
(CWF) testing and examined the performance of a novel ovoid CWF. While these
manuscripts contribute to the literature on CWFs, there is still more that can be done in
this field. Future projects along the same themes as the previous work might involve
applying standardized CWF performance testing in the field, the evaluation of produced
at different factories using a standardized assessment procedure, or the study of the
structure of CWFs using X-ray photoelectron spectroscopy (XPS).
Chapter 1 discusses the importance of utilizing a standardized CWF
performance testing system during the manufacturing process. These assessments
would ideally be performed in the communities in which the CWFs are made. The
implementation of standardized performance assessments at CWF manufacturers and
the initiation of a data sharing network would be an interesting project. Coordination
between CWF manufacturers could improve the performance of CWFs and the health
of developing communities. It would also be interesting to utilize a standardized
performance assessment to evaluate filters produced at different filter factories. This
would demonstrate the way a standardized assessment could highlight the differences
in manufacturing that lead to differences in performance.
XPS was first applied to CWFs in the work presented in Chapter 2 and it has
more to offer the field. Under the right experimental conditions, XPS could be used to
track the movement of silver nanoparticles (AgNPs) through the ceramic matrix over
time. Ceramic disks could be set up so that they are exposed different amounts of a

74
throughput of interest. The migration of AgNPs as a function of throughput volume
would be an important addition to the present literature.