Embed Size (px)
Citation preview
DFT STUDY OF COPPER-NICKEL (111) CATALYST FOR METHANE DRY
REFORMING
A Thesis
by
AHMED SHERIF ALI SHERIF OMRAN
Submitted to the Office of Graduate and Professional Studies of Texas A&M University
in partial fulfillment of the requirements for the degree of
MASTER OF SCIENCE
Chair of Committee, Nimir Elbashir Committee Members, Patrick Linke Hamid Parsaei Head of Department, Nazmul Karim
May 2019
Major Subject: Chemical Engineering
Copyright 2019 Ahmed Sherif Omran

ii
ABSTRACT
No one can deny that the increasing energy demand -due to world population
booming- and climate change are two major challenges facing humanity in the current
century. Climate change phenomenon is basically related to green house gases (GHGs)
emissions which result in increasing temperature of earth. Among GHGs, CO2 is the
major contributor in global warming while CH4 is considered a major energy source as
the main component of natural gas. Dry reforming of methane (DRM) achieves
utilization of both CO2 with CH4 by producing syngas which can be converted into
valuable compounds. Thus, DRM is a currently a hot subject in both industrial catalysis
and environmental research.
The applicability of DRM in industry is hindered by its high energy demand and
coke formation on catalyst surface which leads to rapid catalyst deactivation. Nickel
catalyst is well-known for an activity comparable to those of the expensive and abundant
noble metals. However, pure Ni catalyst can suffer from severe coke formation at the
elevated temperatures required for DRM reaction. To reduce coke formation, Ni-
bimetallic catalysts are examined as they have shown reasonable activity and reduced
carbon deposition. Several nickel-transition metals bimetallic catalysts showed their
potential for coke resistance and improved activity. While the synergetic effects of Co-
Ni-bimetallic catalyst is found to be due to its oxophilicty, Ni- Fe catalyst activity is
attributed to redox system formation. However, Cu behavior of coke resistance and
activity enhancement is still not well-defined at molecular level at the time of this study.

iii
This study uses DFT (Density Functional Theory) computational methods to
evaluate DRM reaction on Ni2Cu (111) bimetallic catalyst. The study will reveal how
different species of elementary reactions are adsorbed on catalyst surface, explore the
reaction mechanism and investigate the role of atomic oxygen as well as hydroxide
species in carbon removal and catalyst stability in presence of Cu in the Ni-Ni network.
The results will also explain the dominant reaction pathway by calculating the activation
energy barriers of different elementary reactions and contribute to design of new stable
and coke-resistant catalyst that can be used for DRM on the industrial scale.

iv
DEDICATION
I kneel humbly to Allah, thanking HIM for showing me the right path, without
HIS help my efforts would have gone in vain.
For my dear parents, thanks for everything, I would not be there without your
kind support and prayers.
My wife Sahar, and my beloved Sherif and Mariam, who experienced all of the
ups and downs of my research and support me all the time, thank you for the happiness
you brought to my life.
For my sister, brothers, family and friends, thank you for your kind wishes, advice
and support.
Last but not least, my deep than gratitude to my friend and colleague for 18 years
Dr.Ahmed Hamid, thanks for your kind clues and support.
I dedicate this work to you all and promise that this is only a start.
Thank you!

v
ACKNOWLEDGEMENTS
I would like to thank my advisor, Prof. Nimir Elbashir for his kind support, from
both personal and technical perspectives, and his guidance through all this work. I would
like to extend my sincere gratitude for my committee members, Prof.Patrick Linke and
Prof.Hamid Parsaei, for their guidance throughout the course of this work. The members
of Office of Graduate and Professional Studies at Texas A&M University at Qatar are
also sincerely acknowledged for their support.
I am especially grateful to Dr. Minhaj Ghouri for his support, helpful discussions
and his assistance in running the computational campaign from scratch. My sincere
thanks are extended to all members of our research team for their valuable scientific
discussions and meetings. I am sincerely grateful to Dr.Ahmed Abdel Wahab for his early
encouragement and support. I am greatly thankful TAMUQ Computational Research
team, Prof. Othmane Bouhali and his team, who made it possible for me to have this
thesis as well. In addition, I would like to express my deep gratitude to all the faculty and
staff at the TAMUQ chemical engineering program for their valuable assistance and
reviews. Moreover, I would like to express many thanks to Prof.Gaber ElEnany from
Port Said University (PSU), without his kind support, I would not be here today. My
sincere gratitude is extended to Dr. Graeme Henkelman from UTA and my fellow Dr.
Andrew Rosen from Northwestern University for their valuable thoughts and help.
Finally, I would like to thank my friends and colleagues at TAMUQ for making
my time here a lively experience.

vi
CONTRIBUTORS AND FUNDING SOURCES
Contributors
This work was supervised by a thesis committee consisting of Professor Nimir
Elbashir as advisor, Professor Patrick Linke of the Department of Chemical Engineering
as well as Professor Hamid Parsaei of the Department of Mechanical Engineering.
The simulations in Chapter 4 were performed on the supercomputing clusters
RAAD & RAAD2.The hardware & software (VASPTM) support from TASC at TAMUQ
is gratefully acknowledged .All other work conducted for the thesis was completed by the
student independently.
Funding Sources
Graduate study was partially supported by Itochu fellowship from Chemical
Engineering Department at Texas A&M University at Qatar.
This work was also made possible in part by NPRP award [NPRP X-100-2-024]
from the Qatar National Research Fund, which is a member of the Qatar Foundation. Its
contents are solely the responsibility of the authors and do not necessarily represent the
official views of the awarding parties.

vii
NOMENCLATURE
A Pre-exponential factor
Al2O3 Alumina
cNEB Climbing nudged elastic band method
DFT Density functional theory
DRM Dry reforming of methane
Ea Activation Energy
FS Final state
GHGs Green house gas
hTST Harmonic approximation of transition state theory
IS Initial state
k Rate constant
MEP Minimum energy path
NEB Nudged elastic band method
n(r) Electron density
SMR Steam reforming of methane
TST Transition state theory
vi Real frequency
v’i Imaginary frequency
ZPE Zero-Point energy correction

viii
TABLE OF CONTENTS
Page
ABSTRACT………………………………………………………………………………ii
DEDICATION……………………………………………………………………………iv
ACKNOWLEDGEMENTS……………………………………………………………… v
CONTRIBUTORS AND FUNDING SOURCES………………………………………..vi
NOMENCLATURE……………………………………………………………………..vii
TABLE OF CONTENTS……………………………………………………………….viii
LIST OF FIGURES…………………………………………………………………….....x
LIST OF TABLES………………………………………………………………………xiv
1 INTRODUCTION AND LITERATURE REVIEW ................................................ 1
1.1 Introduction ..................................................................................................... 1 1.2 Overview on Ni-based catalysts for DRM ........................................................ 3 1.3 Carbon deposition mechanism and coke management ...................................... 4 1.4 Bimetallic Ni-based catalysts for DRM .......................................................... 13
1.4.1 Bimetallic Ni-noble metal catalysts for DRM ............................................. 14 1.4.2 Bimetallic Ni-transition metal catalysts for DRM ....................................... 16
1.5 Ni-Cu bimetallic catalysts .............................................................................. 17
2 RESEARCH PROBLEM AND OBJECTIVES ..................................................... 23
2.1 Research problem........................................................................................... 23 2.2 Research objectives ........................................................................................ 24
3 METHODOLOGY ............................................................................................... 25
3.1 Methods and calculation parameters ............................................................... 25
4 RESULTS AND DISCUSSION ........................................................................... 32
4.1 Mechanism of CH4 dissociation ..................................................................... 35 4.1.1 Adsorption of CHx species on Ni2Cu overlayer Ni (111) surface (x=1-4) .... 35

ix
4.1.2 CHx dissociation (x=1-4) ............................................................................ 35 4.2 Mechanism for CO2 decomposition ................................................................ 40
4.2.1 CO2 direct activation .................................................................................. 40 4.2.2 Hydrogen-induced CO2 dissociation ........................................................... 41
4.3 Oxidation of C and CH .................................................................................. 42 4.3.1 Carbon elimination by C+O and C+OH reaction ........................................ 44 4.3.2 CH+O and CH+OH reactions ..................................................................... 47 4.3.3 CHO (H) and COH decomposition ............................................................. 48
4.4 H2 and H2O formation .................................................................................... 51 4.5 Effect of Cu and temperature on carbon deposition resistance ........................ 53 4.6 Dominant reaction pathways and rate-limiting step ........................................ 60
5 CONCLUSION, RECOMMENDATIONS AND FUTURE WORK ..................... 63
5.1 Conclusion ..................................................................................................... 63 5.2 Recommendations and future work ................................................................ 67
REFERENCES .............................................................................................................. 68
APPENDIX ................................................................................................................... 81

x
LIST OF FIGURES
Page
Figure 1 Summary of catalyst properties for DRM catalyst design modified from30. ........ 4
Figure 2 Pore plugging in a supported metal catalyst owing to carbon adapted from18. .... 5
Figure 3.Carbon containing product for the catalytic reactions: (a) CH4 decomposition (CH4=100%), (b) Boudouard reaction (CO=100%), (c) Dry reforming of methane (CH4=50% and CO2=50%) modified from30. ................................................. 8
Figure 4.Equilibrium data for DRM process adapted from18. ......................................... 10
Figure 5 Proposed mechanism for dry reforming of methane on Ni catalyst modified
from33 to show OH species role. .................................................................................... 11
Figure 6 Deactivation scheme to show schematically the phase transformation and coke formation adapted from 37...................................................................................... 12
Figure 7 Categories of the Catalysts with Encapsulated Structures adapted from49. ........ 13
Figure 8 Summary of characteristic properties of different Ni-based bimetallic catalyst. Cu requires further study to interpret its properties on molecular level modified from 26. ........................................................................................................... 14
Figure 9 Energy profile of C oxidation by lattice oxygen in FeO/Ni (1 1 1) (in unit of eV). The gray and red balls denote the C and O atoms, respectively adapted from 67. 17
Figure 10 The energy profiles for the dissociation of CH4 on elementary metals (Fe, Co, Ni and Cu) and bimetals (NiFe, NiCo and NiCu) surfaces modified from84. ..... 22
Figure 11 Electronic Hamiltonian components modified from 95 .................................... 26
Figure 12 Sequence of DFT calculations shows workflow for DRM over Ni-Cu surface. .......................................................................................................................... 32
Figure 13 Ni2Cu overlayer of Ni (111). .......................................................................... 34
Figure 14 Activation energy profile of CH4 dehydrogenation. Gray frame is showing T.S. configuration where CH3 and H are co-adsorbed on TopNi. ....................... 36

xi
Figure 15 Activation energy profile for CH4 dissociation steps. ..................................... 38
Figure 16 Activation energy profile for different CH3 possible pathways. It has been found further dehydrogenation is favored over oxidation. Similar pattern has been noticed for CH2. ............................................................................................................. 39
Figure 17 Activation energy profile of H-induced CO2 activation .Gray frame show T.S. configuration .......................................................................................................... 41
Figure 18 Activation energy profile for H-induced CO2 dissociation.............................. 42
Figure 19 Coke removal via atomic oxygen has smallest energy barriers of all other oxidation reactions. Black Frames are showing initial state, T.S. and final state. ............ 45
Figure 20 Comparative activation energy profiles of C+O oxidation reaction for Ni2Cu (red) and Ni2Fe (black) surfaces. It shows that carbon elimination is improved more than twice. ............................................................................................ 46
Figure 21 Activation energy profile of CH oxidation by OH.OH is effective oxidant that helps skipping CH dissociation. Gray frame is showing T.S. configuration where OH is adsorbed on TopCu while CH adsorbed on TopNi. ...................................... 47
Figure 22 Activation energy profile of CHOH favorable dissociation to form COH*+H*.Gray frame is showing T.S. configuration. ................................................... 48
Figure 23 Activation energy profile of different CHOH* dissociation pathways. .......... 50
Figure 24 H2O formation via OH*+H* reaction. The weakly adsorbed H2O may physically remove coke from catalyst surface in DRM elevated temperatures (steam). Gray frame is showing T.S. ........................................................................................... 51
Figure 25 Illustration of workflow for constructing a microkinetic model adapted from116. ......................................................................................................................... 54
Figure 26 Rate constant values of coke removal reactions on different temperatures. ..... 57
Figure 27 Periodic cycle of carbon deposition and elimination results in is Ni2Cu catalyst stability ............................................................................................................. 58
Figure 28 Dominant pathways energy barriers in eV. For comparison, Ea in black is for Ni (111), green is for Ni2Cu surface while red color values are for carbon deposition/elimination steps on Ni2Cu surface adapted from 119.. ................................... 62

xii
Figure 29 CH4 conversion for DMR on Ni(111) and different Ni-Cu modified catalyst. Medium Ni-Cu catalyst (in blue) is showing sustained conversion over TOS of 10 h reprinted with permission from our research group. ................................... 64
Figure 30 CO2 conversion for DMR on Ni(111) and different Ni-Cu modified catalyst. Medium Ni-Cu catalyst (in blue) is showing sustained conversion over TOS of 10 h reprinted with permission from our research group. ................................... 65
Figure 31 H2/CO ratio for DMR on Ni (111) and different Ni-Cu modified catalyst. Medium Ni-Cu catalyst (in blue) is showing sustained conversion over TOS of 10 h reprinted with permission from our research group. ....................................................... 66
Figure 32 Integrated approach of Ni2Cu catalyst Design ................................................ 67
Figure 33 Sample input files for cNEB calculations showing all input settings. ............. 86
Figure 34 Sample POSCAR file shows the position of Ni and Cu atoms in Ni (111) slab. ............................................................................................................................... 87
Figure 35 Sample POTCAR file shows the PAW of Cu. ................................................ 88
Figure 36 Sample Output File show the slab energy after required accuracy is reached. . 89

xiii
LIST OF TABLES
Page
Table 1 Different carbon species formed on the catalyst reprinted from18......................... 5
Table 2 Calculated adsorption energies of the species involved in DRM on Ni2Cu overplayed Ni (111) surface........................................................................................... 33
Table 3 Calculated activation energies for all forward (Ea,f) , reverse (Ea,r) and enthalpy (∆Hf) of elementary reaction involved in dry reforming of methane................. 52
Table 4 Rate Constant k(S-1) on Ni2Cu surface at different temperatures. ....................... 56
Table 5 Vibrational frequencies and Zero-point energy correction of T.S. of dominant elementary reactions. ..................................................................................................... 59

1
1 INTRODUCTION AND LITERATURE REVIEW
1.1 Introduction
"Let us face it, there is no Planet B" said Emanuel Macron, the French president
while he addressed the US lawmakers suggesting that U.S. should come back and rejoin
the Paris Climate Agreement1. No doubt that increasing concern over global warming and
greenhouse gases (GHGs) effect has been accelerated in the last decades. With estimated
25.7 gigatons emissions into our atmosphere, CO2 can be considered a major contributor
to global warming2. Despite the efforts from organization such as European Union, Fossil
fuels still hold a major share in the energy mix that resulted from the increasing energy
demand. Utilization of fossil fuels escalates the CO2 emissions and worsens their global
warming effect. Capturing CO2 and using it as a chemical feedstock can be a double
benefit for both environmental and profitability perspective that can drive lawmakers and
industry towards more green economy3,4.
Monetization of both CO2 with CH4, which is the most problematic greenhouse
gas, into more valuable compounds is key subject in industrial catalysis and
environmental research5,6. Fossil fuel consumption releases million tons of CO2 and other
(GHGs) into the atmosphere which is a main factor to global warming and climate
change. Hansen et al showed that the temperature rose at least 0.8 ◦C since 1951 and have
forecasted of continuous increment in 21st century7. Among the GHGs, while CO2 is the
most important contributor in terms of quantity emitted8, natural gas that is mainly
composed of methane and other light hydrocarbons C2-C4 is a major player as clean

2
energy resource. For the major natural gas producers such as USA, Qatar and Russia,
methane monetization represents a major drive for the whole economy. For these
countries, the approach utilization of both CO2 and methane will not only save the
environment9,10, but also it will boost both local, regional and global economy11. In the
context, dry reforming of methane that utilize both major GHGs, which is CH4 and CO2,
is one of the attractive processes for converting the GHGs into value-added chemicals
and fuels 12,13,14,15,16.
The Dry Reforming of Methane (DRM) reaction is given by the following
equation:
CH4 + CO2 → 2 CO + 2H2 ∆H◦ = 247.3 kJ mol-1 1)
The DRM reaction catalytically reform CH4 with CO2 to result in syngas (CO and
H2). In return, the produced syngas is very valuable precursor for many other products
and uses. It can be used either directly as fuel or converted to other hydrocarbons to
produce valuable and ultra-clean fuels and products such as methanol, diesel, gasoline,
kerosene and naphtha through Fischer-Tropsch and other reactions17,18,19,20 . Moreover,
DRM can be used in other industries as in steel manufacturing where syngas plays the
role of reducing agent to get reduced iron21.
Despite the recent improvements and researches related to DRM, certain
challenges are persistent and still required to be faced. First and foremost, the reaction is
highly endothermic and energy intensive which limits the uses due to large capital
required. The reaction need to be controlled above 700 ◦C otherwise competitive

3
reactions will dominate and enhance carbon formation. This coke formation itself is
another major challenge as it causes rapid catalyst deactivation and results in less
efficient non-stable reaction which hinders the industrial application. Thus, producing of
stable and efficient catalysts with economic visibility is very crucial for long term
operation22. Recently, the proposed solutions to address these challenges include
combined reforming and optimization 23,24,12, and developing catalysts that resist coke
formation25,26.
1.2 Overview on Ni-based catalysts for DRM
Recent researches used different metal catalyst such as Platinum (Pt), Rhodium
(Rh), Iridium (Ir), Cobalt (Co) and Nickel (Ni) for DRM. It cannot be denied that noble
metals such as Ru and Rh proved their higher catalytic activity, prolonged stability as
well as coke resistance. Pakhare and Spivey22 reviewed the performance of different
noble metals in DRM and investigated their effect on the reaction kinetics and
mechanism. However, noble metals are costly and less abundant which limit their
economic attractiveness for the large industrial scale use22.On the opposite side, Ni-
based catalysts showed comparable catalytic activity to noble metals, still it is a cheap
alterative transition metal with high availability27,28 ,29.
Catalyst design and synthesis play a major role in the catalytic performance.
Properties such as strong metal-support interaction, dispersion and size, oxygen storage
capacity, basicity, porosity surface area and reducibility are manipulated in a complicated
4
trade-off process in order to tackle certain problems such as reduced catalyst activity or
coke formation as shown in Figure 130.
Figure 1 Summary of catalyst properties for DRM catalyst design modified from30.
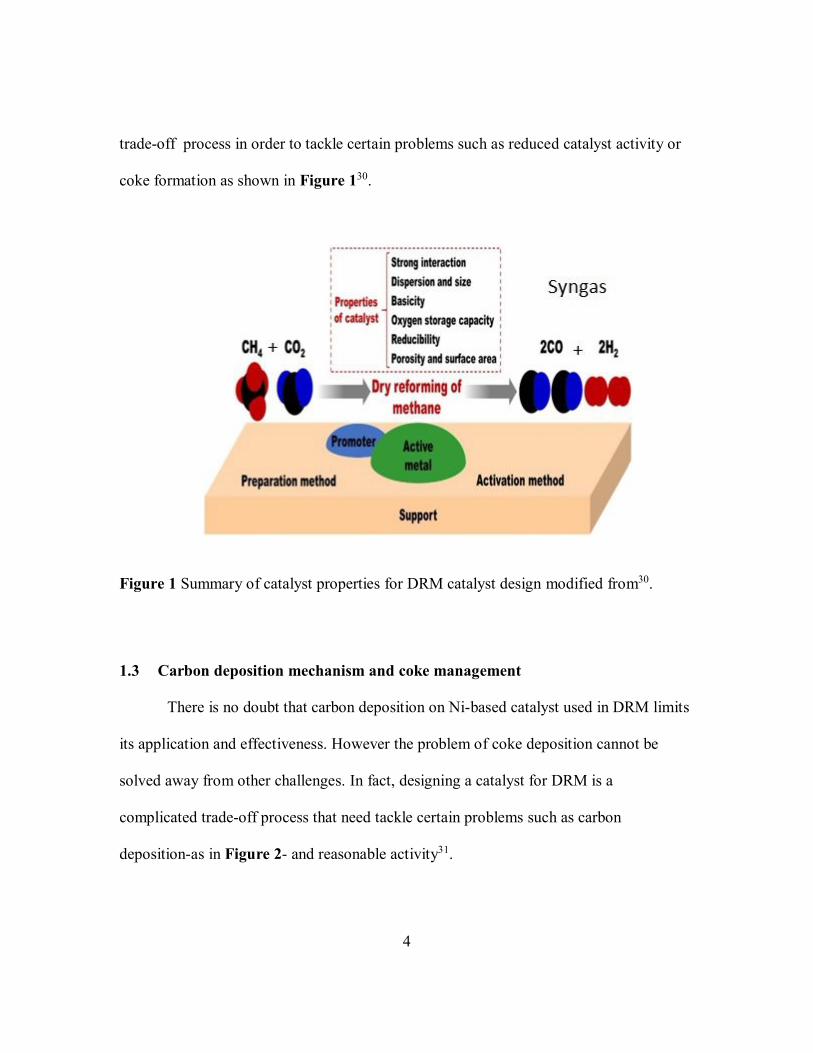
1.3 Carbon deposition mechanism and coke management
There is no doubt that carbon deposition on Ni-based catalyst used in DRM limits
its application and effectiveness. However the problem of coke deposition cannot be
solved away from other challenges. In fact, designing a catalyst for DRM is a
complicated trade-off process that need tackle certain problems such as carbon
deposition-as in Figure 2- and reasonable activity31.

5
Figure 2 Pore plugging in a supported metal catalyst owing to carbon adapted from18.
Table 1 Different carbon species formed on the catalyst modified from18 Carbon Structure Designation Temperature range (degC)
Adsorbed, atomic carbon
(surface carbide)
Cɑ(alpha) 200-400
Polymers, amorphous films Cß(Beta) 250-500
Ni carbide (bulk) CƳ(gamma) 150-250
Vermicular filaments or whiskers Cv(filamentous) 300-1000
Graphite (crystalline) platelet films Cc(crystallline) 500-550

6
DRM is usually associated with competitive reactions such as Boudouard
reaction, Reverse water–gas shift (RWG), methane cracking and methanation. Among
these reactions, Boudouard reaction and methane cracking are responsible directly for
carbon formation which causes rapid catalyst deactivation as in Table 1 and Scheme 1.
Boudouard reaction : 2CO → Cads + CO2 ∆H◦ = -172 kJ mol-1 (2)
Reverse water–gas shift:
CO2+H2 CO+H2O ∆H◦ = 41 kJ mol-1 (3)
Methane cracking: CO2+H2 CO+H2O ∆H◦ = 41 kJ mol-1
(4)
Methanation: CO2+4H2CH4+2H2O ∆H◦ = -165 kJ mol-1
(5)

7
Scheme 1 Mechanism of carbon formation at the catalyst surface adapted from 18.
Temperature control plays crucial to avoid these side reactions as well as manage
coke formation. While methanation are favored at lower temperature (300◦C),
Boudouard reaction generate less reactive species at temperatures (500-700◦C) which
deposits on metal.
Increasing the temperature to above 800◦C inhibits the highly exothermic
Boudouard reaction and more reactive carbon species are formed mainly due to methane
cracking which can be easily oxidized by CO2. In other words, coke formation is
minimized as carbon removal by CO2 is equivalent or faster than carbon formation.
However, these high temperature operation demands more energy, which represents an
economic challenge for DRM industrial applicability while produce more CO2 if the
energy source is fossil fuel. Recently, Wang et al28 suggested utilizing promoters such as

8
Ce and Zr in optimum process parameters can lower this temperature with enhancement
of the ability of carbon deposition elimination and carbon deposition resistance28.
Figure 3.Carbon containing product for the catalytic reactions: (a) CH4 decomposition (CH4=100%), (b) Boudouard reaction (CO=100%), (c) Dry reforming of methane (CH4=50% and CO2=50%) modified from30.
To illustrate the kinetic and thermodynamics of DRM, let CX (X= A, B, or R) is
the component concentration and k0 is the frequency factor, as determined by the
Arrhenius law, equilibrium constant K, absolute temperature T, activation energy Ea,
while k0 is the pre-exponential factor, and R is the universal gas constant.
From Arrhenius Equation:
Forward reaction rate constant:
k = k0 exp (-Ea/RT)
(6)
rf = kf(CA,CB), kf= k0f exp(-Ea/RT)
(7)

9
Reverse reaction rate constant:
So one can conclude that the equilibrium constant K=kf/kr; which determine the
DRM extent. As implied from above Figure 3 and Figure 4, methane decomposition
occurs at temperatures above 557◦C and the Boudouard reaction at temperatures below
700◦C.Thus, maximum carbon deposition is reported in the temperature range 557–700◦C,
as shown in the equilibrium data for the DRM reaction32.
Zhu et al36 conducted a comprehensive DFT study for DRM over Ni (111)
catalyst to investigate the reaction mechanism . They observed that the dominant pathway
for DRM includes CO2 direct decomposition to form atomic O as well as methane
dissociation to generate CH and C, followed by the CH and C oxidation by atomic
oxygen and finally decomposition of CHO to produce CO. However, they stressed that
the OH oxidant effect cannot be ignored 33.Tomishige et al38 tried to investigate carbon
deposition source and conclude that carbon formation fromCH4dissociation is more than
that formed from CO disproportionation and that may be attributed to the fact that CH4
dissociation promoted Ni aggregation than CO34. In two separate publications, Trimm et
al35 investigate the role of Ni3C in DRM and concluded that formation of nickel carbide is
crucial step in coke formation over Ni- based catalysts36.
rr= kr(CR), kr= k0r exp(-Ea/RT)
(8)

10
Figure 4.Equilibrium data for DRM process adapted from18.
The same conclusions have been confirmed by DFT studies. Ziyun et al37 focused
on carbon deposition mechanism on Ni different surfaces as shown Figure 5. The study
showed that carbon deposition is sensitive to Ni metal surface structure and emphasis on
the main role of Ni3C on rapid carbon deposition that leads to rapid catalyst deactivation.
Moreover, carbon diffusion and segregation on the Ni surface is related to surface
structure. Surface modification is with no doubt- a key factor to inhibit coke formation
during DRM. It has been found that carbon diffuse more in Ni surfaces in the following
order: 110>100>11137.

11
Figure 5 Proposed mechanism for dry reforming of methane on Ni catalyst modified from33 to show OH species role.
Experimentally, this claim has been confirmed by plasma techniques which
ensure that Ni (111) lattice structure is well-defined with proper Ni dispersion, reduce
particle size and ensure the strong metal-support interaction (SMSI). The result of this
well-define structure was high catalytic activity and excellent resistance to formations of
filamentous carbon and encapsulating carbon38,39. Figure 6 shows schematically the
phase transformation and coke formation Ni(111) and Ni(211) stand for the clean nickel
metal flat and stepped surfaces respectively, and Ni3C(001) and Ni3C(111) are the flat

12
and stepped nickel carbide37. Flat surfaces are marked in blue, while stepped surfaces are
in red. Toxic coke is the more stable and high toxicity carbon atom which will result in
the deactivation of the nickel catalyst. The corresponding overall reaction rates are
marked below the different structures. The arrow with X means this step is not likely to
occur, while arrow without X means this step could happen37.
Figure 6 Deactivation scheme to show schematically the phase transformation and coke formation adapted from 37.
Particle size is another main factor that can control carbon deposition. Under the
DRM high temperature conditions the Ni particle easily agglomerate due to thermal
sintering40,41. Kim et al46 showed that 7 nm is the lowest diameter for Ni nanoparticles
(NPs) to enable filamentous carbon formation42. Nicolas et al31 highlighted the need for a
fine catalyst particle size, ideally below 5 nm, to avoid excessive carbon deposition31.

13
Several strategies can be utilized to control the nickel particle size and hence
reduce coke formation: (1) Enhance the dispersion of Ni during preparation43,44, (2)
Improve Ni capacity for anti-sintering by SMSI 45,46 and (3) Use a core-shell and
mesoporous support to improve the confinement effects as in Figure 747,48.
Figure 7 Categories of the Catalysts with Encapsulated Structures adapted from49.
1.4 Bimetallic Ni-based catalysts for DRM
Recently Ni bimetallic catalysts have received a lot of attention and research due
to its practicality. Doping other metals in Ni-Ni network results in synergistic effect due
the change of metal surface properties which, in turn, improves the catalytic activity and
improve carbon resistance30,50, For DRM reaction, Ni can be coupled with either noble or
transition metals. The former option has recently received due to its availability and
cheap price, which enables long term operation without frequent shutdowns for catalyst
change or regeneration. Figure 8 summarizes different bimetallic alloys and their
characteristic properties.

14
Figure 8 Summary of characteristic properties of different Ni-based bimetallic catalyst. Cu requires further study to interpret its properties on molecular level modified from 26.
1.4.1 Bimetallic Ni-noble metal catalysts for DRM
Noble metals such as Ir , Ru and Pt are used frequently for DRM because they
exhibit high catalyst activity and less coke formation25,51,52.However, their application is
limited due to less availability and high cost. Foppa et al53used DFT calculations to
explain coke resistance of noble metals by comparing DRM and competitive reactions
free energy span. Their study57 showed that Boudouard reaction results in less reactive
15
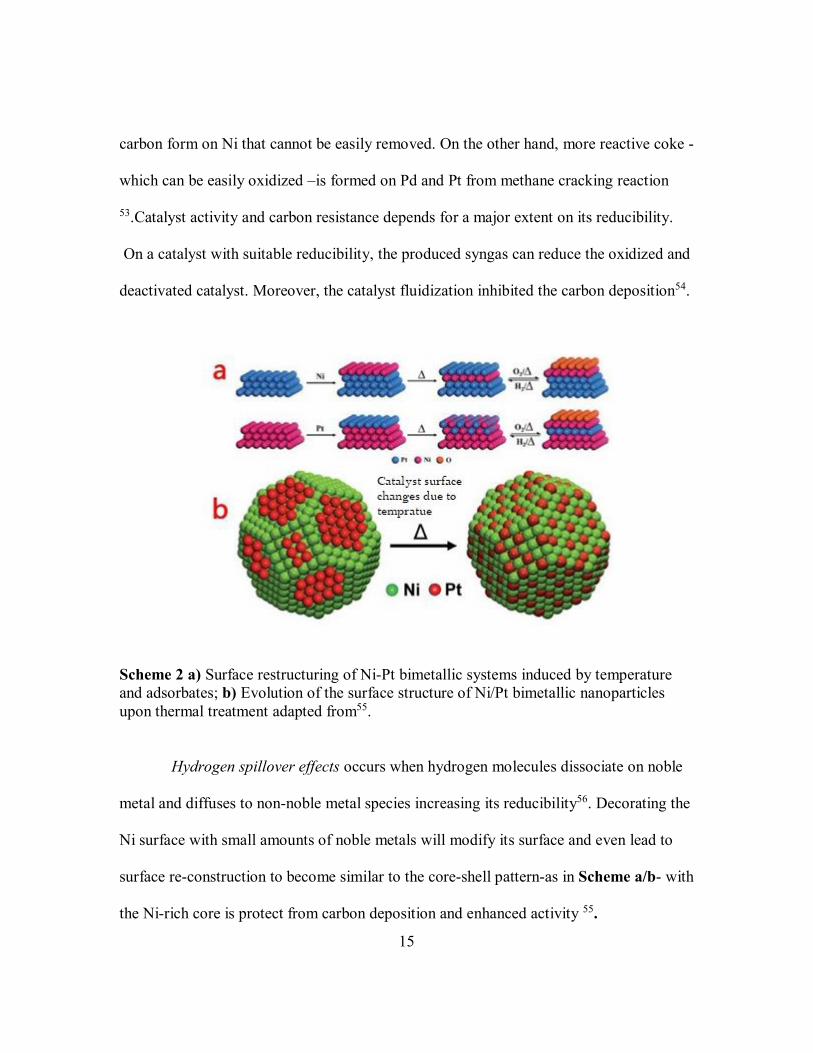
carbon form on Ni that cannot be easily removed. On the other hand, more reactive coke -
which can be easily oxidized –is formed on Pd and Pt from methane cracking reaction
53.Catalyst activity and carbon resistance depends for a major extent on its reducibility.
On a catalyst with suitable reducibility, the produced syngas can reduce the oxidized and
deactivated catalyst. Moreover, the catalyst fluidization inhibited the carbon deposition54.
Scheme 2 a) Surface restructuring of Ni-Pt bimetallic systems induced by temperature and adsorbates; b) Evolution of the surface structure of Ni/Pt bimetallic nanoparticles upon thermal treatment adapted from55.
Hydrogen spillover effects occurs when hydrogen molecules dissociate on noble
metal and diffuses to non-noble metal species increasing its reducibility56. Decorating the
Ni surface with small amounts of noble metals will modify its surface and even lead to
surface re-construction to become similar to the core-shell pattern-as in Scheme a/b- with
the Ni-rich core is protect from carbon deposition and enhanced activity 55.

16
1.4.2 Bimetallic Ni-transition metal catalysts for DRM
Transition metals such as Cu, Fe, Co showed intrinsic characteristics to improve
both catalyst activity and resistance to coke formation 57.
Co was used as both mono and bimetallic catalyst for DRM 58,59. Cobalt-based
catalyst exhibits high CH4 conversion for continuous 250 h TOS (Time-On-Stream) with
reduced coke formation 60. It is widely believed that a high metal dispersion or small
ensemble size can be enhanced by reducing the Ni–Co content. High metal dispersion is
responsible for the Ni–Co outstanding stability, SMSI and coke resistance60,61. The
enhancement of catalytic activity and stability is thought to be due to its high
oxophilicity. While Co is oxidized to Co-O via carbon dioxide, the carbon species from
CH4 dissociation reduce it again to Co0 resulting in dynamic redox system which
maintain catalyst stability.
Ni-Fe catalysts have been also investigated and showed improved coke resistance
due to Ni-Fe alloying and re-alloying process. The presence and migration of FeO at the
surface allowed its reaction with deposited carbon. This phenomenon explained the
increased stability via Fe2+/Fe0 redox cycle as in Scheme 362,63 . Recently, Xu et al64
conducted DFT study on DRM over Ni2Fe of Ni(111) and concluded that the surface C
reacts with lattice oxygen of FeO to produce CO via Mars-van Krevelen (MvK)
mechanism with a low energy barrier of 0.16 eV as in Figure 9, which agrees with the
experimental results from Stavros et al 63,64,65.

17
Scheme 3 Dealloying and realloying behavior of an Fe-Ni alloyed particle in DRM modified from 66.
Figure 9 Energy profile of C oxidation by lattice oxygen in FeO/Ni (1 1 1) (in unit of eV). The gray and red balls denote the C and O atoms, respectively adapted from 67.
1.5 Ni-Cu bimetallic catalysts
The Ni-Cu bimetallic catalyst on different supports such as SiO2 and Al2O3 and
others has been studied. It has been proven that the incorporation of Cu into Ni-Ni

18
surface has been proven to enhance stability, promote activity and improve coke
resistance in dry reforming. For example, Pendem et al68 studies the Cu–Ni interfacial
interaction and chemical state of the active catalytic phase. By characterization of the
fresh and used catalyst, they showed that the Cu- Ni particles intrinsic catalyst synergy
may be responsible for the bimetallic catalyst high stability and reactivity, even with
good recyclability after ten successive cycles without considerable loss in the activity.
Yet, there is no clear interpretation the role of Cu especially at the molecular level
in terms of enhanced carbon resistance to date26,69, 70.
Cu can act as active phase promoter in CH4/CO2 reforming. As per Massimiliano
et al72, the partial substitution of Ni by Cu interrupts the Ni-Ni network and reduces coke
formation69. While Ni and Fe catalysts have a comparably high catalytic activity and
suffer from performance degradation caused by coking, Cu catalyst is less active
compared to both catalysts but more resistant to coking.71 .
Vizcaíno et al72 proved that Nickel is the phase mainly responsible of hydrogen
production by ethanol steam reforming over Cu–Ni supported catalysts, while the copper
presence reduces the CO formation and coke deposition72.Kim et al73 exposed Ceramic-
metal (cermet) composites having alloy compositions of 0, 10, 20, 50 and 100% Ni were
exposed to dry reforming of methane at 1073 K for 1.5 h. The experiments demonstrate
that coke formation is greatly halted on the Cu-Ni surfaces compared to Ni catalyst. More
interestingly, they also noted that carbon formation on the alloys reduced with the
increased reduction temperatures74. Misture et al77 showed that oxide-supported metal
catalysts has high activity for dry reforming of methane with turnover frequencies as

19
large as 3.9 at 850 °C. The Ni0.375Cu0.375Mg0.25Al2O4 catalyst shows stable methane
conversion out to 12 h on stream without performance-degrading coking75.The same
outcome was confirmed by Reshetenko et al76 , Lopez et al77 and Miriam et
al78.Moreover,Sharifi et al concluded that Cu addition improved feed conversion,
products yield and better syngas ratio when he used Cu-promoted Ni/Al2O3-ZrO2
catalyst79.Similar result was indicated by Bonura et al who concluded that copper
addition promotes the kinetics of nickel reduction80.
In attempt to explain the effect of Cu, Nader et al reformed CH4/CO2 over
synthesized 2 Ni–Cu/Al2O3 nanocatalysts that were prepared separately via impregnation
method and treated using non-thermal plasma methods separately. The authors indicate
that while stability of the nanocatalyst was attributed to size of NiO crystals, its activity
strongly dependents on the morphology and the synergism effect between nickel and
copper particles81. This synergism effect itself is related to the Cu loading up. Wu et al
concluded that a Cu/Ni of 1:3 loading showed higher activity whereas higher Cu content
significantly reduces the activation of methane. This can be explained by possibly due to
that the competitive adsorption of CH4 and slow dissociation kinetics on copper atoms.
Surface enrichment of copper due to low surface energy compared with Ni may also
decrease the number of active Ni sites on the surface and affect activity for high copper
ratios 82 .
The above experimental conclusions are in agreement with DFT calculations.
Wang et al investigate the effect of doping coinage metals in Ni-Ni network for DRM.
The authors focused on the successive dehydrogenation of CH4, as well as the diffusion

20
of CH (one of the important carbon-containing intermediate along with CO), on the
doped Ni (111) surfaces. He concluded that the adsorption energies of CHx (x=0-3) are
reduced on alloy surface compared to the corresponding adsorption energies on Ni (111)
surface. In particular, the Cu-Ni surface makes the CH intermediate product is much
more difficult and thus prevents the CH species reactions60. Liu et al conducted DFT
study to investigate the dissociation of CH4 on NiCu (111) surface. The results showed
that Cu-rich surface shows better coke resistance 83. The same group studied the
dissociations of carbon deposition on (111) catalyst surfaces of both elementary metals
(Fe, Co, Ni and Cu) and bimetals (NiFe, NiCo and NiCu). Based on their DFT
calculation, they showed that carbon deposition is expected to be least likely to occur on
segregated NiCu surface compared to Ni (111) surface84. These results agree with An et
al86 who concluded that the activation energy barrier (Eact) for CH→C+H on NiCu (1 1 1)
is found to be 1.8 times larger than that on Ni(111), while Eact for CH4→CH3+H is 1.3
times larger 85. Similar conclusion has been confirmed by Wei et al86 who studied the
methane dehydrogenation on a bimetallic Cu/Ni (111) surface. To conclude, the Cu-Ni
surface reduces coke formation by elevating the CH energy barriers. However, the
stability of CuNi alloy cannot be fully explained by the ensemble effect of Cu on Ni
metal that may inhibit the carbon formation rate on Ni catalyst. More comprehensively,
the incorporation of Cu into Ni affects the oxidation pathway of the deposited carbon, and
this factor would be more important in the stability control of CuNi alloy87,88.
Most reports in literature recognize the role of Oxygen (O) species in carbon
elimination, Zhang et al70 highlighted that not only O species but also OH species has

21
stronger role in carbon elimination in case of Ni (111) and CuNi(111) surface. In their
attempt to explain carbon elimination on Ni based surfaces, they have used DFT
calculations to systematically investigate the mechanism of surface carbon elimination by
O and OH on both the alloy FeNi(111) and CuNi(111) surfaces 70. Their finding showed a
linear relationship between the average adsorption energy of C+O or C+OH species and
the activation barrier of C+O or C+OH reactions for carbon formation70. Thus, they
explained that the ability of carbon elimination on the metal surface increases with the
decreasing of adsorption ability for C+O and C+OH species on the corresponding metal
surface70. In other words, as CuNi(111) surface promotes carbon elimination and inhibit
carbon, carbon elimination is accelerated resulting efficient periodic cycle of carbon
formation and elimination which may be responsible for the stability of CuNi bimetallic
catalysts70. So, overall the addition of Cu to Ni catalyst both promotes DRM activity and
enhances coke resistance as shown in Figure 1026.

22
Figure 10 The energy profiles for the dissociation of CH4 on elementary metals (Fe, Co, Ni and Cu) and bimetals (NiFe, NiCo and NiCu) surfaces modified from84.

23
2 RESEARCH PROBLEM AND OBJECTIVES
2.1 Research problem
There is no doubt that climate change is a global problem. GHG emissions are
main contributor to climate change. Increasing population and growing industrial activity
are main sources of GHGs emissions89.The world population boom in the second half of
20th century has reached its peak levels with the highest growth rates reported at 2.06%
between 1965 and 197090.This increase in population has been met with more demand for
energy. Although efforts toward making the use of renewable and clean energy more
sustainable are continuing91,92, the fossil fuels such as oil, coal and natural gas are still
playing a major role in the energy mix of most countries worldwide.
Syngas production from CO2 is well-know technology which can results in
valuable via Fischer–Tropsch syynthesis19. In that context, the dry reforming of methane
(DRM) reaction is attractive attention due to its advantages over steam reforming (SRM).
DRM require no CO2 separation from flue gases and lower H2/CO ratio around unity
compared to SRM 23,93.
Different catalyst have been explored for DRM, among them Nickel and Ni-based
catalysts been showed reasonable activity that can be compared to noble metals which are
less available and expensive25,52. However, as no oxygen is directly involved in dry
reforming, the carbon deposition on the reaction catalyst represents a major drawback
that hinders further industrial application94.Several nickel-transition metals bimetallic
catalyst showed their potential for coke resistance and improved activity. Co and Fe
synergistic characteristics are due to their oxophilicity and redox system respectively50,70.

24
However, Cu behavior of coke resistance and activity enhancement is still not well
defined at the time of this study. DFT study for DRM over copper modified Ni (111)
catalyst is performed to explore the reaction mechanism, barrier energies and coke
resistance behavior.
2.2 Research objectives
1. Study the adsorption of all different species involved in DRM over Ni2Cu layer to
identify the most stable configurations.
2. Investigate the dominant reaction mechanism of the dry methane reforming of
methane over Ni2Cu bimetallic catalytic system.
3. Explore coke removal oxidation by both atomic O and hydroxyl group (OH).
4. Compare C elimination by Cu surface enrichment to similar Ni2Fe and mono
metallic Ni (111) catalysts reported in literature.
5. Evaluate the Cu surface enrichment and Temperature effect on both coke
deposition and catalyst activity.

25
3 METHODOLOGY
3.1 Methods and calculation parameters
Density functional theory (DFT) is a phenomenally successful approach to finding
solutions to the fundamental equation that describes the quantum behavior of atoms and
molecules that have been described by the Schrödinger equation. There are two important
definitions related to Schrödinger equation solution and DFT: the wave function and the
ground state. The definition of wave function is quantum physics state that it is a
mathematical description of the quantum state of a system. The ground state of a quantum
system is its lowest-energy state; the energy of the ground state is known as the zero-
point energy of the system. On the other hand, an excited state is any state with energy
greater than the ground state.
Schrödinger equation in its famous simple form is:
In this equation the Ĥ is Hamiltonian operator and ᴪ is a set of solutions of the
Hamiltonian. For each of these solutions ᴪ has an associated eigenvalue, En, which is a
real number that satisfies the eigenvalue equation.
Born-Oppenheimer Approximation stated that since the electrons are small and
fast compared to nuclei then the dynamics of nuclei and electron can be separated or
decouple into two wave functions as follows:
Ĥ ᴪ = Eᴪ (9)
ᴪ({ri},{RI}) ᴪN({ri},{RI})* ᴪe({ri},{RI}) (10)

26
For a fixed set of atomic positions, the focus of the calculation is to solve the
ground state of the electrons.Where ri is the spatial coordinate of each i electron and RI is
the spatial coordinate of each I nucleus.
Based on the above, the Schrödinger equation can be expressed as follows:
Where ᴪ is the electronic wave function, which is a function of each of the spatial
coordinate r of each of the N electrons. Solving Schrödinger equation will enable the
determination of the ground state of a collection of atoms Figure 11gives a closer look at
the Hamiltonian component of Schrödinger equation.
Figure 11 Electronic Hamiltonian components modified from 95
Ĥ ᴪ (r1, r2, r3 … rN) = Eᴪ (r1, r2, r3 … rN) (1
1)

27
Still, to solve Schrödinger equation for simple molecule is computational
challenge as it has many-electrons problem. To illustrate this problem, consider the water
molecule which possesses 10 electrons only, the Schrödinger equation will become a 30-
dimensional problem as we consider 3 spatial coordinates per electron position. Similarly,
we can say carbon dioxide Schrödinger equation, which will be 66-dimensional problem
and so on.
The strength of the Density Functional Theory (DFT) comes from its capability to
utilize the electron density n(r) which is a true observable – a physical quantity that can
be measured by methods such as X-ray diffraction-that contains all information in wave
function. This closely related quantity is the density of electrons at a particular position in
the space since it can be written in terms of the individual electron wave functions as
follows:
The summation goes over all the individual electron wave functions that are
occupied by electrons, so the term inside the summation is the probability that an electron
in individual wave function ᴪi (r) is located at position r. The factor of 2 appears due to
Pauli Exclusion Principle, which states that each individual electron wave function can be
occupied by two separate electrons provided they have different spins. The n(r) is
function of 3 coordinates instead of 3N coordinates in case of Schrödinger equation,
which converts the many-electrons problem to many-one electron problem.
n(r) =2 ∑i ᴪi*(r) ᴪi (r) (12)

28
The density functional theory is based on two fundamental mathematical
theorems proved by Kohn and Hohenberg and the derivation of a set of equations by
Kohn and Sham in the mid-1960s96,97. The first theorem, proved by Hohenberg and Kohn
(HK), is: The ground-state energy from Schrödinger’s equation is a unique functional of
the electron density. This is very important as it support the elaborate the concept
discussed above. In fact, it is possible to solve the Schrödinger equation –or in other
meaning find the ground state of atoms- by finding a function of three spatial variables,
the electron density, rather than a function of 3N variables, the wave function. In
addition, the second Hohenberg–Kohn theorem defines another important concept of the
functional: The electron density that minimizes the energy of the overall functional is the
true electron density corresponding to the full solution of the Schrödinger equation95
The self-consistent iterative nature of Khon-Sham theory is broken into the
following steps:
1. Define an initial, trial electron density, n(r).
2. Solve the Kohn–Sham equations defined using the trial electron density to find
the single-particle wave functions, ᴪi (r).
3. Calculate the electron density defined by the Kohn–Sham single particle wave
functions from step 2,
nKS(r) =2∑ ᴪi (r)* ᴪi (r) (13)

29
4. Compare the calculated electron density, nKS(r), with the electron density used in
solving the Kohn–Sham equations, n(r). If the two densities are the same, then
this is the ground-state electron density, and it can be used to compute the total
energy. If the two densities are different, then the trial electron density must be
updated in some way. Once this is done, the process begins again from step 2.
In this project, the first-principles calculations performed in this study are based
on spin-polarized Density Functional Theory. The Vienna ab initio package (VASP) is
used to simulate DFT calculation. The exchange and correlation of the Kohn–Sham
theory are treated with the generalized gradient approximation (GGA) with Revised
Perdew-Burke-Ernzerhof 98,99.
The energy cutoff of plane wave was set to 400 eV is used in the all present
calculations and all geometries are optimized using a force-based conjugate gradient
algorithm 100 until the forces acting on each atom are converged better than 0.01 eV/A˚.
Spin polarization was taken into consideration in all calculations due to presence of
magnetic atoms. The optimized lattice constant for Ni is 3.523 ◦A which is in good
agreement with the experimental value of 3.52467.
Brillouin zone sampling is performed using a Monkhorst–Pack grid 101 and
electronic occupancies are determined according to a Methfessel–Paxton scheme 102 with
an energy smearing of 0.2 eV. The Ni2Cu (1 1 1) surface is represented as a four-layer
slab with p (3 x 3) supercell and only the bottom layer of the slab is kept constrained. The
neighboring slabs are separated by a vacuum region of 12A˚ .The first Brillouin zone of
the p (3 x 3) supercell is sampled with a 3 x 3 x 1 k-point grid, which are evidenced to be

30
sufficient for this cell. The climbing nudged elastic band103 and then dimer methods 104are
used to locate the transition state, in which the saddle point is optimized using a force-
based conjugate gradient method until the maximum force in every degree of freedom is
less than 0.01 eV/A˚. In order to obtain accurate forces, the total energy and band
structure energy are converged to within 1 x10⁻⁷ eV/atom during the electronic
optimization.
The adsorption energy (Eads) of surface species on Ni2Cu overplayed Ni (1 1 1)
has been calculated using the following equation:
energy, total adsorptionare the gasEsurface and E ace ,surf-gasE , adsE herew
energy of adsorbed species , total energy of surface and corresponding gas species, total
.37Ni (1 1 1) and the total energies of gas species respectively overplayedCu 2energy of Ni
As agreed in literature, the more negative adsorption energy indicates that the gas
species is more strongly adsorbed on the surface105,70. The transition state and minimum
energy paths are obtained using the climbing-image nudge elastic band (Climbing-NEB)
method and confirmed by single imaginary frequency from vibrational analysis103,106,107.
All calculations have been performed on RAAD2 supercomputer at Texas A&M
University at Qatar. RAAD2 is a Linux based system from the vendor Cray and has a
total of 4,128 traditional CPU cores of the Intel Haswell architecture. Each of its 172
)gas+Esurface(E-acesurf-gas=EadsE (14)

31
compute nodes contains 24 physical CPU cores -- 2 processor sockets with 12 cores per
socket -- and 128GB of RAM. The interconnect is comprised of the Cray Aries network,
which is employed both for MPI as well as storage traffic. Raad2 runs SLURM as its
workload manager, and is paired with a storage system from the vendor DDN that uses
the parallel filesystem Lustre, providing 800TB of usable disk capacity accessible from
all nodes108.

32
4 RESULTS AND DISCUSSION
Ni2Cu over-layered Ni (111) surface properties have been investigated. First, the
adsorption and co-adsorption energies have been calculated in Table 2. After determining
the initial and final state of each elementary reaction of DRM, transition states have been
calculated and confirmed by vibrational analysis. Then zero-point energy correction and
rate constant have been evaluated .As a result of that, the dominant pathway and rate-
limiting step have been confirmed. These steps are explained in Figure 12
Figure 12 Sequence of DFT calculations shows workflow for DRM over Ni-Cu surface.

33
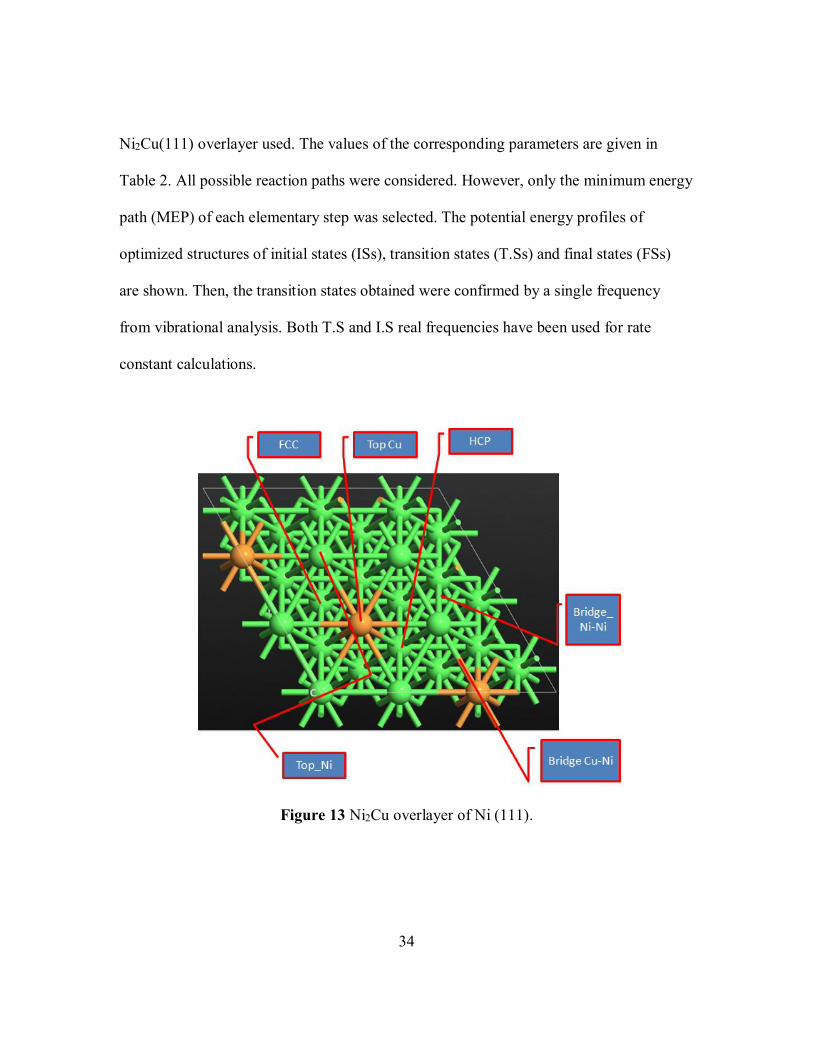
As shown in Figure 13 below, three different sites can be identified: (1) Two top
sites (TopNi and TopCu ) ,two bridge sites (B2Ni and BNiCu) and two hollow sites (HCP and
FCC). The optimal structures of all involved species are selected after examining all
likely adsorption structures by considering only the most stable configurations on the
Species ∆Eads(eV)a Favored adsorption
site 1 CH4 -0.024 N/A 2 CH3 -2.165 FCC 3 CH2 -4.997 FCC 4 CH -5.432 FCC 5 C -7.044 HCP 6 O -6.339 FCC 7 OH -3.275 B2Ni 8 CO -1.518 B2Ni 9 COH -4.072 B2Ni
10 CHOH -2.401 B2Ni 11 CO2 -0.034 N/A 12 H -3.608 FCC 13 H2 -0.056 N/A 14 CH3O -2.4 B2Ni 15 CH2O -0.036 N/A 16 CH2OH -1.865 TopNi 17 CH3OH -0.045 N/A 18 CHO -2.054 TopNi 19 COH -4.072 B2Ni 20 H2O -0.056 N/A 21 COOH -2.278 TopNi
a Zero-point energy correction are not included
Table 2 Calculated adsorption energies of the species involved in DRM on Ni2Cu overplayed Ni (111) surface.
34
Ni2Cu(111) overlayer used. The values of the corresponding parameters are given in
Table 2. All possible reaction paths were considered. However, only the minimum energy
path (MEP) of each elementary step was selected. The potential energy profiles of
optimized structures of initial states (ISs), transition states (T.Ss) and final states (FSs)
are shown. Then, the transition states obtained were confirmed by a single frequency
from vibrational analysis. Both T.S and I.S real frequencies have been used for rate
constant calculations.
Figure 13 Ni2Cu overlayer of Ni (111).
35
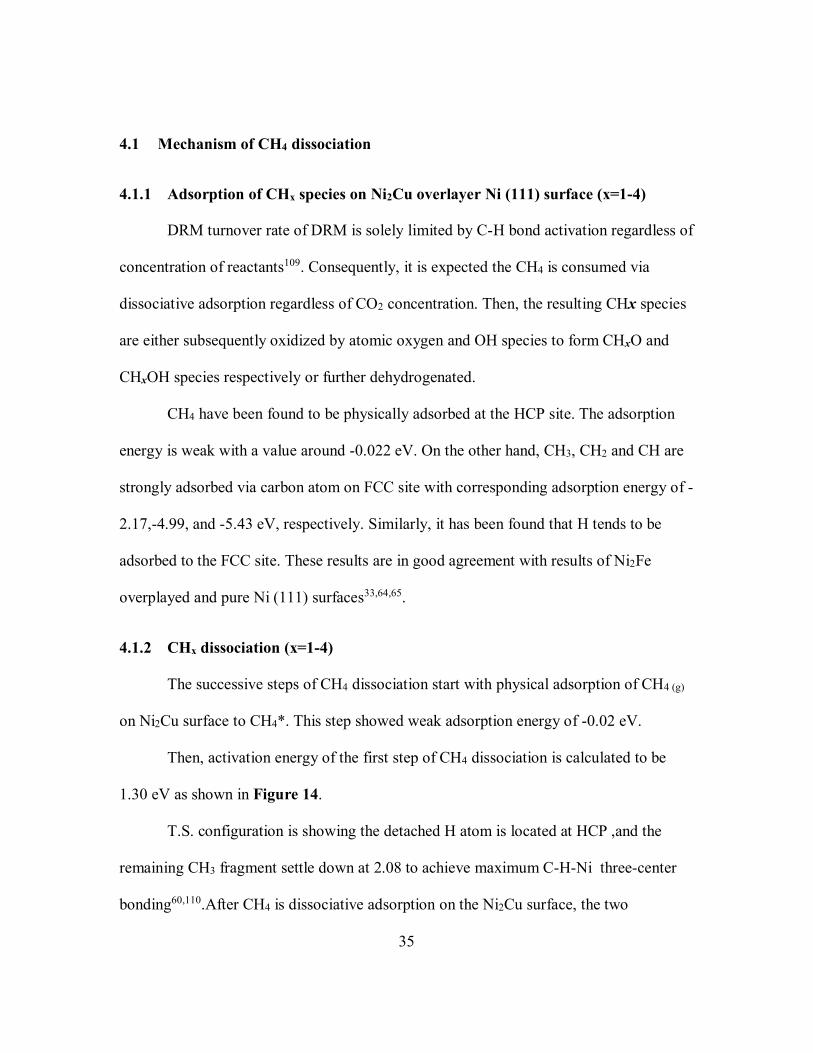
4.1 Mechanism of CH4 dissociation
4.1.1 Adsorption of CHx species on Ni2Cu overlayer Ni (111) surface (x=1-4)
DRM turnover rate of DRM is solely limited by C-H bond activation regardless of
concentration of reactants109. Consequently, it is expected the CH4 is consumed via
dissociative adsorption regardless of CO2 concentration. Then, the resulting CHx species
are either subsequently oxidized by atomic oxygen and OH species to form CHxO and
CHxOH species respectively or further dehydrogenated.
CH4 have been found to be physically adsorbed at the HCP site. The adsorption
energy is weak with a value around -0.022 eV. On the other hand, CH3, CH2 and CH are
strongly adsorbed via carbon atom on FCC site with corresponding adsorption energy of -
2.17,-4.99, and -5.43 eV, respectively. Similarly, it has been found that H tends to be
adsorbed to the FCC site. These results are in good agreement with results of Ni2Fe
overplayed and pure Ni (111) surfaces33,64,65.
4.1.2 CHx dissociation (x=1-4)
The successive steps of CH4 dissociation start with physical adsorption of CH4 (g)
on Ni2Cu surface to CH4*. This step showed weak adsorption energy of -0.02 eV.
Then, activation energy of the first step of CH4 dissociation is calculated to be
1.30 eV as shown in Figure 14.
T.S. configuration is showing the detached H atom is located at HCP ,and the
remaining CH3 fragment settle down at 2.08 to achieve maximum C-H-Ni three-center
bonding60,110.After CH4 is dissociative adsorption on the Ni2Cu surface, the two

36
subsequent dehydrogenation steps of CH3 and CH2 species are more facile with 0.75 eV
and 0.49 eV and endothermicity by 0.33 and exothermicity of 0.066 eV, respectively. So,
the generation of CH3O(H) as well as CH2O(H) is relatively quiet difficult because the
energy barrier of CH3 and CH2 dissociation are relatively lower than those for the
oxidation (1.37 and 1.6 eV) for CH3 oxidation, 0.76 and 0.78 eV for the CH2 oxidation.
CH3OH could be formed from CH3, CH3O or CH2OH intermediates which mainly
formed from CH2 and CH3 oxidation. Among these intermediates CH2OH is the most
favorable with 1.07 eV energy barrier to overcome.
Figure 14 Activation energy profile of CH4 dehydrogenation. Gray frame is showing T.S. configuration where CH3 and H are co-adsorbed on TopNi.

37
As for CH decomposition, the activation energy barrier increased significantly to
1.41 eV which is higher than those of CH oxidation by OH and O species (1.08 and 1.06
eV) respectively. Based on above results, one can conclude that CH dissociation is the
rate-limiting step for CH4 dissociation process as in Figure 15.
In conclusion , the energy barriers for CHx (x=1-4) bond dissociation increase in
order of CH2<CH3<CH4<CH, which is in line with CH4 decomposition on pure Ni(111)
and Ni2Fe systems64,111.Moreover,CH3 prefers further dehydrogenation than oxidation as
in Figure 16 The comparison Ni2Cu and those systems clearly indicate that doping Cu
into Ni (111) surface has greatly reduced carbon deposition from CH radical
dehydrogenation

38
Figure 15 Activation energy profile for CH4 dissociation steps.

39
Figure 16 Activation energy profile for different CH3 possible pathways. It has been found further dehydrogenation is favored over oxidation. Similar pattern has been noticed for CH2.

40
4.2 Mechanism for CO2 decomposition
As it has been expected from experimental work 112,113, CO2 decomposition have
two possible pathways. First, the adsorbed CO2 dissociates directly to form CO and
atomic oxygen. The latter acts as oxidant for CH x (x=1-4) to form intermediate that will
ultimately end with CO(g) .In the second pathway, CH4 firstly is dehydrogenated to
produce atomic H which subsequently activate the adsorbed CO2 to produce COOH
intermediate. Then, the decomposition of COOH results in CO and the oxidant OH as per
below equation.
4.2.1 CO2 direct activation
The adsorption of CO2 on Ni2Cu surface has been investigated at all possible
sites. After geometry optimization, it has been found that CO2 is physically adsorbed
towards vacuum with weak adsorption energy of -0.03 eV in parallel to surface with C-
Cu. This results agrees with Heiland114 who has used both fast ion beam and fast
molecular beam techniques to study CO2 dissociation and found no chemisorbed CO2 on
Ni (111). Moreover, it also agrees with Zhu et al36 and Xu et al69 computational studies
on Ni(111) and on Ni2Fe surfaces respectively 33,64. CO prefers to be adsorbed on TopNi,
and O atom binds to FCC. The calculated adsorption energy is -1.51 for CO and -6.39 eV
for atomic oxygen ,which indicate that Cu doping in Ni(111) network has improved
atomic oxygen adsorption ability while weaken CO adsorption compared to both pure
Ni(111) and Ni2Fe surfaces respectively 33,64.
CO2* + H* COOH * CO* + OH* (15)

41
4.2.2 Hydrogen-induced CO2 dissociation
As it has been described above, the hydrogen atoms released from CH4
dissociation pathway may contribute or activate CO2 activation. First, the CO2 and
hydrogen are co-adsorbed on Ni2Cu surface to form an intermediate COOH with and
activation energy barrier of 0.93 eV and exothermic reaction energy of -0.11 eV as shown
in Figure 17. Then, the C-O bond is broken to reach a final state of co-adsorbed CO and
OH on B2Ni site with C-Ni bond length is 1.89A for CO and O-Ni bond length for OH
.The activation energy barrier is found to be 0.43 eV and the reaction is exothermic with
energy of -0.59 eV .
Figure 17 Activation energy profile of H-induced CO2 activation .Gray frame show T.S. configuration
In previous studies of DRM on pure Ni (111) surface, CO2 direct dissociation was
found to be dominant with energy barrier of 0.67 eV37 compared to 1.13 eV for the H-
induced activation pathway33. Consequently, atomic oxygen was considered to be
dominant oxidant of CHx (x=1-4) intermediates. On the other hand, the Ni2Cu surface has
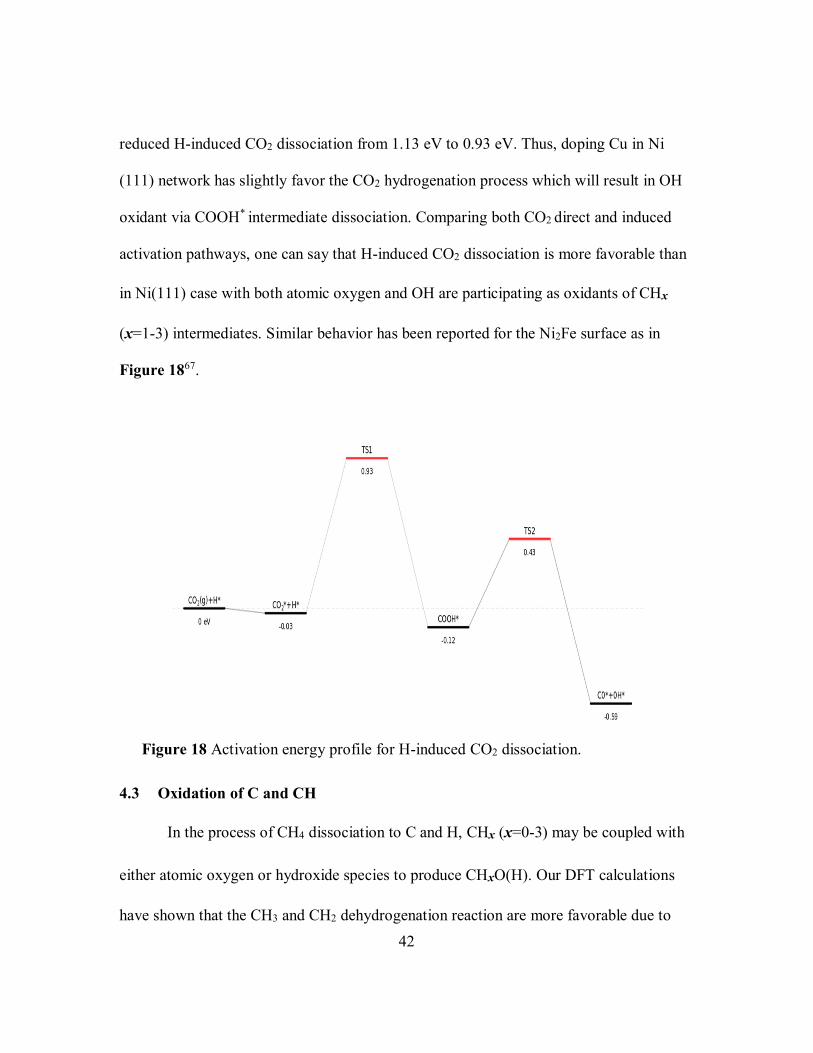
42
reduced H-induced CO2 dissociation from 1.13 eV to 0.93 eV. Thus, doping Cu in Ni
(111) network has slightly favor the CO2 hydrogenation process which will result in OH
oxidant via COOH* intermediate dissociation. Comparing both CO2 direct and induced
activation pathways, one can say that H-induced CO2 dissociation is more favorable than
in Ni(111) case with both atomic oxygen and OH are participating as oxidants of CHx
(x=1-3) intermediates. Similar behavior has been reported for the Ni2Fe surface as in
Figure 1867.
4.3 Oxidation of C and CH
In the process of CH4 dissociation to C and H, CHx (x=0-3) may be coupled with
either atomic oxygen or hydroxide species to produce CHxO(H). Our DFT calculations
have shown that the CH3 and CH2 dehydrogenation reaction are more favorable due to
Figure 18 Activation energy profile for H-induced CO2 dissociation.

43
the facile energy barriers of 0.75 eV and 0.49 eV, respectively. In contrast, the CH
dehydrogenation have significantly higher energy barrier of 1.41 eV and with the reverse
reaction energically favored by 50% at activation energy barrier of 0.71 eV. Thus, coke
formation due to CH decomposition is less favored in case of Ni2Cu system compared to
pure Ni (111) and Ni2Fe surfaces which have less energy barriers of 1.33 and 1.36 eV,
respectively. Moreover, only CH and C represent the most stable major intermediates that
remain on the surface rather than the kinetically unstable CH3 and CH2 intermediates. To
illustrate this assumption, all the possible oxidation of CHx are systematically calculated.
Among those calculations, it has been found that only C oxidation and CH oxidation are
favorable.

44
4.3.1 Carbon elimination by C+O and C+OH reaction
C+O oxidation pathway has been found much more favorable with an activation
energy barrier of 0.72 eV in an highly exothermic reaction energy of -2.17 eV
(compared to 1.59 eV and 1.58 eV in case of Ni(111) and Ni2Fe, respectively) while
C+OH have showed an activation barrier of 1.12 eV compared to 1.46 eV and 1.42 eV
for Ni (111) and Ni2Fe surfaces, respectively. Moreover, the reverse reaction of
COC+O has to overcome 2.89 eV activation energy barrier which is clearly in favor of
carbon elimination. This breakthrough indicates that this particular oxidation reaction is
accelerated on Cu enriched surface with Cu change the surface properties to enhance
carbon elimination by atomic oxygen and even by OH species at lesser extent that cannot
be ignored too Figure 19 and Figure 20.
As will be explained later, the temperature will play crucial role to enhance these
oxidation steps. From these results, one can conclude that doping Cu in the Ni (111)
have reduced coke formation by both increasing the activation energy barrier of CO and
CH dissociation while improving carbon elimination by both atomic oxygen and OH
species. These outstanding results overcoming both Ni(111) and Ni2Fe in terms of coke
resistance and agrees with both previous computational and experimental studies69, 82,
85,115.

45
Figure 19 Coke removal via atomic oxygen has smallest energy barriers of all other oxidation reactions. Black Frames are showing initial state, T.S. and final state.

46
Figure 20 Comparative activation energy profiles of C+O oxidation reaction for Ni2Cu (red) and Ni2Fe (black) surfaces. It shows that carbon elimination is improved more than twice.

47
4.3.2 CH+O and CH+OH reactions
The oxidation of CH by atomic oxygen generated from CO2 direct dissociation
begins from co-adsorption of CH on FCC and oxygen atom on HCP with one Cu
bridging between the two species. At transition state, atomic oxygen moves to BNiCu site
with Ni-O distance of 1.97◦A and Cu-O distance of 2.01◦A while CH settles at B2Ni site
with Ni-C distance of 1.86◦A and 1.81 ◦A. It has been calculated that the energy barrier of
that step is only 1.06 eV which is significantly lower by 0.47 eV and by 0.78 eV than that
of pure Ni (111) and Ni2Fe surface respectively. Similarly, CH and OH are co-adsorbed
at adjacent FCC and B2Nisites, then the intermediate CHOH is formed by overcoming
energy barrier of only 1.08 eV compared to 1.48 eV and 1.42 in case of pure Ni (111) and
Ni2Fe, respectively as in Figure 21.
Figure 21 Activation energy profile of CH oxidation by OH.OH is effective oxidant that helps skipping CH dissociation. Gray frame is showing T.S. configuration where OH is adsorbed on TopCu while CH adsorbed on TopNi.

48
4.3.3 CHO (H) and COH decomposition
The stable CHOH configuration involves CHOH located at B2Ni site with equal C-
Ni distances of 1.95 ◦A. The subsequent CHOH* have two possible pathways. The first
pathway involves the dissociation via CHOH*CHO*+H* at activation energy barrier
of 0.60 eV. Then the produced CHO is facile to dissociate to form CO and atomic H at
energy barrier of 0.18eV as in Figure 22 .
Figure 22 Activation energy profile of CHOH favorable dissociation to form COH*+H*.Gray frame is showing T.S. configuration.

49
The second pathway is going through formation of COH* and H* after
overcoming a facile energy barrier of only 0.20 eV and then the COH* dissolves to CO
and atomic H at energy barrier of 1.09.From above calculations, one can conclude that
CH oxidation by atomic oxygen and OH oxidants are very competitive with a minute
energy barrier difference (1.06 and 1.08 eV ,respectively) which distinguishes Ni2Cu
system from Ni(111) and Ni2Fe by the active participation of OH as oxidant as in
Figure 2333,64. Moreover, it has been found that in spite of the slightly lower activation
barrier of CH oxidation by atomic oxygen, CH oxidation by OH shows higher rate
constant at reaction temperature from 800-1000K as it will be elaborated later.

50
Figure 23 Activation energy profile of different CHOH* dissociation pathways.

51
4.4 H2 and H2O formation
The reaction of H* +H* H2 (g) requires activation energy barrier of 0.71 eV
with endothermic reaction energy of 0.57 eV. The formed H2 (g) is physically adsorbed
on catalyst surface with adsorption energy of -0.016 eV which in-along with
endothermicity in the high reaction temperatures- favor of product formation. Thus, H2
(g) product formation via Ni2Cu catalyst is more facile than pure Ni(111) and Ni2Fe
which possess relatively higher energy barrier of 0.92 eV or even 1.18 eV, respectively
as in Figure 2433,64.
Figure 24 H2O formation via OH*+H* reaction. The weakly adsorbed H2O may physically remove coke from catalyst surface in DRM elevated temperatures (steam). Gray frame is showing T.S.

52
Table 3 Calculated activation energies for all forward (Ea,f) , reverse (Ea,r) and enthalpy (∆Hf) of elementary reaction involved in dry reforming of methane.
Reaction Ea,f *(eV) ∆Hf
**(eV) Ea,r***(eV)
CH4-->CH3+H 1.30 0.78 0.52 CH3-->CH2+H 0.75 0.33 0.42 CH2-->CH+H 0.49 -0.06 0.55 CH-->C+H 1.40 0.69 0.71 C+O-->CO 0.72 -2.17 2.89 CH+O-->CHO 1.06 -0.30 1.36 CHO-->CO+H 0.18 -1.17 1.35 C+OH-->COH 1.13 -0.95 2.07 H+H-->H2 0.73 0.57 0.16 CH+OH-->CHOH 1.08 0.24 0.84 CHOH-->CHO+H 0.60 -0.31 0.91 CO2+H-→COOH 0.93 -0.12 1.05 COOH-->CO+OH 0.43 -0.59 1.02 O+H-->OH 0.94 -0.24 1.18 H+OH-->H2O 0.91 -0.15 1.06 CO2-->CO+O 1.69 0.48 1.21 CH3+O-->CH3O 1.37 -0.22 1.59 CH2+O-→CH2O 0.76 -0.43 1.19 CHOH-→COH+H 0.20 -0.53 0.73 COH-->CO+H 1.01 -1.09 2.10 CH3+OH-->CH3OH 1.60 -0.14 1.74 CH2+OH-->CH2OH 0.78 -0.10 0.88 CH3O-->CH2O+H 0.96 0.57 0.39 CH2OH-->CH2O+H 0.75 -0.07 0.82 CH2OH-->CHOH+H 0.92 0.42 0.50 CH3OH-->CH3O+H 4.29 0.01 4.28 CH3OH-→CH2OH+H 2.46 1.39 1.10
*,**,*** ZPE corrections are not included
Table 3 summarizes the calculated energy barriers for all possible elementary
reactions involved in DRM. For H2O formation, the adsorbed H and O atoms are reacting
to produce OH with energy barrier of 0.94 eV and exothermic reaction energy of -0.24
eV. Finally, the formed OH reacts exothermically with H with similar activation energy

53
barrier of around 0.91 eV and reaction energy of -0.15 eV. These two steps are favored
energetically than similar steps on pure Ni (111) surface and Ni2Fe (111) surfaces. The
H2O formed is physically adsorbed at the surface with adsorption energy of -0.06 eV. In
elevated temperature of DRM, this H2O may participate in physical removal of coke
deposition on the catalyst surface.
4.5 Effect of Cu and temperature on carbon deposition resistance
One of the drawbacks of DFT is that calculations follow zero temperature
approach. The calculations reflect the condition where atoms are localized at “minimum
energy” positions at 0 K. To overcome this problem, a complete vibrational analysis is
performed on the elementary reaction. It is well-know that atoms in material are vibrating
around their equilibrium positions at different temperature. These vibrations can be
measured experimentally by spectroscopic methods and therefore have a great
importance in DFT.
Calculation of vibrational frequencies has double benefit. First, it can confirm the
transition state configuration as well as the activation energy barrier. One striking feature
of these frequencies is that at the transition state, one of them is imaginary (i.e., the
eigenvalue associated with this vibrational mode is negative). The reason behind that is
the transition state is a point on the potential energy surface that is a minimum in all
directions but one. Second benefit is that it can be used to confirm calculate the rate
constant via partion function or vineyard formula. The later is the crucial central step in
developing microkinetic model of the overall reaction and identify atomistic model as in
Figure 25116.

54
In that context, we will utilize the calculated vibrational frequencies to evaluate the rate
constant from the confirmed transition states with focus on the role of Cu doping and
temperature on coke deposition resistance.
Figure 25 Illustration of workflow for constructing a microkinetic model adapted from116.
Under realistic conditions, DRM is highly endothermic which require
temperatures as high as 800-1000 K to obtain reasonable conversion 117 and coke

55
resistance 39.So in order to understand the effect of temperature and Cu doping on coke
deposition resistance ,complete vibrational analysis for the involved elementary reaction
is performed to calculate the rate constants at that temperature range. Coke deposition can
be from two main source: CH4 and CO2.For carbon formation from CH4,CH dissociation
have to overcome 1.40 eV. This carbon can be easily oxidized by atomic oxygen with
energy barrier 0.71 eV only. Moreover, more importantly, CH oxidation pathway will
transfer CH to CO via CHO skipping carbon formation from CH4 dissociation pathway.
Thus, the rate constant ratio of CH oxidation pathway to C oxidation pathway will
determine carbon deposition from CH4 route. As this ratio becomes high, then carbon
formation is reduced37.
Regarding CO2, carbon formation faces a very high energy barrier of 2.89 eV. So,
dissociation of CO into C and O is highly unfavorable on Ni2Cu surface which diminish
coke formation from CO2 route. Table 4 shows rate constants k(s-1) on Ni2Cu surface at
different temperatures for reactions involved in carbon elimination and deposition.
In general, k of C+O (OH) increases with the increasing temperature. The results
confirm that carbon deposition from CO is negligible due to the very small k values. In
addition, CH is dissociation rate constant is less than that of carbon oxidation either by
atomic oxygen or by OH species. With increasing temperature, kCH/kC(O) increase while
kCH/kC(OH) decreases.
56
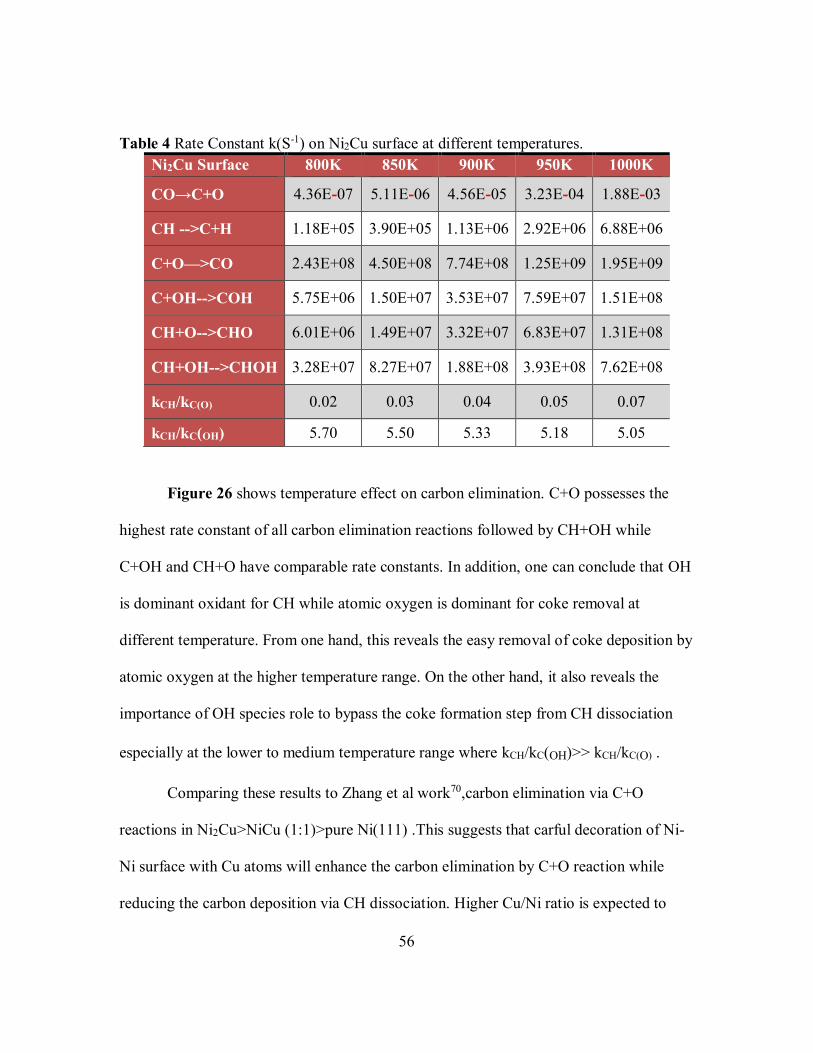
Table 4 Rate Constant k(S-1) on Ni2Cu surface at different temperatures. Ni2Cu Surface 800K 850K 900K 950K 1000K
CO→C+O 4.36E-07 5.11E-06 4.56E-05 3.23E-04 1.88E-03
CH -->C+H 1.18E+05 3.90E+05 1.13E+06 2.92E+06 6.88E+06
C+O—>CO 2.43E+08 4.50E+08 7.74E+08 1.25E+09 1.95E+09
C+OH-->COH 5.75E+06 1.50E+07 3.53E+07 7.59E+07 1.51E+08
CH+O-->CHO 6.01E+06 1.49E+07 3.32E+07 6.83E+07 1.31E+08
CH+OH-->CHOH 3.28E+07 8.27E+07 1.88E+08 3.93E+08 7.62E+08
kCH/kC(O) 0.02 0.03 0.04 0.05 0.07
kCH/kC(OH) 5.70 5.50 5.33 5.18 5.05
Figure 26 shows temperature effect on carbon elimination. C+O possesses the
highest rate constant of all carbon elimination reactions followed by CH+OH while
C+OH and CH+O have comparable rate constants. In addition, one can conclude that OH
is dominant oxidant for CH while atomic oxygen is dominant for coke removal at
different temperature. From one hand, this reveals the easy removal of coke deposition by
atomic oxygen at the higher temperature range. On the other hand, it also reveals the
importance of OH species role to bypass the coke formation step from CH dissociation
especially at the lower to medium temperature range where kCH/kC(OH)>> kCH/kC(O) .
Comparing these results to Zhang et al work70,carbon elimination via C+O
reactions in Ni2Cu>NiCu (1:1)>pure Ni(111) .This suggests that carful decoration of Ni-
Ni surface with Cu atoms will enhance the carbon elimination by C+O reaction while
reducing the carbon deposition via CH dissociation. Higher Cu/Ni ratio is expected to

57
suppress the catalyst activity probably as it occupies Ni active site. These results agree
with experimental results69,82,118.
Figure 26 Rate constant values of coke removal reactions on different temperatures.
Moreover, the reaction proceeds, it is expected to show more stability as rate of
carbon elimination by both OH and atomic oxygen will be much higher of carbon
deposition via CH dissociation. This periodic cycle of carbon deposition and elimination
result in catalyst stability as explained in Figure 27.
0.000E+00
5.000E+08
1.000E+09
1.500E+09
2.000E+09
2.500E+09
800 850 900 950 1000
C+O—>CO CH+O-->CHO C+OH-->COH CH+OH-->CHOH

58
Figure 27 Periodic cycle of carbon deposition and elimination results in is Ni2Cu catalyst stability

59
Table 5 Vibrational frequencies and Zero-point energy correction of T.S. of dominant elementary reactions. *Bold numbers are the imaginary frequencies that confirm the T.S
Reaction Frequencies (cm-1) ZPET.S (eV)
CH4-->CH3+H 819.53*, 59.11 ,108.04 ,132.75 ,261.32 ,362.45 , 673.55 ,789.46 ,1143.10 ,1359.84 ,1394.47 ,1623.37 ,2969.78 ,3062.81
,3087.85 1.06
CH3-->CH2+H 918.70 ,2983.18 ,2933.26 ,1682.49 ,1339.03 , 895.72, 710.83, 554.02, 507.44, 325.13, 232.66, 117.91 0.76
CH2-->CH+H 869.34 ,165.36 ,274.50 ,441.62 ,596.77 ,659.66 ,887.05 ,1547.77 ,3043.56 0.47
CH-->C+H 961.56 ,258.61 ,388.83 ,532.72 ,569.96 ,1308.36 0.19
C+O-->CO 219.59 ,399.37 ,420.94 ,514.03 ,553.52 ,614.10 0.16
CH+O-->CHO 464.03 ,129.67 ,270.90 ,384.45 ,465.37 ,584.49 ,692.61 ,910.96 ,3069.77 0.40
CHO-->CO+H 328.43 ,71.95 ,84.59 , 190.42,303.42 ,601.96 ,1038.61 ,1570.87 ,2522.31 0.40
C+OH-->COH 181.06 ,72.61 ,186.82 ,324.76 ,378.84 ,576.60 ,589.12 ,640.27 ,3676.65 0.40
H+H-->H2 841.83 ,165.81 ,246.70 ,350.07 ,1632.59 ,1880.40 0.27
CH+OH-->CHOH 157.86 ,90.71 ,99.16 ,161.57 ,174.99 ,373.96 ,539.84 ,604.36 ,621.58 ,813.22 ,2939.62 ,3658.00 0.62
CHOH-->CHO+H 1293.53 ,129.26 ,162.25 ,188.72 ,209.12 ,321.76 ,546.69 ,692.61 ,850.51 ,952.32 ,1146.87 ,2771.89 0.49
CO2+H-→COOH 1351.94 ,87.91 ,101.57 ,144.06 ,240.08 ,303.05 ,469.25 ,530.16 ,683.00 ,892.49 ,1150.57 ,1545.00 0.38
COOH-->CO+OH 178.76 ,65.60 ,125.85 ,178.29 ,204.22,317.52 ,382.05 ,426.69 ,542.31 ,762.23 ,1830.49 ,3509.01 0.52
O+H-->OH 1199.07 ,240.02 ,246.75 ,324.31 ,468.52 ,1492.46 0.17
H+OH-->H2O 624.65 ,97.25 ,150.44 ,337.45 ,407.75 ,566.99 ,745.44 ,913.98 ,3652.67 0.43

60
4.6 Dominant reaction pathways and rate-limiting step
Based on DFT calculations of activation energy barriers of DRM over Ni2Cu
which are confirmed by vibrational frequencies as Table 5, the most dominant pathways
can be predicted.CH4 undergoes successive dehydrogenation steps ,among them CH3 and
CH2 dissociation are the more facile with energy barrier of 0.75 eV and 0.49 eV
respectively. Moreover, oxidations of these species either by atomic oxygen or OH are
not favored energetically due to higher energy barrier of 1.37 eV and 1.6 eV in case of
CH3 and 0.76 eV and 0.78 in case of CH2 oxidation, respectively. Consequently, the CH4
dissociation will result in that CH, C and H at lesser extent as the main intermediates.
As discussed separately above, CH showed 3 major pathways as follow
I. CH* C* + H*
II. CH* + O* CHO* CO* + H*
III. CH * + OH* CHOH*
Having to overcome significantly higher energy barrier 1.41 eV, CH dissociation
is the major source of coke formation have become quite difficult due to doping Cu into
Ni (111) network. Moreover, coke formation from CO dissociation has been found
energetically and kinetically unfavorable. Moreover, CH dissociation has been found the
rate-limiting step of the reaction and expected to determine the overall rate of reaction.
For CH* oxidation, both oxidation pathways II and III are very competitive with
oxidation by atomic oxygen is slightly favored over OH oxidation with energy barrier of
1.06 eV. However, kinetic data favors the CHOH* formation based on vibrational
analysis and rate constant. Regarding CHOH*, the most favored pathway goes through

61
formation of COH* with activation energy barrier of 0.20 eV which further dissociate to
CO* and H*.
Looking at coke elimination, oxidation by atomic oxygen is more favorable with
only 0.71 eV energy barriers to overcome. As for H* intermediate, H* + H* H2* is the
most favored pathway.
Regarding CO2 activation pathways are possible, CO2 direct dissociation to form
CO and O (pathway I) and H-induced CO2 formation through intermediate COOH*
which in turn dissociate to CO* and OH* (pathway II) .Pathway II has been found to be
more favorable with an energy barrier of 0.93 eV which suggests that doped Cu atoms
have promoted H-induced CO2 activation pathway which results in formation of both O
and OH oxidants responsible for CH and C elimination on the Ni2Cu surface. Rate
constant calculations have revealed carbon oxidation by atomic oxygen is the more
favorable elimination reactions followed by CH+OH while C+OH and CH+O have
comparable rate constants. The overall mechanism is summarized in Figure 28

62
Figure 28 Dominant pathways energy barriers in eV. For comparison, Ea in black is for Ni (111), green is for Ni2Cu surface while red color values are for carbon deposition/elimination steps on Ni2Cu surface adapted from 119..

63
5 CONCLUSION, RECOMMENDATIONS AND FUTURE WORK
5.1 Conclusion
To summarize, this study aimed to get mechanistic understanding of dry
reforming of methane (DRM) on Ni2Cu surface on the molecular level utilizing density
functional theory (DFT) calculations.
All elementary reactions steps are covered comprehensively which include CH4
dehydrogenation, CO2 activation, CH and C oxidation via atomic oxidation and OH.
First, the adsorption different species suggested the most stable configurations and the
corresponding adsorption energies. Then, the detailed mechanism has been investigated
using climbing nudged elastic band method (cNEB) followed by dimer method to locate
the elementary reaction saddle points. The results pointed that CH4 and CH dissociation
energy barrier have been significantly increased in presence of doped Cu in Ni-Ni
network. Moreover, CH dissociation has been found the rate-limiting step of the reaction
with 1.41 eV energy barrier which suggests significant improvement in regarding carbon
deposition inhibition compared to similar reactions on Ni (111) and Ni2Fe surfaces.
In addition, it has been found that in presence of Cu, the coke elimination via
oxidation have been not only improved remarkably in case of atomic oxygen as oxidant
but also showed active participation of OH species. The later have been clearly seen in
the difference of energy barriers of CH oxidation by atomic oxygen and that one by OH
species which was only 0.02 eV. Among the C/CH oxidation pathways, C* + O* CO
(g) has been found the most favorable with energy barrier of 0.71 eV which is almost less

64
than half of that of Ni (111) and Ni2Fe for the similar reaction. Furthermore, easier H2O
(g) formation can physically assist to halt coke deposition.
Comparing these results to Zhang et al work70,carbon elimination via C+O
reactions in Ni2Cu>NiCu (1:1)>pure Ni(111).This suggests that carful decoration of Ni-
Ni surface with Cu atoms will enhance the carbon elimination by C+O reaction while
reducing the carbon deposition via CH dissociation. Higher Cu/Ni ratio is expected to
suppress the catalyst activity probably as it occupies Ni active site. These results agree
with experimental results in literature69,82,118 and our group experimental work .
Figure 29 CH4 conversion for DMR on Ni(111) and different Ni-Cu modified catalyst. Medium Ni-Cu catalyst (in blue) is showing sustained conversion over TOS of 10 h reprinted with permission from our research group.
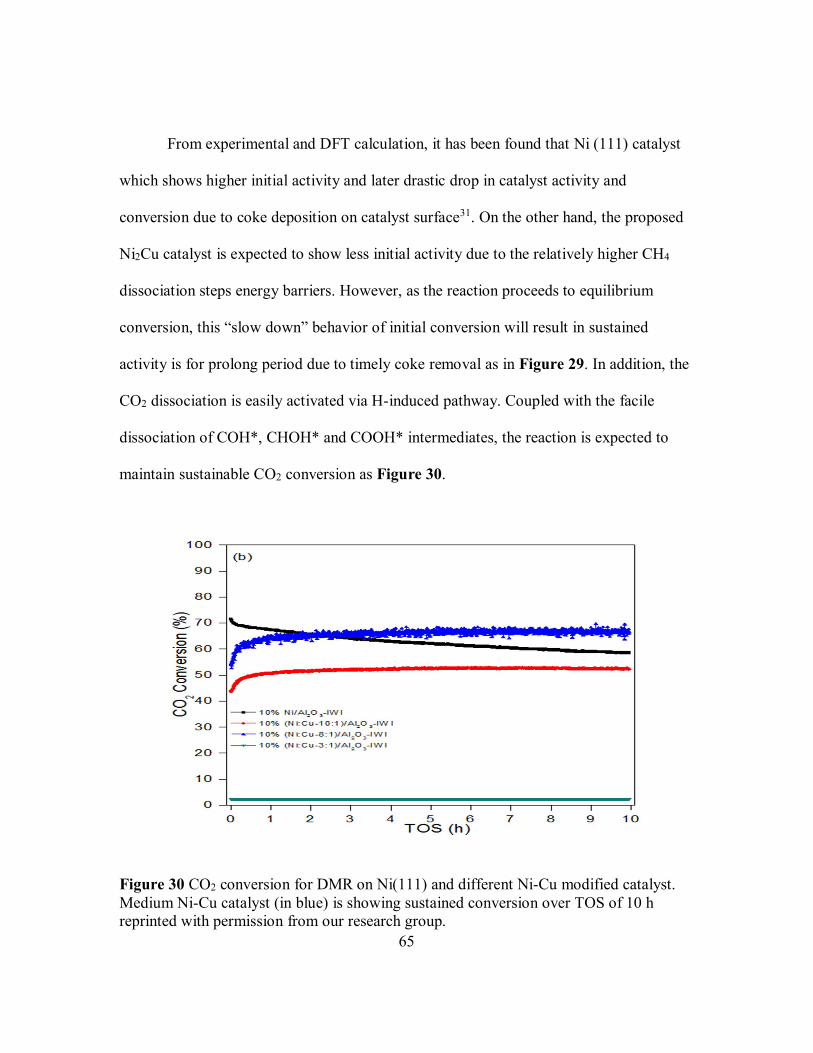
65
From experimental and DFT calculation, it has been found that Ni (111) catalyst
which shows higher initial activity and later drastic drop in catalyst activity and
conversion due to coke deposition on catalyst surface31. On the other hand, the proposed
Ni2Cu catalyst is expected to show less initial activity due to the relatively higher CH4
dissociation steps energy barriers. However, as the reaction proceeds to equilibrium
conversion, this “slow down” behavior of initial conversion will result in sustained
activity is for prolong period due to timely coke removal as in Figure 29. In addition, the
CO2 dissociation is easily activated via H-induced pathway. Coupled with the facile
dissociation of COH*, CHOH* and COOH* intermediates, the reaction is expected to
maintain sustainable CO2 conversion as Figure 30.
Figure 30 CO2 conversion for DMR on Ni(111) and different Ni-Cu modified catalyst. Medium Ni-Cu catalyst (in blue) is showing sustained conversion over TOS of 10 h reprinted with permission from our research group.

66
Last, it is expected to have a stable H2/CO ratio near unity due to two main
reasons: first, CH oxidation is more favorable than CH dissociation and ultimately from
CO and second is that the relatively slow CH4 dissociation will control the atomic H*
species which end up with H2 (g) formation as in Figure 31.
Figure 31 H2/CO ratio for DMR on Ni (111) and different Ni-Cu modified catalyst. Medium Ni-Cu catalyst (in blue) is showing sustained conversion over TOS of 10 h reprinted with permission from our research group.
To conclude, it is expected that once carbon deposition occurs on Ni2Cu surface,
the coke is timely removed as rate of carbon elimination-by different oxidation reaction-
will be much higher of carbon deposition. This efficient periodic cycle of carbon
deposition and carbon elimination contributes to more stable catalytic performance that

67
explains the experimental results that Ni-Cu bimetallic catalysts have outstanding
catalytic performance and excellent carbon deposition resistance in DRM.
5.2 Recommendations and future work
The DFT calculations suggested outstanding carbon-resistance ability which leads
to stable prolonged activity for Ni2Cu catalyst. It represent cheap and environmental
friendly alternative for noble metal-based catalysts. . Computationally, these results also
can be solid basis to build a detailed microkinetic model for DRM over Ni2Cu reaction. It
is also recommended to examine the possible role of different supports for the suggested
catalyst. Moreover, it is recommended that these results are confirmed by experimental
work to identify the optimum amount of Cu doping in the Ni-Ni network in an iterative
approach as Figure 32. In that direction, it also suggested the different supports are
included in the calculation to examine their role in the reaction mechanism. Catalyst
regeneration and disposal process need to be investigated to further examination of its
feasibility.
Figure 32 Integrated approach of Ni2Cu catalyst Design

68
REFERENCES
1. Emily Tillett. Watch: Macron address to Congress today live stream and updates during speech - CBS News. Apr 25, 2018. https://www.cbsnews.com/live-news/french-president-emmanuel-macron-address-to-congress-today-live-updates-stream-2018-04-25/. Published 2018. Accessed August 28, 2018.
2. Aresta M, Dibenedetto A. Utilisation of CO2 as a chemical feedstock: opportunities and challenges. Dalt Trans. 2007;0(28):2975. doi:10.1039/b700658f
3. Song C. Global challenges and strategies for control, conversion and utilization of CO2 for sustainable development involving energy, catalysis, adsorption and chemical processing. Catal Today. 2006;115(1-4):2-32. doi:10.1016/J.CATTOD.2006.02.029
4. Kondratenko E V., Mul G, Baltrusaitis J, Larrazábal GO, Pérez-Ramírez J. Status and perspectives of CO2 conversion into fuels and chemicals by catalytic, photocatalytic and electrocatalytic processes. Energy Environ Sci. 2013;6(11):3112. doi:10.1039/c3ee41272e
5. Guo J, Hou Z, Gao J, Zheng X. Syngas production via combined oxy-CO2 reforming of methane over Gd2O3-modified Ni/SiO2 catalysts in a fluidized-bed reactor. Fuel. 2008;87(7):1348-1354. doi:10.1016/J.FUEL.2007.06.018
6. Hironori Arakawa ▪, Michele Aresta †, John N. Armor ‡, et al. Catalysis Research of Relevance to Carbon Management: Progress, Challenges, and Opportunities. 2001. doi:10.1021/CR000018S
7. Hansen J, Sato M, Ruedy R. Perception of climate change. Proc Natl Acad Sci U S A. 2012;109(37):E2415-23. doi:10.1073/pnas.1205276109
8. Encyclopedia of Global Warming and Climate Change Globalization. 2008. doi:10.4135/9781412963893
9. Safi MA, Kotb M, Yiğiterhan O, et al. Geographical distribution of air pollution in Doha, Qatar View project Monitoring of new particles formation in ambient air View project Geographical distribution of air pollution in Doha, Qatar. 2018. doi:10.13140/RG.2.2.12822.45129
10. Alfoldy B, Kotb M, Yigiterhan O, Elobaid EA, Safi M. BTEX, nitrogen oxides, ammonia and ozone concentrations at traffic influenced urban sites in an arid environment. 20th EGU Gen Assem EGU2018, Proc from Conf held 4-13 April 2018 Vienna, Austria, p6628. 2018;20:6628.

69
http://adsabs.harvard.edu/abs/2018EGUGA..20.6628A. Accessed September 8, 2018.
11. Al-Yaeeshi AA, Al-Ansari T, Govindan R. The potential for carbon dioxide capture and utilization within the State of Qatar. Comput Aided Chem Eng. 2018;43:1499-1504. doi:10.1016/B978-0-444-64235-6.50261-8
12. Afzal S, Sengupta D, Sarkar A, El-Halwagi M, and, Elbashir N. Optimization Approach to the Reduction of CO 2 Emissions for Syngas Production Involving Dry Reforming. ACS Sustain Chem Eng. 2018;6(6):7532-7544. doi:10.1021/acssuschemeng.8b00235
13. Valderrama G, Kiennemann A, de Navarro CU, Goldwasser MR. LaNi1-xMnxO3 perovskite-type oxides as catalysts precursors for dry reforming of methane. Appl Catal A Gen. 2018;565:26-33. doi:10.1016/J.APCATA.2018.07.039
14. Tillmann L, Schulwitz J, van Veen A, Muhler M. Dry Reforming of Methane at High Pressure in a Fixed-Bed Reactor with Axial Temperature Profile Determination. Catal Letters. 2018;148(8):2256-2262. doi:10.1007/s10562-018-2453-x
15. le Saché E, Pastor-Pérez L, Watson D, Sepúlveda-Escribano A, Reina TR. Ni stabilised on inorganic complex structures: superior catalysts for chemical CO 2 recycling via dry reforming of methane. Appl Catal B Environ. 2018;236:458-465. doi:10.1016/j.apcatb.2018.05.051
16. Muraza O, Galadima A. A review on coke management during dry reforming of methane. Int J Energy Res. 2015;39(9):1196-1216. doi:10.1002/er.3295
17. Uykun Mangaloğlu D, Baranak M, Ataç Ö, Atakül H. Effect of the promoter presence in catalysts on the compositions of Fischer–Tropsch synthesis products. J Ind Eng Chem. June 2018. doi:10.1016/J.JIEC.2018.05.044
18. Arora S, Prasad R. An overview on dry reforming of methane: strategies to reduce carbonaceous deactivation of catalysts. RSC Adv. 2016;6(110):108668-108688. doi:10.1039/C6RA20450C
19. Challiwala MS, Wilhite BA, Ghouri MM, Elbashir NO. Multidimensional modeling of a microfibrous entrapped cobalt catalyst Fischer-Tropsch reactor bed. AIChE J. 2018;64(5):1723-1731. doi:10.1002/aic.16053
20. Gu B, Khodakov AY, Ordomsky V V. Selectivity shift from paraffins to α-olefins in low temperature Fischer–Tropsch synthesis in the presence of carboxylic acids.

70
Chem Commun. 2018;54(19):2345-2348. doi:10.1039/C7CC08692J
21. Koo KY, Lee JH, Ho Jung U, Kim SH, Yoon WL. Combined H 2 O and CO 2 reforming of coke oven gas over Ca-promoted Ni/MgAl 2 O 4 catalyst for direct reduced iron production. 2015. doi:10.1016/j.fuel.2015.03.007
22. Pakhare D, Spivey J. A review of dry (CO 2 ) reforming of methane over noble metal catalysts. Chem Soc Rev. 2014;43:7813. doi:10.1039/c3cs60395d
23. Challiwala MS, Ghouri MM, Linke P, El-Halwagi MM, Elbashir NO. A combined thermo-kinetic analysis of various methane reforming technologies: Comparison with dry reforming. J CO2 Util. 2017;17:99-111. doi:10.1016/J.JCOU.2016.11.008
24. Noureldin MMB, Elbashir NO, El-Halwagi MM. Optimization and Selection of Reforming Approaches for Syngas Generation from Natural/Shale Gas. Ind Eng Chem Res. 2014;53(5):1841-1855. doi:10.1021/ie402382w
25. Pakhare D, Spivey J. A review of dry (CO 2 ) reforming of methane over noble metal catalysts. Chem Soc Rev. 2014;43(22):7813-7837. doi:10.1039/C3CS60395D
26. Bian Z, Das S, Wai MH, Hongmanorom P, Kawi S. A Review on Bimetallic Nickel-Based Catalysts for CO2 Reforming of Methane. ChemPhysChem. 2017;18(22):3117-3134. doi:10.1002/cphc.201700529
27. Kawi S, Kathiraser Y, Ni J, Oemar U, Li Z, Saw ET. Progress in Synthesis of Highly Active and Stable Nickel-Based Catalysts for Carbon Dioxide Reforming of Methane. ChemSusChem. 2015;8(21):3556-3575. doi:10.1002/cssc.201500390
28. Wang Y, Yao L, Wang S, Mao D, Hu C. Low-temperature catalytic CO 2 dry reforming of methane on Ni-based catalysts: A review. Fuel Process Technol. 2018;169(June 2017):199-206. doi:10.1016/j.fuproc.2017.10.007
29. Abdullah B, Abd Ghani NA, Vo DVN. Recent advances in dry reforming of methane over Ni-based catalysts. J Clean Prod. 2017;162:170-185. doi:10.1016/j.jclepro.2017.05.176
30. Jang W-J, Shim J-O, Kim H-M, Yoo S-Y, Roh H-S. A review on dry reforming of methane in aspect of catalytic properties. Catal Today. 2018:1-0. doi:10.1016/j.cattod.2018.07.032
31. Aramouni NAK, Touma JG, Tarboush BA, Zeaiter J, Ahmad MN. Catalyst design

71
for dry reforming of methane: Analysis review. Renew Sustain Energy Rev. 2018;82(December 2016):2570-2585. doi:10.1016/j.rser.2017.09.076
32. Pakhare D, Schwartz V, Abdelsayed V, et al. Kinetic and mechanistic study of dry (CO 2 ) reforming of methane over Rh-substituted La 2 Zr 2 O 7 pyrochlores. 2014. doi:10.1016/j.jcat.2014.04.023
33. Zhu YA, Chen D, Zhou XG, Yuan WK. DFT studies of dry reforming of methane on Ni catalyst. Catal Today. 2009;148(3-4):260-267. doi:10.1016/j.cattod.2009.08.022
34. Tomishige K, Chen Y-G, Fujimoto K. Studies on Carbon Deposition in CO2 Reforming of CH4 overNickel–Magnesia Solid Solution Catalysts. Vol 181.; 1999. http://www.idealibrary.comon. Accessed August 27, 2018.
35. Trimm DL. Coke Formation and Minimisation during Steam Reforming Reactions. Vol 37.; 1997. https://ac-els-cdn-com.ezproxy.library.tamu.edu/S092058619700014X/1-s2.0-S092058619700014X-main.pdf?_tid=03719725-c79c-4c3c-af93-b0bc0458578d&acdnat=1535354856_232f26433e5501507d0e403ccbd4fcc4. Accessed August 27, 2018.
36. Trimm DL. Catalysts for the Control of Coking during Steam Reforming. https://ac-els-cdn-com.ezproxy.library.tamu.edu/S0920586198004015/1-s2.0-S0920586198004015-main.pdf?_tid=4bc32656-557e-4b81-ab06-d2cf7c23d41b&acdnat=1535354989_1b2643402bce75130d7aa524356dfcdd. Accessed August 27, 2018.
37. Wang Z, Cao XM, Zhu J, Hu P. Activity and coke formation of nickel and nickel carbide in dry reforming: A deactivation scheme from density functional theory. J Catal. 2014;311:469-480. doi:10.1016/j.jcat.2013.12.015
38. Zhu X, Huo P, Zhang Y, Cheng D, Liu C. Structure and reactivity of plasma treated Ni/Al2O3 catalyst for CO2 reforming of methane. Appl Catal B Environ. 2008;81(1-2):132-140. doi:10.1016/J.APCATB.2007.11.042
39. Chung W-C, Chang M-B. Review of catalysis and plasma performance on dry reforming of CH4 and possible synergistic effects. Renew Sustain Energy Rev. 2016;62:13-31. doi:10.1016/J.RSER.2016.04.007
40. Bengaard HS, Nørskov JK, Sehested J, et al. Steam Reforming and Graphite Formation on Ni Catalysts. J Catal. 2002;209(2):365-384. doi:10.1006/JCAT.2002.3579

72
41. Chen D, Christensen KO, Ochoa-Fernández E, et al. Synthesis of carbon nanofibers: effects of Ni crystal size during methane decomposition. J Catal. 2005;229(1):82-96. doi:10.1016/J.JCAT.2004.10.017
42. Kim J-H, Suh DJ, Park T-J, Kim K-L. Effect of metal particle size on coking during CO2 reforming of CH4 over Ni–alumina aerogel catalysts. Appl Catal A Gen. 2000;197(2):191-200. doi:10.1016/S0926-860X(99)00487-1
43. Mo L, Saw ET, Du Y, et al. Highly dispersed supported metal catalysts prepared via in-situ self-assembled core-shell precursor route. Int J Hydrogen Energy. 2015;40(39):13388-13398. doi:10.1016/J.IJHYDENE.2015.07.105
44. Yang W, He D. Role of poly(N-vinyl-2-pyrrolidone) in Ni dispersion for highly-dispersed Ni/SBA-15 catalyst and its catalytic performance in carbon dioxide reforming of methane. Appl Catal A Gen. 2016;524:94-104. doi:10.1016/J.APCATA.2016.06.026
45. Shang Z, Li S, Li L, Liu G, Liang X. Highly active and stable alumina supported nickel nanoparticle catalysts for dry reforming of methane. Appl Catal B Environ. 2017;201:302-309. doi:10.1016/j.apcatb.2016.08.019
46. Han JW, Park JS, Choi MS, Lee H. Uncoupling the size and support effects of Ni catalysts for dry reforming of methane. Appl Catal B Environ. 2017;203:625-632. doi:10.1016/j.apcatb.2016.10.069
47. Mette K, Kühl S, Tarasov A, et al. High-Temperature Stable Ni Nanoparticles for the Dry Reforming of Methane. ACS Catal. 2016;6(10):7238-7248. doi:10.1021/acscatal.6b01683
48. Bian Z, Suryawinata IY, Kawi S. Highly carbon resistant multicore-shell catalyst derived from Ni-Mg phyllosilicate nanotubes@silica for dry reforming of methane. Appl Catal B Environ. 2016;195:1-8. doi:10.1016/J.APCATB.2016.05.001
49. Tian H, Li X, Zeng L, Gong J. Recent Advances on the Design of Group VIII Base-Metal Catalysts with Encapsulated Structures. 2015. doi:10.1021/acscatal.5b01221
50. Horlyck J, Lawrey C, Lovell EC, Amal R, Scott J. Elucidating the impact of Ni and Co loading on the selectivity of bimetallic NiCo catalysts for dry reforming of methane. Chem Eng J. 2018;352:572-580. doi:10.1016/J.CEJ.2018.07.009
51. Mohamedali M, Henni A, Ibrahim H. Recent Advances in Supported Metal Catalysts for Syngas Production from Methane. ChemEngineering. 2018;2(1):9.

73
doi:10.3390/chemengineering2010009
52. Nematollahi B, Rezaei M, Khajenoori M. Combined dry reforming and partial oxidation of methane to synthesis gas on noble metal catalysts. Int J Hydrogen Energy. 2011;36(4):2969-2978. doi:10.1016/J.IJHYDENE.2010.12.007
53. Foppa L, Silaghi MC, Larmier K, Comas-Vives A. Intrinsic reactivity of Ni, Pd and Pt surfaces in dry reforming and competitive reactions: Insights from first principles calculations and microkinetic modeling simulations. J Catal. 2016;343:196-207. doi:10.1016/j.jcat.2016.02.030
54. Tomishige K. Syngas production from methane reforming with CO2/H2O and O2 over NiO–MgO solid solution catalyst in fluidized bed reactors. Catal Today. 2004;89(4):405-418. doi:10.1016/J.CATTOD.2004.01.003
55. Li L, Zhou L, Ould-Chikh S, et al. Controlled Surface Segregation Leads to Efficient Coke-Resistant Nickel/Platinum Bimetallic Catalysts for the Dry Reforming of Methane. ChemCatChem. 2015;7(5):819-829. doi:10.1002/cctc.201402965
56. Lucci FR, Marcinkowski MD, Lawton TJ, Sykes ECH. H 2 Activation and Spillover on Catalytically Relevant Pt–Cu Single Atom Alloys. J Phys Chem C. 2015;119(43):24351-24357. doi:10.1021/acs.jpcc.5b05562
57. Ren J, Qin X, Yang JZ, et al. Methanation of carbon dioxide over Ni-M/ZrO<inf>2</inf> (M = Fe, Co, Cu) catalysts: Effect of addition of a second metal. Fuel Process Technol. 2015;137:204-211. doi:10.1016/j.fuproc.2015.04.022
58. Takanabe K, Nagaoka K, Nariai K, Aika K. Titania-supported cobalt and nickel bimetallic catalysts for carbon dioxide reforming of methane. J Catal. 2005;232(2):268-275. doi:10.1016/J.JCAT.2005.03.011
59. Budiman AW, Song S-H, Chang T-S, Shin C-H, Choi M-J. Dry Reforming of Methane Over Cobalt Catalysts: A Literature Review of Catalyst Development. Catal Surv from Asia. 2012;16(4):183-197. doi:10.1007/s10563-012-9143-2
60. Fan X, Liu Z, Zhu Y-A, et al. Tuning the composition of metastable CoxNiyMg100−x−y(OH)(OCH3) nanoplates for optimizing robust methane dry reforming catalyst. J Catal. 2015;330:106-119. doi:10.1016/J.JCAT.2015.06.018
61. Zhang J, Wang H, Dalai AK. Development of stable bimetallic catalysts for carbon dioxide reforming of methane. J Catal. 2007;249(2):300-310. doi:10.1016/J.JCAT.2007.05.004

74
62. Kim SM, Abdala PM, Margossian T, et al. Cooperativity and Dynamics Increase the Performance of NiFe Dry Reforming Catalysts. J Am Chem Soc. 2017;139(5):1937-1949. doi:10.1021/jacs.6b11487
63. Theofanidis SA, Batchu R, Galvita V V., Poelman H, Marin GB. Carbon gasification from Fe–Ni catalysts after methane dry reforming. Appl Catal B Environ. 2016;185:42-55. doi:10.1016/J.APCATB.2015.12.006
64. Xu L li, Wen H, Jin X, Bing Q ming, Liu J yao. DFT study on dry reforming of methane over Ni2Fe overlayer of Ni(1 1 1) surface. Appl Surf Sci. 2018;443:515-524. doi:10.1016/j.apsusc.2018.02.268
65. Theofanidis SA, Galvita V V., Poelman H, Marin GB. Enhanced Carbon-Resistant Dry Reforming Fe-Ni Catalyst: Role of Fe. ACS Catal. 2015;5(5):3028-3039. doi:10.1021/acscatal.5b00357
66. Kim SM, Abdala PM, Margossian T, et al. Cooperativity and Dynamics Increase the Performance of NiFe Dry Reforming Catalysts. 2017. doi:10.1021/jacs.6b11487
67. Xu L li, Wen H, Jin X, Bing Q ming, Liu J yao. DFT study on dry reforming of methane over Ni2Fe overlayer of Ni(1 1 1) surface. Appl Surf Sci. 2018;443(111):515-524. doi:10.1016/j.apsusc.2018.02.268
68. Pendem S, Mondal I, Shrotri A, Rao BS, Lingaiah N, Mondal J. Unraveling the structural properties and reactivity trends of Cu–Ni bimetallic nanoalloy catalysts for biomass-derived levulinic acid hydrogenation. Sustain Energy Fuels. 2018;2(7):1516-1529. doi:10.1039/C8SE00138C
69. Lo Faro M, Frontera P, Antonucci PL, Aricò AS. Ni-Cu based catalysts prepared by two different methods and their catalytic activity toward the ATR of methane. Chem Eng Res Des. 2015. doi:10.1016/j.cherd.2014.05.014
70. Zhang R, Guo X, Wang B, Ling L. Insight into the effect of CuNi(111) and FeNi(111) surface structure and second metal composition on surface carbon elimination by O or OH: A comparison study with Ni(111) surface. J Phys Chem C. 2015;119(25):14135-14144. doi:10.1021/acs.jpcc.5b03868
71. Hua B, Li M, Zhang W, Pu J, Chi B, Jian L. Methane On-Cell Reforming by Alloys Reduced from Ni0.5Cu0.5Fe2O4 for Direct-Hydrocarbon Solid Oxide Fuel Cells. J Electrochem Soc. 2014;161(4):F569-F575. doi:10.1149/2.097404jes
72. Vizcaíno AJ, Carrero A, Calles JA. Hydrogen production by ethanol steam
75
reforming over Cu-Ni supported catalysts. Int J Hydrogen Energy. 2007;32(10-11):1450-1461. doi:10.1016/j.ijhydene.2006.10.024
73. Kim H, Lu C, Worrell WL, Vohs JM, Gorte RJ. Cu-Ni Cermet Anodes for Direct Oxidation of Methane in Solid-Oxide Fuel Cells. J Electrochem Soc. 2002;149(3):A247. doi:10.1149/1.1445170
74. Kim H, Lu C, Worrell WL, Vohs JM, Gorte RJ. Cu-Ni Cermet Anodes for Direct Oxidation of Methane in Solid-Oxide Fuel Cells. J Electrochem Soc. 2002;149(3):A247. doi:10.1149/1.1445170
75. Misture ST, Mcdevitt KM, Glass KC, et al. From chip-in-a-lab to lab-on-a-chip: towards a single handheld electronic system for multiple application-specific lab-on-a-chip (ASLOC). Cite this Catal Sci Technol. 2014;5. doi:10.1039/c5cy00800j
76. Reshetenko T V, Avdeeva LB, Ismagilov ZR, Chuvilin AL, Ushakov VA. Carbon capacious Ni-Cu-Al2O3 catalysts for high-temperature methane decomposition. Appl Catal A Gen. 2003;247(1):51-63. doi:10.1016/S0926-860X(03)00080-2
77. Morán-Pineda M, Castillo S, López T, Gómez R, Cordero-Borboa, Novaro O. Synthesis, characterization and catalytic activity in the reduction of NO by CO on alumina–zirconia sol–gel derived mixed oxides. Appl Catal B Environ. 1999;21(2):79-88. doi:10.1016/S0926-3373(99)00010-7
78. Agnelli M, Mirodatos C. CO Hydrogenation on Nickel-Based Catalysts: Effects of Copper Addition. J Catal. 2000;192:204-214. doi:10.1006/jcat.2000.2828
79. Sharifi M, Haghighi M, Rahmani F, Karimipour S. Syngas production via dry reforming of CH4over Co- and Cu-promoted Ni/Al2O3-ZrO2nanocatalysts synthesized via sequential impregnation and sol-gel methods. J Nat Gas Sci Eng. 2014;21:993-1004. doi:10.1016/j.jngse.2014.10.030
80. Bonura G, Cannilla C, Frusteri F. Ceria–gadolinia supported NiCu catalyst: A suitable system for dry reforming of biogas to feed a solid oxide fuel cell (SOFC). Appl Catal B Environ. 2012;121-122:135-147. doi:10.1016/J.APCATB.2012.03.028
81. Rahemi N, Haghighi M, Akbar Babaluo A, Allahyari S, Fallah Jafari M. Syngas production from reforming of greenhouse gases CH 4 /CO 2 over Ni-Cu/Al 2 O 3 nanocatalyst: Impregnated vs. plasma-treated catalyst. Energy Convers Manag. 2014;84:50-59. doi:10.1016/j.enconman.2014.04.016
82. Wu T, Cai W, Zhang P, Song X, Gao L. Cu-Ni@SiO2alloy nanocomposites for
76
methane dry reforming catalysis. RSC Adv. 2013;3(46):23976-23979. doi:10.1039/c3ra43203c
83. Liu H, Zhang R, Yan R, et al. Insight into CH 4 dissociation on NiCu catalyst: A first-principles study there is serious carbon deposition on NiCu/MgO-Al 2 O 3 in CO 2 reforming of methane [. Appl Surf Sci. 2012;258:8177-8184. doi:10.1016/j.apsusc.2012.05.017
84. Liu H, Wang B, Fan M, et al. Study on carbon deposition associated with catalytic CH 4 reforming by using density functional theory. 2013. doi:10.1016/j.fuel.2013.06.022
85. An W, Zeng XC, Turner CH. First-principles study of methane dehydrogenation on a bimetallic Cu/Ni(111) surface. Cit J Chem Phys. 2009;131(111):134704. doi:10.1063/1.3254383
86. Wang M, Fu Z, Yang Z. The carbon-tolerance mechanism of Ni-based alloy with coinage metals. Phys Lett Sect A Gen At Solid State Phys. 2013;377(34-36):2189-2194. doi:10.1016/j.physleta.2013.05.054
87. Tavares MT, Alstrup I, Bernardo CA, Rostrup-Nielsen JR. Carbon Formation and CO Methanation on Silica-Supported Nickel and Nickel-Copper Catalysts in CO H 2 Mixtures. Vol 158.; 1996. https://core.ac.uk/download/pdf/55605070.pdf. Accessed August 19, 2018.
88. Chen H-W, Wang C-Y, Yu C-H, Tseng L-T, Liao P-H. Carbon dioxide reforming of methane reaction catalyzed by stable nickel copper catalysts. Catal Today. 2004;97(2-3):173-180. doi:10.1016/J.CATTOD.2004.03.067
89. Rafiee A, Rajab Khalilpour K, Milani D, Panahi M. Title: Trends in CO 2 conversion and utilization: A review from process systems Perspective. 2018. doi:10.1016/j.jece.2018.08.065
90. Biraben JN. An essay concerning mankind’s demographic evolution. J Hum Evol. 1980;9(8):655-663. doi:10.1016/0047-2484(80)90099-8
91. Perea-Moreno M-A, Hernandez-Escobedo Q, Perea-Moreno A-J, Perea-Moreno M-A, Hernandez-Escobedo Q, Perea-Moreno A-J. Renewable Energy in Urban Areas: Worldwide Research Trends. Energies. 2018;11(3):577. doi:10.3390/en11030577
92. Gao Y, Jiang J, Meng Y, Yan F, Aihemaiti A. A review of recent developments in hydrogen production via biogas dry reforming. Energy Convers Manag.

77
2018;171:133-155. doi:10.1016/j.enconman.2018.05.083
93. Centi G, Quadrelli EA, Perathoner S. Catalysis for CO2 conversion: a key technology for rapid introduction of renewable energy in the value chain of chemical industries. Energy Environ Sci. 2013;6(6):1711. doi:10.1039/c3ee00056g
94. Jason M. Ginsburg †, Juliana Piña ‡, Tarek El Solh § and, Hugo I. de Lasa* †. Coke Formation over a Nickel Catalyst under Methane Dry Reforming Conditions: Thermodynamic and Kinetic Models. 2005. doi:10.1021/IE0496333
95. Sholl DS, Steckel JA. Density Functional Theory : A Practical Introduction. Wiley; 2009. https://www.wiley.com/en-us/Density+Functional+Theory%3A+A+Practical+Introduction-p-9780470373170. Accessed November 20, 2018.
96. Kohn W, Sham LJ. Physical Review: Self-Consistent Equations Including Exchange and Correlation Effects*. http://users.wfu.edu/natalie/s15phy752/lecturenote/KohnPhysRev.140.A1133.pdf. Accessed December 8, 2018.
97. Bickelhaupt FM, Baerends EJ. Kohn-Sham Density Functional Theory: Predicting and Understanding Chemistry. In: Wiley-Blackwell; 2007:1-86. doi:10.1002/9780470125922.ch1
98. Kresse G, Furthmiiller B ’ J. Efficiency of Ab-Initio Total Energy Calculations for Metals and Semiconductors Using a Plane-Wave Basis Set. Vol 6.; 1996. https://ac-els-cdn-com.ezproxy.library.tamu.edu/0927025696000080/1-s2.0-0927025696000080-main.pdf?_tid=e3d03892-c3db-4281-bc4c-d8e2999faed2&acdnat=1536770056_83116e6f9c9ce254fe25b05e26d525cc. Accessed September 12, 2018.
99. Kresse G, Furthmüller J. Efficient iterative schemes for ab initio total-energy calculations using a plane-wave basis set. Phys Rev B. 1996;54(16):11169-11186. doi:10.1103/PhysRevB.54.11169
100. Perdew JP, Burke K, Ernzerhof M. Generalized Gradient Approximation Made Simple.; 1996. https://journals-aps-org.ezproxy.library.tamu.edu/prl/pdf/10.1103/PhysRevLett.77.3865. Accessed September 12, 2018.
101. Monkhorst HJ, Pack JD. Special Points for Brillonin-Zone Integrations*. Vol 13.; 1976. https://journals-aps-org.ezproxy.library.tamu.edu/prb/pdf/10.1103/PhysRevB.13.5188. Accessed
78
September 12, 2018.
102. Methfessel M, Paxton AT. High-Precision Sampling for Brillouin-Zone Integration in Metals. Vol 40. https://journals-aps-org.ezproxy.library.tamu.edu/prb/pdf/10.1103/PhysRevB.40.3616. Accessed September 12, 2018.
103. Henkelman G, Jónsson H, Jó H. Improved tangent estimate in the nudged elastic band method for finding minimum energy paths and saddle points. Cit J Chem Phys. 2000;113:2082. doi:10.1063/1.1323224
104. Henkelman G, Jónsson H, Jó H. A dimer method for finding saddle points on high dimensional potential surfaces using only first derivatives Improved tangent estimate in the nudged elastic band method for finding minimum energy paths and saddle points Optimization methods for finding minimum energy paths A dimer method for finding saddle points on high dimensional potential surfaces using only first derivatives. Cit J Chem Phys. 1999;111:14106. doi:10.1063/1.480097
105. Fan C, Zhu Y, Yang M, Sui ZJ, Zhou X, Chen D. DFT-assisted microkinetic analysis of methane dry reforming on Ni catalyst DFT-assisted microkinetic analysis of methane dry reforming on Ni catalyst. 2015;(May):1-12. doi:10.1021/acs.iecr.5b00563
106. Henkelman G, Arnaldsson A, Jónsson H. Theoretical calculations of CH 4 and H 2 associative desorption from Ni"111…: Could subsurface hydrogen play an important role? 2006. doi:10.1063/1.2161193
107. Sharia O, Holzgrafe J, Park N, Henkelman G. Rare event molecular dynamics simulations of plasma induced surface ablation. J Chem Phys. 2014;141:74706. doi:10.1063/1.4892841
108. Research Computing @ TAMUQ. Getting started with RAAD2 - Research Computing @ TAMUQ. https://rc-docs.qatar.tamu.edu/index.php/Raad2_getstarted. Accessed January 14, 2019.
109. Wei J, Iglesia E. Isotopic and kinetic assessment of the mechanism of reactions of CH 4 with CO 2 or H 2 O to form synthesis gas and carbon on nickel catalysts. J Catal. 2004;224:370-383. doi:10.1016/j.jcat.2004.02.032
110. Michaelides A, Hu P. Methyl Chemisorption on Ni(111) and CMHMM Multicentre Bonding: A Density Functional Theory Study. Vol 437.; 1999. www.elsevier.nl/locate/susc. Accessed November 14, 2018.

79
111. Zhu Y-A, Dai Y-C, Chen D, Yuan W-K. First-principles calculations of CH 4 dissociation on Ni(1 0 0) surface along different reaction pathways. J Mol Catal A Chem. 2007;264:299-308. doi:10.1016/j.molcata.2006.09.043
112. Wei J, Iglesia E. Isotopic and kinetic assessment of the mechanism of reactions of CH 4 with CO 2 or H 2 O to form synthesis gas and carbon on nickel catalysts. J Catal. 2004;224:370-383. doi:10.1016/j.jcat.2004.02.032
113. Bradford MCJ, Vannice MA. Catalytic reforming of methane with carbon dioxide over nickel catalysts II. Reaction kinetics. Appl Catal A Gen. 1996;142(1):97-122. doi:10.1016/0926-860X(96)00066-X
114. Heiland W. Charge exchange processes and surface chemistry. Surf Sci. 1991;251-252:942-946. doi:10.1016/0039-6028(91)91129-L
115. Pérez-Hernández R, Gutiérrez-Martínez A, Espinosa-Pesqueira ME, Estanislao ML, Palacios J. Effect of the bimetallic Ni/Cu loading on the ZrO<inf>2</inf>support for H<inf>2</inf>production in the autothermal steam reforming of methanol. Catal Today. 2015;250. doi:10.1016/j.cattod.2014.08.009
116. Jørgensen M. Microkinetic Modeling of Nanoparticle Catalysis using Density Functional Theory. PhD thesis. 2017.
117. Liu C, Ye J, Jiang J, Pan Y. Progresses in the Preparation of Coke Resistant Ni-based Catalyst for Steam and CO2 Reforming of Methane. ChemCatChem. 2011;3(3):529-541. doi:10.1002/cctc.201000358
118. Ray D, Ghosh S, Tiwari AK. Controlling Heterogeneous Catalysis of Water Dissociation Using Cu−Ni Bimetallic Alloy Surfaces: A Quantum Dynamics Study. J Phys Chem A. 2018;122:5698-5709. doi:10.1021/acs.jpca.8b03237
119. Foppa L, Silaghi M-C, Larmier K, Comas-Vives A. Intrinsic reactivity of Ni, Pd and Pt surfaces in dry reforming and competitive reactions: Insights from first principles calculations and microkinetic modeling simulations. J Catal. 2016;343:196-207. doi:10.1016/J.JCAT.2016.02.030
120. Jørgensen M. Microkinetic Modeling of Nanoparticle Catalysis using Density Functional Theory. 2017.
121. Sautet P, Schrödinger E. Computational Catalysis. 2013. doi:10.1039/9781849734905
122. Pounds AJ. Introduction to Quantum Mechanics in Chemistry (Ratner, Mark A.;
80
Schatz, George C.). J Chem Educ. 2002;79(4):434. doi:10.1021/ed079p434
123. Hammer B, Norskov JK. Theoretical Surface Science and Catalysis — Calculations and Concepts. Adv Catal. 2000;45:71-129. doi:http://dx.doi.org/10.1016/S0360-0564(02)45013-4
124. Haas P, Tran F, Blaha P. Calculation of the lattice constant of solids with semilocal functionals. 2009. doi:10.1103/PhysRevB.79.085104
125. Maslov MM, Openov LA, Podlivaev AI. On the Vineyard Formula for the Pre-Exponential Factor in the Arrhenius Law. https://arxiv.org/ftp/arxiv/papers/1406/1406.3621.pdf. Accessed December 7, 2018.
126. Henkelman G, Uberuaga BP, Jó H. A Climbing Image Nudged Elastic Band Method for Finding Saddle Points and Minimum Energy Paths.; 2000. http://theory.cm.utexas.edu/henkelman/pubs/henkelman00_9901.pdf. Accessed December 8, 2018.

81
APPENDIX
I. DFT (Density Functional Theory)
The total energy of a system of atoms is calculated using the stationary
Schrödinger equation:
Where the many-body Hamiltonian Ĥ can be written:
The expression includes contributions from electron-nuclei interactions (eZ),
electron-electron interactions (ee), and nuclei-nuclei interactions (ZZ). The corresponding
Schrödinger equation does not allow an analytical solution for more than one electron,
and must be solved by approximations such as Born-Oppenheimer approximation which
is sufficient to deal with the electronic part of the Hamiltonian95.
The 1st H-K theorem states that the ground state electronic density (ρ ) uniquely
determines the external potential (Vext). This implies that ρ also determines the ground
state ᴪ of the many body problems.The second HK theorem defines the variational
energy as a functional of ρ:
Ĥ ᴪ = Eᴪ (16)
Ĥ = ĤeZ + Ĥee + ĤZZ (17)
Ev [ρ] =<ᴪ [ρ]Ť+Ŭee | ᴪ [ρ]>+∫ ρ(r) vext (r) dr (1
8)

82
where vext is the external potential, Ť is the kinetic energy operator for the electrons120.
To simplify, the energy functional at Eq (19) from HK can be rewritten as
The terms on Eknown are, in order, the electron kinetic energies, the Coulomb
interactions between the electrons and the nuclei, the Coulomb interactions between pairs
of electrons, and the Coulomb interactions between pairs of nuclei96. The other term in
the complete energy functional, EXC [{ᴪ i}],is the exchange–correlation functional, and it
is defined to include all the quantum mechanical effects that are not included in the
“known” terms97.
The self interaction is unphysical, and the correction for it is one of several
effects that are lumped together into the final potential in the Kohn–Sham equations, VXC,
which defines exchange and correlation contributions to the single electron equations.
VXC can formally be defined as a “functional derivative” of the exchange–correlation
energy:
E [{ᴪ i}] = Eknown[{ᴪ i}]+ EXC[{ᴪ i}]
(19)

83
The only remaining unknown quantity here is the exchange-correlation energy, which
determines the accuracy of DFT121,122,97.
II. Exchange correlation energy approximations
The approximation of the exchange-correlation functional is a major concern
when it comes to the accuracy of DFT97.
Two kinds of exchange-correlation approximation is the Local Density
Approximation (LDA) and Generalized Gradient Approximation GGA. In LDA, the
exchange-correlation is approximated by considering the inhomogeneous electron gas as
being locally homogeneous, thus applying the exchange-correlation hole of the
homogeneous electron gas96. GGA approximation improves over LDA by taking into
account the gradient of the density100. Multiple GGA functionals have been developed
throughout time, and one popular choice is the Perdew-Burke-Ernzerhof (PBE)
functional. Another GGA functional derived from PBE is the revised PBE functional of
Hammer et al. (RPBE), which is optimized for chemisorptions, which is of unique
importance for microkientic modeling123,124.
III. Energy barriers with NEB (Nudged Elastic Band)
Nudged elastic band (NEB) is a method to find the Minimum Energy Path (MEP)
between an initial state and final state, and NEB is also used to identify the transition
state.
VXC(r) = EXC(r)/ n(r) (20)

84
To initialize a NEB calculation, the initial and final atomic positions are
determined from adsorption calculations. The resulting atomic configurations are called
images, and the distance between the images are described by a reaction coordinate r.
Structural optimization is done on each image, which is connected to the other images by
modifying the force component parallel to the MEP. The total force on each image is
decomposed in parallel and perpendicular components as:
where k is a spring constant. Typically, the transition state is not found without releasing
the highest energy image from all spring forces, and reversing the true parallel force
component. As a result, the image climbs up the MEP to the true transition state. This
procedure is called the Climbing Image method.
IV. Rate constant calculation
The temperature dependence of the rate k of one or another thermally activated
process in solids or atomic clusters (diffusion, decomposition, isomerization, etc.) is often
described by the harmonic approximation to TST (hTST) can typically be used in studies
of diffusion and reactions in crystals or at crystal surfaces. Accordingly, the rate constant
khTST (T) can be calculated by: ...........................................................................................
F = F// + F┴= -kr + F┴ (21
)
khTST(T) = A exp (-Ea/KBT) (22)

85
where T is the temperature, KB is the Boltzmann constant, Ea is the activation energy (the
minimum energy required to be transferred to the system to overcome an energy barrier
on the corresponding reaction path), and A is the frequency factor with dimension of s–1
125,126.
The frequency factor A is calculated according to the Vineyard formula, which for an
N-atom cluster with zero values of the total momentum and the total angular momentum has
the form
where vi are the eigenfrequencies of vibrations of the cluster in the state corresponding to the
minimum of the potential energy Epot for all 3N – 6 normal coordinates, and vi , vi` are the
frequencies of vibrations at the saddle point corresponding to the maximum of Epot for one
normal coordinate and to the minimum for all the other coordinates (since one of the 3N – 6
frequencies vi` is imaginary, it is not included in the denominator of the expression for
A126.Similary,the Zero-Point energy correction can be calculated as37:
= ∏∏ ′i
(23)
EZPE=∑ (24
)

86
V. Input and output files:
The following Figure 33, Figure 34, Figure 35 and Figure 36 shows DFT input
calculation parameters and VASPTM output for the Ni2Cu over-layered Ni (111) slab.
Figure 33 Sample input files for cNEB calculations showing all input settings.

87
Figure 34 Sample POSCAR file shows the position of Ni and Cu atoms in Ni (111) slab.

88
Figure 35 Sample POTCAR file shows the PAW of Cu.

89
Figure 36 Sample Output File show the slab energy after required accuracy is reached.