Embed Size (px)
Citation preview

THE DEVELOPMENT OF NICKEL CATALYST FOR
AMMONIA DECOMPOSITION
BY
SUPAROEK HENPRASERTTAE
A DISSERTATION SUBMITTED IN PARTIAL FULFILLMENT OF
THE REQUIREMENTS FOR THE DEGREE OF DOCTOR OF
PHILOSOPHY (ENGINEERING AND TECHNOLOGY)
SIRINDHORN INTERNATIONAL INSTITUTE OF TECHNOLOGY
THAMMASAT UNIVERSITY
ACADEMIC YEAR 2018
Ref. code: 25615622300134IGC

ii
Abstract
THE DEVELOPMENT OF NICKEL CATALYST FOR AMMONIA
DECOMPOSITION
by
SUPAROEK HENPRASERTTAE
Bachelor of Science, Silpakorn University, 2000
Master of Engineering, Sirindhorn International Institute of Technology Thammasat
University, 2009
Doctor of Philosophy, Sirindhorn International Institute of Technology Thammasat
University, 2018
Ammonia decomposition can be a potential route for clean H2 production and a
solution for H2 transportation. This reaction requires a catalyst for the enhancement of
H2 production where Ni/Al2O3 catalysts are widely used. However, Ni/Al2O3 catalysts
still need developments to improve their catalytic activity. Modification of Al2O3
supports is a method to improve the activity of Ni catalysts. This study shows that the
catalytic activity of Ni/Al2O3 catalyst in ammonia decomposition was enhanced by
partial doping the Al2O3 framework with Sr, Y, Zr, or Ce for the formation of defects
in Al2O3. The improvements of catalyst properties in terms of Ni dispersion as well as
surface acidity and basicity are observed. The catalysts were characterized using BET,
XRD, XANES, SEM, TEM, Chemisorption, NH3-TPRx and activation energy
measurements. The lattice constant of Al2O3 from the XRD technique and the local
structure of Al2O3 from the XANES technique confirm the achievement of the partial
doping of Al2O3 with Sr, Y, Zr, or Ce as supports for Ni catalysts. The equivalent Ni
contents (19.61–21.69 wt%) in the catalysts analyzed by the ICP-OES technique ensure
the same Ni mass basis for evaluation of the catalyst activities in this study. When
compared to Ni/γ-Al2O3, Ni on the doped Al2O3 exhibits enhanced Ni dispersion that
results in higher catalytic activity and stability. The enhanced Ni dispersion of the
Ref. code: 25615622300134IGC

iii
Ni/doped Al2O3 catalysts corresponds to the small crystallize sizes and cluster sizes of
Ni in these catalysts, evidenced by the XRD and TEM techniques, respectively. The
NH3-TPRx results imply that desorption of surface nitrogen and recombine to form N2
could be the rate-determining step in the catalysis of NH3 decomposition. The
decomposition of low-concentration NH3 originated from synthetic urine was also
demonstrated over the Ni/Ce-doped Al2O3 catalyst. The results indicate that it is
potentially feasible to utilize the catalyst for H2 production as well as for wastewater
treatment. The role of dopants in the Al2O3 frameworks for the enhancement of catalyst
activity was discussed to understand the mechanism of NH3 decomposition over the
catalysts.
Keywords: Ammonia decomposition, Dopants in Al2O3 supports, Hydrogen
production from urine and wastewater, Ni/doped Al2O3, Support modification.
Ref. code: 25615622300134IGC

iv
Acknowledgements
Firstly, I would like to express my sincere gratitude to my advisor Assoc. Prof.
Dr. Pisanu Toochinda for the continuous support of my Ph.D. study and related
research, for his patience, motivation, and distinguished knowledge. His guidance
helped me in all the time of research and writing of this thesis. I could not have imagined
having a better advisor and mentor for my Ph.D. study.
Besides my advisor, I would like to thank my co-advisor Dr. Sumittra
Charojrochkul for her valuable guidance and giving an opportunity for my Ph.D. study.
I would like to thank the rest of my thesis committee: Assoc. Prof. Dr. Luckhana
Lawtrakul, Asst. Prof. Dr. Wanwipa Siriwatwechakul, and Assoc. Prof. Dr. Siwarutt
Boonyarattanakalin, for their insightful comments and encouragement, and also for the
hard question, which incented me to widen my research from various perspectives. I
would like to thank Dr. Pimpa Limthongkul for her trust on me, which encouraged me
to study in higher education.
My sincere thanks also goes to National Metal and Materials Technology Center
(MTEC), which provided me the access to the laboratory and research facilities. I have
to thank Dr. Wantana Klysubun and her team, for their kind supports in X-ray
absorption experiment at Synchrotron Light Research Institute (Thailand).
I would like to acknowledge the Bangchak Graduate Scholarship program of
Sirindhorn International Institute of Technology (SIIT), which financially supported for
my Ph.D. study. In addition, my Ph.D. study was also supported by the National
Research University Project of Thailand Office of Higher Education Commission
(NRU-15/2559) and Thammasat University Grant (TU-2/23/2558).
I thank my fellow lab mates: Dr. Chaicharn, Mr. Pumiwat, Ms. Sirintra, Mr.
Nathasak, Mr. Krit, Mr. Pawan and others for their helps in my experiments, and for all
the fun we have had in my Ph.D. study. I have to thank my buddy Mr. Mahinsasa
Rathnayake, who helped me a lot to improve my listening, speaking, and writing in
English as well as helping me in English proof reading and MATLAB codings.
Last but not the least, I would like to thank my family: my parents, my sister,
my brother, my wife, and my son for supporting me spiritually throughout writing this
thesis, my Ph.D. study, and my life in general.
Ref. code: 25615622300134IGC

v
Table of Contents
Chapter Title Page
Signature Page i
Abstract ii
Acknowledgements iv
Table of Contents v
List of Tables viii
List of Figures ix
1 Introduction 12
1.1 Introduction 12
1.2 Objectives of study 15
1.3 Scopes of study 15
2 Literature Review 17
2.1 Ammonia as a hydrogen carrier 17
2.2 Catalysts for ammonia decomposition 20
2.2.1 Active component for NH3 decomposition 30
2.2.2 Promoter for NH3 decomposition 31
2.2.3 Support for NH3 decomposition 34
2.3 Defect structure and oxygen vacancy 38
3 Methodology 42
3.1 Materials 42
3.2 Supports preparation 43
3.3 Catalysts preparation 44
3.4 NH3 decomposition from pure NH3 46
3.5 NH3 decomposition from synthetic urine 47
Ref. code: 25615622300134IGC

vi
3.6 Supports and catalysts characterization 48
3.6.1 Nitrogen physisorption technique 48
3.6.2 X-ray diffraction technique 49
3.6.3 X-ray absorption near edge structure technique 50
3.6.4 Differential scanning calorimetry technique 51
3.6.5 Scanning electron microscope technique 52
3.6.6 Transmission electron microscope technique 53
3.6.7 Inductively coupled plasma optical emission
spectrometry technique 54
3.6.8 Chemisorption techniques 55
3.7 Determination of activation energy 57
4 Results and Discussions 58
4.1 Evaluation of Ni/Zr-doped Al2O3 catalysts in NH3
decomposition 58
4.1.1 Preparation of Zr-doped Al2O3 supports and their
properties 58
4.1.2 Characterization of Ni/Zr-doped Al2O3 62
4.1.3 Activities of Ni/Zr-doped Al2O3 for H2 production
from NH3 decomposition 65
4.1.4 Role of Zr in Al2O3 supports for NH3 decomposition 66
4.2 Effect of valency and ionic size of dopant in Al2O3 support
toward Ni catalyzed NH3 decomposition 69
4.2.1 Partial doping of Sr, Y, Zr, or Ce into Al2O3
frameworks and their properties 70
4.2.2 Evaluation of Ni-support interaction and crystal
structure of Ni catalysts 74 4.2.3 Ni active sites for activity and stability in NH3
decomposition 78
4.2.4 Evaluation of activation energy of NH3 decomposition 82
Ref. code: 25615622300134IGC

vii
4.2.5 Role of dopants in Al2O3 frameworks to reaction
mechanism and rate-determining steps of NH3
decomposition 84
4.2.6 Effect of dopant amount in Al2O3 support to Ni
catalyzed NH3 decomposition 93
4.2.7 Applications for H2 production from NH3
decomposition over Ni/Ce-doped Al2O3 using urine
and wastewater 96
5 Conclusions and Suggestions for Future Studies 99
References 101
Appendices 110
Appendix A 111
Appendix B 113
Appendix C 115
Appendix D 116
Appendix E 117
Appendix F 120
Ref. code: 25615622300134IGC

viii
List of Tables
Tables Page
2.1 Ammonia properties [17]. 18
2.2 Acute health effects of NH3. 19
2.3 Conditions and activities of various catalysts in NH3 decomposition. 21
2.4 Properties of 20 wt% Ni catalysts and H2 formation rates. 33
2.5 NH3 decomposition over supported 4.8 wt%-Ru catalysts. 34
2.6 H2 yields of Ni catalysts over supports. 36
2.7 Physicochemical properties of Ni catalysts supported on various metals [5].
36
2.8 Interaction of Pd on supports and CO on Pd [70]. 40
3.1 Chemical used in this study. 42
4.1 Physical properties of Al2O3 and Zr-doped Al2O3 supports. 61
4.2 Catalytic activities of Ni over Al2O3 and Zr-doped Al2O3 supports. 65
4.3 Surface acidity of catalysts over Al2O3 and Zr-doped Al2O3 supports. 67
4.4 Ni dispersion of catalysts over Al2O3 and Zr-doped Al2O3 supports. 68
4.5 Physical properties of supports. 71
4.6 Ni contents of catalysts. 78
4.7 NH3 conversion of Ni catalysts. 78
4.8 H2 formation rate of Ni catalysts. 79
4.9 Ni surface area of catalysts. 80
4.10 Characteristic properties of reduced catalysts with NH3 conversion. 85
4.11 Ni crystallize size of reduced catalysts. 87
4.12 Catalytic activities of Ni/Ce-doped Al2O3. 93
4.13 Ni dispersion and Ni surface area of catalysts. 94
A.1 Calculation of metal used for 15 g support preparation 111
A.2 Calculation of compound used for 0.5 M solution preparation. 111
Ref. code: 25615622300134IGC

ix
List of Figures
Figures Page
2.1 Energy densities of various energy carriers. 17
2.2 NH3 decomposition using CNTs-supported metal catalysts. 30
2.3 NH3 decomposition over Ru/CNTs modified by different metal nitrates. 32
2.4 Improvement of Cu-Zn dispersion using urea as a promoter [61]. 33
2.5 Ammonia conversion of 10 wt% Ni catalysts [7]. 35
2.6 Spinel structure of MgAl2O4. 37
2.7 Oxygen vacancy in crystal lattice. 38
2.8 Optimized structures of (A) Ni/regular MgO and (B) Ni/defective MgO [8].
39
2.9 Optimized structures of (A) CO-bound on Pd/regular MgO and (B) CO-
bound on Pd/defective MgO [70]. 39
3.1 Schematic of supports preparation. 43
3.2 Schematic of catalysts preparation. 44
3.3 H2 formation rate as function of residence time. 45
3.4 Schematic of NH3 decomposition testing system from pure NH3. 46
3.5 Schematic of NH3 decomposition from synthetic urine. 47
3.6 N2 physisorption instrument. 48
3.7 X-ray diffractometer. 49
3.8 Schematic of XANES experiment [76]. 50
3.9 Differential scanning calorimetry. 51
3.10 Scanning electron microscopy. 52
3.11 Transmission electron microscopy. 53
3.12 Inductively coupled plasma optical emission spectrometry. 54
3.13 Chemisorption catalyst analyzer. 55
3.14 Temperature programmed reactor and Mass Spectrometer. 56
4.1 XRD pattern of Zr-doped Al2O3 precursor dried at 110 °C. 59
Ref. code: 25615622300134IGC

x
4.2 XRD patterns of the calcined Zr-doped Al2O3 supports; : γ-Al2O3;
: -Al2O3; : α-Al2O3; : tetragonal-ZrO2; : monoclinic-ZrO2. 60
4.3 DSC profiles of impregnated catalysts. 62
4.4 XRD patterns of catalysts over Al2O3 and Zr-doped Al2O3 supports. 63
4.5 SEM image and EDS profile of Ni/α-Al2O3 catalyst. 64
4.6 NH3-TPD profiles of catalysts over Al2O3 and Zr-doped Al2O3 supports. 66
4.7 CO-pulse profiles of catalysts over Al2O3 and Zr-doped Al2O3 supports. 67
4.8 XRD patterns of supports, : face center cubic-Al2O3;
: simple cubic-Al2O3; : tetragonal-ZrO2; : face center cubic-CeO2.71
4.9 XANES spectra of supports. 72
4.10 H2-TPR profiles of catalysts. 74
4.11 Ni-O interaction over regular site and oxygen vacancy site. 75
4.12 XRD patterns of catalysts, : NiO; : Ni; : γ-Al2O3; : ZrO2;
: CeO2; : CeAlO3. 76
4.13 Stability test of Ni catalysts, : Ni/γ-Al2O3; : Ni/Sr-doped Al2O3;
: Ni/Y-doped Al2O3; : Ni/Zr-doped Al2O3; : Ni/Ce-doped Al2O3. 81
4.14 Arrhenius plots of catalysts. 82
4.15 Correlation between experimental and calculated reaction rates,
: Ni/γ-Al2O3; : Ni/Sr-doped Al2O3; : Ni/Y-doped Al2O3;
: Ni/Zr-doped Al2O3; : Ni/Ce-doped Al2O3. 83
4.16 Ammonia decomposition mechanisms. 84
4.17 CO chemisorption profiles of catalysts. 85
4.18 NH3-TPD profiles of catalysts. 87
4.19 TEM images of catalysts (brightness adjusted). 88
4.20 CO2-TPD profiles of catalysts. 89
4.21 Role of oxygen vacancies in doped Al2O3 support for Ni catalyst. 90
4.22 N2 formation over catalysts from NH3-TPRx (A) with
their first derivatives (B). 91
4.23 CO chemisorption profiles of catalysts (10 wt% Ni and 20 wt% Ni). 94
4.24 XRD patterns of Ce-doped Al2O3 supports, : γ-Al2O3; : CeO2. 95
4.25 NH3 decomposition from synthetic urine, : Ni/γ-Al2O3;
: Ni/Ce-doped Al2O3. 97
Ref. code: 25615622300134IGC

xi
4.26 Schematic of NH3 decomposition from urea plant wastewater. 98
C.1 Lattice constants of unit cell. 115
D.2 X-ray absorption near edge structure (XANES). 116
E.3 CO-pulse injection technique and CO-pulse profile. 117
E.4 Illustration of TPD technique. 118
E.5 Illustration of TPR and TPRx techniques. 119
Ref. code: 25615622300134IGC
12
Chapter 1
Introduction
1.1 Introduction
Nowadays, energy demand has been exponentially increased along with many
environmental problems. Researchers have tried to develop alternative energies, which
can lower greenhouse gas emissions into the environment. There are many renewable
energy sources, such as biomass, solar, wind, etc., but hydrogen can be considered as
an interesting choice for clean energy. Fuel cells generate electricity from
electrochemical reaction of hydrogen with atmospheric oxygen, which produces water
as an environmental benign byproduct. Hence, hydrogen is the major fuel for electricity
generation from fuel cells.
The major problems associated with the hydrogen fuel cell technology are the
high cost of hydrogen production, and greenhouse gas emissions from the conventional
hydrogen production processes, i.e., hydrocarbons reforming, water-gas shift, and
pyrolysis of hydrocarbons. The hydrogen production cost depends on the used catalyst,
the energy consumption in the production process, and the hydrogen purification
process [1]. The future success of hydrogen fuel cells not only depends on the fuel cell
efficiency and the hydrogen production cost, but also depends on low carbon emissions
from the hydrogen production process. Recently, most of the hydrogen fuel is produced
from the thermo-chemical process of natural gas, which emits greenhouse gases as
byproducts. Besides CO2 emissions, this process can also yield CO as a by-product,
which causes poisoning of electrodes in proton exchange membrane fuel cells
(PEMFCs) [2-4]. In addition, catalyst used in hydrogen production from hydrocarbons
can be deactivated by coking during the reaction process. Therefore, hydrogen
production from a carbon-free source, such as ammonia is an attractive choice for clean
hydrogen production.
Being carbon free, ammonia is also considered as a good H2 carrier for on-site
H2 generation, which has high H2 contents per unit volume. One mole of NH3 contains
1.5 mol of H2, which is 17.65 wt% or 108 kg of H2/m3 of NH3, embedded in liquid NH3
at 20 °C and 8.5 atm. Ammonia decomposition is shown in chemical reaction-1.
Ref. code: 25615622300134IGC

13
2NH3 ↔ N2 + 3H2 ∆Hrxn = 46 kJ/mol reaction-1
Ruthenium (Ru) has been reported as the most active catalyst for ammonia
decomposition. However, Ru catalysts suffer from high cost and limited availability.
Iron (Fe) catalysts have a lower cost with abundant resources, but their catalytic
activities are very low, compared to Ru catalysts. Nickel over alumina catalysts
(Ni/Al2O3) has been reported as a replacement for expensive Ru catalysts for
economical hydrogen production. However, Ni/Al2O3 catalysts have a lower catalytic
activities for H2 production, compared to Ru catalysts. In general, Ni/Al2O3 catalysts
require reaction temperatures at 600–700 °C for high NH3 conversion while Ru
catalysts require only 450–550 °C. Thus, Ni/Al2O3 catalysts require some developments
to improve its catalytic activities for hydrogen production. Studies have provided many
approaches to improve the catalytic activities of Ni catalysts, such as using bimetallic
active sites, adding promoters in catalyst preparation, and using different supports. The
use of a new support other than conventional Al2O3 or activated carbon may alter the
catalytic activity, but the large surface area of these supports is essential for providing
a large number of Ni active sites and an improvement of Ni dispersion. Besides a high
surface area of Al2O3, thermal stability and the price of Al2O3 are important factors for
using Al2O3 as a catalyst support. The high thermal stability of Al2O3 allows the use of
a catalyst at high temperatures without support deformation, which can change the
catalytic activity. The price of Al2O3 is also economically attractive for low-cost H2
production. The literature reported that Ni dispersions of Ni/Y2O3, Ni/ZrO2, and
Ni/CeO2 were decreased at a higher reduction temperature of 600 °C, compared to that
of Ni/Al2O3 [5]. The main reason is the low surface areas of these supports, i.e., Y2O3
(43.0 m2/g or 7 m2/g), ZrO2 (85.7 m2/g), CeO2 (88.2 m2/g or 4 m2/g), and SrO (1.05
m2/g) [5-7]. Thus, modification of an Al2O3 support is an interesting approach to
enhance the Ni catalyst activity while maintaining a high surface area of the support.
Alumina supports can be modified using partial doping of atoms with different
valencies in the Al2O3 frameworks. This method may cause defect formation in the
Al2O3 framework due to the differences in atomic valency and/or ionic size to those of
the native Al atom [8]. Verwey reported that the crystal structure of γ-Al2O3 is similar
to the defect spinel structure, which contains cation vacancies in the structure [9]. These
vacancies increase the opportunity to insert dopant atoms and partially replace the Al
Ref. code: 25615622300134IGC

14
atoms by dopant atoms in the Al2O3 framework. The insertion or replacement forms
oxygen vacancies, which alter the Ni-support interactions of our Ni catalysts and
improve their properties of Ni dispersion, acidic sites, and basic sites [8]. These
improvements facilitate the dehydrogenation of ammonia and desorption of nitrogen
adsorbates from the Ni active sites, which are the possible rate determining steps in
ammonia decomposition [10-12].
The active Ni catalyst in this study was further investigated for hydrogen
production from urine. The catalyst must be invulnerable to water vapor and active for
a low concentration of NH3 (e.g. urine). Urine contains 0.31–0.33 M urea, which can
be further converted to NH3 by urea dissociation [13, 14]. In addition, wastewater from
ammonia and urea plants contains ammoniacal nitrogen in the range of 400–1000 mg
of N/L, which can be a great source for H2 production from NH3 decomposition [15].
This process can also decrease the toxic ammonia in wastewater prior to environmental
release. Ammonia in water can be harmful to the aquatic life [13]. Therefore, NH3
decomposition using an active and water-resistant Ni over doped Al2O3 catalyst can
serve as a simultaneous solution for energy production and environmental problems.
This study provides an understanding of the reaction mechanism, Ni-support
interactions, and effects of doped Al2O3 supports for the H2 production process from
NH3 decomposition. Thus, the active catalysts of this study may lead to the
development of a novel clean hydrogen production process from NH3 and to other
related applications.
Ref. code: 25615622300134IGC

15
1.2 Objectives of study
The main objective of this study is to develop the Ni catalysts for hydrogen
production from ammonia decomposition. The Ni catalysts were developed via the
modification of Al2O3 supports using the partial doping of heteroatoms in the Al2O3
frameworks. The main objective can be clarified as follows.
1. To evaluate the activities of Ni/doped Al2O3 catalysts, compared to Ni over
commercial γ-Al2O3 catalyst.
2. To in-depth study the role of dopants in the Al2O3 frameworks toward the
Ni catalysts properties.
3. To evaluate the activation energies of NH3 decomposition over the
catalysts.
4. To study the rate determining step in the NH3 decomposition mechanism.
5. To investigate the feasibility of the H2 production process from urine.
1.3 Scopes of study
The partial doping of heteroatoms in the Al2O3 frameworks leads to change the
supports properties, which affect Ni-support interaction and enhance the Ni catalysts
activities. In this study, the same range of ionic sizes with variation of valencies in Sr2+
(170 pm), Y3+ (160 pm), or Zr4+ (160 pm) were selected as the dopants to evaluate the
effects of dopant valency in the Al2O3 framework for the Ni catalyst activities. The
same valency with different ionic sizes in Ce4+ (200 pm) in comparison to Zr4+ was also
selected as the dopant to evaluate the effects of dopant ionic size in Al2O3 framework
for the Ni catalyst activities [16]. The Ni catalysts were prepared using the incipient
wetness impregnation method over the doped Al2O3 supports. The Ni catalyst over γ-
Al2O3 was also prepared using the same preparation method and used as the reference
in this study. The embedded dopants in the Al2O3 frameworks were investigated using
the XRD and XANES techniques. Interaction of Ni on each support was evaluated
using the H2-TPR technique to investigate the effect of dopants in the Al2O3
frameworks to the Ni active sites. The catalytic activity tests in ammonia decomposition
were conducted in a quartz reactor at a temperature range of 500–600 °C and
atmospheric pressure. The performances of the catalyst were evaluated in terms of the
Ref. code: 25615622300134IGC

16
ammonia conversion and the hydrogen formation rate. The role of dopants in the Al2O3
frameworks for the Ni catalysts was studied using the chemisorption technique, i.e.,
CO-pulse, CO2-TPD, NH3-TPD, and NH3-TPRx to understand the NH3 decomposition
mechanism over the catalysts in this study. The decomposition of low-concentration
NH3, originated from synthetic urine was also evaluated over the active Ni/Ce-doped
Al2O3 catalyst to investigate the feasibility of catalyst utilization for a simultaneous
solution of H2 production and environmental problems.
Ref. code: 25615622300134IGC

17
Chapter 2
Literature Review
2.1 Ammonia as a hydrogen carrier
The main obstacles in the H2 technology are H2 storage and transportation. Till
now, hydrogen storage materials, such as metal hydride, complex hydrides, and
organic-inorganic framework cannot satisfy the practical requirements of fuel cell
application. Moreover, transportation of compressed H2 by truck or rail is very
expensive [17, 18]. Ammonia is considered as a good hydrogen carrier for on-site H2
generation due to its several desirable characteristics. One mole of NH3 contains 1.5
mol of H2, which is 17.65 wt% or 108 kg of H2/m3 of NH3, embedded in liquid NH3 at
20 °C and 8.5 atm [3, 19-21]. This means that NH3 can be stored in liquid phase under
mild conditions in pressure vessels, and NH3 has a H2 density around 45 % higher than
that of liquid H2. Figure 2.1 shows energy densities of various energy carriers [3].
Figure 2.1: Energy densities of various energy carriers [3].
Ammonia also exhibits an energy density higher than that of compressed
hydrogen and close to fossil fuel, i.e., coal and oil. Ammonia can be decomposed to
Ref. code: 25615622300134IGC

18
produce H2 for non-alkaline fuel cells or directly fed in an alkaline fuel cell to generate
electricity without carbon emission. Ammonia could also be an excellent fuel as it can
be fed directly in an internal combustion engine. Thus, ammonia can be one of the best
potential options for H2 carrier to produce H2 at on-site generation without CO and CO2
emissions. Ammonia distribution and transportation can be more attractive than
hydrogen distribution because, it is routinely transported in large tonnage by rail, truck,
barge, and pipeline [3, 17]. The physical and chemical properties of NH3 are listed in
Table 2.1 [17].
Table 2.1: Ammonia properties [17].
Ammonia is normally produced from the Haber-Bosch process by the reaction
of N2 and H2. The Haber-Bosch process was discovered in 1909 by German scientists,
Fritz Haber and Carl Bosch. This process is generally operated over Fe-based catalysts
at a temperature of 400–600 °C and a pressure of 200–400 atm. The hydrogen is
normally produced from various sources, such as natural gas, petroleum coke, and
Hydrogen content
H2 weight fraction 17.65 wt% H2 volume density 0.105 kg/liter
Solid phase
Melting point -78 °C Latent heat of fusion (1 atm at triple point)
-337.37 kJ/kg
Liquid phase
Vapor pressure
(20°C) 8.6 bar
Liquid density (1 atm at boiling point)
682 kg/m3
Boiling point (1 atm) 33.5 °C Latent heat of
vaporization (1 atm at boiling point)
1371.2 kJ/kg
Critical temperature 132.4 °C Critical pressure 112.8 bar
Gas phase
Gas density (1 atm at boiling point)
0.86 kg/m3 Compressibility (Z)
(1 atm at 15 °C) 0.9929
Specific gravity
(air=1) (1 atm at 20 °C) 0.597
Specific volume (1 atm at 20 °C)
1.411 m3/kg
Critical density 0.24 g/mL Thermal
conductivity 22.19 mW/mK
Miscellaneous
Water solubility (1 atm at 0 °C)
862 vol/vol Auto ignition
temperature 630 °C
Lower flammable
limit in air 15 vol%
Upper flammable
limit in air 28 vol%
Molecular weight 17.03 g/mol
Ref. code: 25615622300134IGC

19
biomass. These feedstocks are thermally reformed to obtain hydrogen and other gases,
which can be reacted with water and nitrogen to produce ammonia. The majority of
NH3 is produced from hydrocarbon sources that emit carbon into the atmosphere, but
opportunities for carbon sequestration are available in NH3 production plants. World
ammonia production has increased over time as ammonia is used in both agricultural
and industrial sectors. In 2017, the United States Geological Survey (USGS) reported
that the world ammonia production was around 150 million metric tons (Mt) of
ammonia [22].
Safety, toxicity, and social acceptance must be considered for the use of
ammonia. Ammonia is a poisonous gas with exposure limits of 50 ppm in atmospheric
air for 8-hour exposure, reported by the Occupational Safety and Health Administration
(OSHA). However, ammonia is commonly used as an agricultural and industrial
chemical, which can be handled safely. The health effects from ammonia exposure and
acute effects from short exposure are listed in Table 2.2 [17].
Table 2.2: Acute health effects of NH3 [17].
Only a few documents have reported the health effects of NH3 from long term
and low-level exposures. Coon et al. studied animal inhalation on ammonia over rats,
guinea pigs, New Zealand albino rabbits, squirrel monkeys, and beagle dogs. They
Effect NH3 concentration in air
(by volume)
Least perceptible odor 5 ppm
Readily detectable odor 20–50 ppm
No discomfort or impairment of health for prolonged
exposure 50–100 ppm
General discomfort and eye tearing; no lasting effect
on short exposure 150–200 ppm
Severe irritation of eyes, ears, nose and throat, no
lasting effect on short exposure 400–700 ppm
Coughing, bronchial spasms 1700 ppm
Dangerous, less than half hour exposure may be fatal 2,000–3,000 ppm
Serious edema, strangulation, asphyxia, rapidly fatal 5,000–10,000 ppm
Immediately fatal 10,000 ppm (1 %)
Ref. code: 25615622300134IGC

20
reported that mild nasal irritation was observed in 12 of 49 rats at 262 mg/m3 of NH3
exposure. An NH3 exposure at 455 mg/m3 made 32 of 51 rats dead at day 25, and 50 of
51 rats died after 65 days at the same NH3 exposure. At 470 mg/m3 of NH3 exposure,
13 of 15 rats and 4 of 15 guinea pigs died after 65 days, and eye irritation was found in
dogs and rabbits. These dogs also had nasal discharge. However, the NH3 exposure of
40 mg/m3 for 114 days and 127 mg/m3 for 90 days did not affect to any organs or tissues
of animals [23]. Therefore, NH3 can be the potential source for H2 production according
to the good properties and safety issues, and NH3 decomposition is worth to be
investigated for on-site H2 production.
2.2 Catalysts for ammonia decomposition
Ammonia decomposition is the reverse reaction of ammonia synthesis, and a
mildly endothermic process, which yields hydrogen and nitrogen. The temperature
required for efficient cracking depends on the catalyst, i.e., 450–550 °C for Ru catalysts
and 600–700 °C for Ni catalysts. The drawback of ammonia decomposition is
unconverted ammonia that can poison fuel cell electrodes even at a trace amount (0.1
ppm). However, unconverted ammonia can be reduced below 200 ppb using a suitable
absorber [18].
There are many catalysts used for ammonia decomposition, reported in the
literature. The performance of catalysts depends on active component, promoter, and
support as well as reaction conditions. Table 2.3 shows the catalytic system of ammonia
decomposition, including the catalytic performance and the reaction conditions.
Ref. code: 25615622300134IGC

21
Table 2.3: Conditions and activities of various catalysts in NH3 decomposition.
Ref./ Year Catalysts
Reaction
temperature
(°C)
Ammonia
conversion
(%)
Hydrogen rate
(mmol/min·gcat)1
(mL/min·gcat)2
Remarks
[24] / 1999 Fused Fe 500 20–80 - - Use the industrial catalyst PS3 INS.
- NH3 conversion depend on space velocity of NH3.
[25] / 2000
Nitrided MoNx/α-Al2O3
600–750
75–99.7
-
- The Mo and NiMo catalysts were prepared using the
impregnation method.
- The catalysts were further nitrided using temperature
programmed reaction with NH3. Nitrided NiMoNy/α-Al2O3 78–99.9
NiO/MgO 69.9–99.9 - Commercial catalyst.
[26] / 2001
10 % Ni/SiO2 400–650 1.4–70.0 0.44–21.11
- The catalysts were prepared using the wet
impregnation method. 10 % Ir/SiO2 400–700 3.9–98.0 1.2–30.61
10 % Ru/SiO2 400–650 14.3–99.0 4.5–30.91
65 % Ni/SiO2/Al2O3 400–650 3.5–97.0 1.1–30.31 - Commercial catalyst from Aldrich chemicals.
[27] / 2002
Ni-Pt/Al2O3 500–600 14.5–78.1
-
- Commercial catalyst (G43-A, United Catalyst).
Raney Ni 600–700 18.8–81.6 - Commercial catalyst (2800, Grace Davison).
Ru/Al2O3 500–700 6.5–84.5 - Commercial catalyst (146, Johnson Matthey).
[28] / 2002
Ru/active carbon
400 - -
- The catalysts were prepared over the commercial
active carbon (RO-08, Norit Company) using the
impregnation method.
- The catalysts activities were reported as the reaction
rate, which can be ranked as Cs-Ru > Ba-Ru > Ru.
Ba-Ru/active carbon
Cs-Ru/active carbon
Ref. code: 25615622300134IGC

22
Ref./ Year Catalysts
Reaction
temperature
(°C)
Ammonia
conversion
(%)
Hydrogen rate
(mmol/min·gcat)1
(mL/min·gcat)2
Remarks
[29] / 2003
0.5 wt% Ru/Al2O3
580 - -
- The Pd, Pt, Ir, Rh, and Ru are commercial catalysts
from Alfa Aesar.
- The remaining catalysts were prepared using the wet
impregnation method.
- The catalysts activities were reported as Turn over
frequency of NH3 (TOF), which can be ranked as Ru
> Ni > Rh > Co > Ir > Fe > Pt > Cr > Pd > Cu > Te.
- The rate determining step of Ru, Ni, Co, Fe, and Cr
catalysts is the recombination of nitrogen adsorbate
on the active sites.
1.0 wt% Ni/Al2O3
0.5 wt% Rh/Al2O3
1.0 wt% Co/Al2O3
1.0 wt% Ir/Al2O3
1.0 wt% Fe/Al2O3
1.0 wt% Pt/Al2O3
1.0 wt% Cr/Al2O3
0.5 wt% Pd/Al2O3
1.0 wt% Cu/Al2O3
1.0 wt% Te/Al2O3
[30] / 2004
2 % Fe/charcoal 550–850 10–100
-
- The Fe over charcoal catalyst was prepared using the
pyrolysis method.
- The Fe over activated carbon was prepared using the
impregnation method.
6 % Fe/charcoal 550–850 20–100
8 % Fe/activated carbon 750 25
6 % Ca/charcoal 750–850 40–100
Ref. code: 25615622300134IGC

23
Ref./ Year Catalysts
Reaction
temperature
(°C)
Ammonia
conversion
(%)
Hydrogen rate
(mmol/min·gcat)1
(mL/min·gcat)2
Remarks
[31] / 2004
Ba-Ru/MgAl2O4
430 - -
- The catalysts were prepared using the incipient
wetness impregnation method.
- The catalytic activities were reported in terms of
TOF, which can be ranked as Cs-Ru/C > Ba-Ru/C >
Cs-Ru/MgAl2O4 > Ba-Ru/MgAl2O4.
Cs-Ru/MgAl2O4
Ba-Ru/C (carbon)
Cs-Ru/C (carbon)
[32] / 2004
Ru/CNTs (carbon nanotubes)
350–500
5–45
581
- This study reported that the best catalytic activity
was obtained at 1:1 wt. ratio for MgO-CNTs support.
- Hydrogen production is 58 mmol/min·gcat at 80 %
NH3 conversion.
- The catalysts were prepared using the incipient
wetness impregnation method with 4.8 wt% Ru.
K-Ru/CNTs 30–100
Ru/MgO-CNTs 5–55
K-Ru/MgO-CNTs 40–100
Ru/MgO 5–35
K-Ru/MgO 10–70
[33] / 2004
Ru/CNTs
450–550
43.7–100 14.6–33.51
- Using acetone as the solvent for catalyst preparation.
- The catalysts were prepared using the incipient
wetness impregnation method with 5 wt% Ru.
- The Ru/K molar ratio of catalyst is 1.
Ru/MgO 30.9–91.8 10.4–30.71
Ru/AC 28.7–78.9 9.6–26.41
Ru/ZrO2 24.8–77.0 8.3–25.81
Ru/Al2O3 23.4–73.7 7.8–23.51
K-Ru/CNTs 400–450 59.8–97.3 20.0–32.61
[34] / 2004 Rh/CNTs
350–500 1–11 0.2–4.191
Ni/CNTs 1–8 0.10–2.901
Ref. code: 25615622300134IGC

24
Ref./ Year Catalysts
Reaction
temperature
(°C)
Ammonia
conversion
(%)
Hydrogen rate
(mmol/min·gcat)1
(mL/min·gcat)2
Remarks
[34] / 2004
(continue)
Pd/CNTs
350–500
1–3 0.03–1.431 - The catalysts were prepared using the incipient
wetness impregnation method with the metal loading
of 4.75 × 10⁻⁴ mol/gcat.
- Using acetone as the solvent for catalyst preparation.
- GHSV of NH3 = 30,000 mL/(h∙gcat)
Fe/CNTs 1–2 0.02–0.651
Pt/CNTs 1–3 0.05–1.411
Ru/CNTs 8–85 2.11–28.351
[35] / 2005
Ni/Fumed SiO2
400–700
4.6–93.4 1.5–31.31
- The catalysts were prepared with 5 wt% Ni.
- IMP = incipient wetness impregnation method.
- TIE = template ion-exchange method.
- The molar ratio of K-Ni is 2:1.
- KOH was used as promoter.
Ni/MCM-41 (IMP) 8.0–95.4 2.7–32.01
Ni/MCM-41 (TIE) 6.3–98.8 2.1–33.11
K-Ni/SBA-15 8.2–93.6 2.8–31.31
K-Ni/Fumed SiO2 6.8–95.7 2.3–32.11
K-Ni/MCM-41 (IMP) 8.6–97.8 2.9–32.81
K-Ni/MCM-41 (TIE) 9.5–100 3.2–33.51
K-Ni/SBA-15 9.5–94.9 3.2–31.81
[36] / 2007
10 % Ni/γ-Al2O3
400
32
- - The catalysts were prepared using the wet
impregnation method.
10 % Ni-0.5 % Ir/γ-Al2O3 36
10 % Ni-0.7 % Ir/γ-Al2O3 44
10% Ni-1 % Ir/γ-Al2O3 34
[37] / 2007 5 wt% Ru/fly ash
550 6.9 4.21 - The supports (fly ash and red mud) were obtained
from industrial wastes. 5 wt% Ru/red mud 11 7.361
Ref. code: 25615622300134IGC

25
Ref./ Year Catalysts
Reaction
temperature
(°C)
Ammonia
conversion
(%)
Hydrogen rate
(mmol/min·gcat)1
(mL/min·gcat)2
Remarks
[38] / 2007
Ni
600–650
39.0–65.7 87.8–147.8* - The catalysts were prepared using the wet-lay
papermaking process to form the thin-sheet micro-
fibrous nickel.
- * Unit of the H2 production rate is mL/min.
71.43 % Ni/28.57 % Al 62.6–88.7 140.9–199.6*
99.86 % Ni/0.14 % Ce 64.6–89.6 145.4–201.6*
95.49 % Ni/0.04 % Ce/4.49 % Al 81.0–99.4 182.3–223.7*
[39] / 2007
Ru/AC (activated carbon)
550
14.4 4.41
- The catalysts were prepared using the incipient
wetness impregnation method with 5 wt% Ru.
- GHSV of NH3 = 30,000 mL/(h∙gcat)
- This work investigated the importance of carbon
structure as the support and found that graphite is the
most suitable support for Ru catalyst.
Ru/CMK-3 (mesoporous carbon) 22.7 7.01
Ru/CB-C (synthesized carbon black) 26.1 8.01
Ru/CB-S (commercial carbon black) 52.7 16.21
Ru/CNTs 84.7 26.01
Ru/GC (graphite carbon) 95.0 29.11
[40] / 2007
Ru/CMK-3
550
22.7 7.01
- The catalysts were prepared using the incipient
wetness impregnation method with 5 wt% Ru.
- The CMK-3 supports were modified with various
acid and alkali solutions.
Ru-Cl/CMK-3 37.4 11.51
Ru-SO4/CMK-3 35.6 10.91
Ru-PO4/CMK-3 33.9 10.41
Ru-Li/CMK-3 15.2 4.71
Ru-Na/CMK-3 50.8 15.61
Ru-K/CMK-3 78.9 24.21
Ru-Ca/CMK-3 48.5 14.91
Ref. code: 25615622300134IGC

26
Ref./ Year Catalysts
Reaction
temperature
(°C)
Ammonia
conversion
(%)
Hydrogen rate
(mmol/min·gcat)1
(mL/min·gcat)2
Remarks
[41] / 2008
Ni1.2/Al2O3
450–600
16–98 -
- The catalysts were prepared using the co-
precipitation method.
- GHSV of NH3 = 30,000 mL/(h∙gcat)
- The molar ratio of Ni/Al is 1.20.
- Ce was used as promoter with the molar ratio of
Ce/Ni from 0.07 to 0.5.
Ni1.2Ce0.07/Al2O3 21–97
Ni1.2Ce0.10/Al2O3 29–100 24.11
Ni1.2Ce0.20/Al2O3 27–99 -
Ni1.2Ce0.50/Al2O3 22–95
[42] / 2010
CNT
500–600
1–10
-
- Nitrogen doping was done in the plasma treatment
process.
- The catalysts were prepared using the dry
impregnation method with 0.8 wt% Ru.
Ru/CNT-undoped N 22–72
Ru/CNT (N-doped at 200 W) 32–98
Ru/CNT (N-doped at 400 W) 29–92
[4] / 2010
Nano-Fe@SiO2
400–550
0–59 20.31 at 550 °C
- The catalysts were prepared with TEOS at Si/metal
ratio equal to 0.2 to form nano-metal encapsulated
by SiO2 shell.
Nano-Ni@SiO2 8–61 20.71 at 550 °C
Nano-Co@SiO2 1–39 -
Nano-Ru@SiO2 35–100 33.51 at 550 °C
[43] / 2011
3.5 wt% Fe/CNFs
450–600
2–48
- - GHSV of NH3 = 6,500 mL/(h∙gcat). 3.5 wt% Fe/mica 6–88
3.5 wt% Fe-CNFs/mica 10–98
Ref. code: 25615622300134IGC

27
Ref./ Year Catalysts
Reaction
temperature
(°C)
Ammonia
conversion
(%)
Hydrogen rate
(mmol/min·gcat)1
(mL/min·gcat)2
Remarks
[44] / 2012
Ni/Al2O3
550
32.7 35.02
- The catalysts were prepared using the impregnation
method with 3.6 wt% Ni, except 2Ni/Ce0.8Zr0.2O2
(7 wt% Ni).
- The Ce0.8Zr0.2O2 supports were prepared using sol
gel, co-precipitation, and surfactant-assisted method.
- SA = surfactant-assisted
Ni/CeO2 60.8 65.12
Ni/Ce0.8Zr0.2O2-sol gel 80.2 85.92
Ni/Ce0.8Zr0.2O2-co-precipitation 84.5 90.52
Ni/Ce0.8Zr0.2O2-SA 91.0 97.52
2Ni/Ce0.8Zr0.2O2-SA 91.6 93.72
[45] / 2012
10 wt% Ni/Al2O3
550
70
-
- The catalysts were prepared using the impregnation
method.
- This work also studied effect of calcination of the
Ni/La2O3 catalysts and reported that the calcination
at 600 °C yields the highest catalytic activity.
10 wt% Ni/SiO2 60
10 wt% Ni/MgO 45
10 wt% Ni/CeO2 45
10 wt% Ni/TiO2 35
10 wt% Ni/ZrO2 10
10 wt% Ni/La2O3 63
20 wt% Ni/La2O3 65
40 wt% Ni/La2O3 79
Ref. code: 25615622300134IGC

28
Ref./ Year Catalysts
Reaction
temperature
(°C)
Ammonia
conversion
(%)
Hydrogen rate
(mmol/min·gcat)1
(mL/min·gcat)2
Remarks
[46] / 2013
Co
500
4.5 1.21 - The Co catalyst was prepared using the precipitation
method.
- The modified Co catalysts were prepared using the
co-impregnation with the solutions of calcium,
potassium, and aluminum nitrates.
- GHSV of NH3 = 24,000 mL/(h∙gcat).
Modified Co 40.1 8.31
Modified Co with 0.25 wt% Mn 23.0 6.21
Modified Co with 0.16 wt% Cr 35.0 7.31
Modified Co with 0.28 wt% Cr 32.0 6.81
[47] / 2014
MRM
700
63.4 21.21
- The catalysts were prepared using the homogeneous
precipitation method.
- MRM = modified red mud.
3 wt% Ni/MRM 69.3 23.21
6 wt% Ni/MRM 72.0 24.11
9 wt% Ni/MRM 75.9 25.41
12 wt% Ni/MRM 93.2 31.21
15 wt% Ni/MRM 97.9 32.81
18 wt% Ni/MRM 82.0 27.51
[48] / 2015
Ni/Al2O3
550
60.0
-
- The catalysts were prepared using the impregnation
method.
- Y, La, Ce, Pr, Nd, Sm, Eu, and Gd were used as
promoter.
Y-Ni/Al2O3 87.5
La-Ni/Al2O3 92
Ce-Ni/Al2O3 81
Pr-Ni/Al2O3 90
Ref. code: 25615622300134IGC

29
Ref./ Year Catalysts
Reaction
temperature
(°C)
Ammonia
conversion
(%)
Hydrogen rate
(mmol/min·gcat)1
(mL/min·gcat)2
Remarks
[48] / 2015
(continue)
Nd-Ni/Al2O3
550
91
-
- The catalysts were prepared using the impregnation
method.
- Y, La, Ce, Pr, Nd, Sm, Eu, and Gd were used as
promoter.
Sm-Ni/Al2O3 85
Eu-Ni/Al2O3 83
Gd-Ni/Al2O3 83
[5] / 2016
Ni
450–600 -
0.3–12.4*
- The catalysts were prepared using the co-
precipitation method.
- * = H2 yield (%).
Ni/Y2O3 23.4–99.9*
Ni/CeO2 28.6–99.0*
Ni/MgO 20.9–98.2*
Ni/La2O3 21.2–98.0*
Ni/Al2O3 16.9–98.0*
Ni/ZrO2 14.2–95.0*
[7] / 2016
Ni/Al2O3
550
70
-
- The catalysts were prepared using the impregnation
method.
- The Ni loading was fixed at 10 wt%.
Ni/La2O3 62
Ni/CeO2 23
Ni/Sm2O3 80
Ni/Gd2O3 80
Ni/Y2O3 87
Ref. code: 25615622300134IGC

30
2.2.1 Active component for Catalyst in NH3 decomposition
The component of catalysts must be investigated to improve the catalytic
activities. In general, heterogeneous catalysts are composed of three major parts, i.e.,
active component, support, and promoter. According to Table 2.3, there are many
metals, alloys, and compounds, which have been tested for NH3 decomposition. Most
of the studies in the literature reported the use of ruthenium (Ru), Iron (Fe), and Nickel
(Ni) as the active components in catalysts. A few studies reported the use of iridium
(Ir), rhodium (Rh), platinum (Pt), and palladium (Pd) as the active components in the
catalysts. Some metal nitrides and carbides were also reported as the active components
in catalysts. Figure 2.2 shows the activities of metals over CNTs supports with the same
metal loading at reaction temperature of 400 °C [18].
Figure 2.2: NH3 decomposition using CNTs-supported metal catalysts [18].
Figure 2.2 shows that Ru catalyst is the most active catalyst for NH3 decomposition.
Goodman et al. also reported that the catalytic activity of NH3 decomposition can be
ranked as Ru > Ir > Ni with the same metal loading, as shown in Table 2.3. The activity
of Ru catalyst surpassing other catalysts can be explained by the turn over frequency
(TOF) of H2 production over the catalysts, which shows the same trend as the catalytic
activity ranking. The re-combinative desorption of nitrogen from the metal surfaces has
been proposed as the rate-limiting step in NH3 decomposition reaction, which implies
Ref. code: 25615622300134IGC

31
that nitrogen has a stronger bound on Ni than that of Ir and Ru [26]. The drawback of
Ru and Ir catalysts is their high cost and limited availability. Even though the activity
of Ni catalyst cannot compete with that of Ru and Ir catalysts, Ni catalyst exhibits the
same range of the catalytic activity to other noble metals, i.e. rhodium (Rh), platinum
(Pt), and palladium (Pd). However, a high reaction temperature of 600–700 °C was
required for a high catalytic activity of Ni catalysts to increase the rate in re-
combinative desorption of nitrogen from the Ni active sites [26, 27, 35, 38]. One
approach of Ni development is using bimetallic catalyst. Han et al. reported the use of
bimetallic Ni-Ir/γ-Al2O3 catalysts, which exhibit a bit higher of NH3 conversion than
Ni/γ-Al2O3 catalyst [36]. In terms of cost, Ni can be a potential active component in
catalyst for NH3 decomposition, but it still needs an improvement of catalytic
performance.
2.2.2 Promoter for Catalyst in NH3 decomposition
Another approach to increase the catalyst activity is the use of a promoter. A
promoter is a substance added to a solid catalyst to improve the catalyst performance
of a chemical reaction. Normally, a promoter has little or no catalytic effect by itself,
but it can enhance the catalyst activity. Some promoters interact with active components
in catalysts, and thereby alter their chemical effect on a catalyzed substance. Alkali,
alkaline earth, or rare earth metal ions have been reported as effective promoters for
supported Ru or Fe catalysts in NH3 synthesis. A promoter can prevent the sintering of
Ru or Fe clusters during the thermal treatment process in NH3 synthesis [49-57].
Ref. code: 25615622300134IGC

32
Figure 2.3: NH3 decomposition over Ru/CNTs modified by different metal nitrates
[58].
For NH3 decomposition, Wang et al. reported the use of alkali, alkaline earth,
or rare earth metal ions as promoters for Ru catalysts. The catalysts activities in NH3
decomposition were conducted at reaction temperature of 400 °C as shown in Figure
2.3 [58]. Considering in the same group (K, Na, and Li; Ba and Ca), a high
electronegativity of the promoter results in a low catalytic activity for NH3
decomposition. Li et al. [35] reported the use of KOH as a promoter in Ni catalysts for
NH3 decomposition. The KOH promoter added in Ni catalysts resulted in a little
improvement of the catalytic activities, as shown in Table 2.3. Lanthanum and cerium
were also reported as promoters in Ni catalysts with little improvements in the catalysts
activities for NH3 decomposition [41, 59]. Okura et al. investigated the Ni catalyst
activities using various promoters for NH3 decomposition. The catalytic activities were
improved significantly for the Ni catalysts using promoters, such as lanthanum (La),
praseodymium (Pr), and Neodymium (Nd), as reported in Table 2.3. Okura et al.
reported that high activities of these catalysts could come from depletion of the
hydrogen inhibition phenomenon. The use of promoters facilitated desorption of
hydrogen from the Ni active sites of catalysts, evidenced by the H2 desorption data [48].
However, the use of rare elements as promoters suffers from their prices and
H2 formation rate
Ref. code: 25615622300134IGC

33
availabilities, which increases the cost of catalyst production. Thus, the use of basic
chemical as a promoter can be economically attractive for catalyst production.
Urea has been reported as a promoter in the precipitated Cu-Zn catalysts, which
can increase the homogeneity and increase surface area of catalysts [60]. Our previous
work found that, the use of urea as a promoter in the impregnated Cu-Zn/Al2O3 catalysts
can increase the dispersion of Cu-Zn clusters on the Al2O3 support, which enhance the
catalytic activity for the methanol steam reforming, as shown in Figure 2.4 [61].
Figure 2.4: Improvement of Cu-Zn dispersion using urea as a promoter [61].
The use of urea as a promoter in Ni catalysts was also investigated for H2 production
from NH3 decomposition in this study. The catalysts activities were tested using 30
vol% NH3 solution with 30 mL/min Ar as a carrier gas at 550 °C. The preliminary data
show that the use of urea in Ni catalyst can also improve Ni dispersion and Ni surface
area of the catalyst, resulted in a higher activity of Ni catalyst for NH3 decomposition,
as shown in Table 2.4. Therefore, the Ni catalysts were prepared using urea as a
promoter to improve Ni dispersion and Ni surface area of the catalysts in this study.
Table 2.4: Properties of 20 wt% Ni catalysts and H2 formation rates.
Catalysts Ni dispersion Ni surface area H2 formation rate
(%) (m2/g of Ni) (μmol/min·gcat)
Ni/γ-Al2O3 1.14 7.58 1590
Ni/γ-Al2O3-2 mol urea 1.58 10.54 1856
Cu-Zn/Al2O3 Cu-Zn/Al2O3 with 1 mol urea
10 μm
10 μm 10 μm
Cu-Zn/Al2O3 with 2 mol urea
Ref. code: 25615622300134IGC

34
2.2.3 Support for Catalyst in NH3 decomposition
Supports are generally used to provide an area for depositing active
components. High surface area of supports is essential for the improvement in
dispersion and surface area of active component as well as high thermal stability is also
important for good supports. However, supports often involve in a reaction, which
enhances the catalysts activities. Such phenomena have been observed in many studies.
Goodman et al. reported that the Al2O3-supported Ru and Ir catalysts exhibit lower
activities than the SiO2-supported Ru and Ir catalysts due to a lower TOF of H2 from
the Al2O3-supported catalysts, compared to that of SiO2-supported catalysts [26]. Yin
et al. reported that the Ru catalysts activities depend on the supports, as shown in
Table 2.5, which indicate that carbon nanotubes (CNTs) is the best support for Ru
catalysts in NH3 decomposition. The high surface area, high degree of graphitization,
and tube structure of CNTs support are beneficial for an increased Ru dispersion, which
can enhance the catalytic activity for NH3 decomposition [62].
Table 2.5: NH3 decomposition over supported 4.8 wt%-Ru catalysts [62].
Temperature
(°C)
NH3 conversion (%)
Ru/CNTs Ru/AC Ru/Al2O3 Ru/MgO Ru/TiO2
400 2.3 0.8 2 2.4 1.9
450 6.4 2.7 5.9 6.3 5.3
500 20.5 7.2 17.6 12.2 11.5
550 40.6 14.4 35.9 19.5 21.6
Chen et al. reported that the doping of nitrogen in CNTs using the microwave plasma
technique can enhance the activity of Ru/N-doped CNTs catalyst, compared to the
Ru/undoped CNTs catalyst [42]. Two types of nitrogen species were formed in the N-
doped CNTs supports, which are pyridinic nitrogen at the edge of a graphene sheet on
the surface of CNTs and quaternary nitrogen within a graphene sheet. The average size
of Ru particles decreased with the increase of pyridinic nitrogen content on CNTs, and
the dispersion of Ru particles on CNTs were improved due to strong interaction of Ru
particles with pyridinic nitrogen on the surface of CNTs.
Ref. code: 25615622300134IGC
35
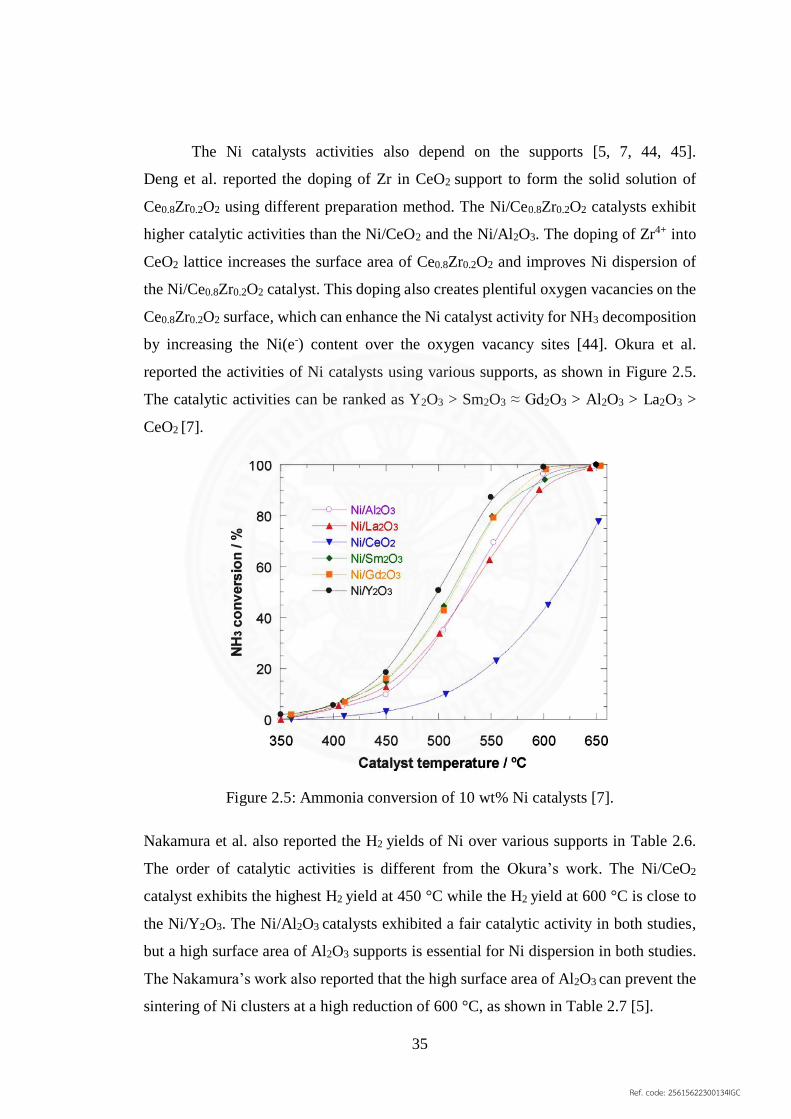
The Ni catalysts activities also depend on the supports [5, 7, 44, 45].
Deng et al. reported the doping of Zr in CeO2 support to form the solid solution of
Ce0.8Zr0.2O2 using different preparation method. The Ni/Ce0.8Zr0.2O2 catalysts exhibit
higher catalytic activities than the Ni/CeO2 and the Ni/Al2O3. The doping of Zr4+ into
CeO2 lattice increases the surface area of Ce0.8Zr0.2O2 and improves Ni dispersion of
the Ni/Ce0.8Zr0.2O2 catalyst. This doping also creates plentiful oxygen vacancies on the
Ce0.8Zr0.2O2 surface, which can enhance the Ni catalyst activity for NH3 decomposition
by increasing the Ni(e-) content over the oxygen vacancy sites [44]. Okura et al.
reported the activities of Ni catalysts using various supports, as shown in Figure 2.5.
The catalytic activities can be ranked as Y2O3 > Sm2O3 ≈ Gd2O3 > Al2O3 > La2O3 >
CeO2 [7].
Figure 2.5: Ammonia conversion of 10 wt% Ni catalysts [7].
Nakamura et al. also reported the H2 yields of Ni over various supports in Table 2.6.
The order of catalytic activities is different from the Okura’s work. The Ni/CeO2
catalyst exhibits the highest H2 yield at 450 °C while the H2 yield at 600 °C is close to
the Ni/Y2O3. The Ni/Al2O3 catalysts exhibited a fair catalytic activity in both studies,
but a high surface area of Al2O3 supports is essential for Ni dispersion in both studies.
The Nakamura’s work also reported that the high surface area of Al2O3 can prevent the
sintering of Ni clusters at a high reduction of 600 °C, as shown in Table 2.7 [5].
Ref. code: 25615622300134IGC

36
Table 2.6: H2 yields of Ni catalysts over supports [5].
Catalysts H2 yield (%)
450 °C 500 °C 550 °C 600 °C
Ni 0.3 1.0 4.7 12.4
Ni/Y2O3 23.4 60.8 98.3 99.9
Ni/CeO2 28.6 60.0 92.9 99.0
Ni/MgO 20.9 51.2 87.2 98.2
Ni/La2O3 21.2 48.6 84.3 98.0
Ni/Al2O3 16.9 42.3 84.0 98.0
Ni/ZrO2 14.2 31.4 71.8 95.0
Table 2.7: Physicochemical properties of Ni catalysts supported on various metals [5].
Catalysts
Ni dispersion (%) Specific
surface
area
(m2/g)
Pore size
(nm)
Pore
volume
(cm3/g) 400 °C
reduction
600 °C
reduction
NiO 0.66 0.16 18.7 21.2 0.112
Ni/Y2O3 11.3 6.4 43.0 17.8 0.192
Ni/CeO2 9.3 4.0 88.2 17.1 0.413
Ni/MgO 1.9 4.9 177.8 5.1 0.311
Ni/La2O3 8.9 3.5 65.6 20.6 0.377
Ni/Al2O3 0.03 4.7 289.5 4.5 0.467
Ni/ZrO2 4.3 1.7 85.7 4.6 0.138
However, Muroyama et al. reported the ranking of Ni catalysts activities over various
supports as Al2O3 > La2O3 > SiO2 > CeO2 ≈ MgO > TiO2 > ZrO2. In addition, the
apparent activation energies of the supported Ni catalysts (80–90 kJ/mol) are lower than
those of Ni films (180 kJ/mol) and Ni wires (209 kJ/mol) [45]. Similar evidences are
also observed in the supported Ru catalysts, compared to Ru films [26]. Unlike the Ru
and Ni catalysts, little differences between the supported and unsupported catalysts
were observed in Ir, Pt, Rh, and Pd catalysts [63]. Thus, the supports play an important
role in the activities of Ni catalysts. A high surface area of support is needed for Ni
dispersion, which can also prevent the sintering of Ni clusters. The oxygen vacancies
in the supports provide positive effects on the catalytic activities for NH3
decomposition. Therefore, modification of high surface area Al2O3 for Ni catalysts can
Ref. code: 25615622300134IGC

37
be the potential approach to promote the Ni catalysts activities and maintain a high
surface area of Al2O3 support as well as the creation of oxygen vacancies in the support.
There are many phases of Al2O3, i.e., α-Al2O3 and γ-Al2O3. A support, α-Al2O3, is rarely
used due to its low surface area (25 m2/g) [64]. On the other hand, γ-Al2O3 is widely
used as a support due to its high surface area (176 m2/g), which is beneficial for metal
dispersion. Verwey reported that the crystal structure of γ-Al2O3 is similar to the spinel
structure of MgAl2O4 with two differences, i.e., the number of atoms in a unit cell and
the cation vacancies [9].
Figure 2.6: Spinel structure of MgAl2O4.
(Source: http://www.chemtube3d.com/solidstate/_spinel(final).htm)
The spinel structure of MgAl2O4 has 56 atoms in the unit cell, including 32 oxygen
atoms, 16 aluminum atoms in octahedral sites, and 8 magnesium atoms in tetrahedral
sites, as illustrated in Figure 2.6. The structure of γ-Al2O3 contains 40 atoms in the unit
cell, which includes 24 oxygen atoms, 16 aluminum atoms, and 2 cation vacancies
randomly distributed in octahedral/tetrahedral/both sites. The literature reported the
calculation of all possible configurations using the density functional theory, and found
that the two cation vacancies energetically prefer to distribute in octahedral sites [65,
66]. These vacancies increase the opportunity to insert the dopant atoms along with the
partial replacement of Al atoms by dopant atoms in the Al2O3 framework. The insertion
or replacement may cause defect formation in the doped Al2O3 supports, resulted by the
differences of atomic valency and/or ionic size, compared to those of the native Al
Octahedral site
Tetrahedral site
Ref. code: 25615622300134IGC
38
atoms. The defects lead to form oxygen vacancies in the supports, which can alter the
Ni-support interaction and improve the Ni catalysts activities in this study.
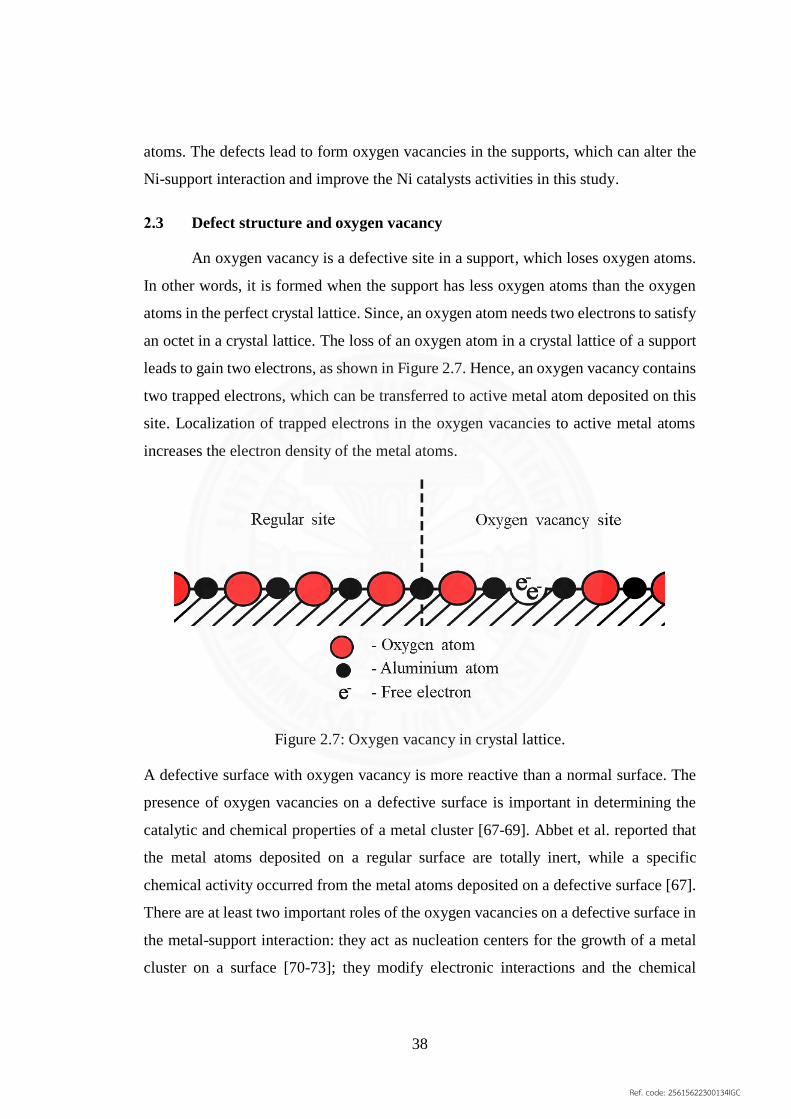
2.3 Defect structure and oxygen vacancy
An oxygen vacancy is a defective site in a support, which loses oxygen atoms.
In other words, it is formed when the support has less oxygen atoms than the oxygen
atoms in the perfect crystal lattice. Since, an oxygen atom needs two electrons to satisfy
an octet in a crystal lattice. The loss of an oxygen atom in a crystal lattice of a support
leads to gain two electrons, as shown in Figure 2.7. Hence, an oxygen vacancy contains
two trapped electrons, which can be transferred to active metal atom deposited on this
site. Localization of trapped electrons in the oxygen vacancies to active metal atoms
increases the electron density of the metal atoms.
Figure 2.7: Oxygen vacancy in crystal lattice.
A defective surface with oxygen vacancy is more reactive than a normal surface. The
presence of oxygen vacancies on a defective surface is important in determining the
catalytic and chemical properties of a metal cluster [67-69]. Abbet et al. reported that
the metal atoms deposited on a regular surface are totally inert, while a specific
chemical activity occurred from the metal atoms deposited on a defective surface [67].
There are at least two important roles of the oxygen vacancies on a defective surface in
the metal-support interaction: they act as nucleation centers for the growth of a metal
cluster on a surface [70-73]; they modify electronic interactions and the chemical
Ref. code: 25615622300134IGC
39
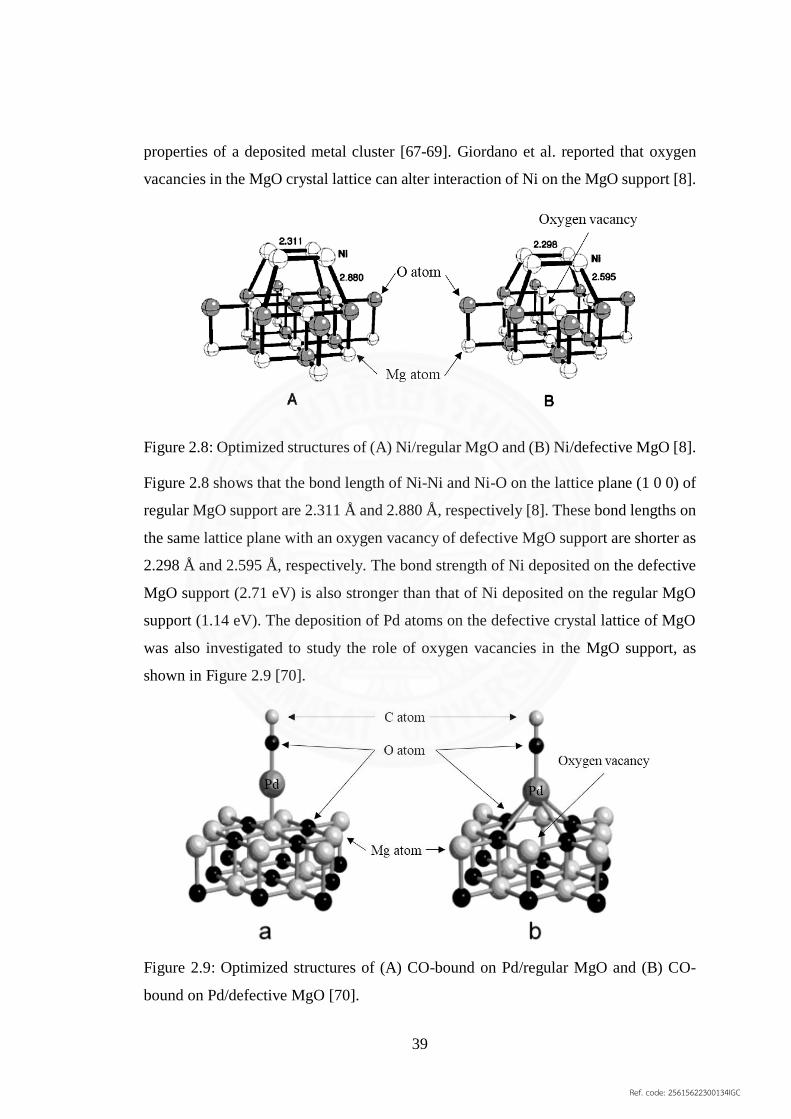
properties of a deposited metal cluster [67-69]. Giordano et al. reported that oxygen
vacancies in the MgO crystal lattice can alter interaction of Ni on the MgO support [8].
Figure 2.8: Optimized structures of (A) Ni/regular MgO and (B) Ni/defective MgO [8].
Figure 2.8 shows that the bond length of Ni-Ni and Ni-O on the lattice plane (1 0 0) of
regular MgO support are 2.311 Å and 2.880 Å, respectively [8]. These bond lengths on
the same lattice plane with an oxygen vacancy of defective MgO support are shorter as
2.298 Å and 2.595 Å, respectively. The bond strength of Ni deposited on the defective
MgO support (2.71 eV) is also stronger than that of Ni deposited on the regular MgO
support (1.14 eV). The deposition of Pd atoms on the defective crystal lattice of MgO
was also investigated to study the role of oxygen vacancies in the MgO support, as
shown in Figure 2.9 [70].
Figure 2.9: Optimized structures of (A) CO-bound on Pd/regular MgO and (B) CO-
bound on Pd/defective MgO [70].
Ref. code: 25615622300134IGC

40
Table 2.8: Interaction of Pd on supports and CO on Pd [70].
Interaction Bond length
(Å)
Bond strength
(eV)
Pd supported on regular MgO 2.210 0.96
Pd supported on defective MgO 1.524 3.42
CO on unsupported Pd 1.871 1.71
CO-Pd/regular MgO 1.847 2.23
CO-Pd/defective MgO 1.969 0.52
According to Table 2.8, the shorter bond length of supported Pd on defective MgO is
observed with a stronger bond strength than those of supported Pd on regular MgO,
which similar to those of Ni atom. Considering the interaction of CO on Pd atoms, the
bond strength of CO on an unsupported Pd is 1.71 eV. The bond strength of CO on a
supported Pd/regular MgO is 2.23 eV, while the bond strength of CO on a supported
Pd/defective MgO decreases to 0.52 eV [70]. The oxygen vacancies in a defective
support not only act as nucleation centers for the growth of the metal clusters, but also
strengthens the bond of metal clusters on the defective support. The strengthening bond
of a metal atom on a defective support comes from the trapped electrons in oxygen
vacancies, which can be localized to the metal atoms on a defective support. In addition,
the bond strength of CO on Pd/MgO support is a direct effect from the theory of bond-
order conservation in an A-B-C system [74]. The strengthening bond of Pd on a
defective MgO support results in the weakening bond of CO on Pd/defective MgO
support. On the other hand, the weakening bond of Pd on the regular MgO yields the
strengthening bond of CO on Pd/regular MgO. Therefore, metal-support interaction can
be altered by the oxygen vacancies in a defective support.
In this study, nickel was selected as the active component to reduce the catalyst
cost. Urea promoter was used to improve Ni dispersion from explosive decomposition
during the calcination process. The spinel-like structure of γ-Al2O3 was selected to serve
as the catalyst support because it has a high surface area and cation vacancies in the
framework. It is envisaged that the partial doping of heteroatoms to substitute in the
Ref. code: 25615622300134IGC

41
cation vacancies of Al2O3 frameworks can form the defects in the form of oxygen
vacancies, which alter Ni-support interaction. Surface acidity of a catalyst is one of the
important parameter, which enhance the NH3 adsorption step in the NH3 decomposition
mechanism. Thus, zirconium was selected as the first dopant due to its acid properties,
which could increase the surface acidity of Ni/Zr-doped Al2O3 catalyst. Cerium, same
valency as zirconium, was selected as a dopant to form Ce-doped Al2O3 to investigate
the effect of dopant ionic size on Ni-catalyzed NH3 decomposition. For a
comprehensive study, dopant atoms from the same period as zirconium were also used
to form Sr-doped Al2O3 and Y-doped Al2O3 to investigate the effect of dopant valency
on Ni-catalyzed NH3 decomposition. The partial doping of heteroatoms in the Al2O3
frameworks not only alters Ni-support interaction but also maintains the surface area of
doped Al2O3 supports close to that of γ-Al2O3 support. The change in Ni-support
interaction could improve the catalyst properties and the catalytic activities for NH3
decomposition.
Ref. code: 25615622300134IGC

42
Chapter 3
Methodology
3.1 Materials
The purities and brands of the chemicals and gases in this study are listed in
Table 3.1.
Table 3.1: Chemical used in this study.
Chemical Purity Brand Purpose
Urea 99 % CARLO ERBA
Reagents Catalyst preparation
Ammonia solution 30 vol% Panreac AppliChem Support preparation
α-Al2O3 99 % Reference support
γ-Al2O3 99 % Sigma-Aldrich
Sr(NO3)2 99 %
Support preparation
Y(NO3)3·6H2O 99 % Alfa Aesar
Zr(NO3)2·6H2O 99 % ACROS
Ce(NO3)3·6H2O 99 % Fluka
Al(NO3)3·9H2O 98 % LOBA Chemie
Ni(NO3)2·6H2O 99 % Catalyst preparation
Fine quartz powder 99 % Sigma-Aldrich
Catalytic test H2 (gas) 99.99 %
Linde Thailand Pub
Co., Ltd.
Ar (gas) 99.999 %
NH3 (gas) 99.5 %
CO2 (gas) 99.999 %
Catalyst
characterization H2 in Ar (gas) 5 %
NH3 in He (gas) 5 %
Ref. code: 25615622300134IGC

43
3.2 Supports preparation
The new supports, Sr-doped Al2O3, Y-doped Al2O3, Zr-doped Al2O3, and Ce-
doped Al2O3, were prepared with 5 mol% of dopants using the so-gel method according
to the following steps. Sr(NO3)2, Y(NO3)3·6H2O, Zr(NO3)2·6H2O, Ce(NO3)3·6H2O,
and Al(NO3)3·9H2O were dissolved in deionized water, separately, to form the salt
solutions with concentration of 0.5 M. The salt solutions of Sr, Y, Zr, and Ce were
mixed with Al salt solution to form the Sr-Al, Y-Al, Zr-Al, and Ce-Al salt solutions
with a mole ratio of 0.05:0.95. The ammonia solution (30 vol%, Panreac AppliChem)
was dropped into the mixed salt solutions to form gels until the pH of solutions reached
9 within 60 min. The gels of Sr-Al, Y-Al, Zr-Al, and Ce salt were kept at room
temperature for 48 h and dried at 110 ºC for 24 h. After that, the dried gels were calcined
at 800 °C for 4 h to obtain Sr-doped Al2O3, Y-doped Al2O3, Zr-doped Al2O3, and Ce-
doped Al2O3 supports. The Zr-doped Al2O3 supports calcined at 600, 1100, and
1200 °C were also prepared to investigate the effect of calcination temperature on the
support properties. In addition, the Ce-doped Al2O3 support was also prepared with 1
mol% of Ce to investigate the effect of dopant amount on the catalytic activity
compared with 5 mol% of Ce doped in Al2O3 support. The Alumina, α-Al2O3 and γ-
Al2O3, were used as the reference supports in this study. All supports were ground and
sieved using 106 µm sieve to control the uniformity of support particles. Figure 3.1
shows the schematic of supports preparation.
Figure 3.1: Schematic of supports preparation.
Ref. code: 25615622300134IGC

44
3.3 Catalysts preparation
The 10 wt% and 20 wt% Ni catalysts were prepared using the incipient wetness
impregnation method. Ni(NO3)2·6H2O was dissolved in deionized water to obtain a
solution concentration of 1.25 M. Urea was added and dissolved in the Ni solution prior
to the impregnation process. The molar ratio of urea to Ni was kept at 2:1 in this study.
The Ni solutions were impregnated drop by drop on the supports until the supports get
saturated, then the supports were dried in the hood at room temperature. The
impregnation steps were repeated until the Ni solutions were completely introduced to
impregnate all the Ni solutions over the supports. After impregnation, the impregnated
catalysts were dried at 110 °C for 12 h, and then calcined at 500 °C for 4 h. Figure 3.2
shows the schematic of catalyst preparation.
Figure 3.2: Schematic of catalysts preparation.
The literature reported that the catalysts with particle size less than 125 µm have
negligible mass transfer effects [27]. Hence, the catalysts were sieved using 106 µm
sieve to ensure that the mass transfer limitation can be neglected in this study. In
addition, experiments were conducted by varying catalyst weights, dilution ratios
between catalyst and fine quartz powder, and NH3 flow rates at 40, 50, and 60 mL/min.
Figure 3.3 shows the H2 formation rate as a function of the residence time (W/F). The
change in hydrogen formation rates indicates that the catalytic activitiy tests in this
study were not performed under mass tranfer limitation. The Ni/γ-Al2O3 using Zr as the
promoter was also prepared to compare the catalytic activities with the Ni catalyst using
Zr as the dopant in Al2O3 framework. Zr(NO3)2·6H2O solution was added into the Ni
solution with the same preparation process to prepare the catalyst. The composition of
Zr as the promoter is kept at the same amount as Zr in the Ni/Zr-doped Al2O3 catalyst.
The calculation of supports and catalysts preparation was shown in Appendix-A.
Ref. code: 25615622300134IGC

45
Figure 3.3: H2 formation rate as function of residence time.
Ref. code: 25615622300134IGC

46
3.4 Ammonia decomposition from pure ammonia
The catalysts were tested using a quartz tubular reactor with an inner diameter
of 1 cm to evaluate the H2 production rate from NH3 decomposition. To minimize the
temperature gradients inside the catalyst bed, the catalyst (0.4 g) was mixed with fine
quartz powder (1 g) then packed between quartz wool in the reactor. Figure 3.4 shows
the schematic of the NH3 decomposition testing system from pure NH3.
Figure 3.4: Schematic of NH3 decomposition testing system from pure NH3.
The reduction of the catalysts was conducted using 50 vol% H2 balanced in Ar
at 50 mL/min of total flow rate at 600 °C for 1 h. The reactor was purged with 50 ml/min
Ar at 600 °C for 30 min to remove excess H2 out of the reactor. The catalyst activity
tests were performed at 500–600 °C in a continuous operation with 50 mL/min NH3,
corresponding to 7500 mL/(h·gcat) space velocity. The product gas was directly sent to
an auto sampling unit of the Gas Chromatography with Thermal Conductivity Detector
(GCMS-2010 Ultra, Shimadzu Corporation, Japan) to determine the concentration of
product gas compositions. The stability of the catalysts was evaluated using the
accelerated deactivation process at 800 °C with 50 mL/min NH3 flow for 5 h and 5
Ref. code: 25615622300134IGC
47
cycles. The NH3 conversion at 550 °C of catalysts was evaluated with 50 mL/min NH3
flow before and after each cycle of the accelerated deactivation.
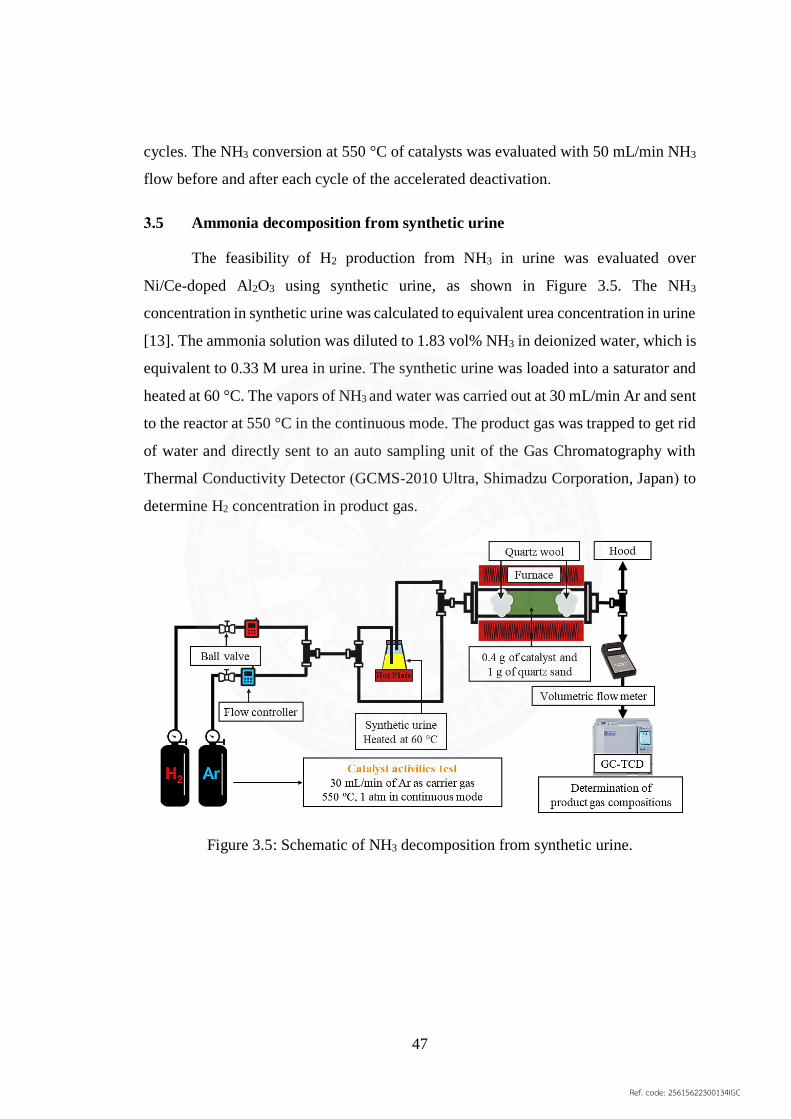
3.5 Ammonia decomposition from synthetic urine
The feasibility of H2 production from NH3 in urine was evaluated over
Ni/Ce-doped Al2O3 using synthetic urine, as shown in Figure 3.5. The NH3
concentration in synthetic urine was calculated to equivalent urea concentration in urine
[13]. The ammonia solution was diluted to 1.83 vol% NH3 in deionized water, which is
equivalent to 0.33 M urea in urine. The synthetic urine was loaded into a saturator and
heated at 60 °C. The vapors of NH3 and water was carried out at 30 mL/min Ar and sent
to the reactor at 550 °C in the continuous mode. The product gas was trapped to get rid
of water and directly sent to an auto sampling unit of the Gas Chromatography with
Thermal Conductivity Detector (GCMS-2010 Ultra, Shimadzu Corporation, Japan) to
determine H2 concentration in product gas.
Figure 3.5: Schematic of NH3 decomposition from synthetic urine.
Ref. code: 25615622300134IGC

48
3.6 Supports and catalysts characterization
3.6.1 Nitrogen physisorption technique
Physical adsorption of N2 over the supports was evaluated using the N2
physisorption instrument (Autosorp-1, Quantachrome, USA), as shown in Figure 3.6.
The support was packed in a sample tube then attached in the instrument. A blank
sample tube was also attached in the instrument as a reference. The sample tube was
heated at 300 °C under vacuum condition for 12 h to degas from the support surface.
The sample tube was cooled down to room temperature under He flow. Both sample
and blank tubes were vacuumed to get rid of any gases in the tubes, then immersed in
the liquid nitrogen dewar. Nitrogen gas was introduced into the sample and blank tubes,
then the pressure of the sample and blank tube was measured as P and P0, respectively.
The data of N2 adsorption were calculated using Brunauer, Emmett, and Teller (BET)
equation (Appendix-B) to determine the surface area, pore volume, and pore diameter
of the supports.
Figure 3.6: N2 physisorption instrument.
Ref. code: 25615622300134IGC

49
3.6.2 X-ray diffraction technique
The structures of supports were characterized using the X-ray diffraction
technique with Cu Kα1 radiation at 40 kV and 45 mA (XRD, X’Pert PRO
diffractometer, Panalytical, Almelo, the Netherlands), as shown in Figure 3.7. Each
support was packed in a glass sample holder then the sample holder was attached in the
X-ray diffractometer. The XRD patterns of supports were recorded using scintillation
detector with 23°–73° 2-theta, 0.02° step size, and 0.5 sec step time. JADE software
(Materials Data, Inc., Livermore, California) was utilized to identify phases and crystal
structures of the supports. The XRD patterns of supports were searched and matched
with the reference patterns from the International Centre for Diffraction Data (ICDD).
In addition, the lattice constant of the Al2O3 structure was calculated using the two
highest intensity peaks from diffraction planes of (4 0 0) and (4 4 0), corresponding to
the diffraction angles at around 46° and 67° in the diffractrogram, respectively [75].
Peak deconvolution was performed on the XRD pattern of supports prior to calculate
the lattice constant using JADE software. The details of the lattice constant calculation
is provided in Appendix-C.
Figure 3.7: X-ray diffractometer.
Ref. code: 25615622300134IGC

50
The structures of catalysts were also characterized using the XRD technique
with Cu Kα1 radiation at 40 kV and 45 mA. The XRD patterns of catalysts were
recorded with the same method as the XRD patterns of supports. JADE software and
the reference patterns from the ICDD were also utilized to identify phases and crystal
structures of the catalysts. In addition, the Ni crystallite sizes of reduced catalysts were
calculated based on the Scherrer’s equation using the peak broadening at the diffraction
angle around 76 degree, which correspond to the diffraction plane of (2 2 0). The peak
around 76 degree was selected to determine the Ni crystallize size as it is free from peak
overlapping.
3.6.3 X-ray absorption near edge structure technique
The local structure of Al2O3 framework in the supports was investigated using
the X-ray absorption near edge structure spectroscopy (XANES, Appendix-D) at
Beamline-8 [76] of Synchrotron Light Research Institute (Thailand), as shown in
Figure 3.8 (http://www.slri.or.th).
Figure 3.8: Schematic of XANES experiment [76].
Each support was spread on a conductive copper tape for electron-yield mode in
XANES measurements. The X-ray absorption of Al K-edge was determined using Ie/I0,
where Ie and I0 were electron-yield current intensity and incident X-ray intensity,
respectively. An aluminum foil was used to calibrate photon energy in the range of
Ref. code: 25615622300134IGC

51
1545–1560 eV. The XANES spectra were measured with 1560–1600 eV photon
energy, 0.2 eV step size, and 1 sec step time and analyzed using Athena software [77].
3.6.4 Differential scanning calorimetry technique
The calcination temperature of catalyst was determined using the Differential
scanning calorimeter (DSC, DSC-1, Mettler Toledo, USA), as shown in Figure 3.9. The
impregnated catalyst was filled in the aluminum pan, then the sample pan and the blank
aluminum pan were placed at the measurement position in the furnace of DSC
instrument. The measurement was conducted from 100–600 °C with the temperature
programmed at 10 °C/min. The differences in temperatures between the sample pan and
the blank pan were plotted with the increase of furnace temperature to investigate the
exothermic reaction of catalysts during the calcination process. The DSC plots of
catalysts were also utilized to determine the proper calcination temperature of catalysts
in this study.
Figure 3.9: Differential scanning calorimetry.
Ref. code: 25615622300134IGC

52
3.6.5 Scanning electron microscope technique
The surface morphology of catalyst was evaluated using the Scanning electron
microscopy (SEM, JSM-5410, Jeol, Japan). The elemental composition of catalyst was
also determined using an Energy dispersive Spectrometry (EDS, INCA-300, Oxford
Instruments, UK), which is coupled with the SEM, as shown in Figure 3.10. The
catalyst powders were spilled over the conductive carbon tape, which was pasted on the
copper stub. The catalyst powders were coated with gold to make them conductive for
the SEM photography.
Figure 3.10: Scanning electron microscopy.
Ref. code: 25615622300134IGC

53
3.6.6 Transmission electron microscope technique
The transmitted morphology of catalysts was evaluated using the Transmission
electron microscopy, as shown in Figure 3.11 (TEM, JEM-2100 Plus, Jeol, Japan). The
catalyst powders were suspended in ethanol solution to distribute the catalyst powders
over the copper grid and dried at room temperature for 24 h prior to TEM photography.
The Ni cluster sizes and Ni distribution of catalysts were investigated at 150,000 times
of magnification.
Figure 3.11: Transmission electron microscopy.
Ref. code: 25615622300134IGC

54
3.6.7 Inductively coupled plasma optical emission spectrometry technique
The Ni contents on the catalysts were determined using the Inductively coupled
plasma optical emission spectrometry (ICP-OES, OptimaTM 8300, PerkinElmer, USA,
Figure 3.12) to verify the same range of the Ni contents in each catalyst. The catalysts
were digested with 65 vol% HNO3 solution to obtain the Ni catalyst solutions using the
Microwave digestion technique. The Ni catalyst solutions were diluted 50 times with
deionized water to obtain the Ni contents in the catalyst solutions in the range of mg/L.
The Ni contents in the catalyst solutions were determined using the Multi-Element
Calibration Standard 2 (PerkinElmer Plus, USA), working range for Ni: 0.1–100 mg/L.
Figure 3.12: Inductively coupled plasma optical emission spectrometry.
Ref. code: 25615622300134IGC

55
3.6.8 Chemisorption techniques
The CO chemisorption by pulse injection technique using 10 vol% CO in He
(Linde Thailand Pub Co., Ltd.) was carried out to determine Ni surface area of the
catalysts using the Chemisorption catalyst analyzer (BELCAT-B, BEL Japan Inc.,
Japan), as shown in Figure 3.13.
Figure 3.13: Chemisorption catalyst analyzer.
Temperature Programmed Reduction with Hydrogen (H2-TPR) using 5 vol% H2 in Ar,
Temperature Programmed Desorption of NH3 (NH3-TPD) using 5 vol% NH3 in He, and
Temperature Programmed Desorption of CO2 (CO2-TPD) using pure CO2 were also
measured using the Chemisorption catalyst analyzer. Each catalyst was packed into a
quartz tube, then the quartz tube was attached in the instrument. The catalyst was
reduced with H2 gas at 600 °C for 30 min then cooled down to room temperature prior
to the measurements of NH3-TPD and CO2-TPD. The H2-TPR was applied to determine
the reduction temperatures of catalysts and to investigate the Ni-O interaction over the
supports. The acidic sites of reduced catalysts were calculated from the peak area of the
NH3-TPD profiles to investigate the NH3 adsorption step in the ammonia
decomposition mechanism. The basic sites of reduced catalysts were calculated from
the peak area of CO2-TPD profiles to investigate the basicity of reduced catalysts
towards the catalytic performance in ammonia decomposition. The details of the
chemisorption techniques are provided in Appendix-E.
Ref. code: 25615622300134IGC

56
Figure 3.14: Temperature programmed reactor and Mass Spectrometer.
The temperature Programmed Reaction of NH3 (NH3-TPRx) was conducted in
a temperature programmed reactor (Shimax Co., Ltd.) and using Mass Spectrometer
(GCMS-2010 Ultra, Shimadzu Corporation, Japan) as a detector, shown in Figure 3.14.
Each catalyst was packed into the quartz reactor then placed in the temperature
programmed reactor. The catalyst was reduced with 50 vol% H2 in Ar for 1 h, then the
reactor was cooled down to 100 °C. Pure NH3 gas was fed at 50 mL/min into the reactor
with the temperature programmed at 10 °C/min from 100–600 °C. The N2 formation
rate from the recombination of nitrogen adsorbates was determined using an online
Mass Spectrometer from a mass spectrum of N2 (M/Z = 28). The maximum N2
formation rate of Ni catalysts was obtained from the first derivative of MS profiles,
which indicate the N2 desorption temperature of each catalyst.
Ref. code: 25615622300134IGC

57
3.7 Determination of activation energy
Equation 1 indicates the power law model, where partial pressures of N2 does
not affect the reaction rate of NH3 decomposition (𝑟𝑁𝐻3) over Ni catalysts [12]. The
reaction rates were determined under 60 mL/min of the reactant with different NH3 and
H2 concentrations at 375–475 °C. The reaction rate constant (k) and the reaction rate
orders (a and b) in the power law model for NH3 decomposition were calculated via a
computer coding on MATLAB software (version R2016a). The codes were written to
perform the iterations for initial values of k, a, and b within a given range following the
error minimization method [78]. The error between the calculated reaction rates and the
experimental reaction rates was calculated at each iteration and the iterations sequence
was stopped when the least square error is less than a predefined tolerance. The k, a,
and b values at the last iteration were displayed as the optimal values. The k, a, and b
values at different reaction temperatures (375–475 °C) were calculated using the same
calculation procedure. The apparent activation energies (Ea) of NH3 decomposition
over the catalysts were calculated from the Arrhenius relationship between the reaction
rate constant (k) and the temperature (1/T), which can be described in equation 2–3
[12].
𝑟𝑁𝐻3 = 𝑘𝑃𝑁𝐻3𝑎 𝑃𝐻2
𝑏 Equation 1
𝑘 = 𝑘0𝑒−𝐸𝑎𝑅𝑇 Equation 2
𝑙𝑛 𝑘 = −𝐸𝑎
𝑅
1
𝑇+ 𝑐𝑜𝑛𝑠𝑡𝑎𝑛𝑡 Equation 3
Where 𝑃𝑁𝐻3 and 𝑃𝐻2 are the partial pressures of NH3 and H2, respectively, 𝑘0 is the
pre-exponential factor and R is the gas constant.
Ref. code: 25615622300134IGC

58
Chapter 4
Results and Discussion
4.1 Evaluation of Ni/Zr-doped Al2O3 catalysts in NH3 decomposition
The catalytic activities of Ni/Al2O3 catalysts in NH3 decomposition depend on
the properties of catalyst, i.e., Ni dispersion, surface acidity, and basicity. Supports play
an important role to improve these catalyst properties and promote the activities of the
Ni catalysts. Alumina in the forms of γ-Al2O3 and α-Al2O3 are generally used as
supports for Ni catalysts because γ-Al2O3 provides a high surface area for Ni deposition,
and α-Al2O3 provides a very high thermal stability for Ni catalysts. In this study, NH3
decomposition over Ni catalysts requires the high support surface area for the
improvement of Ni dispersion and no deformation at the high reaction temperature of
600–700 °C for high NH3 conversion. Modification of Al2O3 by the partial doping of
Zr in the Al2O3 framework can change the catalyst properties, such as surface acidity
and Ni-support interaction, which boost the catalyst activity and maintain the properties
of Al2O3 support. The Zr-doped Al2O3 supports were prepared to obtain the α-Al2O3
and γ-Al2O3 phases, separately, in each Zr-doped Al2O3 support. The catalytic activities
of Ni/Zr-doped Al2O3 catalysts were evaluated in comparison to Ni/α-Al2O3 and Ni/γ-
Al2O3 to investigate the enhanced activities of Ni catalysts by Zr doping for NH3
decomposition.
4.1.1 Preparation of Zr-doped Al2O3 supports and their properties
The crystal structure or phase of Al2O3 is a key parameter, which directly affects
to the surface area and thermal properties of Al2O3. The Al2O3 supports can be
synthesized in different phases by varying calcination temperatures of aluminum
hydroxide precursors. The γ-Al2O3 phase can be synthesized from the aluminum
hydroxide of Gibbsite, Boehmite, or Bayerite with the calcination temperature range
around 500–800 °C and 1100–1200 °C for α-Al2O3 phase [79]. In this study, the Zr-
doped Al2O3 support was also synthesized from the aluminum hydroxide precursor. An
initial phase of aluminum hydroxide of the support was investigated using the XRD
technique, as shown in Figure 4.1.
Ref. code: 25615622300134IGC

59
Figure 4.1: XRD pattern of Zr-doped Al2O3 precursor dried at 110 °C.
The XRD pattern of Zr-doped Al2O3 precursor shows that the initial phase of
aluminum hydroxide is Bayerite, which can form the Zr-doped Al2O3 in both γ-Al2O3
and α-Al2O3 phases. Thus, the Zr-doped Al2O3 precursors were calcined at 600, 800,
1100, and 1200 °C and characterized using the XRD technique to investigate the Al2O3
phase in each Zr-doped Al2O3 support after calcination. The XRD patterns of the Zr-
doped Al2O3 supports were compared with those of the γ-Al2O3 and α-Al2O3 supports
to evaluate the effect of calcination temperature to the structure of Zr-doped Al2O3.
Figure 4.2 shows the XRD patterns of the calcined Zr-doped Al2O3 supports at different
calcination temperatures.
Ref. code: 25615622300134IGC

60
Figure 4.2: XRD patterns of calcined Zr-doped Al2O3 supports; : γ-Al2O3;
: -Al2O3; : α-Al2O3; : tetragonal-ZrO2; : monoclinic-ZrO2.
From Figure 4.2, the XRD pattern of the Zr-doped Al2O3 calcined at 600 °C
shows an amorphous phase as majority of the support with a low crystallinity of γ-
Al2O3 phase. Calcination of the Zr-doped Al2O3 at 800 °C yields the γ-Al2O3 phase
(JCPDS: 10-0425, face center cubic structure) similar to the γ-Al2O3 support with a
presence of ZrO2 (JCPDS: 50-1089, tetragonal structure). For the Zr-doped Al2O3
calcined at 1100 °C, the γ-Al2O3 phase was transformed to -Al2O3 phase (JCPDS: 35-
0121, monoclinic structure) with higher crystallinity of the ZrO2 tetragonal structure.
Small amount of Baddeleyite ZrO2 (JCPDS: 37-1484, monoclinic structure) and
Corundum α-Al2O3 (JCPDS: 10-0173, hexagonal structure) were also observed in this
support. The α-Al2O3 phase was clearly observed in the XRD pattern of the Zr-doped
Al2O3 calcined at 1200 °C, which is similar to that of the α-Al2O3 support. Some of -
Al2O3 peaks were still observed in this XRD pattern as well as the tetragonal-ZrO2 and
monoclinic-ZrO2 were also observed at the calcination temperature of 1200 °C.
23 33 43 53 63 73
Norm
ali
zed
in
ten
sity
(a.u
.)
2-theta (degree)
Zr Al-800 °C
γ-Al2O
3
α-Al2O
3
Zr-Al-1100 °C
Zr-Al-1200 °C
Zr Al-600 °C
Ref. code: 25615622300134IGC

61
Therefore, the crystal structure of Al2O3 in the Zr-doped Al2O3 supports calcined at 800
and 1200 °C are similar to γ-Al2O3 and α-Al2O3 supports, respectively.
The surface area of the Zr-doped Al2O3 supports in this study were determined
and compared with that of the α-Al2O3 and γ-Al2O3 supports. Table 4.1 lists the values
of the surface area, pore volume, and average pore diameter.
Table 4.1: Physical properties of Al2O3 and Zr-doped Al2O3 supports.
Supports Surface area
(m2/g)
Pore volume
(cm3/g)
Average pore
diameter
(Å)
α-Al2O3 3.3 0.0035 43.3
γ-Al2O3 175.6 0.29 66.7
Zr-doped Al2O3-800 °C 145.1 0.29 81.1
Zr-doped Al2O3-1100 °C 44.2 0.22 195.9
Zr-doped Al2O3-1200 °C 15.4 0.07 183.0
The results show that a high calcination temperature of the supports yields low surface
area and pore volume of the supports. The Zr-doped Al2O3 calcined at 800 °C exhibits
the surface area and pore volume close to the γ-Al2O3 support while the surface area
and pore volume of the Zr-doped Al2O3 calcined at 1200 °C are close to those of the α-
Al2O3 support. Hence, the Zr-doped Al2O3 calcined at 800 and 1200 °C were used as
supports for Ni catalysts. The Ni catalysts activities using the Zr-doped Al2O3 calcined
at 800 and 1200 °C supports were investigated and compared to those of Ni over
conventional α-Al2O3 and γ-Al2O3 supports to evaluate the effect of support
modification by the partial doping of Zr in the Al2O3 framework.
Ref. code: 25615622300134IGC

62
4.1.2 Characterization of Ni/Zr-doped Al2O3
The Ni over Zr-doped Al2O3 catalyst, calcined at 800 and 1200 °C were
prepared by incipient wetness impregnation with 20 wt% of Ni loading. Calcination
temperature of the catalysts after the impregnation process is a crucial factor, where
high calcination temperatures can affect the size of Ni clusters on the supports. The
DSC technique was used to investigate the Ni nitrate precursor and urea promoter under
the calcination process with air to form NiO over the catalysts, as shown in Figure 4.3.
Evaluation of the calcination temperature of catalysts is required to ensure that none of
the nitrate, hydroxyl, and ammonium compounds remain after the calcination process.
Figure 4.3: DSC profiles of impregnated catalysts.
The DSC profiles show that the exothermic reaction of Ni nitrate precursor and urea
promoter in all catalysts occurred at around 280 °C, and a small peak was also observed
at around 380–400 °C for the Ni/α-Al2O3 catalyst. Based on the literature, the
calcination temperature at 500–600 °C is usually selected as the calcination temperature
of Ni catalysts [5, 7, 12, 44, 59]. Therefore, all catalysts in this study were calcined at
100 200 300 400 500 600
Norm
ali
zed
hea
t fl
ow
(a.u
.)
Temperature (°C)
↑ Exothermic
Ni/Zr-Al-800 °C
Ni/Zr-Al-1200 °C
Ni/γ-Al2O
3
Ni/α-Al2O
3
Ref. code: 25615622300134IGC

63
500 °C to get rid of any unwanted compounds and prevent the agglomeration of Ni
clusters after the calcination process.
The catalysts were then characterized using the XRD technique to identify the
phase of Ni and ensure that there are no remaining unwanted compounds in the catalysts
after the calcination process. Figure 4.4 shows the XRD patterns of the catalysts in this
section, which exhibit the same characteristic peaks of NiO phase (JCPDS: 71-1179,
cubic structure) on all supports. The same phase of NiO over these supports catalyzes
the same reaction mechanism of ammonia decomposition. In addition, the same range
of the support surface area and a similar crystal structure of Al2O3 could allow fair
comparison for all catalysts to study solely on the effect of the support surface area and
Zr doped in Al2O3 supports.
Figure 4.4: XRD patterns of catalysts over Al2O3 and Zr-doped Al2O3 supports.
Ni/Zr-Al-1200 °C
Ni/α-Al2O
3
23 33 43 53 63 73
Norm
ali
zed
in
ten
sity
(a.u
.)
2-theta (degree)
Ni/γ-Al2O
3
Ni/Zr-Al-800 °C
= NiO
Ref. code: 25615622300134IGC

64
Incipient wetness impregnation was used to prepare the catalysts in this study.
The catalysts after the impregnation process were investigated the Ni clusters on the
support using the SEM-EDS technique. The Ni/α-Al2O3, a non-porous support, was
used as a representative catalyst for surface investigation to clearly observe the
distribution of Ni clusters on the support, as shown in Figure 4.5.
Figure 4.5: SEM image and EDS profile of Ni/α-Al2O3 catalyst.
The SEM-EDS image shows the distribution of NiO clusters over the α-Al2O3 support,
which are confirmed by the Ni peaks in the EDS profile of small clusters on the sheets
of α-Al2O3. This can be pointed out that the incipient wetness impregnation method can
serve as the facile method for catalyst preparation in this study.
Ref. code: 25615622300134IGC

65
4.1.3 Activities of Ni/Zr-doped Al2O3 for H2 production from NH3 decomposition
The performance of catalysts in NH3 decomposition were evaluated at 500 and
550 °C in the continuous mode, and the activities of the catalysts are listed in
Table 4.2. The performance of catalysts was compared in terms of NH3 conversion and
the H2 formation rate to evaluate the effect of Zr doped in Al2O3 and support surface
area towards the Ni catalysts activities.
Table 4.2: Catalytic activities of Ni over Al2O3 and Zr-doped Al2O3 supports.
Catalysts
NH3 conversion
(%)
H2 formation rate
(µmol/min·gcat)
500 °C 550 °C 500 °C 550 °C
Ni/α-Al2O3 22.3 ± 0.5 43.2 ± 0.7 1593 ± 21 2949 ± 27
Ni/Zr-doped Al2O3
(Calcined at 1200 °C) 33.8 ± 0.7 64.3 ± 0.4 2239 ± 51 4209 ± 8
Ni/γ-Al2O3 28.4 ± 0.2 59.2 ± 0.2 2019 ± 11 3982 ± 16
Ni/Zr-doped Al2O3
(Calcined at 800 °C) 48.8 ± 0.3 87.0 ± 0.3 3341 ± 18 5836 ± 18
Ni/γ-Al2O3
(Zr as promoter) 28.3 ± 0.1 58.3 ± 0.1 2005 ± 10 3904 ± 10
The Ni/γ-Al2O3 catalyst exhibits higher catalytic activities than Ni/α-Al2O3, and the
Ni/Zr-doped Al2O3-800 °C catalyst also exhibits higher catalytic activities than the
Ni/Zr-doped Al2O3-1200 °C. The results point out that a larger surface area of support
can increase the catalyst activity. At the same range of support surface area, Zr doped
in the Al2O3 frameworks can increase the catalyst activities, evidenced by higher
activities of Ni/Zr-doped Al2O3 catalysts than those of the Ni/Al2O3 catalysts. In
addition, the use of Zr as the promoter in Ni catalyst was investigated and compared
with the use of Zr as the dopant in Ni catalysts. The activities of Ni/γ-Al2O3 with and
without Zr promoter in Table 4.2 exhibit insignificant differences among catalytic
activities. Therefore, introduction of Zr as a dopant in the Al2O3 framework is more
favorable to improve the Ni catalyst activity for H2 production from NH3 decomposition
than using as a promoter.
Ref. code: 25615622300134IGC
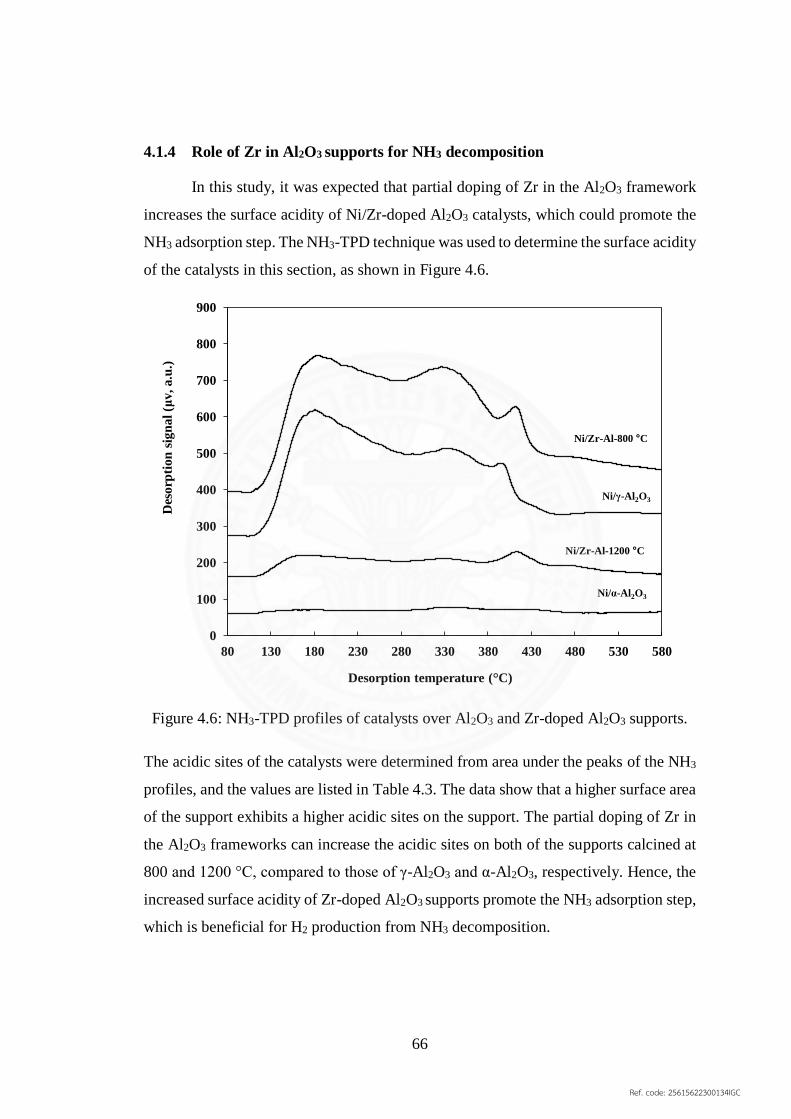
66
4.1.4 Role of Zr in Al2O3 supports for NH3 decomposition
In this study, it was expected that partial doping of Zr in the Al2O3 framework
increases the surface acidity of Ni/Zr-doped Al2O3 catalysts, which could promote the
NH3 adsorption step. The NH3-TPD technique was used to determine the surface acidity
of the catalysts in this section, as shown in Figure 4.6.
Figure 4.6: NH3-TPD profiles of catalysts over Al2O3 and Zr-doped Al2O3 supports.
The acidic sites of the catalysts were determined from area under the peaks of the NH3
profiles, and the values are listed in Table 4.3. The data show that a higher surface area
of the support exhibits a higher acidic sites on the support. The partial doping of Zr in
the Al2O3 frameworks can increase the acidic sites on both of the supports calcined at
800 and 1200 °C, compared to those of γ-Al2O3 and α-Al2O3, respectively. Hence, the
increased surface acidity of Zr-doped Al2O3 supports promote the NH3 adsorption step,
which is beneficial for H2 production from NH3 decomposition.
0
100
200
300
400
500
600
700
800
900
80 130 180 230 280 330 380 430 480 530 580
Des
orp
tion
sig
nal
(μv, a.u
.)
Desorption temperature (°C)
Ni/γ-Al2O3
Ni/Zr-Al-800 °C
Ni/Zr-Al-1200 °C
Ni/α-Al2O3
Ref. code: 25615622300134IGC

67
Table 4.3: Surface acidity of catalysts over Al2O3 and Zr-doped Al2O3 supports.
Catalysts Acidic sites
(µmol/gcat)
Ni/α-Al2O3 11
Ni/Zr-doped Al2O3-1200 °C 55
Ni/γ-Al2O3 210
Ni/Zr-doped Al2O3-800 °C 251
The CO chemisorption technique was utilized to evaluate the effect of Zr doped
in the Al2O3 framework to Ni dispersion and the Ni surface area of the catalyst.
Figure 4.7 shows the CO-pulse profiles of the Ni catalysts in this section. The
adsorption volume of CO on each catalyst was determined from the CO-pulse profiles
to calculate Ni dispersion and the Ni surface area of each catalyst, and the values are
listed in Table 4.4.
Figure 4.7: CO-pulse profiles of catalysts over Al2O3 and Zr-doped Al2O3 supports.
0 200 400 600 800 1000 1200 1400
Norm
ali
zed
CO
sig
nal
from
TC
D (
a.u
.)
Time (sec)
Ni/Zr-doped Al2O3-800 C
Ni/γ-Al2O3
Ni/Zr-doped Al2O3-1200 C
Ni/α-Al2O3
Ref. code: 25615622300134IGC

68
Table 4.4: Ni dispersion of catalysts over Al2O3 and Zr-doped Al2O3 supports.
Catalysts
Ni
dispersion
(%)
Ni surface area
(m2/g of Ni)
Low surface
area
Ni/Zr-dopedAl2O3
(1200 °C) 1.4 9.6
Ni/α-Al2O3 0.3 2.1
High surface
area
Ni/Zr-dopedAl2O3
(800 °C) 3.3 22.0
Ni/γ-Al2O3 1.6 10.5
Ni/γ-Al2O3
(Zr as promoter) 1.4 9.53
Table 4.4 show that Ni dispersion on the catalysts can be enhanced by partial doping of
Zr in the Al2O3 frameworks. The Ni/Zr-doped Al2O3 catalysts, calcined at 800 and
1200 °C exhibit higher Ni dispersions and Ni surface areas than those of Ni/γ-Al2O3
and Ni/α-Al2O3, respectively. In addition, the use of Zr as promoter in Ni/γ-Al2O3
catalyst cannot enhance its Ni dispersion and Ni surface area, compared to Ni/γ-Al2O3
without Zr promoter. Therefore, the roles of Zr as a dopant in this study are as follows;
1) increasing the surface acidity of Ni catalyst, which promotes the NH3 adsorption
step; 2) improvement of Ni dispersion, which promotes the dehydrogenation step. The
activity data in Table 4.2 correspond to these statements, since the Ni/Zr-doped Al2O3-
800 °C exhibits the highest catalytic activities among the catalysts in this section.
The results from section 4.1 show that the partial doping of different valencies
and ionic sizes of Zr4+ can increase the Ni catalyst activities, compared to Al3+ in the
Al2O3 framework. The effect of valences and ionic sizes of different dopants were also
studied in section 4.2 to investigate the roles of dopants in the Ni catalyst activities for
NH3 decomposition.
Ref. code: 25615622300134IGC

69
4.2 Effect of valency and ionic size of dopant in Al2O3 support toward Ni
catalyzed NH3 decomposition
In section 4.1, it was discovered that doping of Zr4+ in the Al2O3 framework
enhanced the activity of the Ni/Zr-doped Al2O3 catalyst by increasing Ni dispersion and
acidic sites of the catalyst. Sr2+ and Y3+, from the same period of Zr4+, were also selected
to use as the dopants in this section. The same range of ionic sizes in Sr2+ (170 pm), Y3+
(160 pm), and Zr4+ (160 pm) were doped in the Al2O3 frameworks to investigate the
effect of dopant valency on the Ni catalyst activity [16]. In addition, Ce4+ (200 pm) with
a larger ionic size, compared to Zr4+ (160 pm) was also doped in the Al2O3 framework
to investigate the effect of dopant ionic size on the Ni catalyst activity [16]. The amount
of all dopants in this section were kept at 5 mol% equal to that of the Zr doped Al2O3
in section 4.1. In addition some Al3+ can also be doped in a segregated phase of each
dopant (SrO, Y2O3, ZrO2, and CeO2) when it is present in the crystalline form. The
reaction of this doping may be written using the Kröger-Vink notation (Appendix F) as
follows [80].
2𝑆𝑟𝑂𝐴𝑙2𝑂3→ 2𝑆𝑟𝐴𝑙
′ + 𝑉𝑂∙∙ + 2𝑂𝑂
𝑥 𝑜𝑟 𝐴𝑙2𝑂3𝑆𝑟𝑂→ 2𝐴𝑙𝑆𝑟
∙ + 𝑂𝑖′′ + 2𝑂𝑂
𝑥
𝑌2𝑂3𝐴𝑙2𝑂3→ 2𝑌𝐴𝑙
𝑥 + 3𝑂𝑂𝑥 𝑜𝑟 𝐴𝑙2𝑂3
𝑌2𝑂3→ 2𝐴𝑙𝑌
𝑥 + 3𝑂𝑂𝑥
2𝑍𝑟𝑂2𝐴𝑙2𝑂3→ 2𝑍𝑟𝐴𝑙
∙ + 𝑂𝑖′′ + 3𝑂𝑂
𝑥 𝑜𝑟 𝐴𝑙2𝑂3𝑍𝑟𝑂2→ 2𝐴𝑙𝑍𝑟
′ + 𝑉𝑂∙∙ + 2𝑂𝑂
𝑥
2𝐶𝑒𝑂2𝐴𝑙2𝑂3→ 2𝐶𝑒𝐴𝑙
∙ + 𝑂𝑖′′ + 3𝑂𝑂
𝑥 𝑜𝑟 𝐴𝑙2𝑂3𝐶𝑒𝑂2→ 2𝐴𝑙𝐶𝑒
′ + 𝑉𝑂∙∙ + 2𝑂𝑂
𝑥
The oxygen vacancy and oxygen interstitial in the doped Al2O3 supports can alter their
electronic properties and change interaction of Ni on each doped Al2O3. The doping of
Sr, Y, Zr, or Ce in the Al2O3 frameworks was investigated using the XRD and XANES
techniques in section 4.2.1. The differences in Ni-support interactions were evaluated
using the H2-TPR technique. The change in Ni-support interactions affects the
properties of catalysts, resulting in the enhancement of activities for Ni/doped Al2O3
catalysts in section 4.23
Ref. code: 25615622300134IGC

70
4.2.1 Partial doping of Sr, Y, Zr, or Ce into Al2O3 frameworks and their
properties
From section 4.1, the Ni catalyst activity partially depends on the support
surface area. Thus, the doped supports in this section were calcined at 800 °C to obtain
a high surface area of the γ-Al2O3 phase. The macrostructure of supports were evaluated
from the XRD patterns to investigate the replacement and/or insertion of dopants into
the Al2O3 frameworks. Figure 4.8 shows the XRD patterns and peak assignment of the
γ-Al2O3 and doped Al2O3 supports in this section. The commercial γ-Al2O3 shows two
crystal structures, i.e., face center cubic (JCPDS: 10-0425, 2-theta about 37°, 40°, 46°
and 67°) and simple cubic structure (JCPDS: 04-0880, 2-theta about 37°, 40°, 43°, 46°
and 67°). The doped Al2O3 supports show different diffractograms from the γ-Al2O3.
Absence of the simple cubic structure peak at 43° indicates that there are only face
center cubic structures in the doped Al2O3 supports. The different intensity ratio of the
doped Al2O3 supports and γ-Al2O3 indicates different compositions of the face center
and simple cubic structures on the supports. A segregated ZrO2, tetragonal structure
(JCPDS: 50-1089) and segregated CeO2, face center cubic structure (JCPDS: 43-1002),
were observed in the XRD pattern of Zr-doped Al2O3 and Ce-doped Al2O3,
respectively. Segregated phases of SrO and Y2O3 were not observed in the XRD pattern
of Sr-doped Al2O3 and Y-doped Al2O3, respectively. However, they may be present in
an amorphous form, which cannot be detected by the XRD technique.
Ref. code: 25615622300134IGC

71
Figure 4.8: XRD patterns of supports, : face center cubic-Al2O3; : simple cubic-
Al2O3; : tetragonal-ZrO2; ▲: face center cubic-CeO2.
Table 4.5: Physical properties of supports.
Supports
Surface
area
(m2/g)
Pore
volume
(cm3/g)
Average pore
diameter
(Å)
Lattice constant
(Å)
a
γ-Al2O3 176 0.29 66.7 7.8856
Sr-doped Al2O3 172 0.39 91.7 7.9264
Y-doped Al2O3 167 0.39 92.8 7.9206
Zr-doped Al2O3 145 0.29 81.1 7.9189
Ce-doped Al2O3 146 0.34 93.7 7.9302
In addition, the XRD patterns were used to determine the lattice constants of γ-Al2O3
and doped Al2O3 supports, to evaluate the changes in unit cells of Al2O3 in the supports.
Table 4.5 shows a larger lattice constant of the Al2O3 structure in the doped Al2O3
Ref. code: 25615622300134IGC
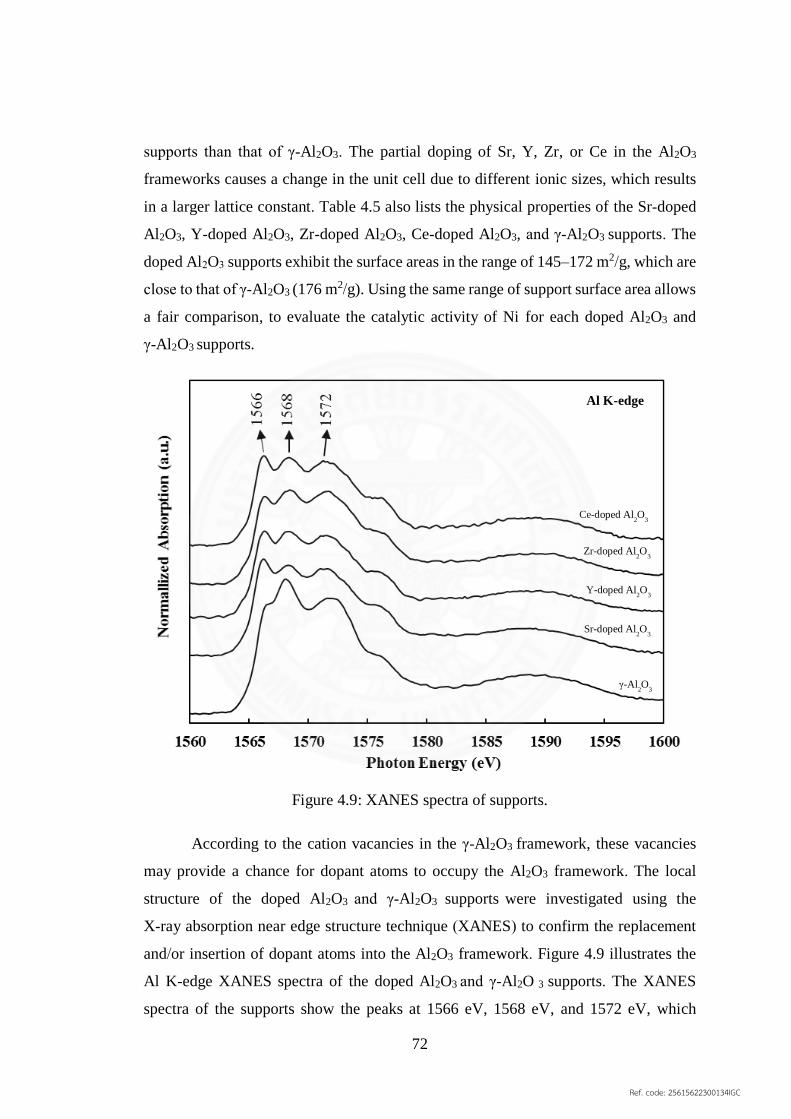
72
supports than that of γ-Al2O3. The partial doping of Sr, Y, Zr, or Ce in the Al2O3
frameworks causes a change in the unit cell due to different ionic sizes, which results
in a larger lattice constant. Table 4.5 also lists the physical properties of the Sr-doped
Al2O3, Y-doped Al2O3, Zr-doped Al2O3, Ce-doped Al2O3, and γ-Al2O3 supports. The
doped Al2O3 supports exhibit the surface areas in the range of 145–172 m2/g, which are
close to that of γ-Al2O3 (176 m2/g). Using the same range of support surface area allows
a fair comparison, to evaluate the catalytic activity of Ni for each doped Al2O3 and
γ-Al2O3 supports.
Figure 4.9: XANES spectra of supports.
According to the cation vacancies in the γ-Al2O3 framework, these vacancies
may provide a chance for dopant atoms to occupy the Al2O3 framework. The local
structure of the doped Al2O3 and γ-Al2O3 supports were investigated using the
X-ray absorption near edge structure technique (XANES) to confirm the replacement
and/or insertion of dopant atoms into the Al2O3 framework. Figure 4.9 illustrates the
Al K-edge XANES spectra of the doped Al2O3 and γ-Al2O 3 supports. The XANES
spectra of the supports show the peaks at 1566 eV, 1568 eV, and 1572 eV, which
γ-Al2O
3
Al K-edge
Sr-doped Al2O
3
Y-doped Al2O
3
Zr-doped Al2O
3
Ce-doped Al2O
3
Ref. code: 25615622300134IGC

73
correspond to the electrons transition from the 1s to antibonding a1g (s-like) state, 1s to
antibonding t1u (p-like) state, and 1s to t2g (d-like) state, respectively [81]. The relative
intensity of these peaks corresponds to the neighboring atoms around the Al atoms in
the Al2O3 framework. The peak intensity at 1566 eV relates to the local symmetry of
Al, which is influenced by the distortion of the octahedral sites in the Al2O3 framework,
where the dopant atoms could occupy the cation vacancies. This result agrees well with
the computational results, which reported that the cation vacancies in octahedral sites
of the Al2O3 framework have the lowest total energy [65, 82, 83]. The peak intensity at
1568 eV represents the electron transition from 1s to unoccupied valence in p-state
called white line. The peak intensity at 1572 eV is contributed by the multiple scattering
from the distant atomic shells called the symmetry-forbidden shape resonance [84, 85].
The XANES spectrum of γ-Al2O3 shows the highest peak at 1568 eV, which is different
from the doped Al2O3 supports. The differences in the relative peak intensities indicate
that the neighboring atoms are different around the Al atoms in the doped Al2O3
supports, compared to the γ-Al2O3 support. This shows that the doped Al2O3 supports
contain the doped atoms inside the Al2O3 frameworks, which may cause defect
formation in terms of oxygen vacancies in the doped Al2O3 supports. The oxygen
vacancies in the doped Al2O3 supports can alter their electronic properties, resulting in
different Ni-support interactions between the Ni/doped Al2O3 and the Ni/γ-Al2O3
catalysts. Therefore, the results of the lattice constant from the XRD measurements and
the local structure from the XANES measurements confirm the partial doping of Sr, Y,
Zr, or Ce in the Al2O3 frameworks in this study.
Ref. code: 25615622300134IGC

74
4.2.2 Evaluation of Ni-support interaction and crystal structure of Ni catalysts
The Ni catalysts were prepared by incipient wetness impregnation and calcined
at 500 °C, which is the same procedure as the catalysts reported in section 4.1. The
Hydrogen temperature programmed reduction technique (H2-TPR) was used to
determine the reduction temperatures of catalysts. Different reduction temperatures of
the catalysts show that different energies are required to reduce NiO to Ni0, which can
be used to investigate the differences of Ni-support interactions among the catalysts in
this section. Figure 4.10 shows the H2-TPR profiles of Ni/γ-Al2O3, Ni/Sr-doped Al2O3,
Ni/Y-doped Al2O3, Ni/Zr-doped Al2O3, and Ni/Ce-doped Al2O3 catalysts.
Figure 4.10: H2-TPR profiles of catalysts.
Figure 4.10 shows that the Ni/γ-Al2O3 exhibits a single major peak of H2
consumption at 570 °C. The Ni/doped Al2O3 catalysts exhibit two major peaks of H2
consumption at 420 °C and 590 °C (570 °C for the Ni/Y-doped Al2O3), which
correspond to the weak and strong interactions of the O to Ni active sites on the
supports, respectively. The different valencies of dopants (Sr2+, Zr4+, and Ce4+) in the
Al2O3 frameworks yield a higher peak intensity at 420 °C than Y3+, which the same
Ref. code: 25615622300134IGC

75
valency as native Al3+ in the Al2O3 framework. Higher peak intensities at 420 °C for
the catalysts imply higher amounts of the weak interactions of O to Ni active sites on
these supports, which were reduced easily to Ni0. Therefore, the differences in H2-TPR
profiles of these catalysts indicate different Ni-support interactions for the Ni/doped
Al2O3 and Ni/γ-Al2O3 catalysts in this study. This phenomenon may come from the
concept of oxygen vacancy sites [70] and the theory of bond-order conservation in an
A-B-C system [74], as shown in Figure 4.11.
Figure 4.11: Ni-O interaction over regular site and oxygen vacancy site.
The partial doping of Sr, Y, Zr, or Ce in the Al2O3 frameworks cause defect
formations in terms of oxygen vacancies in the doped Al2O3 supports. The defects in
the doped Al2O3 supports lead to the changes in support properties, resulted in different
Ni-support interactions between the Ni/doped Al2O3 and the Ni/γ-Al2O3 catalysts. The
oxygen vacancy is caused by the loss of an oxygen atom in a crystal lattice of support
and provides two trapped electrons on the site. These trapped electrons can be
Ref. code: 25615622300134IGC

76
transferred to the Ni site, which increase the electron density of the Ni site. The high
electron density at Ni site facilitates reduction of NiO to be Ni0, which partly lower the
reduction temperature of Ni/doped Al2O3 catalysts, compared to that of Ni/γ-Al2O3.
Another theory to support this phenomenon is the theory of bond order conservation in
an A-B-C system [74]. The strengthening bond of Ni over defective support results in
the weakening bond of adsorbed species on Ni relative to that of Ni over regular
support.
Figure 4.12: XRD patterns of catalysts, : NiO; : Ni; : γ-Al2O3; : ZrO2; :
CeO2; : CeAlO3.
Figure 4.12 shows the XRD patterns of the Ni catalysts before and after
reduction at 600 °C for 1 h, to identify the Ni crystal structure of catalysts. The calcined
catalysts show the peaks of NiO, cubic structure (JCPDS: 71-1179, 2-theta about 37°,
Ref. code: 25615622300134IGC

77
43°, and 63°). After reduction, the XRD patterns of the reduced catalysts exhibit the
same crystal structure of Ni, a cubic structure (JCPDS: 04-0850, 2-theta about 44°, 52°,
and 76°) without any characteristic peaks of NiO. The results indicate that a reduction
temperature of 600 °C is sufficient to reduce the Ni catalysts in this study. There is no
change in the Ni cubic structure over each support. In addition, the crystal structure of
each support in the reduced catalysts is similar to that of each support in the calcined
catalysts, which indicates that there is no support deformation after reduction at 600 °C.
Figure 4.12 also shows the XRD patterns of the Ni catalysts after H2-TPR
measurements, to investigate the crystal structure of Ni. The catalysts after H2-TPR
exhibit the same characteristic peaks of Ni as in the reduced catalysts at 600 °C, which
correspond to the cubic structure of Ni (JCPDS: 04-0850). The results show that there
is only one Ni structure available in the catalysts, even when the catalysts were reduced
at a higher temperature of 900 °C. The XRD patterns also show that the characteristic
peaks of Al2O3 in the catalysts remain almost the same after H2-TPR at 900 °C, as
evidenced by the major peak of Al2O3 about 67°. However, the segregated CeO2 in the
Ni/Ce-doped Al2O3 was transformed to CeAlO3 (JCPDS: 48-0051, 2-theta about 24°,
34°, 41°, 48°, and 60°) after H2-TPR measurement at 900 °C. The results imply that all
catalysts in this study can be used under the reaction temperature up to 900 °C without
support deformation, except the Ni/Ce-doped Al2O3. Therefore, the differences in the
H2-TPR profiles of catalysts imply different interactions of Ni over each support,
resulting from partial doping of Sr, Y, Zr, or Ce in the Al2O3 frameworks in this section.
Ref. code: 25615622300134IGC

78
4.2.3 Ni active sites for activity and stability in NH3 decomposition
The Ni catalysts in this section were prepared by incipient wetness impregnation
using the same 20 wt% of Ni loading. The Ni contents of catalysts were determined by
the ICP-OES technique, as shown in Table 4.6. The results show the same range of Ni
contents in each catalyst (from 19.61–21.69 wt%). This ensures that the evaluation of
Ni catalysts ativities is based on the same Ni mass basis in this section.
Table 4.6: Ni contents of catalysts.
Catalysts Ni contents[a] Catalyst weight[b] Ni contents
mg/L mg wt%
Ni/γ-Al2O3 10.18 ± 0.05 50.2 20.28 ± 0.11
Ni/Sr-doped Al2O3 9.84 ± 0.06 49.8 19.76 ± 0.12
Ni/Y-doped Al2O3 10.66 ± 0.09 50.1 21.28 ± 0.19
Ni/Zr-doped Al2O3 9.75 ± 0.10 49.7 19.61 ± 0.20
Ni/Ce-doped Al2O3 10.91 ± 0.09 50.3 21.69 ± 0.18
[a] determined from ICP-OES, [b] weight of catalyst used in the digestion process
Table 4.7: NH3 conversion of Ni catalysts.
Catalysts NH3 conversion (%)
500 °C 550 °C 575 °C 600 °C
Ni/γ-Al2O3 28.4 ± 0.2 59.2 ± 0.2 76.6 ± 0.3 90.3 ± 0.3
Ni/Sr-doped Al2O3 45.4 ± 0.1 84.4 ± 0.3 93.1 ± 0.3 96.7 ± 0.3
Ni/Y-doped Al2O3 42.6 ± 0.3 79.2 ± 0.4 91.1 ± 0.4 95.0 ± 0.2
Ni/Zr-doped Al2O3 48.8 ± 0.3 87.0 ± 0.3 96.3 ± 0.1 98.9 ± 0.1
Ni/Ce-doped Al2O3 53.0 ± 0.3 89.9 ± 0.4 97.0 ± 0.2 99.0 ± 0.3
Ref. code: 25615622300134IGC

79
The catalytic activities of NH3 decomposition over the Ni catalysts were studied
at 500–600 °C, 1 atm in the continuous mode.
Table 4.7 lists the NH3 conversion using the catalysts in this section. The
Ni/doped Al2O3 catalysts exhibit higher NH3 conversion than that of the Ni/γ-Al2O3 at
all reaction temperatures. Dopants with different valencies compared to Al3+ (Sr2+, Zr4+,
and Ce4+) exhibit higher NH3 conversion than the dopant with the same valency (Y3+).
The dopants with higher valencies (Zr4+ and Ce4+) can enhance the Ni catalysts
activities better than that of the dopant with a lower valency (Sr2+). The dopant with a
larger ionic size (Ce-doped in Al2O3) exhibits higher NH3 conversion than a smaller
dopant (Zr-doped in Al2O3) with the same valency. High NH3 conversion can be
achieved at 575 °C on Ni/Zr-doped Al2O3 (96.3 %) and Ni/Ce-doped Al2O3 (97.0 %),
which correspond to a H2 production rate of 6453 and 6520 μmol/min·gcat, respectively,
as shown in Table 4.8. Thus, the partial doping of Sr, Y, Zr, or Ce in the Al2O3
frameworks can enhance the Ni catalysts activities for ammonia decomposition.
Table 4.8: H2 formation rate of Ni catalysts.
Catalysts H2 formation rate (μmol/min·gcat)
500 °C 550 °C 575 °C 600 °C
Ni/γ-Al2O3 2,019 ± 11 3,982 ± 16 5,155 ± 52 6,051 ± 36
Ni/Sr-doped Al2O3 3,125 ± 9 5,696 ± 30 6,289 ± 34 6,556 ± 29
Ni/Y-doped Al2O3 2,916 ± 40 5,308 ± 24 6,081 ± 22 6,411 ± 27
Ni/Zr-doped Al2O3 3,341 ± 18 5,836 ± 18 6,453 ± 44 6,656 ± 6
Ni/Ce-doped Al2O3 3,659 ± 5 6,027 ± 42 6,520 ± 27 6,657 ± 58
The number of Ni active sites plays a key role in catalyzed NH3 decomposition.
The reduced catalysts were evaluated for their Ni surface area using the CO pulse
technique. The values of the Ni surface area are listed in Table 4.9.
Ref. code: 25615622300134IGC
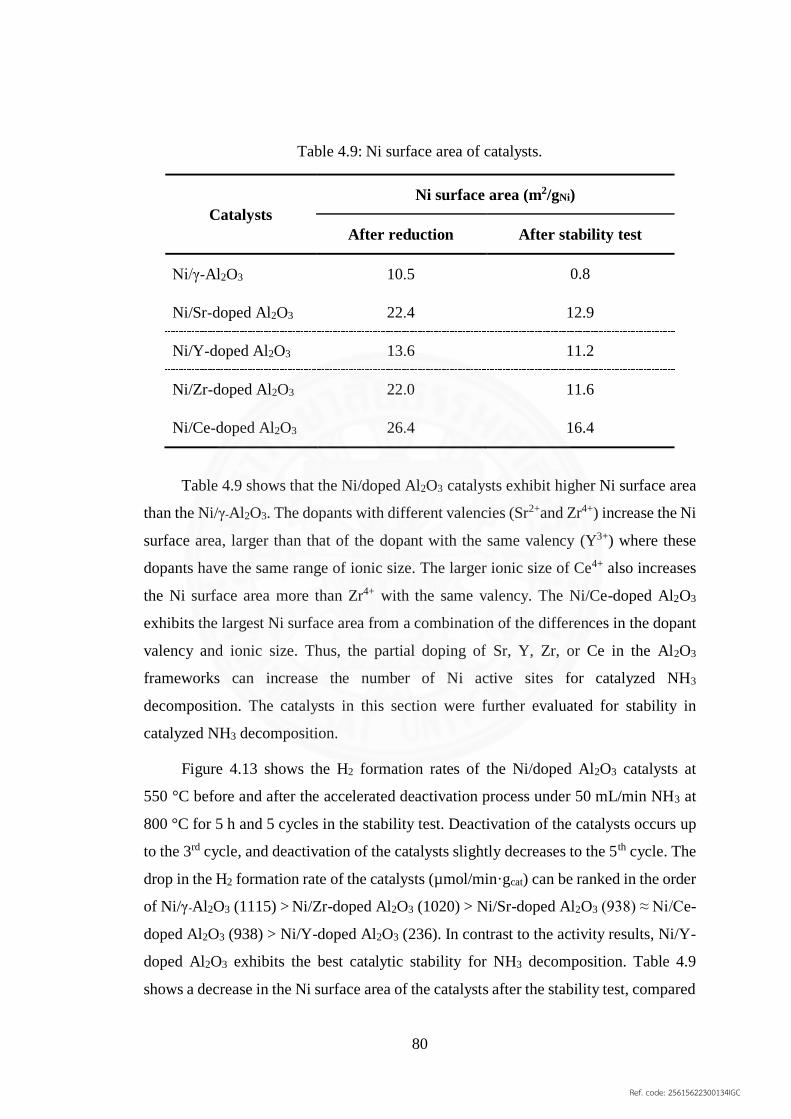
80
Table 4.9: Ni surface area of catalysts.
Catalysts
Ni surface area (m2/gNi)
After reduction After stability test
Ni/γ-Al2O3 10.5 0.8
Ni/Sr-doped Al2O3 22.4 12.9
Ni/Y-doped Al2O3 13.6 11.2
Ni/Zr-doped Al2O3 22.0 11.6
Ni/Ce-doped Al2O3 26.4 16.4
Table 4.9 shows that the Ni/doped Al2O3 catalysts exhibit higher Ni surface area
than the Ni/γ-Al2O3. The dopants with different valencies (Sr2+and Zr4+) increase the Ni
surface area, larger than that of the dopant with the same valency (Y3+) where these
dopants have the same range of ionic size. The larger ionic size of Ce4+ also increases
the Ni surface area more than Zr4+ with the same valency. The Ni/Ce-doped Al2O3
exhibits the largest Ni surface area from a combination of the differences in the dopant
valency and ionic size. Thus, the partial doping of Sr, Y, Zr, or Ce in the Al2O3
frameworks can increase the number of Ni active sites for catalyzed NH3
decomposition. The catalysts in this section were further evaluated for stability in
catalyzed NH3 decomposition.
Figure 4.13 shows the H2 formation rates of the Ni/doped Al2O3 catalysts at
550 °C before and after the accelerated deactivation process under 50 mL/min NH3 at
800 °C for 5 h and 5 cycles in the stability test. Deactivation of the catalysts occurs up
to the 3rd cycle, and deactivation of the catalysts slightly decreases to the 5th cycle. The
drop in the H2 formation rate of the catalysts (µmol/min·gcat) can be ranked in the order
of Ni/γ-Al2O3 (1115) > Ni/Zr-doped Al2O3 (1020) > Ni/Sr-doped Al2O3 (938) ≈ Ni/Ce-
doped Al2O3 (938) > Ni/Y-doped Al2O3 (236). In contrast to the activity results, Ni/Y-
doped Al2O3 exhibits the best catalytic stability for NH3 decomposition. Table 4.9
shows a decrease in the Ni surface area of the catalysts after the stability test, compared
Ref. code: 25615622300134IGC

81
to that of the catalysts after reduction. The decrease in the Ni surface area after the
stability test of Ni/Y-doped Al2O3 is only 2.4 m2/gNi, which is lower than that of Ni/γ-
Al2O3 (9.7 m2/gNi) Ni/Sr-doped Al2O3 (9.5 m2/gNi), Ni/Zr-doped Al2O3 (10.4 m2/gNi),
and Ni/Ce-doped Al2O3 (10.0 m2/gNi). The results show that partial doping of the dopant
with same valency (Y3+) in the Al2O3 framework for the Ni catalyst prevents the
agglomeration of Ni active sites at high reaction temperatures, which enhances the
catalytic stability better than that of different valencies (Sr2+, Zr4+, and Ce4+) in the
Al2O3 frameworks for Ni catalysts. The catalyst activity and stability results can lead
to the development of a new active Ni catalyst with high catalytic stability for NH3
decomposition.
Figure 4.13: Stability test of Ni catalysts, : Ni/γ-Al2O3; : Ni/Sr-doped Al2O3; :
Ni/Y-doped Al2O3; : Ni/Zr-doped Al2O3; : Ni/Ce-doped Al2O3.
Ref. code: 25615622300134IGC

82
4.2.4 Evaluation of activation energy of NH3 decomposition
Figure 4.14 shows the Arrhenius plots of NH3 decomposition over the Ni/γ-
Al2O3 and Ni/doped Al2O3 catalysts and lists the apparent activation energies of the
reaction (Ea) in this section. The Ni/doped Al2O3 catalysts have a significant decrease
of the apparent activation energies, compared to the Ni/γ-Al2O3. The apparent activation
energies can be ranked as Ni/Ce-doped Al2O3 ≈ Ni/Zr-doped Al2O3 < Ni/Sr-doped Al2O3
≈ Ni/Y-doped Al2O3 < Ni/γ-Al2O3. The Ea values of each catalyst agree well with the
catalytic activity ranking in Table 4.7. Figure 4.15 shows a good correlation between
the experimental and calculated reaction rates. This validates the reliability of the
kinetics parameters in this section. Therefore, the partial doping of Sr, Y, Zr, or Ce in
the Al2O3 frameworks facilitates the improvements of the catalytic activities over Ni
catalysts.
Figure 4.14: Arrhenius plots of catalysts.
Ref. code: 25615622300134IGC

83
Figure 4.15: Correlation between experimental and calculated reaction rates, : Ni/γ-
Al2O3; : Ni/Sr-doped Al2O3; : Ni/Y-doped Al2O3; : Ni/Zr-doped Al2O3; :
Ni/Ce-doped Al2O3.
Ref. code: 25615622300134IGC

84
4.2.5 Role of dopants in Al2O3 frameworks in reaction mechanism and rate-
determining steps of NH3 decomposition
According to the existing studies, NH3 decomposition consists of three major
steps in the reaction mechanism, i.e., adsorption, surface reaction, and desorption, as
indicated in steps (I) to (VI) in Figure 4.16 [12]:
Figure 4.16: Ammonia decomposition mechanisms.
The literature reported that either step (II) or step (VI) or both steps could be the
rate-determining steps in NH3 decomposition [12, 27]. Evaluation of step (II) or step
(VI) of the reaction mechanism is required to understand the role of the dopants in the
Al2O3 supports that can affect the activation energy in this section. There are many
factors that can alter the activation energy, including Ni dispersion, acidic sites, and
basic sites evaluated from CO chemisorption, NH3-TPD, and CO2-TPD results,
respectively, as listed in Table 4.10. The Ni dispersion values were calculated from the
same data of CO adsorption as the Ni surface area values in Table 4.9. The first possible
rate-determining step, i.e., dehydrogenation of NH3 in step (II), depends on the number
of NH3 adsorbates and the number of available Ni active sites. This step is related to Ni
dispersion over the support and acidic sites of the catalyst to promote NH3
dehydrogenation. According to the oxygen vacancies in a defective support act as
nucleation centers for the growth of the metal clusters on the support. In this study, Ni
Ref. code: 25615622300134IGC

85
dispersion of the Ni/doped Al2O3 catalysts were increased, compared to those of Ni/γ-
Al2O3, as evidenced in Figure 4.17 and Table 4.10. The increase of Ni dispersion
improved NH3 conversion, accordingly.
Figure 4.17: CO chemisorption profiles of catalysts.
Table 4.10: Characteristic properties of reduced catalysts with NH3 conversion.
Catalysts Ni
dispersion (%)
Acidic
sites (µmol/gcat)
Basic
sites (µmol/gcat)
NH3 conversion
at 550 °C (%)
Ni/γ-Al2O3 1.6 210 41 59.2 ± 0.2
Ni/Sr-doped Al2O3 3.4 209 105 84.4 ± 0.3
Ni/Y-doped Al2O3 2.0 209 67 79.2 ± 0.4
Ni/Zr-doped Al2O3 3.3 251 49 87.0 ± 0.3
Ni/Ce-doped Al2O3 4.0 212 67 89.9 ± 0.4
0 200 400 600 800 1000 1200
Norm
ali
zed
CO
sig
nal
from
TC
D (
a.u
.)
Time (sec)
Ni/CeO2-Al2O3
Ni/SrO-Al2O3
Ni/Y2O3-Al2O3
Ni/ZrO2-Al2O3
Ni/γ-Al2O3
Ref. code: 25615622300134IGC

86
Greater Ni dispersion of Ni/Sr-doped Al2O3, Ni/Y-doped Al2O3, and Ni/Ce-
doped Al2O3 results in higher NH3 conversion than Ni/γ-Al2O3, where these catalysts
have the same range of acidic sites. The number of acidic sites on a reduced catalyst
corresponds to the capability of NH3 adsorption, evidenced by the peak areas of the
NH3-TPD profiles in Figure 4.18. The higher number of the acidic sites on Ni/Zr-doped
Al2O3 also yields higher NH3 conversion than Ni/Sr-doped Al2O3 where these catalysts
have the same range of Ni dispersion. Therefore, greater Ni dispersion and acidic sites
of a catalyst can provide more available Ni active sites and more ammonia adsorbates,
which can promote the dehydrogenation of ammonia in step (II). In addition, Table 4.11
lists that the catalysts with a smaller Ni crystallize size have a higher Ni dispersion in
Table 4.10. The Ni particle size of the catalysts over doped Al2O3 supports are smaller
than that of the catalyst over γ-Al2O3 and corresponds to the Ni crystallize size in this
section. The catalysts were also conducted TEM to investigate the Ni cluster sites in
each catalyst. The TEM images of the catalysts were shown in Figure 4.19. The black
dots in the TEM images are the Ni clusters in the catalysts. The catalysts with a high
Ni dispersion also exhibit a small Ni clusters in the TEM images. The TEM image of
Ni/Ce-doped Al2O3 exhibits the smallest Ni cluster sizes among the catalysts in this
section. The size of Ni clusters from the TEM images can be ranked as Ni/γ-Al2O3 >
Ni/Y-doped Al2O3 > Ni/Sr-doped Al2O3 > Ni/Zr-doped Al2O3 > Ni/Ce-doped Al2O3,
which agrees well with the results from the CO chemisorption technique.
Ref. code: 25615622300134IGC

87
Figure 4.18: NH3-TPD profiles of catalysts.
Table 4.11: Ni crystallize size of reduced catalysts.
Catalysts
Ni crystallize size
from XRD
Ni particle size
from CO chemisorption
nm nm
Ni/γ-Al2O3 15.3 64
Ni/Sr-doped Al2O3 10.4 30
Ni/Y-doped Al2O3 12.2 50
Ni/Zr-doped Al2O3 10.1 31
Ni/Ce-doped Al2O3 8.4 26
3500
3600
3700
3800
3900
4000
4100
4200
4300
4400
80 180 280 380 480 580
Des
orp
tion
sig
nal
(µv)
Desorption temperature (°C)
Ni/γ-Al2O3
Ni/Sr-doped Al2O3
Ni/Y-doped Al2O3
Ni/Zr-doped Al2O3
Ni/Ce-doped Al2O3
Ref. code: 25615622300134IGC

88
Figure 4.19: TEM images of catalysts (brightness adjusted).
Ni/γ-Al2O
3
50 nm
Ni/Sr-doped Al2O
3
50 nm
Ni/Y-doped Al2O
3
50 nm
Ni/Zr-doped Al2O
3
50 nm
Ni/Ce-doped Al2O
3
50 nm
Ref. code: 25615622300134IGC
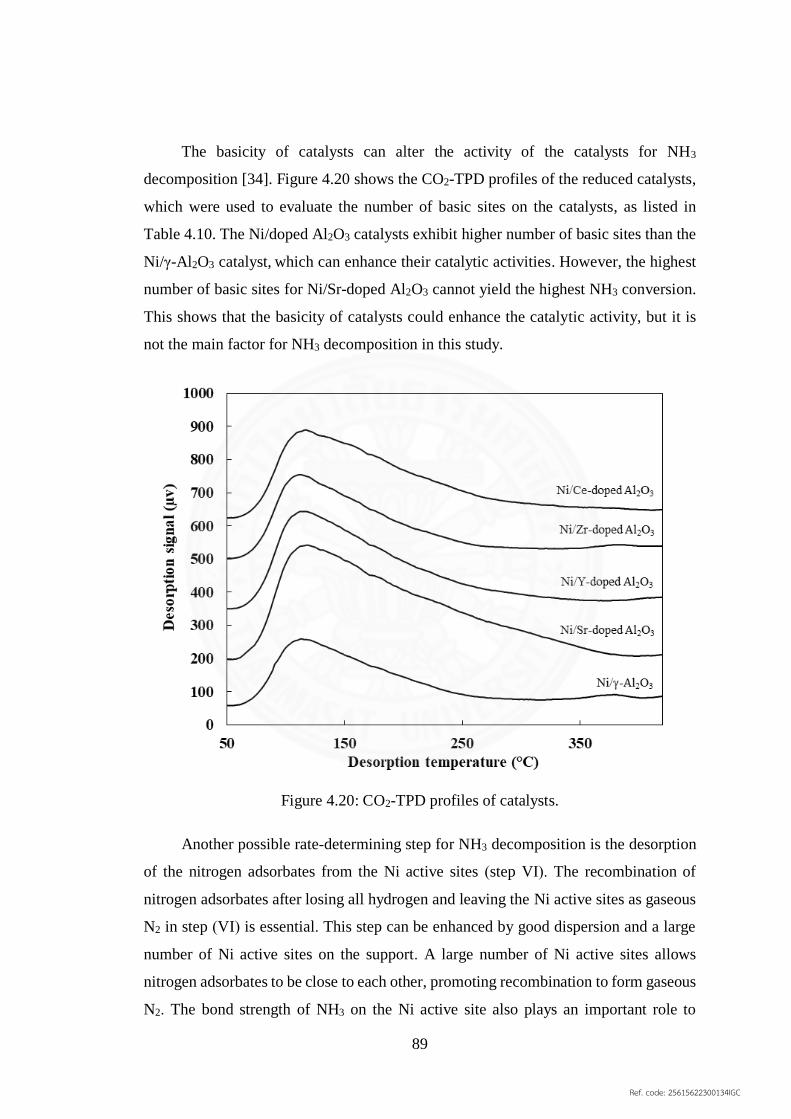
89
The basicity of catalysts can alter the activity of the catalysts for NH3
decomposition [34]. Figure 4.20 shows the CO2-TPD profiles of the reduced catalysts,
which were used to evaluate the number of basic sites on the catalysts, as listed in
Table 4.10. The Ni/doped Al2O3 catalysts exhibit higher number of basic sites than the
Ni/γ-Al2O3 catalyst, which can enhance their catalytic activities. However, the highest
number of basic sites for Ni/Sr-doped Al2O3 cannot yield the highest NH3 conversion.
This shows that the basicity of catalysts could enhance the catalytic activity, but it is
not the main factor for NH3 decomposition in this study.
Figure 4.20: CO2-TPD profiles of catalysts.
Another possible rate-determining step for NH3 decomposition is the desorption
of the nitrogen adsorbates from the Ni active sites (step VI). The recombination of
nitrogen adsorbates after losing all hydrogen and leaving the Ni active sites as gaseous
N2 in step (VI) is essential. This step can be enhanced by good dispersion and a large
number of Ni active sites on the support. A large number of Ni active sites allows
nitrogen adsorbates to be close to each other, promoting recombination to form gaseous
N2. The bond strength of NH3 on the Ni active site also plays an important role to
Ref. code: 25615622300134IGC

90
promote this step, as shown in Figure 4.21. The weaker bond of NH3 on the Ni active
sites can yield easier desorption of nitrogen adsorbates on the Ni active sites after the
dehydrogenation process. Hence, the gaseous N2 formation from NH3 decomposition
over the catalysts was investigated using NH3-TPRx coupled with a mass spectrometer
(MS) to evaluate the support effects on N2 desorption in step (VI). Figure 4.22 shows
the gaseous N2 formation from the MS profiles of the catalysts, which indicate the rate
of nitrogen recombination in the desorption step.
Figure 4.21: Role of oxygen vacancies in doped Al2O3 support for Ni catalyst.
Ref. code: 25615622300134IGC

91
Figure 4.22: N2 formation over catalysts from NH3-TPRx (A) with their first derivatives
(B).
300 400 500 600
Norm
ali
zed
N2
form
ati
on
(a.u
.)
Temperature (°C)
Ni/Zr-doped Al2O
3
Ni/γ-Al2O
3
Ni/Ce-doped Al2O
3
Ni/Sr-doped Al2O
3
Ni/Y-doped Al2O
3
(A)
300 400 500 600
1st
der
ivati
ve
N2
form
ati
on
(a.u
.)
Temperature (°C)
520 °C
500 °C
510 °C
Ni/Zr-doped Al2O
3
Ni/γ-Al2O
3
Ni/Ce-doped Al2O
3
Ni/Sr-doped Al2O
3
Ni/Y-doped Al2O
3
(B)
Ref. code: 25615622300134IGC

92
The maximum N2 formation rate of Ni catalysts can be obtained from the first
derivative of the MS profile of N2, which indicates the N2 desorption temperature of
each catalyst. Ni/Ce-doped Al2O3 and Ni/Zr-doped Al2O3 exhibit the lowest N2
desorption temperature at 500 °C. The Ni/Sr-doped Al2O3 and Ni/Y-doped Al2O3
catalysts exhibit the N2 desorption temperature at 510 °C while N2 desorption over Ni/γ-
Al2O3 occurs at a higher temperature of 520 °C. A lower desorption temperatures of the
Ni/doped Al2O3 catalysts allows a lower energy requirement for nitrogen desorption
from the Ni/doped Al2O3 catalysts. These phenomena may be caused by the strong bond
of Ni on the doped Al2O3 supports, which results in the weak bond of nitrogen adsorbate
on the Ni over doped Al2O3 supports after the dehydrogenation process, as shown in
Figure 4.21. In addition, the N2 desorption temperatures of the catalysts correlate well
with the activation energies of NH3 decomposition over the catalysts in section 4.2.4.
The results imply that the N2 desorption in step (VI) could be the rate-determining step
of NH3 decomposition over the catalysts in this study.
Ref. code: 25615622300134IGC
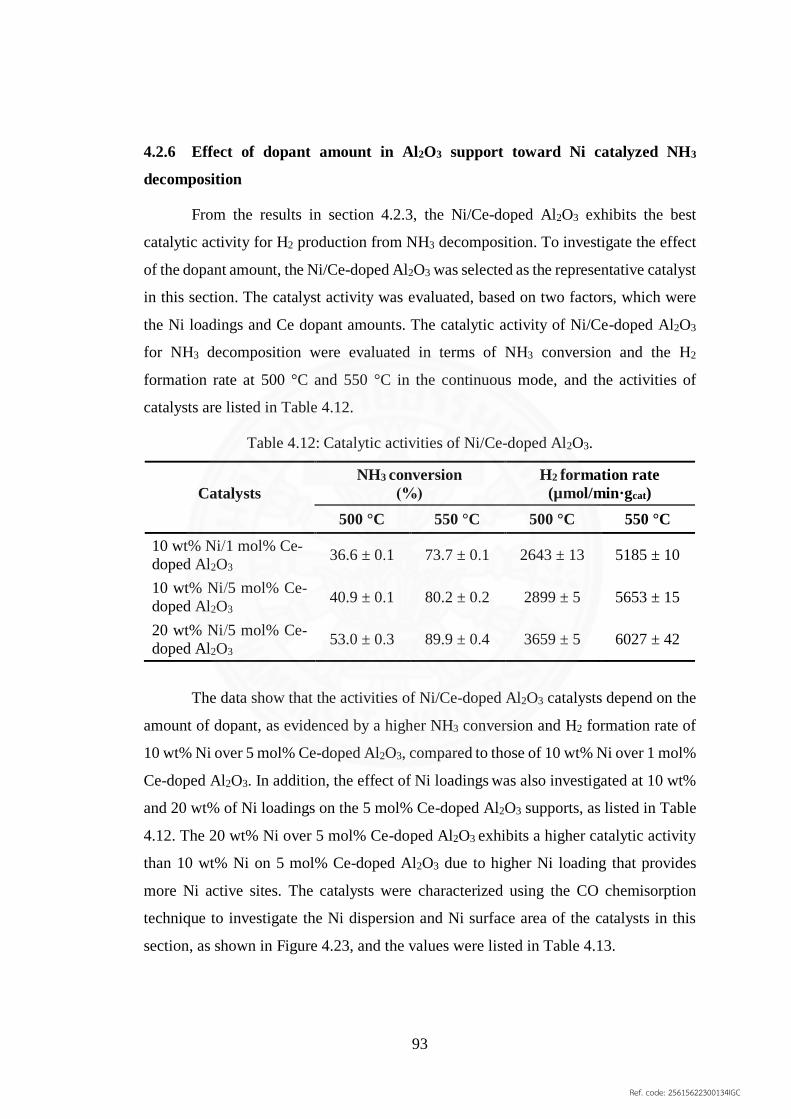
93
4.2.6 Effect of dopant amount in Al2O3 support toward Ni catalyzed NH3
decomposition
From the results in section 4.2.3, the Ni/Ce-doped Al2O3 exhibits the best
catalytic activity for H2 production from NH3 decomposition. To investigate the effect
of the dopant amount, the Ni/Ce-doped Al2O3 was selected as the representative catalyst
in this section. The catalyst activity was evaluated, based on two factors, which were
the Ni loadings and Ce dopant amounts. The catalytic activity of Ni/Ce-doped Al2O3
for NH3 decomposition were evaluated in terms of NH3 conversion and the H2
formation rate at 500 °C and 550 °C in the continuous mode, and the activities of
catalysts are listed in Table 4.12.
Table 4.12: Catalytic activities of Ni/Ce-doped Al2O3.
Catalysts
NH3 conversion
(%)
H2 formation rate
(µmol/min·gcat)
500 °C 550 °C 500 °C 550 °C
10 wt% Ni/1 mol% Ce-
doped Al2O3 36.6 ± 0.1 73.7 ± 0.1 2643 ± 13 5185 ± 10
10 wt% Ni/5 mol% Ce-
doped Al2O3 40.9 ± 0.1 80.2 ± 0.2 2899 ± 5 5653 ± 15
20 wt% Ni/5 mol% Ce-
doped Al2O3 53.0 ± 0.3 89.9 ± 0.4 3659 ± 5 6027 ± 42
The data show that the activities of Ni/Ce-doped Al2O3 catalysts depend on the
amount of dopant, as evidenced by a higher NH3 conversion and H2 formation rate of
10 wt% Ni over 5 mol% Ce-doped Al2O3, compared to those of 10 wt% Ni over 1 mol%
Ce-doped Al2O3. In addition, the effect of Ni loadings was also investigated at 10 wt%
and 20 wt% of Ni loadings on the 5 mol% Ce-doped Al2O3 supports, as listed in Table
4.12. The 20 wt% Ni over 5 mol% Ce-doped Al2O3 exhibits a higher catalytic activity
than 10 wt% Ni on 5 mol% Ce-doped Al2O3 due to higher Ni loading that provides
more Ni active sites. The catalysts were characterized using the CO chemisorption
technique to investigate the Ni dispersion and Ni surface area of the catalysts in this
section, as shown in Figure 4.23, and the values were listed in Table 4.13.
Ref. code: 25615622300134IGC

94
Figure 4.23: CO chemisorption profiles of catalysts (10 wt% Ni and 20 wt% Ni).
Table 4.13: Ni dispersion and Ni surface area of catalysts.
Catalysts Ni dispersion Ni surface area
% m2/g of Ni
10 wt% Ni/1 mol% Ce-doped Al2O3 1.9 12.5
10 wt% Ni/5 mol% Ce-doped Al2O3 2.8 18.6
20 wt% Ni/5 mol% Ce-doped Al2O3 4.0 26.4
The 20 wt% Ni catalyst exhibits a higher Ni dispersion and Ni surface area than
the 10 wt% Ni catalyst, which indicates the adequate space of the support for the
distribution of 20 wt% Ni loading. For the 10 wt% Ni catalysts, higher amount of Ce
doped in the Al2O3 framework can increase the Ni active sites, as evidenced by higher
Ni dispersion and Ni surface area of 10 wt% Ni over 5 mol% Ce-doped Al2O3,
compared to those of 10 wt% Ni over 1 mol% Ce-doped Al2O3. This improvement
could come from the degree of Ce doped in the Al2O3 framework, which can be
investigated by the lattice constant of Al2O3 unit cells in both supports. The supports
were characterized using the XRD technique to investigate the crystal structures and
0 200 400 600 800 1000 1200 1400
Norm
ali
zed
CO
sig
nal
from
TC
D (
a.u
.)
Time (sec)
20Ni/5Ce-doped Al2O3
10Ni/1Ce-doped Al2O3
10Ni/5Ce-doped Al2O3
Ref. code: 25615622300134IGC
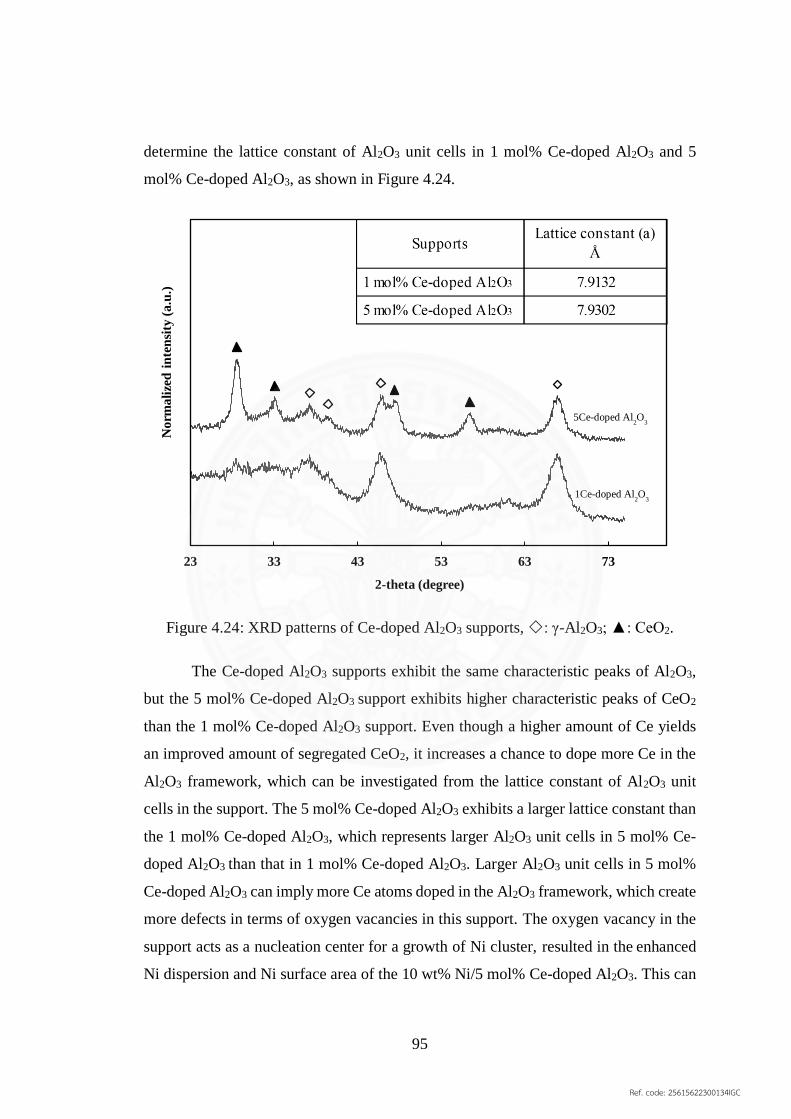
95
determine the lattice constant of Al2O3 unit cells in 1 mol% Ce-doped Al2O3 and 5
mol% Ce-doped Al2O3, as shown in Figure 4.24.
Figure 4.24: XRD patterns of Ce-doped Al2O3 supports, : γ-Al2O3; ▲: CeO2.
The Ce-doped Al2O3 supports exhibit the same characteristic peaks of Al2O3,
but the 5 mol% Ce-doped Al2O3 support exhibits higher characteristic peaks of CeO2
than the 1 mol% Ce-doped Al2O3 support. Even though a higher amount of Ce yields
an improved amount of segregated CeO2, it increases a chance to dope more Ce in the
Al2O3 framework, which can be investigated from the lattice constant of Al2O3 unit
cells in the support. The 5 mol% Ce-doped Al2O3 exhibits a larger lattice constant than
the 1 mol% Ce-doped Al2O3, which represents larger Al2O3 unit cells in 5 mol% Ce-
doped Al2O3 than that in 1 mol% Ce-doped Al2O3. Larger Al2O3 unit cells in 5 mol%
Ce-doped Al2O3 can imply more Ce atoms doped in the Al2O3 framework, which create
more defects in terms of oxygen vacancies in this support. The oxygen vacancy in the
support acts as a nucleation center for a growth of Ni cluster, resulted in the enhanced
Ni dispersion and Ni surface area of the 10 wt% Ni/5 mol% Ce-doped Al2O3. This can
1Ce-doped Al2O
3
23 33 43 53 63 73
Norm
ali
zed
in
ten
sity
(a.u
.)
2-theta (degree)
5Ce-doped Al2O
3
Ref. code: 25615622300134IGC

96
be the reason for a higher activity of the 10 wt% Ni/5 mol% Ce-doped Al2O3 than that
of the 10 wt% Ni/1 mol% Ce-doped Al2O3 in this section.
4.2.7 Applications for H2 production from NH3 decomposition over Ni/Ce-doped
Al2O3 using urine and wastewater
For Hydrogen production from ammonia decomposition can utilize the free
ammonia sources, such as urine and industrial wastewater. The urea (0.31–0.33 M) in
urine can be dissociated to form NH3 [13, 14] for H2 production from NH3
decomposition. High ammonical nitrogen (400–1000 mg of N/L) from ammonia and
urea plants is also a great source for H2 production from NH3 decomposition [15].
Ammonia in water is one of the enviromental problems, because it can be harmful to
the aquatic life [13]. Thus, the decomposition of NH3 from urine and industrial
wastewater can serve as a simultaneous solution for energy production and
environmental problems. The catalyst in this process requires active performance under
water vapor environment for a low-concentrations of NH3 in urine and industrial
wastewater. According to the result from section 4.2.3, Ni/Ce-doped Al2O3 exhibits the
best catalytic activity in NH3 decomposition. The Ni/Ce-doped Al2O3 catalyst was
tested for active behavior under these conditions, to evaluate the feasibility of the
catalyst for NH3 decomposition from urine and industrial wastewater. The activities of
Ni/Ce-doped Al2O3 were also compared to that of Ni/γ-Al2O3. Figure 4.25 shows NH3
conversion from synthetic urine using the Ni/Ce-doped Al2O3 and Ni/γ-Al2O3 catalysts
at 550 °C in the continuous mode. The NH3 conversions from synthetic urine were
achieved at around 72 % and 58 % for the Ni/Ce-doped Al2O3 and Ni/γ-Al2O3 catalysts,
respectively. The H2 production rates are in the range of 169–188 and 134–152
µmol/(min·gcat) for the Ni/Ce-doped Al2O3 and Ni/γ-Al2O3 catalysts, respectively. In
comparison to Ni/γ-Al2O3, Ni/Ce-doped Al2O3 showed high catalytic activities in the
decomposition of high-concentration NH3, and Ni/Ce-doped Al2O3 still exhibits high
catalytic activities under water vapor environment for the decomposition of low-
concentration NH3. The results show that NH3 decomposition from urine using the
Ni/Ce-doped Al2O3 catalyst is possible for H2 production and NH3 reduction in
wastewater sources, before releasing it back into the environment.
Ref. code: 25615622300134IGC

97
Figure 4.25: NH3 decomposition from synthetic urine, : Ni/γ-Al2O3; : Ni/Ce-doped
Al2O3.
For the NH3 sources from wastewater, the potential industry could be the urea
production plants. Urea has been widely used in fertilizers for agricultural activities,
which require more than 50 metric tons of annual urea production. The average
wastewater generation rate is 450–480 kg for a metric ton of urea production, which
typically composed of 3–8 % NH3, 1.5–2 % CO2, and 0.2–5.1 % urea [86, 87]. High
amounts of NH3 and urea in the wastewater from urea plants can be a great source for
H2 production from NH3 decomposition simultaneous to the wastewater treatment. The
H2 production process using the wastewater from urea plants was proposed in Figure
4.26. Urea can be produced from the reaction of NH3 and CO2, which is an exothermic
reaction [87]. The heat from this reaction can also be recovered as an energy source for
the proposed H2 production process. The pretreatment of wastewater is needed to
remove oil, solid particles, and etc., which can damage pumps. After pretreatment, the
liquid effluents are pumped and preheated before feeding into a distillation tower using
heat recovery from the urea production process. The different volatilities of NH3, urea,
Ref. code: 25615622300134IGC

98
and water are separated in the distillation tower, where water is condensed to the bottom
of the tower, and the NH3 and urea vapors are floated up and collected from the top of
the tower. The vapor of urea can then be hydrolyzed to NH3 vapor in the top section.
The NH3 vapor from the urea plant wastewater is flowed into the reactor with the
packed catalyst for NH3 decomposition. The proposed process can serve as a solution
for simultaneous H2 production and treatment of urea plant wastewater.
Figure 4.26: Schematic of NH3 decomposition from urea plant wastewater.
Ref. code: 25615622300134IGC

99
Chapter 5
Conclusions and Suggestions for Future Studies
It is concluded that the catalytic activity of Ni/Al2O3 catalysts for ammonia
decomposition can be enhanced by partially doping the Al2O3 frameworks with Sr, Y,
Zr, or Ce atoms. The enhancement was attributed to defects in the form of oxygen
vacancies in the doped Al2O3 supports. The oxygen vacancies act as nucleation centers
for the growth of Ni clusters, and as a consequence, altering the bond lenghts and bond
strengths of Ni over these sites. The improved properties of the catalysts were observed,
such as increasing dispersion of Ni on the supports (Ce-doped Al2O3 > Sr-doped Al2O3
≈ Zr-doped Al2O3 > Y-doped Al2O3 > γ-Al2O3). Partilly doping also changes the acidic
and basic sites of the catalysts, evidenced by CO-pulse, NH3-TPD, and CO2-TPD,
respectively. Hence, the enhanced Ni dispersion and the enrichment of surface acidic
sites enlarge the availability of Ni sites for NH3 adsorption, resulting in higher NH3
conversion as a result of the promoted NH3 dehydrogenation step. High basicity of the
Ni catalysts may also enhance the performance of catalysts. The recombination of
nitrogen in the NH3 decomposition mechanism could be the rate limiting step in this
study, evidenced by the N2 formation profiles in the NH3-TPRx experiments. The
Ni/Ce-doped Al2O3 catalyst exhibits the highest catalytic activities while the Ni/Y-
doped Al2O3 catalyst exhibits the best catalytic stability in this study. The
decomposition of low-concentration NH3 originated from urine was further evaluated
over the active Ni/Ce-doped Al2O3 catalyst, revealing the H2 formation rate of 169–188
µmol/(min·gcat) with 72.1 % NH3 conversion. The H2 production process from the urea
plant wastewater was also proposed as a solution for simultaneous H2 production and
treatment of urea plant wastewater. A simple preparation method of doped Al2O3
supports provides cost-effective way to synthesize effective Ni catalysts for H2
production from NH3 decomposition, and maintain a high surface area and high thermal
stability of doped Al2O3 at a level similar to that of conventional γ-Al2O3. The results
of this study demonstrate a facile way for the development of active Ni catalysts for
clean hydrogen production from NH3 sources, including NH3 from urine and
wastewater.
Ref. code: 25615622300134IGC

100
This study discovered that the size and valency of dopants in Al2O3 frameworks
affect the properties of Ni catalysts. The dopants with different valencies (Sr2+, Zr4+,
and Ce4+) relative to Al3+ significantly enhance the activities of Ni catalysts while in
the case of Y3+ with valency equal to that of Al3+, there is also an improvement of the
catalytic stability. The larger size of Ce4+ in comparison to Zr4+ (same valency) results
in a further enhancement of activity, making the Ni/Ce-doped Al2O3 catalyst the most
active among the prepared catalysts in this study.
It is envisaged that a combination of doping Y and Ce into the Al2O3 framework
for a Ni catalyst could result in improvement of both the catalytic activity and stability.
These finding would be a research direction for future investigation. The sol gel method
used in support preparation could also be modified, such as using magnetic field
inducement to improve atomic distribution of dopants in Al2O3. Preliminary data
indicated that the magnetic field inducement during support preparation can indeed
improve Ni dispersion on the support, which is an important property to enhance the Ni
catalyst activity for NH3 decomposition.
Ref. code: 25615622300134IGC

101
References
1. Song, H. & Ozkan, U. S. (2010). Economic analysis of hydrogen production
through a bio-ethanol steam reforming process: Sensitivity analyses and cost
estimations. International Journal of Hydrogen Energy, 35(1), 127-134.
2. Choudhary, T. V. & Goodman, D. W. (2002). CO-free fuel processing for fuel
cell applications. Catalysis Today, 77(1–2), 65-78.
3. Lan, R., Irvine, J. T. S., & Tao, S. (2012). Ammonia and related chemicals as
potential indirect hydrogen storage materials. International Journal of Hydrogen
Energy, 37(2), 1482-1494.
4. Yao, L. H., Li, Y. X., Zhao, J., Ji, W. J., & Au, C. T. (2010). Core–shell
structured nanoparticles (M@SiO2, Al2O3, MgO; M = Fe, Co, Ni, Ru) and their
application in COx-free H2 production via NH3 decomposition. Catalysis Today, 158
(3–4), 401-408.
5. Nakamura, I. & Fujitani, T. (2016). Role of metal oxide supports in NH3
decomposition over Ni catalysts. Applied Catalysis A: General, 524(45-49.
6. Liu, X., He, H., Wang, Y., & Zhu, S. (2007). Transesterification of soybean oil
to biodiesel using SrO as a solid base catalyst. Catalysis Communications, 8(7), 1107-
1111.
7. Okura, K., Okanishi, T., Muroyama, H., Matsui, T., & Eguchi, K. (2016).
Ammonia Decomposition over Nickel Catalysts Supported on Rare‐Earth Oxides for
the On‐Site Generation of Hydrogen. ChemCatChem, 8(18), 2988-2995.
8. Giordano, L., Pacchioni, G., Illas, F., & Rösch, N. (2002). Adsorption properties
of Ni4 and Ni8 clusters supported on regular and defect sites of the MgO (001) surface.
Surface Science, 499(1), 73-84.
9. Verwey, E. J. W. (1935).The Structure of the electrolytical oxide Layer on
Aluminium, in Zeitschrift für Kristallographie - Crystalline Materials.(317).
10. Duan, X., Qian, G., Fan, C., Zhu, Y., Zhou, X., Chen, D., & Yuan, W. (2012).
First-principles calculations of ammonia decomposition on Ni(110) surface. Surface
Science, 606(3–4), 549-553.
11. Kishida, K., Kitano, M., Inoue, Y., Sasase, M., Nakao, T., Tada, T., Abe, H.,
Niwa, Y., Yokoyama, T., Hara, M., & Hosono, H. (2018). Oblate hemispheroidal Large
Ref. code: 25615622300134IGC

102
Ruthenium Particles Supported on Calcium Amide as Efficient Catalysts for Ammonia
Decomposition. Chemistry – A European Journal, 24(31), 7976-7984.
12. Zhang, J., Xu, H., & Li, W. (2005). Kinetic study of NH3 decomposition over
Ni nanoparticles: The role of La promoter, structure sensitivity and compensation
effect. Applied Catalysis A: General, 296(2), 257-267.
13. Boggs, B. K., King, R. L., & Botte, G. G. (2009). Urea electrolysis: direct
hydrogen production from urine. Chemical Communications, 0(32), 4859-4861.
14. Kim, J., Choi, W. J. K., Choi, J., Hoffmann, M. R., & Park, H. (2013).
Electrolysis of urea and urine for solar hydrogen. Catalysis Today, 199(2-7.
15. Gupta, S. K. & Sharma, R. (1996). Biological oxidation of high strength
nitrogenous wastewater. Water Research, 30(3), 593-600.
16. Kielland, J. (1937). Individual Activity Coefficients of Ions in Aqueous
Solutions. Journal of the American Chemical Society, 59(9), 1675-1678.
17. Thomas, G. & Parks, G. (2006). Potential Roles of Ammonia in a Hydrogen
Economy. U.S. Department of Energy.
18. Yin, S. F., Xu, B. Q., Zhou, X. P., & Au, C. T. (2004). A mini-review on
ammonia decomposition catalysts for on-site generation of hydrogen for fuel cell
applications. Applied Catalysis A: General, 277(1–2), 1-9.
19. Chiuta, S., Everson, R. C., Neomagus, H. W. J. P., van der Gryp, P., &
Bessarabov, D. G. (2013). Reactor technology options for distributed hydrogen
generation via ammonia decomposition: A review. International Journal of Hydrogen
Energy, 38(35), 14968-14991.
20. Wang, W., Herreros, J. M., Tsolakis, A., & York, A. P. E. (2013). Ammonia as
hydrogen carrier for transportation; investigation of the ammonia exhaust gas fuel
reforming. International Journal of Hydrogen Energy, 38(23), 9907-9917.
21. Zamfirescu, C. & Dincer, I. (2009). Ammonia as a green fuel and hydrogen
source for vehicular applications. Fuel Processing Technology, 90(5), 729-737.
22. Apodaca, L. E. (2018).Mineral Commodity Summaries, U.S.G. Survey. Editor).
23. Coon, R. A., Jones, R. A., Jenkins, L. J., & Siegel, J. (1970). Animal inhalation
studies on ammonia, ethylene glycol, formaldehyde, dimethylamine, and ethanol.
Toxicology and Applied Pharmacology, 16(3), 646-655.
Ref. code: 25615622300134IGC

103
24. Arabczyk, W. & Zamlynny, J. (1999). Study of the ammonia decomposition
over iron catalysts. Catalysis Letters, 60(3), 167-171.
25. Liang, C., Li, W., Wei, Z., Xin, Q., & Li, C. (2000). Catalytic Decomposition
of Ammonia over Nitrided MoNx/α-Al2O3 and NiMoNy/α-Al2O3 Catalysts. Industrial
& Engineering Chemistry Research, 39(10), 3694-3697.
26. Choudhary, T. V., Sivadinarayana, C., & Goodman, D. W. (2001). Catalytic
ammonia decomposition: COx-free hydrogen production for fuel cell applications.
Catalysis Letters, 72(3), 197-201.
27. Chellappa, A. S., Fischer, C. M., & Thomson, W. J. (2002). Ammonia
decomposition kinetics over Ni-Pt/Al2O3 for PEM fuel cell applications. Applied
Catalysis A: General, 227(1–2), 231-240.
28. Raróg-Pilecka, W., Szmigiel, D., Kowalczyk, Z., Jodzis, S., & Zielinski, J.
(2003). Ammonia decomposition over the carbon-based ruthenium catalyst promoted
with barium or cesium. Journal of Catalysis, 218(2), 465-469.
29. Ganley, J. C., Thomas, F. S., Seebauer, E. G., & Masel, R. I. (2004). A Priori
Catalytic Activity Correlations: The Difficult Case of Hydrogen Production from
Ammonia. Catalysis Letters, 96(3), 117-122.
30. Ohtsuka, Y., Xu, C., Kong, D., & Tsubouchi, N. (2004). Decomposition of
ammonia with iron and calcium catalysts supported on coal chars. Fuel, 83(6), 685-
692.
31. Szmigiel, D., Raróg-Pilecka, W., Miśkiewicz, E., Kaszkur, Z., & Kowalczyk,
Z. (2004). Ammonia decomposition over the ruthenium catalysts deposited on
magnesium–aluminum spinel. Applied Catalysis A: General, 264(1), 59-63.
32. Yin, S. F., Xu, B. Q., Wang, S. J., Ng, C. F., & Au, C. T. (2004). Magnesia–
Carbon Nanotubes (MgO–CNTs) Nanocomposite: Novel Support of Ru Catalyst for
the Generation of COx-Free Hydrogen from Ammonia. Catalysis Letters, 96(3), 113-
116.
33. Yin, S.-F., Xu, B.-Q., Ng, C.-F., & Au, C.-T. (2004). Nano Ru/CNTs: a highly
active and stable catalyst for the generation of COx-free hydrogen in ammonia
decomposition. Applied Catalysis B: Environmental, 48(4), 237-241.
Ref. code: 25615622300134IGC

104
34. Yin, S.-F., Zhang, Q.-H., Xu, B.-Q., Zhu, W.-X., Ng, C.-F., & Au, C.-T. (2004).
Investigation on the catalysis of COx-free hydrogen generation from ammonia. Journal
of Catalysis, 224(2), 384-396.
35. Li, X.-K., Ji, W.-J., Zhao, J., Wang, S.-J., & Au, C.-T. (2005). Ammonia
decomposition over Ru and Ni catalysts supported on fumed SiO2, MCM-41, and SBA-
15. Journal of Catalysis, 236(2), 181-189.
36. Han, X., Chu, W., Ni, P., Luo, S.-z., & Zhang, T. (2007). Promoting effects of
iridium on nickel based catalyst in ammonia decomposition. Journal of Fuel Chemistry
and Technology, 35(6), 691-695.
37. Ng, P. F., Li, Wang, S., Zhu, Z., Lu, G., & Yan, Z. (2007). Catalytic Ammonia
Decomposition over Industrial-Waste-Supported Ru Catalysts. Environmental Science
& Technology, 41(10), 3758-3762.
38. Liu, Y., Wang, H., Li, J., Lu, Y., Wu, H., Xue, Q., & Chen, L. (2007).
Monolithic microfibrous nickel catalyst co-modified with ceria and alumina for
miniature hydrogen production via ammonia decomposition. Applied Catalysis A:
General, 328(1), 77-82.
39. Li, L., Zhu, Z. H., Yan, Z. F., Lu, G. Q., & Rintoul, L. (2007). Catalytic
ammonia decomposition over Ru/carbon catalysts: The importance of the structure of
carbon support. Applied Catalysis A: General, 320(166-172.
40. Li, L., Zhu, Z. H., Lu, G. Q., Yan, Z. F., & Qiao, S. Z. (2007). Catalytic
ammonia decomposition over CMK-3 supported Ru catalysts: Effects of surface
treatments of supports. Carbon, 45(1), 11-20.
41. Zheng, W., Zhang, J., Ge, Q., Xu, H., & Li, W. (2008). Effects of CeO2 addition
on Ni/Al2O3 catalysts for the reaction of ammonia decomposition to hydrogen. Applied
Catalysis B: Environmental, 80(1–2), 98-105.
42. Chen, J., Zhu, Z. H., Wang, S., Ma, Q., Rudolph, V., & Lu, G. Q. (2010). Effects
of nitrogen doping on the structure of carbon nanotubes (CNTs) and activity of
Ru/CNTs in ammonia decomposition. Chemical Engineering Journal, 156(2), 404-410.
43. Duan, X., Qian, G., Zhou, X., Sui, Z., Chen, D., & Yuan, W. (2011). Tuning the
size and shape of Fe nanoparticles on carbon nanofibers for catalytic ammonia
decomposition. Applied Catalysis B: Environmental, 101(3–4), 189-196.
Ref. code: 25615622300134IGC

105
44. Deng, Q.-F., Zhang, H., Hou, X.-X., Ren, T.-Z., & Yuan, Z.-Y. (2012). High-
surface-area Ce0.8Zr0.2O2 solid solutions supported Ni catalysts for ammonia
decomposition to hydrogen. International Journal of Hydrogen Energy, 37(21), 15901-
15907.
45. Muroyama, H., Saburi, C., Matsui, T., & Eguchi, K. (2012). Ammonia
decomposition over Ni/La2O3 catalyst for on-site generation of hydrogen. Applied
Catalysis A: General, 443-444(119-124.
46. Lendzion-Bielun, Z., Narkiewicz, U., & Arabczyk, W. (2013). Cobalt-based
Catalysts for Ammonia Decomposition. Materials, 6(6), 2400.
47. Cao, J.-L., Yan, Z.-L., Deng, Q.-F., Yuan, Z.-Y., Wang, Y., Sun, G., Wang, X.-
D., Hari, B., & Zhang, Z.-Y. (2014). Homogeneous precipitation method preparation
of modified red mud supported Ni mesoporous catalysts for ammonia decomposition.
Catalysis Science & Technology, 4(2), 361-368.
48. Okura, K., Okanishi, T., Muroyama, H., Matsui, T., & Eguchi, K. (2015).
Promotion effect of rare-earth elements on the catalytic decomposition of ammonia
over Ni/Al2O3 catalyst. Applied Catalysis A: General, 505(77-85.
49. Aika, K., Kubota, J., Kadowaki, Y., Niwa, Y., & Izumi, Y. (1997). Molecular
sensing techniques for the characterization and design of new ammonia catalysts.
Applied Surface Science, 121-122(488-491.
50. Aika, K.-i., Takano, T., & Murata, S. (1992). Preparation and characterization
of chlorine-free ruthenium catalysts and the promoter effect in ammonia synthesis: 3.
A magnesia-supported ruthenium catalyst. Journal of Catalysis, 136(1), 126-140.
51. Dahl, S., Taylor, P. A., Törnqvist, E., & Chorkendorff, I. (1998). The Synthesis
of Ammonia over a Ruthenium Single Crystal. Journal of Catalysis, 178(2), 679-686.
52. Fishel, C. T., Davis, R. J., & Garces, J. M. (1996). Ammonia Synthesis
Catalyzed by Ruthenium Supported on Basic Zeolites. Journal of Catalysis, 163(1),
148-157.
53. Forni, L., Molinari, D., Rossetti, I., & Pernicone, N. (1999). Carbon-supported
promoted Ru catalyst for ammonia synthesis. Applied Catalysis A: General, 185(2),
269-275.
Ref. code: 25615622300134IGC

106
54. Hinrichsen, O., Rosowski, F., Hornung, A., Muhler, M., & Ertl, G. (1997). The
Kinetics of Ammonia Synthesis over Ru-Based Catalysts: 1. The Dissociative
Chemisorption and Associative Desorption of N2. Journal of Catalysis, 165(1), 33-44.
55. Murata, S. & Aika, K.-I. (1992). Preparation and characterization of chlorine-
free ruthenium catalysts and the promoter effect in ammonia synthesis.: 1. An alumina-
supported ruthenium catalyst. Journal of Catalysis, 136(1), 110-117.
56. Murata, S. & Aika, K.-i. (1992). Preparation and characterization of chlorine-
free ruthenium catalysts and the promoter effect in ammonia synthesis: 2. A lanthanide
oxide-promoted Ru/Al2O3 catalyst. Journal of Catalysis, 136(1), 118-125.
57. Zeng, H. S., Inazu, K., & Aika, K.-i. (2001). Dechlorination process of active
carbon-supported, barium nitrate-promoted ruthenium trichloride catalyst for ammonia
synthesis. Applied Catalysis A: General, 219(1), 235-247.
58. Wang, S. J., Yin, S. F., Li, L., Xu, B. Q., Ng, C. F., & Au, C. T. (2004).
Investigation on modification of Ru/CNTs catalyst for the generation of COx-free
hydrogen from ammonia. Applied Catalysis B: Environmental, 52(4), 287-299.
59. Liu, H., Wang, H., Shen, J., Sun, Y., & Liu, Z. (2008). Promotion effect of
cerium and lanthanum oxides on Ni/SBA-15 catalyst for ammonia decomposition.
Catalysis Today, 131(1–4), 444-449.
60. Shishido, T., Yamamoto, Y., Morioka, H., Takaki, K., & Takehira, K. (2004).
Active Cu/ZnO and Cu/ZnO/Al2O3 catalysts prepared by homogeneous precipitation
method in steam reforming of methanol. Applied Catalysis A: General, 263(2), 249-
253.
61. Henpraserttae, S., Limthongkul, P., & Toochinda, P. (2010). The role of urea in
Cu–Zn–Al catalysts for methanol steam reforming. Monatshefte für Chemie - Chemical
Monthly, 141(3), 269-277.
62. Yin, S. F., Xu, B. Q., Zhu, W. X., Ng, C. F., Zhou, X. P., & Au, C. T. (2004).
Carbon nanotubes-supported Ru catalyst for the generation of COx-free hydrogen from
ammonia. Catalysis Today, 93–95(0), 27-38.
63. Papapolymerou, G. & Bontozoglou, V. (1997). Decomposition of NH3 on Pd
and Ir Comparison with Pt and Rh. Journal of Molecular Catalysis A: Chemical,
120(1), 165-171.
Ref. code: 25615622300134IGC

107
64. Lee, J., Jeon, H., Oh, D. G., Szanyi, J., & Kwak, J. H. (2015). Morphology-
dependent phase transformation of γ-Al2O3. Applied Catalysis A: General, 500(58-68.
65. Ahuja, R., Osorio-Guillen, J. M., Almeida, J. S. d., Holm, B., Ching, W. Y., &
Johansson, B. (2004). Electronic and optical properties of γ-Al2O3 from ab initio theory.
Journal of Physics: Condensed Matter, 16(16), 2891.
66. Gutiérrez, G., Taga, A., & Johansson, B. (2001). Theoretical structure
determination of γ-Al2O3. Physical Review B, 65(1), 012101.
67. Abbet, S., Sanchez, A., Heiz, U., Schneider, W. D., Ferrari, A. M., Pacchioni,
G., & Rösch, N. (2000). Acetylene Cyclotrimerization on Supported Size-Selected Pdn
Clusters (1 ≤ n ≤ 30): One Atom Is Enough! Journal of the American Chemical Society,
122(14), 3453-3457.
68. Ferrari, A. M., Giordano, L., Rösch, N., Heiz, U., Abbet, S., Sanchez, A., &
Pacchioni, G. (2000). Role of Surface Defects in the Activation of Supported Metals:
A Quantum-Chemical Study of Acetylene Cyclotrimerization on Pd1/MgO. The
Journal of Physical Chemistry B, 104(45), 10612-10617.
69. Sanchez, A., Abbet, S., Heiz, U., Schneider, W. D., Häkkinen, H., Barnett, R.
N., & Landman, U. (1999). When Gold Is Not Noble: Nanoscale Gold Catalysts. The
Journal of Physical Chemistry A, 103(48), 9573-9578.
70. Abbet, S., Riedo, E., Brune, H., Heiz, U., Ferrari, A. M., Giordano, L., &
Pacchioni, G. (2001). Identification of Defect Sites on MgO (100) Thin Films by
Decoration with Pd Atoms and Studying CO Adsorption Properties. Journal of the
American Chemical Society, 123(25), 6172-6178.
71. Ferrari, A. M. & Pacchioni, G. (1996). Metal Deposition on Oxide Surfaces: A
Quantum-Chemical Study of the Interaction of Rb, Pd, and Ag Atoms with the Surface
Vacancies of MgO. The Journal of Physical Chemistry, 100(21), 9032-9037.
72. Giordano, L., Goniakowski, J., & Pacchioni, G. (2001). Characteristics of Pd
adsorption on the MgO (100) surface: Role of oxygen vacancies. Physical Review B,
64(7), 075417.
73. Matveev, A. V., Neyman, K. M., Yudanov, I. V., & Rösch, N. (1999).
Adsorption of transition metal atoms on oxygen vacancies and regular sites of the MgO
(001) surface. Surface Science, 426(1), 123-139.
Ref. code: 25615622300134IGC

108
74. Shustorovich, E. (1986). Chemisorption phenomena: Analytic modeling based
on perturbation theory and bond-order conservation. Surface Science Reports, 6(1), 1-
63.
75. Cullity, B. D. (1956). Elements of X-ray diffraction. Reading, Mass.: Addison-
Wesley Pub. Co.
76. Klysubun, W., Sombunchoo, P., Deenan, W., & Kongmark, C. (2012).
Performance and status of beamline BL8 at SLRI for X-ray absorption spectroscopy.
Journal of Synchrotron Radiation, 19(6), 930-936.
77. Ravel, B. & Newville, M. (2005). ATHENA, ARTEMIS, HEPHAESTUS: data
analysis for X-ray absorption spectroscopy using IFEFFIT. Journal of Synchrotron
Radiation, 12(4), 537-541.
78. Seoud, A.-L. A. & Abdallah, L. A. (2010). Two optimization methods to
determine the rate constants of a complex chemical reaction using FORTRAN and
MATLAB. American Journal of Applied Sciences, 7(4), 509.
79. Santos, P. S., Santos, H. S., & Toledo, S. P. (2000). Standard transition
aluminas. Electron microscopy studies. Materials Research, 3(104-114.
80. Kröger, F. A. & Vink, H. J., Relations between the Concentrations of
Imperfections in Crystalline Solids, in Solid State Physics, F. Seitz & D. Turnbull,
Editors. 1956. Academic Press. p. 307-435.
81. Li, D., Bancroft, G. M., Fleet, M. E., Feng, X. H., & Pan, Y. (1995).Al K-edge
XANES spectra of aluminosilicate minerals, in American Mineralogist.(432).
82. Mo, S.-D., Xu, Y.-N., & Ching, W.-Y. (1997). Electronic and Structural
Properties of Bulk γ-Al2O3. Journal of the American Ceramic Society, 80(5), 1193-
1197.
83. Streitz, F. H. & Mintmire, J. W. (1999). Energetics of aluminum vacancies in
gamma alumina. Physical Review B, 60(2), 773-777.
84. Dehmer, J. L. (1972). Evidence of Effective Potential Barriers in the X‐Ray
Absorption Spectra of Molecules. The Journal of Chemical Physics, 56(9), 4496-4504.
85. Ferrett, T. A., Lindle, D. W., Heimann, P. A., Kerkhoff, H. G., Becker, U. E.,
& Shirley, D. A. (1986). Sulfur 1s core-level photoionization of SF6. Physical Review
A, 34(3), 1916-1930.
Ref. code: 25615622300134IGC

109
86. Musalaiah, M., Naik, D. T., M.Sindhuj, & P.Palankaiah. (2016). A Theoritical
Description on Effluent Treatment Process – with A Case Study of Urea Plant Effluent
Treatment. International Journal of Scientific Engineering and Applied Science, 2(1),
266-273.
87. Meessen, J. H., Urea, in Ullmann's Encyclopedia of Industrial Chemistry.
Ref. code: 25615622300134IGC

110
Appendices
Ref. code: 25615622300134IGC

111
Appendix A
Supports and catalysts preparation
For 15 g of the doped Al2O3 supports, the amount of dopants used was calculated
and listed in Table A.1. However, the amount of Al for 15 g of the doped Al2O3 supports
depends on the total weight of each doped Al2O3 support.
Table A.1: Calculation of metal used for 15 g support preparation.
Element Mole fraction MW (g/mol) Weight (g) Weight (g)
(15 g of support)
Weight of Al (g)
(15 g of support)
Al 0.95 26.982 25.633 - -
Sr 0.05 87.620 4.381 2.189 12.811
Y 0.05 88.906 4.445 2.217 12.783
Zr 0.05 91.224 4.561 2.266 12.734
Ce 0.05 140.116 7.006 3.220 11.780
Since, the interested elements are available in the nitrate form. To prepare the solution
of 0.5 M, the amount of metal nitrate used was calculated as follows to prepare the
solution of 0.5 M. The values are shown in Table A.2.
Table A.2: Calculation of compound used for 0.5 M solution preparation.
Compound MW
(g/mol)
Weight
(g)
Water
(cm3)
Weight of
Al(NO3)2∙9H2O
(g)
Water
(cm3)
Sr(NO3)2 211.630 5.287 50 178.111 950
Y(NO3)3∙6H2O 383.012 9.551 50 177.722 948
ZrO(NO3)2∙xH2O 339.320 8.429 50 177.040 944
Ce(NO3)3∙6H2O 434.220 9.979 46 163.781 873
Ref. code: 25615622300134IGC

112
Example calculation: amount of Ce(NO3)3∙6H2O and Al(NO3)3∙9H2O as well as water
for Ce-doped Al2O3
𝐶𝑒(𝑁𝑂3)3 ∙ 6𝐻2𝑂 =3.220 𝑔 × 434.220
𝑔𝑚𝑜𝑙
1 × 140.116 𝑔𝑚𝑜𝑙
= 9.979 𝑔
𝐻2𝑂 =9.979 𝑔
434.220 𝑔𝑚𝑜𝑙 × 0.5
𝑚𝑜𝑙𝐿
×1000 𝑐𝑚3
1 𝐿= 46 𝑐𝑚3
𝐴𝑙(𝑁𝑂3)3 ∙ 9𝐻2𝑂 =11.780 𝑔 × 375.130
𝑔𝑚𝑜𝑙
1 × 26.982 𝑔𝑚𝑜𝑙
= 163.781 𝑔
𝐻2𝑂 =163.781 𝑔
375.13 𝑔𝑚𝑜𝑙 × 0.5
𝑚𝑜𝑙𝐿
×1000 𝑐𝑚3
1 𝐿= 873 𝑐𝑚3
For 10 g of catalysts, the catalysts were prepared with 20 wt% of Ni over the supports.
The amount of Ni nitrate and water used in the preparation process were calculated as
follows. The Ni nitrate solutions were prepared with 1.25 M and impregnated over the
supports.
𝑁𝑖(𝑁𝑂3)2 ∙ 6𝐻2𝑂 =2 𝑔 × 290.810
𝑔𝑚𝑜𝑙
1 × 58.693 𝑔𝑚𝑜𝑙
= 9.910 𝑔
𝐻2𝑂 =2 𝑔
58.6934 𝑔𝑚𝑜𝑙 × 1.25
𝑚𝑜𝑙𝐿
×1000 𝑐𝑚3
1 𝐿= 27.260 𝑐𝑚3
Ref. code: 25615622300134IGC

113
Appendix B
Brunauer-Emmett-Teller (BET) theory
The Brunauer-Emmett-Teller (BET) theory provides an explanation on the
physical adsorption of gas molecules over a solid surface. The BET theory also serves
as the basis for the specific surface area of material measurements. The BET theory was
first published as an article in the Journal of the American Chemical Society in 1938
by Stephen Brunauer, Paul Hugh Emmett, and Edward Teller. This theory can apply
for the multilayer adsorption of gas molecules over a solid surface. The adsorption of
gas molecules is measured using a gas, which does not chemically react with material
surfaces. Nitrogen is commonly used as the probing gas to investigate the properties of
material surfaces using the BET method. The concept of the BET theory is an extension
of the Langmuir theory, which is a theory for monolayer molecular adsorption, to
multilayer adsorption with the following hypotheses:
1. The gas molecules physically adsorb on a solid in layers infinitely.
2. The gas molecules only interact with adjacent layers.
3. The Langmuir theory can be applied to each layer.
The resulting BET equation is
1
𝑣 [(𝑝0𝑝) − 1]
=𝑐 − 1
𝑣𝑚𝑐(𝑝
𝑝0) +
1
𝑣𝑚𝑐
Where, p and p0 are the equilibrium and the saturation pressure of adsorbates at the
temperature of adsorption, respectively. v is the adsorbed gas quantity (for example, in
volume units), and vm is the monolayer adsorbed gas quantity. c is the BET constant.
𝑐 = 𝑒(𝐸1−𝐸𝐿)𝑅𝑇
Where, E1 is the heat of adsorption for the first layer, and EL is the heat of adsorption
for the second and upper layers, which is equivalent to the heat of liquefaction. A BET
plot can be plotted between 1
𝑣[(𝑝0𝑝)−1]
as the y-axis and (𝑝
𝑝0) as the x-axis, which
maintains the (𝑝
𝑝0) value in the range of 0.05–0.35. The slope and y-intercept of this
Ref. code: 25615622300134IGC

114
plot are used to calculate the values of vm and c. These values are further used to
calculate the total surface area (Stotal) and the specific surface area (SBET) of a material,
as indicated in the following equation.
𝑣𝑚 =1
𝑠𝑙𝑜𝑝𝑒 + 𝑦𝑖𝑛𝑡𝑒𝑟𝑐𝑒𝑝𝑡
𝑣𝑚 = 1 +𝑠𝑙𝑜𝑝𝑒
𝑦𝑖𝑛𝑡𝑒𝑟𝑐𝑒𝑝𝑡
𝑆𝑡𝑜𝑡𝑎𝑙 =(𝑣𝑚𝑁𝑠)
𝑉
𝑆𝐵𝐸𝑇 =(𝑆𝑡𝑜𝑡𝑎𝑙)
𝑎
Where, N is Avogadro's number, and s is the cross section of the adsorbing species. V
is the molar volume of the adsorbate gas, and 𝑎 is the mass of the solid sample or
adsorbent.
Ref. code: 25615622300134IGC

115
Appendix C
Lattice constant calculation
The lattice constant, or lattice parameter, can be used to explain the unit cells
dimension in a crystal lattice. There are three lattice constants, i.e., a, b, and c, which
are referred to the dimensions in x, y, and z directions, respectively. Three angles are
also used to explain the shape of unit cells, which are α, β, and γ, as shown in
Figure C.1.
Figure C.1: Lattice constants of unit cell.
For cubic crystal structures, the lattice constant (a) and angle (α = 90°) can be used only
to explain the unit cell dimensions in the crystal lattice due to the symmetry of the
crystal structure. The lattice constant (a) can be calculated from the diffraction angle of
a particular peak in an X-ray diffractogram. The diffraction angle of a particular peak
represents the distance between its lattice planes (d h k l), which is calculated from the
Bragg’s equation as follows.
2𝑑ℎ 𝑘 𝑙 sin 𝜃 = 𝑛𝜆
The distance between lattice planes is further used to calculate the lattice constant of
unit cells in the cubic crystal structure using the equation below.
𝑎2 = 𝑑ℎ 𝑘 𝑙2 (ℎ2 + 𝑘2 + 𝑙2)
Ref. code: 25615622300134IGC

116
Appendix D
X-ray absorption near edge structure spectroscopy
X-ray Absorption Near Edge Structure (XANES) is one of the techniques to
analyze the X-ray absorption spectra (XAS) of a substance. Synchrotron radiation is
normally used to generate X-ray photon energy, which is used in XAS experiment. In
this study, the XAS experiment of the Al atoms in the supports was conducted in the
X-ray energy range of 1560-1600 eV to obtain the XAS spectrum of the doped Al2O3
supports and γ-Al2O3 in the XANES region. A rapid increase of X-ray absorption was
occurred when the energy of X-ray was scanning through the binding energy regime of
Al K-edge. This phenomenon corresponds to absorption of the X-ray photon by
electrons in the K-shell of Al atoms, which is ejected as the photoelectron. The
oscillatory structure in the XANES region was appeared from the interference between
the outgoing photoelectron wave and the back-scattered photo electron wave from
neighboring atoms, shown in Figure D.2. Therefore, the oscillatory pattern and
amplitude in the Al K-edge XANES profile of support provides information on the local
structure of probed Al atoms in the support.
Figure D.2: X-ray absorption near edge structure (XANES).
Ref. code: 25615622300134IGC

117
Appendix E
Chemisorption Techniques
The characteristic properties of catalysts can be determined via chemisorption
techniques, i.e., CO-pulse, NH3-TPD, and CO2-TPD. The Ni dispersion and Ni surface
area can be obtained from the CO-pulse injection technique. The acidic sites and basic
sites can be obtained from NH3-TPD, and CO2-TPD techniques, respectively. The
principle of each chemisorption technique is illustrated as follows. The figures in this
appendix were copied from the operation manual of Catalyst Analyzer (BELCAT-B,
BEL Japan Inc., Japan).
CO-pulse injection technique
The CO-pulse injection technique is generally used to evaluate the metal
dispersion and metal surface area of a catalyst. The catalyst has to be reduced to remove
oxygen out from NiO. The known volume of CO is injected as a pulse into the reduced
catalyst for chemical adsorption until the reduced catalyst is saturated. The volume of
CO chemisorption on the reduced catalyst can be determined from the CO-pulse profile,
as shown in Figure E.3.
Figure E.3: CO-pulse injection technique and CO-pulse profile.
The adsorption volume is calculated from the comparison between the adsorbed peak
and saturated peak. The Ni dispersion and Ni surface area are calculated via the
adsorption volume using the equations below.
Ref. code: 25615622300134IGC

118
Ni dispersion (%) 𝐷𝑚 =𝑉𝑐ℎ𝑒𝑚×𝑀𝑊
22414×(𝑚×𝑝
100)× 100
Ni surface area (m2/g of Ni) 𝐴𝑚 =𝑉𝑐ℎ𝑒𝑚×6.02×10
23×𝜎𝑚
22414×(𝑚×𝑝
100)
Where Vchem = adsorption volume (cm3)
MW = atomic weight of Ni (g/mol)
m = catalyst weight (g)
p = Ni content in the catalyst (wt%)
σm = crossectional area of Ni atom (nm2)
Temperature programmed desorption techniques
Temperature Programmed Desorption (TPD) is generally used to study the
physical adsorption and chemical adsorption of a gas on a catalyst. A TPD profile can
be obtained from the measurement of a desorbed gas during the ramping-up of
temperature, continuously. The type of adsorption and number of adsorption sites on
the catalyst can be determined from the desorption peaks and peak area in the TPD
profile, respectively. The illustration of the TPD techniques is shown in Figure E.4.
Figure E.4: Illustration of TPD technique.
For the evaluation of acidic sites, NH3 is used as the probe molecule for
adsorption on the catalyst while CO2 is used as the probe molecule for the evaluation
Ref. code: 25615622300134IGC

119
of basic sites. After the adsorption process, the NH3-TPD and CO2-TPD profiles are
recorded using Thermal Conductivity Detector (TCD) under the He carrier gas flow
during the ramping up of temperature, continuously.
Temperature Programmed Reduction and Temperature Programmed Reaction
Temperature programmed reduction (TPR) is typically used to study the
characteristics of a catalyst during the reduction process. The reaction products with
respect to the temperature are studied using Temperature programmed reaction (TPRx).
The illustration of the TPR and TPRx techniques is shown in Figure E.5.
Figure E.5: Illustration of TPR and TPRx techniques.
For the TPR technique, H2 is used as the reactive gas to remove the O2 out from NiO
on the catalyst. The H2-TPR profile is recorded using TCD under the 5 vol% H2/He
flow during the ramping-up of temperature, continuously. For the TPRx technique, NH3
is used as the reactant to evaluate the production rate of N2 gas with respect to the
temperature. The TPRx profile is recorded using a Mass Spectrometer under a pure
NH3 flow during the ramping up of temperature, continuously.
Ref. code: 25615622300134IGC

120
Appendix F
Kröger-Vink notation
Kröger–Vink notation is a set of symbols, which are used to explain lattice
position, ionic vacancy, and electrical charge for a point defect in crystals. This notation
was proposed by F. A. Kröger and H. J. Vink, and it is useful for explanation of defect
reactions. The Kröger–Vink notation is shown as follows.
MSC
M can be to atoms (Al, Sr, Y, Zr, or Ce), vacancy (V), electron (e), and electron
holes (h).
S is the lattice site of native atom or interstitial site that the M species occupies. For
example, SrAl and Sri indicate the Sr atom on the Al lattice site and the Sr atom on
the interstitial site, respectively.
C indicates the electrical charge of the species relative to its occupied site. It is
calculated by the charge on the original site minus the charge on the occupied site.
The symbols, , , and indicates a null charge, positive charge, and negative
charge, respectively. For example, the Sr atom on the Al lattice site in the Al2O3
framework can be written as SrAl ′ . The Y atom or Zr atom on the Al lattice site in
the Al2O3 framework can be written as YAl × or ZrAl
, respectively.
Ref. code: 25615622300134IGC