Embed Size (px)
Citation preview

Development of Iowa Statewide
Freight Transporta�on Network
Op�miza�on Strategy
Final Report
September 2016
© 2016 Quetica, LLC
quèt� ica

© 2016 Quetica, LLC
2 Development of Iowa Statewide Freight Transportation Network Optimization Strategy
Table of Contents
List of Figures.....................................................................................................................................................................4
List of Tables......................................................................................................................................................................6
List of Acronyms and Abbreviations..................................................................................................................................8
1. Executive Summary.......................................................................................................................................................9
1.1. Project Overview ...................................................................................................................................................9
1.2. Key Findings ........................................................................................................................................................12
1.3. Recommendations...............................................................................................................................................14
2. Introduction to Freight Transportation Network Optimization ....................................................................................17
2.1. Optimization Methodology...................................................................................................................................17
2.2. Overview of Iowa’s Freight Transportation Network..........................................................................................19
2.3 Optimization Model Architecture Overview ........................................................................................................24
3. Demand Modeling........................................................................................................................................................27
3.1. Demand Module Development Process.............................................................................................................29
3.2. Out-of-Scope Items in Demand Model ...............................................................................................................34
4. Capacity Modeling and Analysis .................................................................................................................................36
4.1. Highway Network Capacity Analysis ..................................................................................................................37
4.2. Rail Network Capacity .........................................................................................................................................40
4.3. Inland Waterway Network Capacity....................................................................................................................46
5. Quantitative and Qualitative Measurements ..............................................................................................................51
5.1. Quantitative Measurements................................................................................................................................51
5.2. Qualitative Measurements ..................................................................................................................................52
5.3. Comparing Transportation Modes using Different Measurement Criteria ........................................................53
6. Data Analysis and Key Findings .................................................................................................................................57
6.1. Baseline Model Summary ...................................................................................................................................57
6.2. Optimized Baseline Performance Summary ......................................................................................................59
6.3. Key Findings from Baseline Analysis .................................................................................................................62

3
© 2016 Quetica, LLC
Development of Iowa Statewide Freight Transportation Network Optimization Strategy
7. Recommended Optimization Strategies .....................................................................................................................94
7.1. Explore the Opportunity to Establish and Leverage New Truck Cross-Docking Operations to Enable GreaterTruck Freight Consolidation for Iowa Businesses......................................................................................................95
7.2. Explore the Opportunity of a New Rail Intermodal Facility in Iowa to Enable Access to Lower Cost RailIntermodal Services for Iowa Businesses.................................................................................................................110
7.3. Explore the Opportunity of Additional Transload Facilities to Provide Iowa Businesses with More Access toLower Cost Rail Freight Services..............................................................................................................................129
7.4. Explore Opportunities to Leverage a Barge and Rail Multimodal Solution to Provide a Cost-Effective FreightTransportation Alternative .........................................................................................................................................143
7.5. Explore the Opportunity to Build a Logistics Park to Co-locate Cross-Docking, Intermodal, Transloading andWarehousing Facilities ..............................................................................................................................................145
7.6. Collaborate with the Railroads to Provide Iowa Businesses with More Capacity to Accommodate ForecastedGrowth in Iowa Freight Shipments............................................................................................................................148
7.7. Explore Opportunities to Improve Competitiveness of Intermodal in Iowa by Repositioning Empty Containersusing Barge and Reducing Repositioning Costs......................................................................................................149
7.8. Explore and Implement Strategies to Reduce Deadhead Truck Miles ...........................................................152
7.9. Explore Opportunities for Railroads to Provide Additional Lower Cost Rail Freight Transportation for WithinIowa High Volume Traffic Lanes ...............................................................................................................................152
8. Additional Considerations and Next Steps ..............................................................................................................153
8.1. Project Scope Considerations...........................................................................................................................153
8.2. Next Steps .........................................................................................................................................................155
Appendix A: References...............................................................................................................................................156
Appendix B: Glossary of Terms ...................................................................................................................................161
Appendix C: Iowa Freight Advisory Council Survey Questions...................................................................................165

© 2016 Quetica, LLC
4 Development of Iowa Statewide Freight Transportation Network Optimization Strategy
List of Figures
Figure 1-1: Fundamental Steps of Freight Transportation Network Optimization Analysis ..........................................................10
Figure 2-1: Fundamental Steps of Freight Transportation Network Optimization Analysis ..........................................................18
Figure 2-2: Core Components of Supply Chain Network Design ...................................................................................................18
Figure 2-3: Iowa’s Freight Transportation Network Components...................................................................................................20
Figure 2-4: Overview of Network Optimization Conceptual Architecture .......................................................................................24
Figure 3-1: Overview of Base Year Domestic Demand Module Development..............................................................................30
Figure 3-2: FAF3 Freight Volume (Percentage of Total Tonnage) Breakdown by Mode..............................................................34
Figure 4-1: Top 10 County-To-County Truck Freight Traffic Lanes (Origin-Destination Pairs) by Commodity in 2010...............39
Figure 4-2: Iowa Rail Freight Network Utilization Map Using 2013 Data .......................................................................................43
Figure 4-3: Iowa Rail Freight Network: Utilization Map Using FAF Projected 2040 Freight Volume ...........................................45
Figure 4-4: Map of Upper Mississippi and Illinois Rivers with Locks and Dams............................................................................47
Figure 5-1: U.S. Mode Share of Tonnage and Total Tonnage by Distance Band in 2007 ...........................................................56
Figure 6-1a: 2013 GDP Breakdown By Sector: U.S........................................................................................................................58
Figure 6-1b: 2013 GDP Breakdown By Sector: Iowa ......................................................................................................................59
Figure 6-2: Comparing Annual Freight Volume by Mode: Baseline vs. Optimized Baseline ........................................................61
Figure 6-3: Comparing Annual Transportation Costs by Mode: Baseline vs. Optimized Baseline ..............................................62
Figure 6-4: Domestic Freight in 2012 - Percentage Breakdown of Tonnage by Mode .................................................................67
Figure 6-5: Estimated Annual Cost Savings Opportunities using Rail Carload and Rail Intermodal Transportation ..................68
Figure 6-6: Linear Trend Line Analysis of Correlation between Distances and Drayage Costs...................................................71
Figure 6-7: Areas within 100- Mile Straight Line Radius of Existing Intermodal Yards In Iowa and Neighboring States ...........73
Figure 6-8: Annual Freight Tonnage by County That Benefits From Converting Truck to Rail ....................................................74
Figure 6-9: Ports and Navigable Waterways of the United States .................................................................................................78
Figure 6-10: Top Destination for Barge Freight Originated in Western Iowa.................................................................................79
Figure 6-11: Top Origins for Barge Freight Terminated in Western Iowa ......................................................................................80
Figure 6-12: Annual Cost Savings Opportunities with New Barge Terminals ...............................................................................82
Figure 6-13: Annual Freight Volume in Number of Barges That Would Benefit From New Barge Terminals .............................83
Figure 6-14: Average Transportation Costs to Export a 40 foot Container from Iowa to Major Foreign Markets .......................86
Figure 6-15: Cost Comparison: Trade Routes to Export Containerized Iowa Products to Major Economies in Europe ............87
Figure 6-16: Cost Comparison: Trade Routes to Export Containerized Iowa Products to Major Economies in Asia .................88
Figure 6-17: Cost Comparison: Trade Routes to Export Iowa Products to China.........................................................................89
Figure 6-18: Typical Modern Flow for Bulk Grain Export ................................................................................................................90
Figure 6-19: Iowa Areas that Could Benefit from Using Panama Canal for Grain Exports to China ............................................92
Figure 7-1: A Typical Cross-Docking Operation ..............................................................................................................................96
Figure 7-2: Comparing Total Market Opportunities (TMO) between Eastern Iowa and Central Iowa-A....................................101
5
© 2016 Quetica, LLC
Development of Iowa Statewide Freight Transportation Network Optimization Strategy
Figure 7-3: Current State Truck Shipment Network ......................................................................................................................102
Figure 7-4: Optimized State Truck Shipment Network Leveraging Cross-Dock in Eastern Iowa...............................................102
Figure 7-5: Approx. Annual Freight Tonnage by Commodity Benefiting From Cross-Docking In Eastern Iowa .......................103
Figure 7-6: Approx. Annual Freight Tonnage by Origin State Benefiting from Cross-Docking Operations in Eastern Iowa ....104
Figure 7-7: Approx. Annual Freight Tonnage by Destination State Benefiting from Cross-Docking Operations in Eastern Iowa.................................................................................................................................................................................................104
Figure 7-8: Estimated Annual EV from a Mid-Sized Cross-Dock in Eastern Iowa ......................................................................106
Figure 7-10: Aerial View of NFI’s 150-Door Cross-Dock in Breinigsville, PA ..............................................................................108
Figure 7-11: Aerial View of Reddaway’s 150-Door Cross-Dock in Fontana, CA.........................................................................108
Figure 7-12: An Intermodal Yard with Double Stacked Rail Cars.................................................................................................111
Figure 7-13: Existing Intermodal Facilities in U.S. in 2014 ...........................................................................................................111
Figure 7-14: Current Baseline Shipments That Would Benefit from an Intermodal Yard In Eastern Iowa ................................116
Figure 7-15: Optimized State Shipments Leveraging an Intermodal Yard In Eastern Iowa .......................................................116
Figure 7-16: Annual Freight Volume Measured By Container Count by Commodity in the TMO ..............................................119
Figure 7-17: Top 10 Counties with the Largest Intermodal Freight Volume (as a Percentage of Total Market Size)...............119
Figure 7-18: Aerial View of the IAIS Intermodal Facility in Council Bluffs, IA ..............................................................................125
Figure 7-19: Aerial View of the CSX Intermodal Facility in Louisville, KY....................................................................................125
Figure 7-20: Aerial View of NS Appliance Park Intermodal Facility in Louisville, KY ..................................................................126
Figure 7-21: Truck-to-Rail and Rail-to-Truck Transloading Process............................................................................................130
Figure 7-22: Estimated Total Market Opportunities in Annual Cost Savings in Three Iowa Transloading Locations ...............134
Figure 7-23: Estimated Total Market Sizes in Annual Tonnage in Three Iowa Transloading Locations....................................134
Figure 7-24: Cost Savings Opportunities by Commodity Group in Eastern Iowa Transloading Facility ....................................135
Figure 7-25: Cost Savings Opportunities by Commodity Group in Central Iowa Transloading Facility .....................................136
Figure 7-26: Cost Savings Opportunities by Commodity Group in Western Iowa Transloading Facility ...................................137
Figure 7-27: An Aerial View of the Trans Load Limited, Inc.’s Transloading Facility in Birmingham, AL ..................................141
Figure 7-28: An Aerial View of the Patriot Rail’s Transloading Facility in Gibsland, LA..............................................................142
Figure 7-29: Ocean Shipping Container Availability – Six-Month Snapshot of Average Weekly Throughput...........................150
© 2016 Quetica, LLC
6 Development of Iowa Statewide Freight Transportation Network Optimization Strategy
List of Tables
Table 2-1: Foreign Countries or Country Groups in the Study Scope............................................................................................21
Table 3-1: Prioritized Commodities that are Modeled Individually in the iFROM Demand Model................................................31
Table 3-2: Iowa’s Priority Commodity and Grouping Structure in the Demand Model...................................................................32
Table 3-3: List of 24 Commodity Groups in the Demand Model.....................................................................................................33
Table 4-1: Primary Highway System Utilization Level.....................................................................................................................37
Table 4-2: Summary of Financial Impact in Resilience Analysis Scenarios ..................................................................................40
Table 4-3: Rail Freight Network Utilization Level.............................................................................................................................42
Table 4-4: Growth Factors Used to Estimate Iowa Rail Freight Network Utilization in the Forecast Year ..................................44
Table 4-5: Estimating Lock and Dam 18 Freight Capacity..............................................................................................................49
Table 4-6: Estimating Lock and Dam 18 Free Freight Capacity in the Forecast Year Using FAF3 and USACE Data...............49
Table 5-1: Comparing the Modes included in the Study Scope .....................................................................................................54
Table 6-1: Comparing Freight Volume and GDP – Iowa and U.S. Total .......................................................................................58
Table 6-2: Summary of Key Findings ...............................................................................................................................................63
Table 6-3: U.S. Domestic Truck Market by Mode in 2012 ..............................................................................................................65
Table 6-4: Cost per Ton-Mile Associated With Each Mode ............................................................................................................66
Table 6-5: Estimated Reduced Cost Savings Opportunities due to Railroad Capacity Constraints in Base Year ......................69
Table 6-6: Estimated Reduced Cost Savings Opportunities Due To Railroad Capacity Constraints in Forecast Year ..............70
Table 6-7: Estimated Cost per Dray to CIC in Chicago Area..........................................................................................................71
Table 6-8: High Level Financial Analysis for a Grundy County Branch Line .................................................................................76
Table 6-9: High Level Financial Analysis for a Howard County Branch Line.................................................................................77
Table 6-10: Sample Cost Per Ton Comparison between Barge and Multimodal (Rail + Barge)..................................................78
Table 6-11: Cost Comparison between Barge Transportation on the Missouri River and Rail ....................................................80
Table 6-12: Top 10 Iowa Export Counties in 2010 Based On Total Export Tonnage ...................................................................84
Table 6-13: Potential Impact of Panamax Expansion Project.........................................................................................................93
Table 7-1: Summary of Recommendations .....................................................................................................................................94
Table 7-2: Commodities Included in Analysis of Cross-Docking Operations.................................................................................98
Table 7–3: Total Market Opportunity (TMO) Before Factoring In Stop-Off Costs .......................................................................100
Table 7-4: ROM Financial Analysis for a Mid-Sized Cross-Dock in Eastern Iowa ......................................................................106
Table 7-5: Commodities Included in Optimization Strategy Analysis using Intermodal Transportation.....................................113
Table 7-6: The TMO of the Suggested Intermodal Yard in Eastern Iowa, Focusing on High Volume Traffic Lanes .................118
Table 7-7: Base Case Analysis for a New Intermodal Yard in Eastern Iowa................................................................................121
Table 7-8: Comparison of Typical Road Travel Distance to Eastern Iowa versus Rochelle, IL .................................................122
Table 7-9: Conservative Case Analysis for a New Intermodal Yard in Eastern Iowa .................................................................123
Table 7-10: Summary of the Financial Case for a New Intermodal Yard in Eastern Iowa..........................................................124
7
© 2016 Quetica, LLC
Development of Iowa Statewide Freight Transportation Network Optimization Strategy
Table 7-11: Some Small Existing Intermodal Facilities .................................................................................................................126
Table 7-12: Commodities Included In Optimization Strategy Analysis Using Transloading .......................................................132
Table 7-13: Estimated Annual Rail Carloads in DMAMPO Study ................................................................................................138
Table 7-14: Rough Order of Magnitude Initial Investment Estimates...........................................................................................138
Table 7-15: Comparing the Estimated Annual Rail Carloads between DMAMPO Study and Optimization Study ...................139
Table 7-16: Base Case vs. Conservative Case Assumptions ......................................................................................................139
Table 7-17: Base Case Financial for New Transloading Facilities ...............................................................................................140
Table 7-18: Conservative Case Financial Analysis for the New Transloading Facilities ............................................................140
Table 7-19: Cost Analysis for a Hypothetical Multimodal Solution ...............................................................................................144
Table 7-20: TMO of a Logistics Park in Eastern Iowa..................................................................................................................147
Table 7-21: Business Case for a Logistics Park in Eastern Iowa.................................................................................................147
Table 7-22: Potential Annual Capacity in Barge Transportation to Reposition Empty Containers.............................................151
Table 8-1: Comparing Iowa Domestic Freight Volume by Mode: 2007 vs. 2012 ........................................................................153
Table 8-2: Comparing Iowa Import/Export Freight Volume by Mode: 2007 vs. 2012 .................................................................154

© 2016 Quetica, LLC
8 Development of Iowa Statewide Freight Transportation Network Optimization Strategy
List of Acronyms and Abbreviations
The following is a list of acronyms and abbreviations in the report.
Acronym or Abbreviation Description
3PL Third Party Logistics
AAR Association of American Railroads
ADT Average Daily Traffic
BEA Bureau of Economic Analysis
CBP County Business Patterns
CFS Commodity Flow Survey
COFC/TOFC Container on Flat Car/Trailer on Flat Car
DOT Department of Transportation
EFM Economic Feasibility Measurement
EV Economic Value
FAF Freight Analysis Framework
FHWA Federal Highway Administration
FTL Full Truckload
GDP Gross Domestic Product
IEDA Iowa Economic Development Authority
iFROM Iowa Freight Optimization Model
iTRAM Iowa Travel Analysis Model
LTL Less Than Truckload
NAICS North American Industrial Classification System
NMFC National Motor Freight Classification
NMFTA National Motor Freight Traffic Association
SCTG Standard Classification of Transported Goods
TEU Twenty-foot Equivalent Unit
TL Truckload
TMO Total Market Opportunity
USDA United States Department of Agriculture

9
© 2016 Quetica, LLC
Development of Iowa Statewide Freight Transportation Network Optimization Strategy
1. Executive Summary
1.1. Project Overview
The primary objective of the Statewide Freight Transportation Network Optimization Study is to effectively identifyand prioritize investment opportunities that will reduce transportation costs for Iowa’s businesses and to promotebusiness growth in Iowa. The study area includes all counties in the State of Iowa. Sponsored by the IowaDepartment of Transportation (Iowa DOT) and the Iowa Economic Development Authority (IEDA), the study uses ademand-based supply chain network design and an optimization methodology to evaluate the efficiency of Iowa’sfreight transportation network, in order to make informed investment decisions. The approach, used for decades inthe private sector to optimize complex global supply chain networks for large corporations, is adopted for thisproject to optimize both public and private elements of the freight transportation network in Iowa.
A business supply chain consists of suppliers, plants, warehouses, and transportation modes used to moveproducts from point of origin to end customer. Up to 80 percent of the costs of a company’s supply chain could beimpacted by the location of the company’s facilities and its access to the multimodal networks that determine therouting of product flows between these facilities.1 In 2012, more than 490 million tons of freight moved betweenIowa and other domestic or foreign regions2, with Iowa businesses spending billions of dollars on freight transportannually.
Supply chain design and optimization is a practice used by commercial organizations to achieve a competitiveadvantage and improve profitability by reducing supply chain-related expenses. It is common in the private sectorfor companies to expect reduction in their transportation, warehousing, and other supply chain costs by 5 to 15percent by addressing supply chain constraints and optimizing their network, while improving their service andoperational agility.
A company’s supply chain, however, depends heavily on the public elements of a transportation network, such asthe highway system, interchanges, interconnectivity between different transportation modes, and inland waterwaysystems. Private companies have to design and optimize their supply chain networks around these systemconstraints, because changes to the publicly-owned transportation network are outside their direct control. Inaddition, businesses are limited to designing and optimizing their supply chains based on their own privatecompany data, without insights into other commodity movements across the region or state.
The statewide freight network optimization study builds a model using statewide commodity flow data and uses themodel to identify and assess network constraints impacting all users of Iowa’s freight network. By addressing thehigh value network constraints (the most expensive constraints in the network), Iowa DOT can effectively help Iowabusinesses to reduce their transportation costs and improve their supply chain efficiency. The statewide freightoptimization study generates recommended strategies based on the network constraints to help Iowa DOT makeinfrastructure investment decisions that deliver the greatest benefits to its freight transportation system users. It alsoprovides statewide supply chain data to key industries to help IEDA identify economic development opportunities toestablish or expand the operations of commercial businesses in Iowa.
1 Percentage is based on Quetica’s industry experience.
2 Source: Federal Highway Administration, Freight Analysis Framework version 3.5. (FAF-3.5)

© 2016 Quetica, LLC
10 Development of Iowa Statewide Freight Transportation Network Optimization Strategy
To accomplish these objectives, the Statewide Freight Transportation Network Optimization Study approachincludes four fundamental steps:
Figure 1-1: Fundamental Steps of Freight Transportation Network Optimization Analysis
Source: Quetica, LLC
The result is a set of transportation network optimization strategies and models developed to reduce the overalltransportation costs for Iowa businesses.
At the center of the study is the development of the Iowa Freight Optimization Model (iFROM), which leveragessupply chain data, supply chain network optimization algorithms and business analytics to identify transportationcost reduction opportunities for Iowa companies. The iFROM tool is designed to:
Simulate Iowa’s commodity flows using a demand module;
Simulate Iowa’s freight transportation network capacity at the county level in a capacity module; and
Evaluate optimization opportunities by applying optimization and analysis algorithms to demand andcapacity modeling and transportation cost benchmarks.
This study provides essential tools to help Iowa DOT achieve its mission to be “Smarter, Simpler, Customer Driven”and the corresponding objectives outlined in its Strategic Plan.3 By enhancing opportunities for commerce throughstrategic investment in transportation infrastructure that meets current and future needs of the transportation systemusers, the study also identifies economic development opportunities to encourage companies to establishoperations and/or expand their supply chain networks in Iowa.
3 Iowa DOT’s Strategic Plan is available at http://www.iowadot.gov/strategicplan/docs/StrategicPlanBrochure.pdf

11
© 2016 Quetica, LLC
Development of Iowa Statewide Freight Transportation Network Optimization Strategy
This study is focused on optimizing the Iowa portion of the transportation network, which may skew results towardsthe center of the state in the optimization algorithms and may understate opportunities on the edges of Iowa.Modeling a multistate region or the national freight network could deliver more balanced results for Iowa and itsadjacent states, but is beyond the scope of the current effort. It is recommended that a future study be carried out toinclude commodity flows in nearby counties in Illinois, Kansas, Minnesota, Missouri, Nebraska, South Dakota andWisconsin to analyze the costs and benefits of network improvements in a broader region.
A freight transportation network optimization is different from the traditional travel demand modeling intransportation planning. Travel demand modeling is used to “develop traffic forecasts, test alternative transportationscenarios, and evaluate transportation systems or policies” (CamSys, 2014). The results of travel demandmodeling are used to assist decision makers in making transportation planning decisions from a range ofalternatives that may include addressing congestion issues and increasing network capacity. Traditionally, a “four-step process” is used for regional transportation planning (CamSys, 2014):
1. Trip generation (how many trips will be made?);
2. Trip distribution (where will the trips go?);
3. Mode choice (what modes of transportation will the trips use?); and
4. Trip assignment (what routes will the trips take).
A freight transportation network optimization is focused on identifying opportunities to transport commodities fromorigins to destinations at lower costs for commercial users of the transportation system. The resulting optimizationstrategies typically involve leveraging more effective multimodal choices and freight consolidation methods toreduce transportation costs, truck miles, and carbon emissions. A freight network optimization study can use thetransportation network and capacity data from a travel demand model to evaluate the possible cost effectiveness ofmodal options for each origin-destination pair in commodity flows. The optimization results include quantifying thetransportation cost saving benefits to the transportation system users and projected impact to freight traffic patternssuch as an increase or reduction of truck counts, rail traffic, or barge traffic in the study area. The freight trafficpattern change data can be fed back to the travel demand model to further analyze projected changes to the overalltravel patterns after the optimization strategies are implemented. As a result, freight network optimization and traveldemand modeling can provide complementary tools to more effective transportation planning.

© 2016 Quetica, LLC
12 Development of Iowa Statewide Freight Transportation Network Optimization Strategy
1.2. Key Findings
Results of quantitative and qualitative analysis of Iowa’s multimodal transportation network, commodity flows, andfreight network cost analysis, are summarized in the following key findings:
1. Iowa’s primary highway system capacity is well managed, but capacity constraints affecting freighttransportation are projected in the future. Iowa’s 10,000 mile Primary Highway System consists ofInterstate Highways, U.S. Highways, and Iowa state highways. The primary highway network is thebackbone of the state transportation system that connects all 99 counties in Iowa. Results from the baseyear (2010) analysis show no high value network constraints for freight transportation in the base yearhighway capacity analysis. No existing capacity constraints would change truck routes and freightmovement patterns.
In the forecast year (2040), some highway segments are projected to have capacity constraints. Thesecapacity constraints could cause traffic congestion and delays, which may result in truck dispatchers andtruck drivers using alternate routes with potentially increased transportation costs.
2. A substantial volume of truck shipments are small shipments that could be consolidated to reducetransportation costs. An estimated 9.5 percent of Iowa’s domestic truck freight (inbound, outbound, andwithin Iowa) moves in small shipments weighing less than 15,000 pounds in the base year. Smallshipments typically have a higher cost per ton-mile than full truckload shipments. As a result, opportunitiesmay exist to consolidate shipments in Iowa to reduce business transportation costs.
3. Significant opportunities exist to leverage railroad transportation in Iowa to reduce freight costs.There are 18 railroads with 3,851 miles of track in Iowa that connect shippers, manufacturers, andproducers to a robust network of North American trading partners. By converting truck freight to rail freight,the estimated total annual cost savings opportunities are $670 million for inbound freight and $810 millionfor outbound freight if 100 percent of the conversion opportunities are captured.
4. Railroad capacity constraints are projected in the future. In the forecast year (2040) of the analysis,railroad capacity constraints are projected in 29 Iowa counties if no new capacity is added. These capacityconstraints limit the potential for converting some truck freight to rail freight. An estimated 14.6 percent ofthe total cost savings opportunity in truck to rail conversions could be lost in the forecast year as a result ofrailroad capacity constraints.
5. Businesses in many Iowa communities may pay high drayage4 costs as a result of limited access torail intermodal services. Shippers in a large portion of Iowa are beyond 100 miles from existingintermodal yards in Iowa and neighboring states. Iowa companies in these areas may pay high drayagecosts to access rail intermodal transportation, increasing the total transportation costs.
4 Drayage is the transport of commodities over a short distance, typically as a truck pickup from or delivery to an intermodal yard.
13
© 2016 Quetica, LLC
Development of Iowa Statewide Freight Transportation Network Optimization Strategy
6. It is not economically viable to build railroad branch lines to connect the 9 counties that currentlydo not have direct rail access. Nine out of 99 counties in Iowa do not have direct access to rail.5 Buildingrailroad branch lines to connect these counties to Iowa’s railroad network could provide transportation costsavings opportunities by converting some truck freight to rail freight. Analysis of the economic benefit, giventhe base year freight volume, estimated an Economic Feasibility Measurement (EFM)6 of approximately 16years in the best case scenario, suggesting that it is not economically viable to construct new branch lines.
7. The inland waterway system provides sufficient capacity for Iowa’s freight transportation, but isprojected to have capacity constraints in the future. Iowa has 491 miles of navigable river bordering thestate, and it is the only state in the nation bordered by two navigable rivers: Mississippi River and MissouriRiver. For some commodities, barge transportation provides significant cost savings over land-basedtransportation services and is more fuel efficient than other modes. The capacity analysis indicates thatsufficient capacity is available in the base year for barge transportation demand. However, freight capacityconstraints are projected in 2040 if the current lock and dam system on the Upper Mississippi River is notimproved to create additional capacity.
8. Barge transportation on the Missouri River provides a cost competitive alternative to transportcommodities to the Gulf area. Navigation on the Missouri River occurs from Sioux City to the mouth at St.Louis, a distance of 734 miles. Access to barge transportation on the Missouri River is available in Iowathrough barge terminals located in Council Bluffs, Sergeant Bluff, and Sioux City. Barge transportation onthe Missouri River provides approximately 5 percent in cost savings over rail carload freight costs betweenIowa and the Gulf area. More importantly, barge transportation provides additional freight capacity andtransportation modal choice to Western Iowa, improving the resiliency of Iowa’s freight transportationnetwork.
9. It is not economically viable to build new barge terminals in counties bordering the Mississippi orMissouri River that currently do not have direct access to barge transportation. Sixteen Iowacounties border either the Mississippi River or the Missouri River. However, six of these counties do nothave terminals to directly access barge transportation. 7 Quantitative network analysis indicates that there isnot enough freight volume to justify new barge terminals in these six counties. There is an opportunity forIowa companies in these six counties to leverage existing barge terminals in nearby counties to transporttheir freight.
5 The 9 Iowa counties without direct rail access are Audubon, Davis, Decatur, Grundy, Howard, Jones, Ringgold, Taylor, and Van Buren.
6 EFM is a financial metric for evaluating the economic benefits from a project. EFM is measured by the period of time required to recoupfunds expended in implementing a recommended optimization strategy, starting from the point that the freight volume reaches theexpected level in the business case. The value of EFM is equal to the estimated total implementation cost (including all design andconstruction costs) divided by the annual cost savings opportunity measured by comparing the transportation costs in build and no buildscenarios. For example, if the total implementation cost is $60 million, and the projected cost savings in the build scenario is $6 million,then the EFM is 10 years. The lower the EFM value, the stronger the business case.
7 The 6 Iowa counties bordering the rivers, but without direct barge access, are Jackson, Louisa, Monona, Harrison, Mills, and Fremont.

© 2016 Quetica, LLC
14 Development of Iowa Statewide Freight Transportation Network Optimization Strategy
10. Lower ocean freight rates as a result of the Panama Canal expansion could provide cost savings toIowa exporters using the Gulf ports. Currently, a typical Panamax cargo ship has deadweight tonnage of65,000 to 80,000 tons, due to draft limitations in the canal. After the canal expansion, the New Panamaxstandard will accommodate ships having a deadweight tonnage of up to 120,000 tons. Larger cargo shipsare typically more cost efficient for transporting commodities. It is likely that ocean carriers will pass onsome of the operational cost savings to shippers.8 If the New Panamax standard were estimated to resultin a 10 percent reduction in ocean freight rates, freight cost routing through the Panama Canal would bemore competitive than routing through the Pacific Northwest ports for an increased number of companieslocated in Iowa counties near the Mississippi River or the Missouri River. An increase of approximately 65percent in export tonnage to China and over 27 percent to the East and Southeast Asia region could benefitfrom the lower transportation costs routing through the Panama Canal than through the Pacific NorthwestPorts.
1.3. Recommendations
The key findings above present significant opportunities to enhance Iowa’s freight network. The followingrecommendations present the optimization strategies to capture the opportunities and deliver tangible benefits toIowa businesses whose supply chains rely heavily on Iowa’s freight transportation systems. The recommendedoptimization strategies include:
1. Explore the opportunity to establish and leverage new truck cross-docking operations to enablegreater truck freight Consolidation for Iowa Businesses. Cross-docking is a logistics practice ofunloading materials from an incoming semi-trailer truck or railcar and loading these materials directly intooutbound trucks, trailers, or railcars, with little or no storage in between. There are opportunities to establishnew cross-docking operations in Iowa to consolidate small truck shipments to full truckload for multipleshippers and reduce transportation costs. Quantitative analysis in truck freight consolidation estimates thatthe total market opportunity (TMO) on behalf of Iowa shippers in annual transportation cost savings isapproximately $852 million. A business case developed for a mid-sized cross dock in Eastern Iowa showsapproximately $22 million to $34 million in total annual transportation cost savings, with an EconomicFeasibility Measurement (EFM)6 of approximately one year (after the cross dock is fully operational andfreight volume has reached the expected level).
2. Explore the opportunity of a new rail intermodal facility in Iowa to enable access to lower cost railintermodal services for Iowa businesses. Rail intermodal service involves the transportation ofcontainerized freight using truck and rail, capturing the best of each mode: combining the lower cost of railline-haul, with the door-to-door flexibility of trucking. A quantitative analysis for rail intermodal marketopportunities on behalf of Iowa shippers estimates that the total market opportunity in annual transportationcost savings is approximately $197 million. A business case developed for a mid-sized intermodal facility inEastern Iowa shows approximately $12.8 million to $15.5 million in total annual transportation cost savings,with an EFM6 of approximately one year (after the intermodal facility is fully operational and freight volumehas reached the expected level).
8 The exact ocean rate saving was not available at the time when this report was authored.
15
© 2016 Quetica, LLC
Development of Iowa Statewide Freight Transportation Network Optimization Strategy
3. Explore the opportunity of additional transload facilities to provide Iowa businesses with moreaccess to lower cost railroad freight services. Transloading is the process of transferring freightbetween two modes of transportation. Truck-to-rail and rail-to-truck transloading allows shippers to takeadvantage of the trucking access capabilities for short-haul pickup/delivery and the lower cost rail for long-haul shipments. Quantitative analysis of rail carload transportation estimates that the total marketopportunity (TMO) in annual transportation cost savings is approximately $20 million to $32 million perregion, across different Iowa regions in Eastern, Central, and Western Iowa. A business case developed fora transload facility in each region shows the EFM6 is approximately 1.7 to 2.7 years9 depending on location,after a facility is fully operational and freight volume has reached the expected level.
4. Explore opportunities to leverage a barge and rail multimodal solution to provide a cost-effectivefreight transportation alternative. Barge transportation has the lowest cost structure measured by costper ton-mile among all modes of transportation, though it typically requires longer transit time. Effectivelyleveraging barge transportation for non-time sensitive, large volume shipments can produce significant costsavings opportunities for Iowa companies. However, there are several constraints for Iowa businesses tofully utilize barge transportation, including limited access to adjacent barge terminals, delays in the aginglock and dam system during peak season, and winter closures on the Upper Mississippi River. A rail andbarge multimodal solution could be a viable alternative to transport commodities during winter betweenIowa and the Gulf Coast. A cost analysis estimates that the multimodal solution has comparable cost to theall rail alternative during winter. A feasibility study is recommended to explore the economic viability of anIowa to Gulf Coast bi-direction rail/barge multimodal service option.
5. Explore the opportunity to build a logistics park to co-locate cross-docking, intermodal,transloading and warehousing facilities. A logistics park is a development concept in which warehouseand distribution centers are located in a single zone, typically with access to railroad networks and primaryhighway systems. Co-locating logistics functions in a single development provides many benefits, includingsubstantially lower transportation costs, improved transportation efficiency, more transportation options forshippers, increased transportation capacity and better facility management. Quantitative analysis hasidentified a region in Eastern Iowa as an economically viable location for a new logistics park. Theestimated annual transportation cost savings for the logistics park is approximately $37.7 million to $52.9million. The estimated EFM6 is between 0.8 and 1.1 years.
6. Collaborate with the railroads to provide Iowa businesses with more capacity to accommodateforecasted growth in Iowa freight shipments. Quantitative analysis indicates that Iowa’s railroad networkprovides significant opportunities for reducing transportation costs for Iowa shippers. Improved railroadcapacity and access points are essential for Iowa shippers to convert additional truck freight to rail in thefuture. Iowa DOT is currently in the process of developing a state rail plan. It is recommended that IowaDOT complete the development of a rail plan to identify strategic opportunities for rail transportation.
9 In business case development, two scenarios will be used to quantify the investment opportunities: a base case scenario and aconservative case scenario. The base case is the scenario with the highest likelihood. The conservative case uses a more conservative setof assumptions to evaluate economic viability. The EFM values in the section are the base case.
© 2016 Quetica, LLC
16 Development of Iowa Statewide Freight Transportation Network Optimization Strategy
7. Explore opportunities to improve competitiveness of intermodal in Iowa by repositioning emptycontainers using barge and reducing repositioning costs. There is a shortage of empty containers inIowa. Because Iowa is a production state, it ships more containerized commodities than it consumes andpotentially there is an opportunity to ship more containerized commodities in the future. Repositioningempty containers is expensive. The estimated cost to reposition an empty container from Chicago to Iowaby rail is approximately $600. Many barges go up the Mississippi River empty, load grain and othercommodities in Illinois, Iowa, Minnesota, Missouri, and Wisconsin, and transport the commodities downriver to the Gulf Coast. There are cost effective opportunities to leverage empty up river barges toreposition empty containers from cities with large container inventories, such as Memphis and NewOrleans. The concept could include a virtual container yard to track and manage containers, facilitatecontainer leasing and management of related documents, as well as container returns and exchanges.
8. Explore and implement strategies to reduce deadhead truck miles. The volume of Iowa’s outboundtruck freight is much higher than inbound volume. This flow results in many deadhead miles as trucksreturn to Iowa empty in order to haul outbound freight. It is recommended that a public-private partnershipbe established to develop a mobile and web-based freight and truck information sharing andcommunication solution for both the contractual and spot markets to help reduce deadhead miles.
9. Explore opportunities for railroads to provide additional lower cost rail freight transportation forwithin Iowa high volume traffic lanes. The driver shortage, higher insurance costs and new governmentregulations are pushing truck transportation costs higher. Railroads are making progress in the short-haulmarket, as they improve operating efficiencies and service times. It is recommended that opportunities beexplored to provide additional lower cost freight rail services for intra-Iowa high volume traffic lanes.10
The strategies recommended above can provide Iowa shippers with sustainable transportation cost reductions byaddressing current and future freight network constraints, resulting in higher profitability and more competitivetransportation options for Iowa companies. An optimized freight transportation network also encourages companiesto establish operations and/or expand their supply chain network in Iowa.
During the revision process of this final report, Iowa DOT, IEDA, and their private partners have used theoptimization recommendations and the supporting data to develop an application for the Fostering Advancements inShipping and Transportation for the Long-term Achievement of National Efficient (FASTLANE) Grant. The grantapplication proposes a logistics park in Eastern Iowa to provide cross-docking, intermodal, transloading, and otherlogistics services. The project will provide Iowa and the surrounding states with access to a high capacity, efficient,and cost-competitive facility to move goods from truck to rail and vice versa. In July 2016, Iowa DOT and its privatepartners were awarded $25.6 million in the FASTLANE grant to develop the proposed logistics park.
10 Some of these high volume traffic lanes in the base year are Polk County – Linn County – Black Hawk County, Polk County – ScottCounty, and Polk County – Woodbury County.
17
© 2016 Quetica, LLC
Development of Iowa Statewide Freight Transportation Network Optimization Strategy
2. Introduction to Freight Transportation Network Optimization
The primary objective of the Statewide Freight Transportation Network Optimization Study is to effectivelyidentify and prioritize investment opportunities that will reduce transportation costs for Iowa’s businesses and topromote business growth in Iowa. Sponsored by the Iowa Department of Transportation (DOT) and Iowa EconomicDevelopment Authority (IEDA), the project team consists of subject matter experts from Iowa DOT and IEDA, aswell as consultants in supply chain network design and optimization.
The Iowa Freight Optimization Model (iFROM) is a tool developed to:
1. Simulate Iowa’s commodity flows using a demand module;
2. Simulate Iowa’s freight transportation network capacity in a capacity module; and
3. Evaluate optimization opportunities by applying the optimization and analysis algorithms to the demand andcapacity modeling and transportation cost benchmarks.
As a result of this study, a set of transportation network optimization strategies have been developed to reduce theoverall transportation costs for Iowa businesses to support economic development within the state. The strategieshave also been used as input to the development of Iowa DOT’s freight plan.
The remainder of this chapter provides an overview of the optimization methodology used in the iFROM. The detailsof the optimization model are discussed in Chapters 3, 4, and 5. Chapter 3 discusses demand modeling, Chapter 4discusses capacity modeling and Chapter 5 discusses transportation cost benchmarks. The findings from theconstraint analysis11 are documented in Chapter 6. The design alternatives are evaluated to develop therecommended optimization strategies in Chapter 7.
2.1. Optimization Methodology
This project uses a demand-based supply chain network design and optimization methodology to evaluate theefficiency of Iowa’s freight transportation network. The same approach used for decades in the private sector tooptimize complex global supply chain networks for large corporations is adopted in this project to optimize publicly-owned or privately-owned elements of the state freight transportation network.
11 In the Theory of Constraints (TOC) (Goldratt, 1984), a constraint is anything that prevents the system from achieving its performancegoal. The TOC is based on the premise that the rate of goal achievement by a goal-oriented system is limited by at least one constraint.By following a systematic five- step process of ongoing improvement, system performance can be improved in a cost-effective way.

© 2016 Quetica, LLC
18 Development of Iowa Statewide Freight Transportation Network Optimization Strategy
The approach includes four fundamental steps described in Figure 2-1.
Figure 2-1: Fundamental Steps of Freight Transportation Network Optimization Analysis
Source: Quetica, LLC
A network optimization model is designed to objectively analyze the optimized network structure, flows and policies.The optimized network design can be mathematically determined by looking at both physical and behavioralattributes of a supply chain network (see Figure 2-2):
Figure 2-2: Core Components of Supply Chain Network Design
Source: Quetica, LLC
19
© 2016 Quetica, LLC
Development of Iowa Statewide Freight Transportation Network Optimization Strategy
The optimization process requires collecting data for the quantitative analysis, including:
Demand: Base year demand and forecast year demand
Sites: Supply (or origin) sites, consumption (or destination) sites, ports of entrance/exit for import/export
Products: Aggregated to commodity groups by source
Data was collected from both public and proprietary data sources12, as well as through interviews and surveys withindustry subject matter experts on both the infrastructure and data essential to analyze Iowa’s statewide freighttransportation network.13
The expert input on industry practices is translated into policies14 within the model to establish an optimizationcomputer model for analysis:
Sourcing: Where are the products sourced? How much product is sourced?
Transportation: What modes are used to move products from different origins to destinations? What arethe capacity and costs by mode?
2.2. Overview of Iowa’s Freight Transportation Network
A freight transportation network consists of supply sites that have commodities, demand sites that request thosecommodities and multimodal transportation systems that can transport the commodities from supply sites todemand sites. In a freight transportation network model, supply and demand sites are modeled as nodes and themultimodal transportation network is modeled as unidirectional lines connecting the nodes. Freight transportationnetwork optimization uses computer tools and algorithms to analyze possible alternatives to deliver commodities tothe demand sites, while meeting the defined optimization objectives, such as lowered costs, lowered risks and/orshortened delivery time. This study focuses on optimizing Iowa’s freight transportation network for inbound,outbound and within Iowa (Iowa internal) freight movements to achieve the primary objective which is to reducetransportation costs for Iowa businesses.
In the iFROM, a freight transportation network is modeled as a collection of interconnected nodes in the study area.A typical segment of the network is shown in Figure 2-3. Each node (identified as a circle in the diagram) representsa geographic zone and each unidirectional link between two nodes represents the freight transportation networkconnection from the origin node to the destination node. Iowa’s businesses, their commodity consumption andproduction, as well as freight transportation flows, are aggregated into one large network to represent Iowa’sstatewide freight transportation network.
12 See more detailed discussion on data sources in Chapters 3, 4 and 5.
13 External subject matter experts representing key industry stakeholders were consulted throughout the project, including Iowa’s FreightAdvisory Council (FAC), shippers, transportation service providers, as well as industry associations, regulatory authorities, educational andresearch groups.
14 Supply chain network optimization studies also include inventory policies (i.e., where to keep the right amount of inventory to meetcustomer service and revenue goals). However, since this study is focused on freight transportation network optimization, inventorypolicies are outside of the scope.
© 2016 Quetica, LLC
20 Development of Iowa Statewide Freight Transportation Network Optimization Strategy
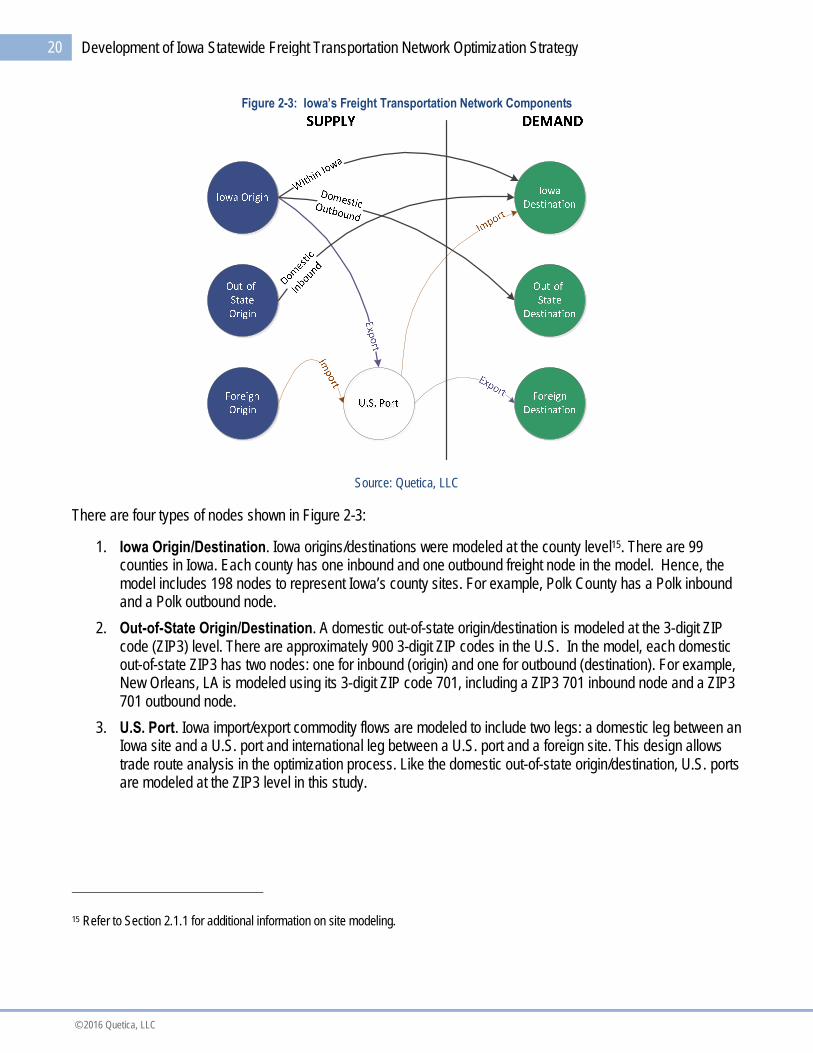
Figure 2-3: Iowa’s Freight Transportation Network Components
Source: Quetica, LLC
There are four types of nodes shown in Figure 2-3:
1. Iowa Origin/Destination. Iowa origins/destinations were modeled at the county level15. There are 99counties in Iowa. Each county has one inbound and one outbound freight node in the model. Hence, themodel includes 198 nodes to represent Iowa’s county sites. For example, Polk County has a Polk inboundand a Polk outbound node.
2. Out-of-State Origin/Destination. A domestic out-of-state origin/destination is modeled at the 3-digit ZIPcode (ZIP3) level. There are approximately 900 3-digit ZIP codes in the U.S. In the model, each domesticout-of-state ZIP3 has two nodes: one for inbound (origin) and one for outbound (destination). For example,New Orleans, LA is modeled using its 3-digit ZIP code 701, including a ZIP3 701 inbound node and a ZIP3701 outbound node.
3. U.S. Port. Iowa import/export commodity flows are modeled to include two legs: a domestic leg between anIowa site and a U.S. port and international leg between a U.S. port and a foreign site. This design allowstrade route analysis in the optimization process. Like the domestic out-of-state origin/destination, U.S. portsare modeled at the ZIP3 level in this study.
15 Refer to Section 2.1.1 for additional information on site modeling.

21
© 2016 Quetica, LLC
Development of Iowa Statewide Freight Transportation Network Optimization Strategy
4. Foreign Origin/Destination. There are 40 foreign countries or country groups in the model forimport/export analysis16. Each foreign origin/destination is modeled using the geographic location of thelargest port city in the area. A list of the foreign countries or country groups is provided in Table 2-1. Eachforeign country/country group has two nodes in the model: one for inbound and one for outbound.
Table 2-1: Foreign Countries or Country Groups in the Study Scope
Africa Asia Pacific Americas Europe
Eastern Africa
Middle Africa
Northern Africa
Remainder of SouthernAfrica
South Africa
Western Africa
Australia and New Zealand
Central Asia
China
India
Japan
Melanesia
Micronesia
Polynesia
Remainder of Eastern Asia
Remainder of Western Asia
Republic of Korea
Remainder of South-EasternAsia
Remainder of Southern Asia
Singapore
Argentina
Brazil
Canada
Caribbean
Chile
Colombia
Mexico
Remainder of CentralAmerica
Remainder of NorthernAmerica
Remainder of SouthAmerica
Eastern Europe
France
Germany
Netherlands
Remainder of NorthernEurope
Remainder of SouthernEurope
Remainder of WesternEurope
Spain
Turkey
United Kingdom of GreatBritain and Northern Ireland
Source: Economic Development Research Group (EDR Group, 2014)
The diagram in Figure 2-3 shows the 5 freight transportation scenarios modeled in the study:
1. Domestic Inbound – Freight is transported from a domestic out-of-state node to an Iowa node.
2. Domestic Outbound – Freight is transported from an Iowa node to a domestic out-of-state node.
3. Within Iowa (Iowa Internal) – Freight is transported between two Iowa nodes.
4. Import – Freight is transported from a foreign node to a U.S. port node first, then from the U.S. port node toan Iowa node.
5. Export – Freight is transported from an Iowa node to a U.S. port node first, then from the U.S. port node toa foreign node.
16 These 40 foreign countries or country groups are used in the import/export data in the model. Import/export data was acquired fromEconomic Development Research Group (EDR Group, 2014).
© 2016 Quetica, LLC
22 Development of Iowa Statewide Freight Transportation Network Optimization Strategy
Multiple modal choices may be available to transport freight between two nodes in the model. The transportationmodes in the study scope include:
Truck (both full truckload and less-than-truckload);
Rail (carload shipment);
Barge (for inland waterborne transportation);
Ocean (excluding liquid bulk); and
Multimodal (with any combination of truck, rail and barge).
These modes represent more than 98 percent of the Iowa’s freight volume in tonnage, according to the FreightAnalysis Framework Version 3.5 (FAF3) data from the Federal Highway Administration (FHWA), U.S. Departmentof Transportation (FAF3, 2014)17. Air freight, pipeline and ocean bulk tank are considered out of the study scope.
The freight network capacity modeling focuses on the Iowa portion of the network, which may skew results towardsthe center of the state in optimization algorithms and may understate opportunities on the edges of Iowa. Modelinga multistate region or the national freight network could deliver more balanced results for Iowa and its adjacentstates, but is beyond the scope of the current effort.18
The iFROM freight transportation network is modeled differently from a transportation network in a travel demandmodel. The iFROM network is focused on the amount of freight that can be transported from origin to destinationusing a specific mode in the transportation system, and the distance that the freight travels based on commerciallyused mode specific routing systems. Physical assets in a transportation network such as roads, bridges,interchanges, rail tracks and waterways are not the modeling components in the iFROM. The iFROM requiresnetwork data from the Iowa Statewide Travel Analysis Model (iTRAM, 2015) to be used to estimate freight capacityin the iFROM network, based on the physical characteristics of a transportation system.
2.2.1. Site ModelingThe primary purpose of the freight transportation network model is to enable network optimization for the definedproject objectives. Since minimizing transportation cost is the primary objective of this study, the model needs toenable effective transportation cost benchmarking. Transportation costs typically depend on a shipment’s origin,destination, transportation mode and equipment type used (e.g. dry van, refrigerated, tank). Therefore, eachcombination of origin-destination-mode-equipment in the model needs to be included in the cost benchmarkingprocess for optimization.
17 FAF Version 3.5 Year 2007 tonnage data is used in this estimate.
18 Chapter 8 discusses the suggested scope items for future study.
23
© 2016 Quetica, LLC
Development of Iowa Statewide Freight Transportation Network Optimization Strategy
The number of cost benchmarking scenarios can be estimated using the following formula:
TotalScenarioNumber = TotalOriginNodeNumber * TotalDestinationNodeNumber * TotalNumberOfModes * TotalNumberOfEquipmentTypes
Where:
TotalScenarioNumber = the total number of cost benchmarking scenarios
TotalOriginNodeNumber = the total number of origin nodes
TotalDestinationNodeNumber = the total number of destination modes
TotalNumberOfModes = the total number of transportation modes available
TotalNumberOfEquipmentTypes = the total number of transportation equipment types used
Iowa’s multimodal freight transportation network is very large, serving an area of more than 56,000 square miles,with a multitude of potential freight origin and termination zones, modal choices and equipment type combinations.To develop a model that would support relevant optimization decisions, choices were made to define Iowa’snetwork nodes that would provide a meaningful level of significance, without an overwhelming level of detail.
Iowa consists of 99 counties, with most of these counties defined by land surveys, as opposed to natural features.As a result, Iowa has a large number of “box counties” with a typical size of 576 square miles (24 mi. x 24 mi.)19. Itwas determined that building the model at a level of detail beyond county geography would increase the number ofnodes significantly, but would not meaningfully enhance the optimization results. Differences in distance and costcalculations from a higher number of nodes would be a small percentage of the total trip distance and cost. Countylevel modeling effectively balances the accuracy of the cost modeling and the model complexity in this study.
Domestic shipments using truck and rail are most commonly priced using 3-digit or 5-digit ZIP codes in thetransportation industry. There are approximately 900 3-digit ZIP Codes and 43,000 5-digit ZIP codes in the UnitedStates20. Modeling the domestic out-of-state sites at the ZIP3 level was deemed to provide sufficient accuracy fortransportation cost benchmarking in this study.
Modeling the sites at 5-digit ZIP level would have increased the number of cost benchmarking scenariossignificantly. For example:
The model examines shipments for five freight transportation modes: 1. Less-than-truckload (LTL), 2.Truckload (TL), 3. Rail (rail carload), 4. Intermodal (rail intermodal) and 5. Barge.
The model also assumes three equipment types for each mode: 1. Dry cargo trailer/container, 2.Refrigerated trailer/container (refrigerated) and 3. Liquid tank trailer or car
The model is based on 99 counties within Iowa. Each county has one inbound and one outbound node.
19 From http://factfinder.census.gov/faces/nav/jsf/pages/community_facts.xhtml
20 According to http://www.zipboundary.com/zipcode_faqs.html

© 2016 Quetica, LLC
24 Development of Iowa Statewide Freight Transportation Network Optimization Strategy
Given these parameters, using a 3-digit ZIP for out-of-state nodes (900 locations) results in a total of1,336,500 scenarios (99 x 900 x 5 x 3). Using a 5-digit ZIP for out-of-state nodes (43,000 locations) wouldhave resulted in 63,855,000 scenarios (99 x 43,000 x 5 x 3). The model using 5-digit ZIP code sites is over45 times larger than the 3-digit ZIP code model. It was determined that the additional detail resulting from5-digit ZIP code external node would add a degree of complexity that would significantly outweigh anyenhanced optimization results.
2.3 Optimization Model Architecture Overview
Figure 2-4 shows the conceptual architecture of the optimization model. The baseline model is developed torepresent the base year, freight transportation demand and network capacity and then is calibrated usingtransportation cost benchmarks to quantify baseline performance. The baseline performance is analyzed in anoptimization model to identify network constraints and design alternatives to address the constraints. The designalternatives are evaluated and used to develop a baseline optimization model to reduce transportation costs usingthe baseline transportation network. A greenfield optimization evaluates design alternatives to identifyopportunities to develop additional network elements to enhance the transportation network and address high valuenetwork constraints. Greenfield optimization is typically conducted after baseline optimization. As the final step,optimization strategies and the supporting business case are derived from the baseline and greenfield optimizationto develop the final recommendations.
Figure 2-4: Overview of Network Optimization Conceptual Architecture
Source: Quetica, LLC

25
© 2016 Quetica, LLC
Development of Iowa Statewide Freight Transportation Network Optimization Strategy
When developing Iowa’s freight transportation network model, the objectives of the model are to understand theconstraints within the network, to identify multiple network improvement opportunities and to evaluate strategies toimprove the network performance. Because the transportation network is operated and used by many independentparties, it may not be realistic to achieve the “most” optimal state of the network in an optimization. Optimizationbased on the new demand and network usage patterns would identify new improvement opportunities and furtherfine-tune the network performance.
The targeted benefits for Iowa of taking a network optimization approach, as an output of the optimization model,are:
To identify high value network constraints21 that significantly affect the freight network performance and major opportunities forimproving freight network performance;
To recommend specific and actionable optimization strategies;
To quantify investment opportunities to lower transportation costs for Iowa businesses and develop a business case for eachinvestment opportunity, using both quantitative and qualitative measurements;
To provide the building blocks to help Iowa businesses optimize their commercial supply chains to achieve sustainable costsavings; and
To develop a dynamic framework to support future analysis, as market conditions change.
A freight transportation network optimization is different from traditional travel demand modeling widely used intransportation planning. Travel demand modeling is used to “develop traffic forecasts, test alternative transportationscenarios, and evaluate transportation systems or policies” (CamSys, 2014). The results of travel demandmodeling are used to assist decision makers in making transportation planning and infrastructure investmentdecisions from a range of alternatives that may include addressing congestion issues or increasing networkcapacity. Traditionally, a “four-step process” is used for regional transportation planning (CamSys, 2014):
1. Trip generation (how many trips will be made?);
2. Trip distribution (where will the trips go?);
3. Mode choice (what modes of transportation will the trips use?); and
4. Trip assignment (what routes will the trips take).
21 High value constraints are the weakest links in a system. Addressing these constraints can deliver high cost savings, or high value to theusers of the freight transportation system.

© 2016 Quetica, LLC
26 Development of Iowa Statewide Freight Transportation Network Optimization Strategy
A freight transportation network optimization is focused on identifying opportunities to transport commodities fromorigins to destinations at lower costs for the users of the transportation system. The resulting optimization strategiestypically involve leveraging effective multimodal choices and freight consolidation methods to reduce transportationcosts, truck miles, and carbon emissions. A freight network optimization study can use the transportation networkand capacity data from a travel demand model to define the possible modal options for each origin-destination pair.These modal options are examined to select the most cost-effective mode to deliver the commodities in anoptimized network. The optimization results include quantifying the transportation cost saving benefits to thetransportation system users and projected impact to freight traffic patterns such as an increase or reduction of truckcounts, rail traffic, or barge traffic in the study area. The freight traffic pattern change data can potentially be fedback to the travel demand model to further analyze projected changes to the overall travel patterns after theoptimization strategies are implemented. As a result, freight network optimization and travel demand modeling mayprovide complementary tools to effective transportation planning.

27
© 2016 Quetica, LLC
Development of Iowa Statewide Freight Transportation Network Optimization Strategy
3. Demand Modeling
Modeling freight demand on Iowa’s multimodal networks required the assembly and normalization of Iowacommodity flow data. The data was enhanced with additional attributes, disaggregated and/or aggregated to thedesired level determined by the modeling parameters. The assembled demand data represents shipment levelinformation regarding commodity type, volume, demand nodes and supply nodes. The resulting database is acollection of shipments in the base and forecast years. Each shipment includes the following data:
Origin Site
Destination Site
Commodity/Product Group
Quantity of Commodity/Product Group22
Equipment Type Required 23
Transportation Mode(s) Available/Used
Shipment Direction (Within/Inbound/Outbound)
This study uses data from both public and proprietary sources. The primary source of the domestic commodity flowdata is FHWA’s Freight Analysis Framework (FAF), Version 3.5 data (FAF3, 2014). FAF is a compilation of datathat provides estimates of freight shipped to, from and within the United States. It provides a comprehensivenational picture of base year freight flows and forecasted trends to support policy studies. FAF3 data is builtprimarily on the 2007 Commodity Flow Survey (CFS) conducted by the U.S. Census Bureau and the Bureau ofTransportation Statistics (BTS). FAF3 data includes the following components (FAF3, 2014):
Transportation modes – Truck, Rail, Water, Air, Multiple Modes and Mail, Pipeline and Other andUnknown
Commodities – 43 commodities represented in 2-digit Standard Classification of Transported Goods(SCTG) codes (US DOT, 2007).
Domestic regions – 123 domestic regions, of which the entire state of Iowa is one region.
Foreign regions – 8 foreign regions including Canada, Mexico, Rest of Americas, Europe, Africa,Southwest & Central Asia, Eastern Asia and Southeast Asia & Oceania.
Freight tonnage22 and value -- In 2007 survey year and provisional update or forecast data in 2010, 2015,2020, 2025, 2030, 2035 and 2040.
22 All freight tonnage in both domestic and import/export models is represented in U.S. short tons, commonly referred to as a “ton”. A U.S.short ton is a unit of weight equal to 2,000 pounds (907.18474 kg).
23 Detail is covered in next part of Section 3.1.

© 2016 Quetica, LLC
28 Development of Iowa Statewide Freight Transportation Network Optimization Strategy
The primary source of the import/export commodity flow data is Economic Development Research Group’svFreight™ dataset (EDR Group, 2014). The vFreight™ dataset identifies trade between U.S. counties and 40foreign countries/country groups, including port of entry/exist. The data is consistent with the U.S. Census ForeignTrade database.24 EDR Group examines national commodity flow levels and assesses internal production andconsumption patterns to identify the volume and patterns of import and export commodity flow. EDR Group’smethod develops the trade data based on true commodity shipment origin/destination and resolves data distortionsdue to the use of other factors such as the locations of company headquarters.
The EDR Group’s import/export data includes the following components:
Transportation modes – Truck, Rail, Water, Air, Multiple Modes and Mail, Pipeline, and Other &Unknown.
Commodities – 43 commodities represented in 2-digit Standard Classification of Transported Goods(SCTG) codes (US DOT, 2007).
Iowa regions – all 99 counties in Iowa.
Non-Iowa domestic regions – all 3,044 remaining counties in the U.S.
Foreign regions – 40 foreign countries/country groups (see Table 2-1).
Freight tonnage and value in 2010.
The domestic and import/export commodity flow data is augmented and normalized into a network design andoptimization demand module, following the process described in Section 3.1. The resulting module is then usedwithin the network capacity and performance measurement modules in the optimization process to analyze thenetwork constraints and improvement opportunities. The resulting demand module includes:
1. Base year model – The base year is the 2010 model, which is derived from 2007 FAF3 domestic flow datadisaggregated using 2010 socio-economic variables and 2010 EDR Iowa import/export commodity flowdata.
2. Forecast year model – The forecast year is the 2040 model, which is derived from 2040 FAF3 domesticand import/export data, disaggregated using 2040 forecasted socio-economic variables.
24 The U.S. Census Foreign Trade web site is at http://www.census.gov/foreign-trade/data/index.html

29
© 2016 Quetica, LLC
Development of Iowa Statewide Freight Transportation Network Optimization Strategy
3.1. Demand Module Development Process
The base year model was developed following a four-step process illustrated in Figure 3-1:
Step 1 disaggregates FAF3 domestic data to the county level in the Iowa Statewide Travel Analysis Model(iTRAM, 2015), using various socio-economic data as variables in regression analysis.
Step 2 normalizes the data to the targeted geographic zones discussed in Chapter 2.
Step 3 disaggregates the data to the modes and transportation equipment types included in the scope. Themodes include truck (truck is disaggregated to truckload (TL) and less-than-truckload (LTL)), rail (railcarload), water (barge and ocean), and multimodal (multimodal is disaggregated to rail intermodal andmultimodal barge such as truck and barge). The equipment types include dry (for dry commodities),refrigerated (for refrigerated commodities) and tank (for liquid commodities). In addition, annual freighttonnage was broken down to quarterly and weekly tonnages using freight shipment seasonality information(USDA, 2015b, USACE, 2015a, and Cass, 2014). The disaggregated weekly tonnage by mode is used toestimate the number of shipments by mode, using a maximum tonnage per shipment of 20 tons, 104 tons,and 1,495 tons for truck, railcar and barge, respectively.
Step 4 is the final step to create the base year domestic demand module using Iowa’s commodity priorityand grouping structure in Tables 3-1 and 3-2. Additional analysis was also completed in Step 4 to excludesome of the commodity flows in the model that were irrelevant to freight transportation optimization. Theexcluded scope items are discussed in Section 3.2.

© 2016 Quetica, LLC
30 Development of Iowa Statewide Freight Transportation Network Optimization Strategy
Figure 3-1: Overview of Base Year Domestic Demand Module Development
Source: Quetica, LLC
While FAF3 is the primary data source, a number of additional data and information sources are used in thedemand model development process, including:
U.S. Census Bureau County Business Patterns data in 2010 (US Census Bureau, 2012).
U.S. Bureau of Economic Analysis (BEA) county employment data in 2010 (USDOC, 2010).
Iowa DOT’s primary highway system and railroad network in iTRAM (iTRAM, 2015) and barge terminaldirectory data (Iowa DOT Barge, 2011).
U.S. Department of Transportation’s Commodity Flow Survey data (USDOT, 2010).
Battelle’s Truck Equivalency Factors (Battelle, 2007).
U.S. Department of Agriculture Grain Transportation Report (USDA, 2015b).
U.S. Army Corp of Engineers Lock Performance Monitoring data (USACE, 2015a).
Cass Information Systems Freight Index (Cass, 2014).

31
© 2016 Quetica, LLC
Development of Iowa Statewide Freight Transportation Network Optimization Strategy
The key industry clusters included in a study of Iowa’s economic development strategy were reviewed (Battelle,2014). The major commodities in the key industry clusters and the freight shipment tonnage in those commoditieswere analyzed to identify a subset of 13 commodities at a 2-digit Standard Commodity Transportation Group(SCTG) level that became the focus of the optimization study. These 13 commodities, listed in Table 3-1, wereindividually evaluated in the demand module. The remaining commodities were aggregated into three groups in thedemand module, as shown in Table 3-2. The final commodity grouping structure allows the optimization model tofocus on transportation areas most relevant to Iowa’s strategic directions.
Table 3-1: Prioritized Commodities that are Modeled Individually in the iFROM Demand Model25
SCTG Code Description% of Total Domestic Freight Tonnage in Truck,
Rail, Water and Multimodal for Iowa
02 Cereal grains 32.80%
03 Other agriculture products 4.86%
04 Animal feed 7.29%
06 Milled grain products 1.16%
07 Other foodstuffs 5.10%
20 Basic chemicals 1.03%
24 Plastics/rubber 0.83%
26 Wood products 0.66%
31 Nonmetal mineral products 5.70%
34 Machinery 1.22%
35 Electronics 0.20%
36 Motorized vehicles 0.52%
38 Precision instruments 0.01%
Total 61.36%
Source: Base year data from FHWA, Freight Analysis Framework 3.5
25 The percentage is calculated by dividing the Iowa domestic freight tonnage of a commodity transported using truck, rail, water, ormultimodal modes by the total Iowa domestic freight tonnage of all the commodities using truck, rail, water and multimodal.
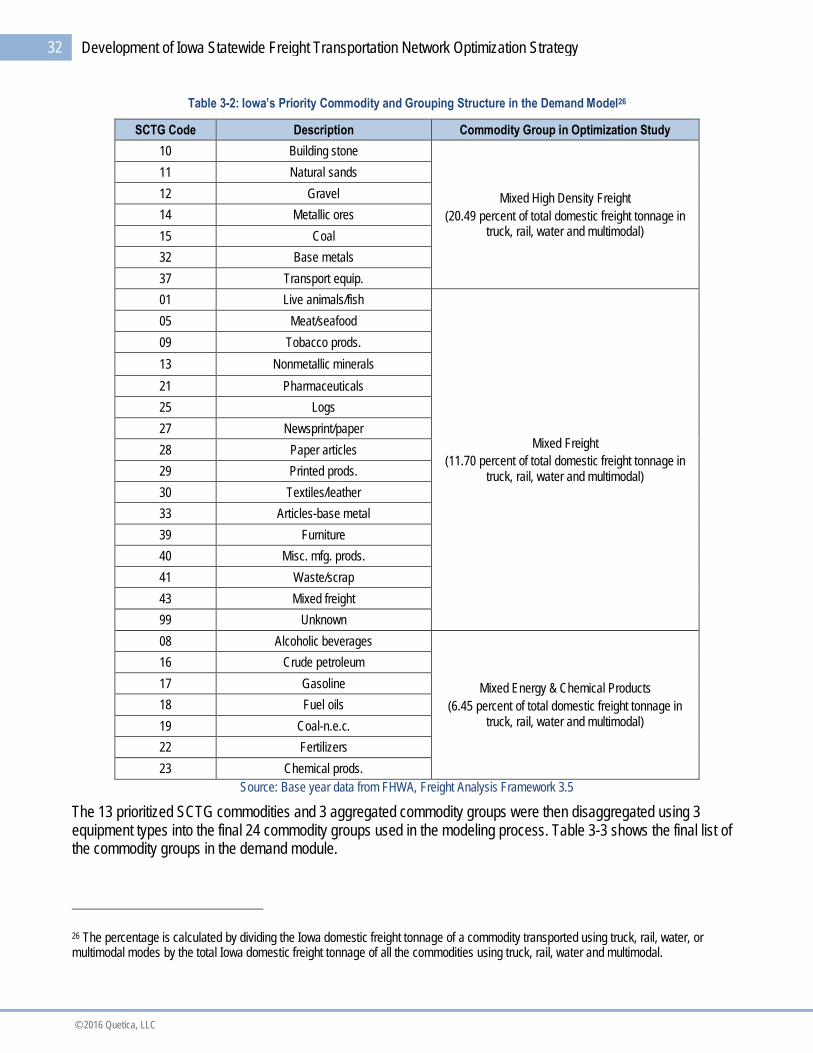
© 2016 Quetica, LLC
32 Development of Iowa Statewide Freight Transportation Network Optimization Strategy
Table 3-2: Iowa’s Priority Commodity and Grouping Structure in the Demand Model26
SCTG Code Description Commodity Group in Optimization Study
10 Building stone
Mixed High Density Freight
(20.49 percent of total domestic freight tonnage intruck, rail, water and multimodal)
11 Natural sands
12 Gravel
14 Metallic ores
15 Coal
32 Base metals
37 Transport equip.
01 Live animals/fish
Mixed Freight
(11.70 percent of total domestic freight tonnage intruck, rail, water and multimodal)
05 Meat/seafood
09 Tobacco prods.
13 Nonmetallic minerals
21 Pharmaceuticals
25 Logs
27 Newsprint/paper
28 Paper articles
29 Printed prods.
30 Textiles/leather
33 Articles-base metal
39 Furniture
40 Misc. mfg. prods.
41 Waste/scrap
43 Mixed freight
99 Unknown
08 Alcoholic beverages
Mixed Energy & Chemical Products
(6.45 percent of total domestic freight tonnage intruck, rail, water and multimodal)
16 Crude petroleum
17 Gasoline
18 Fuel oils
19 Coal-n.e.c.
22 Fertilizers
23 Chemical prods.
Source: Base year data from FHWA, Freight Analysis Framework 3.5
The 13 prioritized SCTG commodities and 3 aggregated commodity groups were then disaggregated using 3equipment types into the final 24 commodity groups used in the modeling process. Table 3-3 shows the final list ofthe commodity groups in the demand module.
26 The percentage is calculated by dividing the Iowa domestic freight tonnage of a commodity transported using truck, rail, water, ormultimodal modes by the total Iowa domestic freight tonnage of all the commodities using truck, rail, water and multimodal.
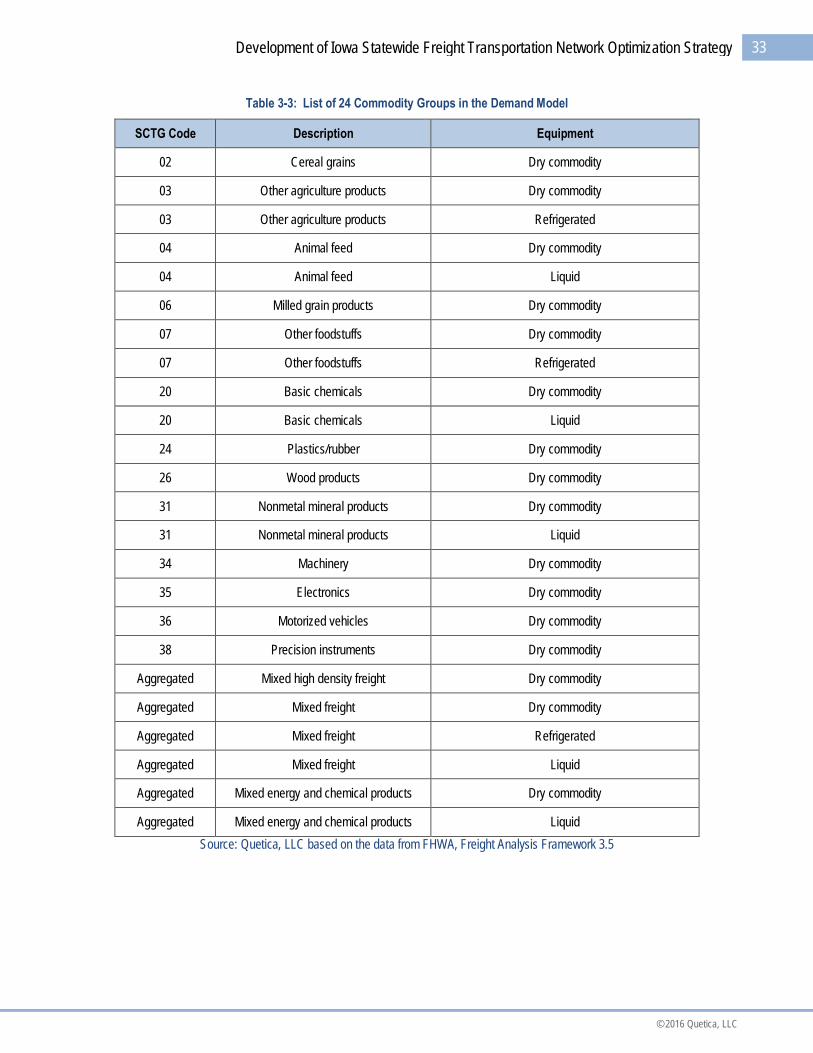
33
© 2016 Quetica, LLC
Development of Iowa Statewide Freight Transportation Network Optimization Strategy
Table 3-3: List of 24 Commodity Groups in the Demand Model
SCTG Code Description Equipment
02 Cereal grains Dry commodity
03 Other agriculture products Dry commodity
03 Other agriculture products Refrigerated
04 Animal feed Dry commodity
04 Animal feed Liquid
06 Milled grain products Dry commodity
07 Other foodstuffs Dry commodity
07 Other foodstuffs Refrigerated
20 Basic chemicals Dry commodity
20 Basic chemicals Liquid
24 Plastics/rubber Dry commodity
26 Wood products Dry commodity
31 Nonmetal mineral products Dry commodity
31 Nonmetal mineral products Liquid
34 Machinery Dry commodity
35 Electronics Dry commodity
36 Motorized vehicles Dry commodity
38 Precision instruments Dry commodity
Aggregated Mixed high density freight Dry commodity
Aggregated Mixed freight Dry commodity
Aggregated Mixed freight Refrigerated
Aggregated Mixed freight Liquid
Aggregated Mixed energy and chemical products Dry commodity
Aggregated Mixed energy and chemical products Liquid
Source: Quetica, LLC based on the data from FHWA, Freight Analysis Framework 3.5

© 2016 Quetica, LLC
34 Development of Iowa Statewide Freight Transportation Network Optimization Strategy
The same process as that described above, is used to create the base year import/export demand modules andforecast modules. The import/export module relies on EDR Group data described earlier and several other socio-economic data sources that were used in the baseline domestic demand module creation. The base yearimport/export demand module consists of the same commodity groups, transportation modes and equipment typesas the domestic module. The forecast year domestic and import/export demand modules were developed in iTRAMfrom FAF3 2040 forecasts disaggregated using the forecasted 2040 socio-economic data (iTRAM, 2015).
3.2. Out-of-Scope Items in Demand Model
Some commodity flows are excluded from the demand model, because they do not have a material impact on theoptimization of Iowa’s freight transportation systems. The freight volume of the excluded commodity flowsrepresents a very small portion of the total Iowa freight movements. The remainder of this section discusses theexcluded portions.
3.2.1. Out-of-Scope Items: Domestic FreightIn the seven modes and mode combinations included in FAF3 data, only truck, rail, water and multimodal areincluded in the Iowa model. Air, pipeline and unknown modes are excluded, because they are fairly independent ofthe focus of the optimization effort: Iowa’s highway, railroad and inland waterway networks. The out-of-scopemodes also represent a very small portion of Iowa’s total freight transportation demand. The mode exclusion doesnot affect the commodity prioritization and grouping. All the commodities transported using truck, rail, water andmultimodal remain in the study scope.
Figure 3-2 shows the domestic freight movement (in percentage of total tonnage) breakdown by mode. The fourFAF3 modes included in the study represent over 98 percent of the total freight volume in the FAF3 data.
Figure 3-2: FAF3 Freight Volume (Percentage of Total Tonnage) Breakdown by Mode
Source: Base year data from FHWA, Freight Analysis Framework 3.5
Some domestic waterborne commodity flows were also excluded from this study. FAF3 reported waterbornecommodity flows between Iowa and Alaska, California and Washington State. The volume of the flows isapproximately 0.03 percent of the overall domestic volume. Since the waterborne transportation cost benchmarksare not available for these traffic lanes and the small freight volume would not materially affect the optimizationresults, these commodity flows were excluded.
80.50%
13.40%
1.61%
0.00%2.86% 1.31%
0.32%Truck
Rail
Water
Air (include truck-air)
Multiple modes & mail
Pipeline
Other and unknown
35
© 2016 Quetica, LLC
Development of Iowa Statewide Freight Transportation Network Optimization Strategy
The domestic multimodal commodity flows were analyzed to determine which portions are most relevant to Iowa’sfreight transportation network. FAF3’s multimodal data includes the following scenarios:
Parcel, USPS or courier
Truck and rail
Truck and water
Rail and water
Other multiple modes
This optimization study focused on freight transportation using multimodal rail and multimodal barge for domesticshipments. Freight shipments using Parcel carriers, the United State Postal Service (USPS) and couriers wereidentified using 2007 CFS and excluded as freight volumes were approximately 0.21 percent of the total domestictonnage.
3.2.2. Out-of-Scope Items: Import/Export FreightSimilar to the mode selection in domestic commodity flows, only truck, rail, water and multimodal in import/exportare included in this study. Since import/export shipments typically have two legs of shipments – the domestic legbetween Iowa and a U.S. port and the international leg between a U.S. port and a foreign destination – the freighttransportation must use truck, rail, water, or multimodal in both legs of shipments to be included in the study.
Given the mode selection, the import/export data in the model focuses on commodity flows between Iowa and theforeign ports. The transportation from the foreign origin to the foreign port in import, or from the foreign port to theforeign destination in export, is outside of the study scope. For example, in the case of exporting to China from Iowavia the Port of Seattle (port of exit) and Port of Shanghai (port of entry), the domestic shipments from Iowa to thePort of Seattle and the international shipments from the Port of Seattle to the Port of Shanghai are included but theshipments from the Port of Shanghai to the final destinations in China are excluded in the study. In the case ofimport/export from/to Canada or Mexico, the port of entry and port of exit are considered the same. The studyincludes only the shipments between Iowa and the ports but excludes the shipments between the ports and theforeign origins/destinations. For example, in the case of exporting to Canada from Iowa via the Port of Chicago, theshipments from Iowa to the Port of Chicago are included but the shipments from the Port of Chicago to the finaldestinations in Canada are excluded in the study.
In addition, some foreign destination countries in export commodity flows are identified as unknown locations in theoriginal EDR Group data. These foreign destinations are likely unreported. Since cost benchmarking cannot bedone, commodity flows to unknown destinations are excluded in this study.
The selected commodity flow data in the demand module represents approximately 82.89 percent of the importtonnage and 95.12 percent of the export tonnage in the original EDR Group data.

© 2016 Quetica, LLC
36 Development of Iowa Statewide Freight Transportation Network Optimization Strategy
4. Capacity Modeling and Analysis
The mode-specific capacity module in the iFROM ensures that freight is not allocated to a single mode beyond itscapacity, which could result in unrealistic optimization strategies. The model focuses on three surface freighttransportation networks: highway, rail and inland waterway. Therefore, a capacity module was built for each modalnetwork.
As discussed in Section 2.1, the iFROM is constructed with three types of nodes, each with two directional flows(one for inbound and one for outbound):
Intra-Iowa (Within Iowa): Each county is modeled as two nodes: an inbound node and an outbound node.
Interstate domestic: Each domestic node is defined by a 3-digit ZIP Code.
Interstate foreign: Modeled as countries or country groups in foreign nodes.
The lines connecting nodes represent traffic lanes transporting commodity using truck, rail, water or multiple modes.Network capacity modules were developed for truck, rail and inland waterway to measure the maximum annualizedtonnage allowed in each node’s inbound or outbound freight shipment. In the case of waterborne transportation,barge transportation capacity is measured. Seaport and ocean freight capacity measurement is out of scope for thisproject. Multimodal with rail is included in rail. Multimodal with barge is included in barge. The total capacity of eachgeographic zone in a mode-specific network is the sum of the zone’s expected inbound and outbound capacity inannual tonnage by mode, based on the characteristics of a transportation system such as speed limit, number oflanes/tracks, lock-and-dam capacity, etc. The total freight tonnage an origin node can ship to a destination node islimited by the origin node’s outbound capacity and the destination node’s inbound capacity.27
The network capacity analysis in this study is focused on freight transportation capacity in each node in the iFROM(i.e., each county in Iowa) for a statewide freight transportation optimization. If no capacity constraint is identified fora mode in this analysis, it suggests that the mode-specific transportation network should not be a factor tomaterially affect the freight transportation patterns. Congestion, however, may still exist to affect passenger and/ortruck traffic. In addition, the freight capacity is modeled at the Iowa county level to estimate if network capacity isavailable to move freight into or out of a county. Within county, intra-zone freight capacity is out of the scope of thisanalysis. Segments of the network may have congestion within a county even if the analysis shows no capacityconstraints at the county level. Furthermore, the railroad network capacity analysis uses a method developed in anational freight rail infrastructure study (CamSys, 2007), to estimate capacity based on industry average data,historical through traffic data, and rail traffic routing assumptions. The capacity analysis results in this study may bedifferent from a railroad company’s internal assessments because the company manages capacity differently fromthe variables and factors used in this study. In addition, this analysis looks at capacity of the entire rail network inthe State of Iowa vs. capacity of one railroad company.
27 Intra-area capacity, i.e. freight moving entirely within a single zone, is not included in the model.

37
© 2016 Quetica, LLC
Development of Iowa Statewide Freight Transportation Network Optimization Strategy
4.1. Highway Network Capacity Analysis
The highway network capacity module focuses on Iowa’s Primary Highway System, a 10,000-mile network ofInterstate, US and state highways. This primary highway network is the backbone of the state’s transportationsystem that connects all 99 counties in Iowa. The objective of the Primary Highway System capacity analysis is toidentify constraints that could affect highway freight in the following two areas:
Overall network capacity constraints. Section 4.1.1 defines the highway capacity modeling approach.The analysis of highway network constraint uses Iowa DOT’s iTRAM 2015 traffic model outputs to estimatevolume-to-capacity (V/C) ratios to assess the highway network capacity in normal operating conditions.Capacity under peak hour conditions was not included in the current analysis. Options to enhance thecapacity analysis are discussed at the end of the chapter.
Economic impact in an emergency situation. The analysis assesses the transportation cost impact if asegment of the primary highway network becomes unavailable due to natural and/or man-made disasters.The analysis provides input for developing a plan to assess and improve overall transportation networkresiliency in emergency situations. Several high-impact highway segments and a limited number ofemergency scenarios are analyzed in this study.
4.1.1. Primary Highway Network Capacity and Utilization AnalysisThe highway network capacity analysis is focused on estimating the primary highway system’s V/C ratio todetermine if capacity constraints are likely in each primary highway segment. A county’s V/C ratio is the aggregatedaverage of V/C ratios of all highway segments in the county. The V/C ratio analysis is conducted for each highwaysegment since it provides more detailed information than a county-level utilization ratio. The V/C ratio in eachhighway segment is categorized into three levels below in Table 4-1.
Table 4-1: Primary Highway System Utilization Level
Level DescriptionVolume-to-Capacity
(V/C) Ratio
1 Below CapacityFree capacity is available to accommodate large increase of
highway traffic0% to 0.84
2 Near CapacityFree capacity is available to accommodate small increase
of highway traffic0.85 to 0.99
3 Over CapacityNo capacity is available to accommodate any increase of
highway traffic1.0 or more
Source: Iowa DOT
In the base year analysis, a highway segment’s V/C ratio is estimated using Average Daily Traffic (ADT) count andcurrent highway capacity in the iTRAM system 28. Analyzing the actual traffic count on Iowa’s primary highwaysshows that 80 percent of the daily traffic occurs in the 6 a.m. to 6 p.m. time period. Thus, the highway utilizationanalysis focuses on this 12-hour time period.
28 The base year is 2010 and forecast year is 2040.
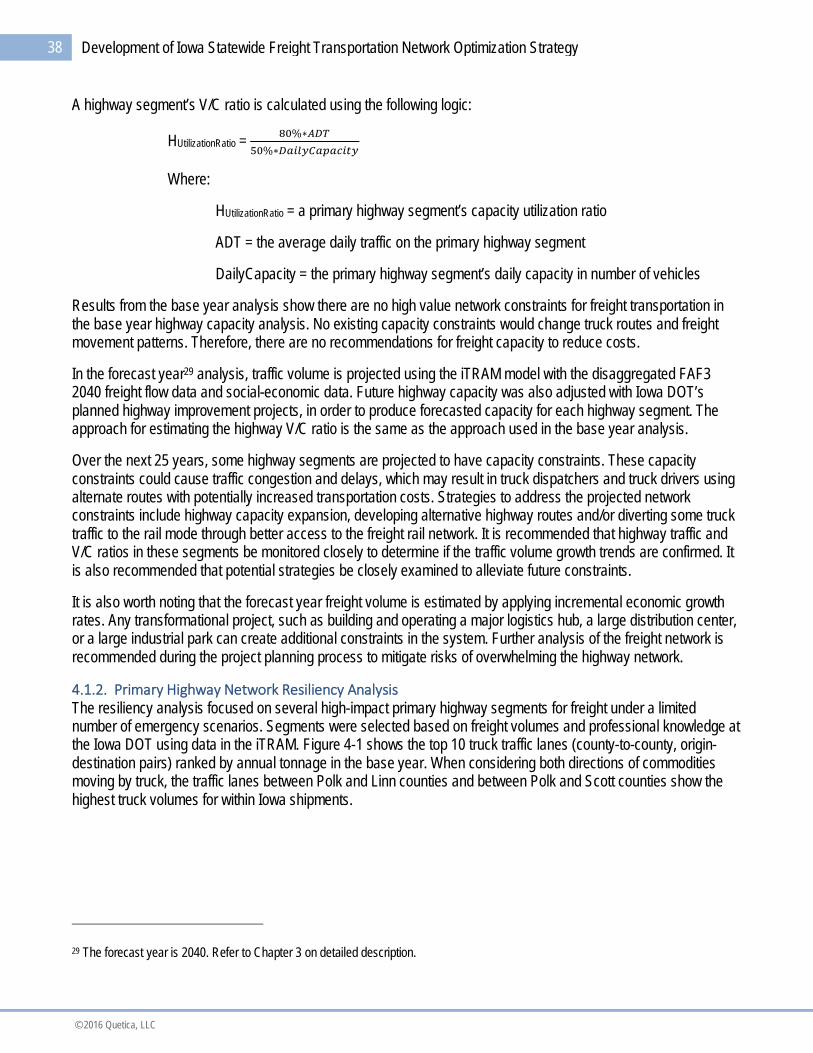
© 2016 Quetica, LLC
38 Development of Iowa Statewide Freight Transportation Network Optimization Strategy
A highway segment’s V/C ratio is calculated using the following logic:
HUtilizationRatio =Ψ∗
ହΨ∗௬௧௬
Where:
HUtilizationRatio = a primary highway segment’s capacity utilization ratio
ADT = the average daily traffic on the primary highway segment
DailyCapacity = the primary highway segment’s daily capacity in number of vehicles
Results from the base year analysis show there are no high value network constraints for freight transportation inthe base year highway capacity analysis. No existing capacity constraints would change truck routes and freightmovement patterns. Therefore, there are no recommendations for freight capacity to reduce costs.
In the forecast year29 analysis, traffic volume is projected using the iTRAM model with the disaggregated FAF32040 freight flow data and social-economic data. Future highway capacity was also adjusted with Iowa DOT’splanned highway improvement projects, in order to produce forecasted capacity for each highway segment. Theapproach for estimating the highway V/C ratio is the same as the approach used in the base year analysis.
Over the next 25 years, some highway segments are projected to have capacity constraints. These capacityconstraints could cause traffic congestion and delays, which may result in truck dispatchers and truck drivers usingalternate routes with potentially increased transportation costs. Strategies to address the projected networkconstraints include highway capacity expansion, developing alternative highway routes and/or diverting some trucktraffic to the rail mode through better access to the freight rail network. It is recommended that highway traffic andV/C ratios in these segments be monitored closely to determine if the traffic volume growth trends are confirmed. Itis also recommended that potential strategies be closely examined to alleviate future constraints.
It is also worth noting that the forecast year freight volume is estimated by applying incremental economic growthrates. Any transformational project, such as building and operating a major logistics hub, a large distribution center,or a large industrial park can create additional constraints in the system. Further analysis of the freight network isrecommended during the project planning process to mitigate risks of overwhelming the highway network.
4.1.2. Primary Highway Network Resiliency AnalysisThe resiliency analysis focused on several high-impact primary highway segments for freight under a limitednumber of emergency scenarios. Segments were selected based on freight volumes and professional knowledge atthe Iowa DOT using data in the iTRAM. Figure 4-1 shows the top 10 truck traffic lanes (county-to-county, origin-destination pairs) ranked by annual tonnage in the base year. When considering both directions of commoditiesmoving by truck, the traffic lanes between Polk and Linn counties and between Polk and Scott counties show thehighest truck volumes for within Iowa shipments.
29 The forecast year is 2040. Refer to Chapter 3 on detailed description.

39
© 2016 Quetica, LLC
Development of Iowa Statewide Freight Transportation Network Optimization Strategy
Figure 4-1: Top 10 County-To-County Truck Freight Traffic Lanes (Origin-Destination Pairs) by Commodity in 2010
Source: Disaggregated FAF3 Data in the iFROM
Further analysis comparing the highway segments between Polk and Linn counties, as well as between Polk andScott counties, found that the distance and travel time differences between primary and alternate routes of the Polk-Scott county pair were far greater than that of Polk-Linn county pair. Therefore, the Polk-Scott county pair isselected as the focus of the resiliency analysis.
Based on current traffic and freight transportation volumes on the highway segments, three scenarios wereidentified to analyze the resilience of primary highway segments for the Polk-Scott county pair:
Scenario 1: Closure of the I-80 Bridge over the Mississippi River. iTRAM is used to analyze the trafficimpact in this scenario. The analysis shows a change in truck travel time by 20 percent or 4.62 minutes anddistance by 53 percent or 6.97 miles, when rerouting traffic from a primary to an alternate route.
Scenario 2: A route closure on I-80 between Grinnell and Malcom. iTRAM is used to analyze the trafficimpact in this scenario. The analysis shows a change in truck travel time of 74 percent or 7 minutes anddistance by 84 percent or 8.2 miles, when rerouting traffic from a primary to an alternate route.
Scenario 3: A lane reduction on the same link as the route closure on I-80 between Grinnell andMalcom. Analysis of the scenario using iTRAM shows no difference in truck route selection, becausecurrent capacity (assuming 24 hours a day) can accommodate the traffic volume without rerouting vehiclesto an alternate route.
0
200,000
400,000
600,000
800,000
1,000,000
1,200,000
1,400,000A
nu
alT
on
na
ge
Freight Traffic Lane (Origin-Destination)
Mixed energy and chemicalproducts
Mixed freight
Mixed high density freight
Precision instruments andapparatus
Motorized vehicles
Electronics
Machinery
Nonmetal min. prods.
Wood prods.
Plastics/rubber

© 2016 Quetica, LLC
40 Development of Iowa Statewide Freight Transportation Network Optimization Strategy
Iowa DOT’s historical highway closure records30 were analyzed to estimate the probability of an I-80 closure. Theannual risk is quantified as the cost of impact multiplied by the probability in each scenario. Transportation costbenchmarks in the iFROM were used to quantify the cost impact in each scenario. The results are summarized inTable 4-2. Based on the historical probability of the highway closure and the financial impact during the closure, theannual risk is estimated at $66,000 and $100,000 per year in Scenario 1 and Scenario 2, respectively. The annualrisk is defined as the cost of impact (cost increase if trucks are rerouted to alternate routes) multiplied by theprobability of the event occurring based on historical data. There is no financial impact in Scenario 3. Since theannual risk is low compared to the costs to implement risk mitigation strategies such as building a new bridge ornew highway segment/lane, the analysis confirms that Iowa’s Primary Highway System is robust and canaccommodate truck freight between Polk and Scott counties, even when one key segment is disrupted.
Table 4-2: Summary of Financial Impact in Resilience Analysis Scenarios
Scenario DiversionDivertedTrucks
BaseRoute
Mileage
AlternateRoute
Mileage
$ PerMile
DailyAdditionalCost usingAlt. Route
AnnualAdditionalCost usingAlt. Route
ClosureProbability
AnnualRisk
I-80Mississippi
River Bridgeout in Quad
Cities
I-80 to I-74to IL-5 back
to I-802,784 13.14 20.11 $2.15 $42,000 $15,330,000
0.13 daysper month
$66,000
I-80unavailable
between Exits182 (Grinnell)
and 191(Malcom)
I-80 to US-146 to US-6
to US-635,210 9.8 18 $2.15 $92,000 $33,580,000
0.09 daysper month
$100,000
Source: Costs estimated by Quetica, LLC using data from the Iowa DOT
4.2. Rail Network Capacity
Iowa’s rail network consists of 3,851 miles of mainline track, operated by 18 railroads. Six Class I railroads operatein Iowa, including BNSF Railway Co. (BNSF), Canadian National Railway Co. (CN), Canadian Pacific Railroad(CP), Kansas City Southern Railway (KCS), Norfolk Southern Railway Co. (NS) and Union Pacific Railroad (UP).One of the remaining 13 railroads is a Class II railroad spanning two states; and 11 are Class III railroads (IowaDOT, 2016b). The rail transportation system is a critical component of Iowa’s freight network, carrying more than70 million tons of inbound or outbound freight in 2013 (Iowa DOT, 2016b). Some mainline rail corridors in Iowa arekey elements of the national railroad system carrying more than 200 million tons of freight through Iowa to otherdestinations in 2013 (Iowa DOT, 2016b).
30 Historical records available for the study were from September, 2013 to March, 2015.
41
© 2016 Quetica, LLC
Development of Iowa Statewide Freight Transportation Network Optimization Strategy
4.2.1. Overview of Rail Freight Network Capacity ModelingThe goal of the railroad network capacity analysis was to estimate total utilization and free capacity in Iowa’srailroad network. Current inbound, outbound, within Iowa, and through traffic are taken into account in Iowa’srailroad network capacity analysis. The rail freight network capacity analysis focuses on the within Iowa nodes (i.e.,the 99 Iowa counties). Rail capacity analysis for the network segments outside of Iowa is excluded from the scope.
A rail network utilization ratio was estimated for each Iowa county, in order to determine free capacity in annualtonnage available to accommodate additional freight. A summary of the modeling approach for estimating therailroad network utilization ratio is provided below:
Estimating total capacity. Iowa’s railroad network is broken down into numerous track segments. A tracksegment is defined as track running between two stations or branch lines. Each track segment in Iowa wasanalyzed for total capacity using the number of tracks, type of control system, mix of train types andindustry averages used in a national freight rail infrastructure and capacity study conducted by CambridgeSystematics (CamSys, 2007). The approach estimates the capacity in number of daily trains that can beaccommodated by the network.
Estimating freight capacity. If passenger trains go through a railroad track segment, the capacity used bythe passenger trains is subtracted from the capacity available to freight. Freight capacity was measuredusing the number of daily trains. It was then converted to estimate annual tonnage using average tonnageper train, 365 days per year. The average train volume is estimated at 8,000 tons for Class I railroads31 and2,500 tons for Class II and Class III railroads in the analysis.
Estimating the utilization ratio for each track segment. Each year, Iowa DOT collects freight tonnagedata from each railroad operating in Iowa. This data was used to represent the current utilization of Iowa’srailroad network. Track segment utilization was estimated by dividing the total reported freight tonnage bythe freight capacity.
Estimating the utilization ratio for each county. County railroad utilization ratios were estimated usingthe average of each segment’s utilization ratio in the county.
31 The estimated numbers are derived from historical freight volume numbers railroad companies reported to Iowa DOT and a national railfreight infrastructure and capacity study conducted by Cambridge Systematics (CamSys, 2007), with feedback from some of the railroadcompanies in Iowa.

© 2016 Quetica, LLC
42 Development of Iowa Statewide Freight Transportation Network Optimization Strategy
The following formula summarizes the approach in a mathematic notation:
RUtilizationRatio =∑ (( ) ∗ைே∗ୈୟ୷�–�ி)÷సభ (( ) ∗ைே∗ୈୟ୷)
Where:
RUtilizationRatio = the average rail freight network utilization ratio in an Iowa county
n = the number of railroad track segments in the Iowa county
= the theoretical number of daily trains at capacity in each railroad track segment
= the number of daily passenger trains in each railroad track segment
= the average number of tons per train in each railroad track segment
=ܨ current freight tonnage in each railroad track segment
Day = the number of days in a year for freight transportation
4.2.2. Rail freight Network Utilization AnalysisIowa’s rail freight network utilization was analyzed for each Iowa county to estimate free capacity available toaccommodate additional freight tonnage in the freight network optimization. Iowa’s 2013 freight tonnage data fromrail companies operating in Iowa was used in the modeling approach described in Section 4.2.1 to estimate currentutilization ratios. The utilization of each county’s rail freight network is then categorized into five levels listed inTable 4-3.
Table 4-3: Rail Freight Network Utilization Level
Level Color DescriptionEstimatedUtilization
A Below Capacity Free capacity is available to accommodate large freight increase 0% to 70%
B Near Capacity Free capacity is available to accommodate small freight increase 71% to 80%
C At CapacityLimited free capacity may be available to accommodate verysmall freight increase
81% to 100%
D Above Capacity No capacity is available to accommodate any additional freight Greater than 100%
N Not Applicable No railroad tracks in the county N/A
Source: Developed by Quetica, LLC using data from the Iowa DOT

43Development of Iowa Statewide Freight Transportation Network Optimization Strategy
© 2016 Quetica, LLC
Figure 4-2: Iowa Rail Freight Network Utilization Map Using 2013 Data
Source: Iowa DOT

44 Development of Iowa Statewide Freight Transportation Network Optimization Strategy
© 2016 Quetica, LLC
Figure 4-2 provides a railroad network utilization map in Iowa. Nine Iowa counties do not have direct access toIowa’s rail network, including: Audubon, Davis, Decatur, Grundy, Howard, Jones, Ringgold, Taylor and Van Burencounties. Eight counties have rail networks at or above capacity, including: Adams, Boone, Harrison, Mills,Montgomery, Story, Tama, and Union counties. The capacity constraints identified in the railroad network weretaken into account in multimodal freight network optimization modeling.
Iowa’s rail freight network was also analyzed to estimate the projected free capacity in the forecast year32. Severalassumptions were made in the forecast year network capacity analysis:
The railroad network capacity stays the same in the forecast year, i.e., the conditions of the railroad tracksegments and the control systems used are assumed to remain the same in the forecast year.
The number of passenger trains and the railroad track segments used by the passenger trains areassumed to remain the same in the forecast year.
FAF forecasted 2040 rail tonnage increase is used to assess the capacity in the forecast year. Todetermine the rail freight increase in each county, both the base year and the forecast year FAF data wasdisaggregated to the county level (iTRAM, 2015). A growth factor was applied to the base year data toestimate the forecast year tonnage increase. The growth factors were determined using Table 4-4.
Table 4-4: Growth Factors Used to Estimate Iowa Rail Freight Network Utilization in the Forecast Year
RegionFAF 2007 Domestic
Rail Freight TonnageFAF 2040 Domestic
Rail Freight TonnageGrowthFactor
Applicability
Nationwide 1,745,239,042 2,181,987,584 125.03%Not used in the forecast year capacity
analysis
Iowa and nearby states(IA, MN, WI, IL, MO,
NE, SD)461,069,956 712,178,109 154.46%
Growth factor is used to estimateincrease in rail freight in segments
owned by Class I railroads
Iowa Statewide 60,967,102 84,241,782 138.18%Growth factor is used to estimate
increase in rail freight in segmentsowned by Classes II & III railroads
Source: Quetica analysis using FAF 3.5 data
Using the assumptions above, the analysis is focused on the impact of projected increases in rail freight volumes inthe forecast year, using the same modeling method as the base year analysis. Figure 4-3 is an Iowa rail systemmap showing the projected forecast year network utilization. Out of the 90 counties in Iowa that have direct accessto the rail network, it is projected that 29 counties will be at or above capacity (up from eight in the base year).These capacity constraints in Iowa’s railroad network will likely limit the opportunities for companies wishing toconvert more freight from truck to rail to reduce transportation costs. An analysis of this limitation is discussedfurther in Chapter 7.
32 The forecast year is 2040.
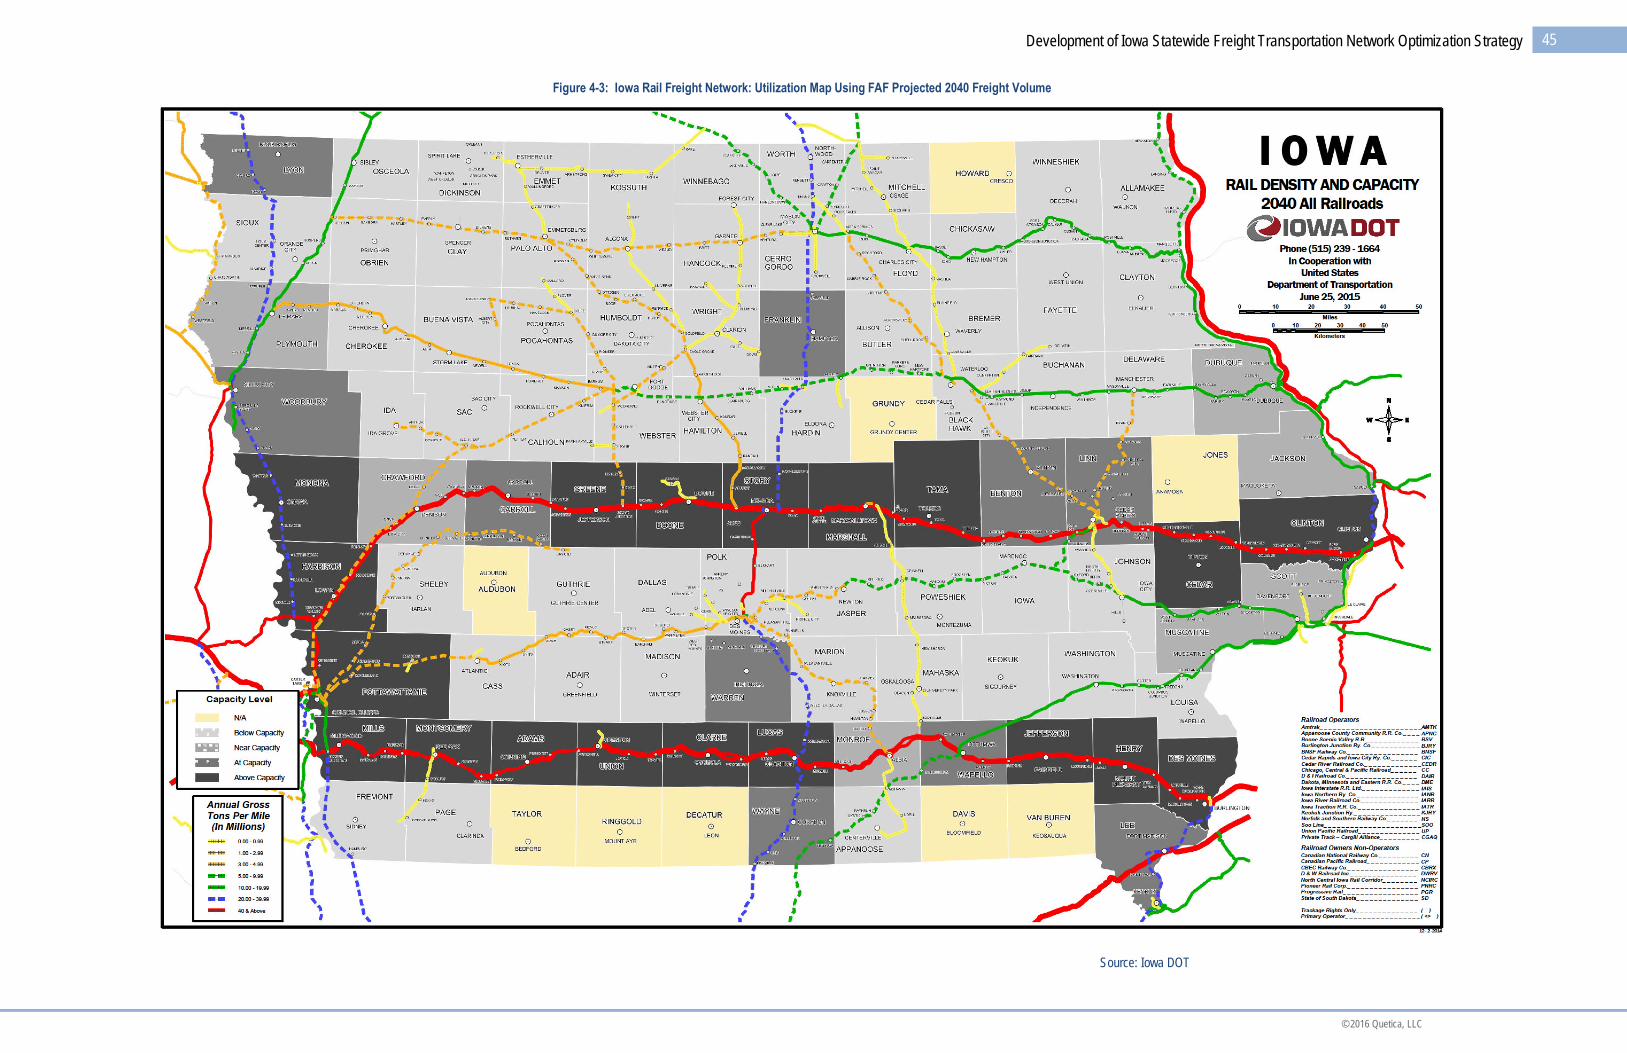
45Development of Iowa Statewide Freight Transportation Network Optimization Strategy
© 2016 Quetica, LLC
Figure 4-3: Iowa Rail Freight Network: Utilization Map Using FAF Projected 2040 Freight Volume
Source: Iowa DOT

46 Development of Iowa Statewide Freight Transportation Network Optimization Strategy
© 2016 Quetica, LLC
4.3. Inland Waterway Network Capacity
Iowa has 491 miles of navigable rivers bordering the state. It is the only state in the nation bordered by twonavigable rivers: the Mississippi and Missouri Rivers. In 2012, over 110 million tons of commodities were shippedon the Upper Mississippi River and over 3.9 million tons of commodities were shipped on the Missouri River(USACE, 2014). There are 60 barge terminals in Iowa that shipped and received freight in 2011, 55 on theMississippi River and 5 on the Missouri River (Iowa DOT Barge, 2011).33 In 2010, 10.5 million tons of commodities(mostly grain, coal and fertilizer) moved to, from and within Iowa by barge, mostly on the Upper Mississippi (IowaDOT, 2014c). Grain represented the largest tonnage, totaling nearly 56 percent overall. Sand and gravel was thesecond largest commodity, totaling 9 percent of the tonnage, followed closely by chemicals and fertilizer, whichtotaled 8 percent. Other commodities transported by barge include coal, manufactured goods, manufacturedmachinery and waste material
4.3.1. Upper Mississippi River Freight Capacity AnalysisThe Upper Mississippi River borders Iowa for 312 miles and is a vital segment of the U.S. Inland Waterway System.The Upper Mississippi (from Minneapolis to the mouth of the Ohio River) provides an economic transportation linkfrom the upper Midwest to the lower Mississippi Valley and the Gulf of Mexico. There are 11 navigation locks anddams (Locks and Dams 9 through 19) on the Mississippi River bordering Iowa (USACE, 2012). Of these locks, 8have a single chamber measuring 110 feet wide by 600 feet long and lock 19 has a chamber 110-feet wideby-1200feet long built in 1957 (USACE, 2012). The other structures were built in the 1930s (USACE, 2012). Figure 4-6shows a map of the Upper Mississippi and Illinois Rivers, including the locks and dams on the Iowa portion of theUpper Mississippi.
Lock capacity affects the barge transportation capacity and grain rates on the Mississippi River (Yu, 2006). A typicalbarge is 195 feet long and 35 feet wide. A 600 foot lock will accommodate, at most, eight jumbo barges (plus thetowboat) in a single lockage. Modern towboats on the Upper Mississippi River can push 15 barge tows that are1,200-foot-long. Therefore, to pass through a 600 foot lock, it is necessary to break tows in half to navigate thechamber and reassemble the tow once through (double lockage). A double lock operation takes approximately 60to 90 minutes (Yu, 2006; USDA 2010). A 1,200 foot lock can accommodate up to 17 jumbo-barges plus thetowboat. The passage of towboat and barges at a 1,200 foot lock often requires only about 30 to 45 minutes (Fuller1998; Yu 2006; USDA 2010).
Given these constraints, barge transportation capacity for Iowa businesses is mainly determined by the number ofbarges that can lock through 600 foot locks on the Upper Mississippi River each shipping season. Since Lock andDam 18 has a 600 foot chamber, as do most of the other 10 locks and dams in Iowa, the inland waterway networkcapacity analysis for Iowa focuses on the capacity of Upper Mississippi River Lock and Dam 18, which is thesouthernmost 600-foot lock and dam in Iowa.
33 Some of these barge terminals have become inactive recently.

47Development of Iowa Statewide Freight Transportation Network Optimization Strategy
© 2016 Quetica, LLC
Figure 4-4: Map of Upper Mississippi and Illinois Rivers with Locks and Dams
Source: http://www.mvr.usace.army.mil/portals/48/docs/CC/2013_Flood/UMR-IWWSystemMap.jpg

48 Development of Iowa Statewide Freight Transportation Network Optimization Strategy
© 2016 Quetica, LLC
The capacity in tonnage for Lock and Dam 18 is determined by the number of loaded barges that can lock throughduring a shipping season. Historical data from the U.S. Army Corps of Engineers (USACE) 2015 Factsheet wasused to analyze the number of lockages/cuts, the average number of barges per lockage and the number of emptybarges in 2014. Lockage time was also collected from USACE data (USACE Lock Performance, 2015) to estimatethe number of daily lockages/cuts per day.
The data is used to estimate the capacity represented as annual freight tonnage that can pass through Lock andDam 18, including both up-river and down-river traffic, using the following formula:
MS-RIVERBargeCapacity = ∗ ܤ ∗ ܮ ∗ ∗ܮܥ ܨܮ ∗ ݕܦ
Where:
MS-RIVERBargeCapacity = the barge freight capacity on Upper Mississippi River
= the tonnage of freight each barge can carry
ܤ = the average number of barges per commercial lockage
ܮ = the maximum number of lockages per day
=ܮܥ the percentage of lockages that are commercial
ܨܮ = the load factor, i.e., percent of barges loaded
=ݕܦ the average number of days in a shipping season
The formula computes the total capacity in tonnage for barge transportation for all Upper Mississippi River states,including Illinois, Iowa, Minnesota and Wisconsin. The maximum freight per barge is assumed to be 1,500 tonsusing Iowa DOT’s estimate (Iowa DOT Cargo, 2014). The average number of barges per lockage is estimated at5.4, using USACE data34 (USACE, 2015b). The average lockage time is 37 to 48 minutes and the maximumnumber of lockages per day at capacity is estimated at 30 based on USACE lock performance data (USACE LockPerformance, 2015).35 The 2014 data shows that 75.38 percent of barges are loaded (USACE, 2015b) and onaverage 77.54 percent of lockages are commercial barge traffic (USACE, 2015b).
The shipping season on the Upper Mississippi River typically runs from early April to the end of November. To avoidoverestimating freight capacity, the barge capacity estimation module uses 240 days per year36 as the number ofdays in a shipping season. With these assumptions, the estimated barge freight capacity in Lock and Dam 18 isapproximately 34.1 million tons per year. Table 4-5 summarizes the assumptions and estimated capacity.
34 The 2014 USACE data for Locks and Dams 9 to 18 was used to estimate the averages.
35 The average time was estimated at 48 minutes using USACE lock performance data for Lock and Dam 18 between February, 2000 andJune, 2015. The average time was estimated at 37 minutes using USACE lock performance data for Lock and Dam 9 through 18 betweenMay 23, 2015 and June 22, 2015. The average time of 48 minutes was used in this study. It is assumed that the locks and dams canoperate at the maximum 24 hours per day during a shipping season.
36 Two hundred forty days is based on a shipping season lasting 8 months per year, 30 days per month
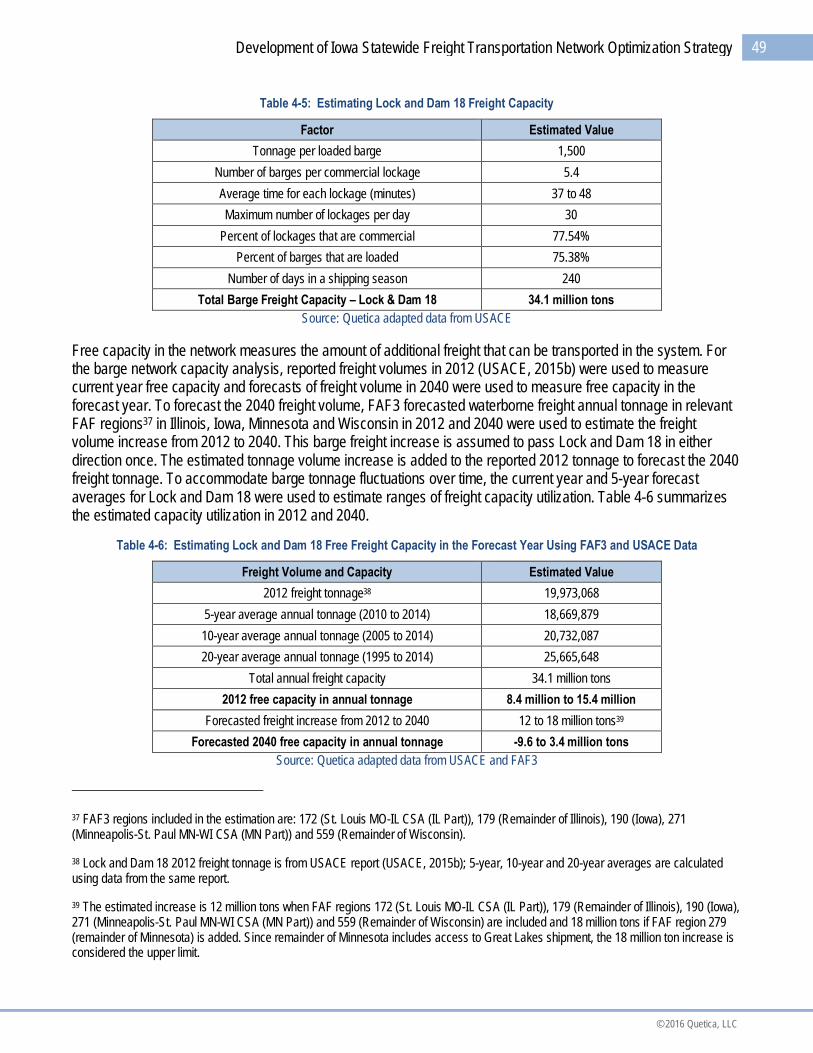
49Development of Iowa Statewide Freight Transportation Network Optimization Strategy
© 2016 Quetica, LLC
Table 4-5: Estimating Lock and Dam 18 Freight Capacity
Factor Estimated Value
Tonnage per loaded barge 1,500
Number of barges per commercial lockage 5.4
Average time for each lockage (minutes) 37 to 48
Maximum number of lockages per day 30
Percent of lockages that are commercial 77.54%
Percent of barges that are loaded 75.38%
Number of days in a shipping season 240
Total Barge Freight Capacity – Lock & Dam 18 34.1 million tons
Source: Quetica adapted data from USACE
Free capacity in the network measures the amount of additional freight that can be transported in the system. Forthe barge network capacity analysis, reported freight volumes in 2012 (USACE, 2015b) were used to measurecurrent year free capacity and forecasts of freight volume in 2040 were used to measure free capacity in theforecast year. To forecast the 2040 freight volume, FAF3 forecasted waterborne freight annual tonnage in relevantFAF regions37 in Illinois, Iowa, Minnesota and Wisconsin in 2012 and 2040 were used to estimate the freightvolume increase from 2012 to 2040. This barge freight increase is assumed to pass Lock and Dam 18 in eitherdirection once. The estimated tonnage volume increase is added to the reported 2012 tonnage to forecast the 2040freight tonnage. To accommodate barge tonnage fluctuations over time, the current year and 5-year forecastaverages for Lock and Dam 18 were used to estimate ranges of freight capacity utilization. Table 4-6 summarizesthe estimated capacity utilization in 2012 and 2040.
Table 4-6: Estimating Lock and Dam 18 Free Freight Capacity in the Forecast Year Using FAF3 and USACE Data
Freight Volume and Capacity Estimated Value
2012 freight tonnage38 19,973,068
5-year average annual tonnage (2010 to 2014) 18,669,879
10-year average annual tonnage (2005 to 2014) 20,732,087
20-year average annual tonnage (1995 to 2014) 25,665,648
Total annual freight capacity 34.1 million tons
2012 free capacity in annual tonnage 8.4 million to 15.4 million
Forecasted freight increase from 2012 to 2040 12 to 18 million tons39
Forecasted 2040 free capacity in annual tonnage -9.6 to 3.4 million tons
Source: Quetica adapted data from USACE and FAF3
37 FAF3 regions included in the estimation are: 172 (St. Louis MO-IL CSA (IL Part)), 179 (Remainder of Illinois), 190 (Iowa), 271(Minneapolis-St. Paul MN-WI CSA (MN Part)) and 559 (Remainder of Wisconsin).
38 Lock and Dam 18 2012 freight tonnage is from USACE report (USACE, 2015b); 5-year, 10-year and 20-year averages are calculatedusing data from the same report.
39 The estimated increase is 12 million tons when FAF regions 172 (St. Louis MO-IL CSA (IL Part)), 179 (Remainder of Illinois), 190 (Iowa),271 (Minneapolis-St. Paul MN-WI CSA (MN Part)) and 559 (Remainder of Wisconsin) are included and 18 million tons if FAF region 279(remainder of Minnesota) is added. Since remainder of Minnesota includes access to Great Lakes shipment, the 18 million ton increase isconsidered the upper limit.

50 Development of Iowa Statewide Freight Transportation Network Optimization Strategy
© 2016 Quetica, LLC
As shown in Table 4-6, Lock and Dam 18 forecasts suggest that the lock will be operating at or over capacity in2040 to accommodate forecasted barge volume increases predicted by FAF. The future free capacity estimateassumes the locks and dams operate in an ideal condition 24 hours day, 240 days a year without serviceinterruptions. Operating at capacity means that any service interruption during a shipping season frommaintenance, floods, accidents and any other natural or man-made disasters will cause major disruptions to bargetransportation. It is recommended that freight capacity on the Upper Mississippi River locks and dams be evaluatedand improved to accommodate the forecasted freight increases suggested by FAF3.
4.3.2. Missouri River Freight Capacity AnalysisThe Missouri River originates in southwestern Montana and flows in a southeasterly direction about 2,315 miles tojoin the Mississippi River approximately 15 miles upstream of St. Louis, Missouri. The river is navigable from SiouxCity, Iowa to the mouth at St. Louis, a distance of 734 miles. The waterway is free flowing without locks and dams.Shipping season is usually from April 1st through November 30th. During extended droughts, the shipping seasonmay still last for over 6 months.
Since the Missouri River is free flowing without locks and dams, the river’s freight capacity is not constrained by thecapacity of locks and dams, like the Upper Mississippi River. However, recreational uses and reservoirs in NorthDakota and Montana have periodically reduced water flows and barge draft on Iowa portions of the river. TheMissouri River’s total navigation tonnage in 2012 was below 4 million tons. Its peak total navigation tonnage was9.73 million tons in 2001, therefore it is assumed that the river has free capacity for barge transportation when theriver is at normal water level. The Missouri River’s freight capacity is not considered a constraint in Iowa’s freightnetwork. Without a lock and dam system, however, barge transportation is more likely to get disrupted due to floodor drought situations. For example, according to the Columbia Missourian, “Long-haul shipping on the MissouriRiver fell from 1.3 million tons in 2000 to 269,000 tons in 2009. Water levels too low for heavy barge traffic droveaway most of the existing shipping on the 675-mile stretch from Sioux City, Iowa, to St. Louis.” 40
40 More information is available at http://www.columbiamissourian.com/news/missouri-river-flooding-hurts-barge-industry/article_ed4b5cfb-a9d5-5155-bf7b-f9b7282ade37.html

51Development of Iowa Statewide Freight Transportation Network Optimization Strategy
© 2016 Quetica, LLC
5. Quantitative and Qualitative Measurements
This project uses both quantitative and qualitative metrics to evaluate the optimized network and to test designoptions that will meet the overall strategic objectives of Iowa DOT and IEDA. Examples of quantitative metrics usedin the analysis include cost, transit time, and financial risk, with cost being the primary quantitative metric.Qualitative metrics were used to evaluate optimization and design options after they are evaluated favorably usingthe quantitative measurements. For example, the quantitative analysis may identify location options to constructnew distribution centers. Qualitative measurements such as road and utility access can be used to evaluate thelocation options and eliminate locations that do not have access to the highway or utilities networks. The remainingchapter discusses the quantitative and qualitative measurements used in this study.
5.1. Quantitative Measurements
A freight cost benchmark database was developed using public and proprietary data sources, including data fromUSDA, third-party logistics (3PL) companies, carriers and shippers, as well as freight audit and payment (FAP)service providers. The benchmarking database includes two main components: linehaul costs and fuel surcharges.Cost benchmarks were developed for each combination of traffic lane (origin and destination pair), distance, mode,transportation equipment type and tonnage ranges. In addition to linehaul costs, the transportation cost benchmarksinclude the following components: 41
Less-than-truckload (LTL) rate benchmarks. LTL rate benchmarks were developed for all ZIP3 to ZIP3traffic lanes in the demand model, using SMC3 CzarLite, a standard trucking industry tariff, to determinethe base rate based on the origin-destination distance for blended freight classes. An industry average 70percent discount level and $80 minimum charge were then applied to the base rates, when developing thebenchmarks for the commodity groups included in this study.
Truckload (TL) rate benchmarks. TL rate benchmarks were developed from rate benchmark dataacquired from 3PL and trucking companies to measure the costs of moving one truckload from origin todestination. Benchmarks were developed for each ZIP3 to ZIP3 traffic lane, by equipment type, tripdistance and industry average minimum linehaul charge.
Rail carload cost benchmarks. Rail carload benchmarks were developed from PC*Miler Rail, LLamasoft,and U.S. Rail to measure the costs of moving one carload from origin to destination. Benchmarks weredeveloped for each ZIP3 to ZIP3 traffic lane, equipment type and trip distance.
Rail intermodal cost benchmarks. Rail intermodal benchmarks are developed from PC*Miler Rail,LLamasoft, and U.S. Rail to measure the cost of moving one container from origin to destination.Benchmarks were developed for each ZIP3 to ZIP3 traffic lane, container type and distance. Theintermodal benchmarks include lift costs.
Fuel surcharges. Fuel surcharges are an add-on cost item separate from the contract rate. Surchargesadjust the contract rate by taking into account significant variation in fuel prices. The fuel surchargebenchmark was based on the fuel price in first quarter, 2014.42
41 Shipment data is from 2010 and freight rate benchmarks are from 2014.
42 The fuel surcharge benchmark was based on fuel price data from the Energy Information Administration (EIA).

52 Development of Iowa Statewide Freight Transportation Network Optimization Strategy
© 2016 Quetica, LLC
Intermodal drayage cost benchmarks. Truck drayage cost benchmarks are developed from dataacquired from trucking companies for distance bands up to 400 miles, in order to estimate end-to-end,intermodal shipment costs in the study.
Barge rate benchmarks. Barge rate benchmarks are developed for ZIP3 to ZIP3 traffic lanes. Since bargerates fluctuate significantly depending on the season (USDA, 2015a), benchmark rates are developed foreach of the four seasons43 using data from the industry barge rate tariff, U.S. Department of Agriculture(USDA, 2015a), River Transport News (Criton, 2013), and private sector barge companies. The benchmarkrates measure cost per ton for one whole barge (up to 1500 tons per barge).
Ocean rate benchmarks. Ocean rate benchmarks are developed for each port-to-port pair in the demandmodel based on carrier tariffs.
Transloading cost benchmark. Transloading is the process of transferring freight between two modes oftransportation. Transloading costs are incurred each time a shipment is transferred from one mode toanother. An average cost of $8 per ton was used to benchmark shipments involving transloading based onindustry feedback.
Stop-off charge benchmarks. Stop-off charge is an additional shipping charge for delivery of partial loadsto several different sites. The benchmarks were created from private sector companies’ data.
Sometimes shippers pay for accessorial charges in addition to the cost components listed above. Accessorialcharges are charges made for carriers performing freight services beyond the normal pickup, transport, anddelivery. Some examples of the accessorial charges are lift gate, after hour deliveries, detention, and truck ordernot used. Since these accessorial charges are dependent on the specific shipments, they are not included in thequantitative measurements.
A benchmark database was used to benchmark transportation costs (in 2014 U.S. dollars) for each shipment,calculating the costs using input data items, such as traffic lane, distance, equipment type and tonnage.
5.2. Qualitative Measurements
This study includes the following qualitative metrics to evaluate network design options and optimization strategies:
Industry multiplier effects. Multiplier effects reflect the full impact of jobs created in an industry asmeasured by their associated additional economic activities. This metric evaluates optimization alternativesbased on whether it improves freight cost efficiency for industries with high multiplier effects in Iowa’seconomy.
Network capacity. This metric is used to evaluate an optimization option’s impact on freight networkcapacity and can be used to evaluate “what if” questions, such as whether the alternative addressescapacity issues by converting freight traffic from a congested mode to a less congested mode – or whetherthe alternative adds new capacity to the network.
Network resilience. Network resilience is the ability for the network to provide and maintain acceptablelevels of service in man-made or natural disasters. This metric is used to evaluate an alternative in terms ofimproving freight network resilience by providing additional routing options, modal choices, etc.
43 Most of the barge shipments occur in spring, summer, and fall. Barge shipment volume in winter is very small.
53Development of Iowa Statewide Freight Transportation Network Optimization Strategy
© 2016 Quetica, LLC
Road mile reduction. This metric is used to evaluate an alternative in reducing truck traffic and road milesby converting freight traffic to other modes, such as rail and barge.
Network access. This metric is a set of rating scales to evaluate an alternative in terms of providing userswith better access to the network.
Availability of skilled labor and utilities. This metric is a set of rating scales used to evaluate theavailability of skilled labor and utilities to implement a recommended optimization strategy.
5.3. Comparing Transportation Modes using Different Measurement Criteria
Each transportation mode offers different cost and service attributes (e.g. speed, reliability). Important metrics formode choice include transport cost and transit time. Cost is the primary measurement in this study, while transittime is used in evaluating network design options and optimization strategies. This study is focused on transportcost optimization. The transit time and reliability optimization is outside of the project scope. The networkoptimization model includes four main modes: truck, rail, water (barge for domestic freight and ocean forimport/export freight) and multimodal (truck plus rail or barge). When measuring these modes using cost as theprimary factor, rail carload and barge are typically more competitive than truck or rail intermodal.
Table 5-1 provides a high level summary of advantages and disadvantages of the 4 domestic freight modes withinthe scope of this study: truck, rail, barge and multimodal (focusing on intermodal rail in this table). When modalchoices are considered, the key factors in the table need to be prioritized based on the business objectives. Thelowest cost or fastest delivery option may or may not be the right option.
Figure 5-1 also provides mode share of tonnage transported and total tonnage by distance band in 2007. The dataand figure are from U.S. DOT, Federal Highway Administration (USDOT, 2013a). While truck is the dominant modefor short-haul shipments less than 750 miles, rail and water account for a significant portion of the long-haulshipments greater than 750 miles.
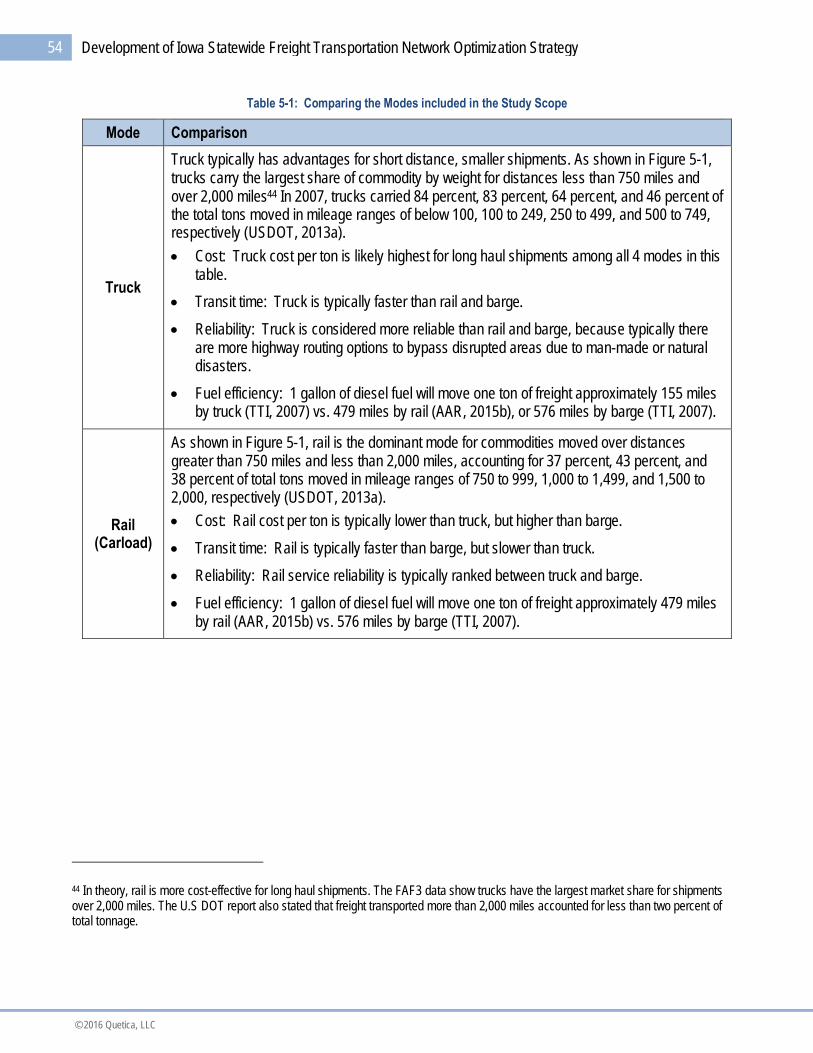
54 Development of Iowa Statewide Freight Transportation Network Optimization Strategy
© 2016 Quetica, LLC
Table 5-1: Comparing the Modes included in the Study Scope
Mode Comparison
Truck
Truck typically has advantages for short distance, smaller shipments. As shown in Figure 5-1,trucks carry the largest share of commodity by weight for distances less than 750 miles andover 2,000 miles44 In 2007, trucks carried 84 percent, 83 percent, 64 percent, and 46 percent ofthe total tons moved in mileage ranges of below 100, 100 to 249, 250 to 499, and 500 to 749,respectively (USDOT, 2013a).
Cost: Truck cost per ton is likely highest for long haul shipments among all 4 modes in thistable.
Transit time: Truck is typically faster than rail and barge.
Reliability: Truck is considered more reliable than rail and barge, because typically thereare more highway routing options to bypass disrupted areas due to man-made or naturaldisasters.
Fuel efficiency: 1 gallon of diesel fuel will move one ton of freight approximately 155 milesby truck (TTI, 2007) vs. 479 miles by rail (AAR, 2015b), or 576 miles by barge (TTI, 2007).
Rail(Carload)
As shown in Figure 5-1, rail is the dominant mode for commodities moved over distancesgreater than 750 miles and less than 2,000 miles, accounting for 37 percent, 43 percent, and38 percent of total tons moved in mileage ranges of 750 to 999, 1,000 to 1,499, and 1,500 to2,000, respectively (USDOT, 2013a).
Cost: Rail cost per ton is typically lower than truck, but higher than barge.
Transit time: Rail is typically faster than barge, but slower than truck.
Reliability: Rail service reliability is typically ranked between truck and barge.
Fuel efficiency: 1 gallon of diesel fuel will move one ton of freight approximately 479 milesby rail (AAR, 2015b) vs. 576 miles by barge (TTI, 2007).
44 In theory, rail is more cost-effective for long haul shipments. The FAF3 data show trucks have the largest market share for shipmentsover 2,000 miles. The U.S DOT report also stated that freight transported more than 2,000 miles accounted for less than two percent oftotal tonnage.

55Development of Iowa Statewide Freight Transportation Network Optimization Strategy
© 2016 Quetica, LLC
Mode Comparison
Barge
The water mode typically carries low-value, bulk commodities. As shown in Figure 5-1, wateraccounts for a small share of short haul shipments less than 250 miles, but a much larger shareof commodity shipments by weight for distances greater than 1,000 miles. Water accounts for 9percent, 10 percent, and 10 percent of total tons moved in mileage ranges of 1,000 to 1,499,1,500 to 2,000, and over 2,000, respectively (USDOT, 2013a).
Cost: Barge cost per ton is typically the lowest among all 4 modes in this table.
Reliability: Barge is typically considered less reliable than truck and rail. Service could bedisrupted for many reasons, such as ice on the inland waterway, flood or drought, andmaintenance and repair issues in the lock and dam system
Transit time: Barge is typically the slowest among all 4 modes in this table.
Fuel efficiency: Barge is considered the most fuel-efficient transportation mode among all4 modes in this table.
IntermodalRail
Intermodal rail is very competitive in long haul (over 750 miles) freight lanes. Intermodaltransportation has gained market share at distances down to 500 miles (Marrs, 2011, Nathen,2014, C.H. Robinson, 2015), with 500 to 1,500 miles being the targeted distance, according toa Norfolk Southern Railroad presentation (Marrs, 2011). Multiple modes and mail, in whichintermodal rail is a significant segment, accounts for 11 percent, 8 percent, 7 percent, and 18percent of total tons moved in mileage ranges of 750 to 999, 1,000 to 1,499, 1,500 to 2,000,and over 2,000, respectively (USDOT, 2013a)
Cost: Intermodal rail cost per ton is typically lower than truck, but higher than the othermodes.
Transit time: Intermodal rail may be a bit slower than truck, but it is faster than rail carloadand barge.
Reliability: Intermodal rail is considered more reliable than rail carload and barge. It canprovide truck-competitive reliability in the markets with direct access to intermodal services.
Fuel efficiency: Intermodal rail provides better fuel efficiency than truck, but is not asefficient as rail carload and barge.
Source: Quetica, LLC

56 Development of Iowa Statewide Freight Transportation Network Optimization Strategy
© 2016 Quetica, LLC
Figure 5-1 (USDOT, 2013a) shows mode share of tonnage and total tonnage by distance band in the U.S. in 2007.In general, truck carried well over 60 percent of total tons moved in short-haul moves over distances within 500miles. Rail is the dominant mode for long-haul moves over distances greater than 750 miles. Water accounts for asmall share of short haul shipments less than 250 miles, but a much larger share of commodity by weight fordistances greater than 1,000 miles.
Figure 5-1: U.S. Mode Share of Tonnage and Total Tonnage by Distance Band in 2007
Source: Adapted from Bureau of Transportation Statistics45
45 Mode share information is available at:http://www.rita.dot.gov/bts/sites/rita.dot.gov.bts/files/publications/transportation_statistics_annual_report/2012/figure3_1.html
0%
10%
20%
30%
40%
50%
60%
70%
80%
90%
100%
Below 100 100 - 249 250 - 499 500 - 749 750 - 999 1,000 - 1,4991,500 - 2,000 Over 2,000
Pe
rce
nt
of
Mo
de
Shar
e
Average Distance Band (miles)
Truck Rail Water Air Multiple Modes & Mail Pipeline Other / Unknown
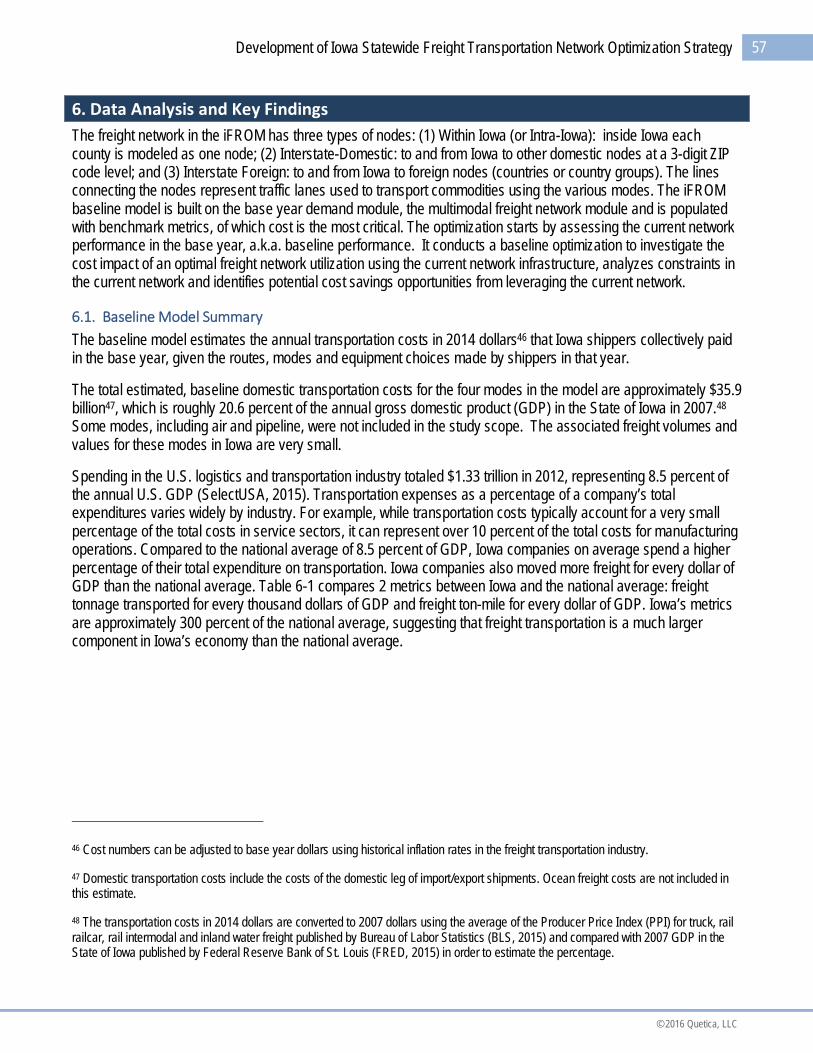
57Development of Iowa Statewide Freight Transportation Network Optimization Strategy
© 2016 Quetica, LLC
6. Data Analysis and Key Findings
The freight network in the iFROM has three types of nodes: (1) Within Iowa (or Intra-Iowa): inside Iowa eachcounty is modeled as one node; (2) Interstate-Domestic: to and from Iowa to other domestic nodes at a 3-digit ZIPcode level; and (3) Interstate Foreign: to and from Iowa to foreign nodes (countries or country groups). The linesconnecting the nodes represent traffic lanes used to transport commodities using the various modes. The iFROMbaseline model is built on the base year demand module, the multimodal freight network module and is populatedwith benchmark metrics, of which cost is the most critical. The optimization starts by assessing the current networkperformance in the base year, a.k.a. baseline performance. It conducts a baseline optimization to investigate thecost impact of an optimal freight network utilization using the current network infrastructure, analyzes constraints inthe current network and identifies potential cost savings opportunities from leveraging the current network.
6.1. Baseline Model Summary
The baseline model estimates the annual transportation costs in 2014 dollars46 that Iowa shippers collectively paidin the base year, given the routes, modes and equipment choices made by shippers in that year.
The total estimated, baseline domestic transportation costs for the four modes in the model are approximately $35.9billion47, which is roughly 20.6 percent of the annual gross domestic product (GDP) in the State of Iowa in 2007.48
Some modes, including air and pipeline, were not included in the study scope. The associated freight volumes andvalues for these modes in Iowa are very small.
Spending in the U.S. logistics and transportation industry totaled $1.33 trillion in 2012, representing 8.5 percent ofthe annual U.S. GDP (SelectUSA, 2015). Transportation expenses as a percentage of a company’s totalexpenditures varies widely by industry. For example, while transportation costs typically account for a very smallpercentage of the total costs in service sectors, it can represent over 10 percent of the total costs for manufacturingoperations. Compared to the national average of 8.5 percent of GDP, Iowa companies on average spend a higherpercentage of their total expenditure on transportation. Iowa companies also moved more freight for every dollar ofGDP than the national average. Table 6-1 compares 2 metrics between Iowa and the national average: freighttonnage transported for every thousand dollars of GDP and freight ton-mile for every dollar of GDP. Iowa’s metricsare approximately 300 percent of the national average, suggesting that freight transportation is a much largercomponent in Iowa’s economy than the national average.
46 Cost numbers can be adjusted to base year dollars using historical inflation rates in the freight transportation industry.
47 Domestic transportation costs include the costs of the domestic leg of import/export shipments. Ocean freight costs are not included inthis estimate.
48 The transportation costs in 2014 dollars are converted to 2007 dollars using the average of the Producer Price Index (PPI) for truck, railrailcar, rail intermodal and inland water freight published by Bureau of Labor Statistics (BLS, 2015) and compared with 2007 GDP in theState of Iowa published by Federal Reserve Bank of St. Louis (FRED, 2015) in order to estimate the percentage.
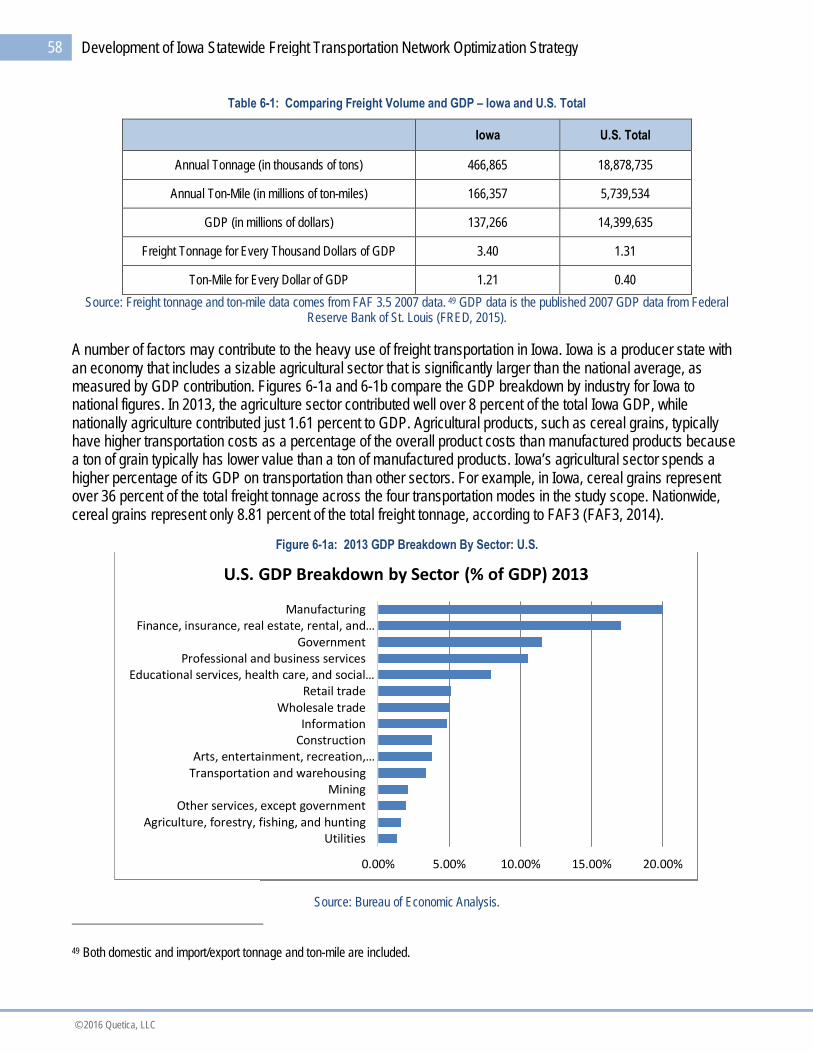
58 Development of Iowa Statewide Freight Transportation Network Optimization Strategy
© 2016 Quetica, LLC
Table 6-1: Comparing Freight Volume and GDP – Iowa and U.S. Total
Iowa U.S. Total
Annual Tonnage (in thousands of tons) 466,865 18,878,735
Annual Ton-Mile (in millions of ton-miles) 166,357 5,739,534
GDP (in millions of dollars) 137,266 14,399,635
Freight Tonnage for Every Thousand Dollars of GDP 3.40 1.31
Ton-Mile for Every Dollar of GDP 1.21 0.40
Source: Freight tonnage and ton-mile data comes from FAF 3.5 2007 data. 49 GDP data is the published 2007 GDP data from FederalReserve Bank of St. Louis (FRED, 2015).
A number of factors may contribute to the heavy use of freight transportation in Iowa. Iowa is a producer state withan economy that includes a sizable agricultural sector that is significantly larger than the national average, asmeasured by GDP contribution. Figures 6-1a and 6-1b compare the GDP breakdown by industry for Iowa tonational figures. In 2013, the agriculture sector contributed well over 8 percent of the total Iowa GDP, whilenationally agriculture contributed just 1.61 percent to GDP. Agricultural products, such as cereal grains, typicallyhave higher transportation costs as a percentage of the overall product costs than manufactured products becausea ton of grain typically has lower value than a ton of manufactured products. Iowa’s agricultural sector spends ahigher percentage of its GDP on transportation than other sectors. For example, in Iowa, cereal grains representover 36 percent of the total freight tonnage across the four transportation modes in the study scope. Nationwide,cereal grains represent only 8.81 percent of the total freight tonnage, according to FAF3 (FAF3, 2014).
Figure 6-1a: 2013 GDP Breakdown By Sector: U.S.
Source: Bureau of Economic Analysis.
49 Both domestic and import/export tonnage and ton-mile are included.
0.00% 5.00% 10.00% 15.00% 20.00%
UtilitiesAgriculture, forestry, fishing, and hunting
Other services, except governmentMining
Transportation and warehousingArts, entertainment, recreation,…
ConstructionInformation
Wholesale tradeRetail trade
Educational services, health care, and social…Professional and business services
GovernmentFinance, insurance, real estate, rental, and…
Manufacturing
U.S. GDP Breakdown by Sector (% of GDP) 2013

59Development of Iowa Statewide Freight Transportation Network Optimization Strategy
© 2016 Quetica, LLC
Figure 6-1b: 2013 GDP Breakdown By Sector: Iowa
Source: Bureau of Economic Analysis.
Other factors may also contribute to Iowa’s above average transportation costs as a percentage of GDP, including:
Iowa has a higher percentage of freight transported by truck than nearby states (discussed in Section6.3.3).
Iowa’s population density is lower than the national average and thus freight movement is likely to travellonger distances than the national average (discussed in Section 6.3.2).
Constraints exist in Iowa’s rail intermodal transportation network to limit the ability of Iowa businesses touse the lower cost shipment mode (discussed in Section 6.3.5).
6.2. Optimized Baseline Performance Summary
An optimization model seeks the lowest cost approach for freight routing across the current multimodaltransportation network in the study scope. The optimization approach assigns the lowest cost transportation modeto each freight movement based on origin, destination, tonnage, equipment and transportation costs. Baselineoptimization results represent the value of the total market opportunities for Iowa’s freight transportation network.Typically only a portion of the entire market opportunity can be captured to realize sustainable cost savings. Thespecific recommendations to capture some of the opportunities are discussed in Chapter 7. The optimization iscompared with the baseline performance data to assess transportation network constraints and the impact of thoseconstraints on cost savings opportunities. The details of the analysis are discussed in Section 6.3.
0.00% 5.00% 10.00% 15.00% 20.00% 25.00%
Utilities
Agriculture, forestry, fishing, and hunting
Other services, except government
Mining
Transportation and warehousing
Arts, entertainment, recreation, accommodation,…
Construction
Information
Wholesale trade
Retail trade
Educational services, health care, and social…
Professional and business services
Government
Finance, insurance, real estate, rental, and leasing
Manufacturing
Iowa GDP Breakdown by Sector (% of GDP) 2013

60 Development of Iowa Statewide Freight Transportation Network Optimization Strategy
© 2016 Quetica, LLC
With the objectives defined for the baseline optimization, the following assumptions are made on Iowa’s multimodaltransportation network to quantify the potential cost saving opportunities:
1. The transportation network’s capacity constraints do not affect freight in the base year. With thisassumption, the optimization algorithms are allowed to use the lowest cost method to transport freight. Thisassumption may not be true in the case of rail freight, depending on the capacity estimation method used.As discussed in Section 4.2, the rail network in 8 Iowa counties is estimated at or above capacity in thebase year. The baseline optimization makes the hypothesis that the rail network in those 8 counties can stillaccommodate small increases in freight volume from converting Iowa’s truck freight to rail freight. Section6.3.3 discusses the impact on the potential cost savings, if the alternative is true and Iowa’s railroadnetwork cannot accommodate the additional freight volume.
2. Access is available to the railroad network. To leverage rail freight, commodities typically need to betransferred from trucks to railcars using a transloading facility, such as a team track or truck-to-rail cross-dock (Iowa DOT, 2014b). The optimization algorithms assume that access to a transloading facility isavailable to shippers in each county that has direct access to the rail network, in order to estimate thepotential cost savings opportunities. In reality, some of the shippers may not have access to a transloadingfacility and thus establishing transloading facilities are a precondition to capture the cost savings potential(see discussions in Section 7.3).
3. Transit time, reliability of service and flexibility are not considered in cost savings estimates.Railroad freight may take longer to deliver and is rarely as flexible as truck transportation. This study doesnot have company-specific supply chain data and thus the baseline optimization does not account for thetransit time and flexibility factors in estimating the total market size of cost savings opportunities. Thistransit time factor is considered in building a business case for the recommended optimization strategydiscussed in Chapter 7.
4. Transloading expenses are included in both origins and destinations where truck freight isconverted to rail or barge freight in the baseline optimization. In reality, some shippers may havedirect access to rail or barge terminal facilities at origin and/or destination sites and can load their freightdirectly to railcars or barges to avoid transloading costs. Without looking into the specific transportationnetworks of those shippers, it is difficult to assess the need for transloading. The optimization algorithmsinclude transloading costs, in order to take a more conservative approach in estimating the cost savingsopportunities. On the other hand, initial investment to build additional transload facilities, if needed, is notincluded in this initial assessment of potential cost savings opportunities. Specific optimization strategieswill be analyzed in Chapter 7 to evaluate the business case for building new transload facilities to helpbusinesses reduce transportation costs.
5. Freight shipments from the same origin to the same destination, using the same shipmentequipment and mode, are not consolidated. Transportation companies may collect shipments with asimilar origin-destination from multiple shippers and load the shipments to the same truck/railcar/barge toimprove equipment utilization and reduce transportation costs. These cost savings from shipmentconsolidation may or may not be passed to the shippers, depending on the contractual or spot rates agreedto between the carriers and shippers. The baseline optimization algorithms take a more conservativeapproach to estimating the cost savings opportunities by assuming the cost savings from freightconsolidation are not passed on to the shippers.

61Development of Iowa Statewide Freight Transportation Network Optimization Strategy
© 2016 Quetica, LLC
With the above assumptions, the baseline optimization was run in the iFROM. The model estimated the totaldomestic transportation cost for Iowa’s truck, rail, waterborne and multimodal shipments at approximately $29.6billion in the baseline optimization, compared to $35.9 billion in the baseline model.50 This result represents annualsavings of $6.4 billion or 17.8 percent of the baseline costs to transport the same freight from the same origins tothe same destinations in the optimization. The savings include the total market opportunity – a portion of which canbe captured in the recommended optimization strategies discussed in Chapter 7.
Figure 6-2 compares the transportation tonnage breakdown by mode between the baseline and optimized baselinemodel. The truck freight tonnage is reduced by over 14 percent. The rail and intermodal freight volumes increasesignificantly in the optimized model, primarily due to the conversion of truck freight to rail and intermodal freight toreduce transportation costs in the optimization process. On the other hand, the barge tonnage in the optimizedmodel is slightly less, indicating that converting truck or rail freight to barge freight does not produce significant costsavings.
Figure 6-2: Comparing Annual Freight Volume by Mode: Baseline vs. Optimized Baseline
Source: Quetica, LLC
Figure 6-3 compares the transportation cost breakdown by mode between baseline and optimized models. It showsthat most of the cost reduction comes from converting truck freight to rail carload and rail intermodal. The total truckcosts are reduced by approximately 20.7 percent or $4.9 billion, while intermodal costs are increased by over 100percent or approximately $2.6 billion in the optimization model. By leveraging existing intermodal services where itmakes sense, the total rail carload costs are also reduced. The cost comparison indicates that significant costsavings opportunities exist in converting truck freight to rail carload and rail intermodal freight. Section 6.3 andChapter 7 discuss approaches to capturing these cost savings opportunities.
50Domestic transportation costs include the costs of the domestic leg of import/export shipments. Ocean freight costs are not included inthis estimate.
0
50,000,000
100,000,000
150,000,000
200,000,000
250,000,000
300,000,000
350,000,000
400,000,000
Truck Rail Carload Barge RailIntermodal
Multimodal -Barge
An
nu
alT
on
na
ge
Transportation Mode
Baseline
OptimizedBaseline

62 Development of Iowa Statewide Freight Transportation Network Optimization Strategy
© 2016 Quetica, LLC
Figure 6-3: Comparing Annual Transportation Costs51 by Mode: Baseline vs. Optimized Baseline52
Source: Quetica, LLC
6.3. Key Findings from Baseline Analysis
Analysis of the baseline and optimized baseline models provide insight into the optimization opportunities in Iowa’sfreight network, as well as areas that do not result in large enough cost savings to optimize. The analysis covers allsurface transportation modes in the study scope: truck, rail, waterborne and intermodal. Table 6-2 summarizes thekey findings by transportation modes. The remaining section discusses the findings in details.
51 Annual costs are in 2014 dollars.
52 Some rail carload volume is shifted to rail intermodal or truck where total shipment costs are lower. The shifting decreases the averagerail carload cost per ton, resulting in lower total rail carload costs to transport a higher volume of freight.
$0
$5,000,000,000
$10,000,000,000
$15,000,000,000
$20,000,000,000
$25,000,000,000
$30,000,000,000
$35,000,000,000
$40,000,000,000A
nn
ua
lTra
nsp
ort
atio
nC
ost
Transportation Mode
Baseline
OptimizedBaseline
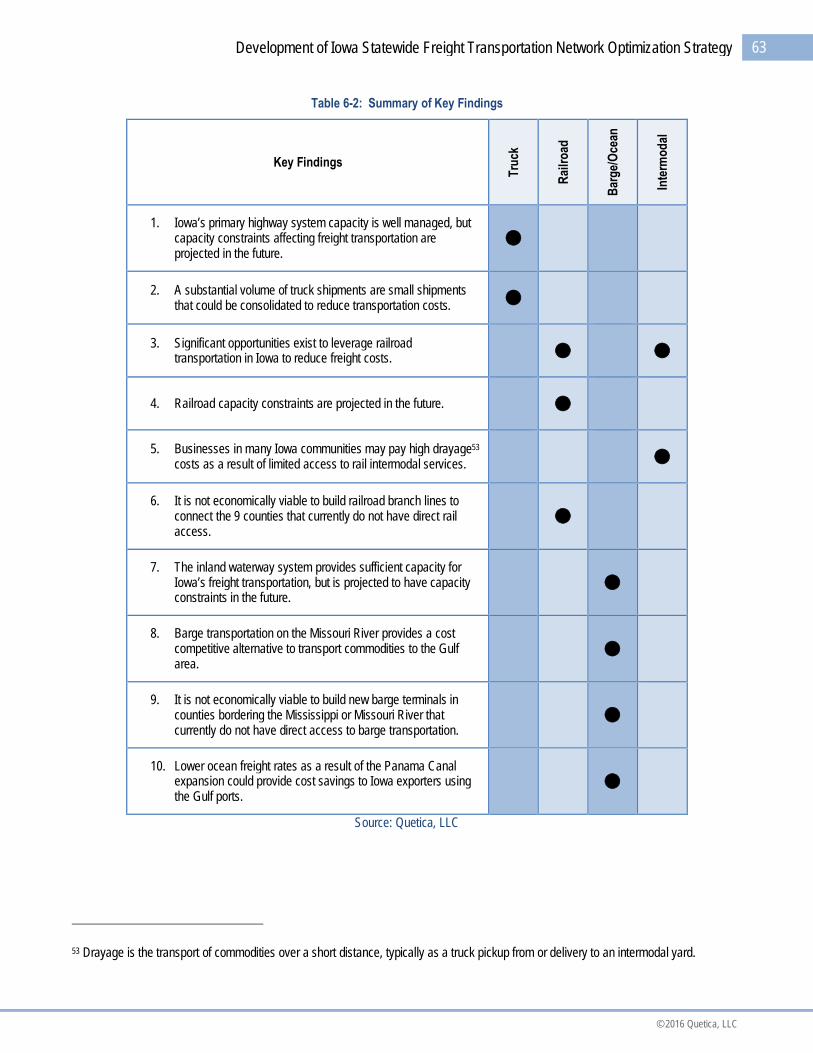
63Development of Iowa Statewide Freight Transportation Network Optimization Strategy
© 2016 Quetica, LLC
Table 6-2: Summary of Key Findings
Key Findings
Tru
ck
Rai
lro
ad
Bar
ge/
Oce
an
Inte
rmo
dal
1. Iowa’s primary highway system capacity is well managed, butcapacity constraints affecting freight transportation areprojected in the future.
2. A substantial volume of truck shipments are small shipmentsthat could be consolidated to reduce transportation costs.
3. Significant opportunities exist to leverage railroadtransportation in Iowa to reduce freight costs.
4. Railroad capacity constraints are projected in the future.
5. Businesses in many Iowa communities may pay high drayage53
costs as a result of limited access to rail intermodal services.
6. It is not economically viable to build railroad branch lines toconnect the 9 counties that currently do not have direct railaccess.
7. The inland waterway system provides sufficient capacity forIowa’s freight transportation, but is projected to have capacityconstraints in the future.
8. Barge transportation on the Missouri River provides a costcompetitive alternative to transport commodities to the Gulfarea.
9. It is not economically viable to build new barge terminals incounties bordering the Mississippi or Missouri River thatcurrently do not have direct access to barge transportation.
10. Lower ocean freight rates as a result of the Panama Canalexpansion could provide cost savings to Iowa exporters usingthe Gulf ports.
Source: Quetica, LLC
53 Drayage is the transport of commodities over a short distance, typically as a truck pickup from or delivery to an intermodal yard.

64 Development of Iowa Statewide Freight Transportation Network Optimization Strategy
© 2016 Quetica, LLC
6.3.1. Iowa’s Primary Highway System Capacity Is Well Managed, But Capacity Constraints AffectingFreight Transportation Are Projected in the FutureQuantitative analysis indicates that Iowa’s primary highway network is well managed for freight capacity in the baseyear (refer to Section 4.1.1 for detailed discussion). No high value network constraints were identified that wouldchange the truck routes and freight movement patterns. Therefore, there are no recommendations resulting fromthe primary highway freight capacity analysis.
Network capacity constraints are projected in a number of highway segments in the forecast year. Theseconstraints may reduce the effectiveness of freight transportation and result in truck cost increases in the affectedareas. Further analysis of Iowa’s multimodal freight network is recommended for future planning efforts to managehighway capacity to accommodate freight volume growth.
The primary highway system resilience analysis confirms that robust alternate routes exist to support Iowa’s primaryfreight corridor in the selected resilience analysis scenarios (refer to Section 4.1.2 for detailed discussion).
6.3.2. A Substantial Volume of Truck Shipments Are Small Shipments that Could Be Consolidated toReduce Transportation CostsMany small truck shipments54 are observed in the iFROM demand module defined in Chapter 3. Small shipmentsweighing from 150 up to 15,000 pounds are usually shipped using LTL carriers.55 LTL services provide shippers anoption to ship their products shortly after an order is placed, versus waiting for additional orders to fill a truck anddelaying order fulfillment. LTL freight costs are typically determined using an agreed upon discount off a base ratetariff. A tariff is a complex mix of rates tiered to a large number of potential origin/destination ZIP code pairs calledlanes, several weight breaks (the more a shipment weighs, the less the cost is per hundred pounds), classificationof freight56, distance, minimum charge, fuel surcharge, and accessorial charges.57 On the other hand, TL freightcosts are typically determined using Rate per Mile (RPM), distance, fuel surcharges, and accessorial charges.RPMs are negotiated by the origin/destination ZIP code pairs and the truck equipment type used.58 While LTL andTL freight rates are determined using different pricing rules, TL shipments usually cost less than LTL shipments perhundredweight (CWT) or per ton (Chopra, 2004). Consolidating LTL shipments can reduce transportation costs.
According to a study published by the American Trucking Association (ATA, 2013), LTL shipments accounted forabout 1.52 percent of total truck tonnage nationwide in 2012. Full truckload and private truck shipments accountedfor the remaining truck tonnage (Table 6-3).59
54 A shipment includes 5 components (origin, destination, commodity, mode, equipment) in the demand module.
55 Various definitions of LTL exist, typically with weight ranging between 100 lbs. and 20,000 lbs. This study uses 150 lbs. to 15,000 lbs. forLTL, as used in a freight broker training class at http://www.freightbrokeracademyhq.com/less-than-truckload-101/.
56 Freight classes are published in the National Motor Freight Classification (NMFC) books by National Motor Freight Traffic Association(NMFTA). The classes are determined by product density, value, stow-ability, handling and liability. Lower classes represent very densefreight that is difficult to damage and is easy to handle. Higher classes represent lighter / less dense freight that typically takes up morespace. More information on freight class is available at www.nmfta.org.
57 Refer to Section 5.1 for more discussions on accessorial charges.
58 Common equipment types are dry van, reefer, tank, etc.
59 The ATA study includes the parcel operations of UPS and FedEx in LTL, in addition to freight shipments from traditional LTL carriers.

65Development of Iowa Statewide Freight Transportation Network Optimization Strategy
© 2016 Quetica, LLC
Table 6-3: U.S. Domestic Truck Market by Mode in 2012
Volume Revenue
(Millions of Tons) (Share %) (Billions of $) (Share %)
Truck 9,397.40 $642.10
TL 4,584.40 48.78% $298.60 46.50%
LTL 142.6 1.52% $51.50 8.02%
Private Truck 4,670.40 49.70% $292.00 45.48%
Source: American Trucking Association (ATA, 2013)
The analysis of the truck freight data in the iFROM shows that for Iowa approximately 9.5 percent of domestic trucktonnage (including inbound, outbound and within Iowa freight) moved in small shipments of less than 15,000pounds (versus 1.5 percent nationally). Several factors may contribute to Iowa’s high percentage of smallshipments including:
Iowa has a low population density and freight movements are more spread out than is the case nationally.Iowa’s population density per square mile was 55.3 in 2013, compared to a national average of 89.5.60
These statistics suggest that Iowa commodity demand and supply is more spread out resulting in lessconsolidation and more small shipments.
Iowa has a large number of small and medium-sized enterprises (SME’s) with fewer than 500 employees.For example, 83 percent of the more than 3,420 Iowa exporting companies in 2013 are categorized asSME’s, according to U.S. Department of Commerce’s International Trade Administration (InternationalTrade, 2015). SME’s tend to have smaller scale production and consume fewer raw materials perenterprise than larger companies. As a result, shipment size tends to be smaller for SME’s. The largenumber of SME’s contributes to a high percentage of small shipments in Iowa.
The truck shipment analysis suggests that opportunities exist to provide freight consolidation facilities and serviceswith the necessary infrastructure support such as interchanges and last mile road access to enable Iowabusinesses to consolidate truck shipments, and reduce total truck-related freight costs by leveraging TLconsolidation. Freight consolidation includes temporal and shipment aggregation.
Temporal aggregation combines orders across time. Temporal aggregation decreases a firm’s responsivenessdue to shipping delays, but also decreases transportation costs due to economies of scale. In general, a limitedamount of temporal aggregation can be very effective in reducing transportation cost in a supply chain. However, itrequires firms to optimize their order fulfillment processes. Since this study is focused on statewide transportationnetwork optimization rather than a specific firm’s supply chain, temporal aggregation is not evaluated in theoptimization.
60 Population density is calculated as resident population divided by total land. Resident population is from the United States CensusBureau estimates for July 1, 2013 (US Census Bureau, 2013). Total land area is from the 2010 Census (US Census Bureau, 2010).

66 Development of Iowa Statewide Freight Transportation Network Optimization Strategy
© 2016 Quetica, LLC
Shipment aggregation is usually accomplished using consolidation centers to which trucks bring in many smallloads originating from surrounding geographic areas. Shipments destined to a common external region arereloaded for a TL linehaul move to a distribution center in the destination area. Iowa shippers can use shipmentaggregation to reduce their transportation costs, although the aggregation process may increase delivery time. Forexample, cross docking is one common strategy to implement shipment consolidation to lower supply chain costs.Cross docking is a procedure where freight from an incoming truck or railcar is unloaded, sorted, consolidated andloaded directly into outbound trucks, trailers, or railcars with little or no storage in between. Cross docking can beleveraged to consolidate freight across one shipper or multiple shippers.
6.3.3. Significant Opportunities Exist to Leverage Railroad Transportation in Iowa to Reduce Freight CostsRail freight is more energy efficient and typically more cost effective than truck freight, especially in long haul trafficlanes. The American Association of Railroads (AAR) estimates that railroads, on average, were four times more fuelefficient than trucks on a ton-mile basis in 2014. Studies have also shown that the cost of rail freight per ton-mile issignificantly lower than truck freight (Ballou 1998, Dong, 2015), as shown in Table 6-4. Effectively leveraging theexisting railroad network in Iowa for freight can reduce transportation costs. There are 18 railroads in Iowa thatconnect shippers to a robust North American network of trading partners (Iowa DOT, 2014b).
Table 6-4: Cost per Ton-Mile Associated With Each Mode
Mode Water Rail Road
Cost (2014 USD) $0.016 $0.050 $0.388
Source: Iowa State University Report # MATC-ISU: 237 (Dong, 2015)61
Although Iowa has a robust railroad network, Iowa companies transport a smaller share of freight by railroad, intonnage terms, compared to neighboring states. Figure 6-4 displays the modal composition of Iowa’s domesticfreight (inbound, outbound and within) compared to four neighboring states. The data shows that Iowa has thelowest percentage of rail freight tonnage and the highest percentage of truck freight tonnage among the fiveMidwest states. It suggests that there could be opportunities to convert a portion of Iowa’s truck freight to rail andreduce transportation costs for Iowa businesses.
61 The original report has a typo in the table showing $3.88 as the cost per ton-mile associated with road. The corrected number is usedand shown in this report after confirming with Dr. Dong at Iowa State University.

67Development of Iowa Statewide Freight Transportation Network Optimization Strategy
© 2016 Quetica, LLC
Figure 6-4: Domestic Freight in 2012 - Percentage Breakdown of Tonnage by Mode
Source: Freight Analysis Framework version 3.5
Comparing baseline costs to the optimized baseline costs in the base year confirm the cost savings opportunitiesfrom the expanded use of rail transportation. Figure 6-5 shows the model outputs for cost savings for long-haul62
inbound, long-haul outbound and short-haul shipments.63 By converting total market truck freight to rail carload orintermodal freight, the estimated total cost savings opportunities are approximately $670 million, $810 million and$660 million for long-haul inbound, long-haul outbound and short-haul shipments respectively. Because rail freightis more cost effective for long haul shipments, the focus of the opportunity assessment to convert truck to rail freightis on inbound and outbound lanes that exceed 750 miles.
62 In this rail opportunity analysis, long-haul shipments have a distance greater than 750 miles.
63 In this rail opportunity analysis, short-haul shipments have a distance less than or equal to 750 miles.
0.00%
10.00%
20.00%
30.00%
40.00%
50.00%
60.00%
70.00%
80.00%
90.00%
Truck Rail Water Air(include
truck-air)
Multiplemodes &
Pipeline Other andunknown
Iowa
Minnesota
Wisconsin
Missouri
Illinois

68 Development of Iowa Statewide Freight Transportation Network Optimization Strategy
© 2016 Quetica, LLC
Figure 6-5: Estimated Annual Cost Savings Opportunities using Rail Carload and Rail Intermodal Transportation
Source: Quetica, LLC using data in the iFROM
In summary, cost saving opportunities exist for Iowa businesses by leveraging rail services for freight. While thesize of the entire market opportunity is provided in this section, specific scenario analysis is needed to assess theactual cost saving amount in a specific optimization strategy or individual company’s supply chain, taking intoaccount the access to rail network, transload facilities, potential freight consolidation and impacts of transit time.Section 7.3 discusses the cost savings opportunities from building additional transload facilities in Iowa and themarket size after accounting for truck to rail conversion ratios.
6.3.4. Railroad Capacity Constraints Are Projected in the FutureThere are 99 counties in Iowa, of which 90 have direct access to the rail network. Among these 90 counties, thequantitative network capacity analysis described in Chapter 4 shows that 8 counties are at or above capacity in thebase year. These 8 counties are: Adams, Boone, Harrison, Mills, Montgomery, Story, Tama, and Union counties.These potential network capacity constraints may preclude companies from converting truck freight to rail (carloadand intermodal) and may reduce the size of the cost savings opportunities. If so, the impact is a reduction in thetotal cost savings opportunity by approximately $143 million or 2.2 percent on an annualized basis.64 Table 6-5shows the impact of this potential capacity constraint. The total cost savings opportunity in the optimized baselinescenario is approximately $6.44 billion (in 2014 dollars) with no railroad capacity constraints. If the railroad capacityconstraints exist, the total cost savings opportunities in the optimized baseline are approximately $6.30 billion (in2014 dollars).
64 The reduction in cost savings reduces the total market opportunity to convert truck freight to rail carload and intermodal freight anddecrease transportation costs.
$0
$100,000,000
$200,000,000
$300,000,000
$400,000,000
$500,000,000
$600,000,000
$700,000,000
$800,000,000
$900,000,000
Inbound(> 750 Miles)
Outbound(> 750 Miles)
Less Than 750 Miles
Esti
ma
ted
An
nu
alC
ost
Savi
ngs
Shipment Direction and Distance
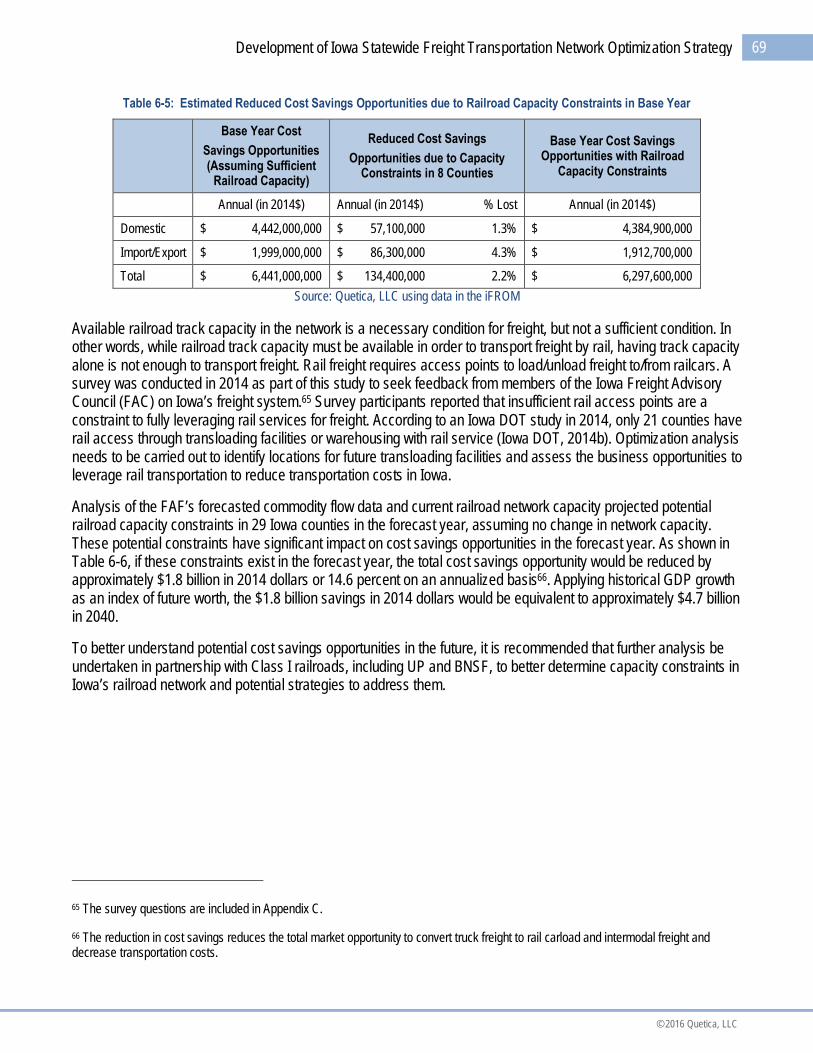
69Development of Iowa Statewide Freight Transportation Network Optimization Strategy
© 2016 Quetica, LLC
Table 6-5: Estimated Reduced Cost Savings Opportunities due to Railroad Capacity Constraints in Base Year
Base Year Cost
Savings Opportunities(Assuming Sufficient
Railroad Capacity)
Reduced Cost Savings
Opportunities due to CapacityConstraints in 8 Counties
Base Year Cost SavingsOpportunities with Railroad
Capacity Constraints
Annual (in 2014$) Annual (in 2014$) % Lost Annual (in 2014$)
Domestic $ 4,442,000,000 $ 57,100,000 1.3% $ 4,384,900,000
Import/Export $ 1,999,000,000 $ 86,300,000 4.3% $ 1,912,700,000
Total $ 6,441,000,000 $ 134,400,000 2.2% $ 6,297,600,000
Source: Quetica, LLC using data in the iFROM
Available railroad track capacity in the network is a necessary condition for freight, but not a sufficient condition. Inother words, while railroad track capacity must be available in order to transport freight by rail, having track capacityalone is not enough to transport freight. Rail freight requires access points to load/unload freight to/from railcars. Asurvey was conducted in 2014 as part of this study to seek feedback from members of the Iowa Freight AdvisoryCouncil (FAC) on Iowa’s freight system.65 Survey participants reported that insufficient rail access points are aconstraint to fully leveraging rail services for freight. According to an Iowa DOT study in 2014, only 21 counties haverail access through transloading facilities or warehousing with rail service (Iowa DOT, 2014b). Optimization analysisneeds to be carried out to identify locations for future transloading facilities and assess the business opportunities toleverage rail transportation to reduce transportation costs in Iowa.
Analysis of the FAF’s forecasted commodity flow data and current railroad network capacity projected potentialrailroad capacity constraints in 29 Iowa counties in the forecast year, assuming no change in network capacity.These potential constraints have significant impact on cost savings opportunities in the forecast year. As shown inTable 6-6, if these constraints exist in the forecast year, the total cost savings opportunity would be reduced byapproximately $1.8 billion in 2014 dollars or 14.6 percent on an annualized basis66. Applying historical GDP growthas an index of future worth, the $1.8 billion savings in 2014 dollars would be equivalent to approximately $4.7 billionin 2040.
To better understand potential cost savings opportunities in the future, it is recommended that further analysis beundertaken in partnership with Class I railroads, including UP and BNSF, to better determine capacity constraints inIowa’s railroad network and potential strategies to address them.
65 The survey questions are included in Appendix C.
66 The reduction in cost savings reduces the total market opportunity to convert truck freight to rail carload and intermodal freight anddecrease transportation costs.

70 Development of Iowa Statewide Freight Transportation Network Optimization Strategy
© 2016 Quetica, LLC
Table 6-6: Estimated Reduced Cost Savings Opportunities Due To Railroad Capacity Constraints in Forecast Year67
Forecast Year Cost SavingsOpportunities (Assuming
Sufficient Railroad Capacity)
Reduced Cost Savings Opportunitiesdue to Capacity Constraints in 29
Counties
Forecast Year Cost SavingsOpportunities with Railroad
Capacity Constraints
Annual
(in 2014$) (in 2040$)
Annual
(in 2014$) (in 2040$) % Lost
Annual
(in 2014$) (in 2040$)
Domestic $7,752,000,00 $19,406,000,000 $ 777,000,000 $1,945,000,000 10.0% $6,975,000,000 $17,461,000,000
Import/Export $5,150,000,000 $12,893,000,000 $1,109,000,000 $2,776,000,000 21.5% $4,041,000,000 $10,177,000,000
Total $12,902,000,000 32,299,000,000 $1,886,000,000 $4,721,000,000 14.6% $11,016,000,000 27,578,000,000
Source: Quetica, LLC using data in the iFROM
6.3.5. Businesses in Many Iowa Communities May Pay High Drayage Costs as a Result of Limited Access toRail Intermodal ServicesIntermodal freight services involve the transportation of a containerized commodity using multiple shipment modes,such as truck, rail and ship. In this study, intermodal analysis focuses on containerized freight using truck and rail.Intermodal service is designed to capture the best of each mode: combining the economies of rail linehaul (with itslower average cost per mile) with the flexibility of trucking for doorstep delivery. Rail’s comparative advantage restswith linehaul efficiency. Moving freight by double-stacked rail cars is three to five times more energy efficient thanby truck (Bryan et al. 2007, Zumerchik, 2012). Drayage accounts for a very large portion of intermodal door-to-doorcosts and is a primary cause for long transit times (Morlok, 1994, Zumerchik, 2012). The intermodal linehaul costsavings could be smaller than the added costs and time associated with drayage and intermodal yard operations ifthe dray distance from/to intermodal ramps is longer than 15 to 25 percent of the total door-to-door trip distance(Morlok, 1994).
Turnaround time has a major influence on drayage costs. Drayage companies often charge a fixed price for linehauldrayage per day. The more “turns”68 a drayage company can accomplish in a day, the lower the cost per container(i.e. trip) charged. Turnaround time depends on a number of factors including drayage distance, traffic congestionand the efficiency of intermodal yard operations. Given the location and operation time of existing intermodal yards,distance between the origin/destination and the origin/destination intermodal yard is the major variable factor fordrayage cost. The shorter the dray, the lower the drayage cost and the more efficient intermodal services become.
Conversely, drayage costs are likely to increase as the drayage distance increases. The greater the drayagedistance, the greater the inefficiency costs that need to be absorbed (Zumerchik, 2012). To demonstrate thecorrelation between drayage distance and cost, sample data collected from an online drayage cost calculator for theChicago area is used to construct Table 6-7. The table shows the distances and estimated drayage trip costs fromvarious locations in Chicago to the CenterPoint Intermodal Center CIC in Joliet, IL. The total cost per dray includeslinehaul charges and fuel surcharges69. The data is used in a linear trend line analysis shown in Figure 6-6 thatcorrelates total drayage cost to trip distance.
67 The forecast values were inflated to 2040 dollars, using the historical GDP growth rate.
68 A turn is a trip between the origin/destination and the origin/destination intermodal yard.
69 Thirty percent of the linehaul charge is assumed.
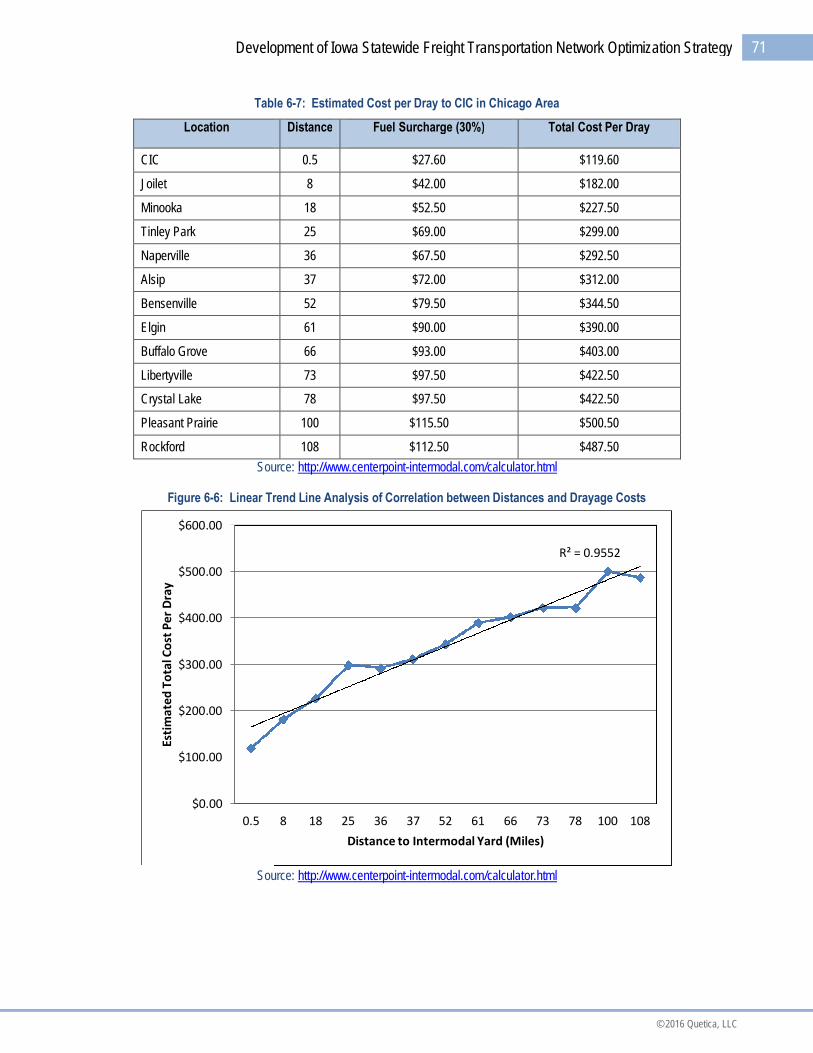
71Development of Iowa Statewide Freight Transportation Network Optimization Strategy
© 2016 Quetica, LLC
Table 6-7: Estimated Cost per Dray to CIC in Chicago Area
Location Distance Fuel Surcharge (30%) Total Cost Per Dray
CIC 0.5 $27.60 $119.60
Joilet 8 $42.00 $182.00
Minooka 18 $52.50 $227.50
Tinley Park 25 $69.00 $299.00
Naperville 36 $67.50 $292.50
Alsip 37 $72.00 $312.00
Bensenville 52 $79.50 $344.50
Elgin 61 $90.00 $390.00
Buffalo Grove 66 $93.00 $403.00
Libertyville 73 $97.50 $422.50
Crystal Lake 78 $97.50 $422.50
Pleasant Prairie 100 $115.50 $500.50
Rockford 108 $112.50 $487.50
Source: http://www.centerpoint-intermodal.com/calculator.html
Figure 6-6: Linear Trend Line Analysis of Correlation between Distances and Drayage Costs
Source: http://www.centerpoint-intermodal.com/calculator.html
R² = 0.9552
$0.00
$100.00
$200.00
$300.00
$400.00
$500.00
$600.00
0.5 8 18 25 36 37 52 61 66 73 78 100 108
Esti
ma
ted
To
talC
ost
Pe
rD
ray
Distance to Intermodal Yard (Miles)

72 Development of Iowa Statewide Freight Transportation Network Optimization Strategy
© 2016 Quetica, LLC
Several studies of rail intermodal drayage operations suggest that drayage operators favor trips of 100 miles or less(WVPPA, 2007, Stewart, 2003). Another study suggested that if 15 to 25 percent of the total door-to-door tripmileage is attributed to drayage, the drayage costs relative to the total intermodal trip cost make the service costprohibitive (Morlok, 1994). For instance, in a door-to-door trip of 700 miles, no more than 105 to 175 miles of the tripshould be drayage miles for the intermodal move to be cost effective. In this freight network optimization study, a100- mile straight -line radius is used to analyze the service areas of existing intermodal yards. Although shippersoutside of the 100- mile radius area can still use the existing intermodal yards, the higher drayage costs wouldreduce the cost effectiveness of intermodal shipments
Currently, a large portion of Iowa is outside of the service area of the nearest intermodal yards, when a 100 milestraight line radius is used. Figure 6-7 shows the areas within a 100- mile radius of existing intermodal yards in Iowaand neighboring states. The map also shows the Iowa areas that are beyond the hypothetical service (shown byred rectangles). The out of service area represents a significant portion of the entire state of Iowa.
Iowa’s major economic activities are in Eastern and Central Iowa. According to the Bureau of Labor Statistics,Eastern Iowa accounts for over 50 percent of the total employment in Iowa.70 Thus, there may be more demand forintermodal services in Eastern Iowa than the other Iowa regions. In a survey conducted with the Iowa FAC, anumber of respondents expressed the desire to use intermodal services in Eastern Iowa. Currently, there is nointermodal yard located in this area. Containers from Eastern Iowa must be drayed to intermodal yards located inWestern Iowa, Illinois, Minnesota, Missouri or Nebraska. Some of the Iowa companies noted that long-distancedrayage makes intermodal freight services cost prohibitive.
The limited access to intermodal services is a constraint in Iowa’s freight network. Further analysis of intermodalfacilities is needed to design the optimization strategies for the Iowa freight network, as discussed in Section 7.2 ofthis report.
70 The employment data is May 2014 data, available at http://www.bls.gov/data/#employment. In this analysis, Eastern Iowa includesCedar Rapids, Davenport-Moline-Rock Island, Dubuque, Iowa City, Waterloo-Cedar Falls, Northeast Iowa nonmetropolitan area, andSoutheast Iowa nonmetropolitan area. Central Iowa includes Ames, Des Moines, and West Des Moines area.

73Development of Iowa Statewide Freight Transportation Network Optimization Strategy
© 2016 Quetica, LLC
Figure 6-7: Areas within 100- Mile Straight Line Radius of Existing Intermodal Yards In Iowa and Neighboring States
Source: Google Map and Free Map Tools71
6.3.6. It Is Not Economically Viable to Build Railroad Branch Lines to Connect the 9 Counties that CurrentlyDo Not Have Direct Rail AccessNine counties in Iowa do not have direct access to rail: Audubon, Davis, Decatur, Grundy, Howard, Jones,Ringgold, Taylor and Van Buren. The rail access analysis sought to quantitatively determine the economic viabilityof constructing rail branch/spur lines to connect some of these counties to the rail network.72 The analysis suggeststhat the current freight volumes in these nine counties may be insufficient to justify the construction costs for newbranch/spur lines to connect any one of these counties to the rail network.
The scenarios analyzed in this section are only for demonstration purposes. As of the writing of this report, thereare no initiatives to pursue the development of these rail branch/spur lines.
Rail freight, as previously noted, typically has a lower cost per ton mile than truck freight (refer to Table 6-2).Significant transportation cost savings may be achieved by converting from truck to rail. The analysis approachincludes two steps: (1) analyzing the truck freight volumes that could be converted to rail freight in the nine countieswithout access to identify top conversion candidates and (2) assessing the costs and benefits in the top candidatecounties to construct a railroad branch line or spur that would enable direct rail network access.
71 Free Map Tools is available at https://www.freemaptools.com/radius-around-point.htm.
72 A branch line is a secondary railway line which branches off a mainline. A very short branch line may be called a spur line.

74 Development of Iowa Statewide Freight Transportation Network Optimization Strategy
© 2016 Quetica, LLC
Step 1 evaluates the market opportunity in each county by converting freight from truck to rail. Figure 6-8 showsthe three scenarios used in conducting the analysis:
(1) No transloading is required where truck freight is converted to rail freight. The blue bars showthe annual freight tonnage that would benefit from converting to rail transportation in this scenario. Thisrepresents the maximum opportunity size since typically one to two transloading services are required.
(2) On average, one transloading service per shipment is required, where truck freight is convertedto rail. The red bars show annual freight tonnage that would benefit from converting to rail.
(3) Two transloading services per shipment are required where truck freight is converted to rail.The green bars show annual freight tonnage that would benefit from converting to rail.
In all three scenarios, Grundy, Van Buren and Howard counties have the highest annual tonnage that would benefitfrom the conversion. The counties with the highest eligible tonnage for truck-to-rail conversion in all three scenarios,Grundy and Howard, were selected for further cost/benefit analysis.
Figure 6-8: Annual Freight Tonnage by County That Benefits From Converting Truck to Rail73
Source: Quetica, LLC
73 For three scenarios: no transloading, 1 transloading service per shipment and 2 transloading services per shipment.
0
500,000
1,000,000
1,500,000
2,000,000
2,500,000
3,000,000
3,500,000
An
nu
alT
on
na
geEl
igib
lefo
rT
ruck
toR
ail
Co
nve
rsio
n
Iowa Counties with No Direct Access to Railroad
No Transload Required
On Average 1Transload PerShipment2 Transload perShipment
75Development of Iowa Statewide Freight Transportation Network Optimization Strategy
© 2016 Quetica, LLC
6.3.6.1. Grundy County Branch Line Analysis
Hypothetically, a railroad branch line can be built between Cedar Falls, Iowa and Grundy Center, Iowa to connectGrundy County to the Canadian National Railway (CN) and Iowa Northern Railway (IANR) in Cedar Falls. SinceIANR also connects to Union Pacific (UP) in Cedar Rapids, this branch line would provide shippers in GrundyCounty direct access to two Class I (CN and UP) railroad networks. The estimated length of the branch line is 20miles. The estimated construction cost for the branch line is approximately $60 million (This study uses $3 millionper mile construction cost as the rough order of magnitude estimate74).
Once constructed, branch-line tracks must be maintained to the railroad mainline. Track maintenance expensesare part of the overall costs to provide rail transportation in lieu of trucking and are included in the cost analysis. Onthe other hand, road maintenance costs are not included in truck transportation costs. Highways are shared bypassenger vehicles, as well as all freight traffic. It is assumed that the highways must be maintained for passengervehicles and through freight traffic, regardless of the decisions to convert freight from truck to rail.
Feedback collected from a Class III railroad in Iowa suggested that annual track maintenance cost for a branch lineis approximately $16,000 per mile and is used as an assumption in this study.
Two scenarios were analyzed for the Grundy County branch line:
1. One transload is required per shipment. Truck transportation does not require transloading service.However, rail shipments require transloading between truck and rail, unless both the origins anddestinations have direct access to rail. Since the branch line may provide only a small number of companysites with direct rail access, it is most likely that companies will need to truck their commodities to thebranch line and transload the commodities to railcars to leverage rail transportation. This scenario models abest case where the other end of each shipment has direct access to rail.
2. Two transloads are required per shipment. This scenario models a worst case that neither origin nordestination of shipments has direct access to rail.
Table 6-8 shows the high-level financial analysis for both scenarios. Annual tonnage represents the current freightthat can benefit from railroad transportation, i.e., rail transportation costs are lower than the truck transportationcosts. The annual tonnage in the two transloads per shipment scenario is much lower than the tonnage in the onetransload scenario, because fewer shipments result in cost savings from using rail.
Rail services are typically less time responsive than truck, so shippers with short time requirements may not userail. Thus, only a fraction of the total truck freight will be converted to rail, even where transportation costs are lower.This analysis uses an extremely aggressive 50 percent conversion rate to test the economic viability of the railbranch line. Realistically, the conversion rate is much lower than this extremely aggressive assumption. However, ifa business case cannot be justified with this aggressive assumption, a conclusion can be drawn that this scenario isnot economically viable. The adjusted annual tonnage in Table 6-8 represents the calculated tonnage that isassumed to be converted from truck to rail and shows the estimated transportation costs.
74 The estimate is based on Iowa DOT’s experience.

76 Development of Iowa Statewide Freight Transportation Network Optimization Strategy
© 2016 Quetica, LLC
A financial metric, Economic Feasibility Measurement (EFM), is used to evaluate the economic benefits frombuilding the branch line and converting truck freight to rail freight. EFM is measured by the period of time required torecoup funds expended in constructing the hypothetical rail branch line to convert truck freight to rail freight75,starting from the point that the converted freight volume reaches the expected level in the hypothesis. The value ofEFM is equal to the estimated total implementation cost divided by the annual cost savings opportunity fromconverting truck freight to rail freight: the lower the EFM value, the stronger the business case.
Table 6-8 shows the financial analysis using EFM. In a best-case scenario where one transload is required, EFM is16 years, even under the aggressive truck-to-rail conversion rate. In a worst-case scenario where two transloadsare required, EFM is 108 years. Based on the high EFM value, even in the best case scenario, pursuingconstruction of a rail branch-line is not recommended.
Table 6-8: High Level Financial Analysis for a Grundy County Branch Line
Scenario 1 - One Transload perShipment
Scenario 2 - Two Transloadsper Shipment
Annual Tonnage 2,466,000 540,000
Truck to Rail Conversion Ratio 50% 50%
Adjusted Annual Tonnage 1,233,000 270,000
Truck Transportation Cost $12,153,000 $2,662,000
Rail Transportation Cost $8,148,000 $1,785,000
Annual Rail Track Maintenance Cost $320,000 $320,000
Annual Cost Saving Opportunity $3,685,000 $557,000
Estimated Branch Line Construction Cost $60,000,000 $60,000,000
EFM (Year) 16 108
Source: Quetica, LLC
6.3.6.2. Howard County Branch Line Analysis
In Howard County, a railroad branch line hypothetically could be built between Calmar, IA and Cresco, IA toconnect Howard County to the Canadian Pacific Railroad (CP) network. The branch line is estimated at 18 miles.The construction cost for the branch line is estimated at $54 million. No additional rail spurs are assumed toconnect other sites in the county.
The same transload scenarios used for the Grundy Country analysis were used for the Howard County analysis.
Table 6-9 shows the high level financial analysis of both scenarios using the aggressive 50 percent truck-to-railfreight conversion ratio to test the economic viability of the rail branch line. The Adjusted Annual Tonnage in thetable represents the calculated tonnage that is assumed to be converted from truck to rail. Both truck and railtransportation costs are estimated in the table. The financial analysis shows that the best-case EFM period is 28years and the worst-case is 134 years. Based on the high EFM value even in the best case scenario, the rail branchline is not recommended.
75 The time value of money is not taken into account in an EFM estimate.

77Development of Iowa Statewide Freight Transportation Network Optimization Strategy
© 2016 Quetica, LLC
Table 6-9: High Level Financial Analysis for a Howard County Branch Line
Scenario 1 - One Transload
per Shipment
Scenario 2 - Two Transloadsper Shipment
Annual Tonnage 1,914,000 603,000
Truck to Rail Conversion Ratio 50% 50%
Adjusted Annual Tonnage 957,000 301,500
Truck Transportation Cost $8,460,000 $2,666,000
Rail Transportation Cost $6,268,000 $1,975,000
Annual Rail Track Maintenance Cost $288,000 $288,000
Annual Cost Saving Opportunity $1,904,000 $403,000
Estimated Branch Line Construction Cost $54,000,000 $54,000,000
EFM (Year) 28 134
Source: Quetica, LLC
6.3.7. The Inland Waterway System Provides Sufficient Capacity for Iowa’s Freight Transportation, But IsProjected to Have Capacity Constraints in the FutureBarge transportation is the lowest cost linehaul mode for domestic freight originating or terminating in Iowa. Thecapacity analysis of Upper Mississippi River and Missouri River suggested that the inland waterway systems canaccommodate Iowa’s freight in the base year. However, if the capacities in Upper Mississippi River locks and damsremain the same in the forecast year, the forecasted freight volume growth may consume all existing capacity,potentially leaving little room to handle unexpected issues during the peak shipment season.
6.3.8. Barge Transportation on the Missouri River Provides a Cost Competitive Alternative to TransportCommodities to the Gulf AreaThe Barge Transportation on Missouri River Analysis assesses the economic value of the river for Iowa companies.The economic value is defined as (1) cost savings opportunities using barge transportation versus other modalchoices and (2) increased freight network resiliency for Iowa.76 Navigation on the Missouri River occurs from SiouxCity to the mouth of the river near St. Louis, a distance of 734 miles. Access to barge transportation on the MissouriRiver is available in Iowa through 5 barge terminals located in Council Bluffs, Sergeant Bluff and Sioux City (IowaDOT Barge, 2011). Iowa companies can leverage barge transportation on the Missouri River to ship commoditiesfrom Woodbury and Pottawattamie counties to St. Louis and continuing to the Gulf region (see Figure 6-9).
76 For example, resiliency exists when alternative modes and routes are available in the case of a natural or man-made disaster.

78 Development of Iowa Statewide Freight Transportation Network Optimization Strategy
© 2016 Quetica, LLC
Figure 6-9: Ports and Navigable Waterways of the United States
Source: U.S. Army Corps of EngineersThe nodes are the major coastal, Great Lakes, and inland waterway port locations
The barge and rail rate data used in the analysis comes from cost benchmarks discussed in Chapter 5. All rates arestated as a cost per ton. Analysis in Table 6-10, suggests that the multimodal alternatives (rail + barge) are not costcompetitive with transloading costs included. The multimodal option is not included in the scenario analysis.
Table 6-10: Sample Cost Per Ton Comparison between Barge and Multimodal (Rail + Barge)
Route Origin Destination Mode Winter Rate Spring Rate SummerRate
Fall Rate
1 Sioux City, IA New Orleans, LA Barge $ 23.78 $ 31.28 $ 35.69 $ 48.86
2 Sioux City, IA Dubuque, IA Rail $ 17.69 $ 17.69 $ 17.69 $ 17.69
2 Dubuque, IA Dubuque, IA Transload $ 8.00 $ 8.00 $ 8.00 $ 8.00
2 Dubuque, IA New Orleans, LA Barge $ 15.42 $ 20.29 $ 23.15 $ 31.70
Route 2 Subtotal $ 41.11 $ 45.97 $ 48.84 $ 57.38
Cost Difference (Route 1 - Route 2) $ (17.33) $ (14.70) $ (13.15) $ (8.52)
3 Council Bluffs, IA New Orleans, LA Barge $ 20.46 $ 26.91 $ 30.71 $ 42.05
4 Council Bluffs, IA Davenport, IA Rail $ 14.94 $ 14.94 $ 14.94 $ 14.94
4 Davenport, IA Davenport, IA Transload $ 8.00 $ 8.00 $ 8.00 $ 8.00
4 Davenport, IA New Orleans, LA Barge $ 13.68 $ 17.99 $ 20.53 $ 28.10
Route 4 Subtotal $ 36.61 $ 40.92 $ 43.46 $ 51.04
Cost Difference (Route 3 - Route 4) ($16.15) ($14.01) ($12.75) ($8.99)
Source: Quetica, LLC

79Development of Iowa Statewide Freight Transportation Network Optimization Strategy
© 2016 Quetica, LLC
The analysis focuses on commodities that are currently shipped using barge between Western Iowa anddownstream destinations, such as Alabama and Louisiana. Since Western Iowa barge terminals are all located inWoodbury and Pottawattamie counties, the freight shipments all originated or terminated in one of these twocounties.
All commodity shipments in the base year model that meet the following conditions are selected for analysis:
The commodity shipments moved by barge in the base year; and
The commodity shipments either originated or terminated in Woodbury or Pottawattamie County.
As shown in Figure 6-10, the top destinations (upper bar chart) by freight volume for outbound freight is the GulfCoast, with New Orleans the top origin from Western Iowa. The lower bar chart in Figure 6-11 shows the top originsby volume for inbound freight, with the Gulf Coast as the top origin for barge freight terminated in Western Iowa.
Figure 6-10: Top Destination for Barge Freight Originated in Western Iowa
Source: Quetica, LLC using data in the iFROM
050,000
100,000150,000200,000250,000300,000350,000400,000450,000500,000
An
nu
alT
on
na
ge
Top Destinations

80 Development of Iowa Statewide Freight Transportation Network Optimization Strategy
© 2016 Quetica, LLC
Figure 6-11: Top Origins for Barge Freight Terminated in Western Iowa
Source: Quetica, LLC using data in the iFROM
Freight benchmarks discussed in Chapter 5 are used to evaluate barge vs. rail transportation costs, includinglinehaul and fuel surcharge costs. Truck drayage and transloading costs are not included in the comparison,because it was assumed these costs would be the same whether rail or barge was used for the linehaul.
Table 6-11 shows the transportation cost comparison between barge and rail to transport the same amount offreight from the same origins to the same destinations. Downbound means that the freight originates in Iowa and isdestined for the Gulf region. Upbound means that the freight originates in the Gulf and is destined for Western Iowa.
Table 6-11: Cost Comparison between Barge Transportation on the Missouri River and Rail77
DirectionAnnual
Tonnage
BargeTransportation
Cost
RailTransportation
Cost Cost Difference
Downbound 815,200 $ 29,249,000.00 $ 30,210,000.00 $ (961,000.00)
Upbound 53,100 $ 1,255,000.00 $ 1,950,000.00 $ (695,000.00)
Total 868,300 $ 30,504,000.00 $ 32,160,000.00 $ (1,656,000.00)
Source: Freight tonnage data is from the disaggregated FAF 3 data in the iFROM.
Barge transportation on the Missouri River is more cost competitive than rail as shown in Table 6-10. Totalpotential cost savings over rail are estimated at just over $1.6 million on an annualized basis, or approximately 5percent of the rail costs. Barge rates are very seasonal with peak rates occurring in the fall78. More significant costsavings can be achieved with Missouri River barge transportation during spring and summer than in fall.
77 Barge transportation costs are estimated using seasonal benchmark rates in winter, spring, summer, and fall.
78 Barge freight rates in the fall sometimes exceed rail freight rates.
0
5,000
10,000
15,000
20,000
25,000
An
nu
alT
on
na
ge
Top Origins

81Development of Iowa Statewide Freight Transportation Network Optimization Strategy
© 2016 Quetica, LLC
As discussed in Section 4.3, there is free capacity for barge transportation on the Missouri River. Bargetransportation is both economical and environmentally friendly. A single barge can hold as much cargo as 16 railcars or 70 semi-trailer trucks (Iowa DOT, 2016a). Missouri River barge transportation provides freight capacity withcompetitive costs for certain commodities. It offers Iowa businesses another shipment mode, and providescompetition to truck and rail. Barge services can also increase the resiliency of Iowa’s freight network in the case ofnatural or man-made disasters that affect the road and/or rail network, by providing an alternative mode and routeoption for transporting Iowa’s products to the Gulf area.
In summary, the analysis found that the economic value of Missouri River barge transportation includes twocomponents:
1. It provides some transportation cost advantage over railroad transportation. The advantage is larger in thespring and summer seasons, when barge rates are lower.
2. It provides additional freight capacity and transportation modal choice to Western Iowa and adds to theresiliency of Iowa’s freight network.
6.3.9. It Is Not Economically Viable to Build New Barge Terminals in Counties Bordering the Mississippi orMissouri River That Currently Do Not Have Direct Access to Barge TransportationSixteen Iowa counties border either the Mississippi River or Missouri River, making it feasible to use bargetransportation in these counties. Six of these counties, however do not currently have a barge terminal providingdirect access to the inland waterway system: Jackson, Louisa, Monona, Harrison, Mills and Fremont. The analysisassessed the economic viability of building new barge terminals in one of these six counties. The analysis estimatesthe potential cost saving opportunities if a new barge terminal was established in these counties.
This analysis includes only barge terminals within Iowa. Barge terminals on the Illinois side of the Mississippi Riveror Nebraska side of the Missouri River are not included in the scope.
The analysis approach is summarized in the following steps:
1. Include freight shipments in the base year model between the six candidate counties anddownstream destinations with direct access to the Mississippi or Missouri River. It is possible thatfreight is moved from an Iowa site to an out-of-state barge terminal, transferred to truck or rail and thendelivered to the final destination that has no direct access to one of the rivers. However, that transportationroute will incur transloading costs and most likely have higher transportation costs than alternate modes,such as rail. Barge transportation is more economical for high volume, long distance shipments with no orshort drayage, which allows linehaul cost savings to offset drayage and transloading costs.
2. Benchmark current transportation costs in the base year as the baseline. Use the iFROM costbenchmarks to estimate barge transportation costs in the case that new barge terminals are built to ship thesame amount of freight by barge. Compare the baseline costs of barge to alternate modes such as rail,truck and multimodal leveraging and calculate the potential cost savings opportunities.
3. Analyze the potential cost savings opportunities. Determine if the opportunities are large enough tojustify new barge terminals in any of these six counties.

82 Development of Iowa Statewide Freight Transportation Network Optimization Strategy
© 2016 Quetica, LLC
The analysis shows that Louisa County has the largest potential cost saving opportunities, if barge terminals arelocated in the county. The total opportunity modal conversion market would generate approximately $3.5 million peryear in transportation cost savings. Eligible shipments are those that would have lower transportation costs bybarge than by any other mode. However, only a portion of the market opportunity can be captured to materialize thecost savings. The capture rate will be discussed later in the section. Figure 6-12 shows the potential cost savingsopportunities among the eligible shipments in all six counties. With savings just over $500,000, Jackson County is adistant second to Louisa County in potential cost savings.
Figure 6-12: Annual Cost Savings Opportunities with New Barge Terminals
Source: Quetica, LLC using data in the iFROM
$0
$500,000
$1,000,000
$1,500,000
$2,000,000
$2,500,000
$3,000,000
$3,500,000
$4,000,000
JacksonCounty
LouisaCounty
MononaCounty
HarrisonCounty
Mills County FremontCounty
An
nu
alC
ost
Savi
ng
Op
po
rtu
nit
y
County Name

83Development of Iowa Statewide Freight Transportation Network Optimization Strategy
© 2016 Quetica, LLC
Figure 6-13 shows the annual freight volume in number of barges that would benefit from barge terminals in thesesix counties. Again, Louisa County has the largest freight volume, totaling approximately 76 barges per year.
Figure 6-13: Annual Freight Volume in Number of Barges That Would Benefit From New Barge Terminals
Source: Quetica, LLC using data in the iFROM
Although Louisa County has the largest opportunity, with a total market size of 76 barges of freight per year, orapproximately 114,000 tons on an annual basis, the realistic market opportunity in Louisa County is rather small(assuming that only a small portion of the total market size can be captured due to the slower transit time for bargeversus rail or truck). No research references related to conversion rates for rail or truck freight converting to bargewere identified during the project. However, conversion rates from truck freight to intermodal are documented inseveral studies (WVPPA, 2007, Fennimore, 2011).
These documented truck-to-intermodal conversion rates were used as the basis for truck-to barge and rail-to-bargeconversion rates in this study. Barges move at approximately 7 miles per hour (MNDOT, 2009), compared to over21 miles per hour for freight trains (RailroadPM, 2015) and over 55 miles per hour on interstate trucks (USDOT,2013a). A company must determine if barge transportation is suitable given the longer transit time. This studyassumes that the conversion rate from other modes to barge is similar to the conversion rate from truck to railintermodal.
An intermodal study conducted for the Des Moines Area Metropolitan Planning Organization (DMAMPO) assumeda 4.5 percent truck to rail intermodal conversion rate (Fennimore, 2011). A West Virginia feasibility study assumed12 percent to 14 percent diversion rate following the completion of an intermodal yard (WVPPA, 2007). Since costsaving and transportation time are the major tradeoff for both truck to rail intermodal conversion and truck/rail tobarge conversion, it is reasonable to assume that the conversion rates are similar. For this analysis, a 10 percentconversion rate is assumed as a mid-point between the 4.5 percent used in the DMAMPO study and 12 percent to14 percent used in the West Virginia study. The estimated converted volume is 11,400 tons per year.
0
10
20
30
40
50
60
70
80
Jackson County Louisa County MononaCounty
HarrisonCounty
Mills County FremontCounty
An
nu
alB
arg
eN
um
be
rIn
cre
ase
County Name

84 Development of Iowa Statewide Freight Transportation Network Optimization Strategy
© 2016 Quetica, LLC
Given the freight volume potential for a new barge terminal in Louisa County of 11,400 tons per year, the estimatedconverted volume equates to 8 loaded barges per year. The estimated converted volume is significantly lower thanthe freight volume that a one-dock barge terminal, the smallest possible terminal, would handle.79 The analysis,therefore, finds that the existing freight volume does not justify the construction and operating costs of a new bargeterminal in Louisa County. Since the other five counties have smaller market potentials, it is expected that they donot have sufficient freight volume to justify a new barge terminal either.
Iowa companies are encouraged to use the nearby barge terminals to transport their freight. Responses to industryinquiries during the study confirm that a number of the existing terminals have free capacity and the terminalowners are willing to offer terminal services to other companies. It is therefore recommended that Iowa companiesuse existing barge terminals to access barge transportation, rather than build new terminals in the six countiesbordering one of the rivers that do not have barge terminals.
6.3.10. Lower Ocean Freight Rates as a Result of the Panama Canal Expansion Could Provide Cost Savingsto Iowa Exporters using the Gulf PortsIowa is a producer state80 and exports products to many foreign countries. In 2014, the total foreign exports ofmerchandise trade from Iowa reached $15.1 billion (International Trade, 2015). Iowa’s top 5 export markets areCanada, Mexico, Japan, China and Brazil. Analyzing the export data in the iFROM shows that the total tonnage ofIowa’s exports exceeded 27 million tons in 2010 (EDR Group, 2014). Table 6-12 shows the estimated exporttonnage for the top 10 Iowa countries. Reducing transportation costs for exports may improve Iowa’scompetitiveness by helping grow export businesses.
Table 6-12: Top 10 Iowa Export Counties in 2010 Based On Total Export Tonnage
CountyEstimated Export
Tonnage% of Overall Iowa
Export
Polk County 740,000 2.73%
Clinton County 721,000 2.66%
Linn County 677,000 2.49%
Scott County 644,000 2.37%
Webster County 621,000 2.29%
Kossuth County 590,000 2.17%
Woodbury County 562,000 2.07%
Sioux County 555,000 2.04%
Story County 513,000 1.89%
Black Hawk County 497,000 1.83%
Source: Economic Development Research Group (EDR Group, 2014)
79 The capacity of a barge terminal depends on a number of factors such as the capacity of the dock equipment, the products handled,fungibility of products, access to and availability of transportation. For example, some terminals can load/offload multiple barges of dry bulkproducts per dock per day, while some bulk products may take two to three days to load/offload a barge per dock.
80 Iowa produces more than it consumes.

85Development of Iowa Statewide Freight Transportation Network Optimization Strategy
© 2016 Quetica, LLC
Most of Iowa’s exports to Canada and Mexico are transported by truck and rail. The freight network analysisincludes trade routes to Canada and Mexico. However this section focuses on analyzing trade routes via seaportsand the associated transportation costs to export products from Iowa to other foreign countries. The trade routeanalysis compares transportation costs among the commonly used trade routes by using transportation costbenchmarks described in Chapter 5 and identifies the trade routes with lower transportation costs for import/export.The analysis also examines the potential impact of lower ocean freight rates as a result of the Panama Canalexpansion project.
6.3.10.1. Transportation Costs to Export Containerized Commodities
Iowa products can be exported in containers or in bulk. This section focuses on transportation costs to shipcontainerized products to foreign countries. Containers are loaded with products at the origin site, or shipped in bulkto a U.S. seaport and transloaded to containers at the port. This scenario assumes that 40 foot containers (theinternational or ISO standard) are loaded in Iowa. The transportation costs analyzed include the followingcomponents in the cost benchmarks:
Drayage costs to move containers to an intermodal yard located in Iowa, Illinois, Minnesota, Missouriand Nebraska.
Lift costs to place containers onto a railcar.
Linehaul and fuel costs to move the container to a U.S. seaport.
Ocean freight costs to ship containers to the destination seaport.

86 Development of Iowa Statewide Freight Transportation Network Optimization Strategy
© 2016 Quetica, LLC
Figure 6-14 shows the average benchmark cost to ship a 40- foot container from Iowa to major foreign markets.The benchmark cost represents the average cost of exporting a container from each of the 99 counties in Iowa. It isworth noting that the total transportation costs to ship a container from Iowa to Europe is much higher than shippingthe same container to Eastern Asia.
Figure 6-14: Average Transportation Costs to Export a 40 foot Container from Iowa to Major Foreign Markets
Source: Quetica, LLC
$0
$2,000
$4,000
$6,000
$8,000
$10,000
$12,000
$14,000
Rep
ub
lico
fK
ore
a
Ch
ina
Arg
en
tin
a
Rem
ain
de
ro
fC
en
tral
Am
eri
ca
Sin
gap
ore
Rem
ain
de
ro
fSo
uth
-Eas
tern
Asi
a
Jap
an
Co
lom
bia
Rem
ain
de
ro
fSo
uth
Am
eri
ca
Bra
zil
Ch
ile
Car
ibb
ean
We
ste
rnA
fric
a
Mid
dle
Afr
ica
East
ern
Afr
ica
Sou
thA
fric
a
Au
stra
liaan
dN
ew
Zeal
and
East
ern
Euro
pe
Rem
ain
de
ro
fSo
uth
ern
Eu
rop
e
Turk
ey
No
rth
ern
Afr
ica
Spai
n
Fran
ce
Rem
ain
de
ro
fW
est
ern
Asi
a
Ce
ntr
alA
sia
Ind
ia
Rem
ain
de
ro
fSo
uth
ern
Asi
a
Mel
ane
sia
Un
ite
dK
ingd
om
Ne
the
rlan
ds
Ge
rman
y
Rem
ain
de
ro
fW
est
ern
Eu
rop
e
Rem
ain
de
ro
fN
ort
he
rnEu
rop
e
Ave
rage
Co
stP
er
Co
nta
ine
r
Foreign Market

87Development of Iowa Statewide Freight Transportation Network Optimization Strategy
© 2016 Quetica, LLC
Looking further into the export trade routes, the analysis compares the average transportation costs of exporting acontainer from Iowa to major European countries via commonly used U.S. seaports. Figure 6-15 shows the resultswhich suggest that an export route via the Port of Savannah or the Port of Charleston to Europe offers morecompetitive transportation rates than the other routes analyzed.
Figure 6-15: Cost Comparison: Trade Routes to Export Containerized Iowa Products to Major Economies in Europe
Source: Quetica, LLC
$0
$2,000
$4,000
$6,000
$8,000
$10,000
$12,000
$14,000
$16,000
Ave
rage
Co
stP
er
Co
nta
ine
r
Trade Route

88 Development of Iowa Statewide Freight Transportation Network Optimization Strategy
© 2016 Quetica, LLC
In the case of exporting containerized products from Iowa to Asia, the U.S. seaport choices are different. Figure 6-16 compares the average total transportation costs of exporting a container to major economies in Asia viacommonly used U.S. seaports. While the Port of Houston and Port of Savannah are the lowest cost choices toexport containerized products to India, the San Pedro Ports are the lowest cost choice to export containerizedproducts from Iowa to countries in East Asia, such as China, Japan and Korea.81
Figure 6-16: Cost Comparison: Trade Routes to Export Containerized Iowa Products to Major Economies in Asia
Source: Quetica, LLC
81 Exporting via the Port of Los Angeles, which is adjacent to the separate Port of Long Beach, has very similar transportation costs. Forthe purpose of comparing trade routes and their transportation costs, these two ports are referred to together as San Pedro Ports in thisanalysis.
$0
$2,000
$4,000
$6,000
$8,000
$10,000
$12,000
Ave
rage
Co
stP
er
Co
nta
ine
r
Trade Route

89Development of Iowa Statewide Freight Transportation Network Optimization Strategy
© 2016 Quetica, LLC
Drilling into the cost differences using different U.S. seaports, the analysis measures the transportation costs toexport a container from Iowa to China in Figure 6-17. The analysis sets the trade route cost via the San Pedro Portsto 100 percent as the base and examines the cost increases via other seaports relative to the base. The costdifferences can be quite significant. On average, trade routes via Pacific seaports have similar total transportationcosts. Transportation costs of trade routes via Gulf or Atlantic seaports, however, are at least 20 percent higher inthe case of exporting containerized goods to China.82
Figure 6-17: Cost Comparison: Trade Routes to Export Iowa Products to China83
Source: Quetica, LLC
To improve the competitiveness of export routes to East Asia via Gulf or Atlantic seaports, both ocean freight ratesand domestic transportation costs from Iowa need to be more competitive. When completed, the Panama CanalExpansion project may enable ocean carriers to lower their operating costs to ship containers from the Gulf andAtlantic seaports to China and other East Asian countries due to larger New Panamax ships. A common hypothesisis that some of these cost savings may be passed to shippers (USDOT, 2013b). However, it is expected that asignificant portion of the transportation cost savings associated with the use of larger vessels will be absorbed byproviders of transportation services (USDOT, 2013b).
82 The transportation costs include both the domestic shipment costs and ocean freight costs.
83 Transport costs via the San Pedro Ports are the base (100%) and costs via other seaports are measured as percentage of the base.
0%
20%
40%
60%
80%
100%
120%
140%
160%
180%
200%
Co
stto
Exp
ort
AC
on
tain
er
toC
hin
aa
sA
Pe
rce
nta
geo
fth
eC
ost
via
San
Pe
dro
Po
rts
Seaport Used

90 Development of Iowa Statewide Freight Transportation Network Optimization Strategy
© 2016 Quetica, LLC
The domestic freight rates from Iowa to the Gulf seaports could be more competitive using the lower cost containeron barge on the Mississippi River versus intermodal rail. Chapter 7 discusses using upbound barges to repositionempty containers84. While container on barge is possible on the Mississippi River, transportation service providersneed sufficient volume to sustain their operations. Greater freight volumes on the Mississippi River may makemoving containers more economical and the combined cost savings from containers on barges and the PanamaCanal Expansion may make Asian export trade via the Gulf Coast a viable and competitive alternative to WestCoast seaports.
6.3.10.2. Exporting Bulk Grain to Asia
A typical grain export supply chain begins with a movement from production sites to on-farm storage or an elevator,where grain is accumulated and then moved from storage to export markets. Grain elevators are used toaccumulate and store grain for bulk shipment. Trucks initially move grain from production sites to grain elevators.Smaller elevators may be used for storage and aggregation of grain that is reshipped in larger quantities to amainline shuttle elevator. Trucks, trains and barges compete and complement one another in moving grain throughthe supply chain to successively larger elevators, with shipping distance often determining each mode’s particularrole (Christensen Associates, 2012). Grain is eventually loaded to ocean vessels at a seaport if it is exported toother continents. Figure 6-18 shows the typical modal flow for modern bulk grains bound for export.
Figure 6-18: Typical Modern Flow for Bulk Grain Export
Source: Recreated from U.S. Grains Council, Value Enhanced Grain Exporter Manual, 1999.
84 Ingram Barge Company tested a single barge loaded with 54 containers to America’s Central Port in Granite City, Illinois in April, 2015:http://www.riverbender.com/articles/details/ingram-barge-companys-test-containers-make-dramatic-arrival-at-americas-central-port-6812.cfm.

91Development of Iowa Statewide Freight Transportation Network Optimization Strategy
© 2016 Quetica, LLC
Two trade routes are commonly used to export grains in bulk from Iowa to Asia:
Route 1 Scenario: Bulk grain is shipped to Seattle/Tacoma via rail, transloaded to ocean vessels andshipped to the destination seaport using ocean freight. Once grain is loaded onto a freight train in Iowa,typically one transload occurs from the train to the ocean vessel at Seattle/Tacoma seaport to deliver grainto the destination.
Route 2 Scenario: Bulk grain is shipped to a Mississippi Gulf port, such as the Port of South Louisiana,using barge, transloaded to ocean vessels and shipped to the destination seaport using ocean freight.Once grain is loaded to a barge at an Iowa barge terminal, typically one transload occurs from the barge tothe ocean vessel for delivery to the destination seaport.
This analysis examines total transportation costs in the trade route scenarios for grain exports from an Iowa countyto East and Southeast Asia. All Iowa counties are included in the analysis as the origin and the Port of ShanghaiChina is the destination seaport.85 Total transportation costs include truck drayage to a rail or barge terminal, aswell as rail, barge and ocean freight costs. Transload costs are excluded from the analysis since they areconsidered equivalent using either route. The impact of a potential ocean freight rate decrease resulting from thePanama Canal expansion is also analyzed.
Since barge rates fluctuate significantly between the seasons, the analysis uses the higher barge rates of the fallseason, as well as the average barge rate across all four seasons. Barge rates are estimated based on totaltransportation costs via the Port of South Louisiana. Total transportation costs per ton of grain moving to the Port ofSouth Louisiana is compared to a ton of grain moving to the Port of Tacoma. All counties that have at least $5 perton cost savings via the Port of South Louisiana are identified.86 Altogether, 22 Iowa counties either on or locatedclose to the Mississippi River show more than $5 per ton in cost savings from using barge comparing to the traderoute via Port of Tacoma. In 2010, approximately 200,000 tons of grain were exported to China and 2.2 million tonsof grain were exported to East and Southeast Asia from these 22 counties, according to the iFROM import/exportdata. In Figure 6-19, the Iowa areas east of the dark blue line would have lower transportation costs using barge viathe Port of South Louisiana.
85 More information about the Port of Shanghai can be found at http://www.dailymail.co.uk/news/article-2478975/Shanghai-port-worlds-busiest-handles-736m-tonnes-year.html .
86 The $5 per ton costs savings threshold provides a safety margin in estimating the opportunity size.

92 Development of Iowa Statewide Freight Transportation Network Optimization Strategy
© 2016 Quetica, LLC
Figure 6-19: Iowa Areas that Could Benefit from Using Panama Canal for Grain Exports to China
Source: Quetica, LLC
The Iowa areas east of the dark blue line would have lower transportation costs to export grain to China usingbarge via the Port of South Louisiana in the baseline scenario. If ocean freight via Panamax decreases costs by 10percent, the expanded area east of the light blue line in Iowa would have lower transportation costs to export grainto China using barge via the Port of South Louisiana.
The Panama Canal Expansion program is intended to double the capacity of the Panama Canal by June, 2016.Currently, Panamax cargo ships have a deadweight tonnage of 65,000 to 80,000 tons, but are limited to about52,000 tons during a transit due to draft limitations in the canal.87 After the canal expansion, the New Panamaxstandard can accommodate ships having a deadweight tonnage of up to 120,000 tons.88 It is likely that oceancarriers will pass some of the operational cost savings to shippers. Three unknowns that could affect the exactocean rate savings were not available when this report was published:
1. The lockage fee that will be charged by the Panamanian Government to pass a ship through the new locks;
2. The extent that Western U.S. railroads may discount rail rates to retain existing grain traffic through WestCoast ports; and
3. The amount of ocean freight cost savings passed to the shippers.
87 According to the Panama Canal Authority. More information is available at http://pancanal.com/eng/.
88 The New Panamax standard is defined by the Panama Canal Authority.

93Development of Iowa Statewide Freight Transportation Network Optimization Strategy
© 2016 Quetica, LLC
It is conceivable that more grain shipments will benefit from the export route via the Gulf, if ocean freight rates arelower using New Panamax ships. A scenario has been analyzed to assess the impact to total transportation costs, ifNew Panamax ocean freight rate is reduced by 10 percent. Figure 6-19 shows the results of the reduction scenariousing the light blue line. A total of 40 Iowa counties will have lower transportation costs using the Iowa-to-NewOrleans-to-Shanghai trade route instead of the Iowa-to-North Pacific Port-to-Shanghai trade route.
Assuming the cost structure of exporting bulk grain to other ports in East and Southeast Asia is similar to that ofexporting to Shanghai, the Panamax expansion may increase export freight volume using Gulf ports. The base year(2010) iFROM model shows that approximately 330,000 tons of grain were exported to China and 2.8 million tons ofgrain were exported to East and Southeast Asia in total from these 40 Iowa counties89. Compared to tonnage in thebaseline, there is an approximately 65 percent increase in export tonnage to China and over 27 percent increase toEast and Southeast Asia that could benefit from using the Iowa-to-New Orleans-to-East and Southeast Asia routewith a lower cost structure.
Table 6-13 summarizes the results of the impact analysis. The capacity analysis (Section 4.3) showed currentinland waterways can accommodate this increase in the base year. However, the inland waterway system maybecome a system capacity constraint with additional volume in the forecast year. It is recommended that new freightvolume data, once it is collected, be used to refresh the iFROM in the future in order to determine if and when theincrease of export freight will approach the inland waterway capacity limits.
Table 6-13: Potential Impact of Panamax Expansion Project
Baseline ScenarioIf Ocean Freight via
Panamax Decreases 10%% of Change
Number of Counties Having Lower Costs via the Gulf 22 40 82%
Annual Tonnage of Grain Exported to China 200,000 330,000 65%
Annual Tonnage of Grain Exported to East andSoutheast Asia
2,200,000 2,800,000 27%
Source: Quetica, LLC
89 According to the iFROM import/export data.

94 Development of Iowa Statewide Freight Transportation Network Optimization Strategy
© 2016 Quetica, LLC
7. Recommended Optimization Strategies
This chapter documents the recommended optimization strategies that may enhance Iowa’s freight network andaddresses the key findings in Chapter 6. Table 7-1 provides a summary of the recommended optimizationstrategies. Strategies 1 through 7 are focused on optimizing Iowa’s inbound and outbound freight. Strategies 8 and9 are focused on improving freight moving within Iowa. The table indicates the transportation mode(s) impacted bythe strategy. The remaining sections of this chapter provide more detailed commentary on the recommendedstrategies and next steps.
Table 7-1: Summary of Recommendations
Recommendations
Tru
ck
Rai
l
Bar
ge
OptimizingInbound and
OutboundFreight
Transportation
1. Explore the opportunity to establish and leveragenew truck cross-docking operations to enable greatertruck freight consolidation for Iowa businesses.
2. Explore the opportunity to develop a new railintermodal facility in Iowa to enable access to lowercost rail intermodal services for Iowa businesses.
3. Explore the opportunity to develop additionaltransload facilities to provide Iowa businesses withmore access to lower cost railroad freight services.
4. Explore opportunities to leverage a barge and railmultimodal solution to provide a cost-effective freighttransportation alternative.
5. Explore the opportunity to build a logistics park to co-locate cross-docking, intermodal, transloading andwarehousing facilities.
6. Collaborate with the railroads to provide Iowabusinesses with additional capacity to accommodateforecasted growth in Iowa freight shipments.
7. Explore opportunities to improve competitiveness ofintermodal in Iowa by repositioning empty containersusing barge and reducing repositioning costs.
Optimizingwithin Iowa
FreightTransportation
8. Explore and implement strategies to reducedeadhead truck miles. 90
9. Explore opportunities for railroads to provideadditional lower cost rail freight transportation forwithin Iowa high volume traffic lanes
Source: Quetica, LLC
90 Deadhead miles are the miles that do not generate any revenue, such as driving around between trips or going back to the office after arun.

95Development of Iowa Statewide Freight Transportation Network Optimization Strategy
© 2016 Quetica, LLC
Where applicable, the recommendations are developed based on quantitative analysis. The optimization analysisevaluates opportunities based on 3 quantitative metrics: (1) total market opportunity, (2) economic value and, (3)economic feasibility analysis. These metrics are defined as follows:
Total Market Opportunity (TMO) – TMO measures the potential recurring cost savings opportunities in theentire market. It is the estimated total net transportation cost savings as a result of the recommendedoptimization strategies. In the iFROM, the total net transportation cost savings is the difference between theoptimized transportation costs after the recommended optimization strategies are implemented and thebaseline costs, given a selected group of shipments targeted by the optimization strategies. Unless calledout specifically, the optimized transportation costs include all cost components in the baseline plusadditional operational expenses for the newly introduced transportation infrastructure. The initial investmentto establish the new transportation infrastructure is not included in the optimized costs. If an optimizationstrategy targets a particular market segment, it may only capture a portion of the TMO.
Economic Value (EV) in a Business Case – EV measures the economic benefits in a targeted marketsegment within the TMO. When a market opportunity is identified, a target market segment is defined and abusiness case is developed to measure the market value of the opportunity. EV is the estimatedtransportation cost savings in the business case.
Economic Feasibility Measurement (EFM) in a Business Case – EFM is a financial metric for evaluatingthe economic benefits from a project. In an optimization strategy evaluation, EV is compared with the initialinvestment needed to capture the cost saving opportunities in the business case. EFM is measured by theperiod of time required to recoup funds expended in implementing a recommended optimization strategy91,starting from the point that the freight volume reaches the expected level in the business case. The value ofEFM is equal to the estimated total implementation cost divided by the annual cost savings opportunitymeasured by EV: the lower the EFM value, the stronger the business case.
In business case development, two scenarios will be used to quantify the investment opportunities: a base casescenario and a conservative case scenario. The base case is the scenario with the highest likelihood. Theconservative case uses a more conservative set of assumptions to evaluate economic viability. Both scenarios willdeliver reasonable EFM if an investment opportunity is recommended.
7.1. Explore the Opportunity to Establish and Leverage New Truck Cross-Docking Operations to EnableGreater Truck Freight Consolidation for Iowa Businesses
This section elaborates on an optimization strategy to leverage cross-docking logistics techniques to address thefindings in Section 6.3.2. The optimization strategy is developed using results from both the baseline optimizationand a greenfield optimization discussed in Section 2.3.
7.1.1. Cross-Dock OverviewCross-docking is a logistics practice of unloading materials from an incoming semi-trailer truck or railroad car anddirectly loading these materials on outbound trucks, trailers or rail cars, with little or no storage in between. Cross-docking takes place in a distribution docking terminal, usually consisting of trucks and dock doors on two (inboundand outbound) sides with minimal space for storage. The name “cross-docking” explains the process of receivingproducts through an inbound dock and then transferring them across the dock to the outbound transportation dock.
91 The time value of money is not taken into account in an EFM estimate.

96 Development of Iowa Statewide Freight Transportation Network Optimization Strategy
© 2016 Quetica, LLC
This optimization strategy is focused on truck-to-truck cross-docking. Figure 7-1 depicts a typical truck-to-truck,cross-docking operation. The cross-dock essentially acts as a high throughput sorting facility for several suppliersand customers. It involves minimal warehousing combined with the economies of scale of shipping multiple supplieroutbound flows to customers by consolidating freight. Cross-docking favors the timely distribution of freight.Shipments typically spend less than 24 hours in the distribution center, sometimes less than an hour when parcelsare involved. Thus, only a small amount of transport time is added when cross-docking is involved compared todirect shipments without consolidation.
Figure 7-1: A Typical Cross-Docking Operation
Source: Quetica, LLC

97Development of Iowa Statewide Freight Transportation Network Optimization Strategy
© 2016 Quetica, LLC
Cross-docking can be used in a number of logistics situations, including:
Transportation cross-docking. Cross-docking is used to consolidate shipments from several suppliers,often in less than truckload (LTL) batches to full truckload (FTL) shipments, achieving economies of scale.Transportation companies sort and consolidate parcels and pallet loads based on geographic destination.The cross-docking services can be provided by a stand-alone cross-docking service provider or be ownedand operated by a trucking company, offering competitive rates to its shippers.
Manufacturing cross-docking. Cross-docking is used for the receipt, consolidation and shipment of rawmaterials or component parts from many suppliers to a manufacturing plant.
Distributor cross-docking. Various manufacturers ship their merchandise to a common distributor’scross-dock .The distributor assembles the products on a multi-SKU (stock keeping unit) pallet beforedelivery to the next level of the supply chain.
Retail cross-docking. Products are received at a retailer’s distribution center, moved across the dock andmarried with other products bound for the same store. For example, Wal-Mart delivers about 85 percent ofits merchandise using a cross-docking system.92
As discussed in Section 6.3.2, Iowa companies have a large volume of small truck shipments. There areopportunities to establish cross-docking operations in Iowa, in order to consolidate small shipments to TL formultiple shippers and reduce shippers’ transportation costs.
The remaining part of this section discusses the optimization analysis to size the opportunities and to access the EVand EFM in a business case.
7.1.2. Sizing the OpportunityThe optimization analysis identifies the location of cross-docking facilities in Iowa that will deliver the largest totalmarket cost savings opportunities to Iowa companies, leveraging the iFROM discussed in Chapters 3, 4 and 5.TMO is measured to size the cross-docking market opportunity. A business case with EV and EFM analysis arealso developed for the recommended optimization strategy.
The optimization strategy analysis is based on the following scope and assumptions:
All domestic shipments originated from or terminated in Iowa in the iFROM are included in the scope.Shipments within Iowa are not included, because shipment consolidation is typically used for long haulshipments. In the case of short haul shipments, cost savings from shipment consolidation may not besufficient to offset the cross-docking operational costs.
Where a cross-dock is used, outbound shipments from Iowa would be trucked to the cross-dock,consolidated and then shipped to out-of-state destinations. Conversely, inbound shipments to Iowa wouldbe trucked to the cross-dock, de-consolidated and then shipped to Iowa destinations. Baseline shipments inthe model are assumed to be consolidated in this optimization analysis (1) when transported to a cross-dock from the same origin site or (2) when transported from the cross-dock to the same destination site.
92 More information can be found athttps://www.porttechnology.org/images/uploads/technical_papers/North_American_maritime_gateways_logistics.pdf

98 Development of Iowa Statewide Freight Transportation Network Optimization Strategy
© 2016 Quetica, LLC
This optimization is focused on dry commodity shipments, the most common type of shipments usingcross-docking operations. Refrigerated and liquid commodities are excluded in this analysis. Althoughrefrigerated shipments can also be consolidated using refrigerated facilities, the TMO would be muchsmaller due to lower freight volumes. Liquid commodity shipment consolidation involves other supply chainmanagement techniques and is not the focus of cross-docking operations.
Table 7-2 lists the commodities included in the analysis scope. The SCTG Code and Commodity columnscome from standard classification of transported commodities as used in the FAF (USDOT, 2007). Theselection criteria column describes how the commodities are grouped for the analysis.
Table 7-2: Commodities Included in Analysis of Cross-Docking Operations
SCTG Code Commodity Selection Criteria
03 Other ag prods. These commodities are individuallyselected. Only the dry portions of thecommodities are selected for the analysis.
04 Animal feed
06 Milled grain prods.
07 Other foodstuffs
24 Plastics/rubber
26 Wood prods.
31 Nonmetal min. prods.
35 Electronics
38 Precision instruments
05 Meat/seafood The dry portions of these commodities areaggregated to a new commodity groupnamed “Mixed Freight – dry commodities”for the analysis.
09 Tobacco prods.
13 Nonmetallic minerals
21 Pharmaceuticals
27 Newsprint/paper
28 Paper articles
29 Printed prods.
30 Textiles/leather
33 Articles-base metal
39 Furniture
40 Misc. mfg. prods.
41 Waste/scrap
43 Mixed freight
99 Unknown
Source: Quetica, LLC
An Iowa cross-dock may draw freight traffic from nearby states, such as Wisconsin and Illinois, and reducetransportation costs for those shippers. The actual freight volume drawn from other states depends on thelocation of the cross-dock and the freight demand from those states. These cost savings opportunities arenot included in the quantitative analysis. However, considerations related to opportunities incremental tothe cost savings in the business case are discussed later in this section. It should be noted that includingfreight traffic in nearby states that is outside the scope of the study may identify different candidate regionsfor cross-dock operations than the analysis results without freight traffic in nearby states.
99Development of Iowa Statewide Freight Transportation Network Optimization Strategy
© 2016 Quetica, LLC
Transportation costs in the baseline model are used to benchmark costs currently paid by companies to transportthe commodities in the scope. The TMO is the difference between the baseline transportation costs and theoptimized transportation costs in all commodity shipments in the scope. The optimized transportation costs arecosts that companies would pay if the cross-docking operations were established and leveraged to transport thesame shipments as the ones in the baseline.
The optimized transportation costs are defined below:
COSTOptimized = COSTTruckShortHaul + COSTTruckLongHaul + COSTCross-Docking + COSTStopOff
Where:
COSTOptimized = the optimized transportation costs leveraging the suggested cross-docking operations.
COSTTruckShortHaul = the short haul truck costs to transport the commodities from the origin to a cross-dock for outbound shipments, or from a cross-dock to a final destination for inbound shipments.
COSTTruckLongHaul = the long haul truck costs to transport the commodities from a cross-dock to out-of-state destinations for outbound shipments, or from out-of-state origins to a cross-dock for inboundshipments.
COSTCross-Docking = the costs a cross-docking operator would charge to receive, sort and shipcommodities93.
COSTStopOff = the cost, or stop-off charge, assessed by trucking companies for shipments requiringadditional stops in transit, excluding the origin and final destination. The stop-off charges vary,depending on competition in the local market and the negotiated contracts94.
With these assumptions, the model was run in a green field analysis to quantitatively identify four candidate regionsfor detailed analysis of transportation cost savings opportunities: Central Iowa-A, Central Iowa-S, Western Iowaand Eastern Iowa. The TMO’s in each region, before stop-off costs, are summarized in Table 7-3.95
93 Industry feedback suggested that cross-docking costs would typically be between $300 and $525 per truck, depending on the amount ofpackaging and palletizing work required for the cross-docking operator. An average cost of $450 per truck is used in this optimizationanalysis, based on feedback from several sources in the trucking industry.
94 For example, some trucking companies charge a $50 flat fee per stop. Other companies may charge $50 for the first stop and thencharge an incremental fee per additional stop. In this optimization analysis, an average of $50 charge for the first stop and $100 charge foreach subsequent stop up to 5 stops is used to benchmark the optimized costs.
95 Subsequent analysis, outside the scope of the optimization study, will identify exact site locations within the regions and will bedependent on a number of qualitative factors, such as physical constraints, access to road and rail networks, community support, etc.

100 Development of Iowa Statewide Freight Transportation Network Optimization Strategy
© 2016 Quetica, LLC
Table 7–3: Total Market Opportunity (TMO) Before Factoring In Stop-Off Costs
RegionApproximate Annual
Outbound Truck Countfrom Cross-Dock
Approximate AnnualCross-Docking Costs
Approximate AnnualTransportation Cost
Savings
Central Iowa-A 973,000 $438 Million $867 Million96
Central Iowa-S 948,000 $427 Million $870 Million96
Western Iowa 614,000 $276 Million $670 Million96
Eastern Iowa 947,000 $426 Million $852 Million96
Source: Quetica, LLC
All four regions have large transportation cost savings opportunities, with Central Iowa-A, Central Iowa-S, andEastern Iowa ranked closely measured by the TMO amount.97 Because of the large amount of truck traffic to andfrom cross-docking facilities, cross-docks are typically built on sites with access to interstate highways. Thisqualitative measurement helps eliminate Central Iowa-S and Western Iowa for further analysis, since neither regionhas direct access to interstates.
Cross-docking opportunities in Central Iowa-A and Eastern Iowa are selected to conduct further analysis with stop-off costs. The total market transportation cost savings, after factoring in stop-off costs, are compared in Figure 7-2.The net savings amounts decline as the number of stops increases, because each stop incurs a $50 to $100 stop-off charge per truck. Using the average number of stops in the iFROM dataset, the TMO is approximately $700million in both cases, with cross-docking in Central Iowa-A generating slightly higher cost savings. However, thedifferences between these two cases are significant enough to select one region over the other one.
96 The TMO in each region is individually sized. If cross docks are established in multiple regions in close proximity to each other, they maycompete for the same shipments. The total cost savings would be less than the sum of all regions’ cost savings. In addition, existing crossdocks in the area may compete for the same truck freight consolidation opportunities.
97 The TMO amounts have been adjusted assuming intermodal and transload opportunities will be pursued together with the cross dockopportunity. The TMO size would be larger if intermodal and transload opportunities are not considered.

101Development of Iowa Statewide Freight Transportation Network Optimization Strategy
© 2016 Quetica, LLC
Figure 7-2: Comparing Total Market Opportunities (TMO) between Eastern Iowa and Central Iowa-A
Source: Quetica, LLC
Eastern Iowa was selected to conduct a business case analysis, because the region was also identified as apotential location for intermodal operations discussed in Section 7.2. Co-locating cross-docking with other logisticscapabilities, such as intermodal, transloading and warehousing, creates synergies within the region, helping tojustify a logistics hub to support economic development in Eastern Iowa (see Section 7.5). The TMO size in cross-docking in Eastern Iowa is between $426 million and $851 million, depending on the number of stops. Developingcross-docking capabilities in Central Iowa-A would remain an economically viable option to optimize Iowa’stransportation network should additional cross-dock facilities be considered.
$0
$100,000,000
$200,000,000
$300,000,000
$400,000,000
$500,000,000
$600,000,000
$700,000,000
$800,000,000
$900,000,000
0 Stop 1 Stop 2 Stops Average inDataset
3 Stops 4 Stops 5 Stops
Esti
ma
ted
An
nu
alT
ran
spo
rtat
on
Co
stSa
vin
gs
Number of Stops
Eastern Iowa-A
Central Iowa
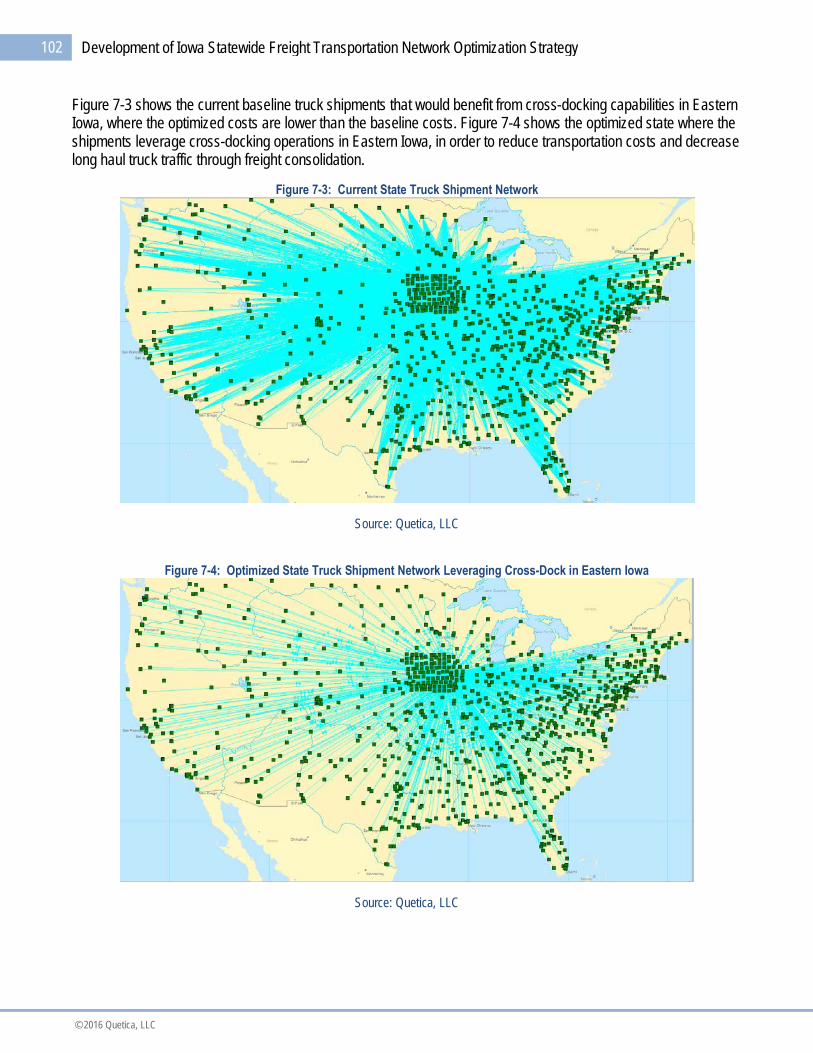
102 Development of Iowa Statewide Freight Transportation Network Optimization Strategy
© 2016 Quetica, LLC
Figure 7-3 shows the current baseline truck shipments that would benefit from cross-docking capabilities in EasternIowa, where the optimized costs are lower than the baseline costs. Figure 7-4 shows the optimized state where theshipments leverage cross-docking operations in Eastern Iowa, in order to reduce transportation costs and decreaselong haul truck traffic through freight consolidation.
Figure 7-3: Current State Truck Shipment Network
Source: Quetica, LLC
Figure 7-4: Optimized State Truck Shipment Network Leveraging Cross-Dock in Eastern Iowa
Source: Quetica, LLC
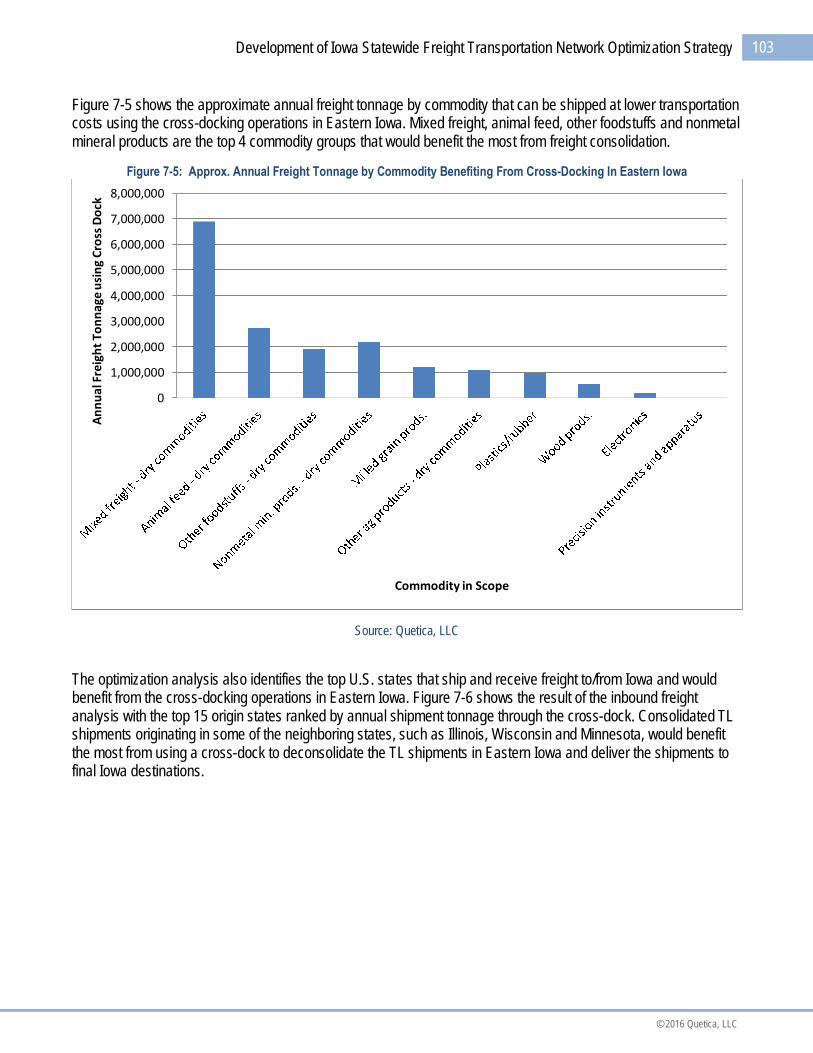
103Development of Iowa Statewide Freight Transportation Network Optimization Strategy
© 2016 Quetica, LLC
Figure 7-5 shows the approximate annual freight tonnage by commodity that can be shipped at lower transportationcosts using the cross-docking operations in Eastern Iowa. Mixed freight, animal feed, other foodstuffs and nonmetalmineral products are the top 4 commodity groups that would benefit the most from freight consolidation.
Figure 7-5: Approx. Annual Freight Tonnage by Commodity Benefiting From Cross-Docking In Eastern Iowa
Source: Quetica, LLC
The optimization analysis also identifies the top U.S. states that ship and receive freight to/from Iowa and wouldbenefit from the cross-docking operations in Eastern Iowa. Figure 7-6 shows the result of the inbound freightanalysis with the top 15 origin states ranked by annual shipment tonnage through the cross-dock. Consolidated TLshipments originating in some of the neighboring states, such as Illinois, Wisconsin and Minnesota, would benefitthe most from using a cross-dock to deconsolidate the TL shipments in Eastern Iowa and deliver the shipments tofinal Iowa destinations.
0
1,000,000
2,000,000
3,000,000
4,000,000
5,000,000
6,000,000
7,000,000
8,000,000
An
nu
alF
reig
ht
To
nn
age
usi
ng
Cro
ssD
ock
Commodity in Scope

104 Development of Iowa Statewide Freight Transportation Network Optimization Strategy
© 2016 Quetica, LLC
Figure 7-6: Approx. Annual Freight Tonnage by Origin State Benefiting from Cross-Docking Operations in Eastern Iowa
Source: Quetica, LLC
Conversely, Figure 7-7 shows the outbound freight analysis results. Shipments originating in Iowa and terminatingin some of the neighboring states, such as Illinois, Minnesota, Nebraska, Wisconsin and Missouri, would benefit themost from using the cross-docking operations to consolidate the Iowa shipments into TL and deliver the shipmentsto final out-of-state destinations.
Figure 7-7: Approx. Annual Freight Tonnage by Destination State Benefiting from Cross-Docking Operations in Eastern Iowa
Source: Quetica, LLC
0
200,000
400,000
600,000
800,000
1,000,000
1,200,000
1,400,000
1,600,000
1,800,000
2,000,000A
pp
roxi
ma
teA
nn
ua
lTo
nn
age
Origin State
Top 15 Inbound Origins
0
500,000
1,000,000
1,500,000
2,000,000
2,500,000
3,000,000
3,500,000
4,000,000
Ap
pro
xim
ate
An
nu
alT
on
na
ge
Destination State
Top 15 Outbound Destinations

105Development of Iowa Statewide Freight Transportation Network Optimization Strategy
© 2016 Quetica, LLC
7.1.3. Developing a Business CaseThe TMO identified in the cross-docking analysis justifies additional financial analysis to assess the EV and EFM ina business case. The business case is focused on analyzing the EV in terms of transportation cost savings versusthe initial investment. It does not focus on analyzing the costs and benefits of all parties (such as shippers, railcarriers, facility operator, investor and state and local government agencies) involved in building and operatingcross-dock facilities.
This business case is to build a mid-sized cross-dock in Eastern Iowa, which is assumed to include:
A 120,000 square feet cross-dock facility with 150 doors and 600 trailer parking spaces on 15 acres of land.
Capacity to accommodate approximately 200 truck pickups daily and 52,000 truck pickups yearly, whileoperating 5 days a week, 52 weeks a year. This volume represents approximately 5.30 percent of the totalmarket volume discussed in Section 7.1.2.
A cross-docking fee at $450 per truck, covering all operational expenses and profit margin required by thecross-dock operator.
The rough order of magnitude (ROM) estimated cost to build the facility is $21 million. The high level breakdown ofthe cost components are in Table 7-4. The actual costs could be higher, if additional infrastructure investment isrequired to create access to the interstate for the cross-dock to accommodate the expected truck traffic.
Figure 7-8 shows the estimated EV measured by the annual transportation cost savings relative to the number ofstops in shipments. The approximate total annual EV is between $22 million and $45 million, depending on thenumber of stops needed. If the average number of stops in the iFROM dataset is used, the estimated total annualEV is approximately $34 million.
Two financial scenarios are analyzed in the business case. EFM is estimated from the point the cross-dock is fullyoperational and freight volume is ramped up to the expected throughput level. In the base case scenario, theaverage number of stops in the iFROM dataset is used. The EFM for the cross-dock is approximately 0.6 years. Inthe conservative scenario, five stops per shipment are used to estimate the ROI. The EFM in the conservative caseis estimated at 1 year.

106 Development of Iowa Statewide Freight Transportation Network Optimization Strategy
© 2016 Quetica, LLC
The EFM analysis shows a strong financial case to construct a mid-sized cross-dock in Eastern Iowa.
Table 7-4: ROM Financial Analysis for a Mid-Sized Cross-Dock in Eastern Iowa
Item Approximate Amount
Construction Cost $5 million
Doors $1 million
15 Acres of Land $5 million
Support Systems98 $10 million
Total Investment $21 million
Approximate Annual Transportation CostSavings
$22 million to $45 million
(Average $34 million)
Base Case Cost Savings $34 Million
Base Case Payback Period 0.6 years
Conservative Case Cost Savings $22 Million
Conservative Case Payback Period 1 year
Source: Quetica, LLC
Figure 7-8: Estimated Annual EV from a Mid-Sized Cross-Dock in Eastern Iowa
Source: Quetica, LLC
Mid-sized cross-docks, similar to the suggested facility in Eastern Iowa, are common in the industry. Someexamples are provided in the remainder of this section.
98 Support systems include sortation, information technology, security, etc.
$0
$10,000,000
$20,000,000
$30,000,000
$40,000,000
$50,000,000
0 Stop 1 Stop 2 Stops Average inDataset
3 Stops 4 Stops 5 Stops
Ap
pro
xim
ate
An
nu
alS
avi
ngs
Number of Stops

107Development of Iowa Statewide Freight Transportation Network Optimization Strategy
© 2016 Quetica, LLC
7.1.3.1. Comparable Cross-Dock Facilities
Old Dominion Freight Line, a $535.5 million trucking company, operates a 150-door cross-docking facility onroughly 16 acres in Memphis, TN. The facility employs approximately 308 people. Figure 7-9 shows the location ofthe facility. Old Dominion plans to invest $31.3 million to replace the 150-door site by building a 229-door cross-docking facility, creating 188 new jobs in the area99.
Figure 7-9: Aerial View of Old Dominion’s 150-Door Cross-Dock in Memphis, TN
Source: Google Maps
NFI is a $1 billion provider of logistics, warehousing, transportation and distribution services. It operates a 150-doorcross-dock in Breinigsville, PA.100 The cross-dock has 254,000 square feet of space, with 550 trailer spots onroughly 40 acres of land (shown in Figure 7-10). The cross-dock is close to CSX and Norfolk Southern intermodalrail yards. NFI also provides other services such as custom and promotional packaging, light manufacturing /assembly, and product labeling at the facility.
99 More information can be found at http://www.commercialappeal.com/business/two-memphis-business-expansions-would-create-208
100 http://www.nfiindustries.com/about-nfi/

108 Development of Iowa Statewide Freight Transportation Network Optimization Strategy
© 2016 Quetica, LLC
Figure 7-10: Aerial View of NFI’s 150-Door Cross-Dock in Breinigsville, PA
Source: Google Maps
Reddaway Fontana Service Center is owned by Reddaway, a $335 million subsidiary of YRC Worldwide.101 It is a160-door facility located on 17.6 acres of land in Fontana, CA (shown in Figure 7-11). Reddaway provides cross-docking services to L&L Nursery Supply, a West Coast manufacturer and distributor of lawn and garden products,to consolidate shipments from over 60 manufacturers and deliver full truckloads to a major retailer.
Figure 7-11: Aerial View of Reddaway’s 150-Door Cross-Dock in Fontana, CA
Source: Google Maps
101 More information can be found at http://reddawayregional.com/services/consolidationDistribution_casestudy.shtml.

109Development of Iowa Statewide Freight Transportation Network Optimization Strategy
© 2016 Quetica, LLC
7.1.3.2. Recommended Next Steps
Cross-docking is a widely-used, effective logistics technique to consolidate shipments, in order to reducetransportation costs and to help reduce the expensive inventory holding and order picking costs from distributioncenters in modern supply chains. Since there is a compelling financial case to establish cross-docking operationsin Eastern Iowa to reduce total transportation costs for Iowa companies, it is recommended that the marketopportunity be pursued further, including:
Reaching out to Iowa stakeholders, including shippers, carriers, third party logistics companies and localgovernment agencies, to discuss this opportunity and obtain feedback.
Exploring strategic, business development partnerships and various business models with interestedparties. Cross-docks have multiple viable ownership models, depending on the situation, including:
o Cross-docks owned and operated by shippers. Large shippers in manufacturing, distributionand retail industries typically have the need to transport a large amount of freight in a timelymanner. Many of them own and operate cross-docks.102
o Cross-docks owned and operated by carriers. Many LTL and package carriers, such as UPSand FedEx, use cross-docks to consolidate freight and reduce costs in transportation.
o Cross-docks owned and/or operated by third-party logistics companies or cross-dockingservice providers to handle transportation management, warehousing, order management, etc.103
The key to successfully implementing the strategy is to provide cross-docking services to multiple Iowashippers and capture the density of the freight flow. A single shipper may not have large enough volume tosustain the cross-docking operations. Both carrier-owned and service provider-owned models are worthadditional consideration because they benefit multiple shippers. It is important to identify parties interestedin the market opportunity for potential public-private partnership.
Collaborating with interested parties to complete a feasibility study to identify anchor shippers and trafficlanes, select the site, detail the facility design concept and develop a detailed financial plan. Data from theiFROM and from private sources can be leveraged to justify a cross-dock implementation project.
During the revision process of this final report, Iowa DOT, IEDA, and their private partners have used theoptimization recommendations and the supporting data to develop an application for the Fostering Advancements inShipping and Transportation for the Long-term Achievement of National Efficient (FASTLANE) Grant. The grantapplication proposes a logistics park in Eastern Iowa to provide cross-docking, intermodal, transloading, and otherlogistics services. The project will provide Iowa and the surrounding states with access to a high capacity, efficient,and cost-competitive facility to move goods from truck to rail and vice versa. In July 2016, Iowa DOT and its privatepartners were awarded $25.6 million in the FASTLANE grant to develop the proposed logistics park (USDOT,2016).
102 For example, Wal-Mart delivers about 85 percent of its merchandise using a cross-docking system. GE’s distribution network includes130 cross-dock locations and 9 distribution centers across the country. Home Depot has a network of Rapid Deployment Centers usingcross-docks.
103 For example, UPS Logistics provides cross-docking solutions to Harley-Davidson in WI (see https://www.ups-scs.com/solutions/case_studies/cs_harley.pdf). Ryder manages cross-docking operations for Chrysler Mexico (seehttp://www.reuters.com/article/2014/09/24/fl-ryder-system-idUSnBw245045a+100+BSW20140924). Schneider Logistics provides sharedLTL/cross-docking services to shippers having similar distribution locations and dispatch schedules (seehttp://mhlnews.com/transportation-amp-distribution/schneider-logistics-launches-shared-ltl-service).

110 Development of Iowa Statewide Freight Transportation Network Optimization Strategy
© 2016 Quetica, LLC
7.2. Explore the Opportunity of a New Rail Intermodal Facility in Iowa to Enable Access to Lower Cost RailIntermodal Services for Iowa Businesses
This section discusses the optimization strategy using intermodal freight to address the findings in Section 6.3.5.The optimization strategy is developed using results from both the baseline optimization and a greenfieldoptimization discussed in Section 2.1.
7.2.1. Overview of Optimization Strategy Using IntermodalIntermodal freight involves the transportation of containerized freight using multiple shipment modes, such as truck,rail and barge. Intermodal is designed to capture the best of each mode, combining the economies of rail linehaul(with a much lower average cost per mile) with the flexibility of trucking for local drayage. Every year, nearly 25million containers and trailers are moved using intermodal transportation in the U.S. (IANA, 2015). Electronics, mail,food, paper products, clothes, appliances, textiles and auto parts all take a ride on the country's intermodal network.Intermodal freight has been the fastest growing segment of the freight rail industry since 1980 (FRA, 2015).Domestic intermodal traffic will continue to increase as a result of converting truckloads from highway to intermodalrail (Inbound Logistics, 2012). Domestic and international intermodal freight can involve multiple shipment modes,such as truck, rail, barge and ocean. In this optimization strategy using intermodal, the analysis is focused ondomestic containerized freight using truck and rail, since leveraging rail transportation presents large cost savingsopportunities in the baseline optimization analysis.
As discussed in Section 6.3.5, access to a nearby intermodal rail yard is crucial for companies to leverage the lowercost intermodal freight. An intermodal rail yard is a facility where goods on trailers in containers are transferred.Transportation costs are optimized where goods travel long distance by rail and move locally by truck. Intermodalyards typically consist of loading tracks and paved areas to support lifting equipment, truck movements and storageareas. A gate area, similar to a toll booth facility, is provided to control access to the yard and log vehicles in andout. Containerized goods can be transported using trailers mounted on flat railcars (TOFC) or containers on flatcars (COFC).
Introduced in North America in 1984104, double stack rail services in COFC improve the productivity of intermodaltransportation since two containers can be stacked on a rail car, essentially doubling the capacity of an intermodaltrain. At the same time, double stack operations require a more complex loading or unloading procedure and ahigher clearance to pass beneath bridges and tunnels. Figure 7-12 shows an intermodal yard in the U.S. withdouble stack rail cars.
104 According to: http://www.civil.utah.edu/~zhou/container_scheduling.pdf.

111Development of Iowa Statewide Freight Transportation Network Optimization Strategy
© 2016 Quetica, LLC
Figure 7-12: An Intermodal Yard with Double Stacked Rail Cars
Source: http://www.inboundlogistics.com/cms/article/intermodal-more-than-roads-and-rails/
Currently, there are approximately 190 intermodal yards in the U.S. The locations of these yards are shown inFigure 7-13. Only one intermodal yard is located in Iowa: the Iowa Interstate Railroad facility in Council Bluffs.There are a number of intermodal yards located in nearby states, including the UP intermodal yard located inRochelle (Illinois), nearly 24 sites in the Chicago area, multiple yards in the Kansas City area (Missouri/Kansas), St.Louis area (Missouri), and Minneapolis/St. Paul area (Minnesota), as well as one yard in the Omaha area(Nebraska).
Figure 7-13: Existing Intermodal Facilities in U.S. in 2014
Source: Quetica, LLC
As discussed in Section 6.3.5, a large portion of Iowa is outside of a 100 mile radius of existing intermodal yards.This situation increases the intermodal transportation costs for companies located in this area of Iowa due to higherdrayage costs. Feedback from multiple companies located in Eastern Iowa indicate that high drayage costs, fromdraying containers to intermodal yards in Illinois, make intermodal shipments cost inefficient for many medium haultraffic lanes (500 to 1,000 miles).

112 Development of Iowa Statewide Freight Transportation Network Optimization Strategy
© 2016 Quetica, LLC
Section 7.2.2 outlines the analysis of the market size, location and business case to establish a new intermodalyard in Iowa.
7.2.2. Sizing the OpportunityThe optimization identifies the location of a new intermodal yard in Iowa that could deliver the largest TMO to Iowacompanies, leveraging the iFROM freight demand module discussed in Chapter 3, the network model discussed inChapter 4 and the supply chain cost benchmarks discussed in Chapter 5.
Intermodal services include both COFC and TOFC. Since over 88 percent of intermodal units transported by Class Irailroads are COFC in recent years (AAR, 2016), this study focuses the market analysis on COFC opportunity.
TMO is used to size the market opportunity. TMO is defined as the transportation cost savings as a result of usingthe new intermodal yard, compared to the baseline transportation costs using trucking or truck-to-rail at anintermodal yard farther away. Once the TMO is identified, a business case is developed to show the EV and EFM ofthe suggested facility.
The optimization analysis is based on the following scope and assumptions:
All domestic shipments between Iowa and out-of-state locations, as well as the domestic legs ofimport/export shipments in the iFROM, are included in the scope. As discussed in Chapter 3, allimport/export shipments include two shipment legs: (1) the domestic leg is the shipment between an Iowalocation and a U.S. port site; and (2) the international leg is the shipment between a U.S. port and a foreignport or foreign origin/destination site. In this analysis, the international legs of import/export shipments arenot included in the scope.
For domestic shipments, only the movements between Iowa and out-of-state locations are the focus of theanalysis. Shipments within Iowa are not included in scope, because intermodal shipments are typicallyused for long haul shipments.
It is assumed that baseline shipments are not consolidated. In trucking-to-intermodal conversions, freightoriginated and terminated in the same locations can be consolidated to lower transportation costs.However, the consolidation strategy requires additional supply chain management capabilities. Theoptimization strategy in this section does not include cost savings from this type of consolidation process.
It is assumed that less-than-container shipments are not used. If a shipment is less than a container, thefull container shipment costs are used in cost benchmarks. Less-than-container shipment allowscompanies to consolidate multiple small shipments into one full container. Successful use of less-than-container shipment can further reduce intermodal transportation costs and decrease the lift numbers in anintermodal yard. However, it also requires additional transportation management capabilities.
Commodities included in the analysis are only dry commodities that are likely to be shipped by intermodal.Refrigerated and liquid commodities are excluded in the analysis, because they require refrigerated or ISOtank containers with a much smaller market size than dry commodity container shipments. However,shipments of refrigerated and ISO tank containers can also leverage the suggested intermodal yard tolower transportation costs. The cost savings opportunities in that case will be in addition to theopportunities discussed in this section.
Table 7-5 lists the commodities included in the analysis scope. The SCTG Code and Commodity columnscome from standard classification of transported goods (USDOT, 2007). The selection criteria columndescribes how the commodities are grouped for the intermodal yard analysis.

113Development of Iowa Statewide Freight Transportation Network Optimization Strategy
© 2016 Quetica, LLC
Table 7-5: Commodities Included in Optimization Strategy Analysis using Intermodal Transportation
SCTGCode
Commodity Selection Criteria
03 Other ag prods. These commodities are individually selected. Only the dryportions of the commodities are selected for the analysis.
04 Animal feed
06 Milled grain prods.
07 Other foodstuffs
24 Plastics/rubber
26 Wood prods.
31 Nonmetal min. prods.
34 Machinery
35 Electronics
38 Precision instruments
05 Meat/seafood The dry portions of these commodities are aggregated to anew commodity group named “Mixed Freight – drycommodities” for the analysis09 Tobacco prods.
13 Nonmetallic minerals
21 Pharmaceuticals
27 Newsprint/paper
28 Paper articles
29 Printed prods.
30 Textiles/leather
33 Articles-base metal
39 Furniture
40 Misc. mfg. prods.
41 Waste/scrap
43 Mixed freight
99 Unknown
Source: Quetica, LLC

114 Development of Iowa Statewide Freight Transportation Network Optimization Strategy
© 2016 Quetica, LLC
As discussed in Section 6.3.5, an intermodal yard tends to draw freight traffic from areas within a 100 mileradius of the facility. It is conceivable that the suggested intermodal yard may draw freight traffic fromnearby states, such as Wisconsin and Missouri. These cost savings opportunities are not included in thisanalysis and would be in addition to the savings noted in the business case outlined in this section. Itshould be noted that including freight traffic in nearby states outside the scope of the study may identifydifferent candidate regions for an intermodal yard than the analysis results without freight traffic in nearbystates.
Freight originated or terminated in 22 Iowa counties105 located within a 100 mile radius from Council Bluffsis excluded from the analysis. It is assumed that it is more cost effective for companies in these counties touse the existing Council Bluffs intermodal yard.
Transportation costs in the baseline model are used to benchmark costs companies currently pay to transportshipments in the study scope. TMO is measured as the difference between baseline transportation costs andoptimized transportation costs. The optimized transportation costs are costs that companies would pay if theintermodal operations are established and leveraged to transport the same shipments.
The optimized transportation costs are defined as below:
COSTOptimized = COSTTruckDryage + COSTIntermodalRail + COSTLift + COSTRepositioningEmptyContainer
Where:
COSTOptimized = the optimized transportation costs using the suggested intermodal yard.
COSTTruckDrayage = the drayage costs to truck a container from origin to originating intermodal yardand from terminating intermodal yard to final destination.
COSTIntermodalRail = the intermodal railroad costs between originating and terminating intermodalyards.
COSTLift = the lifting costs to move a container from truck to railcar at originating intermodal yardand from railcar to truck at terminating yard.
COSTRepositioningEmptyContainer = the costs to reposition empty containers to Iowa because there is acontainer imbalance issue in Iowa (Iowa DOT, 2015).
Iowa is a producing state. More products are shipped from Iowa to its customers than products transported to Iowafrom other states for consumption, resulting in a shortage of empty containers in Iowa. Empty containers need to bebrought into Iowa, typically by rail, loaded with Iowa products and shipped out using truck or intermodal. The costsof repositioning empty containers are included in estimating the net cost savings.
105 The 22 counties are: Woodbury, Ida, Sac, Monona, Crawford, Carroll, Harrison, Shelby, Audubon, Guthrie, Pottawattamie, Cass, Adair,Madison, Mills, Montgomery, Adams, Union, Fremont, Page, Taylor and Ringgold.

115Development of Iowa Statewide Freight Transportation Network Optimization Strategy
© 2016 Quetica, LLC
A Minnesota Department of Transportation (MnDOT) study found that the cost to reposition an empty containerfrom Chicago, IL with a fuel surcharge to St. Paul, MN is approximately $436 (MnDOT, 2009). Wilbur SmithAssociates and TranSystems, Inc. prepared a feasibility study in August of 2007 for the North Dakota Departmentof Transportation (NDDOT) in regard to expanded intermodal service to the Fargo/Dilworth area. Containeravailability surfaced as one of the more prominent barriers. The cost to reposition a container for reloading wasreported to be in the range of $350 to $750 (Wu, 2008). This cost was passed on to the shipper. For purposes ofthis current study, subject matter expert feedback indicated that the empty container repositioning cost isapproximately $600 per container for Iowa. Based on these sources, a $600 per container cost assumption wasused in this optimization strategy to estimate net cost savings.
Within the scope and assumptions discussed above, three candidate regions were identified quantitatively foradditional analysis of transportation cost savings opportunities: Central Iowa-1, Central Iowa-2 and Eastern Iowa106.All three regions produced similar ratings in the quantitative ROM transportation cost model. Eastern Iowa wasselected to conduct a detailed cost savings analysis, because of its access to two Class I, one Class II, and twoClass III railroads and Iowa’s Primary Highway System.
Figure 7-14 shows the current baseline freight shipments that would benefit from an intermodal yard in EasternIowa, i.e., their optimized costs are lower than their baseline costs. Figure 7-15 shows the optimized state wherethese shipments leverage intermodal rail transportation to reduce transportation costs and decrease truck traffic.
106 Subsequent analysis, outside the scope of the optimization study, will identify exact site locations within the regions and will bedependent on a number of qualitative factors, such as physical constraints, access to road and rail networks, community support, etc.

116 Development of Iowa Statewide Freight Transportation Network Optimization Strategy
© 2016 Quetica, LLC
Figure 7-14: Current Baseline Shipments That Would Benefit from an Intermodal Yard In Eastern Iowa
Source: Quetica, LLCThe map shows the commodity flows included in the intermodal optimization analysis. Most of these commodity shipments are truck
shipments in the baseline iFROM.
Figure 7-15: Optimized State Shipments Leveraging an Intermodal Yard In Eastern Iowa
Source: Quetica, LLCThe map shows the same commodity shipments in Figure 7-14 if transported using the suggested intermodal yard, assuming all of the in-
scope truck shipments in the baseline iFROM are converted to intermodal shipments.

117Development of Iowa Statewide Freight Transportation Network Optimization Strategy
© 2016 Quetica, LLC
The TMO analysis in this optimization strategy is focused on the high volume intermodal traffic lanes. An intermodaltraffic lane is an originating-terminating intermodal yard pair that would have lower transportation costs thanbaseline costs, using the suggested intermodal yard in Eastern Iowa. Intermodal transportation needs sufficientvolume on each traffic lane to sustain the operations. All intermodal traffic lanes in the optimization model areranked based on estimated annual container shipment count and potential annual cost savings.
The annual gross cost savings from converting truck freight to intermodal rail freight is approximately $340 millionfrom the top 25 high volume lanes.107 The TMO is estimated at approximately $197 million in net transportation costsavings per year108, as shown in Table 7-6. The net transportation cost savings account for empty containerrepositioning costs of approximately $143 million annually.
Five commodity groups contribute the largest freight volume in the TMO analysis: Other agriculture products – drycommodities, Animal feed – dry commodities, Other foodstuffs – dry commodities, Machinery, and Mixed freight –dry commodities. Together, these five commodity groups represent over 85 percent of the total volume benefitingfrom the suggested intermodal yard in Eastern Iowa, shown in Figure 7-16. Not surprisingly, the counties thatbenefit the most from the intermodal yard are relatively close to the suggested facility, as shown in Figure 7-17.
107 This analysis assumes that an intermodal facility will be co-located with cross-dock and transload facilities in a logistics park (seeSection 7.5 for details). Since cross-dock and transload operations will be competing for the same freight movements with intermodal, theestimated intermodal cost savings opportunity is smaller than the case if an intermodal facility is individually sized without cross dock andtransload facilities in the same region.
108 This analysis assumes that steel-wheel interchange is used if intermodal trains need to interchange with another rail carrier. If steel-wheel interchange is not available, rubber tire interchange is required. The additional costs associated with rubber tire interchange, ifneeded, are not included in the net transportation cost savings estimate.

118 Development of Iowa Statewide Freight Transportation Network Optimization Strategy
© 2016 Quetica, LLC
Table 7-6: The TMO of the Suggested Intermodal Yard in Eastern Iowa, Focusing on High Volume Traffic Lanes
IowaIntermodal
Yard Location
Out-of-StateIntermodal Yard
Location
ApproximateAnnual OutboundContainer Number
Approximate AnnualInbound Container
Number
EstimatedAnnual
ContainerNumber
Estimated AnnualCost Savings
Eastern Iowa Seattle/Tacoma, WA 58,226 11,415 69,641 $54,000,000
Eastern Iowa Long Beach, CA 37,430 21,841 59,271 $33,000,000
Eastern Iowa San Antonio, TX 43,977 16,048 60,025 $26,000,000
Eastern Iowa New Orleans, LA 34,834 16,196 51,031 $20,000,000
Eastern Iowa Tampa, FL 13,009 600 13,609 $17,000,000
Eastern Iowa Portland, OR 11,752 8,161 19,913 $17,000,000
Eastern Iowa Miami, FL 13,543 2,766 16,310 $16,000,000
Eastern Iowa Los Angeles, CA 16,712 4,003 20,714 $16,000,000
Eastern Iowa El Paso, TX 16,813 4,646 21,460 $14,000,000
Eastern Iowa Baltimore, MD 17,121 2,995 20,117 $14,000,000
Eastern Iowa Stockton/French Camp,CA
11,609 3,604 15,213 $12,000,000
Eastern Iowa San Bernardino, CA 12,907 3,239 16,146 $11,000,000
Eastern Iowa Fresno, CA 10,357 4,006 14,363 $11,000,000
Eastern Iowa Fort Lauderdale, FL 7,405 801 8,206 $9,000,000
Eastern Iowa Oakland, CA 10,580 2,479 13,059 $8,000,000
Eastern Iowa Spokane, WA 8,906 350 9,256 $8,000,000
Eastern Iowa Staten Island, NY 7,110 356 7,466 $8,000,000
Eastern Iowa Savannah, GA 11,494 5,715 17,209 $8,000,000
Eastern Iowa Auburn, ME 2,613 6,748 9,361 $7,000,000
Eastern Iowa Burlington, VT 5,366 3,699 9,065 $7,000,000
Eastern Iowa Albany, NY 9,346 3,302 12,648 $7,000,000
Eastern Iowa Lewiston, ID 6,563 4,514 11,076 $6,000,000
Eastern Iowa Sparks/Reno, NV 2,402 1,951 4,353 $4,000,000
Eastern Iowa Las Vegas, NV 2,802 5,804 8,606 $4,000,000
Eastern Iowa East Syracuse, NY 4,312 3,983 8,295 $3,000,000
Gross Savings $340,000,000
Total Outbound Container Number 377,187
Total Inbound Container Number 139,223
Total Container Deficit 237,964
Total Number of Lifts (including empty containers) 754,374
Empty Container Reposition Costs ($600 Each) ($142,778,625)
Net Savings $197,221,375
Source: Quetica, LLCAnnual gross transportation cost savings from converting truck freight to intermodal rail freight is approximately $340 million. Given $143
million empty container repositioning costs, the annual TMO is approximately $197 million.

119Development of Iowa Statewide Freight Transportation Network Optimization Strategy
© 2016 Quetica, LLC
Figure 7-16: Annual Freight Volume Measured By Container Count by Commodity in the TMO
Source: Quetica, LLC
Figure 7-17: Top 10 Counties with the Largest Intermodal Freight Volume (as a Percentage of Total Market Size)109
Source: Quetica, LLC
109 The counties in Figure 7-17 all have more than 2.0 percent of the total market measured by estimated annual container count.
0
20,000
40,000
60,000
80,000
100,000
120,000
140,000
Esti
ma
ted
An
nu
alC
on
tain
er
Co
un
t
Commodity
0.00%
2.00%
4.00%
6.00%
8.00%
10.00%
12.00%
Co
nta
ine
rV
olu
me
as
%o
fT
ota
lO
pp
ort
un
ity
County Name

120 Development of Iowa Statewide Freight Transportation Network Optimization Strategy
© 2016 Quetica, LLC
7.2.3. Developing a Business CaseThe TMO identified in the previous section is significant and requires an additional business case analysis toassess the EV and EFM. The business case is focused on analyzing the economic value in terms of thetransportation cost savings versus the initial investment. It does not focus on analyzing the costs and benefits of allparties (such as shippers, rail carriers, facility operator, investor and state and local government agencies) involvedin building and operating an intermodal yard.
Intermodal traffic represents a significant market share in major transportation markets. For example, intermodal vs.truck market share is 80 vs 20 percent between Los Angeles and Chicago and 49 vs. 51 percent between Chicagoand New York (FRA, 2010). Since the Iowa market is much smaller, the percentage of truck conversion is expectedto be lower due to lower freight density. A Wisconsin study suggested that a well-run intermodal operation wouldcapture 7 to 15 percent of the truck market (Stewart, 2003). The Wisconsin study used an average conversionfactor of 11 percent. A West Virginia study suggested 12 to 14 percent conversion rate in 3 to 5 years following thecompletion of an intermodal yard (WVPPA, 2007).
In this optimization strategy analysis, the business case is focused on only the top 10 high volume traffic lanes.These top 10 lanes, listed in Table 7-7, are selected because they are all long haul lanes over 750 miles, and likelyinvolve only one interchange between the origin and destination intermodal yards110, which helps manage theintermodal transportation costs and makes intermodal more attractive to Iowa businesses. A 13 percent truck-to-intermodal conversion rate was used in the base case analysis based on analysis of the previous studies (Stewart,2003, WVPPA, 2007). This rate was used because these long haul traffic lanes have large volumes and deliversignificant cost savings per container, providing incentives for rail carriers to offer reliable intermodal services andfor shippers to use intermodal rather than trucks to lower transportation costs.
Table 7-7 shows all the traffic lanes and truck-to-intermodal conversion rates in these traffic lanes in the base case.The analysis result shows that the suggested intermodal yard in Eastern Iowa has an estimated 68,000 lifts111 peryear and an annualized transportation cost savings of over $15.5 million112, starting from the point the intermodalyard is fully operational and freight volume is ramped up to the expected throughput level. This metric assumes thelifting costs can cover the intermodal operator’s operating costs and required profit margin to sustain the business.No additional intermodal yard operating costs are included when estimating cost savings.
110 Outbound intermodal railcars would be built in Eastern Iowa, and interchanged in Chicago for eastbound and southbound trains or inOmaha for westbound trains. Conversely, inbound intermodal trains will be interchanged in Chicago or Omaha and arrive at the EasternIowa intermodal yard.
111 Empty container lifts are included.
112 This analysis assumes that steel-wheel interchange is used if intermodal trains need to interchange with another rail carrier. If steel-wheel interchange is not available, rubber tire interchange is required. The additional costs associated with rubber tire interchange, ifneeded, are not included in the net transportation cost savings estimate.

121Development of Iowa Statewide Freight Transportation Network Optimization Strategy
© 2016 Quetica, LLC
Table 7-7: Base Case Analysis for a New Intermodal Yard in Eastern Iowa113
Outbound Inbound Summary
Iowa IntermodalYard Location
Out-of-State IntermodalYard Location
Approx.Annual
ContainerNumber in
TMO
Approx.Annual
ContainerNumber in
TMOEstimated
Annual TMO
EstimatedAnnual
ContainerNumber in
theBusiness
CaseEstimatedAnnual EV
Eastern Iowa Seattle/Tacoma, WA 58,226 11,415 $54,000,000 9,053 $7,020,000
Eastern Iowa Long Beach, CA 37,430 21,841 $33,000,000 7,705 $4,290,000
Eastern Iowa San Antonio, TX 43,977 16,048 $26,000,000 7,803 $3,380,000
Eastern Iowa New Orleans, LA 34,834 16,196 $20,000,000 6,634 $2,600,000
Eastern Iowa Tampa, FL 13,009 600 $17,000,000 1,769 $2,210,000
Eastern Iowa Portland, OR 11,752 8,161 $17,000,000 2,589 $2,210,000
Eastern Iowa Miami, FL 13,543 2,766 $16,000,000 2,120 $2,080,000
Eastern Iowa Los Angeles, CA 16,712 4,003 $16,000,000 2,693 $2,080,000
Eastern Iowa El Paso, TX 16,813 4,646 $14,000,000 2,790 $1,820,000
Eastern Iowa Baltimore, MD 17,121 2,995 $14,000,000 2,615 $1,820,000
Gross Savings $29,510,000
Total Outbound Container Number 34,244
Total Inbound Container Number 11,527
Total Container Deficit 22,717
Total Number of Lifts 68,488
Empty Container Reposition Costs ($600 Each) ($14,000,000)
Net Savings $15,510,000
Source: Quetica, LLC
The conservative case excludes shipments originated or terminated in Clinton, Dubuque, Jackson and Scottcounties in the optimization analysis. It assumes these shipments will be diverted to the existing intermodal yard inRochelle, IL, based on geographic proximity.
113 Assuming a 13 percent truck-to-intermodal conversion rate in these high volume traffic lanes, the analysis estimates 68,000 annual liftsat the new intermodal yard, resulting in $15.5 million in annual net savings.
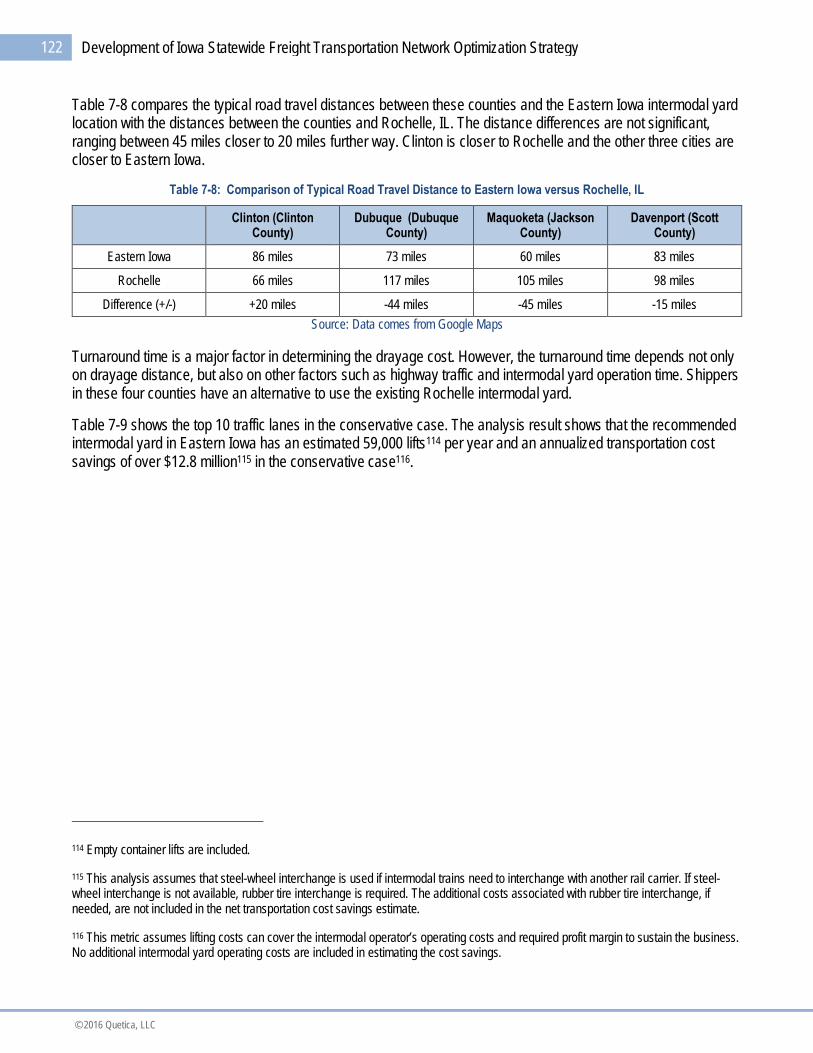
122 Development of Iowa Statewide Freight Transportation Network Optimization Strategy
© 2016 Quetica, LLC
Table 7-8 compares the typical road travel distances between these counties and the Eastern Iowa intermodal yardlocation with the distances between the counties and Rochelle, IL. The distance differences are not significant,ranging between 45 miles closer to 20 miles further way. Clinton is closer to Rochelle and the other three cities arecloser to Eastern Iowa.
Table 7-8: Comparison of Typical Road Travel Distance to Eastern Iowa versus Rochelle, IL
Clinton (ClintonCounty)
Dubuque (DubuqueCounty)
Maquoketa (JacksonCounty)
Davenport (ScottCounty)
Eastern Iowa 86 miles 73 miles 60 miles 83 miles
Rochelle 66 miles 117 miles 105 miles 98 miles
Difference (+/-) +20 miles -44 miles -45 miles -15 miles
Source: Data comes from Google Maps
Turnaround time is a major factor in determining the drayage cost. However, the turnaround time depends not onlyon drayage distance, but also on other factors such as highway traffic and intermodal yard operation time. Shippersin these four counties have an alternative to use the existing Rochelle intermodal yard.
Table 7-9 shows the top 10 traffic lanes in the conservative case. The analysis result shows that the recommendedintermodal yard in Eastern Iowa has an estimated 59,000 lifts114 per year and an annualized transportation costsavings of over $12.8 million115 in the conservative case116.
114 Empty container lifts are included.
115 This analysis assumes that steel-wheel interchange is used if intermodal trains need to interchange with another rail carrier. If steel-wheel interchange is not available, rubber tire interchange is required. The additional costs associated with rubber tire interchange, ifneeded, are not included in the net transportation cost savings estimate.
116 This metric assumes lifting costs can cover the intermodal operator’s operating costs and required profit margin to sustain the business.No additional intermodal yard operating costs are included in estimating the cost savings.
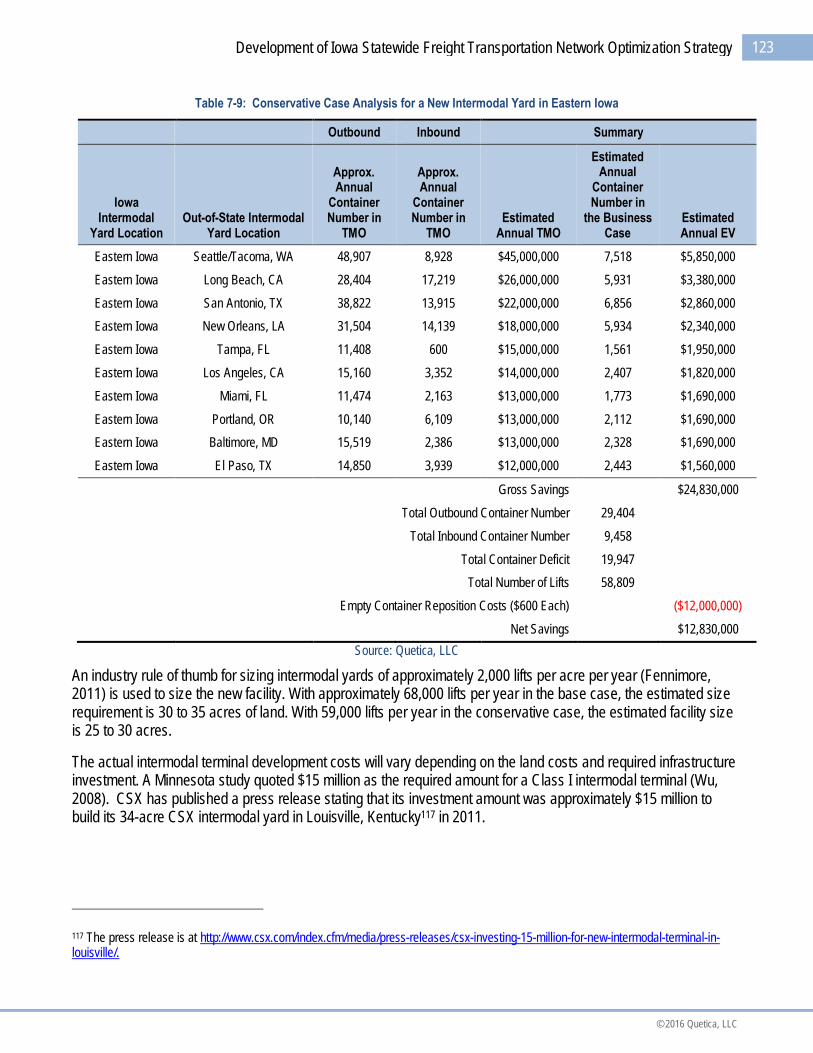
123Development of Iowa Statewide Freight Transportation Network Optimization Strategy
© 2016 Quetica, LLC
Table 7-9: Conservative Case Analysis for a New Intermodal Yard in Eastern Iowa
Outbound Inbound Summary
IowaIntermodal
Yard LocationOut-of-State Intermodal
Yard Location
Approx.Annual
ContainerNumber in
TMO
Approx.Annual
ContainerNumber in
TMOEstimated
Annual TMO
EstimatedAnnual
ContainerNumber in
the BusinessCase
EstimatedAnnual EV
Eastern Iowa Seattle/Tacoma, WA 48,907 8,928 $45,000,000 7,518 $5,850,000
Eastern Iowa Long Beach, CA 28,404 17,219 $26,000,000 5,931 $3,380,000
Eastern Iowa San Antonio, TX 38,822 13,915 $22,000,000 6,856 $2,860,000
Eastern Iowa New Orleans, LA 31,504 14,139 $18,000,000 5,934 $2,340,000
Eastern Iowa Tampa, FL 11,408 600 $15,000,000 1,561 $1,950,000
Eastern Iowa Los Angeles, CA 15,160 3,352 $14,000,000 2,407 $1,820,000
Eastern Iowa Miami, FL 11,474 2,163 $13,000,000 1,773 $1,690,000
Eastern Iowa Portland, OR 10,140 6,109 $13,000,000 2,112 $1,690,000
Eastern Iowa Baltimore, MD 15,519 2,386 $13,000,000 2,328 $1,690,000
Eastern Iowa El Paso, TX 14,850 3,939 $12,000,000 2,443 $1,560,000
Gross Savings $24,830,000
Total Outbound Container Number 29,404
Total Inbound Container Number 9,458
Total Container Deficit 19,947
Total Number of Lifts 58,809
Empty Container Reposition Costs ($600 Each) ($12,000,000)
Net Savings $12,830,000
Source: Quetica, LLC
An industry rule of thumb for sizing intermodal yards of approximately 2,000 lifts per acre per year (Fennimore,2011) is used to size the new facility. With approximately 68,000 lifts per year in the base case, the estimated sizerequirement is 30 to 35 acres of land. With 59,000 lifts per year in the conservative case, the estimated facility sizeis 25 to 30 acres.
The actual intermodal terminal development costs will vary depending on the land costs and required infrastructureinvestment. A Minnesota study quoted $15 million as the required amount for a Class I intermodal terminal (Wu,2008). CSX has published a press release stating that its investment amount was approximately $15 million tobuild its 34-acre CSX intermodal yard in Louisville, Kentucky117 in 2011.
117 The press release is at http://www.csx.com/index.cfm/media/press-releases/csx-investing-15-million-for-new-intermodal-terminal-in-louisville/.

124 Development of Iowa Statewide Freight Transportation Network Optimization Strategy
© 2016 Quetica, LLC
An investment of $15 million was used as the estimated total development costs to build the suggested intermodalfacility in Eastern Iowa. With this assumption, the financial case for a new intermodal facility in Eastern Iowa issummarized in Table 7-10. The annual EV and EFM analysis assumes the intermodal facility is fully operational andfreight volume is ramped up to the expected level. The EFM of 1 to 1.2 years suggests there is a strong financialcase to develop a new intermodal facility in Eastern Iowa, based on the analysis assumptions summarized below:
The scope includes all domestic shipments between Iowa and out-of-state locations, as well as thedomestic legs of import/export shipments in the iFROM.
The baseline shipments are not consolidated.
Less-than-container shipments are not used.
Commodities included in the analysis are documented in Section 7.21.
Freight traffic from areas within a 100 mile radius of the suggested facility is in- scope.
Freight originated or terminated in the 22 Iowa counties located within a 100 mile radius from Council Bluffsis excluded from the analysis (refer to Section 7.2.2 for details). Although within Iowa shipments can benefitfrom the new transloading facilities, they tend to be short haul shipments within 200 miles
The analysis is focused on transportation cost optimization. Transit time and service level optimization isout of scope.
A 13 percent truck-to-intermodal conversion rate is used.
The cost to reposition an empty container is $600.
Table 7-10: Summary of the Financial Case for a New Intermodal Yard in Eastern Iowa118
ScenarioAnnual Lift
NumberFacility Size Initial Investment Annual EV EFM
Conservative Case 59,000 25 to 30 acres Less than $15 million $12.8 million 1.2 years
Base Case 68,000 30 to 35 acres $15 million $15.5 million 1 year
Source: Quetica, LLC
7.2.3.1. Comparable Intermodal Facilities
Several existing intermodal yards have comparable size to the suggested intermodal facility in Eastern Iowa. Theonly existing intermodal facility in Iowa is the Council Bluffs intermodal facility owned and operated by the IowaInterstate Railroad (IAIS), including switch service with Union Pacific.119 The facility is capable of handling bothCOFC and TOFC. In 2012, the facility did approximately 62,000 lifts with a capacity of 65,000. The facility is locatedin the I-80 corridor and can be accessed via I-29 and I-80. Figure 7-18 shows the Council Bluffs intermodal facilitylocation.
118 The annual cost savings and payback period analysis assumes the intermodal facility is fully operational and freight volume is rampedup to the expected level.
119 https://iaisrr.com/ship-with-iais/intermodal/

125Development of Iowa Statewide Freight Transportation Network Optimization Strategy
© 2016 Quetica, LLC
Figure 7-18: Aerial View of the IAIS Intermodal Facility in Council Bluffs, IA
Source: Mid-America Freight Coalition: http://midamericafreight.org/rfs/network-inventory/rail/intermodal-facilities/up-council-bluffs-ia/
In 2011, CSX invested $15 million to build an intermodal facility on 34-acres of land in Louisville, KY.120 It is one offour intermodal terminals in Kentucky and the only CSX intermodal terminal in Louisville. The facility is located inthe I-65 corridor. Figure 7-19 shows the CSX intermodal facility location.
Figure 7-19: Aerial View of the CSX Intermodal Facility in Louisville, KY
Source: Mid-America Freight Coalition: http://midamericafreight.org/rfs/network-inventory/rail/intermodal-facilities/csx-louisville-ky/
120 http://www.truckinginfo.com/news/story/2011/08/csx-to-build-new-15-million-intermodal-terminal-in-louisville.aspx

126 Development of Iowa Statewide Freight Transportation Network Optimization Strategy
© 2016 Quetica, LLC
Norfolk Southern’s (NS) Appliance Park Louisville Intermodal Terminal (APK) is one of four intermodal terminals inKentucky.121 It is 2.5 miles away from the other NS Louisville intermodal terminal and 9 miles away from the CSXLouisville intermodal terminal. It is a 30-acre facility with the capacity of approximately 55,000 lifts per year. In 2012,the intermodal facility handled approximately 40,000 lifts. The facility can be accessed by I-264 and I-65, but isoutside of the I-65 corridor (3.5 miles away). Figure 7-20 shows the NS Appliance Park intermodal facility location.
Figure 7-20: Aerial View of NS Appliance Park Intermodal Facility in Louisville, KY
Source: Mid-America Freight Coalition:http://midamericafreight.org/rfs/network-inventory/rail/intermodal-facilities/ns-louisville-ky-appliance-park/
7.2.3.2. Size of Intermodal Facility
Volume and size do matter in the decision-making process to build a new intermodal facility, however, intermodalfacilities do not have to be built on a grand scale. There are a number of small facilities in the U.S., listed in Table 7-11.
Table 7-11: Some Small Existing Intermodal Facilities
Facility City, State Size (Acres)
CSX Intermodal Terminal Mobile, AL 10
Port of Pasco Intermodal Terminal Pasco, WA 15
Port of Quincy Intermodal Terminal Quincy, WA 16
Charlotte Inland Terminal Charlotte, NC 16
CSX Intermodal Terminal Charlotte, NC 21
Stark County Neomodal Terminal Stark County, OH 28
CSX Intermodal Terminals Memphis, TN 30
Somerset Rail Park Ferguson, KY 34
Source: (Sulbaran, 2013a)
121 http://midamericafreight.org/rfs/network-inventory/rail/intermodal-facilities/ns-louisville-ky-appliance-park/
127Development of Iowa Statewide Freight Transportation Network Optimization Strategy
© 2016 Quetica, LLC
To keep an existing intermodal facility viable, the minimum number of lifts per year is 13,000 to 20,000 lifts basedon a 2006 Minnesota Department of Agriculture study (Wu, 2008) and 15,000 to 18,000 lifts based on a 2006 reportfrom Canadian Pacific (Wu, 2008).
The volumes required for a Class I railroad to build a new intermodal yard is higher than the volume requirement tomaintain an existing one. At a meeting of the Transportation Research Board (TRB), BNSF cited 91,250 containersas a target volume for a new intermodal facility, which is equivalent to 1 train per day each day of the year with 250containers per train (Wu, 2008). A WVPPA study considers 45,000 annual lifts as the necessary volume forprofitable operation of an intermodal yard (WVPPA, 2007). With an estimated volume of 32,000 to 56,000 lifts peryear, the suggested intermodal yard may be too small to attract a Class I railroad.
There are several solutions to build a new, lower volume intermodal yard. One solution is to involve a Class II or IIIrailroad in the building of a new intermodal facility. Regional railroads may be more flexible in their requirements forestablishing and serving a new facility. A Class II or Class III rail intermodal yard has lesser throughputrequirements and lower demands on land, infrastructure and equipment, therefore, does not need the same level ofinvestment as a Class I rail yard. A Class II or Class III railroad can load containers to railcars and block thecontainer railcars in Eastern Iowa, deliver container railcars to the connecting Class I railroads in one of theregional/national intermodal facilities in Chicago, Kansas City, or Omaha, effectively leveraging the existingintermodal networks of multiple Class I’s to provide lower cost solutions to Iowa shippers. Although this approachwould require longer transit time than using truck or using the alternative intermodal facilities in the Chicago area, ifthe service levels are consistent and the cost savings are significant, shippers would be interested in using theservices for less time-sensitive shipments. Since the financial case of establishing a new intermodal facility is strong(as shown in Table 7-7), it is conceivable that a Class II or Class III railroad in Iowa would be interested in thedevelopment of a new intermodal terminal.
In addition to an intermodal facility owned and operated by a railroad, landlord and developer intermodal facilitiesare two other viable business models. In the landlord model, infrastructure for intermodal is set up or built by thepublic entity and leased out to operators on a landlord-tenant basis (Sulbaran, 2013b)122. The main revenuestreams are land rents and dues on the facilities. In general, landlord intermodal facilities do not aim for profitmaximization, but have other objectives, such as economic development, traffic decongestion, pollution reductionand the creation of a more efficient supply chain for industries in the area. Landlord intermodal facilities are self-sustaining, however, implying the facilities need to generate sufficient return on investment to finance newinvestments. Therefore, apart from leasing out the facilities, they also engage in active investments in supply chainefficiency that support the competitiveness of the intermodal facilities.
The Virginia Inland Port (VIP) is a typical example of a landlord model. It is an Inland Port anchored by anintermodal ramp located west of Washington, DC, in Warren County and owned by the Virginia Port Authority. Thesite encompasses 161 acres and has 17,820 feet of on-site rail serviced by Norfolk Southern. It is within 1 mile of I-66 and within 5 miles of I-81. VIP is also a Customs-designated port of entry offering a full range of Customsfunctions to customers. Household names, like Wal-Mart, Target, Home Depot, Dollar Tree and Family Dollar, havedistribution facilities in Virginia in large measure due to the presence of a port facility and structure.123
122 Materials about landlord intermodal and developer intermodal model are cited from (Sulbaran, 2013b).
123 http://www.apa.virginia.gov/reports/vpacafrfy09.pdf

128 Development of Iowa Statewide Freight Transportation Network Optimization Strategy
© 2016 Quetica, LLC
In a developer model, a real estate developer owns the intermodal facility. There are several large companies (e.g.,CenterPoint Properties) that specialize in this type of business venture. The Somerset (KY) Rail Park is an exampleof the developer model implemented on a smaller scale. Somerset Rail Park is a 34-acre, state-of-the-art facility inPulaski County, KY, integrating several modes of transportation designed to handle various bulk products fromtruck-to-rail and rail-to-truck, in addition to warehousing capabilities. This Norfolk Southern Thoroughbred BulkTerminal (TBT) is known as a top-quality, rail-to-truck and truck-to-rail transfer facility (Sulbaran, 2013b).
Based on the size and volume estimates and case studies, the regional railroad operator model, landlord model anddeveloper models are all viable options to build a new intermodal yard in Eastern Iowa.
7.2.3.3. Recommended Next Steps
There is a strong financial case to develop a new intermodal yard in Eastern Iowa. The high level estimated volumefor the facility may not be compelling enough for a full-service Class I intermodal terminal. However, the estimatedvolume and cost savings benefits might be large enough to generate interest from Class II and III railroads,developers and local government agencies. The project team recommends that Iowa DOT and IEDA pursue thismarket opportunity and take the following next steps:
1. Reach out to Iowa shippers, railroads (Class I, II and III), developers and local government agencies tofurther develop the market opportunities and business case.
2. Conduct business development to explore strategic partnerships with interested shippers, railroads,developers and local government agencies.
3. Collaborate with interested public and/or private organizations to complete a feasibility study to identifyanchor shippers and anchor traffic lanes, select the site, detail facility design concepts and develop detailedfinancial plans for all parties involved, leveraging the collected statewide data in the iFROM.
4. Investigate approaches to addressing empty container availability in Iowa.
During the revision process of this final report, Iowa DOT, IEDA, and their private partners have used theoptimization recommendations and the supporting data to develop an application for the Fostering Advancements inShipping and Transportation for the Long-term Achievement of National Efficient (FASTLANE) federal grantprogram. The grant application proposes a logistics park in Eastern Iowa to provide cross-docking, intermodal,transloading, and other logistics services. The logistics park will provide Iowa and the surrounding states withaccess to a high capacity, efficient, and cost-competitive facility to move goods from truck to rail and rail to truck. InJuly 2016, Iowa DOT and its private partners were awarded a $25.6 million FASTLANE grant to develop theproposed logistics park (USDOT, 2016).
129Development of Iowa Statewide Freight Transportation Network Optimization Strategy
© 2016 Quetica, LLC
7.3. Explore the Opportunity of Additional Transload Facilities to Provide Iowa Businesses with MoreAccess to Lower Cost Rail Freight Services
This section discusses the optimization strategy leveraging truck-to-rail and rail-to-truck transloading to address thefindings in Section 6.3.3. The optimization strategy is developed using results from both the baseline optimizationand a greenfield optimization discussed in Section 2.3
7.3.1. Transloading OverviewTransloading is the process of transferring freight between two modes of transportation. It allows the shipper to takeadvantage of the cost, speed and access capabilities of more than one mode of transportation (Iowa DOT, 2014b).Transloading operations include truck-to-rail, truck-to-barge, rail-to-barge, and truck/rail/barge-to-ocean vessel.Transportation using transloading leverages the access capabilities of trucking for the short haul pickup/deliveryand lower cost modes, such as rail and barge, for the long haul shipment to provide cost efficient transportationoptions for shippers.
The baseline optimization results discussed in Sections 6.2 and 6.3.3 suggest that there are significantopportunities to leverage Iowa’s railroad network to lower transportation costs for Iowa businesses. Transloading isneeded to effectively leverage rail freight, since shippers may not have direct rail access at their facilities, such asplants and warehouses, and need to use trucking to haul freight between their facilities and railroad access points.
Transloading works for many commodities, including finished and unfinished goods, fresh food and beverageproducts, lumber, paper, metals, building materials and a variety of packaged bulk commodities, as well as specialshipments that cannot travel their entire route by road. The optimization strategy in this section is focused on truck-to-rail and rail-to-truck transloading for dry commodities since this scenario provides the largest potential costsavings opportunities identified in the baseline optimization. Figure 7-21 describes the end-to-end transportationprocess to transport freight from origin to destination, leveraging the truck-to-rail and rail-to-truck transloadingprocess for companies to leverage the rail freight network without building direct access to rail at their own or theircustomers’ facilities (Iowa DOT, 2014b).
Transloading improves companies’ supply chain networks by providing flexible and lower cost freight optionswithout the significant capital expenditure to build direct rail access at each origin and/or destination site. Theremaining section discusses the locations for potential transload facilities and the TMO, EV and EFM of buildingnew transloading sites to benefit Iowa companies.

130 Development of Iowa Statewide Freight Transportation Network Optimization Strategy
© 2016 Quetica, LLC
Figure 7-21: Truck-to-Rail and Rail-to-Truck Transloading Process
Source: Iowa DOT (Iowa DOT, 2014b)

131Development of Iowa Statewide Freight Transportation Network Optimization Strategy
© 2016 Quetica, LLC
7.3.2. Sizing the OpportunityThe optimization analysis identifies potential locations for transloading facilities in Iowa that will deliver the largesttotal market cost savings opportunities to Iowa companies, leveraging the iFROM’s freight demand modeldiscussed in Chapter 3, network model discussed in Chapter 4 and supply chain cost benchmarks discussed inChapter 5. TMO is used to size the market opportunity. TMO is defined as the transportation cost savings as aresult of leveraging the new transloading facilities to maximize railroad transportation use and reduce costs forshippers. A business case is also developed to demonstrate the EV and EFM of a new transloading facility
The optimization strategy analysis is based on the following scope and assumptions:
All domestic shipments between Iowa and out-of-state locations, as well as the domestic legs ofimport/export shipments in the iFROM are included in the scope. As described in Section 3, allimport/export shipments include two legs of the shipments: the domestic leg is the shipment between anIowa location and a U.S. port site; and the international leg is the shipment between a U.S. port and aforeign port or foreign origin/destination site. In this analysis, the international legs of import/exportshipments are not included in the scope.
In domestic shipments, only inbound shipments to and outbound shipments from Iowa are included in theanalysis. Shipments within Iowa are not in scope. Although within Iowa shipments can benefit from the newtransloading facilities, they tend to be short haul shipments within 200 miles. As discussed in Section 5.3,rail is typically focused on long-haul shipments. Additional recommendations on leveraging rail for withinIowa shipments are discussed in Section 7.9.
It is assumed that baseline shipments are not consolidated. In the transloading process, freight is hauledfrom its origin to a nearby rail terminal by truck, transloaded to railcars, shipped via rail to the destinationterminal and transloaded to trucks for delivery to its final destination. Since a railcar can haul more freightthan a single truck, shipments originated and terminated in the same rail terminals can potentially beconsolidated to fewer railcars and de-consolidated to trucks at destination rail terminals to further lowertransportation costs. However, this consolidation strategy requires additional supply chain managementcapabilities. The optimization strategy in this section does not include cost savings from this type ofconsolidation process.
Commodities included in the analysis are only dry commodities. Analysis of the baseline model identifiesdry commodity transportation as the largest transloading opportunity. Refrigerated and liquid commoditiesare excluded in the analysis, because these commodities require additional warehousing and handlingequipment. Table 7-12 lists the commodities that are in scope. The SCTG Code and Commodity columnscome from standard classification of transported goods (USDOT, 2007). The selection criteria columndescribes how the commodities are grouped for the transloading facility analysis.
An Iowa transload facility may draw freight traffic from nearby states. The actual freight volume drawn fromother states depends on the location of the transload facility and the freight demand from those states.These cost savings opportunities are not included in the quantitative analysis. It should be noted thatincluding freight traffic in nearby states outside the scope of the study may identify different candidateregions for transload facilities than the analysis results without freight traffic in nearby states.

132 Development of Iowa Statewide Freight Transportation Network Optimization Strategy
© 2016 Quetica, LLC
Table 7-12: Commodities Included In Optimization Strategy Analysis Using Transloading
SCTG Code Commodity Selection Criteria
02 Cereal grains These commodities are individuallyselected. Only the dry portions of thecommodities are selected for thetransloading facility analysis.
03 Other ag prods.
04 Animal feed
06 Milled grain prods.
07 Other foodstuffs
24 Plastics/rubber
26 Wood prods.
31 Nonmetal min. prods.
34 Machinery
35 Electronics
38 Precision instruments
01 Live animals/fish The dry portions of these commodities areaggregated to a new commodity groupnamed “Mixed Freight – dry commodities”for the transloading facility analysis.
05 Meat/seafood
09 Tobacco prods.
13 Nonmetallic minerals
21 Pharmaceuticals
25 Logs
27 Newsprint/paper
28 Paper articles
29 Printed prods.
30 Textiles/leather
33 Articles-base metal
39 Furniture
40 Misc. mfg. prods.
41 Waste/scrap
43 Mixed freight
99 Unknown
08 Alcoholic beverages The dry portions of these commodities areaggregated to a new commodity groupnamed “Mixed Energy & Chemical Prods.– dry commodities” for the transloadingfacility analysis.
16 Crude petroleum
17 Gasoline
18 Fuel oils
19 Coal-n.e.c.
22 Fertilizers
23 Chemical prods.

133Development of Iowa Statewide Freight Transportation Network Optimization Strategy
© 2016 Quetica, LLC
SCTG Code Commodity Selection Criteria
10 Building stone The dry portions of these commodities areaggregated to a new commodity groupnamed “Mixed Heavy Freight – drycommodities” for the transloading facilityanalysis.
11 Natural sands
12 Gravel
14 Metallic ores
15 Coal
32 Base metals
37 Transport equip.
Source: FAF3 and Quetica, LLC
Transportation costs in the iFROM baseline model are used to estimate the costs companies currently pay totransport the in-scope commodities. The optimized transportation costs are costs that companies would pay iftransloading operations were established and leveraged to transport the same shipments included in the baseline.The optimized transportation costs are defined below:
COSTOptimized = COSTTrucking + COSTRail + COSTTransloading
Where:
COSTOptimized = the optimized transportation costs leveraging recommended transloadingoperations.
COSTTrucking = trucking costs between origin/destination and a railroad transloading site.
COSTRail = the rail freight costs between origin and destination railroad transloading sites.
COSTTransloading = the total transloading costs.
Two transloads are assumed for each shipment, although in reality some shipments may require only onetransload, if the destination sites have direct access to rail. With the two transloads per shipment assumption, thetotal cost savings are estimated at a more conservative level.
The optimization process identifies three locations in the state to establish transloading operations to optimizeIowa’s transportation network: Central Iowa, Western Iowa and Eastern Iowa124. The optimization analysis hasestimated the amount of the TMO in each of these three regions, as shown in Figure 7-22. The estimated TMO ofthe transloading operations will be used to size the facilities and estimate the initial capital investment to build thefacilities. With slightly more than $32 million in annualized cost savings, a transloading facility in Eastern Iowa isestimated to provide the largest cost savings among the three regions. This analysis assumes that a transloadfacility will be co-located with cross dock and intermodal facilities in a logistics park (see Section 7.5 for details).Since cross dock and intermodal operations will be competing for the same freight movements with transload, theestimated transload cost savings opportunity is smaller than the case if a transload facility is individually sizedwithout cross dock and intermodal facilities in the same region.
124 Subsequent analysis, outside the scope of the optimization study, will identify exact site locations within the regions and will bedependent on a number of qualitative factors, such as physical constraints, access to road and rail networks, community support, etc.

134 Development of Iowa Statewide Freight Transportation Network Optimization Strategy
© 2016 Quetica, LLC
Figure 7-22: Estimated Total Market Opportunities in Annual Cost Savings in Three Iowa Transloading Locations
Source: Quetica, LLC
Figure 7-23 shows the annual tonnage of commodity groups targeted in this analysis that could be transported viathe transloading facilities in the recommended regions. Again, the estimated freight volume in Eastern Iowa is thehighest among the three regions.
Figure 7-23: Estimated Total Market Sizes in Annual Tonnage in Three Iowa Transloading Locations
Source: Quetica, LLC
$0
$5,000,000
$10,000,000
$15,000,000
$20,000,000
$25,000,000
$30,000,000
$35,000,000
Eastern Iowa Central Iowa Western Iowa
An
nu
alT
ran
spo
rtat
ion
Co
stSa
vin
gs
Suggested Region
0
200,000
400,000
600,000
800,000
1,000,000
1,200,000
1,400,000
Eastern Iowa Central Iowa Western Iowa
An
nu
alT
ran
slo
ad
ed
To
nn
age
Suggested Region

135Development of Iowa Statewide Freight Transportation Network Optimization Strategy
© 2016 Quetica, LLC
Each transloading location will impact transportation costs for commodities in the area. Figure 7-24 shows howmuch shippers of each commodity group will benefit from a transloading facility in Eastern Iowa, measured byannual cost savings. Cereal grains, machinery, mixed high density freight, mixed freight – dry commodities, andmixed energy and chemical products are the commodity groups analyzed. Dry commodities are estimated to benefitthe most from a potential transloading facility and represent approximately 85 percent of the total annual costsavings opportunities
Figure 7-24: Cost Savings Opportunities by Commodity Group in Eastern Iowa Transloading Facility
Source: Quetica, LLC
$0
$1,000,000
$2,000,000
$3,000,000
$4,000,000
$5,000,000
$6,000,000
$7,000,000
$8,000,000
$9,000,000
Esti
ma
ted
An
nu
alC
ost
Savi
ngs
Commodity Group

136 Development of Iowa Statewide Freight Transportation Network Optimization Strategy
© 2016 Quetica, LLC
Figure 7-25 and 7-26 show the annual cost savings opportunities by commodity from transloading operations inCentral and Western Iowa, respectively.
Figure 7-25: Cost Savings Opportunities by Commodity Group in Central Iowa Transloading Facility
Source: Quetica, LLC
$0
$1,000,000
$2,000,000
$3,000,000
$4,000,000
$5,000,000
$6,000,000
$7,000,000
$8,000,000
$9,000,000
Esti
ma
ted
An
nu
alC
ost
Savi
ngs
Commodity Group
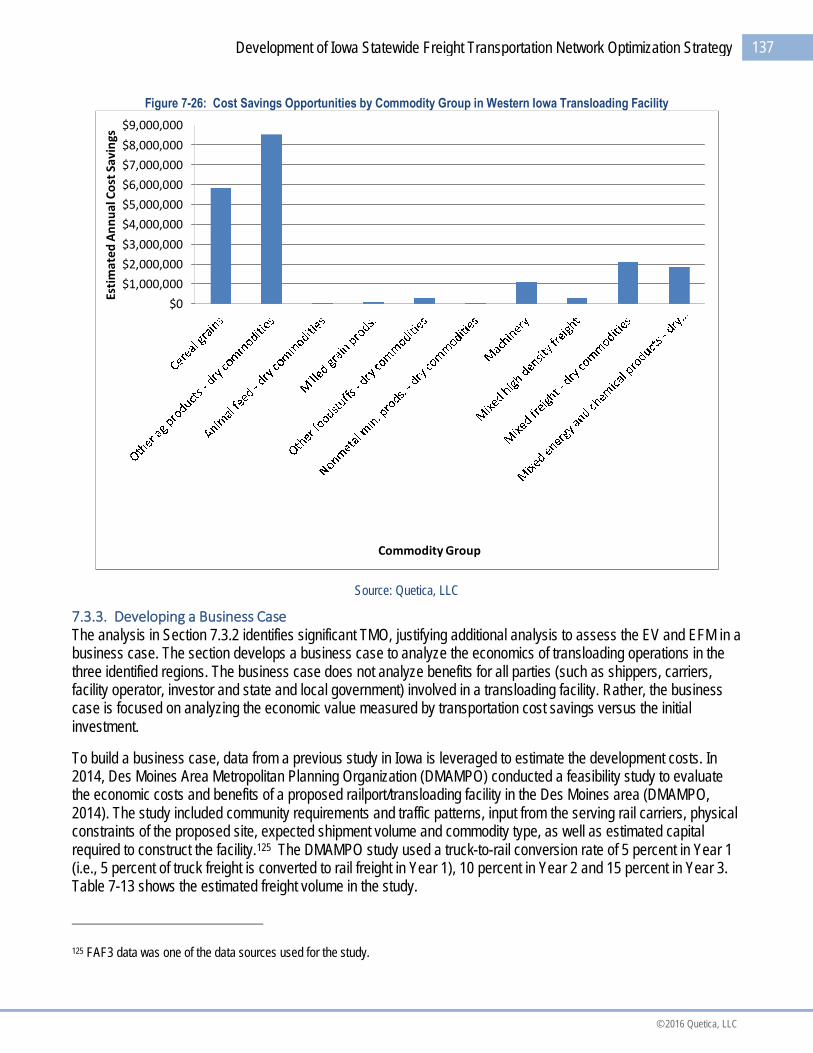
137Development of Iowa Statewide Freight Transportation Network Optimization Strategy
© 2016 Quetica, LLC
Figure 7-26: Cost Savings Opportunities by Commodity Group in Western Iowa Transloading Facility
Source: Quetica, LLC
7.3.3. Developing a Business CaseThe analysis in Section 7.3.2 identifies significant TMO, justifying additional analysis to assess the EV and EFM in abusiness case. The section develops a business case to analyze the economics of transloading operations in thethree identified regions. The business case does not analyze benefits for all parties (such as shippers, carriers,facility operator, investor and state and local government) involved in a transloading facility. Rather, the businesscase is focused on analyzing the economic value measured by transportation cost savings versus the initialinvestment.
To build a business case, data from a previous study in Iowa is leveraged to estimate the development costs. In2014, Des Moines Area Metropolitan Planning Organization (DMAMPO) conducted a feasibility study to evaluatethe economic costs and benefits of a proposed railport/transloading facility in the Des Moines area (DMAMPO,2014). The study included community requirements and traffic patterns, input from the serving rail carriers, physicalconstraints of the proposed site, expected shipment volume and commodity type, as well as estimated capitalrequired to construct the facility.125 The DMAMPO study used a truck-to-rail conversion rate of 5 percent in Year 1(i.e., 5 percent of truck freight is converted to rail freight in Year 1), 10 percent in Year 2 and 15 percent in Year 3.Table 7-13 shows the estimated freight volume in the study.
125 FAF3 data was one of the data sources used for the study.
$0
$1,000,000
$2,000,000
$3,000,000
$4,000,000
$5,000,000
$6,000,000
$7,000,000
$8,000,000
$9,000,000Es
tim
ate
dA
nn
ua
lCo
stSa
vin
gs
Commodity Group

138 Development of Iowa Statewide Freight Transportation Network Optimization Strategy
© 2016 Quetica, LLC
Table 7-13: Estimated Annual Rail Carloads in DMAMPO Study
Year ofOperation
Annual Inbound Annual Outbound Total
1 686 131 817
2 1,372 262 1,634
3 2,058 393 2,451
Total 4,116 786 4,902
Source: Des Moines Area Metropolitan Planning Organization (DMAMPO) railport/transloading facility feasibility study (DMAMPO, 2014)
The DMAMPO study also developed a rough order of magnitude (ROM) cost estimate to construct the proposedrailport/transloading facility. The estimated construction costs are consistent with estimated numbers from otherproprietary sources in Iowa. Table 7-14 shows the estimated costs in the DMAMPO study.
Table 7-14: Rough Order of Magnitude Initial Investment Estimates
Track Feet/Acres Estimate (in MM$)
Lead Track 4,500 $1.35
Transload Track 6,700 $2.01
Contingency 25% $0.84
Subtotal 11,200 $4.20
Land 30 $1.31
Total $5.50
Source: Des Moines area Metropolitan Planning Organization (DMAMPO) railport/transloading facility feasibility study (DMAMPO, 2014)
The size of the proposed transloading facility in the DMAMPO study would work well in the three regions identifiedin this optimization analysis. Table 7-15 compares the estimated market size in the DMAMPO study with theestimated sizes in all three regions identified in Year 1 (5 percent of total market size), Year 2 (10 percent of thetotal market size) and Year 3 (15 percent of the total market size). It is interesting to note that the total market sizein annual rail carloads estimated in the DMAMPO study is very similar to the estimated market size of Central Iowain the optimization analysis, although the methodologies used are different. The ROM investment estimate in theDMAMPO study is used to benchmark the opportunities identified in the three regions in the business caseanalysis.

139Development of Iowa Statewide Freight Transportation Network Optimization Strategy
© 2016 Quetica, LLC
Table 7-15: Comparing the Estimated Annual Rail Carloads between DMAMPO Study and Optimization Study
Annual Rail Carloads –Conversion of 5
percent Truck Freightto Rail Freight
Annual Rail Carloads –Conversion of 10
percent Truck Freightto Rail Freight
Annual Rail Carloads –Conversion of 15
percent Truck Freightto Rail Freight
DMAMPO Study 817 1,634 2,451
Eastern Iowa 919 1,837 2,756
Central Iowa 779 1,558 2,337
Western Iowa 600 1,201 1,801
Source: Des Moines Area Metropolitan Planning Organization (DMAMPO) railport/transloading facility feasibility study (DMAMPO, 2014)and Quetica, LLC
In a business case analysis, it is assumed that transloading costs can cover the transload facility operator’soperating costs and required profit margin to sustain the business. No additional transload facility operating costsare included in estimating the cost savings. Payback period is calculated from the point the facilities are fullyoperational and the freight volume is ramped up to the expected level.
Table 7-16 summarizes the assumptions in both scenarios for transloading facilities in all three regions.
Table 7-16: Base Case vs. Conservative Case Assumptions
Base Case Assumptions Conservative Case Assumptions
Assumes the same size facility as proposed inthe DMAMPO study.
Assumes the same size facility as proposed inthe DMAMPO study.
Assumes the same construction and land costsas proposed in the DMAMPO study.
Assumes the same construction and land costsas proposed one in DMAMPO study.
Assumes 10 percent of the identified truckfreight in the opportunity analysis126 will beconverted to rail freight. This assumption is inline with the Year 2 projection in the DMAMPOstudy.
Targets the long haul truck shipments over 750miles. Assumes 10 percent of the long haultruck shipments identified in the opportunityanalysis112 are captured and converted to railfreight.
Source: Quetica, LLC
126 The truck freight is identified in the opportunity analysis if the truck costs are greater than the sum of rail costs and transload costs.Please refer to Section 7.3.2 for details.

140 Development of Iowa Statewide Freight Transportation Network Optimization Strategy
© 2016 Quetica, LLC
The base case financial analysis suggests that building transloading facilities in all three locations would beattractive investment opportunities. The payback period for building a transloading facility is approximately 1.7 yearsin Eastern Iowa, 2.1 years in Central Iowa, and 2.7 years in Western Iowa, as shown in Table 7-17. Since theremight be additional infrastructure investments needed to enhance the highway network and/or provide additionalroad access to the suggested transloading facilities, once the specific sites are selected, the total investment maybe higher than the estimates in the table. Nonetheless, the opportunities are still economically viable, unless theadditional investments in infrastructure enhancement are significantly higher than the transloading facilityconstruction costs.
Table 7-17: Base Case Financial for New Transloading Facilities127
Region % of TMO
EstimatedAnnualRailcar Estimated Annual EV
TotalInvestment
EstimatedEFM
Eastern Iowa 10.00% 1,837 $3,200,000 $5.5 Million 1.7 Years
Central Iowa 10.00% 1,558 $2,600,000 $5.5 Million 2.1 Years
Western Iowa 10.00% 1,201 $2,000,000 $5.5 Million 2.7 Years
Source: Quetica, LLC
Table 7-18 shows the financial analysis in the conservative case. In this case, the targeted market segmentsinclude only the long haul shipments, thus the percentage of market share is lower than that in the base case. Costsavings in each long haul shipment are higher than the average shipments included in the base case. Although theestimated annual railcar numbers are around half of those in the base case in all three regions, the annualtransportation cost savings are much more than half of the base case and the payback periods are just slightlylonger than those in the base case. With the payback periods ranging between 2.2 and 3.1 years, the conservativecase is still economically viable – assuming any additional infrastructure investments, if needed, are notsubstantially higher than the estimated construction costs.
Table 7-18: Conservative Case Financial Analysis for the New Transloading Facilities
Region % of TMO
EstimatedAnnualRailcar Estimated Annual EV
TotalInvestment
EstimatedEFM
Eastern Iowa 7.78% 1,002 $2,500,000 $5.5 Million 2.2 Years
Central Iowa 7.63% 743 $2,000,000 $5.5 Million 2.7 Years
Western Iowa 8.92% 694 $1,800,000 $5.5 Million 3.1 Years
Source: Quetica, LLC
In summary, the financial analysis suggests the following EFM, starting from the point that the facilities are fullyoperational and the freight volume is ramped up to the expected level:
A transloading facility in Eastern Iowa: 1.7 to 2.2 years A transloading facility in Central Iowa: 2.1 to 2.7 years A transloading facility in Western Iowa: 2.7 to 3.1 years
127 The annual transportation cost savings and payback period analysis assumes the transloading facilities are fully operational and freightvolume is ramped up to the expected level.

141Development of Iowa Statewide Freight Transportation Network Optimization Strategy
© 2016 Quetica, LLC
7.3.2.1. Comparable Transloading Facilities
Transloading facilities of similar size exist in the industry. For example, Trans Load Limited, Inc.128 operates atransloading facility located within two miles of the major highways and interstates in Birmingham, AL. The facility ison approximately 30 acres, has 130,000 square feet of enclosed warehouse space and two rail spurs, providing 8boxcar spots and 12 combined centerbeam and flatcar spots. It is served and switched by three Class I railroads:BNSF, Norfolk Southern and CSX. Figure 7-27 shows an aerial view of the transloading facility.
Figure 7-27: An Aerial View of the Trans Load Limited, Inc.’s Transloading Facility in Birmingham, AL
Source: Google Maps
Another example is shown in Figure 7-28. It is operated by Patriot Rail,129 located Near I-20 in Gibsland, LA, about100 miles east of Shreveport. On approximately 40 acres, it is expected to handle over 5,000 carloads per year.The facility is along the 68-mile Louisiana and North West Railroad that connects with Kansas City Southern andUnion Pacific. Patriot Rail invested $3.3 million in developing the facility in 2011.
128 http://www.transloadlimited.com/AboutUs.aspx
129 http://www.patriotrail.com/

142 Development of Iowa Statewide Freight Transportation Network Optimization Strategy
© 2016 Quetica, LLC
Figure 7-28: An Aerial View of the Patriot Rail’s Transloading Facility in Gibsland, LA
Source: Google Maps
7.3.2.2. Recommended Next Steps
The business case analysis shows that a 30-acre transloading facility in Eastern Iowa, Central Iowa or WesternIowa is economically viable. There is enough freight volume to justify the transload, cross dock and intermodalfacilities at the same location. It is recommended that a market analysis and feasibility study, similar to theDMAMPO study, be the next step to identify the exact site locations and conduct the design and budget planningprocess to assess the costs and benefits of transloading in each region.
During the revision process of this final report, Iowa DOT, IEDA, and their private partners have used theoptimization recommendations and the supporting data to develop an application for the Fostering Advancements inShipping and Transportation for the Long-term Achievement of National Efficient (FASTLANE) Grant. The grantapplication proposes a logistics park in Eastern Iowa to provide cross-docking, intermodal, transloading, and otherlogistics services. The project will provide Iowa and the surrounding states with access to a high capacity, efficient,and cost-competitive facility to move goods from truck to rail and rail to truck. In July 2016, Iowa DOT and its privatepartners were awarded a $25.6 million FASTLANE grant to develop the recommended logistics park (USDOT,2016).

143Development of Iowa Statewide Freight Transportation Network Optimization Strategy
© 2016 Quetica, LLC
7.4. Explore Opportunities to Leverage a Barge and Rail Multimodal Solution to Provide a Cost-EffectiveFreight Transportation Alternative
Barge freight has the lowest cost structure measured by cost per ton-mile (see Table 6-2) among all modes oftransportation. Effectively leveraging barge freight can produce significant cost savings opportunities for Iowacompanies. Iowa is the only state in the nation bordered by two navigable rivers: Mississippi River and MissouriRiver. Its topography provides Iowa businesses with access to the country’s inland waterway freight network.However, there are also several constraints for Iowa businesses to fully utilize the inland waterway system toreduce transportation costs, including:
Limited access to barge terminals to load/unload commodities. Feedback from some Iowa firms in theFAC survey indicates that access to barge terminals is an impediment for them to use barge transportation.
Delay and capacity constraints in the aging lock and dam system on the Upper Mississippi River. Delaysoften happen during peak shipping season, especially at the 600-foot locks.
Winter closure. The shipping season on the Upper Mississippi River is only 8 to 9 months long. Bargetransportation is not available during the winter months.
The remainder of this section discusses recommendations to address these constraints and maximize the use ofthe barge transportation system.
7.4.1. Access to Barge TerminalsThere are 60 barge terminals located in 10 Iowa counties (Iowa DOT Barge, 2011). In general, these terminalsprovide sufficient loading and unloading capacity to use barge transportation. Some Iowa businesses may still havechallenges accessing barge terminals, however, because not all of these terminals provide services to the generalpublic.130
Rather than building additional terminals, it is recommended that Iowa DOT and IEDA explore the opportunities withprivate barge terminal owners to provide for-hire terminal services to Iowa businesses at existing terminals. Inaddition, when an updated barge terminal directory is published (Iowa DOT Barge, 2011), it is recommended thatfor-hire terminal service information be included to help communicate the service offerings to local communities.
7.4.2. Constraints in Lock and Dam System and Shipping SeasonA number of the locks and dams on the Upper Mississippi River only have 600-foot lock chambers which constraincapacity and cause delays by requiring large barge tows to be broken up in order to pass through (see discussion inSection 4.3.1). For example, the average delay at Lock and Dam 18 (the southernmost 600-foot lock in Iowa) was1.91 hours in 2014, compared to the average 0.80 hour delay at Lock and Dam 19 (the southernmost 1,200-footlock in Iowa) (USACE, 2015b).
These capacity constraints and delays contribute to an increase in barge rates during the busiest fall season.During the winter season, however, barge rates are low. Once ice forms on the river and the shipping season ends,barge services shut down to most areas in Iowa, forcing shippers to use other transportation modes. Because it isnot a year-round service, many shippers do not consider barge transportation to be reliable.
130 Refer to discussion in Section 6.3.10.
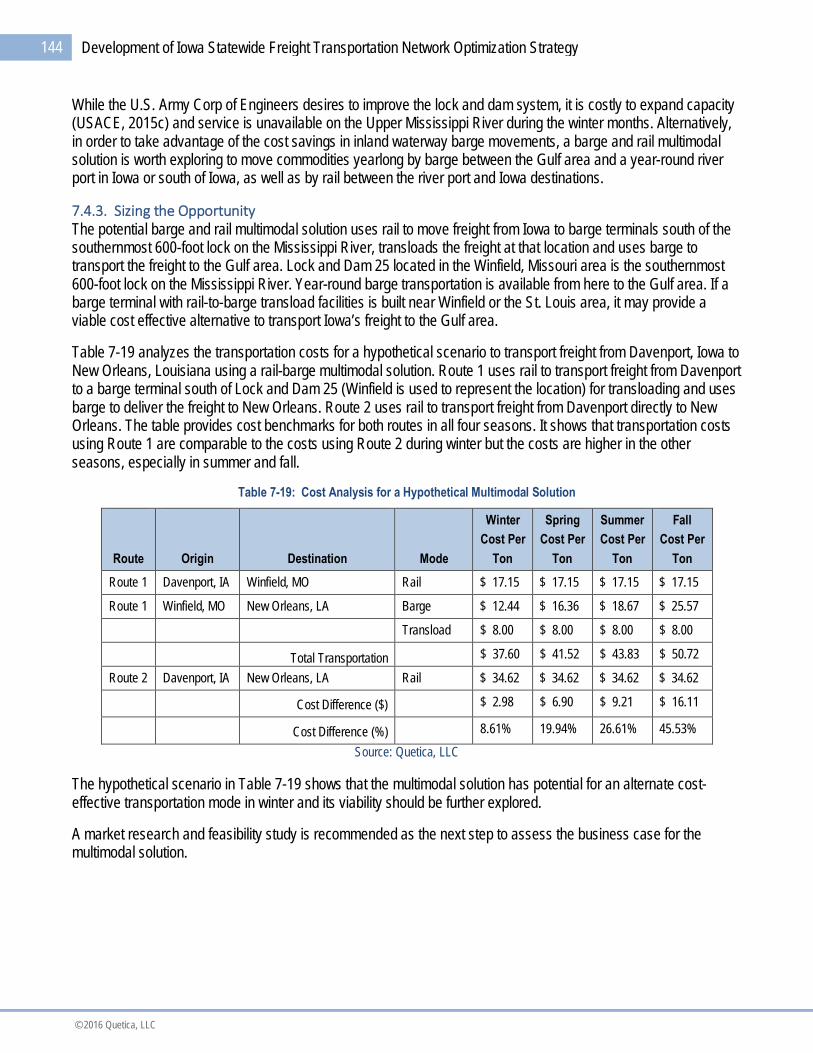
144 Development of Iowa Statewide Freight Transportation Network Optimization Strategy
© 2016 Quetica, LLC
While the U.S. Army Corp of Engineers desires to improve the lock and dam system, it is costly to expand capacity(USACE, 2015c) and service is unavailable on the Upper Mississippi River during the winter months. Alternatively,in order to take advantage of the cost savings in inland waterway barge movements, a barge and rail multimodalsolution is worth exploring to move commodities yearlong by barge between the Gulf area and a year-round riverport in Iowa or south of Iowa, as well as by rail between the river port and Iowa destinations.
7.4.3. Sizing the OpportunityThe potential barge and rail multimodal solution uses rail to move freight from Iowa to barge terminals south of thesouthernmost 600-foot lock on the Mississippi River, transloads the freight at that location and uses barge totransport the freight to the Gulf area. Lock and Dam 25 located in the Winfield, Missouri area is the southernmost600-foot lock on the Mississippi River. Year-round barge transportation is available from here to the Gulf area. If abarge terminal with rail-to-barge transload facilities is built near Winfield or the St. Louis area, it may provide aviable cost effective alternative to transport Iowa’s freight to the Gulf area.
Table 7-19 analyzes the transportation costs for a hypothetical scenario to transport freight from Davenport, Iowa toNew Orleans, Louisiana using a rail-barge multimodal solution. Route 1 uses rail to transport freight from Davenportto a barge terminal south of Lock and Dam 25 (Winfield is used to represent the location) for transloading and usesbarge to deliver the freight to New Orleans. Route 2 uses rail to transport freight from Davenport directly to NewOrleans. The table provides cost benchmarks for both routes in all four seasons. It shows that transportation costsusing Route 1 are comparable to the costs using Route 2 during winter but the costs are higher in the otherseasons, especially in summer and fall.
Table 7-19: Cost Analysis for a Hypothetical Multimodal Solution
Route Origin Destination Mode
Winter
Cost Per
Ton
Spring
Cost Per
Ton
Summer
Cost Per
Ton
Fall
Cost Per
Ton
Route 1 Davenport, IA Winfield, MO Rail $ 17.15 $ 17.15 $ 17.15 $ 17.15
Route 1 Winfield, MO New Orleans, LA Barge $ 12.44 $ 16.36 $ 18.67 $ 25.57
Transload $ 8.00 $ 8.00 $ 8.00 $ 8.00
Total Transportation $ 37.60 $ 41.52 $ 43.83 $ 50.72
Route 2 Davenport, IA New Orleans, LA Rail $ 34.62 $ 34.62 $ 34.62 $ 34.62
Cost Difference ($) $ 2.98 $ 6.90 $ 9.21 $ 16.11
Cost Difference (%) 8.61% 19.94% 26.61% 45.53%
Source: Quetica, LLC
The hypothetical scenario in Table 7-19 shows that the multimodal solution has potential for an alternate cost-effective transportation mode in winter and its viability should be further explored.
A market research and feasibility study is recommended as the next step to assess the business case for themultimodal solution.

145Development of Iowa Statewide Freight Transportation Network Optimization Strategy
© 2016 Quetica, LLC
7.5. Explore the Opportunity to Build a Logistics Park to Co-locate Cross-Docking, Intermodal,Transloading and Warehousing Facilities
A logistics park is a development concept in which warehouses and distribution centers are located in a singlezone, typically with access to the railroad network and Primary Highway System. Logistics parks with access to anintermodal terminal are usually labeled intermodal logistics parks. The co-location of logistics functions in a logisticspark provides many benefits for shippers, including:
Substantially lower transportation costs. Since warehouses and distribution centers in a logistics parkare in proximity to rail terminals, the drayage charges for transporting commodities between logisticsfacilities and rail terminals are significantly reduced or eliminated. Fuel consumption is also reduced andemissions are decreased as a result of nearby access to rail.
Improved transportation efficiency. Co-location of warehouses and distribution centers enablecompanies to do additional freight consolidation to maximize truck turns and minimize the number of trucksand drivers needed. Freight originated or terminated in warehouses and distribution centers within thesame logistics park can be consolidated if outbound shipments are transported to the same destinations orinbound shipments originate from the same sites. Consolidation may not be economical, however, if thewarehouses or distribution centers are located far apart.
Increased transportation options by combining rail and truck services in the same park. Co-locatingrail intermodal, transloading and cross-docking services with warehouses and distribution centers provideshippers with many options. Potential options include container and trailer intermodal service, direct railcarload service, truck-to-railcar and railcar-to-truck transloading service, LTL to TL consolidation andcontainer loading/unloading service.
Increased transportation capacity by clustering equipment and services. Clustering equipment (suchas tractors, trailers, railcars, and containers) and services (such as trucking, rail, warehousing,transloading, freight consolidation, freight deconsolidation, freight forwarding, and maintenance and repair)can provide a pool of resources for Iowa businesses to better manage supply chain demand fluctuations.
Improved facility management. Logistics parks provide integrated park management, encompassinggeneral maintenance, landscaping, security and waste management. As a result, tenants can focus ontheir core competencies.
146 Development of Iowa Statewide Freight Transportation Network Optimization Strategy
© 2016 Quetica, LLC
A relatively new design concept, logistics parks are being utilized by major corporations as a means to efficientlyand effectively manage logistics and transportation. Some of the success stories include Logistics Park Kansas City(LPKC)131 and Rickenbacker Global Logistics Park in Columbus, Ohio. Located in Edgerton, Kansas, LPKC is a1,500-acre inland port capable of handling 17 million square feet of building space, nearly three million of which willbe directly rail-served. The park, served by BNSF, a Class I intermodal rail provider, also has close access to fourinterstates. Located in Columbus, OH, Rickenbacker Global Logistics Park is a public-private partnership betweenDuke Realty Corporation, Capitol Square and Columbus Regional Airport Authority to provide distribution centersand warehousing space. The park encompasses 1,777 acres surrounding Rickenbacker International Airport and isadjacent to the Norfolk Southern intermodal terminal. The park has easy access to I-270, I-71, I-70, U.S. Highway23 and 33. It is capable of handling approximately 28 million square feet of development. It operates within acompetitive environment, by offering 15-year, 100 percent real property tax abatements132 aimed at reducing overallcosts of doing business in the park.
As discussed in Sections 7.1, 7.2 and 7.3, there is a strong financial case to establish cross-docking, intermodaland transloading facilities and operations in Eastern Iowa. Co-locating these facilities in a logistics park withwarehousing, distribution and other logistics services will greatly improve supply chain options in Eastern andCentral Iowa. Accessibility to multimodal transportation networks is one of the major factors to consider in locating alogistics park. Eastern Iowa provides access to multiple rail networks, including access to three Class I lines (CN,CP, and UP), one Class II and two Class III railroads, as well as highway corridors.
7.5.1. Sizing the OpportunityThe following assumptions are used to size the logistics park opportunity in Eastern Iowa:
Only commodity shipments in Section 7.1, 7.2 and 7.3 are included in the scope of this logistics parkoptimization analysis.
All transportation cost assumptions stay the same, as discussed in Sections 7.1, 7.2 and 7.3.
The optimized transportation costs are the lowest costs among the following options:
o Truck transportation costs through freight consolidation using a cross-dock
o Intermodal transportation costs
o Rail carload transportation costs with transloading
The total construction cost for the logistics park is the sum of the cross-dock, intermodal yard and transloadfacility construction costs. This is a conservative assumption since the total construction costs would likelybe lower, if all three facilities were constructed on the same site.
Co-locating three facilities in a logistics park enables businesses to further optimize their supply chains. Forexample, companies can use the cross-dock to consolidate small shipments into a full container and useintermodal to transport the container instead of using TL to transport the consolidated freight in the cross-dock analysis. Another example is to use the cross-dock to consolidate freight to railcars for rail carloadshipments. These techniques can further reduce transportation costs, yet they also require additionaltransportation management capabilities. These opportunities are not included in the logistics park costsavings analysis.
131 More information about LPKC is available at http://www.logisticsparkkc.com/
132 According to the park’s web site at http://www.rickenbackerglp.com/pdf/Ricken_Inserts-fastfacts.pdf
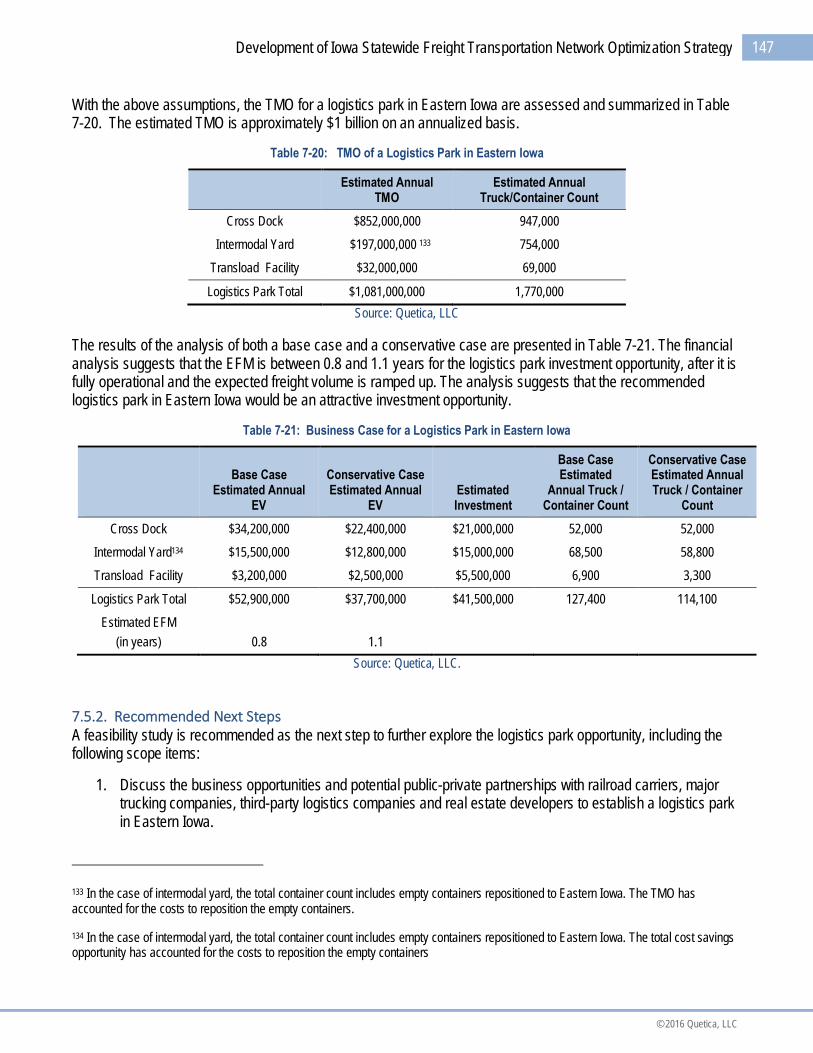
147Development of Iowa Statewide Freight Transportation Network Optimization Strategy
© 2016 Quetica, LLC
With the above assumptions, the TMO for a logistics park in Eastern Iowa are assessed and summarized in Table7-20. The estimated TMO is approximately $1 billion on an annualized basis.
Table 7-20: TMO of a Logistics Park in Eastern Iowa
Estimated AnnualTMO
Estimated AnnualTruck/Container Count
Cross Dock $852,000,000 947,000
Intermodal Yard $197,000,000 133 754,000
Transload Facility $32,000,000 69,000
Logistics Park Total $1,081,000,000 1,770,000
Source: Quetica, LLC
The results of the analysis of both a base case and a conservative case are presented in Table 7-21. The financialanalysis suggests that the EFM is between 0.8 and 1.1 years for the logistics park investment opportunity, after it isfully operational and the expected freight volume is ramped up. The analysis suggests that the recommendedlogistics park in Eastern Iowa would be an attractive investment opportunity.
Table 7-21: Business Case for a Logistics Park in Eastern Iowa
Base CaseEstimated Annual
EV
Conservative CaseEstimated Annual
EVEstimatedInvestment
Base CaseEstimated
Annual Truck /Container Count
Conservative CaseEstimated AnnualTruck / Container
Count
Cross Dock $34,200,000 $22,400,000 $21,000,000 52,000 52,000
Intermodal Yard134 $15,500,000 $12,800,000 $15,000,000 68,500 58,800
Transload Facility $3,200,000 $2,500,000 $5,500,000 6,900 3,300
Logistics Park Total $52,900,000 $37,700,000 $41,500,000 127,400 114,100
Estimated EFM
(in years) 0.8 1.1
Source: Quetica, LLC.
7.5.2. Recommended Next StepsA feasibility study is recommended as the next step to further explore the logistics park opportunity, including thefollowing scope items:
1. Discuss the business opportunities and potential public-private partnerships with railroad carriers, majortrucking companies, third-party logistics companies and real estate developers to establish a logistics parkin Eastern Iowa.
133 In the case of intermodal yard, the total container count includes empty containers repositioned to Eastern Iowa. The TMO hasaccounted for the costs to reposition the empty containers.
134 In the case of intermodal yard, the total container count includes empty containers repositioned to Eastern Iowa. The total cost savingsopportunity has accounted for the costs to reposition the empty containers
148 Development of Iowa Statewide Freight Transportation Network Optimization Strategy
© 2016 Quetica, LLC
2. Form a working group consisting of private sector companies, Iowa DOT and IEDA to further explore thebusiness opportunity.
3. Conduct a detailed site selection analysis to identify candidate sites for the suggested logistics park. Acandidate site should provide effective access to rail and the primary highway system, have land availableat reasonable costs, provide required utilities (such as electricity, water, sewage and internet connectivity)and include access to a skilled workforce with reasonable labor costs.
4. Develop a business plan with an in-depth financial analysis to demonstrate costs and benefits for all partiesinvolved.
During the revision process of this final report, Iowa DOT, IEDA, and their private partners have used theoptimization recommendations and the supporting data to develop an application for the Fostering Advancements inShipping and Transportation for the Long-term Achievement of National Efficient (FASTLANE) Grant. The grantapplication proposes a logistics park in Eastern Iowa to provide cross-docking, intermodal, transloading, and otherlogistics services. The project will provide Iowa and the surrounding states with access to a high capacity, efficient,and cost-competitive facility to move goods from truck to rail and rail to truck. In July 2016, Iowa DOT and its privatepartners were awarded a $25.6 million FASTLANE grant to develop the proposed logistics park (USDOT, 2016).
7.6. Collaborate with the Railroads to Provide Iowa Businesses with More Capacity to AccommodateForecasted Growth in Iowa Freight Shipments
As discussed in Section 4.2, there seems to be capacity constraints in segments of Iowa’s railroad network,especially on BNSF and UP mainlines. It is projected that a portion of the railroad network will have capacityconstraints if no incremental improvement is implemented as freight volumes continue to grow in the next 25 years.Since Iowa’s railroad network provides significant opportunities to optimize Iowa’s statewide freight network andreduce transportation costs for Iowa shippers (as discussed in Section 6.2), the projected capacity constraints willlimit the cost savings opportunities.
Possible solutions to address the current and future capacity constraints include adding additional tracks to theBNSF and UP mainlines (especially in the areas that have only single track segments), upgrading railroad controlsystems and expanding facilities.
Since the capacity constraints have been identified using a theoretical model from a rail freight capacity study(CamSys, 2007), it is recommended that the methodology, data and results be reviewed with the Class I railroadcompanies servicing Iowa and the Class II and III railroads in Iowa, in order to confirm the railroad’s operatingcapacities and constraints. The railroad network capacity and utilization maps in Section 4.2 could be updatedbased on feedback from them.
Iowa DOT is currently in the process of developing a rail plan. It is recommended that Iowa DOT complete thedevelopment of a strategic rail plan that addresses future capacity needs.

149Development of Iowa Statewide Freight Transportation Network Optimization Strategy
© 2016 Quetica, LLC
7.7. Explore Opportunities to Improve Competitiveness of Intermodal in Iowa by Repositioning EmptyContainers using Barge and Reducing Repositioning Costs
As discussed in Section 8.2, there is a shortage of empty containers in Iowa, because as a producer state it shipsmore containerized commodity than it consumes. Repositioning empty containers to Iowa is expensive. Theestimated cost to reposition an empty container from Chicago to Iowa by rail is approximately $600. On the otherhand, many empty barges are shipped up-river on the Mississippi River to load grain and other commodities inIllinois, Iowa, Minnesota, Missouri and Wisconsin for transport down-river. Over the past 12 months, an estimated14,368 up-river empty barges135, or 52 percent of the total up-river barges, passed through Lock and Dam 27 on theMississippi River (USDA, 2015a). These up-river empty barges represent significant unused transportationcapacity. The question is whether there is an opportunity to leverage the up-river empty barges to reposition emptycontainers.
Hopper barges are used to carry dry bulk commodity, such as coal, finished steel, grain, sand, gravel or similarmaterials on the Mississippi River. Hopper barge dimensions vary slightly, but are about 170 to 185 feet long by 28feet wide. The dimensions of a 53-foot domestic container are 53 feet long by 8 feet 6 inches wide by 9 feet 6inches high. A hopper would have room for approximately 27 53-foot containers. The standard 40-foot ISOcontainers are 8-foot wide by 8-foot-6-inch high (the “high cube” containers are 8-foot wide by 9-foot-6-inch wide). Ahopper would have room for approximately 36 40-foot ISO containers. Hypothetically, if all up-river empty bargesare hopper barges and they all carry empty containers to Midwestern states on the Upper Mississippi River, over380,000 empty containers would be repositioned annually, as shown in Table 7-22. Assuming just 5 percent of theup-river empty barges carry empty containers to Iowa, approximately 20,000 empty 53-foot containers (or 26,00040-foot ISO containers) could be repositioned using the deadhead barges to address the empty container deficitissue in Iowa.
135 From the week ending 8/16/2014 to the week ending 8/15/2015.

150 Development of Iowa Statewide Freight Transportation Network Optimization Strategy
© 2016 Quetica, LLC
Figure 7-29: Ocean Shipping Container Availability – Six-Month Snapshot of Average Weekly Throughput
Source: Ocean Shipping Container Availability Report – August 19-25, 2015 (USDA, 2015c)

151Development of Iowa Statewide Freight Transportation Network Optimization Strategy
© 2016 Quetica, LLC
The only additional transportation costs in this case would be to load and unload empty containers to and from thebarge. If the empty container loading and unloading costs are similar to rail intermodal lift costs (rail intermodal liftcosts are approximately $50 to $100 per lift)136, the repositioning costs would be approximately $100 to $200 percontainer (including both loading and unloading costs and before adding in barge operators’ profit margin andempty container inventory carrying costs during the process )137. After including the empty container inventory costs(since it takes longer to reposition the containers by barge), repositioning empty containers from the Gulf ports toIowa could still offer a lower cost solution than repositioning empty containers by rail from Chicago.
Table 7-22: Potential Annual Capacity in Barge Transportation to Reposition Empty Containers
Item 53-Foot Domestic Container 40-Foot ISO Container
Upbound empty barges per year 14,368 14,368
Empty containers carried per barge 27 36
Possible annual capacity to transportempty containers
387,936 517,248
Source: Quetica, LLC
According to the Ocean Shipping Container Availability Report published by USDA (USDA, 2015c), empty oceanshipping containers for dry commodities are available in the Memphis and New Orleans areas. Figure 7-29 shows asix-month snapshot of average weekly throughput published on August 19, 2015. On an average weekly basis, 558empty 20-foot, 530 empty 40-foot and 884 empty 40-foot high cube containers are available in Memphis. In NewOrleans, there was 246 empty 20-foot, 157-empty 40-foot and 221 empty 40-foot high cube containers available.There may be an opportunity to reposition these empty containers to a container yard close to the suggestedlogistics park in Eastern Iowa using up-river empty barges during the shipping season.
The project team didn’t find a reputable inventory report on 53’ empty containers in its research. Feedback fromIowa businesses indicated that companies reposition 53’ empty containers from major metropolitan areas in nearbystates including Chicago, Illinois and Kansas City, Missouri by rail or truck. If 53’ empty containers are foundavailable in areas with access to barge transportation, they can also be repositioned to a container yard close to thesuggested logistics park in Eastern Iowa using barge during the shipping season.
To track the availability of empty containers more effectively, a virtual container yard system could be developed incollaboration between Iowa DOT and IEDA and private partners. A virtual container yard is an online market thattracks status information about containers, such as size, type (e.g. dry, refrigerated and ISO tank), other containercharacteristics, location and availability (Theofanis, 2007). This tracking system improves information exchangebetween parties involved in supply chain management, such as carriers, shippers, distribution centers, equipmentleasing and logistics companies. The system can also help facilitate container leasing and management of relateddocuments, as well as container returns and exchanges.
It is recommended that a feasibility study be conducted to further evaluate the opportunity to reposition emptycontainers to Iowa from Memphis, New Orleans and potentially from other Gulf ports.
136 This is according to feedback from intermodal operators.
137 This assumes that loading/unloading containers goes very quickly to minimize demurrage costs.

152 Development of Iowa Statewide Freight Transportation Network Optimization Strategy
© 2016 Quetica, LLC
7.8. Explore and Implement Strategies to Reduce Deadhead Truck Miles
As discussed in Section 6.1, Iowa’s outbound truck freight volume is higher than the inbound truck freight volumebecause Iowa produces much more than it consumes. As a result, deadhead miles occur when empty trucks returnto Iowa to haul outbound freight. The deadhead miles increase transportation costs for Iowa companies becausetrucking companies are likely to increase outbound truck rates to compensate for the non-revenue producing miles.
One strategy to reduce deadhead miles is to use backhaul miles to transport inbound shipments or within Iowashipments if they are on the route. The key to the success of this strategy is sharing truck availability and freightshipment information across companies. Although commercial online load boards are available for load and truckavailability posting and search, the load boards tend to focus on the spot market and do not cover contracted lanes.A more sophisticated, mobile and web-based freight and truck information sharing and communication solution forboth contractual and spot markets would help reduce deadhead miles. It is recommended that Iowa DOT and IEDAexplore strategies with major Iowa shippers and the Iowa Motor Truck Association (IMTA) to develop such asolution in order to promote freight and truck availability information sharing and effectively leverage backhaul milesfor inbound and within Iowa shipments.
7.9. Explore Opportunities for Railroads to Provide Additional Lower Cost Rail Freight Transportation forWithin Iowa High Volume Traffic Lanes
The conversion of freight from truck-to-rail on long haul shipments of more than 500 miles has been a focus ofmultimodal freight strategies, since rail freight has significant cost advantages over trucking for linehaul trips.However, rail companies have had a harder time competing with trucking companies on short haul shipments.Historically, trucking is more flexible, reliable and has a competitive total cost structure on short hauls. Recently, thetrucking environment has changed. Driver shortage (ATA, 2015), higher insurance costs and new governmentregulations on a driver’s hours of service and safety performance are pushing up truck transportation costs.138
Railroads are making progress in the short haul market, as they improve operational efficiencies and service times.For example, Norfolk Southern has leveraged existing terminal and train capacity to reduce its cost structure insome East Coast short haul markets. One successful short haul traffic lane is a 200-mile rail service betweenNorfolk, VA and Greensboro, NC. Shippers are happy to use the short haul rail services, as long as the services arecost competitive and reliable, and transit time is predictable.139
As shown in Figure 4-1, there are a number of high volume traffic lanes for within Iowa shipments, including Polk –Linn – Black Hawk counties, Polk – Scott counties and Polk – Woodbury counties. These lanes all have well over 1million tons of truck freight in the base year. The volume of truck freight may be an opportunity for railroads toprovide reliable short haul services in these markets.
Further discussions with railroads and major Iowa shippers are recommended to explore the opportunities toprovide competitive short haul rail freight services for high volume traffic lanes in Iowa.
138 http://www.northjersey.com/news/business/trucker-shortage-grows-1.1065136?page=all
139 http://www.nscorp.com/content/nscorp/en/shipping-options/intermodal/terminals-and-schedules/greensboro-n-c-.html
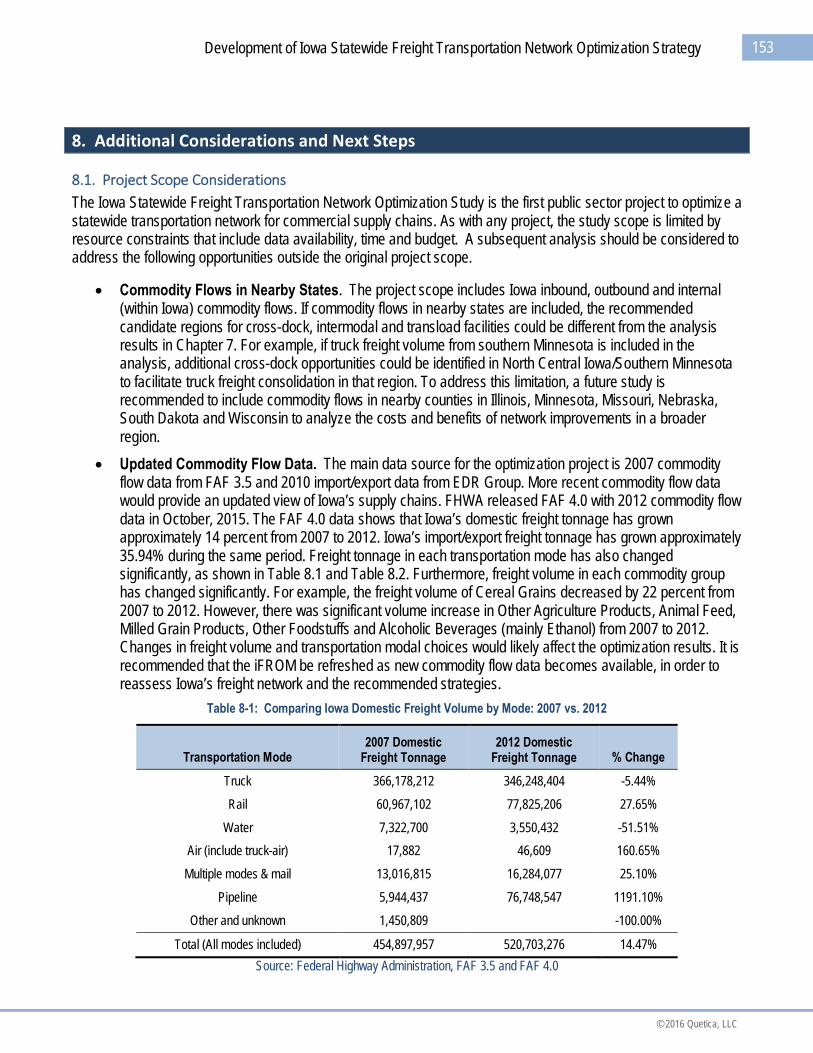
153Development of Iowa Statewide Freight Transportation Network Optimization Strategy
© 2016 Quetica, LLC
8. Additional Considerations and Next Steps
8.1. Project Scope Considerations
The Iowa Statewide Freight Transportation Network Optimization Study is the first public sector project to optimize astatewide transportation network for commercial supply chains. As with any project, the study scope is limited byresource constraints that include data availability, time and budget. A subsequent analysis should be considered toaddress the following opportunities outside the original project scope.
Commodity Flows in Nearby States. The project scope includes Iowa inbound, outbound and internal(within Iowa) commodity flows. If commodity flows in nearby states are included, the recommendedcandidate regions for cross-dock, intermodal and transload facilities could be different from the analysisresults in Chapter 7. For example, if truck freight volume from southern Minnesota is included in theanalysis, additional cross-dock opportunities could be identified in North Central Iowa/Southern Minnesotato facilitate truck freight consolidation in that region. To address this limitation, a future study isrecommended to include commodity flows in nearby counties in Illinois, Minnesota, Missouri, Nebraska,South Dakota and Wisconsin to analyze the costs and benefits of network improvements in a broaderregion.
Updated Commodity Flow Data. The main data source for the optimization project is 2007 commodityflow data from FAF 3.5 and 2010 import/export data from EDR Group. More recent commodity flow datawould provide an updated view of Iowa’s supply chains. FHWA released FAF 4.0 with 2012 commodity flowdata in October, 2015. The FAF 4.0 data shows that Iowa’s domestic freight tonnage has grownapproximately 14 percent from 2007 to 2012. Iowa’s import/export freight tonnage has grown approximately35.94% during the same period. Freight tonnage in each transportation mode has also changedsignificantly, as shown in Table 8.1 and Table 8.2. Furthermore, freight volume in each commodity grouphas changed significantly. For example, the freight volume of Cereal Grains decreased by 22 percent from2007 to 2012. However, there was significant volume increase in Other Agriculture Products, Animal Feed,Milled Grain Products, Other Foodstuffs and Alcoholic Beverages (mainly Ethanol) from 2007 to 2012.Changes in freight volume and transportation modal choices would likely affect the optimization results. It isrecommended that the iFROM be refreshed as new commodity flow data becomes available, in order toreassess Iowa’s freight network and the recommended strategies.
Table 8-1: Comparing Iowa Domestic Freight Volume by Mode: 2007 vs. 2012
Transportation Mode2007 Domestic
Freight Tonnage2012 Domestic
Freight Tonnage % Change
Truck 366,178,212 346,248,404 -5.44%
Rail 60,967,102 77,825,206 27.65%
Water 7,322,700 3,550,432 -51.51%
Air (include truck-air) 17,882 46,609 160.65%
Multiple modes & mail 13,016,815 16,284,077 25.10%
Pipeline 5,944,437 76,748,547 1191.10%
Other and unknown 1,450,809 -100.00%
Total (All modes included) 454,897,957 520,703,276 14.47%
Source: Federal Highway Administration, FAF 3.5 and FAF 4.0
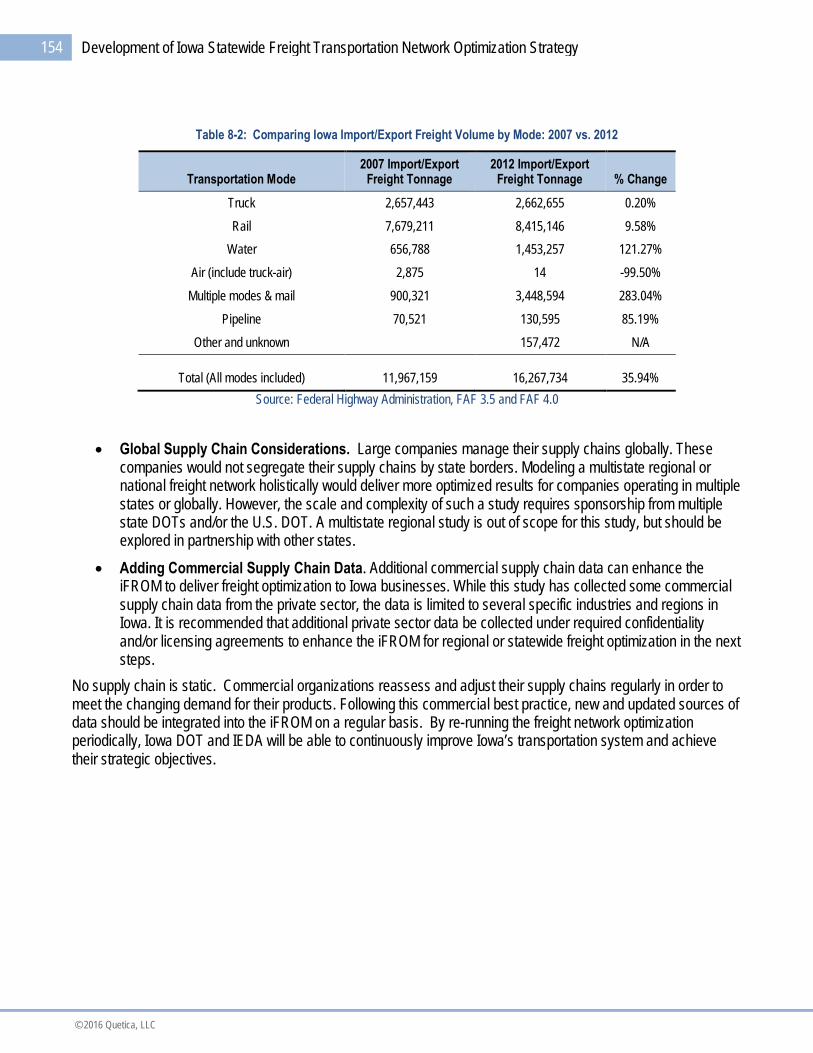
154 Development of Iowa Statewide Freight Transportation Network Optimization Strategy
© 2016 Quetica, LLC
Table 8-2: Comparing Iowa Import/Export Freight Volume by Mode: 2007 vs. 2012
Transportation Mode2007 Import/Export
Freight Tonnage2012 Import/Export
Freight Tonnage % Change
Truck 2,657,443 2,662,655 0.20%
Rail 7,679,211 8,415,146 9.58%
Water 656,788 1,453,257 121.27%
Air (include truck-air) 2,875 14 -99.50%
Multiple modes & mail 900,321 3,448,594 283.04%
Pipeline 70,521 130,595 85.19%
Other and unknown 157,472 N/A
Total (All modes included) 11,967,159 16,267,734 35.94%
Source: Federal Highway Administration, FAF 3.5 and FAF 4.0
Global Supply Chain Considerations. Large companies manage their supply chains globally. Thesecompanies would not segregate their supply chains by state borders. Modeling a multistate regional ornational freight network holistically would deliver more optimized results for companies operating in multiplestates or globally. However, the scale and complexity of such a study requires sponsorship from multiplestate DOTs and/or the U.S. DOT. A multistate regional study is out of scope for this study, but should beexplored in partnership with other states.
Adding Commercial Supply Chain Data. Additional commercial supply chain data can enhance theiFROM to deliver freight optimization to Iowa businesses. While this study has collected some commercialsupply chain data from the private sector, the data is limited to several specific industries and regions inIowa. It is recommended that additional private sector data be collected under required confidentialityand/or licensing agreements to enhance the iFROM for regional or statewide freight optimization in the nextsteps.
No supply chain is static. Commercial organizations reassess and adjust their supply chains regularly in order tomeet the changing demand for their products. Following this commercial best practice, new and updated sources ofdata should be integrated into the iFROM on a regular basis. By re-running the freight network optimizationperiodically, Iowa DOT and IEDA will be able to continuously improve Iowa’s transportation system and achievetheir strategic objectives.
155Development of Iowa Statewide Freight Transportation Network Optimization Strategy
© 2016 Quetica, LLC
8.2. Next Steps
Iowa DOT and IEDA are committed to providing an optimized transportation system to benefit Iowa’s economicgrowth. Several initiatives have been launched to further investigate the recommendations in Chapter 7, includingthe opportunity to establish a logistics park in Eastern Iowa. Iowa DOT and IEDA have also initiated the effort toenhance and refresh the iFROM to better support transportation planning and economic development. Some of thenew components include:
Recent Commodity Flow Data. The iFROM will be refreshed with FAF 4.0 commodity flow data tooptimize Iowa’s multimodal transportation network. FAF 4.0 was developed using the results of the mostrecent commodity flow survey conducted in 2012. It provides additional data points to verify the networkconstraints identified and optimization recommendations developed in this study.
Broader Geographic Scope. Commodity flows in nearby counties in Illinois, Minnesota, Missouri,Nebraska, South Dakota and Wisconsin will be included in the iFROM to optimize the statewide freightnetwork. Optimization results from the larger geographic scope will be compared to the findings in thisreport to fine-tune the recommended optimization strategies to achieve greater return on investment.
Additional Business Analytics Capabilities. The supply chain data collected, enhanced, and normalizedin the iFROM provides significant information on Iowa’s economy. Business analytics capabilities will bedeveloped to provide Iowa DOT and IEDA data visualization tools to help the private sector identifyopportunities to improve their supply chain efficiency, select areas to establish or expand their supplychains in Iowa and leverage public-private partnerships to develop industry clusters.
Regional Freight Network Optimization. Aggregated commercial supply chain data in a region will becollected and processed to augment the iFROM for regional freight network optimization. Regional freightnetwork optimization can create strategies to improve the local transportation network to providesustainable competitive advantages to local industries.
Statewide freight network optimization is a new and innovative approach to integrating transportation planning andeconomic development. Key to the quantitative optimization analysis, the iFROM will be enhanced with additionalcapabilities and optimization algorithms to help Iowa DOT make infrastructure investment decisions that deliversignificant benefits to transportation system users and help IEDA identify economic growth opportunities in Iowa.

156 Development of Iowa Statewide Freight Transportation Network Optimization Strategy
© 2016 Quetica, LLC
Appendix A: References
AAR (2015a). Railroad Performance Measures. Association of American Railroads: http://www.railroadpm.org,downloaded April 2015.
AAR (2015b). The Economic Impact of America’s Freight Railroads. Association of American Railroads:https://www.aar.org/BackgroundPapers/Economic%20Impact%20of%20US%20Freight%20Railroads.pdf#search=fuel%20efficiency. Downloaded in May 2015.
AAR (2016). Class I Railroad Statistics. Association of American Railroads:https://www.aar.org/Documents/Railroad-Statistics.pdf. Downloaded in May, 2016.
AMS (2014). Agriculture Transportation: Barge Data.http://www.ams.usda.gov/AMSv1.0/ams.fetchTemplateData.do?template=TemplateN&navID=AgriculturalTransportation&leftNav=AgriculturalTransportation&page=ATBarge&description=Barge&acct=transmodes. Downloaded inDecember 2014.
ATA (2013). U.S. Freight Transportation Forecast to 2024. American Trucking Association. August 2013. The 2014version is available for purchase athttp://www.atabusinesssolutions.com/ATAStore/ProductDetails.aspx?productId=2529327%20.
ATA (2015). Truck Driver Shortage Analysis 2015. American Trucking Association. October 2015.
Ballou, R. (1998). Business Logistics Management (4 Ed.). Saddle River, NJ: Prentice Hall.
Battelle (2007). Development of Truck Payload Equivalent Factor (TPEF). Battelle under funding from FederalHighway Administration: http://ops.fhwa.dot.gov/freight/freight_analysis/faf/faf2_reports/reports9/index.htm#toc.2007.
Battelle (2014). Iowa’s Re-Envisioned Economic Development Roadmap. Battelle Technology Partnership Practice.December 2014.
BLS (2015). Producer Price Indexes. Bureau of Labor Statistics, U.S. Department of Labor: http://www.bls.gov/ppi/,downloaded in July 2015.
Bryan, J. et al (2007). Rail Freight Solutions to Roadway Congestion: Final Report and Guidebook. NCHRP Report586, Transportation Research Board, 2007.
CamSys (2007). National Rail Freight Infrastructure Capacity and Investment Study by Cambridge Systematics.September 2007.
CamSys (2014). Travel Demand Modeling Policies and Procedures, VDOT Project Number: 30681-03-02. June2014.
Cass (2014). Cass Freight Index. Cass Information Systems, Inc.: http://www.cassinfo.com/Transportation-Expense-Management/Supply-Chain-Analysis/Cass-Freight-Index.aspx, downloaded in 2014.
Chopra, S. et al (2004). Supply Chain Management: Strategy, Planning and Operation. Second edition published byPrentice-Hall, Inc., 2004.
Christensen Associates et al (2012). Preserving and Protecting Freight Infrastructure and Routes. NCFRP Report16, NCFRP 24 Project, Transportation Research Board, 2012.

157Development of Iowa Statewide Freight Transportation Network Optimization Strategy
© 2016 Quetica, LLC
Criton (2013). River Transport News. Biweekly publication by Criton Corporation, 2013.
C.H. Robinson (2015). Intermodal. Downloaded from C.H. Robinson web site:http://www.chrobinson.com/en/us/Logistics/Intermodal-Rail/Intermodal/ in August 2015.
DMAMPO (2014). Des Moines Rail Transload Feasibility Study. Studied by Engineered Rail Solutions, McClureEngineering Co. and ViaRail Logistics, LLC under funding from Des Moines Area Metropolitan PlanningOrganization. June 2014.
Dong, J. et al (2015). Modeling Multimodal Freight Transportation Network Performance under Disruptions. IowaState University Report # MATC-ISU: 237, 2015.
EDR Group (2014). Iowa Year 2010 Import/Export Commodity Flow Data. Economic Development ResearchGroup: www.edrgroup.com. Data was provided in March 2014.
FAF3 (2014). Freight Analysis Framework Version 3.5. Center for Transportation Analysis, Oak Ridge NationalLaboratory under funding from the Federal Highway Administration: http://faf.ornl.gov/fafweb/News.aspx. May 2014.
Fennimore (2011). Des Moines Area Metropolitan Planning Organization Intermodal Feasibility Study. TheFennimore Group. March 2011.
FRA (2010). Proposed Birmingham Regional Intermodal Facility. Submitted pursuant to the National EnvironmentalPolicy Act of 1069 42 U.S.C. 4332(2)(C), led by Federal Railroad Administration, Federal Highway Administration,Alabama Department of Transportation, submitted by CH2MHILL on behalf of Norfolk Southern Railway Company.October 2010.
FRA (2015). Freight Rail Today. U.S. Department of Transportation Federal Railroad Administration:https://www.fra.dot.gov/Page/P0362, downloaded in August 2015.
FRED (2015). Total Gross Domestic Product for Iowa. Federal Reserve Economic Data, Federal Reserve Bank ofSt. Louis: https://research.stlouisfed.org/fred2/series/IANGSP#, downloaded in July 2015.
Fuller, S. et al (1998). The Upper Mississippi/Illinois Rivers and Grain/Soybean Transportation: An Analysis ofTransportation Capacities. Texas Agricultural Market Research Center. Research Report CM 1-98, Department ofAgricultural Economics, Texas A&M University, 1998.
Goldratt, E. et al (1984). The Goal: A Process of Ongoing Improvement. North River Press, 1984.
IANA (2015). Intermodal Fact Sheet. Intermodal Association of North America (IANA):http://www.intermodal.org/information/factsheet.php, downloaded August 2015.
Inbound Logistics (2012). Intermodal: More Than Roads and Rails. Inbound Logistics:http://www.inboundlogistics.com/cms/article/intermodal-more-than-roads-and-rails/, May 2012.
International Trade (2015). Iowa Exports, Jobs and Foreign Investment. U.S. Department of Commerce,International Trade Administration: http://www.trade.gov/mas/ian/statereports/states/ia.pdf, April 2015.
Iowa DOT Barge (2011). River Barge Terminal Directory. Iowa Department of Transportation:http://www.iowadot.gov/pdf_files/river_barge_directory.pdf, downloaded in December 2014.
Iowa DOT (2014a). Compare…Iowa Department of Transportation: http://www.iowadot.gov/compare.pdf,downloaded in December 2014.

158 Development of Iowa Statewide Freight Transportation Network Optimization Strategy
© 2016 Quetica, LLC
Iowa DOT (2014b). Iowa Rail Toolkit. Iowa Department of Transportation, October 2014.
Iowa DOT (2014c). Waterways. http://www.iowadot.gov/about/Waterways.html, downloaded in December 2014.
Iowa DOT (2015). Tiger Discretionary Grant Application Upper Midwest Transportation Hub Manly, Iowa. IowaDepartment of Transportation: http://www.iowadot.gov/iowarail/assistance/documents/2015/narrative.pdf,downloaded in August 2015.
Iowa DOT (2016a). Compare…Iowa Department of Transportation: http://www.iowadot.gov/compare.pdf,downloaded in May 2016.
Iowa DOT (2016b). Draft Iowa State Rail Plan. Iowa Department of Transportation:http://www.engagefreightrailplans.com/resources/documents/, downloaded in July 2016.
iTRAM (2015). iTRAM (2010 Validation Update) Highway Model Update and Validation. Iowa Department ofTransportation. February 2015.
Marrs, Drew (2011). Norfolk Southern Railway The Past, The Present, The Future of Freight Transportation. NorfolkSouthern Government Relations: http://www.i-81coalition.org/Presentations/2011_Annual_Meeting_(Oct_31-Nov_1)/Norfolk_Southern_Railway_-_Freight_Transportation_-_Marrs/, downloaded in August 2015.
MNDOT (2009). Northern Minnesota / Northwestern Wisconsin Regional Freight Study, Technical Memorandum #2:Key Freight Issues Program Analysis and Recommendations. Minnesota Department of Transportation, preparedby Wilbur Smith Associates, in Partnership with SRF Consulting Group, Inc., C.J. Petersen and Associates and TheUniversity of Toledo. August 2009.
MNDOT (2013). Statewide Ports & Waterways Plan (Draft). Minnesota Department of Transportation. November2013.
Morlok, Edward K. et al (2015). APPROACHES FOR IMPROVING DRAYAGE IN RAIL-TRUCK INTERMODALSERVICE. University of Pennsylvania:http://transportation.njit.edu/NCTIP/final_report/approaches_for_improving_drayage.htm, August 1994.
Nathan, Robert (2014). Climb Aboard: Intermodal Pioneering Tomorrow’s Supply Chain. Supply & Demand ChainExecutive. March 2014.
ODOT (2013). Ohio Statewide Freight Study – Ohio River Terminals Analysis. Prepared for Ohio Department ofTransportation by Vickerman & Associates LLC for the Parsons Brinckerhoff Consulting Team:http://www.dot.state.oh.us/Divisions/Planning/SPR/StatewidePlanning/access.ohio/Ohio%20Freight%20Study%20Reports/Ohio%20River%20Terminal%20Analysis.pdf, May 2013.
RailroadPM (2015). Railroad Performance Measures. RailroadPM.Org:http://www.railroadpm.org/home/RPM/Performance%20Reports/BNSF.aspx. Downloaded in April 2015.
SelectUSA (2015). The Logistics and Transportation Industry in the United States. SelectUSA, U.S. Department ofCommerce: http://selectusa.commerce.gov/industry-snapshots/logistics-and-transportation-industry-united-states.html. Downloaded in June 2015.
Stewart, Richard D et al (2003). Twin Ports Intermodal Freight Terminal Study: Evaluation of Shipper Requirementsand Potential Cargo Required to Establish a Rail-Truck-Marine Intermodal Terminal in the Twin Ports of Superior,Wisconsin and Duluth, Minnesota. University of Wisconsin-Madison sponsored by U.S. Department ofTransportation: http://www.uwsuper.edu/tlresearchcenter/upload/intermodalfinalstudy.pdf, July 2003.

159Development of Iowa Statewide Freight Transportation Network Optimization Strategy
© 2016 Quetica, LLC
Sulbaran, T. et al (2013a). Logistical Impact of Intermodal Facilities. ASEE Southeast Section Conference,American Society for Engineering Education. March 2013.
Sulbaran, T. et al (2013b). Triple-Bottom Line Assessment of Future Mississippi Intermodal Facility. Study No. 235,prepared for Mississippi Department of Transportation by the University of Southern Mississippi. June 2013.
Theofanis, S, et al (2007). Investigating the Feasibility of Establishing a Virtual Container Yard to Optimize EmptyContainer Movement in the NY-NJ Region Final Report, prepared for University Transportation Research Center,City College of New York, New York, KY 10031 and US Department of Transportation, Washington, DC by Centerfor Advanced Infrastructure and Transportation, Maritime Infrastructure Engineering and Management Program,Rutgers, The State University of New Jersey, Piscataway, NJ 08854. September 2007.
TTI (2007). A Modal Comparison of Domestic Freight Transportation Effects on the General Public. Center for Portsand Waterways, Texas Transportation Institute. November 2007.
USACE (2012). Upper Mississippi River Locks and Dams. U.S. Army Corps of Engineers. October 2012.
USACE (2014). U.S. Army Corps of Engineers Navigation Data Center:http://www.navigationdatacenter.us/wcsc/webpub12/webpubpart-2.htm, downloaded in December 2014.
USACE (2015a). U.S. Army Corps of Engineers Lock Performance Monitoring System:http://corpslocks.usace.army.mil/lpwb/f?p=121:7:0. Downloaded in June 2015.
USACE (2015b). Lock & Dam 18. U.S. Army Corps of Engineers:http://www.mvr.usace.army.mil/Portals/48/docs/CC/FactSheets/MISS/LockandDam18(2015).pdf. Downloaded inJune 2015.
USACE (2015c). U.S. Army Corps of Engineers, Rock Island District River Navigation Information. PowerPointpresentation by Gary Meden, Deputy Commander for Programs and Project Management, Rock Island District.June 2015.
US Census Bureau (2010). State Area Measurements and Internal Point Coordinates 2010 United States Census:http://www.census.gov/geo/reference/state-area.html. Retrieved in April 2014.US Census Bureau (2012). CountyBusiness Patterns in 2010: http://www.census.gov/econ/cbp/. Downloaded in February 2014.
US Census Bureau (2013). Annual Estimates of the Population for the United States, Regions, States, and PuertoRico: April 1, 2010 to July 1, 2013 (CSV): http://www.census.gov/popest/data/state/totals/2013/tables/NST-EST2013-01.csv. Retrieved in April 2014.
USDA (2010). Study of Rural Transportation Issues. The United States Department of Agriculture and The UnitedStates Department of Transportation:http://www.ams.usda.gov/AMSv1.0/ams.fetchTemplateData.do?template=TemplateA&navID=AgriculturalTransportation&leftNav=AgriculturalTransportation&page=ATRuralTransportationStudyHome&description=Study%20of%20Rural%20Transportation%20Issues. Downloaded in December 2014.
USDA (2015a). Grain Transportation Report Datasets. The United States Department of Agriculture AgriculturalMarketing Service: http://www.ams.usda.gov/services/transportation-analysis/gtr-datasets. Downloaded in August2015.
USDA (2015b). Grain Transportation Report. The United States Department of Agriculture Agricultural MarketingService: http://www.ams.usda.gov/AMSv1.0/GTR. Downloaded in July 2015.

160 Development of Iowa Statewide Freight Transportation Network Optimization Strategy
© 2016 Quetica, LLC
USDA (2015c). Ocean Shipping Container Availability Report. The United States Department of AgricultureAgricultural Marketing Service: http://www.ams.usda.gov/services/transportation-analysis/oscar. August 26, 2015
USDOC (2010). Reginal Economic Accounts. The United States Department of Commerce Bureau of EconomicAnalysis: http://www.bea.gov/regional/. Downloaded in February 2014.
USDOT (2007). 2007 Commodity Flow Survey Standard Classification of Transported Goods (SCTG). U.S.Department of Transportation Bureau of Transportation Statistics and U.S. Department of Commerce U.S. CensusBureau: https://www.census.gov/svsd/www/cfsdat/cfs071200.pdf. Downloaded in 2014.
USDOT (2010). 2007 Commodity Flow Survey United States. U.S. Department of Transportation Bureau ofTransportation Statistics and U.S. Department of Commerce U.S. Census Bureau:http://www.rita.dot.gov/bts/sites/rita.dot.gov.bts/files/publications/commodity_flow_survey/final_tables_december_2009/index.html. April 2010.
USDOT (2013a). Freight Facts and Figures 2013. U.S. Department of Transportation Federal HighwayAdministration and Bureau of Transportation Statistics. 2013.
USDOT (2013b). Panama Canal Expansion Study, Phase I Report, Developments in Trade and National andGlobal Economies. U.S. Department of Transportation Maritime Administration. November 2013.
USDOT (2016). U.S. Department of Transportation Proposed FY 2016 FASTLANE Project Awards. U.S.Department of Transportation: http://transportation.house.gov/uploadedfiles/fastlane_project_awards_7.1.pdf.Downloaded in July 2016
Wu, Fang (Lisa) et al (2008). Assessing Feasibility of Intermodal Transport of Agricultural and Related Products onShort Line and Regional Railroads. Minnesota Department of Agriculture:http://www.ams.usda.gov/AMSv1.0/getfile?dDocName=STELPRDC5073271, 2008.
WVPPA (2007). Final Report Economic and Market Analysis for an Inland Intermodal Port, prepared for WestVirginia Public Port Authority, September 2007.
Yu, T.et al (2006). Effect of Lock Delay on Grain Barge Rates: Examination of Upper Mississippi and Illinois Rivers.The Annals of Regional Science 40:887-908, 2006.
Zarembski, Allan M. et al (2008). Estimating Maintenance Costs for Mixed High-Speed Passenger and Freight RailCorridors A New Tool for Rail Planners. TR News 255, Transportation Research Board, 2008.
Zumerchik, John et al (2012). Automated Transfer Management Systems and the Intermodal Performance of NorthAmerican Freight Distribution. Journal of the Transportation Research Forum: http://www.scilit.net/journals/1381122012.

161Development of Iowa Statewide Freight Transportation Network Optimization Strategy
© 2016 Quetica, LLC
Appendix B: Glossary of Terms
Term Definition
AARAssociation of American Railroads - an industry trade group representing themajor freight railroads of North America (Canada, Mexico and U.S).
BEA Regions
The U.S. Department of Commerce, Bureau of Economic Analysis (BEA) hasdefined 179 BEA geographic regions. BEA's economic areas define the relevantregional markets surrounding metropolitan or micropolitan statistical areas. Theyconsist of one or more economic nodes - metropolitan or micropolitan statisticalareas that serve as regional centers of economic activity - and the surroundingcounties that are economically related to the nodes.
To view a map of BEA Regions go to:www.bea.gov/newsreleases/general/2004/pdf/rea1104.pdf.
Class I, II and III Railroad
As defined by the Association of American Railroads, a Class I-railroad has a2011 operating revenue of $433.2 million or more. U.S. Class I railroads in 2011are: BNSF Railway, CSX Transportation, Grand Trunk Corporation, Kansas CitySouthern Railway, Norfolk Southern Combined Railroad Subsidiaries, Soo LineCorporation and Union Pacific Railroad. Grand Trunk Corporation consists ofalmost all of the Canadian National’s U.S. operations. Soo Line Corporation is allof Canadian Pacific's U.S. operations.
COFC/TOFCThese acronyms mean "Container on Flat Car" and "Trailer on Flat Car"respectively. They are the two common types of intermodal freight.
Container
A typical container for import/export is 40 or 48 feet long, 8 feet tall and 8 feetwide. These steel boxes are used internationally to transport freight by sea, railand highway. Container traffic is measured in twenty-foot equivalent units(TEUs). In the domestic market, 53 foot containers are commonly used.
Container providerFor international shipments, containers are typically provided by the ocean carrierfrom its available empty inventory within proximity of the shipper.
ContainerizationThe technique of using a box-like device, in which commodities are stored,protected and handled as a single unit in transit.
Cross-dockingCross-docking is a logistics procedure where products from a supplier ormanufacturing plant are distributed directly to a customer or retail chain withmarginal to no handling or storage time.
Cut/Lockage A cut or lockage is a passage through a lock in a waterway or canal.
Data AggregationData aggregation is a type of data analysis process where data is searched,gathered and presented in a summarized structure and format to achieve specificbusiness objectives.
Data DisaggregationData disaggregation is a type of data analysis process to break down numericalor non-numerical information in component parts or smaller units of data.

162 Development of Iowa Statewide Freight Transportation Network Optimization Strategy
© 2016 Quetica, LLC
Term Definition
Double-stackRail intermodal technology in which two containers are stacked on a rail cardoubling the container carrying capacity of the car.
Distribution centerWarehousing facilities, where typically like commodities in containers or truck-load lots are re-sorted into mixed truckloads for distribution to retail outlets orcustomers.
Drayage CarrierThe service offered by a motor carrier for pick-up and delivery of ocean, rail or aircommodity containers.
Freight Analysis Framework(FAF)
The Freight Analysis Framework (FAF) integrates data from a variety of sourcesto create a comprehensive picture of freight movement among states and majormetropolitan areas by all modes of transportation. With data from the 2007Commodity Flow Survey and additional sources, FAF version 3 (FAF3) providesestimates for tonnage, value and domestic ton-miles by region of origin anddestination, commodity type and mode for 2007, the most recent year andforecasts through 2040. Also included are state-to-state flows for these yearsplus 1997 and 2002, summary statistics and flows by truck assigned to thehighway network for 2007 and 2040. More FAF information is available athttp://ops.fhwa.dot.gov/FREIGHT/freight_analysis/faf/index.htm.
Inbound Freight FlowsThe freight that originates outside a particular state or region and terminates inthat state or region.
Inland Port
The term inland port is used in two different but related ways to mean either aport on an inland waterway or an inland site carrying out some functions of aseaport. An inland port in the wide sense, as used in common speech, is simplya port on an inland waterway such as a river, lake or canal. The term inland portis also used in a narrow sense in the field of transportation systems to mean arather more specialized facility that has come about with the advent of theintermodal container (standardized shipping container) in international transport.Rather than goods being loaded and unloaded in such ports, shipping containerscan just be transferred between ship/train and road vehicle or ship and train/roadvehicle. The container may be transferred again between road and rail elsewhereand the goods are only loaded or unloaded at their point of origin or finaldestination.
Intermodal
Freight that travels from origin to destination on more than one mode oftransportation such as a container that arrives by train and is transferred to truckfor the remainder of its journey. In this report, intermodal is referred tocontainerized shipments by rail and truck.
Within Freight Flows Freight that both originates and terminates within a particular state or region.
Iowa Travel Analysis Model(iTRAM)
Iowa DOT’s statewide traffic modeling tool. It includes road, rail and inlandwaterway networks.

163Development of Iowa Statewide Freight Transportation Network Optimization Strategy
© 2016 Quetica, LLC
Term Definition
Less Than Truckload (LTL)
LTL shipments can range from 50 to 48,000 pounds in weight, but generallyweigh about 1,000 pounds on average. LTL carriers require a number ofterminals due to their need to reorganize and consolidate shipments. (Source:American Trucking Association - unpublished draft of TRB Trucking 101: AnIndustry Primer)
Ocean port intermodal terminal
There are three general types of intermodal terminals serving container traffic atports:
• On-dock: a rail to ship transfer facility at the marine terminal eliminating theneed to transfer containers by truck on city streets.• Near-dock: typically located within a few miles of port terminals; transferbetween rail and ship requires a truck move and additional container lifts. Thistype of terminal has the advantage of serving multiple ocean carriers.• Inland port/satellite: Located away from the seaport - most advantageous ifshuttle trains operate between the inland terminal and port facilities to avoid porttraffic congestion.
Outbound Freight FlowsThe freight that originates in particular state or region and terminates outside ofthat state or region.
Panamax ships
"Panamax ships" are the largest ships able to pass through the lock chambers ofthe Panama Canal. The current lock dimensions are 1,000 feet long and 106 feetwide. Many ocean cargo ships are built to the Panamax limit to carry themaximum amount of cargo through the canal. Current containers ships arelimited to approximately 5,000 TEU. When the larger locks currently underconstruction are completed, the Panama Canal will be able to handle containerships of up to approximately 13,000 TEU - this class of ships is typically referredto as "Post- Panamax" ships.
Rail CarloadRail freight moved using individual or groups of rail cars (e.g. box cars, hoppercars, tankers and other rail dedicated equipment).
Rail Intermodal Freight moved by railroads in containers.
Short-ton A unit of weight equal to 2,000 pounds.
Supply Chain
A group of physical entities such as manufacturing plants, distribution centers,conveyances and retail outlets in addition to people and information which arelinked together through processes (such as procurement or logistics) in anintegrated fashion, to supply goods or services from source through consumption.
TEU
Twenty-foot Equivalent Unit - the standard of measurement for intermodalcontainers. Early containers used for cargo were 20 feet long, 8 feet wide and8.5 feet high. Today containers come in a variety of sizes including 20 and 40foot ISO standard containers and 45 and 53 foot domestic containers.
Third party logistics (3PL) A firm that specializes in logistics services that are provided to other companies.

164 Development of Iowa Statewide Freight Transportation Network Optimization Strategy
© 2016 Quetica, LLC
Term Definition
Through-Freight FlowsFreight traffic volumes that originate and terminate beyond the borders of a stateor region, but that use transportation infrastructure of the state or region duringtransit.
Transload
The practice of transferring product between modes (e.g., between truck and rail,truck and barge, rail and barge). In most instances, a transload facility operator,third-party logistics company, or broker facilitates transloading for both theshipper and the consignee. These companies coordinate truck, rail, and bargeconnections and frequently offer warehousing and other services to facilitatestorage and delivery.
Transloading
The practice of transferring product between two modes (e.g., between truck andrail, truck and barge, rail and barge). It allows shippers and their customers toenjoy much of the cost benefits of rail/barge transportation without having a railsiding or barge terminal at their door. In most instances, a transload facilityoperator, third-party logistics company, or transportation broker facilitatestransloading for both the shipper and the consignee. These companiescoordinate truck, rail, and barge connections and frequently offer warehousingand inventory management services to facilitate storage and delivery.

165Development of Iowa Statewide Freight Transportation Network Optimization Strategy
© 2016 Quetica, LLC
Appendix C: Iowa Freight Advisory Council Survey Questions
Overview
What are the modes of transportation used in your organization and what is the mode concentration bytonnage or transportation spend? Please fill in the following table:
Mode Percentage Mode Percentage
Full Truckload Less Than TruckloadParcel Intermodal
Rail BargeOcean Air Freight
How many facilities (plants, distribution centers, terminals, etc.) does your organization have in Iowa?A) Fewer than 5B) 5 to 10C) 10 to 25D) 25 to 50E) More than 50
Where are the top destinations for your outbound traffic? Where are the top origin locations for your inbound traffic? What are your major challenges in using Iowa’s freight transportation network to support your business?
Truck (Full Truckload, Less Than Truckload, Parcel)
What challenges do you see with the roadway network in regards to trucking? Are there routes which would be more preferred if they met your trucking needs? Are there any deterrents which cause your drivers to avoid routes (e.g. weight restriction, height restriction,
turning radius, congestion, etc.)?
Rail
What challenges do you see with the rail network? Is rail located in a location that is easy for your organization to use? Where would you like to see additional rail spurs?
Water (Barge and Ocean)
What challenges do you see with the barge/river system? Are barge terminals in convenient locations for your organization to use? What should be the highest priority for improvement?
Intermodal
What are the largest challenges with shipping intermodal? Where do you suggest new intermodal facilities be located?
Air
What are the largest challenges with air freight shipping? What should be the highest priority for improvement?
Warehouse
What challenges do you see with Iowa’s warehouse facilities? Are warehouses in convenient locations for your organization to use? What should be the highest priority for improvement?
© 2016 Quetica, LLC
Prepared for :
Iowa Department of Transporta�on
Prepared by:
Que�ca, LLC
3800 American Boulevard West
Suite 1500
Bloomington, MN 55431