Embed Size (px)
Citation preview

November 2017
Connecticut Statewide
Freight Plan

This page intentionally left blank.

CONNECTICUT STATEWIDE FREIGHT PLAN Page i
LIST OF ACRONYMS
AHTD – Annual Hours of Truck Delay
ATA – American Trucking Association
BPA – Bridgeport Port Authority
CIP – Capital Improvement Plan
CMAQ – Congestion Mitigation and Air Quality Program
CNG – Compressed Natural Gas
COG – Council of Governments
CPA – Connecticut Port Authority
CRA – Connecticut Railroad Association
CRFC – Critical Rural Freight Corridors
CTDOT – Connecticut Department of Transportation
CUFC – Critical Urban Freight Corridors
CVISN – Commercial Vehicle Information Systems and Networks
DECD – Department of Economic and Community Development
DEEP – Department of Energy and Environmental Protection
DMV – Department of Motor Vehicles
EJ – Environmental Justice
EPA – United States Environmental Protection Agency
FAA – Federal Aviation Administration
FAST Act – Fixing America’s Surface Transportation Act
FHWA – Federal Highway Administration
FMCSA – Federal Motor Carrier Administration
FRA – Federal Railroad Administration
FTA – Federal Transit Administration
FTIP – Freight Transportation Improvement Program
GIS – Geographic Information System
GPS – Global Positioning Systems
HCAADT – Heavy Commercial Average Annual Daily Traffic
HHS – U.S. Department of Health and Human Services
HOS – Hours of Service
HSIP – Highway Safety Improvement Program
ITS – Intelligent Transportation Systems
LEP – Limited English Proficiency
LRP – Long Range Plan
MAP-21 – Moving Ahead for Progress in the 21st Century Act
MPG – Miles Per Gallon
MPH – Miles Per Hour
MPO – Metropolitan Planning Organization
NAAQS – National Ambient Air Quality Standards

LIST OF ACRONYMS
Page ii CONNECTICUT STATEWIDE FREIGHT PLAN
NAFTA – North American Free Trade Agreement
NBI – National Bridge Inventory
NECR – New England Central Railway
NERFG – New England Regional Freight Group
NFAC – National Freight Advisory Committee
NFSP – National Freight Strategic Plan
NHFN – National Highway Freight Network
NHFP – National Highway Freight Program
NHL – New Haven Line
NHPA – New Haven Port Authority
NHPP – National Highway Performance Program
NHS – National Highway System
NHTSA – National Highway Traffic Safety Administration
NMFN – National Multimodal Freight Network
NSB – Naval Submarine Base
OSOW – Oversize-Overweight
PHFN – Primary Highway Freight Network
PHFS – Primary Highway Freight System
PHMSA – Pipeline and Hazardous Materials Safety Administration
PPPs – Public-Private Partnerships
PTC – Positive Train Control
RQI – Ride Quality Index
RRIF – Railroad Rehabilitation and Improvement Financing
STF – Special Transportation Fund
STIP – State Transportation Improvement Program
STRAHNET – Strategic Highway Network
TEP – Tax Exempt Program
TIFIA – Transportation Infrastructure Finance and Innovation Act
TIGER – Transportation Investment Generating Economic Recovery
TRANSCOM – Transportation Operations Coordinating Committee
TTTR – Truck Travel Time Reliability
USACE – United States Army Corps of Engineers
USDOT – United Stated Department of Transportation
WIM – Weigh-in-Motion Systems

CONNECTICUT STATEWIDE FREIGHT PLAN Page iii
EXECUTIVE SUMMARY
Freight movement is invisible to most of us, yet we expect much from it. Think about the last time you
ordered a gift for someone at the last minute that was delivered within a single day of your order.
Making deliveries happen so efficiently and seamlessly takes advanced logistics and a well-functioning and
well-integrated system of roads, rail, ports and airports. The State of Connecticut operates and
maintains much of that system, and partners with the private sector to maintain and operate some of it
as well. This system must be fast, but it also needs to be safe for everyone. Connecticut lies in one of
the largest economic regions of the world, and is a major supplier and importer of goods and services,
all of which rely on a properly functioning freight network. In order to keeps this system working safely
and efficiently both now and in the future, Connecticut must formulate the right policies, technologies
and investments to operate, maintain and expand the system that is in place today, and be prepared for
the changes that are coming.
The Connecticut Statewide Freight Plan is part of that preparation. It reviews the State of Connecticut’s
multi-faceted and interconnected freight system and sets a direction for policies, technologies and
investments that will help the state meet the future and thrive in it.
OVERVIEW OF FREIGHT TRANSPORTATION IN CONNECTICUT
Connecticut’s freight system is comprised of public and privately owned infrastructure. As
discussed in more detail in chapter 5, the operations for freight movements are almost entirely
conducted by the private sector, with public or quasi-public entities providing much of the
infrastructure.
In 2014, the shipments of commodities on Connecticut’s freight system contributed to business
activity valued at $58.1 billion. About one-quarter of business activity in the state is directly
related to goods movement.
Trucks move most of the freight that travels in Connecticut. Nearly 94 percent of the freight
that travels to, from or through Connecticut does so by truck (Figure ES-1). Trucks also move
over 84 percent of the fuel oil that is shipped to the state.
Connecticut is part of a national network and a gateway for freight, connecting some of the
nation’s most productive population centers just beyond our borders to the north and south
with the rest of the nation. Forty-four percent of freight movements in Connecticut are through
trips. However, Connecticut’s roads, and especially the Interstate System, carry a
disproportionate burden of this through traffic - trucks transport over 99 percent of the freight
that passes through Connecticut.
Rail accounts for a relatively small share of freight by weight. Two-thirds of Connecticut’s rail
freight shipments consist of wood products, gravel, chemicals, plastics fuel and scrap metal.
Clearance restrictions, weight restrictions, and low operating speeds diminish the effectiveness
of the 648 miles that comprise Connecticut's freight rail network.

EXECUTIVE SUMMARY Final Report
Page iv CONNECTICUT STATEWIDE FREIGHT PLAN
Figure ES-1: Connecticut Major Freight Flows by Tonnage (left)
and Value (right, $Millions)
Source: CDM Smith and IHS-Transearch data, 2914
Connecticut's pipeline system brings 97 percent of the state's natural gas shipments into the
state. The pipeline system is limited in its capacity to meet growing demand.
Scrap metal is Connecticut’s largest single export commodity by weight. Half is exported
through the Port of New Haven to international destinations. The balance is exported by truck
to New England states.
In 2016, over $2.3 billion worth of petroleum products including fuel oil was shipped through
the Port of New Haven.
JFK is a major source of air cargo that travels to and from Connecticut by truck. Bradley
International Airport shipped over $172 million in high-value goods in 2014, consisting of high
value components such as aircraft components, electrical and machinery parts as well as
consumer goods.
The Port of New York and New Jersey is the major conduit for waterborne freight to/from
Connecticut by truck.
Trucks encounter significant delay in the peak hours of travel on Interstate roads around
Connecticut’s urbanized areas. In 2016, truck delays were greatest along Interstate 95 between
New York and New Haven, and I-84 near Danbury, Waterbury and Hartford.
While Connecticut’s largest truck trading partners are its neighbors, there are significant connections
with states in the south and west as well. Figure ES-2 (left) illustrates the major freight flows by truck
to, from, and within Connecticut for 2010, and Figure ES-2 (right) depicts the 2040 truck freight
forecasts. Together, these figures illustrate the increase in freight flows - nearly 59 percent over current
levels - that are projected for Connecticut’s roads within the next 25 years.

CONNECTICUT STATEWIDE FREIGHT PLAN Page v
Final Report EXECUTIVE SUMMARY
Figure ES-2 Major Freight Flows by Truck, 2010 (left) and 2040 (right)
To, From and Within Connecticut
Source: US DOT, FHWA, Office of Freight Management and Operations, Freight Analysis Framework, version 3.4, 2012
Table ES-1 and Table ES-2 exhibit the points of exit for international exports and their value as well
as the breakdown of commodities and their value in the New England Region. Air transport is the major
freight mode for international exports from Connecticut. Air transport allows for fast, just-in-time
deliveries by businesses, saving money on inventory and logistical costs. In addition to becoming
increasingly important in international trade, air transport can involve higher costs and be subject to
delays or cancellations not experienced by other modes.1
Table ES-1: Major Points of Exit for International Exports
and Value in Connecticut, 2013
Location Export Value, 2013
JFK Int’l., NY (air) $8.2 billion
New York, NY (sea) $1.1 billion
Laredo, TX (land) $1.0 billion
Buffalo, NY (land) $653 million
Newark, NJ (sea) $557 million
Baltimore, MD (sea) $490 million
Atlanta, GA. $458 million Source: WISERTrade
1 https://www.gov.uk/transport-and-distribution-for-international-trade

EXECUTIVE SUMMARY Final Report
Page vi CONNECTICUT STATEWIDE FREIGHT PLAN
Table ES-2: Major Commodities Exported Internationally
and Value in Connecticut, 2013
Commodities Total Value, 2013
Aircraft & parts $7.7 billion
Industrial machinery $2.0 billion
Electric machinery $1.3 billion
Medical equipment $1.2 billion
Plastics $505 million
Copper $397 million Source: WISERTrade
By 2040, Connecticut freight demand is expected to grow by 57 percent or 1.7 percent annually, from
212 million to 339 million tons. Trucks will move 97 percent of this increase, assuming the mix of modes
that move freight remains the same. Figure ES-3 presents current and future freight mode shares.
These forecasts underscore the need to maintain and improve both the safety and efficiency of truck
freight, and to seek partnership opportunities that can contribute to an effective multimodal system of
cargo transport.
Figure ES-3 Total Connecticut Freight Tonnage by Mode,
2014 and 2040 (in Millions)
CDM Smith and IHS-Transearch data
SUMMARY OF FREIGHT RECOMMENDATIONS
The freight plan has been developed in conjunction with Connecticut’s Long Range Statewide
Transportation Plan (LRSTP), formerly referred to as TransformCT and Let’s Go CT!, which identifies
$100 billion in long-range improvements in expansion, preservation and modernization. This is plan is
also consistent with the 2009 Long Range Plan. A substantial proportion (nearly 80 percent) of these
improvements would have a direct benefit to freight transportation in Connecticut. Of note for the

CONNECTICUT STATEWIDE FREIGHT PLAN Page vii
Final Report EXECUTIVE SUMMARY
long-distance travel characteristic of freight movements, projects in several key interstate corridors
currently plagued with traffic congestion are prioritized for early implementation, including:
Reconstructing major bridge structures on I-84 in Waterbury and Hartford, and redesigning
major structures on in Danbury. These improvements will increase safety and operational
efficiency, and remove barriers within these cities created by the interstate.
Rebuilding and widening significant portions of I-95, in particular, the section from New Haven
to New York, where the most significant truck bottlenecks occur. CTDOT is designing options
for widening the section of the interstate from Branford, CT (east of New Haven) to Rhode
Island. To address bottlenecks on the section of I-95 from New Haven to New York, CTDOT is
looking at adding additional lanes and implementing travel demand management strategies, as
solutions, as well as significant commuter rail expansion options on the Metro North line
between New Haven and New York.
CTDOT is currently working with the state legislature, the Governor and stakeholders to identify
funding sources and administrative mechanisms for implementing many of these improvements over the
next 15 years.
The state freight plan complements the long-range multimodal plan by adding recommendations that
target goods movement in Connecticut. The recommendations encompass policy, infrastructure and
technology elements, and address larger, system-wide goals that were developed over the course of the
plan. The highlights of these recommendations include:
Addressing the state’s most significant highway freight bottlenecks, implementing the interstate
and rail capital improvement projects identified on the long-range multimodal transportation
plan.
Addressing rail freight capacity issues and working in partnership with rail operators to expand
286,000 lb. capacity over priority routes such as the New Hartford-Springfield route, and
expanding rail capacity on the Metro-North route.
Increasing the supply of truck parking in Connecticut
Modernizing technology to enforce vehicle weight limits, conduct truck inspections and conduct
credentialing operations
Improving rail technologies to improve safety through positive train control
Providing more real-time and predictive information to truck operators, regarding truck parking
availability, truck routes, hazards and incidents that impede truck travel.

EXECUTIVE SUMMARY Final Report
Page viii CONNECTICUT STATEWIDE FREIGHT PLAN
This page intentionally left blank.

CONNECTICUT STATEWIDE FREIGHT PLAN Page ix
TABLE OF CONTENTS
List of Acronyms ............................................................................................................................ i
Executive Summary ..................................................................................................................... iii
1. Introduction .......................................................................................................................... 1-1
1.1 Purpose of the Freight Plan ............................................................................................................................... 1-1
1.2 Plan Development Process ................................................................................................................................ 1-1
1.3 Freight Plan Consistency .................................................................................................................................... 1-2
1.4 Plan Organization ................................................................................................................................................. 1-2
2. Strategic Goals, Objectives, and Performance Measures ................................................ 2-1
2.1 Freight-Related Federal Performance Management Measures .................................................................. 2-3
3. Connecticut’s Freight Policies, Strategies and Institutions ............................................. 3-1
3.1 Capital Improvement Program ......................................................................................................................... 3-1 3.1.1 CTDOT Support for Freight Rail ....................................................................................................... 3-2
3.1.2 CTDOT Support for Port Operations ............................................................................................. 3-2
3.1.3 Planning Support for Freight ................................................................................................................ 3-2
3.1.4 Freight Rail ............................................................................................................................................... 3-3
3.1.5 Marine Freight ......................................................................................................................................... 3-5
3.2 Metropolitan Planning Organizations (MPOs) .............................................................................................. 3-7 3.2.1 MPO Involvement in Statewide Freight Planning ............................................................................ 3-7
3.2.2 MPO Freight Plans .................................................................................................................................. 3-8
3.2.3 Freight-Generating Land Uses Identified in MPO Reports ........................................................ 3-10
3.3 Freight Institutions ............................................................................................................................................. 3-11 3.3.1 Freight-supportive State Agencies .................................................................................................... 3-11
3.3.2 Other Northeast Freight Partners ................................................................................................... 3-14
3.3.3 Freight-Related Regulations ............................................................................................................... 3-15
4. Federal Freight Policies, Strategies, and Institutions ....................................................... 4-1
4.1 National Freight Advisory Committee ........................................................................................................... 4-1
4.2 National Freight Policy ........................................................................................................................................ 4-1
4.3 FAST Act Freight Policy and Provisions ......................................................................................................... 4-2 4.3.1 National Highway Freight Program .................................................................................................... 4-2
4.3.2 National Multimodal Freight Network .............................................................................................. 4-3
4.3.3 Critical Rural and Urban Freight Corridors .................................................................................... 4-4
4.3.4 National Freight Strategic Plan ............................................................................................................ 4-5
4.3.5 Freight Data, Planning, and Reporting ............................................................................................... 4-5
4.3.6 Freight Conditions and Performance Report .................................................................................. 4-5
4.3.7 State Freight Advisory Committees and Freight Plans .................................................................. 4-5
4.3.8 Jason’s Law ............................................................................................................................................... 4-5
4.3.9 Special Permits During Periods of National Emergency ............................................................... 4-6

Page x CONNECTICUT STATEWIDE FREIGHT PLAN
TABLE OF CONTENTS Final Report
4.3.10 Transport of Hazmat and Radioactive Materials ............................................................................ 4-6
4.3.11 Additional Freight Funding Programs ................................................................................................ 4-7
4.3.12 Metropolitan and Statewide Planning .............................................................................................. 4-11
5. Connecticut Freight Transportation Assets ...................................................................... 5-1
5.1 Highways................................................................................................................................................................. 5-1
5.2 Freight Rail ............................................................................................................................................................. 5-2
5.3 Water Transportation ........................................................................................................................................ 5-4 5.3.1 Port of New Haven ................................................................................................................................ 5-4
5.3.2 Port of Bridgeport .................................................................................................................................. 5-5
5.3.3 Port of New London ............................................................................................................................. 5-5
5.3.4 Ferry Operations .................................................................................................................................... 5-5
5.4 Air Cargo ............................................................................................................................................................... 5-5
5.5 Pipeline .................................................................................................................................................................... 5-5
6. Economic Context of Freight.............................................................................................. 6-1
6.1 Highlights ................................................................................................................................................................ 6-1
6.2 Dependence of Connecticut Industry on Freight Transportation ........................................................... 6-2 6.2.1 Businesses & Economic Dependence on Freight ............................................................................ 6-2
6.3 Industry Profile of the Connecticut Economy .............................................................................................. 6-3
6.4 Industries Driving Manufacturing Growth in the Connecticut Economy ............................................... 6-4
7. Freight Demand ................................................................................................................... 7-1
7.1.1 Freight Flow by Direction .................................................................................................................... 7-2
7.2 Trucking .................................................................................................................................................................. 7-5 7.2.1 Truck Flows From, To and Within Connecticut ............................................................................ 7-7
7.2.2 Truck Freight Types and Distances Travelled ................................................................................. 7-9
7.2.3 Commodities Carried by Truck ....................................................................................................... 7-10
7.2.4 Forecast Truck Freight Demand ....................................................................................................... 7-11
7.2.5 Major Truck Freight Generators ...................................................................................................... 7-13
7.3 Freight Rail ........................................................................................................................................................... 7-14 7.3.1 Existing Rail Freight Demand ............................................................................................................. 7-14
7.3.2 Forecast Rail Freight Demand ........................................................................................................... 7-17
7.4 Water Transportation ...................................................................................................................................... 7-17 7.4.1 Existing Port Demand .......................................................................................................................... 7-19
7.4.2 Forecast Port Demand ........................................................................................................................ 7-21
7.5 Ferry Operations ................................................................................................................................................ 7-21
7.6 Air Cargo ............................................................................................................................................................. 7-21 7.6.1 Current Air Cargo Demand .............................................................................................................. 7-21
7.6.2 Forecast Air Cargo Demand ............................................................................................................. 7-22
7.7 Pipeline .................................................................................................................................................................. 7-23
8. Condition and Performance of Connecticut’s Freight System ........................................ 8-1
8.1 Highway System .................................................................................................................................................... 8-1 8.1.1 Pavement Condition .............................................................................................................................. 8-1
8.1.2 Bridge Condition .................................................................................................................................... 8-2
8.1.3 Mobility and Congestion ....................................................................................................................... 8-3
8.1.4 Truck Freight Bottlenecks .................................................................................................................... 8-5
8.1.5 Truck Crashes ......................................................................................................................................... 8-7

CONNECTICUT STATEWIDE FREIGHT PLAN Page xi
Final Report TABLE OF CONTENTS
8.2 Freight Rail ........................................................................................................................................................... 8-10 8.2.1 Freight Rail Bottlenecks ...................................................................................................................... 8-10
8.3 Water Transportation ...................................................................................................................................... 8-10
8.4 Air Cargo ............................................................................................................................................................. 8-11
9. Stakeholder Engagement ................................................................................................... 9-1
9.1 Public Involvement During the Freight Plan’s Development ..................................................................... 9-1
9.2 Freight Plan Stakeholder Outreach .................................................................................................................. 9-2 9.2.1 Key Freight Stakeholder Interviews ................................................................................................... 9-2
9.2.2 Truck Driver Surveys ............................................................................................................................ 9-8
9.2.3 Rail Interviews ....................................................................................................................................... 9-10
9.2.4 Online Business Surveys ..................................................................................................................... 9-14
9.3 Freight Advisory Committee ........................................................................................................................... 9-15
10. Trends, Needs, and Issues ............................................................................................... 10-17
10.1 Statewide Issues and Trends ......................................................................................................................... 10-17 10.1.1 Trucking ................................................................................................................................................ 10-17
10.1.2 Freight Rail ........................................................................................................................................... 10-19
10.1.3 Water Transportation ....................................................................................................................... 10-20
10.1.4 Air Cargo .............................................................................................................................................. 10-22
10.2 National Trends and Issues ............................................................................................................................ 10-22 10.2.1 Panama Canal ....................................................................................................................................... 10-22
10.2.2 Alternate Transportation Fuels ....................................................................................................... 10-22
10.2.3 Air Quality and Regulation ............................................................................................................... 10-23
10.2.4 Climate Volatility ................................................................................................................................ 10-23
10.2.5 Emerging Technological Trends Impacting Freight..................................................................... 10-24
10.2.6 E-Commerce and Drone Delivery ................................................................................................. 10-28
10.2.7 Trucking Trends.................................................................................................................................. 10-28
11. Freight Transportation Improvement Strategy ............................................................. 11-1
11.1 General Freight Recommendations ............................................................................................................... 11-2 11.1.1 Policy........................................................................................................................................................ 11-2
11.2 Truck Freight ....................................................................................................................................................... 11-3 11.2.1 Infrastructure ......................................................................................................................................... 11-3
11.2.2 Policy...................................................................................................................................................... 11-10
11.2.3 Technology ........................................................................................................................................... 11-10
11.3 Freight Rail ......................................................................................................................................................... 11-12 11.3.1 Infrastructure ....................................................................................................................................... 11-12
11.3.2 Policy...................................................................................................................................................... 11-14
11.3.3 Technology ........................................................................................................................................... 11-15
11.4 Maritime Freight ............................................................................................................................................... 11-15 11.4.1 Infrastructure ....................................................................................................................................... 11-15
11.4.2 Policy...................................................................................................................................................... 11-16
11.5 Air Cargo ........................................................................................................................................................... 11-17 11.5.1 Infrastructure ....................................................................................................................................... 11-17
11.5.2 Policy...................................................................................................................................................... 11-17
12. Freight Investment Plan .................................................................................................... 12-1
13. Bibliography ........................................................................................................................ 13-1

Page xii CONNECTICUT STATEWIDE FREIGHT PLAN
TABLE OF CONTENTS Final Report
LIST OF TABLES
Table ES-1: Major Points of Exit for International Exports and Value in Connecticut, 2013 .......................... v
Table ES-2: Major Commodities Exported Internationally and Value in Connecticut, 2013 ......................... vi
Table 2-1: Connecticut Freight Plan Performance Measures .............................................................................. 2-4
Table 3-1: Port Strategies Study, Recommended Investment Strategies ......................................................... 3-6
Table 3-2: Port Strategies Study, Recommended Policies and Implementation Actions .............................. 3-7
Table 5-1: Connecticut Freight Railroad Right-of-way Miles .............................................................................. 5-3
Table 8-1 : Commercial Vehicle and All Motor Vehicle Crashes by Year (2009 – 2014) ........................... 8-7
Table 8-2 : Commercial Vehicle Crashes Involving Pedestrians by Severity (2009 – 2014)........................ 8-7
Table 8-3: Commercial Vehicle Crashes Involving Pedestrians by Severity (2009 – 2014) ......................... 8-8
Table 9-1: Stakeholder Interviews ............................................................................................................................. 9-2
Table 9-2: Freight Rail Carrier Interviews ............................................................................................................. 9-11
Table 11-1: Freight-Beneficial Highway Projects .................................................................................................. 11-4
Table 11-2: Roadway Bridge Improvement Project ............................................................................................ 11-7
Table 11-3: Freight-Beneficial Projects Identified in
Long Range Statewide Transportation Plan (LRSTP) ......................................................................... 11-13
Table 11-4: Freight-Beneficial Port Projects Identified in
Long Range Statewide Transportation Plan (LRSTP) ......................................................................... 11-16
Table 12-1: Freight Projects Chosen for NHFP Funds ....................................................................................... 12-2
LIST OF FIGURES
Figure ES-1: Connecticut Major Freight Flows by Tonnage (left) and Value (right, $Millions) ...................... iv
Figure ES-2 Major Freight Flows by Truck, 2012 (left) and 2040 (right)
To, From and Within Connecticut, 2012 ..................................................................................................... v
Figure ES-3 Total Connecticut Freight Tonnage by Mode, 2014 and 2040 (in Millions) ................................. vi
Figure 1.1: Freight Plan Development Process ....................................................................................................... 1-2
Figure 2.1: Alignment of Freight Plan Goals with Connecticut Statewide Transportation Plan and
National Freight Goals................................................................................................................................... 2-2
Figure 3.1: Connecticut Councils of Government and Metropolitan Planning Organizations .................... 3-9
Figure 4.1: Primary Highway Freight Network, Connecticut .............................................................................. 4-2
Figure 4.2: National Highway Freight Program ....................................................................................................... 4-3
Figure 5.1: State Maintained Roads, Miles ................................................................................................................ 5-1
Figure 5.2: National Highway System Roads ........................................................................................................... 5-2
Figure 5.3: Rail Operators in Connecticut, and Ownership ................................................................................ 5-3
Figure 5.4: Connecticut Deep Water Commercial Ports .................................................................................... 5-4
Figure 6.1: Trends in the Major Industry Sector Shares of the Connecticut Economy, 2008 – 2042 ...... 6-4
Figure 6.2: Composition of Output of Top Industries Driving the Connecticut
Primary Manufacturing Sector to 2042 ..................................................................................................... 6-5
Figure 6.3: Composition of Output of Top Industries Driving the Connecticut
Secondary Manufacturing Sector to 2042 ................................................................................................. 6-6

CONNECTICUT STATEWIDE FREIGHT PLAN Page xiii
Final Report TABLE OF CONTENTS
Figure 6.4: Connecticut State Inbound Freight Map, Total All Commodities,
All Modes of Transport by County, 2013 ................................................................................................. 6-6
Figure 6.5: Connecticut State Outbound Freight Map, Total All Commodities,
All Modes of Transport by County, 2013 ................................................................................................. 6-7
Figure 7.1: Mode Share of Freight Moved in Connecticut by Tonnage (Millions), 2014 .............................. 7-1
Figure 7.2: Mode Share of Freight Moved in Connecticut by Value ($Millions), 2014 ................................. 7-2
Figure 7.3: Connecticut Freight Moved by Direction, Tons (Millions) and Value ($Millions), 2014.......... 7-2
Figure 7.4: Connecticut Freight Moved by Direction and Mode (Percentage by
Weight on Left, Value on Right), 2014 ...................................................................................................... 7-3
Figure 7.5: Connecticut Top 10 Commodities (Percentage by Weight), 2014 .............................................. 7-4
Figure 7.6: Connecticut Freight Volume Moved by Truck by Route, 2014 ..................................................... 7-5
Figure 7.7: Connecticut Freight Value Moved by Truck by Route, 2014 ......................................................... 7-6
Figure 7.8: Top Outbound Truck Shipments by Tonnage (with county of origin), 2014 ............................. 7-7
Figure 7.9: Top Inbound Truck Shipments by Tonnage (with county of destination), 2014 ....................... 7-8
Figure 7.10: Distribution of Connecticut Truck Freight Travel by Distance, 2014
(Trips, excluding through travel)................................................................................................................. 7-9
Figure 7.11: Tonnage of Top Five Commodities Shipped by Truck, 2014 ..................................................... 7-10
Figure 7.12: Value of Top Five Commodities Shipped by Truck 2014 ........................................................... 7-11
Figure 7.13: Connecticut Truck Freight Tonnage Growth, 2014-2040 .......................................................... 7-12
Figure 7.14: Location of Major Truck Freight Generators ................................................................................ 7-13
Figure 7.15: Connecticut Freight Rail Tonnage, 2014 ......................................................................................... 7-14
Figure 7.16: Rail Freight Tonnage by Operator, 2014 ........................................................................................ 7-15
Figure 7.17: Top Five Commodities Shipped by Rail by Tonnage (Thousands), 2014 ................................ 7-16
Figure 7.18: Top Five Commodities Shipped by Rail by Value ($ Millions), 2014 ........................................ 7-16
Figure 7.19: Forecast of Truck Freight Growth (by tonnage), 2014-2040 .................................................... 7-17
Figure 7.20: Value of Port Trade by State, 2016 .................................................................................................. 7-19
Figure 7.21: Value of Trade by Connecticut Port, 2016 .................................................................................... 7-19
Figure 7.22: Commodities Shipped from and to Port of Bridgeport, by Value, 2016 ................................. 7-20
Figure 7.23: Commodities Shipped from and to Port of New Haven, by Value, 2016 ............................... 7-20
Figure 7.24: Commodities Shipped from and to New London, by Value, 2016 ........................................... 7-20
Figure 7.25: Air Cargo Handled at Bradley International Airport, by Weight (pounds, 2014) ................ 7-22
Figure 7.26: Air Cargo Handled at Bradley International Airport, by Value ($millions, 2014) ................. 7-22
Figure 8.1: 2011-2015 Condition of National Highway System Roads ............................................................. 8-1
Figure 8.2: Percent of State Maintained Bridges in a State of Good Repair (2011) ....................................... 8-2
Figure 8.3: Recurring Slow Speed Locations on the Connecticut Highway System (2016)......................... 8-4
Figure 8.4: Truck High Congestion Locations, 2016 ............................................................................................. 8-6
Figure 8.5: Commercial Vehicle Crashes, Contributing Factors, (2009-2014) ............................................... 8-9
Figure 9.1: Major Issues Identified by Truck Freight Stakeholders .................................................................. 9-10
Figure 9.2: Major Issues Identified by Rail Freight Stakeholders ...................................................................... 9-14
Figure 10.1: Locations of Sanctioned and Unsanctioned Truck Parking, 2017 ........................................... 10-18
Figure 10.2: Age of the System ............................................................................................................................... 10-19
Figure 10.3: Locations of Weigh Stations, 2017 ................................................................................................. 10-27

Page xiv CONNECTICUT STATEWIDE FREIGHT PLAN
TABLE OF CONTENTS Final Report
APPENDICES (UNDER SEPARATE COVER)
Appendix A – IHS-Transearch Freight Movements
Appendix B – Economic Context of Freight Transportation in Connecticut

CONNECTICUT STATEWIDE FREIGHT PLAN Page 1-1
1. INTRODUCTION
Every business and resident in Connecticut depends on the freight transportation system of roads,
terminals, waterways, airports and pipelines for the commodities they use daily. Every investment in the
transportation system that increases throughput, improves efficiency and reduces costs has a direct
positive impact on Connecticut’s economy. At the same time, freight transportation requires significant
expenditures of energy to move large quantities of industrial and consumer goods over long distances,
and the many agencies and businesses that develop policies, investments and programs to understand
and mitigate the risks of freight transportation, do so to improve environmental quality and improve
safety for all transportation system users.
1.1 PURPOSE OF THE FREIGHT PLAN
The CTDOT Statewide Freight Plan (Freight Plan) serves the residents and businesses of the State of
Connecticut to improve freight transportation by identifying the state’s unique needs, recommending
policies, and devising implementation strategies. The Freight Plan considers highway, freight rail, aviation,
port and waterway needs. The Freight Plan also describes the pipeline system, but does not provide
investment or policy recommendations for it. This Plan is prepared in accordance with, and pursuant to
Fixing America’s Surface Transportation Act (FAST ACT) (Pub. L. No. 114-94). The Plan is required in
order for Connecticut to receive funding under the National Highway Freight Program (23 U.S.C 167)
and must comprehensively address the State’s freight planning activities and investments.
The Freight Plan is a long-term (25-year) perspective on the needs and issues of the freight
transportation system. How and where freight move depends on many factors, including infrastructure
condition and capacity, economic conditions and competitiveness, consumer demand, government
regulations, transport technologies, international politics, and trade policies. These factors are in flux,
making long-term predictions and recommendations more useful as a guide for establishing general
priorities than as specific prescriptions. The Freight Plan takes a short-term view as well, and considers
the value of the current State Transportation Improvement Program (STIP) to freight transportation.
1.2 PLAN DEVELOPMENT PROCESS
The Freight Plan is the product of extensive discussions with public and private sector partners
combined with an in-depth analysis of the condition and performance of the state’s freight
transportation system (Figure 1.1). This process ensured that the Plan’s products and strategies were
founded on goals and objectives shared by CTDOT and its partners, and that it reflected analysis based
on sound data, the insights of experts from industry and the public sector, as well as the expectations of
users of the freight transportation system.

Page 1-2 CONNECTICUT STATEWIDE FREIGHT PLAN
STRATEGIC GOALS, OBJECTIVES AND PERFORMANCE MEASURES Final Report
Figure 1.1: Freight Plan Development Process
1.3 FREIGHT PLAN CONSISTENCY
This Freight Plan is consistent with the current Long-Range Transportation Plan, “Connecticut on the
Move, Strategic Long Range Transportation Plan, 2009” and the draft Long Range Plan update under
development, referred to as the “Connecticut Statewide Long Range Multimodal Transportation Plan,
2017” as well as the federal transportation legislation Moving Ahead for Progress in the 21st Century (MAP-
21) Act in 2012 and the current legislation, Fixing America’s Surface Transportation (FAST) Act in 2015.
1.4 PLAN ORGANIZATION
The Freight Plan consists of technical analyses, policy reviews, outreach, and consideration of regulatory
requirements organized into the following chapters:
Chapter 2 – Strategic Goals, Objectives, and Performance Measures
Chapter 3 – Connecticut’s Decision-Making Process
Chapter 4 – Freight Policies, Strategies, and Institutions
Chapter 5 – Stakeholder Engagement
Chapter 6 – Economic Context of Freight
Chapter 7 – Freight Demand
Chapter 8 – Freight Transportation Assets
Chapter 9 – Condition and Performance of the Freight System
Chapter 10 – Trends, Needs, and Issues
Chapter 11 – Freight Transportation Improvement Strategy
Chapter 12 – Freight Investment Plan
Chapter 13 – Bibliography of Plans Reviewed
Additional technical resources provide greater detail in several appendices, as referenced throughout
this document.
Data/Analysis
Existing Conditions/ Bottlenecks/Needs
Economic Context
Future Demand
Products
Vision, Goals, Objectives, Performance Measures
Recommendations Best Practices
Freight Transportation Improvement Strategy
Outreach
Freight Working Group
Stakeholder Interviews
Online Survey/Truck Driver Interviews
Regional Partners

CONNECTICUT STATEWIDE FREIGHT PLAN Page 2-1
2. STRATEGIC GOALS, OBJECTIVES, AND
PERFORMANCE MEASURES
Coordinated and mutually-reinforcing strategic goals provide the framework for implementing the
Connecticut Statewide Freight Plan in a consistent way across federal, state, regional, and local planning
efforts. The Freight Plan goals and objectives were established in collaboration with freight stakeholders
(refer to Chapter 5) and after reviewing various regional, state and federal plans related to freight
transportation (see Bibliography). They reflect the National Freight Policy goals and multimodal
transportation goals established in the draft Connecticut Long Range Statewide Plan, and Connecticut’s
State Rail Plan.
The freight goals and objectives address Connecticut’s freight transportation system needs and articulate
a consensus of thought about the future performance of the freight network. They also helped CTDOT
identify potential new policies and establish performance measures for assessing and prioritizing future
investments. Each goal is aligned with one or more objectives that describe the specific and measurable
actions needed to achieve Connecticut’s Freight Plan goals.
Goal 1: Safety and Security
Objective: Enhance the safety and security of the freight transportation system in all modes.
Goal 2: Economic Competitiveness and Efficiency
Objective: Support economic competitiveness, efficiency, and development through investment
in the freight transportation system. Work with the private sector to identify needs and
deficiencies.
Goal 3: Optimized Operations & Performance
Objective: Attain and maintain adequate capacity and operational efficiency in the Connecticut
freight system. Support the use of Intelligent Transportation Systems and technologies. Enhance
the efficiency of the movement of goods into, out of, and throughout the State. Aim to improve
the resilience of the freight system to extreme events or changes in travel demand.
Goal 4: State of Good Repair
Objective: Proactively maintain freight system infrastructure to preserve CTDOT’s capital
investments.
Goal 5: Environmental Protection & Livability
Objective: Ensure that improvements to the freight system do not negatively impact the
environment and help improve the quality of life for Connecticut residents and visitors.

Page 2-2 CONNECTICUT STATEWIDE FREIGHT PLAN
STRATEGIC GOALS, OBJECTIVES AND PERFORMANCE MEASURES Final Report
Goal 6: Program and Service Delivery
Objective: Deliver projects and services faster, cost-effectively and with greater customer
satisfaction. Create strong partnerships with state agencies, local governments, neighboring
states and the private sector to foster collaboration, improve program delivery and facilitate
public-private partnerships.
The 2015 passage of the current federal surface transportation legislation, FAST Act, brought a new
focus on the importance of goods movement to the U.S. economy. The FAST Act establishes a new
formula program for highway freight projects, emphasizes the need to address large-scale projects of
national and regional significance by establishing a new competitive grant program, and improves upon
the National Freight Network created under the MAP-21. While the Connecticut freight plan will guide
project investments that will enhance the efficiency and effectiveness of the transportation system, it will
also further the national freight policy goals of economic competitiveness and efficiency; congestion
reduction; productivity; safety, security, and resilience of freight movement; infrastructure condition; use
of advanced technology; performance, innovation, competitive and accountability in the operations and
maintenance of the network, and mitigation of environmental impacts.
Figure 2.1 illustrates the alignment of the Freight Plan goals with National freight goals and the
Connecticut Statewide Transportation Plan.
Figure 2.1: Alignment of Freight Plan Goals with Connecticut Statewide
Transportation Plan and National Freight Goals

CONNECTICUT STATEWIDE FREIGHT PLAN Page 2-3
Final Report STRATEGIC GOALS, OBJECTIVES AND PERFORMANCE MEASURES
2.1 FREIGHT-RELATED FEDERAL PERFORMANCE MANAGEMENT
MEASURES
CTDOT has a long history of measuring the condition and
performance of its transportation system, and basing its
investment decisions on the data it collects and analyzes.
FHWA has gradually introduced a national transportation
performance management system to monitor and base
investment decisions on transportation performance.
CTDOT is implementing this system, which encompasses
system condition, safety, air quality and congestion and
mobility performance considerations. These system-wide
highway measures address the condition and performance of
the shared use highway system, which serves many travel
markets, including long- and short-distance freight needs.
To ensure that the Freight Plan benefited from the best ideas
and input from all CTDOT divisions regarding freight
performance, CTDOT’s planning staff assembled a cross-
disciplinary group (aka the freight working group) to consider
and assess various alternative measures. After considering this
plan’s draft goals and objectives, and reviewing the available
data, CTDOT’s existing performance measures as well as
practices and approaches adopted by other transportation
agencies in other states, the freight working group concluded that a measurement approach focused on
success in implementation would be best. Specifically, they recommended that CTDOT use the freight-
relevant performance measures that are required as part of the current performance management
framework established in law, as listed in Table 2-1.
The working group saw performance measures as a way to monitor the success of plan implementation.
By tracking performance over time, CTDOT will understand whether the plan’s recommendations are
being implemented and to what extent they help to achieve intended outcomes.
Table 2-1 outlines the federal performance measures that are relevant for freight performance and that
state transportation agencies are required to provide by federal statute. By October 2018, states will
submit a baseline performance report and subsequently provide reports every four years, as well as
interim performance reports and interim targets. The reports will describe performance targets that
have been set by the state and by MPOs. States will describe the actions they have taken to meet their
targets and their progress towards achieving them. The FHWA is providing some of the data and
analytical framework (on travel time data, for example) to assist the states in setting targets and
reporting on progress. Agencies that cannot achieve their targets within the period of performance are
expected to explain the reasons for the differences between the desired and actual outcomes.
Working Group Insights on
Performance Management
“Thinking about how to measure
progress both in freight and in
implementing the freight plan is the
best chance of success for a freight
strategy. An initial focus can be on
implementation of the freight plan
itself, since this will be the best
understood and controllable phase
of executing a strategy.”
“The performance measures already
identified as part of the planning
process are very good.”

Page 2-4 CONNECTICUT STATEWIDE FREIGHT PLAN
STRATEGIC GOALS, OBJECTIVES AND PERFORMANCE MEASURES Final Report
Table 2-1: Connecticut Freight Plan Performance Measures
National Freight Goal Area Relevant Performance Measure
Safety, Security and Resilience
Number and rate of traffic fatalities
Number and rate of serious injuries
Number of non-motorized fatalities and non-motorized serious
injuries
State of Good Repair
Percentage of National Highway System bridges classified in good
condition
Percentage of National Highway System bridges classified in poor
condition
Percentage of Interstate pavements in good condition
Percentage of Interstate pavements in poor condition
Percentage of non-Interstate National Highway System pavements in
good condition
Percentage of non-Interstate pavements in poor condition
Livability and Resilience
Air quality criteria emission levels in areas that have not met
standards: Volatile Organic Compounds, Nitrous Oxides, Carbon
Monoxide, and particulate matter (PM10/PM2.5)2
Economic Competitiveness and
Economic Efficiency Annual hours of peak hour excessive delay per person3
Economic Competitiveness and
Economic Efficiency Truck Travel Time Reliability on the Interstate System
Following the phase in period and within 6 years, the CTDOT should adapt the performance framework
to be more freight-focused. The measures listed below should be reported for the freight-intensive
network components, including the Primary Highway Freight Network, and Critical Rural and Urban
Freight Corridors. The Plan recommends that CTDOT also report on those portions of the network
where higher proportions of truck traffic are expected.
2 Greenhouse gas emissions measure had not been determined at the time of this writing 3 For areas over 1 million population by 2018 and 200,000 population, in 2022 and beyond

CONNECTICUT STATEWIDE FREIGHT PLAN Page 3-1
3. CONNECTICUT’S FREIGHT POLICIES,
STRATEGIES AND INSTITUTIONS
Freight policies guide the development and implementation of a freight plan. They provide the
framework for the actions to be taken, in order to understand and improve the movement of goods.
Statewide freight plans are guided by not only state policies, but also those at the federal level. Federal
policies must be complied with to take advantage of federally-supported freight programs, initiatives and
projects. This chapter documents the state freight policies and the institutions that support them. It also
reviews several long-range planning efforts that support freight movement.
3.1 CAPITAL IMPROVEMENT PROGRAM
The mission of the Connecticut Department of Transportation (Department) is to provide a safe and
efficient intermodal transportation network that improves the quality of life and promotes economic
vitality for the State and the region. The CTDOT 5-year Capital Program is the most important source
of support for the public component of the state’s multimodal freight system. Each year, CTDOT
publishes the details of the program, which describes the funding allocations and priorities for right-of-
way acquisition, planning, design, engineering and construction activities for road, bridge, public
transportation and other transportation facilities improvements.
While the program is led by and is the responsibility of CTDOT, it is the product of collaboration with
MPOs, local elected officials and other state agencies. In particular, CTDOT coordinates the Capital
Improvement Program’s development with Metropolitan Planning Organizations, as they develop their
Transportation Improvement Programs. This coordination ensures that transportation investments are
mutually reinforcing, compatible and timed to minimize traveler disruption and inconvenience.
CTDOT’s process for prioritizing projects includes the requirements of federal funding programs, state
requirements and legislative directives. Broadly speaking, the priorities are described in long-range
planning documents and in strategic planning documents, both of which are updated regularly to reflect
changing initiatives, needs and resource outlooks. Safety and state of good repair have always been the
DOT’s top priority, and CTDOT’s data systems (e.g. bridge inspection and pavement condition
databases) have provided much of the raw condition and performance information needed to recognize
and assign resources to the top priorities. Capital expansion decisions have always been based on
factors such as criticality of need and the potential for realizing mobility, safety and economic
development objectives, but equity has been a consideration as well.

Page 3-2 CONNECTICUT STATEWIDE FREIGHT PLAN
CONNECTICUT’S FREIGHT POLICIES, STRATEGIES AND INSTITUTIONS Final Report
3.1.1 CTDOT Support for Freight Rail
Connecticut’s freight rail system is owned and operated by several private rail companies, AMTRAK,
and CTDOT. Public funds for rail capital improvements are allocated through the CTDOT capital
budget, which is approved by the state legislature annually. Improvements to the CTDOT-owned rail
system, as well as the administration and execution of the private rail support programs described
below are funded through this process.
CTDOT manages several programs that support the private rail
freight system, including: The Railroad Tax Exemption Program
(TEP) and two grant programs.
The Railroad Tax Exemption Program allows rail operators to
reduce their gross earnings tax by an amount equivalent to capital
investments made on a dollar-for dollar basis to upgrade or
maintain their physical plant in Connecticut. Such projects are
determined by the Commissioner of Transportation to be
necessary and in the public interest. Participating railroads are
subject to a monthly reporting requirement, regular compliance
reviews and a yearly audit. A formal certification of eligibility by
the Commissioner of Transportation must be provided to the
Governor and the Chairpersons of the Transportation and
Finance, Revenue and Bonding Committees annually.
Grants for Commercial Freight Rail Lines. CTDOT is authorized to use up to $7.5 million in
General Obligation bonds annually to provide competitive matching grants for commercial freight rail
lines operating in Connecticut. Recipients must use the grants to improve, repair, and modernize
existing rails, rail beds, and related facilities. Preference is given to projects that improve at-grade
crossings to eliminate hazards or increase safety, and that connect to major freight generators.
The state also offers up to $2.5 million in Special Tax Obligation bonds to CTDOT for establishing a Fix-
It-First Program to repair, upgrade, or eliminate at-grade railroad crossings in Connecticut.
3.1.2 CTDOT Support for Port Operations
CTDOT supports the management and oversight of the Connecticut Port Authority (CPA) in providing
funds for port improvements through the capital improvement program. The CPA relies on state bond
funds, administered through the Department of Economic and Community Development or the
Department of Transportation, for port improvements, dredging and property acquisition.
3.1.3 Planning Support for Freight
Connecticut’s transportation system is owned, managed and operated by state, regional and city/town
agencies. These agencies coordinate their planning and operations activities through informal consensus
as well as through various federal and state statutes. CTDOT owns and operates most of the line-haul
portions of the truck freight system, while municipalities manage many of the last mile connections.
Bonds
General obligation bonds finance
the construction of public
infrastructure projects. They are
backed by the “full faith and
credit” of the state. Special tax
obligation bonds finance highway
projects. the state’s motor fuels
tax, motor vehicle registrations,
licenses and fees repay the debt
on the bonds.

CONNECTICUT STATEWIDE FREIGHT PLAN Page 3-3
Final Report CONNECTICUT’S FREIGHT POLICIES, STRATEGIES AND INSTITUTIONS
Long-range planning is a long-established component of that coordination. The long-range plans that the
DOT and its partners work together to create, establish priorities for expansion, preservation and
policy that are intended to influence short- and mid-term decisions.
Trucking
The Governor’s $100 billion long-range transportation improvement initiative, “Let’s Go CT”
represents a complete transformation of the state’s transportation infrastructure. The initiative calls for
rebuilding parts of the system that are beyond their useful life to meet current design and performance
standards and expanding capacity on several of the line haul, high volume portions of the highway and
rail systems. The expansion and preservation projects of most potential benefit to truck freight include:
Major highway expansion projects on portions of I-95, I-91 and I-84, whose estimated cost is
$12.9 billion, of a $13.8 billion highway enhancement program
Development of a commercial vehicle information system ($47.0 million)
Major highway and bridge preservation projects ($17.5 billion)
Expansion of truck rest area facilities ($196 million)
3.1.4 Freight Rail
The CTDOT 2012 Connecticut State Rail Plan identified several freight-related rail goals and objectives.
These are summarized below:
Increase freight rail usage by 25 percent over the next 20 years to reduce truck traffic and
energy consumption
Promote port connectivity by removing existing obstacles and through capital infrastructure
improvements
Explore alternative freight corridor options
Identify public funding resources
Coordinate with Metro North, the operator of the New Haven commuter rail Line, to install
monitoring equipment to detect overloads and defective wheels on passenger and freight trains
Develop a strategic plan for rail freight movements.
Form partnerships with Class 1 railroads and short haul operators.
Partner with northeast states to develop a vision for rail freight.
Support a rail freight investment program.

Page 3-4 CONNECTICUT STATEWIDE FREIGHT PLAN
CONNECTICUT’S FREIGHT POLICIES, STRATEGIES AND INSTITUTIONS Final Report
Continue to support improvements at public highway/rail grade crossings to maintain safe
conditions. Develop a new Connecticut Railroad Bridge Management Program to evaluate
bridges’ routes to determine the feasibility of loading rail cars to the 286,000-pound full
potential in Connecticut to promote economic growth, reduce fuel use, and reduce truck traffic
on the state’s highway system.
Support efforts to increase clearances to 19 feet 6 inches or above on rail lines not encumbered
by overhead catenary wire to permit the movement of larger cars in Connecticut that would
allow a railroad with the ability to increase service or capture additional markets.
Revitalize intermodal facilities/and inland ports in the state to serve the rapidly growing
container segment of rail traffic that will help remove long-haul trucks from highways and deliver
products to consumers faster.
Recommended Investment Strategies
The State Rail Plan also identified growth and investment strategies for freight rail:
Emphasize the preservation of the existing system
– Invest first in projects and initiatives that maintain and improve the transportation system in
areas where the infrastructure is already in place.
– Correct hazardous or potentially hazardous situations to avoid magnification of associated
safety issues.
– Provide for routine maintenance and upgrading of components of the rail system such as
tracks, bridges and structures, power systems, rolling stock, rail stations, maintenance
facilities, etc.
Promote efficient system management and operation.
Support, when efficient and effective, expanded and improved rail passenger services, rail parking
facilities and rail stations, rail freight and improved access to airports and ports.
– Undertake the rail capital projects and provide the transportation services for which the
Governor and the Connecticut General Assembly have authorized funding.
– Develop a plan for expanding rail freight in Connecticut and the surrounding region,
including the state’s commercial ports.
– Support strategies and tactics adopted by Bradley Airport Board of Directors to strengthen
passenger and freight service.
– Implement the recommendations of the Connecticut Maritime Commission with respect to
all ports in Connecticut.
– Work with stakeholders to identify and prioritize needs, and advocate for funding and other
resources required to support accessibility and mobility improvement projects across
transportation modes for people and for freight to address the needs.
– Identify and explore opportunities to enter into public/private partnerships to identify ways
to improve transportation services and facilities and to fund such projects and initiatives.
Collaborate with the freight railroads in maintaining and growing interconnectivity of the state
rail freight system with the national network as a priority.

CONNECTICUT STATEWIDE FREIGHT PLAN Page 3-5
Final Report CONNECTICUT’S FREIGHT POLICIES, STRATEGIES AND INSTITUTIONS
Focus on investing in capital projects on individual rail segments using a measured approach to
increase overall systems capacity. Priority investments include track and bridge improvements,
crossing upgrades or replacement, improvements in drainage, culverts, and clearance limits, and
other improvements to strengthen first-mile/last-mile interchange, off-loading, and other
shipment connection points.
Recommended Priority Investments
The State Rail Plan also identified priority investments by railroad operator listed below:
New Haven-Hartford-Springfield Line:
– Rehabilitate the Windsor Locks-Enfield Connecticut River Bridge to support 286,000-lb.,
industry-standard load.
– Rehabilitate Harford Union Station elevated track to support 286,000-lb., industry-standard
load.
New Haven Line (NHL) (including branch lines)
– Rehabilitate bridges and elevated track to handle the 286,000-lb., industry-standard load.
New England Central Railway (NECR)
– Raise clearances for Phase II double-stack containers between Willimantic and New London.
3.1.5 Marine Freight
As described in the Connecticut’s Deep-Water Port Strategy Study (2012), the State of Connecticut is
committed to reversing the decline of its three deep water ports and their related industries. As
outlined in Table 3-1 and Table 3-2, the following recommended strategies, policies, and actions were
summarized from this study.

Page 3-6 CONNECTICUT STATEWIDE FREIGHT PLAN
CONNECTICUT’S FREIGHT POLICIES, STRATEGIES AND INSTITUTIONS Final Report
Table 3-1: Port Strategies Study, Recommended Investment Strategies
Recommendation Implementation/Rationale
Protect and enhance liquid bulk and related energy
uses
The flow of petroleum products through the ports is
critical to Connecticut’s economy and its energy
future
Will pay economic dividends to every sector of the
Connecticut economy, over time
Significant investment in liquid bulk and related energy
infrastructure already in place at the three ports
Protect and enhance shipyard and ship repair services
The private Thames shipyard in New London is the
largest non-cargo employer among the three ports
The State should streamline the regulatory processes
for ship repair and ship building
Increase dry bulk and break-bulk cargoes (Required
investments: Up to $11 million for increased rail
access to New Haven, up to $14 million for North
Yard expansion, and up to $40 million for capital
incentive improvements in New London)
Extend the ports’ serviceable reaches into competitive
regional markets
Existing flows of salt, sand, and cement are tied to
immediate local demand (highly captive and stable
markets)
Do not commit State capital without similar private
commitment
Increase scrap metal exports (Required investments:
Up to $400k/year for public benefit grants
Connecticut’s largest export commodity by weight, of
which the majority is trucked to ports outside of the
State
In order to capture a larger market share,
Connecticut should partner with the three large
processors, encourage smaller dealers by developing a
statewide brokering system, and offer incentives as
“heavyweight” containers on barge to divert traffic
from congested I-95 corridor
Attract wood pellet exports (Required investments:
$2-12 million for specialized handling equipment and
improvements)
Leverage existing rail connectivity: New England
Central Railway provides direct access to Canadian
and northern New England forestry production
centers and has on-dock rail at the State Pier
Support the investment in specialized infrastructure,
to attract wood pellet flows through New London
Compete for break bulk lumber, copper and steel
imports (Required investments: Up to $11 million for
new rail connections)
Break bulk commodities have traditionally been
handled efficiently at the ports
New Haven and New London could increase lumber
and/or copper imports if/when housing construction
rebounds in the Northeast and can also compete for
various steel products
Leverage existing rail connectivity to reach markets
located in New England, Canada and the Midwest
Evaluate fresh food imports
Had historically been a valuable tenant at Bridgeport,
but was attracted to competing regions due to
inadequate port maintenance/infrastructure
One potential fresh food anchor is the scallop and
shellfish fleet in New London

CONNECTICUT STATEWIDE FREIGHT PLAN Page 3-7
Final Report CONNECTICUT’S FREIGHT POLICIES, STRATEGIES AND INSTITUTIONS
Table 3-2: Port Strategies Study, Recommended Policies
and Implementation Actions
Recommendation Implementation/Rationale
Fund New Haven Channel and Small Marina Dredging
(Required investments: $1 million/year for small
harbor dredging and up to $10 million for New Haven
dredging)
New Haven is the state’s most important cargo facility
and its current business is threatened by shoaling and
poor channel maintenance
Revise State Pier solicitation process (Required
Investments: Up to $10 million depending on specific
cargo commitments)
The State should revise its solicitation process to seek
a long-term public-private partnership
Existing short-term leases and rent structures do not
incentivize/reward cargo growth
Support BPA’s effort to retain ship repair services at
the former Bridgeport/Derecktor Shipyard (Required
Investments: Up to $5 million depending on specific
business commitments)
Significant state capital has already been spent on
buildings and equipment at the Shipyard for which a
return on investment should be sought
The State has financial interest in returning economic
activity to the Derecktor Shipyard and attracting a
tenant that does not harm either adjacent uses in
Bridgeport or other CT shipyards
Create Market-Based Grant-in-Aid Program (Required
Investments: Up to $8 million/year)
Leverage private sector investment and private sector
employment
Reflect, anticipate and respond to changes in local,
regional, national and international cargo and non-
cargo markets
Fund infrastructure and capital investments only when
complementary private investments or business
activities are committed
Support specific cargo or business activity goals (e.g.
number of trucks diverted from I-95 or number of
tons of emissions reduced or acres of wetlands
restored with dredge material)
3.2 METROPOLITAN PLANNING ORGANIZATIONS (MPOS)
3.2.1 MPO Involvement in Statewide Freight Planning
Metropolitan Planning Organizations (MPOs) serve a critical role in Connecticut’s statewide freight
planning efforts. According to guidance established by the Federal Highway Administration (FHWA),
individual MPOs may initiate and pursue freight-related plans and studies for their respective regions, but
there is no federally mandated requirement that an MPO develop any type of separate freight
component in their long-range plans. When completed, an MPO’s freight-specific or freight-related plans
and studies can inform statewide efforts on a region-by-region basis because of their focus on local
issues that may have statewide ramifications.

Page 3-8 CONNECTICUT STATEWIDE FREIGHT PLAN
CONNECTICUT’S FREIGHT POLICIES, STRATEGIES AND INSTITUTIONS Final Report
3.2.2 MPO Freight Plans
Connecticut is made up of nine regional Councils of Governments, which function as the host agencies
for Connecticut’s eight Metropolitan Planning Organizations (MPOs) and two rural transportation
planning organizations.
Capitol Region Council of Governments
Connecticut Metropolitan Council of Governments
Lower Connecticut River Valley Council of
Governments
Naugatuck Valley Council of Governments
Northeastern Connecticut Council of Governments
Northwest Hills Council of Governments
South Central Regional Council of Governments
Southeastern Connecticut Council of Governments
Western Connecticut Council of Governments
Out of Connecticut’s eight MPOs (Figure 3.1), six have
recently completed or have begun work on regional
transportation plans that are freight-specific in nature or
contain freight-related topics.
Capitol Region Council of Governments (CRCOG)
CRCOG Freight Infrastructure: As a part of its 2016-2017 Unified Planning Work Program,
CRCOG conducted an analysis of the region’s existing freight transportation infrastructure, and
identified limitations of freight network connectivity within the region, as well as overall freight
network constraints within Connecticut and New England.
CRCOG has been involved in the development of the Connecticut Department of
Transportation’s Statewide Freight Plan, and has been supporting CTDOT as needed with
document review, stakeholder outreach, and meeting involvement.
Freight Movement in the Hartford Metropolitan Area: A Regional Freight Market Overview
(2005): This study was commissioned by CRCOG in cooperation with the former Central
Connecticut Regional Planning Agency and Midstate Regional Planning Agency. The report
develops a baseline of freight movement activity that can be used to incorporate freight into the
regional transportation planning process, as well as a methodological framework for future
public-private partnerships in freight.
Western Connecticut Council of Governments (WestCOG) *
South Western Region Freight Overview (2010): Completed in 2010 and updated in 2013, the
South Western Region Freight Overview describes the region’s freight system and presents
trends that may impact the freight system over the next twenty to thirty years. The report
identifies key elements of the freight transportation system in Southwestern Connecticut,
describes the movement of goods through the region, and recognizes the safe, efficient, and
economical movement of goods as an integral component of the region’s multi-modal
transportation system.
COGS and MPOs
Councils of Government are
governing and/or coordinating
bodies that represent and serve
local governments. Metropolitan
Planning Organizations develop
area transportation plans and
coordinate the transportation
planning process. Often, MPOs
provide the technical support staff
for the COG.

CONNECTICUT STATEWIDE FREIGHT PLAN Page 3-9
Final Report CONNECTICUT’S FREIGHT POLICIES, STRATEGIES AND INSTITUTIONS
Figure 3.1: Connecticut Councils of Government and
Metropolitan Planning Organizations
Source: Connecticut Department of Transportation
Freight Rail in the Housatonic Region (2011): Prepared for the former Housatonic Valley
Council of Elected Officials (HVCEO) by the Housatonic Area Regional Transit District (HART)
in 2011, this report is intended to assist municipalities in marketing buildings and land with
proximity to rail, and to assist businesses seeking to use rail freight access points.
* After a 2014 analysis by the State of Connecticut Office of Policy and Management (OPM), the former
South Western Regional Planning Agency (SWRPA) and Housatonic Valley Council of Elected Officials
(HVCEO) MPOs were consolidated to create WestCOG.
South Central Region Council of Governments (SCRCOG)
Regional Freight Study (2016-2017): SCRCOG initiated a Regional Freight Study in the summer
of 2016. In cooperation with CTDOT, the SCRCOG study will prepare regional components
for utilization in the Connecticut Statewide Freight Plan.

Page 3-10 CONNECTICUT STATEWIDE FREIGHT PLAN
CONNECTICUT’S FREIGHT POLICIES, STRATEGIES AND INSTITUTIONS Final Report
Freight Cargo Study for Tweed New Haven Airport (2014): This report outlines various freight-
and cargo-related goals, including developing the cargo context for the airport, working with the
airport to establish cargo objectives, assessing the potential for a “freight village” or “business
gateway” development concept, and developing growth strategies to support the freight cargo
industry at and around the airport.
Naugatuck Valley Council of Governments (NVCOG)
The Naugatuck Valley Council of Governments (NVCOG) functions as a host agency for the
Central Naugatuck Valley MPO and has a contract with the Metropolitan COG to undertake
transportation planning for four towns (Derby, Shelton, Seymour and Ansonia) that are part of
the Greater Bridgeport & Valley MPO.
As part of their 2016-2017 Unified Planning Work Programs, both MPOs will develop a Regional
Freight Inventory and Profile. These profiles are aimed at understanding freight and goods
movement in the region, identifying weight restricted bridges, determining general freight issues
and needs, and identifying and assessing rail crossings for improvement. This work is being
coordinated with CTDOT’s development of the Statewide Freight Plan.
Lower Connecticut River Valley Council of Governments (RiverCOG)
Freight Movement in the Hartford Metropolitan Area: A Regional Freight Market Overview
(2005): See above under Capitol Region Council of Governments (CRCOG)
Freight Program Assessment (2011): This self-assessment conducted by the former Connecticut
River Estuary Regional Planning Agency (CRERPA) covers current freight planning efforts as it
relates to institutional organization, public and private sector relationships, planning and
programming, funding, freight operations, multi-jurisdictional coordination, National Highway
System intermodal connectors, and land use.
Connecticut Metropolitan Council of Governments (MetroCOG)
Freight & Goods Movement Data Sources and Planning Analysis (2006): This study provides an
overview of mobility needs as it relates to freight and identifies freight-related issues facing the
Greater Bridgeport region. Additionally, the study aims to improve the integration of freight
planning into the transportation planning process. The report recognizes that failure to address
these issues will lead to worsening traffic on the region’s highways, and recognizes the
importance of understanding freight movement and pursuing appropriate investments.
3.2.3 Freight-Generating Land Uses Identified in MPO Reports
Connecticut’s Metropolitan Planning Organizations coordinate member agencies’ land use planning and
zoning initiatives. Despite an overall decline in Connecticut’s industrial and manufacturing base over the
past 20 years, there remains a significant amount of industrial park and manufacturing capacity, much of
it within the borders of the state’s MPOs. Through their roles in the coordination of land use and
transportation and their responsibilities in the development of regional Transportation Improvement
Programs, the agencies can improve the business climate for freight-generating companies in
Connecticut. Several MPOs have addressed freight as part of an economic development strategy in the
studies summarized below.

CONNECTICUT STATEWIDE FREIGHT PLAN Page 3-11
Final Report CONNECTICUT’S FREIGHT POLICIES, STRATEGIES AND INSTITUTIONS
South Western Region Freight Overview (2010)
This report identifies existing land uses in the region that generate freight, and acknowledges that
region’s small size, dense population, limited land availability, high land cost, and highway congestion
reduces the attractiveness of the region for freight-related land uses. The report states that there are no
outlying areas capable of supporting modern freight‐related land uses, like large warehouses, distribution
centers, or container intermodal facilities, and that most of the facilities of this nature that service the
region are located outside the immediate area.
In looking forward, the report states that if current land use trends continue, existing freight-related
business will continue to be crowded out of the market by higher-end residential and commercial uses,
most notably at Stamford Harbor in the city’s South End. In this scenario, it is likely that barge trips
would be replaced by truck trips, further adding to the region’s highway traffic.
Freight Cargo Study for Tweed New Haven Airport (2014)
This study recommends pursuing the development of an airport enterprise zone and “freight village”
concept for Tweed – New Haven Airport. Despite the air cargo industry experiencing shifting demand,
increased competition, and new federal regulations in recent years, niche markets like that of the bio-
medical sector in the city of New Haven continue to need air cargo services that are efficient and
expedient, especially for medical supplies and other high-value, time-sensitive goods and products.
Freight Movement in the Hartford Metropolitan Area: A Regional
Freight Market Overview (2005)
In its inventory of regional freight facilities, this report suggests that future land use planning near
Bradley International Airport consider access to the nearby CSX West Springfield Intermodal Terminal.
Making nearby sites attractive for high-volume distribution and manufacturing could aid in boosting the
region’s freight-related economy.
The report also concludes that the region’s infrastructure must provide high-speed and dependable
logistics support to bolster dominant area industries in wholesale, retail, and service logistics providers.
It is advised that regional freight operations be segmented from commuter corridors and pick-up and
delivery activities be consolidated via land use and highway planning practices.
3.3 FREIGHT INSTITUTIONS
3.3.1 Freight-supportive State Agencies
The state institutions that influence the movement of freight in Connecticut are discussed in this section.
Connecticut Department of Transportation
Most freight planning at CTDOT falls within the Bureau of Policy and Planning. The Bureau of Policy and
Planning conducts corridor and system-wide planning studies for the movement of people and goods, for
all modes of transportation, including rail, bus, highway, aviation, bicycling, walking and waterway.
Additional responsibilities related to freight movement are within the Bureau of Highway Operations,
including the oversight of the highway and bridge systems such as snow and ice control, incident
management, and oversize/overweight vehicle permitting. Within the Bureau of Engineering and
Construction the Divisions of Bridges, Traffic Engineering, and Highway Design all influence the

Page 3-12 CONNECTICUT STATEWIDE FREIGHT PLAN
CONNECTICUT’S FREIGHT POLICIES, STRATEGIES AND INSTITUTIONS Final Report
movement of freight in Connecticut. The CTDOT also owns and operates two seasonal ferries across
the Connecticut River and the State Pier in New London. http://www.ct.gov/dot/site/default.asp
Connecticut Airport Authority
The Connecticut Airport Authority was established in July 2011 to develop, improve and operate
Bradley International Airport and the state’s five general aviation airports (Danielson, Groton-New
London, Hartford-Brainard, Waterbury-Oxford, and Windham airports). As noted, nearly all air cargo in
Connecticut moves through Bradley International Airport. http://www.ctairports.org/
Connecticut Port Authority
In 2014, the Connecticut Legislature passed legislation establishing a quasi-public port authority is
responsible for coordinating port development by promoting the benefits of Connecticut’s three deep
water ports and focusing on attracting private investments to leverage public-private partnerships.
Responsibility for port oversight and operations was transferred from CTDOT to the authority.
The Connecticut Port Authority has the authority to pursue federal and state funds for dredging and
other infrastructure improvements to increase cargo movement through Connecticut ports, market the
advantages of such ports to the domestic and international shipping industry, coordinate the planning
and funding of capital projects promoting the development of such ports and develop strategic
entrepreneurial initiatives that may be available to the state.
http://www.portsct.com/portsct/site/default.asp
Connecticut Railroad Association
The Connecticut Railroad Association (CRA) represents the eight freight railroads that serve the State
of Connecticut (Central New England Railroad, Connecticut Southern Railroad, CSX Transportation,
Housatonic Railroad, Naugatuck Railroad, New England Central Railroad, Pan Am Railways, and
Providence & Worcester Railroad). These freight railroads are both publicly and privately held. These
railroads transport about 2.6 million tons of freight per year, providing a vital link between Connecticut
and the broader North American rail network.
I-95 Corridor Coalition
The I-95 Corridor Coalition represents transportation agencies and toll authorities, as well as public
safety and related organizations, from the State of Maine to the State of Florida along the Interstate 95
corridor. Transportation management and operations issues of common interest are addressed through
this coalition. Through this consensus-driven, volunteer-based organization, key decision makers from
state, local and regional member agencies collaborate to improve transportation system performance.
The Coalition is viewed as a successful model for multi-state, interagency cooperation and coordination.
http://i95coalition.org/
TRANSCOM
The Transportation Operations Coordinating Committee (TRANSCOM) is a coalition of 16 New York
– New Jersey – Connecticut metropolitan region transportation and public safety agencies. Created in
1986, the committee approaches regional transportation management in a cooperative, coordinated
fashion. http://www.xcm.org/XCMWebSite/Index.aspx

CONNECTICUT STATEWIDE FREIGHT PLAN Page 3-13
Final Report CONNECTICUT’S FREIGHT POLICIES, STRATEGIES AND INSTITUTIONS
New Haven Port Authority
The New Haven Port Authority (NHPA) is a facilitator and supporter of maritime uses at the port,
rather than a day-to-day operator. The Port Authority, working with the private entities, the City of
New Haven and the State, guides and monitors the land use and development within the Port District.
The NHPA owns one significant parcel of land, and various sub-parcels within this area are licensed to
terminal operators for staging and storage activities. NHPA has collaborated with several city
departments to secure funding to improve security and air quality at the port and continues to seek
funding opportunities to improve the port's infrastructure.
http://www.cityofnewhaven.com/PortAuthority/
Bridgeport Port Authority Commission
The Bridgeport Port Authority (BPA) is directed by a five-member Board of Commissioners and is
managed by an executive director and staff. The City of Bridgeport has planning and zoning authority
over the Port District. The Harbor Commission has some authority over water side activities, however
authority over activities water-ward of the high tide line ultimately rests with the Connecticut
Department of Energy and Environmental Resource and the US Army Corps of Engineers. The BPA
controls the land side. http://bridgeportct.gov/content/89019/89540/89601.aspx
Connecticut Maritime Coalition
The Connecticut Maritime Coalition is a non-profit trade association facilitating the competitiveness of
Connecticut's maritime industries. The group identifies issues facing the maritime industries in
Connecticut and seeks solutions for them. http://www.ctmaritime.com/
Connecticut Department of Motor Vehicles
The Connecticut Department of Motor Vehicles (DMV) issues commercial driver’s licenses. There are
several requirements for obtaining a commercial driver’s license, including successfully completing a
commercial driver’s license exam, and passing a physical examination.
http://www.ct.gov/dmv/site/default.asp
The Department of Motor Vehicles is also tasked with truck weighing and inspection operations in
Connecticut. While state police efforts are aimed solely at compliance with laws and regulations, the
DMV is charged with carrying out the Federal Motor Carrier Safety Assistance Program, which focuses
on vehicle weight and safety regulation.
Weighing and inspection of trucks is conducted at over 30 locations statewide under the auspices and
efforts of the DMV. Of these 30 locations, six are fixed locations with permanent weighing facilities,
platform scales, and dedicated space for storage of trucks taken out of service due to weight, safety, or
other violations.4 The six locations are (Figure 10.3):
1. I-95 northbound in Waterford—one single platform scale and scale house,
2. I-95 southbound in Waterford—one dual axle weighing platform scale and scale house,
3. I-95 northbound in Greenwich—quadruple static scales and scale house,
4. I-91 northbound in Middletown—one triple pad axle weighing platform scale and scale house,
4 https://www.cga.ct.gov/2006/rpt/2006-R-0776.htm

Page 3-14 CONNECTICUT STATEWIDE FREIGHT PLAN
CONNECTICUT’S FREIGHT POLICIES, STRATEGIES AND INSTITUTIONS Final Report
5. I-84 eastbound in Danbury—triple pad static scale and scale house, and
6. I-84 westbound in Union—triple pad static scale, inspection pit, and scale house.
Connecticut Department of Economic and Community Development
The Connecticut Department of Economic and Community Development (DECD) creates a strategic
vision for economic development, recruits employers, trains workers and provides financial assistance to
communities seeking to grow their employment base. DECD’s 2015 strategic plan identified health
biosciences, digital media, tourism, insurance and financial services, advanced manufacturing and
aerospace and green energy as opportunities for growth or as industries to sustain and nurture.
http://www.ct.gov/ecd/site/default.asp
Metropolitan Planning Organizations
Federal law requires that a Metropolitan Planning Organization (MPO) be designated for each urban area
with a population of 50,000 or more. Connecticut’s eight MPOs (Figure 3.1) receive federal funding for
transportation planning activities. MPOs develop financially constrained metropolitan transportation
plans and short-term transportation improvement programs in coordination with CTDOT. The long-
range plans identify transportation improvements and services within the metropolitan area boundaries
for the next 20 to 25 years.
The FAST Act requires each MPO to set performance targets in relation to the freight measures,
integrate these targets within their planning processes, and report periodically on their progress in
relation to these targets. [§1201; 23 USC 134(h)(2), 134(i)(2)(C)]
Towns/Municipalities
In Connecticut, there are 169 towns and cities that are responsible for building, operating and
maintaining local transportation infrastructure, including roads, bridges, and bicycle and pedestrian
pathways and maintenance equipment and facilities.
Connecticut Department of Energy and Environmental Resources
The Connecticut Department of Energy and Environmental Resources (DEEP) CT DEEP has a broad
mandate and portfolio to protect the state’s natural resources and public health, and to regulate the
energy industries that operate in the state. DEEP has worked with the Governor’s office to establish
aggressive goals and policies to reduce greenhouse gas emissions and reduce reliance on non-renewable
energy sources. http://www.ct.gov/deep/site/default.asp
3.3.2 Other Northeast Freight Partners
Freight investment planning often concerns and has effects on multiple states. CTDOT shares
information about its investment and planning activities with counterparts in New York, Massachusetts
and Rhode Island on an informal basis and it also coordinates directly with neighbor states on initiatives
that require joint decision-making to produce better and faster outcomes.
CTDOT is a member of the New England Regional Freight Group (NERFG), which is organized to share
information on local investment initiatives and to seek solutions to issues of mutual interest. Over the
course of the development of the Freight Plan, CTDOT met with the NERFG 10 times, most recently in
2016.

CONNECTICUT STATEWIDE FREIGHT PLAN Page 3-15
Final Report CONNECTICUT’S FREIGHT POLICIES, STRATEGIES AND INSTITUTIONS
One highlight of these meetings was a regional freight summit hosted by the Volpe Center in 2014.
States from the Northeast shared information about how they are making freight work better in their
states, and they heard about freight issues and trends from national and international perspectives. The
agenda included discussions about:
Federal freight provisions, policies and incentives
National freight trends at the regional scale
A leadership panel discussion of opportunities for coordination and cooperation
A discussion of the challenges of global competition at the regional scale
A Roundtable discussion of critical single and multimodal freight safety initiatives
A seminar centered on planning for sustainability and resilience in the regional freight system
3.3.3 Freight-Related Regulations
The federal government has established regulations that govern the operation of interstate freight
operations. These regulations cover many aspects of freight operations, including maximum width limits
and minimum lengths for trucks. These regulations provide a consistent and predictable set of operating
rules for motor carriers across all states. As the principal agency governing the operation of truck
freight, the Federal Motor Carrier Administration (FMCSA) has established several regulations that
govern the licensing and operation of trucks on the highway system. Connecticut has adopted these
FMCSA regulations. These cover:
Controlled substance and alcohol testing
Driver qualifications and driver’s license requirements
Safety fitness procedures
Safety and hazardous materials handling
Financial responsibility
Inspection, repair and maintenance
Accessories needed for safe operation
Hours of service
Transportation of hazardous materials
In addition, Connecticut has developed complementary or more specific standards for truck length,
height and weight; vehicle registration; insurance; reporting fuel use tax; licensing, and alcohol and drug
testing.
The federal hours of service regulations were established to maintain safe truck operations. The
regulations stipulate that…” freight operators may not drive more than 11 hours following 10
consecutive hours off duty or drive for any period after having been on duty 14 hours, following 10
consecutive hours off duty.”5 Drivers are required to maintain a logbook showing their on- and off-duty
times. Increasingly, this task is being automated by in-vehicle systems that monitor and record truck
movements. An unintended consequence of the hours of service regulations is that drivers seek
unsanctioned parking locations rather than continue driving at the end of their legal operating hours
when there are no vacancies in the sanctioned parking areas.
5 Connecticut Department of Motor Vehicles, Motor Carrier Handbook, 2016

Page 3-16 CONNECTICUT STATEWIDE FREIGHT PLAN
CONNECTICUT’S FREIGHT POLICIES, STRATEGIES AND INSTITUTIONS Final Report
Oversize and Overweight Vehicles
Connecticut General Statutes Section 13b-61 indicates that all monies collected or received by the State
from license, permit, and fee revenues – which includes vehicle permit fees for oversize and overweight
vehicles – shall be credited to the Special Transportation Fund (STF) monthly. In the year between
October 2014 and October 2015, 87,008 trip permits were issued and 1,370 annual permits were issued
under these provisions. As part of the permitting process, CTDOT assigns truck routes for
oversize/overweight vehicles, and reviews the vehicle management procedures suggested by the
applicant.
The 1982 Surface Transportation Assistance Act sets weight and dimension limits for vehicles operating
on the National Network and more specifically, in the Interstate system. While the federal weight limit
for vehicles operating on the Interstate system without a special permit is 80,000 pounds, there are
exemptions and pre-existing state statues that allow higher weight limits, and these exceptions vary by
state.
Connecticut generally adheres to the federal standards, with some exceptions. Milk tankers and other
trucks hauling agricultural commodities up to 100,000 in gross vehicle weight (GVW) may travel on the
Interstate system. Single axle and tandem axle vehicles meeting axle spacing limits may travel at slightly
higher weights than the federal provisions allow.
Some neighboring states with provisions that predate the STAA allow trucks to exceed the 80,000 lb.
limit. For example, a grandfather provision allows vehicles up to 127,400 lbs. GVW to travel on the
Massachusetts Turnpike. The trucking industry has communicated its preference for a harmonized
system of truck size and weight regulations across state lines.

CONNECTICUT STATEWIDE FREIGHT PLAN Page 4-1
4. FEDERAL FREIGHT POLICIES, STRATEGIES, AND
INSTITUTIONS
To develop implementable recommendations that will maintain and improve Connecticut’s freight
transportation system, it is important to understand the national policy environment in which the freight
system functions. Funding programs as well as national policy and regulatory restrictions all establish
areas of emphasis and create the framework for implementation.
4.1 NATIONAL FREIGHT ADVISORY COMMITTEE
In June 2014, the National Freight Advisory Committee (NFAC) appointed by the Secretary of
Transportation, published its recommendations for the development of the National Freight Strategic
Plan (NFSP). The NFSP will implement and advance the National Freight Policy and Goals established
under MAP-21 and continued under the FAST Act. The recommendations are categorized into three
elements outlined in MAP-21:
1. Barriers: An assessment of statutory, regulatory, technological, institutional, financial, and other
barriers to improved freight transportation performance (including opportunities for
overcoming the barriers)
2. Best Practices: To improve the performance of the national freight network
3. Best Practices: To mitigate the impacts of freight movement on communities
4.2 NATIONAL FREIGHT POLICY
National freight policy is designed to help the United States compete in the global economy and achieve
goals related to economic competitiveness and efficiency. National policy sets a common framework for
states to determine the specific investments that best address their priorities and needs.
The FAST Act, passed by Congress in 2016 and promulgated by the Federal Highway Administration
(FHWA) focuses heavily on investments in freight. The act establishes new formula and discretionary
grant funding programs for freight. The FAST Act also establishes a national policy of maintaining and
improving the condition and performance of the National Multimodal Freight Network (“the
Network”), described below, to ensure that the Network provides a foundation for the U.S. to compete
in the global economy. The FAST Act specifies goals associated with this national policy related to the
condition, safety, security, efficiency, productivity, resiliency, and reliability of the Network, and to
reduce the adverse environmental impacts of freight movement on the Network. These goals are to be
pursued in a manner that is not burdensome to State and local governments. [49 U.S.C. 70101]
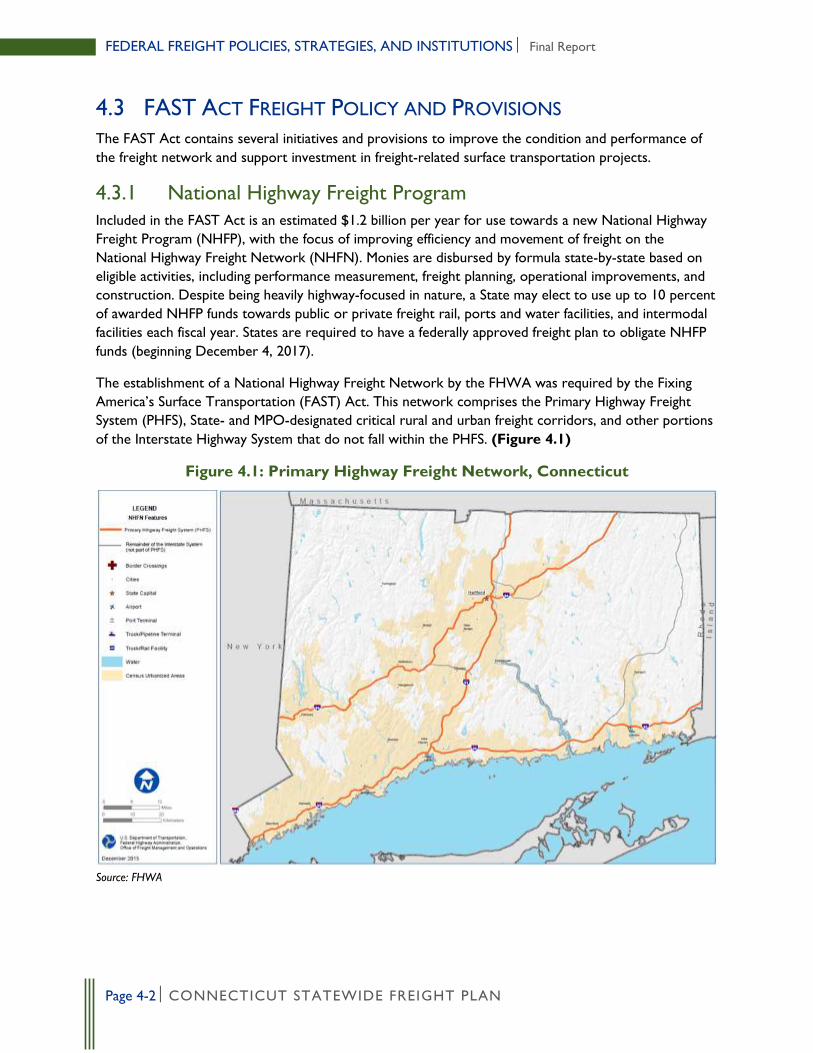
Page 4-2 CONNECTICUT STATEWIDE FREIGHT PLAN
FEDERAL FREIGHT POLICIES, STRATEGIES, AND INSTITUTIONS Final Report
4.3 FAST ACT FREIGHT POLICY AND PROVISIONS
The FAST Act contains several initiatives and provisions to improve the condition and performance of
the freight network and support investment in freight-related surface transportation projects.
4.3.1 National Highway Freight Program
Included in the FAST Act is an estimated $1.2 billion per year for use towards a new National Highway
Freight Program (NHFP), with the focus of improving efficiency and movement of freight on the
National Highway Freight Network (NHFN). Monies are disbursed by formula state-by-state based on
eligible activities, including performance measurement, freight planning, operational improvements, and
construction. Despite being heavily highway-focused in nature, a State may elect to use up to 10 percent
of awarded NHFP funds towards public or private freight rail, ports and water facilities, and intermodal
facilities each fiscal year. States are required to have a federally approved freight plan to obligate NHFP
funds (beginning December 4, 2017).
The establishment of a National Highway Freight Network by the FHWA was required by the Fixing
America’s Surface Transportation (FAST) Act. This network comprises the Primary Highway Freight
System (PHFS), State- and MPO-designated critical rural and urban freight corridors, and other portions
of the Interstate Highway System that do not fall within the PHFS. (Figure 4.1)
Figure 4.1: Primary Highway Freight Network, Connecticut
Source: FHWA

CONNECTICUT STATEWIDE FREIGHT PLAN Page 4-3
Final Report FEDERAL FREIGHT POLICIES, STRATEGIES, AND INSTITUTIONS
Connecticut may use National Highway Freight Program (NHFP) Funds to improve any part of its
Interstate System. Interstate 395 (shown in gray in Figure 4.1) is not part of the Primary Highway Freight
Network but is eligible for NHFP funds because Connecticut’s PHFN mileage falls below a threshold of
two percent of the total US PHFN mileage, as set in law.
4.3.2 National Multimodal Freight Network
To complement its highway-oriented freight provisions, the FAST Act includes many multimodal freight
policy and planning provisions. Among these provisions is the National Multimodal Freight Network.
The FAST Act directs the U.S. DOT to establish an interim National Multimodal Freight Network
(NMFN), to include the NHFN, freight rail systems of Class I railroads, the Great Lakes, the St.
Lawrence Seaway, inland and intercostal waterways, ports and airports that meet specified criteria, and
other strategic freight assets. (Figure 4.2) Following a public comment period, U.S. DOT must
designate a National Multimodal Freight Network, and must re-designate this network every five years
thereafter, with input from a wide range of stakeholders.
The purpose of the NMFN is to 1) assist States in strategically directing resources toward improved
system performance for the efficient movement of freight; 2) inform freight transportation planning; 3)
assist in the prioritization of Federal investment; and, 4) assess and support Federal investments to
achieve the goals of the National Multimodal Freight Policy.
Figure 4.2: National Highway Freight Program
Source: CDM Smith

Page 4-4 CONNECTICUT STATEWIDE FREIGHT PLAN
FEDERAL FREIGHT POLICIES, STRATEGIES, AND INSTITUTIONS Final Report
4.3.3 Critical Rural and Urban Freight Corridors
Critical Rural Freight Corridors (CRFCs) and Critical Urban Freight Corridors (CUFCs) provide access
and connectivity to the NHFN. States may designate such corridors, and by doing so, can strategically
direct resources towards improved system performance on the NHFN. The designation of CRFCs and
CUFCs will increase the network that can be improved with NHFP formula funds and FASTLANE Grant
Program funds for eligible projects that support national goals identified in 23 U.S.C. 167(b) and 23
U.S.C. 117(a)(2).
Critical Rural Freight Corridors
23 U.S.C. 167(e) identifies the requirements for designating CRFCs. A state may designate a public road
within the borders of the state as a CRFC if the public road is not in an urbanized area, and meets one
or more of the following seven elements:
Is a rural principal arterial roadway and has a minimum of 25 percent of the annual average daily
traffic of the road measured in passenger vehicle equivalent units from trucks (Federal Highway
Administration (FHWA) vehicle class 8 to 13);
Provides access to energy exploration, development, installation, or production areas;
Connects the PHFS or the Interstate System to facilities that handle more than:
– 50,000 20-foot equivalent units per year; or
– 500,000 tons per year of bulk commodities;
Provides access to a grain elevator, an agricultural facility, a mining facility, a forestry facility, or
an intermodal facility;
Connects to an international port of entry;
Provides access to significant air, rail, water, or other freight facilities in the state; or
Is determined by the state to be vital to improving the efficient movement of freight of
importance to the economy of the State.
Connecticut may designate up to 150 miles of network as part of the CRFC system. Connecticut’s Rural
Freight Corridors are made part of this plan by reference and may be designated or modified in
conjunction with an update of this plan, or independently as necessary.
Critical Urban Freight Corridors
23 U.S.C. 167(f) identifies the requirements for designating CUFCs. In an urbanized area with a
population of 500,000 or more individuals, the MPO, in consultation with the state, may designate a
CUFC. In an urbanized area with a population of less than 500,000 individuals, the state, in consultation
with the MPO, may designate a CUFC.
A public road designated as a CUFC must be in an urbanized area, regardless of whether the population
is above or below 500,000 individuals, and meet one or more of the following four elements:
Connects an intermodal facility to the PHFS, the Interstate System, or an intermodal freight
facility;

CONNECTICUT STATEWIDE FREIGHT PLAN Page 4-5
Final Report FEDERAL FREIGHT POLICIES, STRATEGIES, AND INSTITUTIONS
Is located within a corridor of a route on the PHFS and provides an alternative highway option
important to goods movement;
Serves a major freight generator, logistic center, or manufacturing and warehouse industrial
land; or
Is important to the movement of freight within the region, as determined by the MPO or the
State.
Connecticut may designate up to 75 miles of network as part of the CUFC system. Connecticut’s Urban
Freight Corridors are made part of this plan by reference and may be designated or modified in
conjunction with an update of this plan, or independently as necessary.
4.3.4 National Freight Strategic Plan
In 2015, USDOT released a draft National Strategic Freight Plan. The plan highlights key trends and
challenges, including congestion, institutional and financial, that need to be addressed to enable
economic growth. The plan describes a range of possible public and private sector actions to improve
freight infrastructure and planning processes.
4.3.5 Freight Data, Planning, and Reporting
The FAST Act directs USDOT to develop or improve data and tools to support an outcome-oriented,
performance-based approach to evaluating proposed transportation projects. It also directs DOT to
consider improvements to existing freight flow data collection.
4.3.6 Freight Conditions and Performance Report
The FAST Act requires DOT to prepare a biennial report describing the condition and performance of
the national freight network.
4.3.7 State Freight Advisory Committees and Freight Plans
USDOT has been directed to encourage states to establish a freight advisory committee composed of a
representative cross-section of public- and private-sector freight stakeholders. It also requires DOT to
encourage each state to develop a comprehensive plan for its immediate and long-range freight-related
planning and investment.
4.3.8 Jason’s Law
Jason’s Law makes construction of safety rest areas, commercial motor vehicle (CMV) parking facilities,
electric vehicle and natural gas vehicle infrastructure eligible for federal funding on the National Highway
System (NHS). It also requires the U.S. DOT to survey states within 18 months of enactment about
their CMV traffic and their capability to provide CMV parking. The U.S. DOT must periodically update
this survey, and must post the results on DOT's website. Projects eligible to receive funding include:

Page 4-6 CONNECTICUT STATEWIDE FREIGHT PLAN
FEDERAL FREIGHT POLICIES, STRATEGIES, AND INSTITUTIONS Final Report
Construction of safety rest areas with truck parking.
Construction of truck parking areas adjacent to commercial truck stops and travel plazas.
Opening existing facilities to truck parking, including inspection and weigh stations and park‐and‐
ride facilities.
Promoting availability of publicly or privately‐provided truck parking on the NHS.
Construction of turnouts along the NHS for commercial motor vehicles.
Making capital improvements to public truck parking facilities closed on a seasonal basis that will
allow those facilities to remain open all year.
Improving the geometric design of interchanges on the NHS to improve access to truck parking
facilities.
4.3.9 Special Permits During Periods of National Emergency
Allows states to issue divisible load permits to overweight trucks exclusively carrying relief supplies for
up to 120 days following a Presidential declaration of a major disaster.
4.3.10 Transport of Hazmat and Radioactive Materials
Federal law requires the Secretary of Transportation to establish regulations governing the transport of
hazardous materials (hazmat).6 These regulations apply to anyone who ships or transports hazmat, as
well as manufacturers of packaging designed to transport hazmat.7 According to the Pipeline and
Hazardous Materials Safety Administration (PHMSA), hazmat is defined as “a substance or material
capable of posing an unreasonable risk to health, safety, or property when transported in commerce.”8
The USDOT has identified more than 3,000 such materials.9 Hazmat are categorized into nine hazard
classes, including explosives, flammable liquids and radioactive materials. Each class is associated with a
level of transport risk. 10
In Connecticut, the Naval Submarine Base (NSB) New London in Groton is a key generator of Class 7
radioactive materials which are transported via rail. Within the Nuclear Regional Maintenance
Department at the base, the Radiological Controls group is responsible for all radioactive materials
associated with submarine nuclear propulsion systems, including the receipt, transfer, stowage, disposal,
and shipping of radioactive materials.11
States and localities are limited in their ability to impose requirements such as route restrictions on
hazmat shipments. In general, state or local regulations or requirements are preempted by the federal
regulations except when a more stringent state or local regulation is necessary to mitigate or eliminate a
local safety hazard, and such regulation does not conflict with a federal law or regulation or unduly
6 49 U.S.C. 5101 et. seq. 7 49 CFR 171.1. 8 https://www.phmsa.dot.gov/resources/glossary#H 9 National Research Council, Transportation Research Board (TRB). Special Report 283. Cooperative Research for Hazardous Materials Transportation: Defining the Need, Converging on Solutions. Washington, D.C., 2005. 10 https://ehs.ncsu.edu/hazardous-materials-classification/ 11 http://www.mybaseguide.com/navy/120-1778/nsb_new_london_commands_at_naval_submarine_base_new_london

CONNECTICUT STATEWIDE FREIGHT PLAN Page 4-7
Final Report FEDERAL FREIGHT POLICIES, STRATEGIES, AND INSTITUTIONS
burden interstate commerce. There are procedures to designate hazmat highway routes within local
jurisdictions, but the process must follow federal regulations. Local control of rail operations is even
more limited than other modes since rail transportation travels for the most part over privately-owned
infrastructure.12
There are special hazmat regulations that apply to radioactive materials transported by rail. The rules
govern the packaging and separation of such shipments from passengers, rail employees, and animals,
and specify the number of packages of radioactive material that may be transported by rail car or stored
at any single location based on safety indexes that are defined in regulation.13
4.3.11 Additional Freight Funding Programs
Various federal grant/loan opportunities are available for freight-related projects and each of the
programs has its own unique requirements. A majority of the funding for freight-related improvements
is administered through the USDOT, with additional funding from non-USDOT sources. Federal
transportation infrastructure funding and financing programs are discussed in this section.
Infrastructure for Rebuilding America Grants
Formerly known as the Nationally Significant Freight and Highway Projects (FASTLANE) program, the
Infrastructure for Rebuilding America (INFRA) program offers funding assistance for freight-beneficial
projects on a competitive grant basis. There is $1.5 billion in funding assistance available through 2018
for highway, rail, port, and intermodal freight projects of national and regional significance. INFRA grants
are available to states, MPOs, tribes, localities, and federal land management agencies pursuing higher-
cost mega-projects. The selection criteria include degree of enhancement to local economic vitality,
innovation in delivery and project streamlining, leveraging of federal funds and project readiness.
National Highway Performance Program
The National Highway Performance Program (NHPP) guides activities related to the condition and
performance of the National Highway System (NHS) and provides funding for the construction of new
facilities on the NHS. It ensures that investments of federal-aid funds in highway construction are
directed to support progress toward the achievement of performance targets established in a state's
asset management plan for the NHS.14 Under MAP-21, routes eligible for NHPP funding include:
The Interstate System
Principal arterials (including those not previously designated as part of the NHS) and border
crossings on those routes
Intermodal connectors – highways that provide motor vehicle access between the NHS and
major intermodal transportation facilities
The Strategic Highway Network (STRAHNET). STRAHNET is a nationwide system of roads
deemed necessary to support U.S. military operations.
12 Texas Transportation Institute, Public Guidance for Managing Hazardous Material Transportation in Texas, August 2009. 13 49 CFR 173.403. 14 U.S. Department of Transportation, FHWA, retrieved July 26, 2014 from
https://www.fhwa.dot.gov/map21/factsheets/freight.cfm

Page 4-8 CONNECTICUT STATEWIDE FREIGHT PLAN
FEDERAL FREIGHT POLICIES, STRATEGIES, AND INSTITUTIONS Final Report
STRAHNET connectors to major military installations
Surface Transportation Program
Under the FAST Act, the Surface Transportation Program (STP) is a block grant program which
provides flexible funding for projects on any Federal-Aid highway, bridges on public roads, bridge and
tunnel inspection and inspector training.15 Eligible freight projects also include bridge clearance increases
to accommodate double-stack freight trains, capital costs of advanced truck stop electrification systems,
freight transfer yards, and truck parking facilities, as well as surface transportation infrastructure
improvements in port terminals for direct intermodal interchange, transfer, and port access.
Congestion Mitigation and Air Quality Program
The Congestion Mitigation and Air Quality Program (CMAQ) program is continued in MAP-21 and the
FAST Act to provide a flexible funding source to state and local governments for transportation projects
and programs to help meet the requirements of the Clean Air Act.16 CMAQ money supports
transportation projects that reduce mobile source emissions in areas designated by the U.S.
Environmental Protection Agency (EPA) as nonattainment or maintenance of national ambient air quality
standards. Eligible activities include those related to rail intermodal freight transportation improvements.
To be eligible for funding, the project must reduce emissions of criteria pollutants17 for which the area is
in non-attainment. CMAQ funding is administered jointly by the FHWA and the Federal Transit
Administration (FTA) and is allocated among the states based on the severity of their air quality status.
Highway Safety Improvement Program
The Highway Safety Improvement Program (HSIP) supports projects that improve the safety of road
infrastructure by adding capacity, improving alignment or operations, such as intersections, curves or
making road improvements such as signing, pavement markings or adding rumble strips. The HSIP also
offers eligibility for truck parking
The Transportation Infrastructure Finance and Innovation Act
The Transportation Infrastructure Finance and Innovation Act (TIFIA) program provides federal credit
assistance in the form of direct loans, loan guarantees, and standby lines of credit to finance surface
transportation projects of national and regional significance. The goal of TIFIA financing is to leverage
federal resources and stimulate private capital investment in transportation infrastructure by providing
credit assistance in the form of direct loans, loan guarantees, and standby lines of credit to projects of
national or regional significance. TIFIA financing is available for large-scale public or private
transportation projects, including highway, bridge and rail intermodal freight improvements. The
program is aimed at large projects with a minimum value of approximately $50 million. The maximum
TIFIA-financed portion is 33 percent and is administered by the USDOT’s TIFIA Joint Program Office.
Railway-Highways Crossing (Section 130) Program
Funds to improve rail-highway crossings are set-aside from the federal HSIP apportionment. The
program provides funds for the elimination of hazards at railway-highway crossings and is apportioned to
states by formula. Eligibility includes the relocation of highways to eliminate railway-highway grade
15 U.S. Department of Transportation, FHWA, retrieved July 26, 2014 from https://www.fhwa.dot.gov/map21/factsheets/freight.cfm 16 Ibid 17 The criteria pollutants are nitrogen dioxide, lead, carbon monoxide, ozone, particulate matter and sulfur dioxide

CONNECTICUT STATEWIDE FREIGHT PLAN Page 4-9
Final Report FEDERAL FREIGHT POLICIES, STRATEGIES, AND INSTITUTIONS
crossings and projects at railway-highway grade crossings to eliminate hazards posed by blocked
crossings due to idling trains.
There are 313 highway grade crossings in Connecticut, with 231 listed as freight railroad crossings, in
which the railroad company is responsible for maintenance of the track and any pavement between the
rails. Many of these crossings need replacement or repair of crossing surfaces on the approach as well as
repair or replacement of signs, signals, crossing gates and other warning or protective devices. The
FAST Act authorized $225 million to be set aside from the Highway Safety Improvement Program
(HSIP) for FY 2016, but the later enacted Department of Transportation Appropriations Act, 2016
raised the set-aside amount for FY 2016 to $350 million. Connecticut is to receive about $2 million
from FY 2017-FY 2020.
Federal Rail Safety Improvement Act of 2008
This Act addresses rail safety through regulations; it also authorizes grants for investing in rail
technology, railroad safety infrastructure, rail grade crossing improvements, and education, subject to
annual appropriations. Provisions under the Act are administered by the Federal Railroad Administration
(FRA).
Rail Line Relocation and Improvement Capital Grant Program
Under this program, a state (or political subdivision such as a parish) is eligible for a grant from FRA for
any construction project that improves the route or structure of a rail line and involves a lateral or
vertical relocation of a portion of rail line, or mitigates the adverse effects of rail traffic on safety, motor
vehicle traffic flow, community quality of life, or economic development.
Railroad Rehabilitation and Improvement Financing Program
The Railroad Rehabilitation and Improvement Financing (RRIF) program provides direct federal loans
and loan guarantees to finance the development of railroad infrastructure18. Under this program,
established in 1998, the FRA provides up to $35 billion in direct loans and loan guarantees, with $7
billion reserved for Class I railroad projects. The loans can be used to refinance outstanding
infrastructure debt. The program also helps to finance project investments directly, up to the total cost
of the project. State and local governments, government-sponsored authorities, corporations, railroads,
and others can participate in the program.
Transportation Investment Generating Economic Recovery
Discretionary Grants
The Transportation Investment Generating Economic Recovery (TIGER) Discretionary Grant program
provides a unique opportunity for USDOT to invest in road, rail, transit and port projects that have the
potential to achieve critical national objectives. Since 2009, Congress has dedicated more than $4.1
billion for six rounds to fund projects that have a significant impact on the nation, a region or a
metropolitan area.19
18 U.S. Department of Transportation, FRA, retrieved August 14, 2014 from http://www.fra.dot.gov/Page/P0128 19 U.S. Department of Transportation, retrieved 8/14/14 from http://www.dot.gov/tiger

Page 4-10 CONNECTICUT STATEWIDE FREIGHT PLAN
FEDERAL FREIGHT POLICIES, STRATEGIES, AND INSTITUTIONS Final Report
U.S. Army Corps of Engineers Harbor Maintenance Trust Fund
The U.S. Army Corps of Engineers (USACE) is responsible for maintaining federal navigation channels.
Under the Harbor Maintenance Trust Fund (HMTF), the principal legislative vehicle for guiding the
USACE Civil Works Program under the 2014 Water Resources Development Act (WRDA),
expenditures will increase each year until 2025, when 100 percent of available funds will be directed
towards operations and maintenance activities. The Harbor Maintenance Trust Fund is funded by a
harbor maintenance tax (HMT) on imported and domestic waterborne cargo and cruise passengers. The
HMTF is used to cover the USACE’s cost of dredging channels, maintaining jetties and breakwaters, and
operating locks along the coasts and in the Great Lakes. The HMTF may be used only with an
appropriation by Congress.
Inland Waterways Trust Fund for Locks and Dams
The Inland Waterways Fuel Tax and Trust Fund was established by the Water Resources Development
Act of 1986. The Act established a Federal marine fuel tax of $0.20 per gallon to support 50 percent of
the cost of inland waterway infrastructure development and rehabilitation. The tax generates
approximately $85 million annually. The Trust Fund balance began to decline in 2003 when increasing
amounts were used to modernize the inland waterway system. This continued until 2009 when the
Trust Fund balance was exhausted, limiting the amount of spending to the annual tax revenues available.
There is now a substantial backlog of authorized projects, and the limited funding available has been
spread over a list of projects, which has extended the construction time for each project. The 2014
WRDA directs the Secretary of the Army to conduct a study to report on potential revenue sources
for the Inland Waterway Trust Fund. With the passing of the Able Act, as of April 1, 2015 the Inland
Waterway Trust Fund tax was increased to $0.29 per gallon.
FAA Airport Improvement Program
The Airport Improvement Program (AIP) is administered by the Federal Aviation Administration (FAA)
and provides grants for planning and developing public-use airports that are included in the National Plan
of Integrated Airport Systems (NPIAS). For large and medium primary hub airports, the grant covers 75
percent of eligible costs (or 80 percent for noise program implementation). For small primary, reliever,
and general aviation airports, the grant covers a range of 90 to 95 percent of eligible costs, based on
statutory requirements. Eligible projects include improvements related to enhancing airport safety,
capacity, security, and environmental concerns. In general, sponsors can use AIP funds on most airfield
capital improvements or repairs and, in some specific situations, for terminals, hangars, and non-aviation
development.
Department of Commerce
The Department of Commerce (DOC) administers federal funding for grants and cooperative
agreements in the form of discretionary and nondiscretionary funds. The grants most germane to freight
are administered by the Economic Development Administration (EDA), The EDA provides public works
funds for distressed communities to revitalize, expand, and upgrade their physical infrastructure to
attract new industry, encourage business expansion, diversify local economies, and generate or retain
long-term, private sector jobs, and investment.20
20 http://www.eda.gov/programs.htm

CONNECTICUT STATEWIDE FREIGHT PLAN Page 4-11
Final Report FEDERAL FREIGHT POLICIES, STRATEGIES, AND INSTITUTIONS
4.3.12 Metropolitan and Statewide Planning
The FAST Act continues to encourage freight shippers and providers of freight transportation services
to participate in metropolitan and statewide transportation planning processes. It also requires that
planning processes consider projects and strategies to increase the accessibility and mobility of people
and for freight; and enhance the integration and connectivity of the transportation system across and
between modes, for people and freight. Freight plans must be completed and updated at least every 5
years.
Federal law established under Moving Ahead for Progress in the 21st Century Act (MAP-21) and the Fixing
America's Surface Transportation (FAST) Act requires a transition to a performance-driven and outcome-
based program. The purpose of performance-based decision making is to increase the transparency and
accountability of states for their investment of federal tax dollars in transportation infrastructure. A
performance-driven program also provides a data-driven framework for improved project planning and
investment decision-making processes that accounts for system reliability, economic vitality, and
environmental sustainability.21
The Federal Highway Administration (FHWA) has established national goals that states and local
agencies can collectively work towards to address safety, infrastructure condition, congestion reduction,
system reliability, freight movement and economic vitality, environmental sustainability and reduced
project delivery delays.22
To help states, achieve these national goals, FHWA has published final rules that establish performance
measures for State departments of transportation (State DOT) and Metropolitan Planning Organizations
(MPO) to use as required by the MAP-21 and the FAST Act. This is the first time that all state DOTs
and MPOs are required to track and report performance data using a national framework of consistent
performance measures.
The measures must be used by State DOTs and MPOs to assess the performance of the Interstate and
non-Interstate National Highway System (NHS) to carry out the National Highway Performance
Program (NHPP); to assess freight movement on the Interstate System; and to assess traffic congestion
and on-road mobile source emissions to comply with Congestion Mitigation and Air Quality
Improvement (CMAQ) Program regulations.
Relative to freight travel, the FHWA established one performance measure for state DOTs to adopt and
implement to assess freight movement on the Interstate System. The measure is Truck Travel Time
Reliability (TTTR) and represents the average reliability of truck travel for all reporting segments on the
Interstate System. The FHWA also specified the inputs and calculations requirements for this measure.
To assist states in implementing this performance measure, the FHWA will provide state DOTs and
MPOs free access to the National Performance Management Research Data Set (NPMRDS) - a travel
time data set that includes freight-only travel times. This data resource provides detailed vehicle travel
time information to monitor system performance.
21 https://www.federalregister.gov/articles/2014/06/02/2014-12155/statewide-and-nonmetropolitan-transportation-planning-metropolitan-
transportation-planning#h-21. 22 http://www.fhwa.dot.gov/tpm/about/goals.cfm

Page 4-12 CONNECTICUT STATEWIDE FREIGHT PLAN
FEDERAL FREIGHT POLICIES, STRATEGIES, AND INSTITUTIONS Final Report
State DOTs must establish two-year and four-year performance targets, as applicable, within one year of
the effective date of final rule. State DOTs are also required to report to FHWA on the performance
and progress of transportation projects in performance reports beginning January 1, 2018. State DOTs
are encouraged to coordinate with MPOs to establish consistent targets, to the maximum extent
practicable. The FHWA will assess each State DOT’s progress toward achieving performance biennially
and use the data to assess the impacts of Federal funding investments.
Transportation agencies are encouraged set additional performance measures that are relevant to the
goals in their transportation plan and that help them measure progress towards those goals.

CONNECTICUT STATEWIDE FREIGHT PLAN Page 5-1
5. CONNECTICUT FREIGHT TRANSPORTATION
ASSETS
Connecticut’s freight transportation system is a large inter-connected system of roads, highways, air
services, ports and waterways that connect the state with the rest of the U.S. and the world. The
system is owned and operated by a variety of private and public entities, each operating under different
cost structures, business models and objectives. This section reviews the extent and attributes of the
networks that carry freight into, through and within Connecticut.
5.1 HIGHWAYS
In Connecticut, there are over 21,400 miles of public roadways. CTDOT is directly responsible for
overseeing all design, construction, maintenance, and improvements for nearly 20 percent of the state’s
roadway mileage. The state-maintained roads comprise Connecticut’s most heavily-traveled roads - the
Interstate System and most of the major arterials.
As shown in Figure 5.1, National Highway System Interstates make up just eight percent of state-
maintained roads; however, roughly 80 percent of truck freight travel moves on the Interstate System.
Figure 5.1: State Maintained Roads, Miles
Source: FHWA, Highway Statistics
As shown in Figure 5.2, the 1,392 miles of the National Highway System connect population and
employment centers within the State and form connections with the rest of the U.S. The rest of the
state system (2,719 miles) and the non-state system (17,271 miles) provide access between regions

Page 5-2 CONNECTICUT STATEWIDE FREIGHT PLAN
CONNECTICUT FREIGHT TRANSPORTATION ASSETS Final Report
within the state, and they also provide the local system connections to factories, stores, warehouse and
distribution centers and intermodal facilities. For the most part, the last and first mile connections of the
highway freight system are on the non-state highway system.
Figure 5.2: National Highway System Roads
Source: CTDOT
5.2 FREIGHT RAIL
There are nine privately owned freight railroad companies operating in Connecticut and the
Connecticut Department Transportation provides freight rail support through several programs. These
companies own most of the rail freight infrastructure and all of the rail freight equipment operating
within the state. The rail service operators include CSX Transportation, Providence & Worcester
Railroad Company, Housatonic Railroad Company, Pan Am Southern Railway (including Pan Am
Railways), Springfield Terminal Railroad, New England Central Railroad, Naugatuck Railroad Company,
Central New England Railroad, and Connecticut Southern Railroad.
There are over 628 miles of freight railroad right-of-way in the state consisting of public and privately-
owned property as shown in Table 5-1.

CONNECTICUT STATEWIDE FREIGHT PLAN Page 5-3
Final Report CONNECTICUT FREIGHT TRANSPORTATION ASSETS
Table 5-1: Connecticut Freight Railroad Right-of-way Miles
PUBLIC ROW Miles
Freight Railroad Operating Rights
Federal – Amtrak owned (Shore Line and Springfield Line) 122.5
State of Connecticut owned (New Haven Line and misc.) 128.2
Freight Railroad Lease Agreements
State of Connecticut owned 129.1
Municipal – City of Bristol owned 2.0
Total Public 381.8
PRIVATE
Freight Railroad Companies (privately owned) 246.7
Total Private 246.7
TOTAL 628.5
Source: Connecticut State Rail Plan 2012-2016, CTDOT.
The locations of freight rail lines by railroad operator and ownership are shown in Figure 5.3. Most of
the freight rail operations in Connecticut involve shared-use agreements between owners of passenger
rail operators and freight rail companies.
Figure 5.3: Rail Operators in Connecticut, and Ownership
Source: CTDOT and CDM Smith

Page 5-4 CONNECTICUT STATEWIDE FREIGHT PLAN
CONNECTICUT FREIGHT TRANSPORTATION ASSETS Final Report
5.3 WATER TRANSPORTATION
There are three deep water commercial ports in Connecticut – New London, New Haven and
Bridgeport – that handle freight movement (Figure 5.4).
Figure 5.4: Connecticut Deep Water Commercial Ports
Source: CTDOT and CDM Smith
5.3.1 Port of New Haven
The Port of New Haven is the highest volume commercial shipping port on Long Island Sound and the
busiest port between Boston and New York City. The 366-acre port can accommodate ships ranging
from 20,000 to 40,000 deadweight tons. It has ten berthing facilities at eight terminal locations ranging
from 200 to 1,500 feet. There is approximately 250,000 square feet of indoor storage and 50 acres of
outdoor storage within the port district. The port primarily handles petroleum products, chemicals,
scrap metal, metallic products, cement, sand and stone, salt and general break bulk cargo. The Port of
New Haven’s fuel facilities are part of the U.S. Government’s strategic heating oil reserve.

CONNECTICUT STATEWIDE FREIGHT PLAN Page 5-5
Final Report CONNECTICUT FREIGHT TRANSPORTATION ASSETS
5.3.2 Port of Bridgeport
The Port of Bridgeport occupies 23 acres with 1,350 linear feet of waterfront. The 160-foot pier
accommodates vessels up to 300 feet in length, 60-foot beam, and 18-foot draft. Additional Port
Authority-owned acreage is contiguous to the site for future expansion of the shipyard facility.
5.3.3 Port of New London
The Port of New London has two piers through which freight moves: State Pier and Long Dock (also
known as CVRR Pier or the Salt Pier). The State Pier is approximately 1,000 feet long with two main
berths and water depths of 30 to 35 feet. The Long Dock is an older pier with structural deficiencies.
The berthing area depths are 16 to 23 feet and are primarily used for berthing barges and smaller
vessels. The port also includes warehouses, a garage, an administration building, and support structures.
5.3.4 Ferry Operations
Ferry services located at the Port of New London that handle freight include:
Cross Sound Ferry: a passenger and road vehicle ferry service, operating between New London,
Connecticut and Orient, Long Island, New York. The service is privately owned and operated
by Cross Sound Ferry Services, Inc., and is headquartered in New London. According to the
company's website, it serves over one million passengers annually. The ferry handles trucks
moving freight between Connecticut and Long Island. Outside of the peak summer season, the
ferry has excess capacity that is used for trucks and freight, which includes gravel and other
heavy items (Connecticut Office of Policy and Management 2013).
The Fishers Island Ferry District: a passenger, auto, and freight service operating between New
London and Fishers Island, New York.
The Block Island Express: a passenger-only service operating between New London and Block
Island, Rhode Island.
5.4 AIR CARGO
Air cargo in Connecticut is handled through the state-owned Bradley International Airport (BDL). BDL
has three cargo complexes: Roncari Freight Facility, Aviation Facilities Company, and UPS Air Express
Sorting Hub. BDL also services six air cargo airlines: ABX Air, FedEx Express, FedEx Feeder (by Wiggins
Airways), Southern Air, UPS Airlines, and Flight Express. In 2009, BDL handled approximately 110,000
tons of air cargo.
5.5 PIPELINE
Connecticut is served by both gas and oil pipelines. There are approximately 590 miles of gas
transmission pipelines in Connecticut, with three interstate pipelines which together move for 43
percent of the state’s natural gas imports, by weight. Natural gas also accounts for 88 percent of all
commodities moved through the state’s pipelines. The principal lines in Connecticut are23:
23 Connecticut Department of Energy and Environmental Protection

Page 5-6 CONNECTICUT STATEWIDE FREIGHT PLAN
CONNECTICUT FREIGHT TRANSPORTATION ASSETS Final Report
Algonquin Gas Transmission (AGT - Enbridge) originates in New Jersey where it connects to
Texas Eastern and runs from Danbury northeasterly to Thompson, with major spurs to North
Haven and New London.
Iroquois Gas Transmission System (IGT) starts at the Canadian border, enters Connecticut at
Sherman and runs southeast through Milford, then offshore to Long Island.
Tennessee Gas Transmission (TGP -Kinder Morgan) starts in the Gulf, enters Connecticut in
Greenwich, runs northeasterly leaving Connecticut in Suffield, with a spur from Massachusetts
to Torrington.
The principal oil pipeline in Connecticut transports jet fuel from the Port of New Haven (Buckeye
terminal) to the Bradley International Airport and for the Massachusetts Air National Guard Base in
Westover, Massachusetts (Connecticut’s Deep-Water Ports Strategy Study, 2012).

CONNECTICUT STATEWIDE FREIGHT PLAN Page 6-1
6. ECONOMIC CONTEXT OF FREIGHT
There are strong correlations between the amount or value of freight shipped and the overall health of a
state or regional economy. The freight transportation system is the means by which Connecticut moves
its exports and by which it imports components and materials for the goods it produces and the
consumer goods it consumes. Freight movement is vital to the state, and the right increases in freight
transportation supply will have a direct and positive effect on economic growth.
6.1 HIGHLIGHTS
In 2014, the shipments of commodities on Connecticut’s freight system contributed to business
activity valued at $58.1 billion. Nearly one-quarter of business activity in the state is directly
related to goods movement.
Connecticut’s $251 billion economy includes $26.8 billion attributed to freight-dependent
manufacturing sectors. The output of the manufacturing sector alone amounts to 10.7 percent
of the state economy.
Across all business sectors, outbound freight transportation dependency represents $58.7 billion
of the state economy while inbound freight transportation dependency represents $57.5 billion
of Connecticut’s economy.
The Aircraft Engine and Parts and the Aircraft Manufacturing Sectors are the top industry
drivers of the 3.2 percent average annual compound growth in the Primary Manufacturing
Sector forecasted from 2015 to 2042.
The Pharmaceutical Preparation Manufacturing industry leads the Secondary Manufacturing
Sector in Connecticut, and is forecast to more than triple in value of output to over $27 Billion
annually by 2042.
Refined Petroleum Products is the top commodity category shipped into the state, accounting
for 14 percent of the total of all inbound shipments to the state.
Warehouse and Distribution Center freight traffic represents six percent of total inbound
shipments into the state.

Page 6-2 CONNECTICUT STATEWIDE FREIGHT PLAN
ECONOMIC CONTEXT OF FREIGHT Final Report
6.2 DEPENDENCE OF CONNECTICUT INDUSTRY ON FREIGHT
TRANSPORTATION
6.2.1 Businesses & Economic Dependence on Freight
Businesses in Connecticut depend on the movement of goods
to reach their customers and provide inputs for their
continued operations. The degree to which industries depend
on freight transportation varies with the nature of the
business, with agriculture and some manufacturing firms
depending more on outbound freight transportation of
production than for inbound transportation of supplies.
Consumers in Connecticut, as represented by households, are
primarily freight dependent for deliveries, using inbound
transport of freight much more heavily than outbound freight
transport of waste, recyclables, product returns or parcel
shipments. At one extreme, the (passenger and freight) rail
transportation service industry is almost entirely dependent
on outbound transportation, with approximately 97 percent of
the sector’s output, value added, income and jobs dependent
on outbound transportation. In contrast, many businesses in
service sectors of the economy depend very little on freight
transportation in either direction, essentially only requiring
office supplies as physical inputs provided by inbound transportation. Thus, industry sectors such as
Finance and Insurance show zero percent outbound freight transportation service dependence24 and
only about one percent dependence on inbound freight transportation. Appendix B contains the
dependency on freight transportation in Connecticut of the individual industries that comprise the state
economy. These are presented as a percent of total output, value added, income25 and jobs26 separately
for outbound transportation and then for inbound transportation.
For Connecticut, the economic dependence on outbound transportation for all industries is 23.4
percent for output, 24.8 percent for value added, 23.5 percent for income and 22.8 percent for jobs.
The overall economic dependence on inbound transportation of all industries is 22.9 percent for output,
20.8 percent for value added, 22.8 percent for income and 23.2 percent for jobs. This means outbound
freight transportation dependency represents $58.7 billion of the Connecticut economy while inbound
freight transportation dependency represents $57.5 billion of the state economy. In the future, as the
service sector share of the economy continues to grow, the overall average economic dependence on
freight will shrink, although with the economy already heavily dominated by the service sectors, further
reductions in freight dependence will be small.
24 Garbage collection and outbound postal mail pickups are not included in the outbound freight dependency data. 25 U.S. Bureau of Economic Analysis defines income as the wages and salaries of workers in jobs in the industry 26 U.S. Bureau of Economic Analysis defines jobs as the number of workers employed in the industry
What are Output and
Value Added?
Output is a measure total industry
sales, including those used as
inputs to produce goods by other
companies.
Value added is the difference
between the output of an industry
and the cost of the inputs needed
to produce the industry’s goods.
This is sometimes seen as a
measure of profitability.

CONNECTICUT STATEWIDE FREIGHT PLAN Page 6-3
Final Report ECONOMIC CONTEXT OF FREIGHT
6.3 INDUSTRY PROFILE OF THE CONNECTICUT ECONOMY
The economy of Connecticut, like the U.S., is dominated by
the services sector, rather than goods producing sectors such
as Manufacturing, Agriculture or Mining. At the end of 2015,
the Connecticut Department of Labor reported that just 9.5
percent of state employment was engaged in manufacturing,
while 90.4 percent of non-farm employment was in the service
sector. Freight transportation serves all industries in the state,
but Manufacturing remains the most directly dependent on
freight transportation besides the Transportation Services
sector itself. According to the U.S. Bureau of Economic
Analysis, Connecticut’s $251 billion in Gross State Product
(2014) included $26.8 billion (10.7%) attributed to the freight-
dependent manufacturing sectors. Within the past decade, the
recession of 2008-2009 resulted in a large downturn in the
state’s Manufacturing, Wholesale and Retail Trade and
Warehousing and Distribution sectors. In Connecticut, the
Wholesale and Retail Trade and Warehousing and
Distribution sectors have recovered and now exceed pre-
recession levels of output. The value of output in the Manufacturing sectors has struggled to recover,
and is still below pre-recession peaks. The state’s Agriculture and Utility sectors experienced smaller
impacts from the 2008 recession, although they have since grown slowly.
The long-term forecasts are for continued recovery in Connecticut Manufacturing, with both Primary27
Manufacturing and Secondary Manufacturing sectors growing the most of any sectors in the state.
Wholesale and Retail Trade are also expected to see gains. Compared with Manufacturing, the size and
growth of the Warehousing and Distribution, Agriculture and Extraction and Utilities sectors are
forecasted to be much smaller for Connecticut. These slower growing sectors are in a more mature
phase of development with limited in-state potential to grow as rapidly as new technically-oriented
manufacturing due to the competitive situation, the impact of regulations and availability of land
compared with alternative suppliers out-of-state.
Comparisons in the relative value of industry sector output forecasted to 2042 in Figure 6.1 show the
long-term importance of Manufacturing and Wholesale and Retail Trade to Connecticut. More detailed
economic analysis can be found in Appendix B.
27 Primary Manufacturing transforms raw materials into industrial materials. Secondary Manufacturing produces goods for final consumption from industrial
materials and components.
Economic Data and
Modeling
The IHS-Transearch Modal
Commodity database contains
information about the value and
tonnage of Connecticut freight
flows. This database is linked with
input-output tables - information
about how Connecticut industries
use and produce commodities.
Together these data sources help
us understand the value of freight
to the Connecticut economy.

Page 6-4 CONNECTICUT STATEWIDE FREIGHT PLAN
ECONOMIC CONTEXT OF FREIGHT Final Report
Figure 6.1: Trends in the Major Industry Sector Shares of the
Connecticut Economy, 2008 – 2042
Source: EDR Group from TREDIS and Moody’s Analytics
6.4 INDUSTRIES DRIVING MANUFACTURING GROWTH IN THE
CONNECTICUT ECONOMY
The Primary Manufacturing industry sector within the
Connecticut economy is being driven by the growth in the
Aircraft Engine and Parts and the Aircraft manufacturing
sectors. These two sectors are the top industry drivers of the
3.2 percent average annual compound growth in the Primary
Manufacturing Sector forecasted from 2015 to 2042. In
Figure 6.2 the composition of output of the top industries
driving the Connecticut Primary Manufacturing sector shows
the relative importance of the aircraft engine and aircraft
manufacturing sectors to other sectors in the Connecticut
economy.
-
20,000
40,000
60,000
80,000
100,000
120,000
$ M
illio
ns
Project Period
Primary Manufacturing Secondary Manufacturing Wholesale and Retail Trade
Warehousing and Distribution Utilities Agriculture and Extraction
Primary and Secondary
Manufacturing
Primary Manufacturing transforms
raw materials into industrial
materials. Secondary
Manufacturing produces goods for
final consumption from industrial
materials and components.

CONNECTICUT STATEWIDE FREIGHT PLAN Page 6-5
Final Report ECONOMIC CONTEXT OF FREIGHT
Figure 6.2: Composition of Output of Top Industries Driving the
Connecticut Primary Manufacturing Sector to 2042
Source: EDR Group
Apart from aircraft, aircraft engine and parts manufacturing, other top drivers of the Primary
Manufacturing sector growth are Relays and Industrial Controls manufacturing and Other Basic Organic
Chemical manufacturing. After the declines in these industry sectors observed in 2009 – 2010, the
forecast for continued average annual compound growth from 2015 to 2042 of 4.3 percent and 3.7
percent, respectively, in these subsectors shows the key drivers of the forecast growth in Primary
Manufacturing.
The Secondary Manufacturing industry sector within the Connecticut economy is being driven by the
growth observed and forecasted to continue in the Pharmaceutical Preparation Manufacturing industry.
The Secondary Manufacturing in this case is production of finished pharmaceutical preparation products
for consumption from industrial materials and components. As seen in Figure 6.3, though this industry
saw a great decline in output following the 2008 recession, and recovery has been subsequently modest,
the longer-term projections are for steady modest growth that leads to record high output, as the value
of production, by 2036 and further growth beyond. The other industry sectors driving growth in
Secondary Manufacturing are projected to see modest growth.
The geography of freight shipments in the inbound direction to Connecticut, in total across modes of
transportation for 2013 in millions of dollars, is depicted in the state inbound freight map in Figure 6.4.
Inbound freight follows the location of the economic activity in the state, in Fairfield, New Haven and
Hartford counties.

Page 6-6 CONNECTICUT STATEWIDE FREIGHT PLAN
ECONOMIC CONTEXT OF FREIGHT Final Report
Figure 6.3: Composition of Output of Top Industries Driving the
Connecticut Secondary Manufacturing Sector to 2042
Source: EDR Group
Figure 6.4: Connecticut State Inbound Freight Map, Total All Commodities,
All Modes of Transport by County, 2013
Source: CDM Smith

CONNECTICUT STATEWIDE FREIGHT PLAN Page 6-7
Final Report ECONOMIC CONTEXT OF FREIGHT
The geography of shipments in the outbound direction from Connecticut, in total, across modes of
transportation for 2013 is depicted in the Connecticut state outbound freight map in Figure 6.5.
Bradley International Airport, rail lines connecting Connecticut to Massachussets rail lines and
intermodal centers, as well as I-91 are significant freight assets located in Hartford county, which has the
largest share among Connecticut counties of outbound freight movements by value.
Figure 6.5: Connecticut State Outbound Freight Map, Total All Commodities,
All Modes of Transport by County, 2013
Source: CDM Smith

Page 6-8 CONNECTICUT STATEWIDE FREIGHT PLAN
ECONOMIC CONTEXT OF FREIGHT Final Report
This page intentionally left blank.

CONNECTICUT STATEWIDE FREIGHT PLAN Page 7-1
7. FREIGHT DEMAND
In 2014, 212.0 million tons of freight valued at $365.4 billion
moved over Connecticut’s transportation system. Freight
moves almost exclusively by truck, accounting for 93.7 percent
of all freight moved in terms of tonnage and 92.4 percent by
value. Port, rail and air account for the remaining commodities
transported in the state. Figure 7.1 and Figure 7.2 show the
mix of modes and their contribution to the state’s freight
movements, by tonnage and value. Despite the presence of
significant congestion, Connecticut’s highway system is the
most direct and accessible means of transport, both for long-
distance movements that begin or end outside the state and
for local transport and deliveries.
Figure 7.1: Mode Share of Freight Moved in Connecticut
by Tonnage (Millions), 2014
Source: IHS-Transearch and CDM Smith
Why we need to
understand freight demand
Understanding the how, where
and how much of freight travel
helps CTDOT target future
improvements where they will
produce the most public benefit.

Page 7-2 CONNECTICUT STATEWIDE FREIGHT PLAN
FREIGHT DEMAND Final Report
Figure 7.2: Mode Share of Freight Moved in Connecticut by Value ($Millions), 2014
Source: IHS-Transearch and CDM Smith
7.1.1 Freight Flow by Direction
Slightly less than half (44.4 percent by weight) of all freight that moves in Connecticut passes through
the state, that is, it is neither originating from or destined to a location in Connecticut. Interstate freight
traffic is a fact for all states, however, as a gateway state Connecticut experiences a relatively high
proportion of through traffic. (Figure 7.3) Nearly all freight through traffic travels on Connecticut’s
highway system (99.9 percent). In effect, the highway freight system in Connecticut serves the
economies of its neighbors, New York and Massachusetts, as well as its own.
Figure 7.3: Connecticut Freight Moved by Direction,
Tons (Millions) and Value ($Millions), 2014
Source: IHS-Transearch and CDM Smith
Connecticut is a net importer (of commodity goods, highlighting the state’s transformation to a service-
based economy that consumes more physical goods than is exported. Over 27.5 percent of total freight
flows are inbound, compared to 11.0 percent by weight outbound.

CONNECTICUT STATEWIDE FREIGHT PLAN Page 7-3
Final Report FREIGHT DEMAND
Figure 7.4 presents the distribution of freight flows by direction in Connecticut. As the charts show,
the shares of inbound, outbound, internal and through travel by value and by tonnage are very similar,
with through travel leading, followed by inbound, outbound and internal travel.
Figure 7.4: Connecticut Freight Moved by Direction and Mode
(Percentage by Weight on Left, Value on Right), 2014
Source: IHS-Transearch and CDM Smith
From a statewide perspective, most freight moves by truck in Connecticut. However, the water, air and
rail systems carry significant amounts of freight either outbound or inbound and are well suited for
moving particular commodities. Figure 7.4 shows that:
Waterborne transportation moves 15.0 percent of all
inbound freight by weight, 70 percent of which is
composed of petroleum products such as fuel oil.
By weight, rail accounts for about 5 percent of
outbound shipments, over 65 percent of which is low
value, high weight cargo such Waste or Scrap
Materials and Non-metallic Minerals.
By value, air shipments account for 7.5 percent of
freight shipped out of Connecticut. These shipments
correspond to low weight, high value small package
shipments as well as electronic equipment and other
high value manufactured goods.
The commodity categories that travel in Connecticut are dominated by heavy goods such as Petroleum
Products (21 percent), Food and Kindred Products (13 percent) and Nonmetallic Minerals (18 percent).
Several of the top 10 commodities are often shipped relatively short distances, and their use in
construction of buildings and infrastructure around the state makes their transport important to the
state economy. Petroleum and Coal products are important in the state as the transportation
equipment and residential heating users of these products sustain inbound demand. Waste and scrap
commodities are usually produced as a byproduct of manufacturing or just from the end-of-life of
commodities. Figure 7.5 presents the top 10 commodities that travel in Connecticut, by weight. The
top 10 accounts for 88.6 percent of all commodities.
What do some of these
commodity names mean?
Secondary traffic means freight
movements from distribution
centers or warehouses to
consuming points like retail stores.
Carbon, rock salt and sulfur are
examples of non-metallic minerals.
Their average value is $10/ton in
Connecticut

Page 7-4 CONNECTICUT STATEWIDE FREIGHT PLAN
FREIGHT DEMAND Final Report
Figure 7.5: Connecticut Top 10 Commodities (Percentage by Weight), 2014
Source: IHS-Transearch and CDM Smith
Secondary traffic refers to freight movements from distribution centers or warehouses to consuming
points like retail stores.

CONNECTICUT STATEWIDE FREIGHT PLAN Page 7-5
Final Report FREIGHT DEMAND
7.2 TRUCKING
In 2014 12.7 million truck units carried 198.7 million tons of freight, valued at $337.5 billion. On average,
total truck commodity movements are valued at $1,698/ton. Truck movements represent 93.7 percent
of modal tonnage in Connecticut and 92.4 percent of total modal value in 2014, by far the largest
relative share. Through travel accounts for over 60 percent of all freight-related truck vehicle miles
traveled (VMT) in Connecticut, and less than 10 percent of the truck freight travel is produced by local
freight movements.
Freight-carrying trucks account for 10-15 percent of all vehicles on Connecticut’s most heavily traveled
roads. I-95 from New York to New Haven, I-91 from New Haven to Hartford and I-84 from New York
to Massachusetts carry the highest volumes of trucks in the state, whether by tonnage or by value.
Figure 7.6 and Figure 7.7 present truck freight volumes by tonnage and value, respectively.
Figure 7.6: Connecticut Freight Volume Moved by Truck by Route, 2014
Source: CDM Smith and IHS-Transearch data

Page 7-6 CONNECTICUT STATEWIDE FREIGHT PLAN
FREIGHT DEMAND Final Report
Figure 7.7: Connecticut Freight Value Moved by Truck by Route, 2014
Source: CDM Smith and IHS-Transearch data

CONNECTICUT STATEWIDE FREIGHT PLAN Page 7-7
Final Report FREIGHT DEMAND
7.2.1 Truck Flows From, To and Within Connecticut
Major outbound truck tonnages in 2014 are shown by county origin in Figure 7.8. Truck movements
destined for out-of-state travel from Hartford County (8.5 million, 25.4 percent), New Haven County
(7.0 million, 20.9 percent), and Fairfield County (6.0 million, 17.8 percent). Nearly 2/3 of the out-of-state
shipments are destined for a neighbor state. The major destinations of outbound freight are New York
(10.2 million, 30.3%), Massachusetts (7.8 million, 23.3%), and New Jersey (3.5 million, 10.4%).
Figure 7.8: Top Outbound Truck Shipments by Tonnage
(with county of origin), 2014
Source: CDM Smith and IHS-Transearch data

Page 7-8 CONNECTICUT STATEWIDE FREIGHT PLAN
FREIGHT DEMAND Final Report
Major inbound truck tonnages in 2014 are shown by state origin in Figure 7.9. Over half of all truck
movements originate from a nearby state: New York (11.2 million, 23.0%), Massachusetts (7.7 million,
15.9%), and New Jersey (6.5 million, 13.4%). The primary destinations of inbound truck shipments are
Hartford County (14.0 million, 28.8%), Fairfield County (11.7 million, 24.0%), and New Haven County
(10.5 million, 21.6%).
Figure 7.9: Top Inbound Truck Shipments by Tonnage
(with county of destination), 2014
Source: CDM Smith and IHS-Transearch data

CONNECTICUT STATEWIDE FREIGHT PLAN Page 7-9
Final Report FREIGHT DEMAND
7.2.2 Truck Freight Types and Distances
Travelled
Connecticut is part of a dense, compact region in close
proximity to major transfer points for water-borne traffic and
rail traffic. Connecticut is part of a multimodal network in
which a significant proportion of truck freight moves goods for
the last leg of a multimodal trip.
There is currently a substantial amount of containerized cargo
that is destined for, or originates in, Connecticut. Virtually all
international containerized cargo enters or departs through
non-Connecticut ports, with the Port of New York and New
Jersey handling most of it. These containers are then moved to
and from Connecticut by truck, for the most part utilizing the
I-95 corridor.
For the top two types of truck trips in Connecticut, Truckload
and Private trucking, the greatest number of trips is in the 101-to-200-mile length category. The largest
number of Less-Than-Truckload (LTL) truck trips is in the 500-and-over miles length category, reflecting
the smaller shipment size services provided by the LTL motor carriers.
Connecticut-serving truck freight travels relatively short distances, indicating that nearby origins and
destinations such as warehouse and distribution centers, retail centers, ports and airports serve a large
proportion of commodity needs. Approximately 70 percent of all Connecticut-serving truck trips
(excluding through travel) are within a four-hour drive of the state. Figure 7.10 shows the distribution
of truck travel by distance category for Connecticut truck freight movements, by truck delivery
category.
Figure 7.10: Distribution of Connecticut Truck Freight Travel by Distance, 2014
(Trips, excluding through travel)
Source: CDM Smith and IHS-Transearch data
Container Traffic
Containers have standardized
dimensions. They can be loaded
and unloaded, stacked,
transported efficiently over long
distances, and transferred from
one mode of transport to another
without being opened. The
handling system is completely
mechanized.
Source: U.S. Bureau of Transportation
Statistics

Page 7-10 CONNECTICUT STATEWIDE FREIGHT PLAN
FREIGHT DEMAND Final Report
7.2.3 Commodities Carried by Truck
Figure 7.11 and Figure 7.12 present the top
commodities delivered by truck in 2014. Collectively,
consumer goods transferred from warehouses or other
transfer points (Secondary Traffic), fuel, commodities
used in construction and manufacturing (Clay, Concrete,
Glass or Stone and Non-metallic minerals) and food
goods accounted for 71 percent of all goods shipped by
truck
In terms of value, the top commodities shipped in 2014
are Secondary Traffic, Electrical Equipment, Chemicals
and Food Products (Figure 7.12). These five
commodities accounted for 48 percent of all goods
shipped by value in 2014.
Figure 7.11: Tonnage of Top Five Commodities Shipped by Truck, 2014
Source: CDM Smith and IHS-Transearch data
Truck Freight Categories
Truckload: A single trailer or container
that encounters multiple forms of
transportation along its route, such as
truck/ship/rail.
Less than truckload (LTL): A driver or
carrier with many types of cargo and
many different destinations. Generally,
involves the use of terminal facilities to
break and consolidate shipments. A LTL
driver normally has a dedicated or
regional route.
Source: US Bureau of Transportation Services

CONNECTICUT STATEWIDE FREIGHT PLAN Page 7-11
Final Report FREIGHT DEMAND
Figure 7.12: Value of Top Five Commodities Shipped by Truck 2014
Source: CDM Smith and IHS-Transearch data
7.2.4 Forecast Truck Freight Demand
Truck tonnage is forecast to increase from 198.7 million in 2014 to 315.4 million in 2040, an increase of
58.7 percent (1.8 percent annually). Truck commodity value is forecast to increase from $337.5 billion in
2014 to $681.1 billion by 2040, an increase of 101.8 percent (2.7 percent annually). The most heavily
traveled truck routes today will absorb the most growth, according to forecasts, meaning I-95 from
New York City to New Haven, along I-91 from New Haven to Harford, and from Harford to the
Massachusetts border along I- 84 (see Figure 7.13). In percentage terms, the growth is more dispersed
throughout Connecticut, with many secondary routes exhibiting a greater percentage growth than the
primary interstate corridors.
Total truck freight-related vehicle miles traveled (VMT) is expected to increase by 88 percent from 2009
to 2040. Through freight is projected to account for the largest share of the forecasted increase in
Connecticut’s freight truck travel, which is expected to increase by 103 percent.28
Year 2040 truck travel forecasts are mapped in Figure 7.13. Consistent with current patterns, future
truck freight flows are forecast to be concentrated on the Interstate System, with the highest flows
occurring between Connecticut and New York, and Connecticut and Massachusetts.
28 Development of a Strategic Plan for Reducing Emissions Associated with Freight Movement, Connecticut Department of Energy and Environmental
Protection, July 2011

Page 7-12 CONNECTICUT STATEWIDE FREIGHT PLAN
FREIGHT DEMAND Final Report
Figure 7.13: Connecticut Truck Freight Tonnage Growth, 2014-2040
Source: CDM Smith and IHS-Transearch data

CONNECTICUT STATEWIDE FREIGHT PLAN Page 7-13
Final Report FREIGHT DEMAND
7.2.5 Major Truck Freight Generators
Thousands of retail shops, warehouses and
manufacturing plants throughout Connecticut
ship and receive goods delivered by truck every
day. Several dozens of these generate significant
volumes of truck traffic, due to the freight-
intensive nature of the business or the sheer
size of the establishment, or a combination of
the two. Connecticut’s major truck freight
generators impact regional and local freight
operations, and produce traffic impacts on local intersections, freeway ramps and mainline facilities. In
understanding these businesses and their locations, CTDOT can learn more about their transportation
needs and their impact on the local and regional transportation systems.
Figure 7.14 presents the locations of the major freight generators. For the most part, the generators
lie along the state’s major travel corridors.
Figure 7.14: Location of Major Truck Freight Generators
Source: CTDOT, 2017
Truck Freight Generators
CTDOT used in-house knowledge and
employment databases to develop this first-ever
compilation of truck freight generators. CTDOT
will continue to expand and refine this database,
as a shared resource with MPO partners.

Page 7-14 CONNECTICUT STATEWIDE FREIGHT PLAN
FREIGHT DEMAND Final Report
7.3 FREIGHT RAIL
There are eight railroad companies in Connecticut that carry freight either through leasing agreements
or through operations on their owned infrastructure and equipment. The rail freight system in
Connecticut is largely owned by the private sector, but significant portions of it are owned by AMTRAK
(Amtrak, or the National Railroad Passenger Corporation, is partially government funded yet operated
and managed as a for-profit corporation) and CTDOT.
7.3.1 Existing Rail Freight Demand
In 2014, rail freight moved 3.1 million tons of goods, valued at $2.2 billion, carried by 32,619 units. On
average, total rail commodity movements are valued at $724/ton. Rail movements represented 1.5
percent or modal tonnage in Connecticut and 0.6 percent of total modal value in 2014.
Major rail freight corridors include routes served by the major rail operators (Class 1 carriers), as seen
in Figure 7.15. The densest rail traffic routes parallel the truck routes: between New York City and
New Haven along the Metro-North Commuter Railroad-owned track (MNCW) along I-95, and from
New Haven up through Hartford and beyond along the Amtrak-owned track (AMTK) parallel to I-91.
Figure 7.15: Connecticut Freight Rail Tonnage, 2014
Source: CDM Smith and IHS-Transearch data

CONNECTICUT STATEWIDE FREIGHT PLAN Page 7-15
Final Report FREIGHT DEMAND
Freight rail accounts for less than two percent of all Connecticut goods movement. The factors
contributing to this level of usage include:
The location of rail freight routes and intermodal terminals in adjacent states. Major container
ports and rail yards are in New York, northeastern New Jersey and Massachusetts.
The weakening of Connecticut’s industrial base and tightening of the product stream. This
results in changes to the way goods are manufactured, shipped, and received.
Class 1 rail service is limited to portions of southwest Connecticut.
The nearest freight rail crossing of the Hudson River connecting southwest Connecticut with
New York is 140 miles north of New York City at Selkirk, New York. Freight rail that passes
through Selkirk must enter or leave Connecticut through Massachusetts.
The increase in the use of just-in-time delivery reduces the amount of supplies needed to be
kept on hand, limiting the amount of inventory and warehousing needed.
Significant tonnage is moved each year by several freight railroads that serve Connecticut. Figure 7.16
illustrates the shares of freight tonnage moved in 2014. These freight railroads are connected to the
North American rail network. CSX Transportation handles most of the long-haul rail freight traffic into
and out of Connecticut. It uses a freight hub at a large rail yard in Selkirk, New York, near Albany.
Trains from across the country are routed direct to Selkirk, much like the hub-and-spoke concept
utilized by airlines and FedEx. From Selkirk, large blocks of railcars are sent to direct connections with
Connecticut short line and regional railroads in Massachusetts.
Figure 7.16: Rail Freight Tonnage by Operator, 2014
Source: CDM Smith and IHS-Transearch data
In addition, significant rail freight traffic from Atlantic Canada, the Midwest, Gulf Coast, and Pacific Coast
enters Connecticut at Stafford Springs, over the New England Central Railroad. High-value chemical and
plastic pellet rail traffic that originates in the Gulf Coast region is routed to Chicago and Montreal, and
then to a connection with the New England Central Railroad.

Page 7-16 CONNECTICUT STATEWIDE FREIGHT PLAN
FREIGHT DEMAND Final Report
Connecticut’s freight rail system exports low value high weight commodities and imports higher value
goods for construction and as inputs to manufacturing processes. In 2014, outbound rail accounted for
nearly 60 percent of all rail freight movements, with a low value weight per ton of $399. The major
categories of freight rail traffic originating in the state include scrap metal and paper; crushed stone,
gravel and sand; concrete and clay products; pulp and paper products; and chemicals. Inbound traffic
accounted for 28 percent of the total by weight, but the inbound freight is more valuable: the average
value per ton in 2014 was $1,587. The major categories of freight rail traffic terminating in Connecticut
include crushed stone, gravel and sand; primary metal products; grain and food products; lumber and
wood products; pulp and paper products; chemicals; and petroleum and coal products.
The top five commodities by tonnage and value are shown in Figure 7.17 and Figure 7.18.
Nonmetallic minerals, the top commodity by weight, accounts for over 37 percent of all outbound
shipments but is value is only $10 per ton. Primary Metal Products is the top commodity by value
($2,268 per ton) and accounts for over 54 percent of all inbound shipments, by value.
Figure 7.17: Top Five Commodities Shipped by Rail by Tonnage (Thousands), 2014
Source: CDM Smith and IHS-Transearch data
Figure 7.18: Top Five Commodities Shipped by Rail by Value ($ Millions), 2014
Source: CDM Smith and IHS-Transearch data

CONNECTICUT STATEWIDE FREIGHT PLAN Page 7-17
Final Report FREIGHT DEMAND
7.3.2 Forecast Rail Freight Demand
Rail tonnage is forecast to increase from 3.1 million in 2014 to 5.5 million in 2040, an increase of 78.3
percent (2.2 percent annually). Rail commodity value is forecast to increase from $2.2 billion in 2014 to
$3.4 billion by 2040, or 54.7 percent(1.7 percent annually). Rail freight growth is projected to occur on
the rail-equivalent corridors of the most heavily traveled truck routes, generally following I-95 and I-91.
In percentage terms, the largest growth in rail traffic is projected for the southeastern portion of the
state (Figure 7.19).
Figure 7.19: Forecast of Truck Freight Growth (by tonnage), 2014-2040
Source: CDM Smith and IHS-Transearch data
7.4 WATER TRANSPORTATION
In 2012, the Connecticut Office of Policy Management
released the results of a year-long study on the state’s three
deep water ports. Connecticut’s Deep-Water Port Strategy
Study provides a market analysis and identification of
infrastructure investments to assist the state in developing and
implementing a long-term strategy for economic development
Port Forecasts
The IHS-Transearch port flow
data is limited in explaining
international imports and exports.
CTDOT used a different database
(U.S. Census waterborne statistics)
for existing port flows, but used
IHS Transearch to provide an
indication of 2014-2040 growth.

Page 7-18 CONNECTICUT STATEWIDE FREIGHT PLAN
FREIGHT DEMAND Final Report
of the ports. The study acknowledges that the decline in goods movement through Connecticut’s ports
can be attributed to the evolving economies of scale supply chain in the U.S., the ports’ geographic
locations, and changes in Connecticut’s industries.
According to the study, there are four key characteristics of a successful container port:
Ready access to major metropolitan consumer markets—largely served by trucks and local
warehousing;
Adequate waterside and landside capacity to accommodate ever-larger ships (e.g. dredging,
berthing and cranes), longer trains (e.g. on-dock and near-dock rail facilities) and larger volumes
of heavier trucks (e.g. dedicated truck ramps and sophisticated gate and security control
systems);
Adequate financial resources to build, maintain, and constantly enhance waterside, landside and
offsite transportation capacity, and
Adequate institutional capacity to provide a stable and adaptable investment climate for both
public and private investors.
The State of Connecticut has established a port authority and current planning initiatives indicate a
desire for additional port development. Connecticut’s ports are capable of serving some local demand
but are challenged to capture a significant share of regional demand, given the established presence of
significant port operations in New York and Massachusetts. As shown in Figure 7.20, New York and
New Jersey (mostly comprising activity at the Port of New York & New Jersey) dominate regional
ocean-going trade with more than $130 billion worth of cargo moved in 2016. Connecticut, ranked 36th
by port trade value, conducted trade worth $8.7 billion in 2016. Imports accounted for 78 percent of
the total.

CONNECTICUT STATEWIDE FREIGHT PLAN Page 7-19
Final Report FREIGHT DEMAND
Figure 7.20: Value of Port Trade by State, 2016
Source: Bureau of the Census, USA Trade Online
7.4.1 Existing Port Demand
The value of port trade for Connecticut’s three deep water ports is shown in Figure 7.21. The Port of
New Haven is the dominant port in terms of total value and tonnage of domestic shipments.
Figure 7.21: Value of Trade by Connecticut Port, 2016
Source: Bureau of the Census, USA Trade Online
The value of Connecticut port imports and exports by major commodity is shown in Figure 7.22,
Figure 7.23 and Figure 7.24. Liquid bulk fuels and petroleum products comprise most of
Connecticut’s imports, and originate predominately from other New England ports. Export shipments
are largely barge movements to the southern U.S. and Gulf coast region.

Page 7-20 CONNECTICUT STATEWIDE FREIGHT PLAN
FREIGHT DEMAND Final Report
Figure 7.22: Commodities Shipped from and to Port of Bridgeport, by Value, 2016
Source: Bureau of the Census, USA Trade Online
Figure 7.23: Commodities Shipped from and to Port of New Haven, by Value, 2016
Source: Bureau of the Census, USA Trade Online
Figure 7.24: Commodities Shipped from and to New London, by Value, 2016
Source: Bureau of the Census, USA Trade Online

CONNECTICUT STATEWIDE FREIGHT PLAN Page 7-21
Final Report FREIGHT DEMAND
Other significant imports in terms of value include salt (New Haven and New London), railway track
(Bridgeport), and iron and steel (New London). Scrap metal is nearly the only waterborne export by
value shipped out of New Haven. Biodiesel accounts for nearly 50 percent of the non-petroleum based
fuel oil imports at New Haven. Bitumen, used in roofing
and paving, is the dominant import at Bridgeport at 64
percent. New Haven’s dominant import is fuel oil 74
percent and New London imports a variety of fabricated
iron and steel products, which in total account for 97.4
percent of all New London imports by value.
7.4.2 Forecast Port Demand
Growth in port flows is forecast to be modest, due to the
continued strong competitive position of the Port of New
York and New Jersey and the relative inaccessibility of
Connecticut’s ports in the Long Island Sound. Between 2014 and 2040, cargo shipments are forecast to
grow by 8.3 percent and 6.6 percent, by tonnage and value, respectively. The commodity mix (fuel, scrap
metal, finished steel and metal goods, building materials, coal, optical and medical equipment) are
forecast to be similar to the composition of cargo today.
7.5 FERRY OPERATIONS
Ferries are not a freight transportation mode per se, however, Bridgeport and New London ferry
services transport more than half a million cars and trucks annually (CT Office of Policy and
Management 2013). No figures are available about freight moved on the state’s ferry system.
7.6 AIR CARGO
7.6.1 Current Air Cargo Demand
Connecticut air movements in 2014 totaled 115.8 thousand tons, valued at $16.5 billion. Operations at
Bradley International Airport account for nearly all-air cargo activity in the state. While air cargo
accounts for a small fraction of total commodity flows in the state, the freight it does transport is high-
value – averaging over $142,000 per ton.
Connecticut air movements in 2014 represented less than 0.1 percent of modal tonnage, but because of
the very high value/ton, air freight value represented 4.5 percent of total Connecticut freight value,
second behind trucking. In 2016, Bradley International Airport ranked 33rd in all cargo transport
tonnage, with 122,392 metric tons29 of cargo transported.
As seen in Figure 7.25 and Figure 7.26, the commodities shipped by air serve the higher-value
consumer goods market, manufacturing processes and various technology needs including those of the
medical industry. Small packaged goods by far accounted for the majority of 2014 air freight, by weight.
FedEx and UPS have consistently accounted for over 93 percent of air cargo activity at Bradley. The
highest value shipments by value were manufactured goods and electrical equipment.
29 From draft of 2017 Bradley International Airport Master Plan. One metric ton is equal to 2,204.6 pounds
Air Cargo
Bradley International Airport’s
ranking comes from Federal
Aviation Administration data and
pertains to all-cargo transport. It
does not include cargo shipped in
the “belly” of passenger jets.

Page 7-22 CONNECTICUT STATEWIDE FREIGHT PLAN
FREIGHT DEMAND Final Report
Figure 7.25: Air Cargo Handled at Bradley International Airport,
by Weight (pounds, 2014)
Source: IHS-Transearch and CDM Smith
Figure 7.26: Air Cargo Handled at Bradley International Airport,
by Value ($millions, 2014)
Source: IHS-Transearch and CDM Smith
7.6.2 Forecast Air Cargo Demand
According to IHS-Transearch forecasts, air tonnage is forecast to increase from 116 thousand tons in
2014 to 252 thousand tons in 2040, an increase of 117.3 percent (3.0 percent annually). Air commodity
value is forecast to increase from $16.5 billion in 2014 to $38.0 billion by 2040, or by 130.9 percent (3.3
percent annually). A nearly identical mix of top commodities as today is forecast for 2040: Small
Packaged Shipments, Electrical Equipment, Miscellaneous Manufacturing Products, and Instruments,
Photo and Optical Equipment Chemicals or Allied Products.

CONNECTICUT STATEWIDE FREIGHT PLAN Page 7-23
Final Report FREIGHT DEMAND
7.7 PIPELINE
Connecticut’s pipelines moved 287.9 thousand tons of Crude Petroleum, Natural Gas, and Petroleum or
Coal Products, valued at $62 million. In effect, almost 100.0 percent of all pipeline-related movements
are Crude Petroleum and Natural Gas, most of which is outbound Natural Gas, with some inbound
Crude Petroleum. The state’s primary petroleum pipeline has a terminus at the Buckeye terminal, at the
Port of New Haven.

Page 7-24 CONNECTICUT STATEWIDE FREIGHT PLAN
FREIGHT DEMAND Final Report
This page intentionally left blank.

CONNECTICUT STATEWIDE FREIGHT PLAN Page 8-1
8. CONDITION AND PERFORMANCE OF
CONNECTICUT’S FREIGHT SYSTEM
Connecticut is in the midst of a capital improvement program known as the Let’s Go CT! Ramp Up
program. The “ramp up” refers to the first five years of budget appropriations to jump start the 30-year
Let’s Go CT! vision. The initiative supports both passenger and freight transportation. However, aging
infrastructure affects all freight modes and funding for maintenance and improvements will continue to
be a concern. Assessing the freight system’s condition and performance helps inform and focus future
investment strategies.
8.1 HIGHWAY SYSTEM
8.1.1 Pavement Condition
The condition of roads on Connecticut’s National Highway System has steadily improved since 2012.
Currently, the ride quality on 86 percent of the system is in acceptable or better condition. (Figure
8.1)
Figure 8.1: 2011-2015 Condition of National Highway System Roads
Source: Connecticut Department of Transportation
Ride Quality
Ride quality measures the
roughness of the pavement as
you drive over it. In the future,
CTDOT will report additional
measures that address factors
like structural integrity.

Page 8-2 CONNECTICUT STATEWIDE FREIGHT PLAN
CONDITION AND PERFORMANCE OF CONNECTICUT’S FREIGHT SYSTEM Final Report
8.1.2 Bridge Condition
The condition of Connecticut’s bridges is on an upward-moving
trend (see Figure 8.2). Since 2012, the percentage of bridges in
a state of good repair has increased from 90.5 percent to 93.2
percent, against a system wide goal of 95 percent. Connecticut
can expect to see continued improvement in the bridge ratings
due to the ramp up.
Figure 8.2: Percent of State Maintained Bridges in a State of Good Repair (2011)
Source: Connecticut Department of Transportation
Bridge Condition
CTDOT inspects its bridges
thoroughly on a regular basis.
These inspections produce ratings
(National Bridge Inventory
Condition Ratings) of many bridge
components such as the deck and
substructure. The lowest rating
among the four main components
becomes the bridge’s overall
rating.

CONNECTICUT STATEWIDE FREIGHT PLAN Page 8-3
Final Report CONDITION AND PERFORMANCE OF CONNECTICUT’S FREIGHT SYSTEM
8.1.3 Mobility and Congestion
A significant number of locations on Connecticut’s roadway
system experience frequent, recurring slowdowns, especially
during the peak periods of weekday travel. Figure 8.3 shows
the frequency of slow travel during weekday evening travel
hours. Major roadways, including the signalized arterial system,
freeways and expressways, show many locations of slow
speeds more than 25 percent of the time around many of
Connecticut’s urbanized areas and on major corridors.
Connecticut is looking at an “all of the above” solution to the
issue of congestion, including providing more transit
opportunities, increasing highway capacity and pricing options.
Slow Speeds
Slow speeds correspond to the
percentage of observed speeds
that are under ½ the free flow
speed. Free flow speed is
measured during the overnight
hours, which are generally
congestion-free.

Page 8-4 CONNECTICUT STATEWIDE FREIGHT PLAN
CONDITION AND PERFORMANCE OF CONNECTICUT’S FREIGHT SYSTEM Final Report
Figure 8.3: Recurring Slow Speed Locations on the Connecticut Highway System (2016)
Source: National Performance Management Data Set and CDM Smith

CONNECTICUT STATEWIDE FREIGHT PLAN Page 8-5
Final Report CONDITION AND PERFORMANCE OF CONNECTICUT’S FREIGHT SYSTEM
8.1.4 Truck Freight Bottlenecks
In 2012, 12.7 million trucks 30 moved cargo on Connecticut’s
roadways, primarily in the National Highway System, including
the Interstate System. In completing their shipments within the
delivery windows they have agreed to, motor carriers must
travel through the same corridors as passenger vehicles, often
during the same peak travel periods. In 2016, the locations at
which truck drivers experience the most severe congestion
generally corresponded to the same locations as passenger
vehicles. They are:
I-95, from New York to Bridgeport
I-95, from West Haven to New Haven
I-95 from Old Lyme to East Lyme
I-84, from New York to Danbury (CT-7)
I-84, from east of Danbury (US-202 to CT-34)
I-84, West of Waterbury (CT-188 to CT-63)
I-84 in Waterbury, (CT-847 to 3 miles east)
I-84, from West Hartford to US 44 in Hartford
I-91 from North of CT-3 to Charter Oak Bridge ramps (East Hartford)
CT-5, from Berlin to CT-175
This review corroborates CTDOT’s emphasis on the need for congestion relief and the reconstruction
of sections of I-95 and I-84. However, last-mile connector issues, as well as operational, state of good
repair and truck parking issues exist as well, as the team learned through conversations with the
trucking industry and public agency stakeholders.
Figure 8.4 presents the most significant locations of truck delay in 2016.
30 Source: 2014 IHS-Global Insight data, expressed as truck units.
Truck Bottleneck Analysis
To identify bottlenecks the team
analyzed more than 150 million
speed observations and thousands
of truck volume counts on the
National Highway System
collected throughout Connecticut
in 2016, to estimate cumulative
truck delay. Using this large
volume of data helps to assure
that the high congestion locations
that have been identified are an
accurate reflection of actual
conditions experienced by truck
drivers.

Page 8-6 CONNECTICUT STATEWIDE FREIGHT PLAN
CONDITION AND PERFORMANCE OF CONNECTICUT’S FREIGHT SYSTEM Final Report
Figure 8.4: Truck High Congestion Locations, 2016
Source: CTDOT, National Performance Management System and CDM Smith

CONNECTICUT STATEWIDE FREIGHT PLAN Page 8-7
Final Report CONDITION AND PERFORMANCE OF CONNECTICUT’S FREIGHT SYSTEM
8.1.5 Truck Crashes
Crash Frequency
Between 2009 and 2014, commercial vehicle crashes represented 18.5 percent (105,704) of all motor
vehicle (571,618) crashes. Between 2009 and 2014, the average number of all motor vehicle crashes
decreased by an annual average rate of -1.42 percent, while commercial vehicle crashes decreased by an
annual average rate of -2.66 percent. The number of commercial vehicle crashes as a percentage of all
motor vehicle crashes varied from year to year, ranging from a high of 20.3 percent in 2011, to a low of
17.0 percent in 2012. (Table 9-1).
Table 8-1 : Commercial Vehicle and All Motor Vehicle Crashes by Year
(2009 – 2014)
Year Truck Crashes All Motor Vehicle Crashes CMV/All Vehicle Crashes
2009 19,614 103,710 18.9%
2010 19,662 101,621 19.4%
2011 15,904 78,435 20.3%
2012 16,264 95,452 17.0%
2013 17,117 95,826 17.9%
2014 17,143 96,574 17.8%
Total 105,704 571,618 18.5%
Source: CTDOT, Hosted by University of Connecticut’s (UConn) Connecticut Crash Data Repository
Crash Severity
All crashes are categorized as fatal, injury, or property damage only (PDO) based on the most severe
impact to the driver(s) or passenger(s). For example, a crash that results in a fatality and one injured
person would be categorized as fatal, a crash that results three injured persons would be categorized as
injury, and a crash that results in no fatalities or injured persons would be categorized as PDO.
There were 105,704 crashes involving a commercial vehicle between 2009 and 2014 (Table 8-2). The
percentage of crashes that involved fatalities, injury, and property damage only (PDO) was 0.3 percent,
21.5 percent, and 78.2 percent, respectively.
Table 8-2 : Commercial Vehicle Crashes Involving Pedestrians by Severity
(2009 – 2014)
Year Fatal Injury PDO Total
2009 36 4,206 15,372 19,614
2010 56 4,222 15,384 19,662
2011 45 4,110 11,749 15,904
2012 50 3,438 12,776 16,264
2013 54 3,452 13,611 17,117
2014 45 3,297 13,801 17,143
Total 286 22,725 82,693 105,704
Source: CTDOT, Hosted by University of Connecticut’s (UConn) Connecticut Crash
Data Repository

Page 8-8 CONNECTICUT STATEWIDE FREIGHT PLAN
CONDITION AND PERFORMANCE OF CONNECTICUT’S FREIGHT SYSTEM Final Report
There were 670 crashes involving pedestrians and a commercial vehicle between 2009 and 2014 (Table
8-3). The percentage of crashes with pedestrians that involved fatalities, injury, and PDO was 13.9
percent, 7.9 percent, and 78.2 percent, respectively. Almost one-fifth (17.8 percent) of all commercial
vehicle crashes that involved fatalities also involved pedestrians.
Table 8-3: Commercial Vehicle Crashes Involving Pedestrians by Severity
(2009 – 2014)
Year Fatal Injury PDO Total
2009 4 92 14 110
2010 13 121 10 144
2011 6 116 2 124
2012 8 79 4 91
2013 11 83 9 103
2014 9 75 14 98
Total 51 566 53 670
Source: CTDOT, Hosted by University of Connecticut’s (UConn) Connecticut Crash
Data Repository

CONNECTICUT STATEWIDE FREIGHT PLAN Page 8-9
Final Report CONDITION AND PERFORMANCE OF CONNECTICUT’S FREIGHT SYSTEM
Contributing Factors
Following Too Closely was the main contributing factor in nearly one third of commercial vehicle
crashes (28.8 percent) between 2009 and 2014 (Figure 8.5). The next highest contributing factors
were Failed to Grant Right of Way (11.4 percent), Driver Lost Control (11.3 percent), and Improper
Lane Change (8.7 percent). Vehicle condition and roadway condition were not frequently cited as
contributing factors. These findings point to the need for continued driver education and enforcement.
Figure 8.5: Commercial Vehicle Crashes, Contributing Factors, (2009-2014)
Source: CTDOT, Hosted by University of Connecticut’s (UConn) Connecticut Crash Data Repository

Page 8-10 CONNECTICUT STATEWIDE FREIGHT PLAN
CONDITION AND PERFORMANCE OF CONNECTICUT’S FREIGHT SYSTEM Final Report
8.2 FREIGHT RAIL
8.2.1 Freight Rail Bottlenecks
Rail activity in CSX’s Cedar Hill yard (New Haven) increased significantly in 2017 and delays are
encountered at entry and exit points.
The Connecticut River Bridge, located near Windsor north of Hartford, is a major constraint to
freight operations between Hartford and Springfield, Massachusetts. Currently, Connecticut
Southern, one of several operators that use the bridge, is experiencing issues scheduling
shipments during the time windows that are available. The Central New England Railroad also
reports capacity constraints in accessing an auxiliary branch line in East Long Meadow,
Massachusetts. As planned service improvements to passenger service for the New Haven-
Hartford-Springfield line are implemented, delays are likely to increase. The cost of a double-
track, 286k replacement bridge is estimated at $50
million.
The Hartford Viaduct is a series of highway and rail
bridge structures on I-84, located in and around
Hartford. The structures are well past their useful life,
and are a chokepoint for freight traffic as well as for
passenger vehicles and trucks. One of the options
under study for the viaduct is to move the railroad to
the west and to upgrade the structures to be 286k lb.-
capable.
There are several looming issues related to potential bottlenecks caused by the lack of 286k lb.-
capable rail in Connecticut.
– The Pan Am line transports a significant and increasing amount of propane fuel on 260k lb.-
capable rails. Safety regulations now under consideration would require that operators use
more puncture-resistant steel jackets, thermal insulation, and heavy steel-reinforced fuel
tanks. These regulations could require upgrades to 286k lb.-capable rail.
– The Strategic Rail Corridor Network (STRACNET) is a 36,000-mile system of rail corridors
considered most important to national defense. In Connecticut, portions of the system,
especially along the I-91 corridor (including the Connecticut River bridge) are not 286k lb.-
compatible. There are no funds available currently time to upgrade the routes to meet the
military’s potential needs in times of emergency
8.3 WATER TRANSPORTATION
Connecticut’s port system faces dredging and access issues that are explained in Section 10, Trends,
Needs and Issues.
Rail Bottlenecks
To understand the location and
cause of bottlenecks on the
Connecticut freight rail system, the
team interviewed major freight rail
operators in person, and followed
up by phone to verify the
information.
CONNECTICUT STATEWIDE FREIGHT PLAN Page 8-11
Final Report CONDITION AND PERFORMANCE OF CONNECTICUT’S FREIGHT SYSTEM
8.4 AIR CARGO
Connecticut has taken steps to ensure that Bradley International Airport remains accessible and that it
has adequate capacity to handle cargo freight for the immediate future. Section 10, Trends, Needs and
Issues provides more information on potential air cargo needs.

Page 8-12 CONNECTICUT STATEWIDE FREIGHT PLAN
CONDITION AND PERFORMANCE OF CONNECTICUT’S FREIGHT SYSTEM Final Report
This page intentionally left blank.

CONNECTICUT STATEWIDE FREIGHT PLAN Page 9-1
9. STAKEHOLDER ENGAGEMENT
Moving goods to, in and through the state’s compact and heavily utilized transportation network
efficiently, safely and at a reasonable cost, is key to state's economic well-being and to the state’s
competitiveness in the decades to come. One of the principal objectives of the Freight Plan is to identify
and prioritize investments in the state’s multi-modal freight transportation system (truck, rail, marine,
and air). This is best achieved through a cooperative and collaborative process where the public and
freight stakeholders are involved in the plan’s development.
Public and stakeholder involvement is critical to ensuring that the plan addresses current and future
needs and challenges unique to the movement of goods and commodities. To facilitate this involvement,
CTDOT reached out to hundreds of individuals to help create this plan. The goals of this outreach were
to:
Understand the importance of the movement of freight to the state’s economy
Establish, and build on existing, private sector relationships in an ongoing dialogue about freight
system needs, and opportunities to create efficiencies in freight movements
Identify the condition, deficiencies and needs of the freight network
Identify ways that CTDOT can make businesses and communities more competitive – whether
through capital improvement projects or policy changes
Allow stakeholders and the public to weigh in on what freight projects are of highest priority for
the State
9.1 PUBLIC INVOLVEMENT DURING THE FREIGHT PLAN’S
DEVELOPMENT
This Freight Plan was developed concurrently with the Connecticut Long-Range Statewide
Transportation Plan (LRSTP). The public outreach and stakeholder engagement processes of the LRSTP
were (and continue to be) the most collaborative and comprehensive public involvement program ever
conducted by CTDOT. The LRSTP encouraged engagement via interactive study websites; formal and
informal surveys; the use of social media to elicit citizen response to ideas and to alert the public to the
availability of draft plans and outreach meetings or events; numerous, face-to-face, small group meetings
and webinars with stakeholders and public officials; live events including visioning sessions, public
informational meetings, and open houses; informal “pop-up meetings” at community events; and, the
creation and widespread distribution of press releases, fact sheets, and informational brochures.
Several LRSTP outreach events included break-out sessions, “Councils” or focused discussions
specifically on the topic of freight. These freight-focused sessions were targeted to freight providers,

Page 9-2 CONNECTICUT STATEWIDE FREIGHT PLAN
STAKEHOLDER ENGAGEMENT Final Report
businesses that heavily rely on freight, and freight advocates – including truck freight, freight rail, marine
freight, and air cargo. The input received during these freight-focused sessions produced valuable
information about the condition and performance of the freight network and guided the development of
capital improvement, policy and strategic implementation recommendations.
9.2 FREIGHT PLAN STAKEHOLDER OUTREACH
Beyond the outreach efforts initiated by the LRSTP, additional stakeholder outreach was conducted to
engage freight-related organizations and private enterprises. These outreach efforts included stakeholder
interviews with representatives of freight network users such as trucking, port, and railroad
associations; logistics directors; shipping managers; economic development professionals; local, state and
regional planners, and business leaders. Additional outreach was conducted using truck driver surveys
and an online survey. The stakeholder input guided the development of the prioritized project list and
policy recommendations. Metropolitan Planning Organizations (MPOs) assisted in the identification of
stakeholders.
9.2.1 Key Freight Stakeholder Interviews
CTDOT conducted numerous interviews and grassroots meetings with leaders in freight-related
services including manufacturing, retail and wholesale sales, logistics, and local, regional, national and
international freight carriers. Discussions centered on the strengths and weaknesses of the current
freight network, current and future demands on the network, and investments needed to improve the
network and meet future demands. A list of stakeholders interviewed is provided in Table 9-1.
Table 9-1: Stakeholder Interviews
Stakeholder Date Location
Teamsters 3/11/16 Stratford, CT
Genesee & Wyoming Railroad 3/24/16 CTDOT HQ
O&G Industries and Rawson Materials 3/24/16 CTDOT HQ
Housatonic Railroad Company 3/28/16 CTDOT HQ
Motor Transport Association of CT, UPS, Bozzuto’s Inc. 3/30/16 CTDOT HQ
CT Public Transportation Commuter Council 3/30/16 CTDOT HQ
Town Fair Tire and Capitol Region Council of Governments 4/6/16 CTDOT HQ
Nora Huvane (marine) 4/8/16 Stamford, CT
CT Business & Industry Association 4/8/16 CTDOT HQ
Gerdau Steel, Capitol Region Council of Governments 4/11/16 Plainville, CT
Santa Energy, Santa Fuel Inc., and Inland Fuel Terminals 4/13/16 Bridgeport, CT
Next Trans Trucking and CT Courier Group 3/30/16
CT Maritime Coalition 4/12/16 Essex, CT
Bridgeport Port Authority, CT Maritime Association, CT Maritime Coalition,
Bridgeport/Port Jefferson Ferry, New Haven Port Authority, CT Ship Pilots,
GZA, Logistec, Port Security Services
4/13/16 Bridgeport, CT
Pratt & Whitney – United Technologies 4/15/16 CTDOT HQ
CT Construction Industries Association 4/19/16 CTDOT HQ
Tilcon Connecticut 5/2/16 New Britain, CT
Bridgeport Port Authority, City of Bridgeport, Connecticut Metropolitan Council
of Governments 5/23/16 Bridgeport, CT
CT Airport Authority, Capitol Region Council of Governments 5/11/16 Windsor Locks, CT
Buckeye Partners/Jetlines 5/25/16 CTDOT HQ
Town Fair Tire 6/4/16 East Haven, CT
Freund Farm, CaroVail, Cargill, Inc., Laurel Brook Farm, Agi-Mark, Allyndale
Limestone Corp. 6/6/16 East Canaan, CT
Hemingway’s Distribution 6/8/16 CTDOT HQ

CONNECTICUT STATEWIDE FREIGHT PLAN Page 9-3
Final Report STAKEHOLDER ENGAGEMENT
The various freight stakeholder interviews provided extensive feedback on industry concerns as well as
modal issues, strengths, trends, and priorities. A summary of the input received throughout the
stakeholder outreach effort is summarized below, by mode, and grouped according to the following
categories: Strengths, Issues, and Trends; Location- Specific Issues; Policies, Regulations, Costs, and
Other Obstacles; and Top Priorities.
Truck Freight
Strengths, Issues, and Trends Want more truck-only parking areas. Concerned about closure of Southington and Willington
rest areas. See Jason’s Law report for information on the importance of truck parking for safety.
Shortage of drivers nationally. Specific shortage of 3rd party, contracted haulers.
Plan for autonomous trucks. Automatic braking already in use.
All height and weight restrictions on bridges should be clearly marked.
Sometimes posted speed limits conflict with the information in the TomTom Opti Drive system
that drivers use. Database of speed limit information should be more readily accessible to
technology companies.
Freight traffic is expected to increase as the global economy recovers.
Online shopping and other shifts in consumer behavior are changing supply chain logistics.
Expect more distribution warehouse operations by companies like Amazon.
Need route planning assistance for oversized loads.
Compliance, Safety, Accountability (CSA) ratings for haulers not reliable due to small inspection
samples.
Want slower speeds and greater safety in highway work zones, especially at night.
Location-Specific Issues Rt. 17 – Rt. 9 interchange in Middletown
Waterbury Mixmaster
Shippers want I-84 viaduct replacement to include overhaul of I-84/I-91 interchange. Tunnel
option that would prohibit hazardous materials is unacceptable
Congestion at crest of hill on I-84E near exit 70 in Willington
Congestion on I-95 between East Haven and West Haven
Entire I-95 corridor. Especially congestion in Fairfield County and accidents in New London
County
Charter Oak Bridge/I-91 interchange

Page 9-4 CONNECTICUT STATEWIDE FREIGHT PLAN
STAKEHOLDER ENGAGEMENT Final Report
Truck routes to JFK
Route 7 and I-84 in Danbury; traffic slow-downs start at 6 AM and can result in delays of two
hours or greater. The diverge from southbound Rt. 7 to I-84 East is a problem because vehicles
block left-turning vehicles.
Policies, Regulations, Costs, and Other Obstacles Some towns seek voluntary restrictions on truck traffic on state routes. Proliferation of “No
Through Truck” signs on local streets.
Freight equipment is subject to personal property tax in Connecticut, but not in New York.
Claim that fuel costs and high gross receipts tax on fuel are reason why there are no truck
terminals in Connecticut.
Shippers want a greater proportion of user fee revenue to be spent on highways.
Shipping in Connecticut is constrained by congestion in New York City.
Onerous certification requirements for hauling potable water, transporting fuel, or gaining
access to port facilities (such as TWIC31 card requirement).
Align DMV rules with other states.
Drivers may be required to move to the left-hand lanes to safely pass roadwork or other issues
in the right or center lanes. They are also prohibited from using the left lane.
DMV restrictions on the number of transactions that can be processed per visit make business
owners have to take multiple unnecessary and costly trips to the DMV.
DMV will not confirm receipt of faxed information. Status of licensure not ascertainable to
client.
Hardship on business to have to travel to Wethersfield DMV to get apportionment plates.
Limits on gross vehicle weight a barrier to efficiency and competitiveness.
Bridge weight limitations also inhibit efficient travel.
Oversize and overweight deliveries take longer and are more difficult in Connecticut than in
other states due to size and weight restrictions and prohibition on wet-weather travel.
Connecticut-specific limit on trailer length conflicts with certain industries.
Consider using “lean management” techniques (continuous improvement) to streamline
construction, reconstruction, and permitting.
31 From the Transportation Security Administration website, “The Transportation Worker Identification Credential, also known as TWIC®, is required by the
Maritime Transportation Security Act for workers who need access to secure areas of the nation’s maritime facilities and vessels.”

CONNECTICUT STATEWIDE FREIGHT PLAN Page 9-5
Final Report STAKEHOLDER ENGAGEMENT
Oversize load permits should allow for a second vehicle to be listed to reduce time pressure on
loading and reduce risk.
Permitting agency for oversized loads should know if there is a travel-ban on oversized loads
and should not take payment for the permit for that trip if it cannot occur.
Confusion regarding 34-hour reset requirement for driver breaks.
Concern about potential new tolls.
Concern about proposed increase in permit fees for individual oversized loads.
Drivers on construction sites should be exempted from hours of service rules.
Difficulty scheduling state police on construction sites.
Top Priorities Improve safety at Significant Level of Service Safety (SLOSSS) locations.
Need map of recommended truck routes (for non-interstate highways).
Shippers believe adding capacity will reduce travel times.
Tolls and other demand management acceptable if paired with new capacity and efficiency32.
Request better mitigation of construction impacts on traffic.
Notification system for lane closures and other anticipated delays should be a real-time feed that
sends location-specific “push notifications” to drivers’ phones.
Want wider breakdown lanes to allow for safe inspection of trucks.
Drivers should be able to easily check and track the status of their Commercial Driver Licenses
online.
Increase weight limits for priority freight routes.
Need to make oversize/overweight travel permanently allowed on weekends (currently pilot
program).
Freight Rail
Strengths, Issues, and Trends Rail shipping helps give Connecticut businesses access to broader markets, helping to insulate
them from local swings in the economy.
32 In response to the request for comment on the Plan, the Motor Transport Association of Connecticut stated that it “…Has never supported tolling
existing interstates.”

Page 9-6 CONNECTICUT STATEWIDE FREIGHT PLAN
STAKEHOLDER ENGAGEMENT Final Report
Rail shippers believe there is capacity for more freight to shift from truck to rail.
Upgrading of NECR to 286K standard a big opportunity.
Location Specific Issues Maintain access to CSX Class 1 terminals in New Haven and West Springfield.
Restart operation of Maybrook Line (Derby to Maybrook, NY, via Danbury). Owner (HRRC)
lacks financial wherewithal to complete repairs.
Need to structure improvements to New Haven-Hartford-Springfield rail investments so they
maintain and enhance freight access to West Springfield terminal in a way that complements
rather than competes with expanded passenger service.
Weight restriction on CT River Bridge in Windsor constricts use of CT Southern freight route
on Amtrak’s Springfield Line.
Pan Am Line is not maintained to same class as line that feeds it (Springfield Line), constraining
freight shipments.
Policies, Regulations, Costs, and Other Obstacles Difficult for rail operators that do not own tracks to obtain financing.
Positive Train Control is unfunded mandate. The Genesee & Wyoming Railroad is laying out
$1.2 million for upgrade.
Section 130 program for upgrading RR crossings is an unfunded mandate.
If a shipment begins or ends on truck, it will be cheapest to do entire trip by truck.
Top Priorities Continue Rail Freight Improvement Program (RFIP) and expand to more predictable and robust
funding scheme.
Provide tax credits or other incentives for non-highway freight transport.
Need better training programs to allow for hiring without employers shouldering risk of
employee leaving following on-the-job training.
New Statewide Port Authority should facilitate improvements to maritime-to-rail connections.
Consider car float barges to create a freight rail connection across the Sound.
Other states provide assistance to freight railroads for construction of new sidings
Maritime
Strengths, Issues, and Trends Conflicts at barge terminals over management of ice during wintertime.
Fixed demand for petroleum terminals.
Marketing for ethanol.
Marketing for dry bulk goods.

CONNECTICUT STATEWIDE FREIGHT PLAN Page 9-7
Final Report STAKEHOLDER ENGAGEMENT
Location Specific Issues Need dredging and other port improvements, not just deep-water ports, but also at barge
terminals and smaller harbors (e.g. Stamford, Branford).
Cedar Creek in Black Rock Harbor is severely constrained due to lack of dredging.
A bridge over Johnsons’ Creek that was destroyed by Hurricane Sandy is inhibiting the delivery
of oil to the Global and Sprague terminals. This bridge is in the process of being demolished.
Policies, Regulations, Costs, and Other Obstacles
Jones Act (all goods transported by water between U.S. ports must be carried on U.S.-flag ships,
constructed in the United States, owned by U.S. citizens, and crewed by U.S. citizens and U.S.
permanent residents33)
Construction and union labor costs
Fees and environmental regulations specific to the US maritime industry are greater than in
other countries. (i.e., Harbor Maintenance Tax)
Visa restrictions for foreign maritime employees, especially land-based operators.
Ports of Bridgeport and New London rely on an aging union workforce that is not able to
quickly grow or shrink in response to market volatility.
Bridgeport and New Haven fuel terminals have shallower channel depth than competitor in
Tiverton, RI.
Dredging permit delays and seasonal restrictions on dredging.
Top Priorities Dredging of Bridgeport Harbor
Utilizing marketing capacity of new Statewide Port Authority
Work with MARAD on M-295 marine route through Long Island Sound.
Pipeline
Strengths, Issues, and Trends The Buckeye terminal operates over 7,000 miles of pipeline and 120 terminals nationwide. In
Connecticut and Massachusetts, it operates pipelines from the Port of New Haven to Westover
Air Force Base in Massachusetts. It also operates two terminals in Connecticut and one in
Springfield, Massachusetts.
Pipeline is a very efficient method to ship petroleum fuels, and can help decrease the number of
delivery trucks needed on the highway system.
33 46. U.S.C. § 50101

Page 9-8 CONNECTICUT STATEWIDE FREIGHT PLAN
STAKEHOLDER ENGAGEMENT Final Report
Location Specific Issues Buckeye’s terminal in Wethersfield may have unused land available for overnight truck parking.
Policies, Regulations, Costs, and Other Obstacles Oil terminals at Port of New Haven set their own “rack prices” per gallon, and tend to be very
low. This incentivizes trucks to pick up the oil in New Haven, rather than at terminals up the
pipeline, such as Springfield, that may be closer to their intended delivery points. This results in
unnecessary extra truck traffic on the highways.
Policies and regulations have positive effects, as they keep the industry honest and ensure
environmental safety.
Top Priorities Incentivize fuel delivery companies to utilize the pipeline infrastructure to its fullest capacity,
rather than driving more distance back and forth the Port of New Haven.
9.2.2 Truck Driver Surveys
In the spring of 2016, CTDOT reached out to truck drivers via the Teamsters and Town Fair Tire to
solicit their ideas for freight related improvements. CTDOT received 62 surveys, with most but not all
fully completed. A summary of the truck driver input is below:
Drivers work mainly for 1) National carriers, and 2) Local carriers
Fleet operational coverage is mainly 1) CT/NY/MA/RI, and 2) New England
Drivers primarily deliver at the 1) truckload, and 2) Less than truckload industry segments
Most drivers work for companies with between 11-100 power units
About 1/3 of drivers work for companies with 26-50 percent operating mileage within CT, and
another 1/3 work for companies with 51-75 percent operating mileage within CT.
For most drivers (35%), their route is designated by a dispatcher prior to departing. Drivers also
rely on their own experience and the conditions of the road (31%) to choose routes.
When selecting a route, drivers primarily choose the least congested routes, followed by the
shortest routes, and assigned routes. Drivers also factor in the reliability of travel time estimates
into their route choices.
Most drivers agree or strongly agree that access to industrial parks, distribution centers,
manufacturing sites, ports, and rail yards is relatively efficient. However, 1/3 of drivers are
neutral about this issue.
Most drivers (58%) believe that highway congestion is an issue in Connecticut.
The clear majority of drivers (75%) believe that Connecticut does not have adequate truck
parking facilities.

CONNECTICUT STATEWIDE FREIGHT PLAN Page 9-9
Final Report STAKEHOLDER ENGAGEMENT
Drivers are ambivalent and divided about whether trucks can efficiently and safely travel in
Connecticut. About 1/3 of drivers are neutral on the question, and the remaining drivers are
split: 40 percent do not agree that trucks can travel efficiently and safely through the State, and
28 percent do agree that their trucks can travel safely and efficiently through Connecticut.
When asked to identify the most significant roadway infrastructure problem in Connecticut,
drivers identified issues that fell within 5 key categories:
– I-95, particularly the portion between the NY State Line and New Haven;
– A need for more lanes;
– I-84, especially issues with construction and congestion;
– Construction and its negative impact on traffic congestion; and
– Traffic and congestion.
Other problems identified included road condition, parking and rest areas, and the Charter Oak
Bridge.
Presented as an open-ended question, drivers were asked which two issues they would fix. Five
key issues came to the fore:
– Parking and rest areas, and need more of both;
– A need for more lanes;
– Infraction enforcement, particularly for issues around distracted driving and cell phone use,
aggressive driving, and tailgating;
– Left lane issues, including requests for trucks to use the left lane and requests for better
enforcement of using the left lane for passing only; and
– The need for improvement of roadway condition.
Finally, drivers were asked to contribute any final thoughts, and their ideas fell into four main
categories:
– Speeding;
– Driver behavior;
– Parking and rest areas; and
– Road Condition.
Figure 9.1Error! Reference source not found. summarizes the major issues identified by trucking
stakeholders during the plan’s development. The trucking interests identified chokepoints that generally
correspond with the results of the bottleneck analysis in Section 9.1.4.

Page 9-10 CONNECTICUT STATEWIDE FREIGHT PLAN
STAKEHOLDER ENGAGEMENT Final Report
Figure 9.1: Major Issues Identified by Truck Freight Stakeholders
Source: CTDOT and CDM Smith
9.2.3 Rail Interviews
Interviews with freight rail carriers were conducted in the fall of 2016 to receive input on rail network
needs in Connecticut. Nine carriers were interviewed as listed in Table 9-2. Overall, the system
appears to be functioning without downsizing, immediate challenges, or regulatory imposition. However,
there is considerable concern over traffic, weight, and congestion with respect to anticipated problems
on the New Haven-Hartford-Springfield (NHHS) Line. Freight rail operators including CSX, Connecticut
Southern, Pan Am Southern, Central New England Railroad and Providence and Worchester voiced
concerns about future access windows for rail freight. There have been substantial customer complaints
regarding access windows on the Hartford Line (NHHS) and the Northeast Corridor. Additional
concerns focused on the continued loss of competitiveness to trucks in the highway system upgrades
compared to rail assistance, the associated enhanced tank car weights and, and assistance with the heavy
capital infrastructure needs. Industry representatives emphasized that the value of rail support to the
State in competitiveness, delivery, industrial development, and public benefit is substantial.

CONNECTICUT STATEWIDE FREIGHT PLAN Page 9-11
Final Report STAKEHOLDER ENGAGEMENT
Table 9-2: Freight Rail Carrier Interviews
Freight Railroad Representative Date
Branford Steam Railroad Janet Mrozowski October 14, 2016
Central New England A.J. Belliview November 11, 2016
Connecticut Southern Charles Hunter September 26, 2016
CSX Transportation Maurice O’Connell November 18 & 21, 2016
Housatonic Colin Pease September 29, 2016
Naugatuck Howard Pincus October 13, 2016
New England Central Charles Hunter September 26, 2016
Pan Am Southern Jim Patterson September 29, 2016
Providence & Worcester Frank Rogers October 12, 2016
Freight Rail Carrier Commentary
Summaries of the freight railroad carrier interviews are listed below.
Branford Steam Rail Road BSRR has no issues with its railroad condition at the present time.
Central New England Railroad Armory Branch needs additional new cross ties and the installation of heavier rail.
Clearance issues and weight restrictions on Amtrak’s Springfield Line in Hartford inhibits the
movement of certain types of freight.
Culvert work assistance would be welcomed.
Connecticut Southern Railroad Amtrak’s Springfield Line needs to allow freight cars to be loaded to 286,000 pounds on four
axles, the national standard, for tenant freight carriers to remain competitive and to divert heavy
truck traffic off Connecticut’s roadway system. The weight limit of 263,000 pounds per car is
chiefly due to the Amtrak-owned Connecticut River Bridge at Windsor Locks, but structural
repairs and double-tracking the Connecticut River Bridge are not programmed.
When Positive Train Control (PTC) is installed on the Hartford Line, there will be a CSO need
to acquire and install PTC equipment on six locomotives.
The former cascade of the tie and rail program that CTDOT used to distribute old crossties
and rail to the freight railroads should be resumed.
Assistance installing a higher speed turnout with signalization on the north end of Hartford Yard
would help streamline operations.
CSX Transportation CSX needs the Hartford Line to be 286k compliant - this is a very big issue for their customers.
CSX is experiencing considerable problems in getting windows for their traffic from the north
and there needs to be improvements in traffic handling.

Page 9-12 CONNECTICUT STATEWIDE FREIGHT PLAN
STAKEHOLDER ENGAGEMENT Final Report
Housatonic Railroad Company (HRRC) Replacing the worn rail north of Canaan- last year that segment had 76 broken rails. HRRC
requests continued assistance with rail replacement, particularly on sections of its Berkshire Line
that are owned by the state of Connecticut, where track work is needed to operate plate F cars
to be competitive in wood panel business.
Public investment in crossing surface repair to address crossing maintenance needs to be
developed.
Development programs that promote conversion of brownfields to productive industrial
development sites that could support rail freight customers should be promoted.
Assistance in new siding and other loading facilities to promote new rail business will support
rail growth and job growth in the state and is particularly needed in Canaan.
While HRRC is rated as a 286,000-pound railroad, work will be necessary to upgrade and
strengthen bridges and strengthen track structure to maintain the 286,000-pound classification.
Work needs to be performed to upgrade tie conditions to re-institute unit train service over
the Maybrook Line.
New siding is needed at O&G Industries in New Milford for quarry and road salt.
Naugatuck Railroad Company (NAUG) Capital projects to repair/replace culvert and bridges are needed due to 100+ year old
structures. There are several smaller culvert structures located on the railroad that will need
attention/replacement with modern culvert piping materials.
The NAUG bridge inventory is composed primarily of three major structures. One is 110 feet
long, two-span (“Hancock Brook” ID #9106R), built in 1902 that is in fair condition and should
be considered for replacement. The second is 234 feet long, 4-span (“Chase Bridge” ID
#9108R), built 1907 that is in good condition and needs a replacement wood tie deck. The third
is 267 feet long, 4-span (“Jericho Bridge” ID #9110R), built 1907 that is in good condition and
needs a replacement wood tie deck. These structures also need concrete/masonry pier and
abutment repairs and some associated steel repairs. The coating systems of these structures
have long since failed (last documented painting was in the early 1950s). Three smaller steel
deck spans (20-22 feet each) have been re-decked by NAUG over the last 9 years, and are in
good condition (except for failed coating systems). One short bridge should be replaced due to
age and condition.
The southern end of the NAUG line, which is expected to have the highest freight traffic
density, with heavyweight cars, has numerous sharp curves. This section should be re- laid with
heavier rail on the curves.
An Interchange yard track in Waterbury must be rehabilitated to accommodate current and
near-future inbound and outbound traffic needs. Several former and existing side tracks can be
extended/reconstructed to provide this storage, and assistance would be needed for this work.

CONNECTICUT STATEWIDE FREIGHT PLAN Page 9-13
Final Report STAKEHOLDER ENGAGEMENT
There is a desire for a regular interchange area/yard in Waterbury with PAS that does not
involve leaving interchange cars on the Naugatuck Main Line. This is critical to NAUG
operations, as interchange cars left on the main line prevent NAUG from completing regular,
federally mandated track and switch inspections.
Existing car storage side tracks are not sufficient to accommodate freight customers.
Upgrading is needed for crossing signals and road surfaces at heavily traveled crossings. SR 262
highway grade crossing in Watertown needs full protection including gates and modern lights.
New England Central Railroad A matching grants program for capital projects should be established.
A TIGER grant-funded project to upgrade the NECR line to 286k compliance in Connecticut is
scheduled for completion by 2019. With the completion of this project, only one section of the
line (in Massachusetts), which connects New London, CT to Montreal, Canada, will not be
286k- capable.
Funding is needed for washouts.
Reaching full double stack clearances remains a priority.
Pan Am Southern High Amtrak car-mile charges financially affect the generation of new business. Need acceptable
windows for freight traffic making necessary weight and clearance infrastructure and capacity
improvements along the Hartford line project limits.
Grade crossing and trespassing programs need assistance. Funding is needed for the Rail
Preservation and Improvement Program.
Maintain and improve the Railroad Tax Exemption Program.
Provide access for freight rail goods movement projects that promote economic development,
including third party-initiated candidate projects, industrial sidings, etc.
Provide freight rail transportation with a seat at the table in the state and federal, development,
planning, and strategy process.
Providence & Worcester Railroad There are concerns over adequate daytime windows on the NEC, which is increasingly
congested, and in need of a coordinated growth plan.
Plate F cars, measuring 17 feet tall, cannot be run under the overhead electrical system along
the NEC.
Figure 9.2 summarizes the major issues identified by freight rail operators during the plan’s
development. The rail interests identified chokepoints and resource constraints that limit the ability of
the rail system to capture a greater share of the goods market in Connecticut.
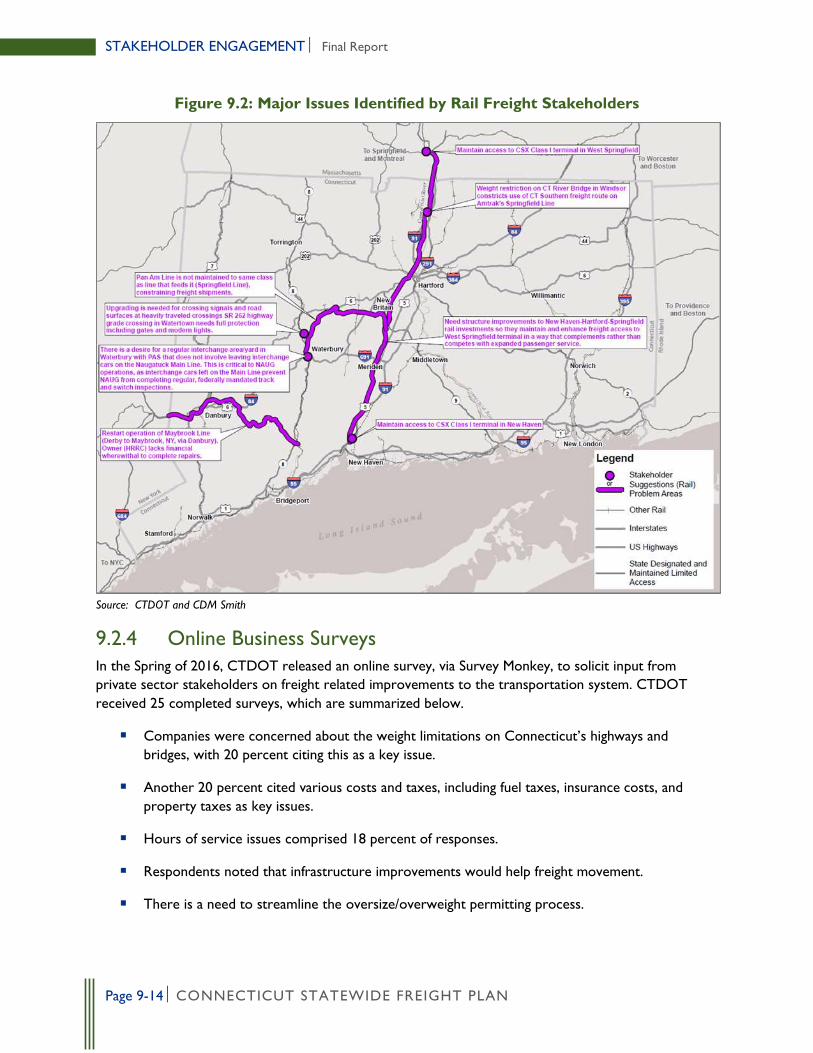
Page 9-14 CONNECTICUT STATEWIDE FREIGHT PLAN
STAKEHOLDER ENGAGEMENT Final Report
Figure 9.2: Major Issues Identified by Rail Freight Stakeholders
Source: CTDOT and CDM Smith
9.2.4 Online Business Surveys
In the Spring of 2016, CTDOT released an online survey, via Survey Monkey, to solicit input from
private sector stakeholders on freight related improvements to the transportation system. CTDOT
received 25 completed surveys, which are summarized below.
Companies were concerned about the weight limitations on Connecticut’s highways and
bridges, with 20 percent citing this as a key issue.
Another 20 percent cited various costs and taxes, including fuel taxes, insurance costs, and
property taxes as key issues.
Hours of service issues comprised 18 percent of responses.
Respondents noted that infrastructure improvements would help freight movement.
There is a need to streamline the oversize/overweight permitting process.

CONNECTICUT STATEWIDE FREIGHT PLAN Page 9-15
Final Report STAKEHOLDER ENGAGEMENT
There is an emphasis on the need to improve the business climate through tax reduction and
service improvement.
9.3 FREIGHT ADVISORY COMMITTEE
Freight planning is greatly enhanced by private sector and industry expert engagement. One mechanism
of achieving this is through ongoing dialogue with operators, shippers, and users of the freight system.
CTDOT conducted extensive outreach in developing this plan and will continue to do so through
regular meetings with modal stakeholders. It is anticipated that CTDOT will lead ongoing meetings,
annually, or more frequently as needed with the private sector including firms related to trucking, rail,
waterway transportation, and aviation, as well as public sector partners. This ongoing engagement will
improve freight operations and provide the state with a more detailed understanding of freight issues
that the CTDOT and private industry will face in the coming years.
Maintaining a Freight Advisory Committee after the completion of the Plan can be mutually beneficial.
The public sector can stay abreast of how the evolution of technology and business models may change
freight needs in Connecticut and enhance the state’s competitiveness from a transportation standpoint.
With open lines of communication, the private sector can work with the DOT to meet transportation
needs that is in the public interest to address. In the past, firms such as Pratt and Whitney have worked
with CTDOT to reinforce structures on routes that bear the size and weight of heavy manufactured
goods. A FAC can be a platform for a more responsive and effective freight investment decision-making
process.

Page 9-16 CONNECTICUT STATEWIDE FREIGHT PLAN
STAKEHOLDER ENGAGEMENT Final Report
This page intentionally left blank.

CONNECTICUT STATEWIDE FREIGHT PLAN Page 10-17
10. TRENDS, NEEDS, AND ISSUES
Economic, demographic, social and technological change all influence the way freight moves. While
Connecticut exists in a fixed location, the state’s consumer demands, its economic drivers and the way
freight itself moves, especially over the last mile, are not fixed at all. This chapter summarizes the
statewide and national trends and issues related to the movement of goods on Connecticut’s statewide
freight transportation network.
10.1 STATEWIDE ISSUES AND TRENDS
10.1.1 Trucking
In addition to the ever-increasing number of trucks on our roadways, there is the problem of
overweight vehicles. The damage caused by these vehicles can lead to premature pavement
failure and is not easily quantified. Continued enforcement of maximum weight restrictions is
critical to the long-term performance of highway systems (pavements and bridges).
New England’s extreme variability in weather is the largest factor beyond traffic loading that
causes deterioration of pavements.
Empty backhauls: 2013 data indicates that empty backhauls for both inbound and outbound
trucks occur about 70 percent of the time. This results in higher overall costs for making
deliveries in Connecticut (DEEP 2013).34
Ninety-four percent of freight is now carried by truck and the state accommodates a significant
amount of through truck freight. Some investments that would make rail and waterborne travel
more cost-effective could reduce or level the rate of truck freight growth. However, the
flexibility and cost advantages of truck-based shipments, coupled with the very high cost of
significant rail and water freight infrastructure upgrades, limits the potential diversion of truck
freight shipments to alternative modes.
Congestion on major truck routes and a lack of parking availability have led to the creation of
informal parking areas, in locations such as along interstate ramps. Figure 10.1 shows the
location of these areas. Unsanctioned parking locations, especially on interstate ramps, present
safety and operational concerns and are a significant issue for both law enforcement and
CTDOT. A 2008 study of truck parking needs found that there was a deficit of 1400 parking
spaces. There is a consensus that the deficit still exists, and that it exists mostly on the west
side of the state. Land for new, additional parking adjacent to the Interstate System along I-84
and I-95 on the west side of the state is scarce. To find a solution to this issue, the state will
need to work with property owners, local governments, truckers and law enforcement.
34 http://www.ct.gov/deep/lib/deep/air/diesel/freightreport_03_28_2013.pdf

Page 10-18 CONNECTICUT STATEWIDE FREIGHT PLAN
TRENDS, NEEDS AND ISSUES Final Report
Figure 10.1: Locations of Sanctioned and Unsanctioned Truck Parking, 2017
Source: CTDOT and CDM Smith
Age of the Highway System
The majority of Connecticut’s most vital highways – the Interstate System – was constructed in the
1950s and 1960s, and substantial portions were constructed earlier (Figure 10.2). Many roadways are
continuously subject to greater traffic and loads than they were designed to handle. The increasing traffic
volumes and heavier loads have accelerated the deterioration of the underlying layers of the pavement
structure. This situation has made the subsequent rehabilitation of pavements increasingly more
extensive and costly.
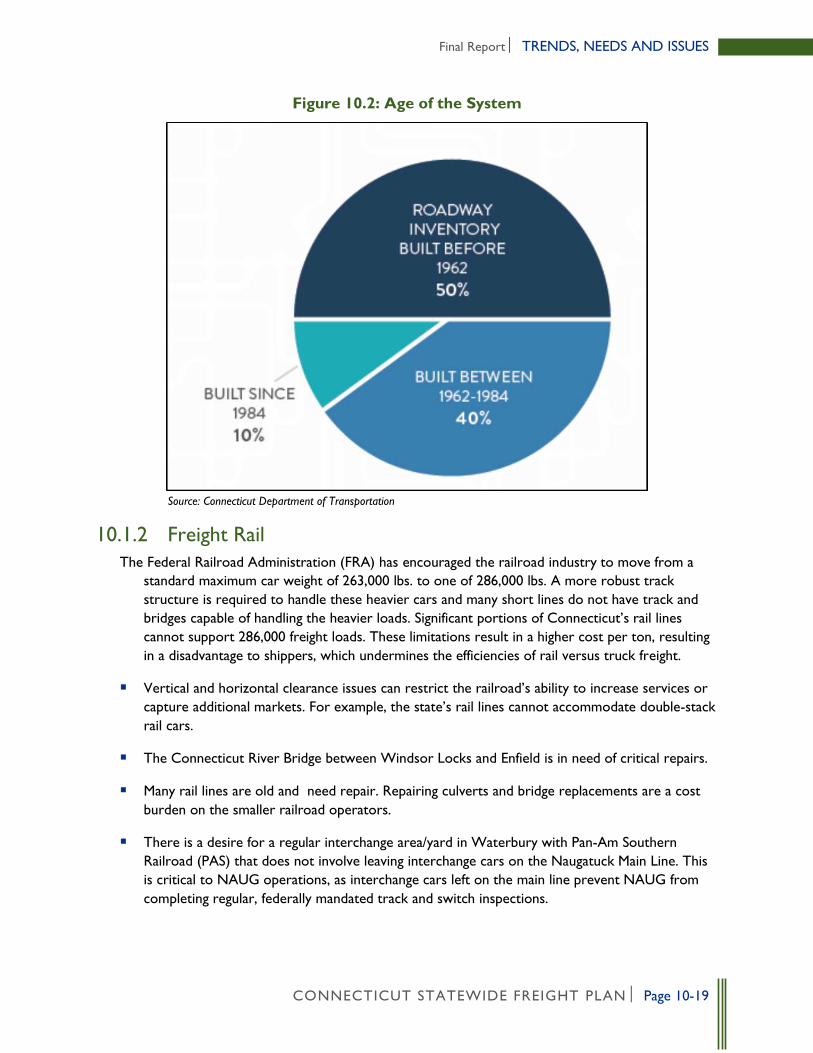
CONNECTICUT STATEWIDE FREIGHT PLAN Page 10-19
Final Report TRENDS, NEEDS AND ISSUES
Figure 10.2: Age of the System
Source: Connecticut Department of Transportation
10.1.2 Freight Rail
The Federal Railroad Administration (FRA) has encouraged the railroad industry to move from a
standard maximum car weight of 263,000 lbs. to one of 286,000 lbs. A more robust track
structure is required to handle these heavier cars and many short lines do not have track and
bridges capable of handling the heavier loads. Significant portions of Connecticut’s rail lines
cannot support 286,000 freight loads. These limitations result in a higher cost per ton, resulting
in a disadvantage to shippers, which undermines the efficiencies of rail versus truck freight.
Vertical and horizontal clearance issues can restrict the railroad’s ability to increase services or
capture additional markets. For example, the state’s rail lines cannot accommodate double-stack
rail cars.
The Connecticut River Bridge between Windsor Locks and Enfield is in need of critical repairs.
Many rail lines are old and need repair. Repairing culverts and bridge replacements are a cost
burden on the smaller railroad operators.
There is a desire for a regular interchange area/yard in Waterbury with Pan-Am Southern
Railroad (PAS) that does not involve leaving interchange cars on the Naugatuck Main Line. This
is critical to NAUG operations, as interchange cars left on the main line prevent NAUG from
completing regular, federally mandated track and switch inspections.

Page 10-20 CONNECTICUT STATEWIDE FREIGHT PLAN
TRENDS, NEEDS AND ISSUES Final Report
There is concern about trespassers riding all-terrain vehicles and off-road bikes along the rail
line, which destroy the railroad roadbed, and endangers passengers as well as themselves. There
is a need for better law enforcement and damage repair.
High Amtrak car-mile charges financially affect the generation of new business.
There is a need to enhance the resources available for grade crossing and trespassing programs.
There is a need to revise the Rail Preservation and Improvement Program.
Interviews with the various rail operators nearly universally pointed out a desire for partnering
between the State railroad operations, planning, and economic development and freight
railroads as a positive congestion-mitigation tool that Connecticut should be using. Rail freight
operators point to the other New England States as examples of partnership solutions that help
progress transportation improvements
10.1.3 Water Transportation
Connecticut’s Deep-Water Port Strategy Study identified the following issues and initiatives for each
port:
Port of Bridgeport Issues
The Port of Bridgeport is hampered as a cargo port by the lack of conveniently accessible freight
rail.
Very difficult and expensive dredging challenges
Loss of cargo markets and potential revenue streams
Lack of consensus regarding east harbor land use
Loss of shipyard operator
Multiple layers of decision-making
Port of Bridgeport Initiatives
In early 2012, the Port of Bridgeport submitted a Dredged Material Management Plan to the United
States Army Corps of Engineers (USACE) for review. While the USACE has acknowledged that
continued maintenance dredging of Bridgeport Harbor is likely justified, the project cannot begin until
federal funding is authorized, appropriated and committed to the project. The USACE has not
recommended the project for funding, in part because waterfront commerce has been substantially
reduced (mainly from lack of dredging).
Port of New Haven Issues
Limited land availability
Lack of labor compatibility for feeder service with the Port of New York/New Jersey
Incompatible land uses
Lack of potential public-sector revenue streams
Multiple layers of decision-making

CONNECTICUT STATEWIDE FREIGHT PLAN Page 10-21
Final Report TRENDS, NEEDS AND ISSUES
Port of New Haven Initiatives
Maintenance dredging of the main channel is needed. Federal funding for the $10 million project
is being sought.
There are U.S. Senate and House resolutions calling for a study to examine deepening the main
channel to greater than 35 feet. A reconnaissance study costing about $100,000 would be
required to begin this process.
Gateway Terminal, the most active terminal in the port, is interested in attracting new business
such as the break bulk cargo or general cargo that once called on New Haven Terminal.
Rail service to the New Haven Port District has begun with the reconstruction of a rail line
along the eastern side of Waterfront Street. A series of sidings are proposed to enter the
private property of various terminals. The City of New Haven has prepared final design plans
and contract documents for the reconstruction of Waterfront Street. This project is estimated
to cost $6 million and will allow future construction of an estimated $10 million worth of rail
spurs across Waterfront Street to the private terminals.
The site known as the North Yard, north of the I-95 corridor and Forbes Avenue, was identified
in the Port Authority’s Strategic Land Use Plan as a key site for further development to expand
maritime use in the port district.
Port of New London Issues
Loss of cargo markets and associated potential revenue streams
Limited consumer market access
Limited cruise industry interest
Port of New London Initiatives
In the State Pier Needs and Deficiencies Study, significant improvements to the infrastructure at
the facility are recommended; recommendations include the relocation of access roads,
renovation to the piers, improvements to the bulkheads, paving of storage areas, and the
construction of a new warehouse.
Various civic and industry groups have suggested improvements to serve the regional fishing and
seafood processing industries (to compete with New Bedford and Gloucester MA) as well as
improvements to attract more cruise ship activity.
CTDOT’s preliminary capital plan includes approximately $40 million for a multi-phase project
to implement improvements to the State Pier, including those recommended in the State Pier
Needs and Deficiencies Study.
Ferry Operations Issues
Limited parking and queuing facilities at Bridgeport and New London port facilities.
Need for expansion and relocation of Bridgeport Ferry to Barnum Landing.

Page 10-22 CONNECTICUT STATEWIDE FREIGHT PLAN
TRENDS, NEEDS AND ISSUES Final Report
10.1.4 Air Cargo
Air cargo is seeing an upward trend that is forecasted to continue over the next 10-15 years. A new on-
airport cargo facility at Bradley International Airport is a priority and will position the airport to meet
future air cargo demands. Potential areas for additional cargo facilities include:
A 20-30-acre site located north of Runway 15-33, adjacent to the new Air Traffic Control
Tower and fire school.
A site located opposite the Aviation Facilities Company, Inc. facility east of Runway 15.
Additional sites located on the northwest side of Runway 24 however, these sites have
environmental requirements to be addressed.
10.2 NATIONAL TRENDS AND ISSUES
10.2.1 Panama Canal
The Panama Canal, completed in 1914, created one of the most important trade routes in the world,
linking the Atlantic and Pacific Oceans. After nearly a century, the canal was expanded to increase
capacity and accommodate larger ships at a cost of 5.25 billion. The expanded canal with new locks will
allow for deeper, longer and wider “New Panamax” vessels, doubling existing throughput capacity from
5,000 20-foot equivalent units (TEU) on current vessels to (potentially) 13,000 TEU. The expansion,
completed in June of 2016, is expected to reduce delays and shipper costs. The expansion may cause
some waterborne shipments to shift to the Port of New York and New Jersey but it is unlikely to have a
major impact on the mode or direction of freight movements in Connecticut.
10.2.2 Alternate Transportation Fuels
Compressed Natural Gas/Liquefied Natural Gas
In 2011, transportation use accounted for less than one percent of the natural gas consumed in the U.S.
However, natural gas consumption in the transportation sector is expected to grow from 40 billion
cubic feet (bcf) in 2012 to 850 bcf in 2040 , an increase of 21-fold (U.S. Energy Information
Administration (EIA)). Citigroup forecasts that 30 percent of the heavy truck fleet will shift to natural
gas by the end of 2020; however, others project growth at a lower rate. Currently, the main obstacle to
faster conversion from diesel and gasoline is the higher cost of natural gas-powered trucks and the lack
of refueling stations for long-haul trips.
Natural gas is currently about 30 to 40 percent less expensive than diesel on a per gallon equivalent
basis on the retail market. Consequently, commercial trucking fleets have begun converting to
compressed natural gas (CNG) for short-haul operations and Liquefied Natural Gas (LNG) for long-haul
operations. Companies with large fleets that have made commitments to CNG/LNG include United
Parcel Service (UPS), Waste Management and AT&T, to name a few.
The EIA also projects that LNG will play an increasing role in powering freight locomotives in the
coming years. Several major railroads are considering the use of LNG in their locomotives to lower
long-term costs; however, the upfront capital cost in switching to LNG- powered locomotives is

CONNECTICUT STATEWIDE FREIGHT PLAN Page 10-23
Final Report TRENDS, NEEDS AND ISSUES
substantial. While experts believe that a switch to LNG to some degree is inevitable, the pace of change
and the penetration of change are highly uncertain. The EIA’s projections on the use of LNG to meet
rail freight energy needs range from a low of 16 percent in by 2040 to a high of 95 percent.
Further adoption of natural gas for transportation use will require more filling stations and widespread
distribution and awareness by policy-makers. Currently, most filling stations (like those being built by
UPS) are paid for and used privately. However, if demand for CNG and/or LNG fueling stations
continues to grow, the State or local governments may need to consider policies to attract or allow for
fueling stations so that more businesses (and, potentially, residents) can access this fuel.
Biofuels
Biofuels have the potential to reduce carbon emissions, reduce reliance on foreign oil and create rural
economic development. For these reasons, biodiesel is an important biofuel for freight transportation.
Increasing the use of a biodiesel blend has shown potential to be a short-term, relatively low-cost way
to reduce freight-related emissions [including CO2, nitrous oxides (NOx), and particulate matter (PM-
10)], which could be attractive to areas that are in nonattainment under Environmental Protection
Agency’s (EPA) air quality standards.
10.2.3 Air Quality and Regulation
The U.S. Clean Air Act regulates areas that do not meet the standards for criteria pollutants under the
National Ambient Air Quality Standards (NAAQS). In nonattainment areas, federal law requires state
and local governments to develop and implement plans for bringing these areas back into compliance.
These areas operate under ‘maintenance’ state implementation plans (SIPs), which often have provisions
affecting the transportation network.
As it relates to freight, project delays only prolong bottlenecks for truckers (who carry goods to other
parts of the system), and restrictions on traffic in general can also affect trucks. Air quality regulation
under the Clean Air Act is yet another factor driving environmental improvements in truck emissions
and fuel use.
Additionally, the EPA is adopting more stringent exhaust emission standards for large marine diesel
engines; the overall strategy includes adjusting Clean Air Act standards and implementing international
standards. By 2030, the measures are expected to reduce annual nitrogen oxide (NOx) emissions in the
U.S. by approximately 1.2 million tons and particulate matter emissions by 143,000 tons. As trucking
companies are required to retrofit exhaust systems or purchase new compliant trucks to meet more
stringent requirements, the associated costs will mean higher operating expenses for shippers, which in
turn will lead to higher costs to transport goods.
10.2.4 Climate Volatility
Climate volatility is likely to have more impact on the future of surface transportation than any other
issue. Anticipated sea level rise, more extreme weather events, and an increase in very hot days/heat
waves have the potential to severely impact the freight transportation network. State DOTs may face
future challenges and implications for surface transportation such as meeting changing public
expectations, adapting vulnerable transportation infrastructure, and addressing greenhouse gas (GHG)
reductions.

Page 10-24 CONNECTICUT STATEWIDE FREIGHT PLAN
TRENDS, NEEDS AND ISSUES Final Report
10.2.5 Emerging Technological Trends Impacting Freight
Technological advancement is rapidly changing the nature of the freight industry. Technology can help
gather data and to understand the transportation system, its operation, and opportunities for
efficiencies. It can also improve operations, allowing for better movement of freight across a
transportation network. Technology is perhaps the category with the greatest potential to change the
transportation system in terms of freight mobility and delivery. Advances in vehicle technology and
logistics operations move faster than regulatory bodies can adjust to them, so close coordination with
the private sector is essential to ensure that the private sector interest in flexibility and the public-sector
interest in safety and environmental protection are in balance.
Weigh-in-Motion Technology
Weigh-in-motion (WIM) is a technology that is embedded into the travel lane of an interstate or
highway, and measures a truck’s wheel weight as it passes over a scale pad at normal highway travel
speeds. WIM can prove useful in protecting road infrastructure, enforcing limits on size and weight of
trucks, and can be implemented in tandem with toll road systems. Typical primary use of WIM
technology includes screening and preselection for further, more extensive enforcement and inspection
actions. WIM scales are typically not accurate enough to issue an immediate citation or fine, but the
technology can provide insight into certain trucks that may be near, at, or over the weight limit. This
process greatly reduces the number of trucks that need to be stopped and physically weighed on a static
scale at a traditional fixed weigh station, significantly elevating the mobility and efficiency of trucks
traveling with legal loads and sizes.
Autonomous and Connected Vehicles
Connected and autonomous vehicles (VC/AV) are two related advances in vehicle technology aimed at
making roadway travel safer and more efficient. Connected vehicles utilize short range communications
and cellular networks for vehicle-to-vehicle communications [Vehicle to Vehicle (V2V)] or to the
transportation network [Vehicle to Infrastructure (V2I)]. Connected vehicles are not self-driving.
Autonomous vehicles use internal sensors, cameras, GPS, and advanced software to operate all
functions of a vehicle without driver assistance.
The development of autonomous trucks continues to advance significantly. This type of truck uses a
system called the Highway Pilot, which enables the human driver to switch control over to the truck's
embedded system after entering the flow of traffic and reaching 50 miles per hour. This technology uses
a combination of vehicle-to-vehicle Wi-Fi communication, radar and cameras to operate on Highway
Pilot. CTDOT has confirmed that the major New England Interstate gateways (I-95/I-91/I-84) would be
well suited for autonomous vehicle test bed applications.
Dedicated Freight Infrastructure
As technology advances, real-time data on parking availability, congestion, and road and weather
conditions can be transmitted between vehicles, roadside units and traffic management centers.
As truck freight volumes increase, advances in Intelligent Transportation Systems (ITS) have the
potential to optimize and improve the transportation network. Specifically, advances in ITS such as
dedicated truck lanes and autonomous freight vehicles may improve the safety and efficiency of goods
movement along roadways. One component of ITS currently used in urban areas to monitor highway

CONNECTICUT STATEWIDE FREIGHT PLAN Page 10-25
Final Report TRENDS, NEEDS AND ISSUES
conditions and inform drivers of traffic slowdowns, delays and incidents is variable message boards/signs.
Freight Advanced Traveler Information System (FRATIS) provides for the sharing of information
between the terminal operator, truck dispatcher, and public with information about real-time and
predicted port terminal queue time; real-time routing, navigation, traffic and weather data, and drayage.
In addition, applications can include advanced emergency management that aims to reduce congestion
on major roadways through monitoring traffic incidents with closed circuit television cameras,
dispatching vehicles to remove debris or hazardous materials, communicating the most direct routes to
emergency vehicles to help them arrive more quickly at accident scenes and displaying information on
dynamic message signs to alert travelers of any issues.
Truck platooning is an alternative to the long combination vehicles (LCVs) where trucks operate in
closely-spaced, semi-automated platoons of three or more big-rigs, with two-way encrypted
communications controlling their spacing. Trucks can reduce fuel usage from 5 to 10 percent by
operating 50 to 75 feet apart (instead of today’s mandated 300 feet). This requires a level of automation,
in which the driver still controls steering but the automation controls acceleration and braking. Pilot
projects are under way in several states, and several more have recently enacted legislation to enable
this new technology.
A major hurdle to dedicated truck lanes and truck platooning is operating in mixed traffic. Motorists
entering or exiting an interstate may have difficultly maneuvering through a “wall” of three-to five truck
platoons. Large-scale platooning is anticipated to be more than a decade away. However, the timetable
for planning, designing, financing, and constructing dedicated truck lanes could occur in the next 10-15
years.
Other Forms of Electronic Freight Management
The Electronic Freight Management (EFM) initiative is a USDOT-sponsored project that applies web
technologies that improve data and message transmissions between supply chain partners. It promotes
and evaluates innovative e-business concepts, enabling process coordination and information sharing for
supply chain freight partners through public-private collaboration. In 2007, as part of its EFM program
initiative, USDOT conducted an EFM deployment test in Columbus, OH with partners from a Limited
Brands air cargo supply chain originating in China. Successful supply chain deployments of EFM
technologies are delivering benefits such as increased efficiency and better customer service. Major
users of these technologies report better integration with their partners and greater supply chain
visibility.
Smart Roadside Program
The Smart Roadside program is a joint modal initiative between the FHWA and the Federal Motor
Carrier Safety Administration (FMCSA). A component of the vehicle-to-infrastructure element of the
USDOT connected vehicle research initiative, Smart Roadside is a system envisioned to be deployed at
strategic points along commercial vehicle routes to improve the safety, mobility, and efficiency of truck
movement and operations on the roadway. It is a concept where private- and public-sector motor
carrier systems will continue to operate as intended and where information collected for one purpose
can be shared where authorized to serve multiple stakeholders and uses. The objective is to apply
advanced technologies to create more efficient and streamlined processes and to share data in real time

Page 10-26 CONNECTICUT STATEWIDE FREIGHT PLAN
TRENDS, NEEDS AND ISSUES Final Report
or near-real time to maximize its utility. The primary focus areas of Smart Roadside safety research are
in various stages of operation and deployment. These are:
Electronic Screening (E-Screening) is a key component of the information collection
systems and communications networks that support commercial vehicle operation, referred to
as the Commercial Vehicle Information Systems and Networks (CVISN). E-Screening involves
automatic identification and safety assessment of a commercial vehicle in motion. With E-
Screening, safe and legal vehicles are permitted to continue on their route. Enforcement
resources can be used to target unsafe vehicles and carriers. Currently, E-Screening occurs at
fixed stations and on-demand verification sites.
Wireless Roadside Inspection Program research is being conducted to increase the
number and frequency of safety inspections at the roadside and obtain data about the
commercial vehicle and its driver. The program is examining technologies that can transmit
safety data directly from the vehicle to the roadside and from a carrier system to a government
system. The safety data being considered for transmission include basic identification data (for
the driver, vehicle, and carrier), the driver’s hours of service record, and sensor data that
provide information on weight, tire, and brake status. Enforcement systems and staff will use this
data to support E-Screening and inspections at locations such as staffed roadside sites, virtual
weigh stations, and on-demand verification sites.
Truck Parking research and ITS-based project deployments will provide commercial vehicle
parking information so that commercial drivers can make early route planning decisions based
on hour-of-service constraints, location and availability of parking, travel conditions, and
loading/unloading.
The Connecticut Department of Transportation (CTDOT) and the Connecticut Department of Motor
Vehicles (CTDMV) are studying the requirements and feasibility of a virtual electronic screening (e-
screening) and weigh-in-motion pilot project. The study will identify the technological resources,
solutions, and costs for a pilot installation of license plate reader (LPR), USDOT number reader
technology and high-speed weigh in motion (WIM) technology. These tools will be used jointly by law
enforcement to screen for motor carriers that may pose a particular risk to the traveling public. In
addition to identifying the most appropriate and effective technologies for e-screening and weigh in
motion for virtual enforcement, a research team will investigate the best methods to integrate the e-
screening data with the FMCSA’s Performance and Registration Information Systems Management
(PRISM) program. As shown in Figure 10.3, Connecticut’s four of the five weigh stations are located
near borders with neighboring states, and one is located where I-691 and I-91 meet, near Meriden.

CONNECTICUT STATEWIDE FREIGHT PLAN Page 10-27
Final Report TRENDS, NEEDS AND ISSUES
Figure 10.3: Locations of Weigh Stations, 2017
Source: CTDOT and CDM Smith
Additionally, State agencies will utilize the information gathered at e-screening operations for
transportation infrastructure decision-making and budgeting, including pavement design, highway
maintenance and rehabilitation, and freight planning and programming. If implemented, the e-screening
system will be used in conjunction with a high speed virtual WIM station. The agencies envision this
system to be installed at up to three potential sites:
1. Interstate 91 near the Massachusetts State Line
2. Interstate 395 near the Massachusetts State Line
3. Interstate 95 near the Rhode Island State Line
The system will screen trucks for compliance in an automated fashion and will transmit data to a nearby
law enforcement vehicle. Overweight vehicles will also be flagged by the system and the data will be sent
to the law enforcement officer on duty at the site. When vehicles are flagged by the system as out of
compliance, enforcement officers will then pull over the vehicle and perform an inspection at a site to be
determined by constraints of the pilot location. These roadside virtual weigh stations are expected to
operate around the clock, capturing and transmitting the data to a centralized e-screening data capture
and analysis system. The real-time data collected from these systems will be available for use in
pavement design, highway maintenance and rehabilitation, freight planning and programming, and related
applications.

Page 10-28 CONNECTICUT STATEWIDE FREIGHT PLAN
TRENDS, NEEDS AND ISSUES Final Report
Low Carbon and Zero-Emission Technologies
In 2015, the National Highway Traffic Safety Administration and the US Environmental Protection
Agency proposed new CO2 emissions and fuel economy standards for heavy duty tractor trailers that
could produce a 24 percent reduction in carbon emissions. Tractor trailers contribute significantly to
mobile-source CO2 emissions due to the fact that they travel relatively long distances, carry heavy loads
and use higher-carbon content diesel fuel. According to the proposed rule, the emissions reductions
could be achieved through drive train improvements, idle reduction technologies, and vehicle
components that reduce air and road friction35.
10.2.6 E-Commerce and Drone Delivery
According to the U.S. Department of Commerce, online sales accounted for more than a third of total
retail sales growth in 2015. When factoring out items not normally bought online such as fuel and
automobiles, e-commerce accounted for more than 10 percent of all of retail sales. Web sales totaled
$341.7 billion for the year, a 14.6 percent increase over 2014's $298.3 billion. As e-commerce or online
retail purchases continue to increase, the demand for moving those shipments will also increase. E-
retailers have quickly realized that last mile delivery is becoming a critical differentiator and a strategic
priority. According to a survey by Accenture in 2016, two-thirds of online consumers now choose a
retailer based on the number of delivery options, with another three-quarters looking at a retailer’s
return policy before completing an order.
Major delivery companies such as Amazon, Google, DHL, and UPS are now working on meeting the
demand for faster, cheaper package deliveries by looking for efficient, time saving methods for home
delivery including drone delivery. In June 2016, the FAA approved rules governing small commercial
drones. Commercial uses such as package delivery are not yet allowed under the rules. However, the
FAA is working to expand commercial uses for drones. Retailers and delivery companies have
expectations that drone deliveries will allow drivers to make more deliveries per hour without driving
additional miles. Amazon is piloting a drone delivery program called “Prime Air” that will deliver
packages weighing less than 5 pounds to customers within 30 minutes from centrally located
warehouses. Google parent company Alphabet and DHL are also working on their own drone delivery
programs. Although drone delivery has several hurdles to overcome such as weather restrictions, FAA
rules, and public acceptance; it has the potential to disrupt the trucking industry.
10.2.7 Trucking Trends
Because nearly every freight shipment travels by truck at some point in its delivery, challenges on the
highway system can cause ripples through the state’s freight transportation system and the economy.
Delay, safety, and access issues raise costs for shippers, carriers, manufacturers and consumers alike.
Pavement and Bridge Maintenance
Substandard bridges and pavement may cause cargo damage and truck detours that increase distances
and increase delivery times. The FHWA has issued a proposal to set minimum national standards for
pavement and bridge conditions specific to pavement smoothness and the structural integrity of bridges.
35 “EPA and NHTSA Propose Standards to Reduce Greenhouse Gas Emissions and Improve Fuel Efficiency of Medium- and Heavy-Duty Vehicles for Model
Year 2018 and Beyond”, Regulatory Announcement, United States Environmental Protection Agency, June 2015

CONNECTICUT STATEWIDE FREIGHT PLAN Page 10-29
Final Report TRENDS, NEEDS AND ISSUES
The initiative is one of three rulemakings mandated by MAP-21 that are aimed at establishing national
performance management process to guide improvements on the national highway system. Once
standards are adopted, states will be required to report on pavement and bridge conditions to the
USDOT. If reported pavement and bridge conditions fail to meet the established minimum national
standard, Connecticut will be required to dedicate highway formula funds to improve these conditions
and lose the flexibility that MAP-21 and the FAST Act provide to use these funds for other priorities.
Truck Size & Weight Limits
Increases in the size and weight of vehicles may improve freight efficiency, but they may also have a
lasting impact on roadway quality and state maintenance budgets and may compromise safety. In
addition, heavier and larger trucks require route plans that may necessitate the need for lengthy detours
due to weight limits, or vertical or horizontal clearances. The state’s roadway system is relatively well
equipped to handle the current truck configurations, in terms of size and weight, particularly in urban
areas. Town and city roads are not built to the same standards however, and can suffer from the
repeated stress of heavy truck loads. In rural areas, some infrastructure that was built decades ago may
struggle to handle heavy farm loads.
Incident Management
Incident management describes the coordinated activities of transportation, emergency and law
enforcement agencies to respond to accidents, highway construction, incidents and natural disasters
such as hurricanes. Proper planning and investment in incident management can decrease the response
times to emergencies and can help restore a corridor to pre-incident flow rates more quickly. Statewide
and regional transportation planning for disasters, emergencies, and significant events provide a
framework for comprehensive, multi-jurisdictional, multi-disciplinary preparedness, response, and
management for a wide range of incidents that affect freight transportation systems in the state.
Providing solutions that address all hazards will support transportation system management, congestion
management, and emergency response preparedness. Barriers to better incident management exist
within the state such as manpower, funding limitations, lack of best practices knowledge, and
bureaucracy/coordination issues.
Limited Availability of Truck Parking
Hours of service regulations for truck drivers requires off-duty times for rest. The limited availability of
parking may occasionally result in trucks parked on ramps and shoulders, which may present a safety
risk. An inventory of parking supply conducted by a recent FHWA report notes that Connecticut has
the 9th lowest number of commercial truck parking spaces (1,536) being accommodated by 20 public
facilities and 16 private facilities. The location of truck parking facilities is critical especially in urban
locations where the current supply may not be adequate in high demand locations.
Overall Condition and Design of Roadway Infrastructure
As the economy grows and new industries are established, the highway system will be expected to carry
more freight. Heavy-use truck routes often experience rough pavement, tight turning radii, narrow lane
width, short ramps, inadequate merging lanes, lane restrictions and overall capacity issues. Last mile
connections on the local road systems can be particularly prone to these issues. Needs can range from
small scale intersection improvements to the rebuilding and expanding of long stretches of highway links.

Page 10-30 CONNECTICUT STATEWIDE FREIGHT PLAN
TRENDS, NEEDS AND ISSUES Final Report
Improved Connectivity
Intermodal connectivity improves efficiency by increasing the mode choices and speed at which goods
move throughout the State. Improving these connections can increase the velocity of freight, reduce
transportation costs and positively impact freight-reliant industries.
Additional Transportation Funding Mechanisms
Connecticut is not unique in terms of transportation funding shortfalls. Transportation needs far
outweigh the resources available and historically, freight needs have not received separate attention in
transportation funding programs. There is a freight-specific need for additional transportation funding
mechanisms, particularly for highway maintenance and construction. In addition, funding programs are
often prescribed for specific types of projects or modes, limiting the ability to fund some high priority
projects. Multimodal transportation funds, which can be used for transportation projects on a
competitive basis regardless of mode, have begun to gain popularity in other states.
Truck Wayfinding and Routing
Truck freight routing decisions can be influenced in a number of ways. For example, events such as
incidents and construction activities that occur far from a truck driver’s current location can influence
routing over long distances. Tolling policies and operational restrictions in one state can lead to
diversions or re-routing decisions that adversely affect traffic conditions in another. Wayfinding and
directional signage can have the same unintended effect. CTDOT has been particularly concerned about
policies and traffic conditions that have encouraged trucks to use I-84.
There is a need for public agencies to exchange information and harmonize how trucks are managed in
an operational sense. Regional and national coordinating bodies such as the American Association of
State Highway Transportation Officials (AASHTO) and the I-95 Corridor Coalition offer forums for
exchanging such information. More informal exchanges that lead to better coordination between public
agencies is certainly desirable as well. For any exchanges to succeed, there must be a mutual recognition
of the value in communicating and a way to institutionalize agreements into concrete actions.

CONNECTICUT STATEWIDE FREIGHT PLAN Page 11-1
11. FREIGHT TRANSPORTATION IMPROVEMENT
STRATEGY
This chapter presents recommendations for freight investments, policies, and programs that
Connecticut should implement to ensure the state’s freight transportation system serves the current
and future freight transportation needs of business, industry and consumers, and aligns with the national
freight policy goals established under MAP-21 and FAST Act.
These recommendations are also aligned with Connecticut’s long range statewide strategic multimodal
transportation plan. They were carefully crafted by CTDOT and freight stakeholders to address current
needs and support the major goals and objectives of this plan (as articulated in Chapter 2 of this report):
Goal 1: Safety and Security – Enhance the safety and security of the freight transportation
system in all modes.
Goal 2: Economic Competitiveness and Efficiency – Support economic competitiveness,
efficiency, and development through investment in the freight transportation system. Work with
the private sector to identify needs and deficiencies.
Goal 3: Optimized Operations & Performance – Ensure adequate capacity and
operational efficiency of the freight system in Connecticut. Support the use of Intelligent
Transportation Systems and technologies. Enhance the efficiency of the movement of goods
into, out of, and throughout the State. Aim to improve the resilience of the freight system to
extreme events or changes in travel demand.
Goal 4: State of Good Repair – Proactively maintain freight system infrastructure to
preserve CTDOT’s capital investments.
Goal 5: Environmental Protection & Livability – Ensure that improvements to the freight
system do not negatively impact the environment and help improve the quality of life for
Connecticut residents and visitors.
Goal 6: Program and Service Delivery – Deliver projects and services faster, more cost-
effectively and with greater customer satisfaction. Create strong partnerships with state
agencies, local governments, neighboring states and the private sector to foster collaboration,
improve program delivery and facilitate public-private partnerships.
The recommendations are centered on and organized under five categories including a general freight
category and four categories that recognize the principal modes that the State relies upon for goods and
commodities movement: truck freight, freight rail, marine freight, and air cargo. Within each category
recommendations are further organized under three subcategories: infrastructure recommendations,
policy recommendations and technology recommendations, where appropriate.

Page 11-2 CONNECTICUT STATEWIDE FREIGHT PLAN
FREIGHT TRANSPORTATION IMPROVEMENT STRATEGY Final Report
11.1 GENERAL FREIGHT RECOMMENDATIONS
11.1.1 Policy
Adopt Statewide Freight Plan. The first step in integrating freight into CTDOT planning and
project development activities is to adopt this Connecticut Statewide Freight Plan. Adoption of
this plan by CTDOT, once it has been reviewed and accepted by the Federal Highway
Administration (FHWA), will demonstrate the state’s commitment to address freight needs and
advance effective freight transportation policies. The adoption of the Connecticut Statewide
Freight Plan, along with updates every five years, will allow CTDOT to obligate National
Highway Freight Program funds from December 2017 onwards.
Incorporate Recommendations into Statewide Rail Plan. CTDOT is currently preparing
a new plan for the state’s rail network, including freight rail. This Statewide Freight Plan, serving
as the State’s freight transportation policy document, will be used to inform the Statewide Rail
Plan by incorporating freight needs and recommendations, thereby improving coordination
among various CTDOT departments.
Freight Transportation Performance Measures. As discussed in Chapter 2, the adoption
of performance-based planning for freight transportation systems is integral to enabling CTDOT
to measure progress towards freight goals. The FHWA has gradually introduced a national
transportation performance management system to monitor and base decisions on
transportation performance. Performance-based planning is a data-driven, strategic approach to
the planning and programming of future investments that prioritizes limited funding on the most
strategic projects, adds accountability and transparency to the decision-making process, and
improves program delivery.
Performance-based planning and programming is not only considered a best practice in the
transportation industry but also is mandated by the FHWA under MAP-21 and FAST Act. The
FHWA requires the use of data and other information on transportation system performance to
make more effective and efficient decisions that improves resource allocation and leads to
improved safety, emissions and freight movement outcomes, particularly on the National
Highway System and Interstate Systems.
Following the phase-in period of federal performance management implementation and within
six years, CTDOT will adapt the performance framework to be more freight-focused. The
measures listed in the Goals and Objectives section of the plan should be reported for the
freight-intensive network components, including the National Multimodal Freight Network, the
Primary Highway Freight Network, and Critical Rural and Urban Freight Corridors. As an
example, CTDOT will report on bridge condition for the “freight-intensive” highway network as
a separate element. The plan recommends that CTDOT also report on those portions of the
network where higher proportions of truck traffic are expected.

CONNECTICUT STATEWIDE FREIGHT PLAN Page 11-3
Final Report FREIGHT TRANSPORTATION IMPROVEMENT STRATEGY
Continue Dialog with Freight Stakeholders and Regional Partners. As part of the
process for developing the Connecticut Statewide Freight Plan, CTDOT engaged public and
private sector freight stakeholders through a series of small group meetings held throughout the
State. CTDOT will continue this program of stakeholder outreach to inform stakeholders of the
status of freight projects and activities, solicit feedback, and work cooperatively to advance new
policies. Connecticut will also continue to coordinate freight planning and freight-supportive
land uses with Metropolitan Planning Organizations and Rural Councils of Government in
Connecticut and work with the MPOs and COGs to prioritize, fund and implement freight
capital improvements and institute new freight related programs and policies.
Engaging the private sector and freight stakeholders benefits CTDOT by creating an institutional
framework for learning about freight trends, which are changing rapidly, and freight needs.
Private sector stakeholders in turn can benefit from discussing the multiple competing objectives
that public infrastructure investment addresses. During the plan’s development, rail stakeholders
cited a need for a point of contact to coordinate freight partnerships.
Coordinate Freight Transportation Planning and Investment. Connecticut will
continue to coordinate transportation planning and investments among New England states, and
New York State to ensure that issues impacting regional trade are identified and addressed
strategically, and to avoid a scenario where one state’s investment shifts a problem to another
state. This is particularly important in New England where relatively small states with dense
populations and transportation networks increase the likelihood of impacts spilling over state
borders. Specific discussion topics include coordination and harmonization of trucking
regulations, multi-state information-sharing with freight operators, tolling and value pricing
policies and regionally-significant freight investment needs such as a new Hudson River freight
rail crossing.
Connecticut officials participate in many regional coordination organizations, including the I-95
Corridor Coalition, the Coalition of Northeastern Governors (CONEG), the New England-
New York Transportation Compact and others. Continued involvement in regional
organizations such as these will allow the region’s officials to collaborate on a regional vision for
freight and to prioritize mutually beneficial investments.
11.2 TRUCK FREIGHT
11.2.1 Infrastructure
Truck Parking Areas. Increase number of truck-only parking areas.
Truck Inspection Safety. Construct wider breakdown lanes to allow for safe inspection of
trucks.
Implement the Investment Recommendations of the Long Range Statewide
Transportation Plan. Connecticut’s Long Range Statewide Transportation Plan (LRSTP)
identifies over $79 billion in highway and bridge enhancement and state of good repair
investments that will have a direct and positive effect on truck freight movement. The LRSTP
addresses many of the capacity, operational and access issues identified in this freight plan.

Page 11-4 CONNECTICUT STATEWIDE FREIGHT PLAN
FREIGHT TRANSPORTATION IMPROVEMENT STRATEGY Final Report
Highways carry more than 94 percent of the State’s total freight and are therefore the most
critical component of the State’s freight transportation infrastructure. Due to pervasive
bottlenecks, congestion, and bridge deficiencies that have plagued many portions of the state’s
highway network, highway travel times between Connecticut and regional markets are
unreliable. This affects businesses and industries throughout the State and region.
Costly improvements such as additional travel lanes and extended truck climbing lanes are needed on
many interstate routes and bridges on priority freight routes that do not meet the 100,000-pound
weight capacity, or have substandard vertical clearances. These structures need to be reconstructed or
replaced to accommodate heavy and oversize loads. In addition, real-time incident and travel
information should be more widely available and the State’s oversize/overweight permitting process can
be further streamlined. Addressing these deficiencies, will improve system efficiency and the reliability of
truck access to and from Connecticut businesses.
The costs for improving the state’s highway network are significant, but the benefits relative to costs are
also high. The state’s biggest challenge is to identify new funding sources to implement these freight-
beneficial projects on a timely basis to improve travel time reliability for all users and to begin to realize
the economic benefits. The highway and bridge elements of the investment recommendations are shown
in Table 11-1 and Table 11-2.
Table 11-1: Freight-Beneficial Highway Projects
Highway Projects $30,405,000,000
Statewide $15,965,000,000
New Truck Rest Areas
Construction of new truck rest area facilities to address statewide truck parking
shortage, providing safe and ample parking to meet demand.
$500,000,000
Highway Needs - Pavement
Funding needed to maintain state of good repair and achieve 0 percent poor roads on
all state maintained roadways. This number represents pavement costs and not total
project costs.
$5,425,000,000
Highway Needs - Ancillary Assets
Funding needed to maintain state of good repair of ancillary assets on state maintained
roadways such as guardrail, lighting, signs, signals, etc. Excludes costs for major projects
listed.
$8,565,000,000
Safety Improvements on State Highway Network
Fund safety improvements in addition to the safety improvements that are part of
every project CTDOT undertakes.
$50,000,000
Intelligent Transportation Systems (ITS)
Project combines two federal-state initiatives that use Intelligent Transportation
Systems technology to promote the safe and legal movement of commercial vehicle
traffic within our state and across the nation. Through an automated system, both
initiatives seek to improve highway safety by rewarding safe motor carriers, penalizing
unsafe carriers and removing unsafe commercial vehicles from the roadways.
$50,000,000
Annual Funding for Municipal Traffic Signal Program
The municipal traffic signal enhancement program will be funded at a level of
$10 million per year. This is a new program proposed to assist local communities in
upgrading, modernizing and improving traffic signal systems and signalized intersections
in the municipalities, bringing them in conformance with the current MUTCD.
$250,000,000

CONNECTICUT STATEWIDE FREIGHT PLAN Page 11-5
Final Report FREIGHT TRANSPORTATION IMPROVEMENT STRATEGY
Highway Projects $30,405,000,000
Local Transportation Capital Improvements Program (LOTCIP)
This project will increase the Local Transportation Capital Improvement Program
(LOTCIP) from a current funding level of $45 million per year to an annual value of
$90 million per year. This program is established to support projects in Connecticut's
municipalities.
$1,125,000,000
New York to New Haven $9,560,000,000
Operationally Improve Rt. 8
Operational enhancements to the Route 8 corridor in Naugatuck Valley to address
congestion. Include additional safety features, wider shoulders, longer and enhanced on
and off-ramp geometrics and acceleration lanes, as well as operational lanes to improve
operational safety along a portion of this corridor.
$500,000,000
Reconstruct Rt. 7 from Grist Mill Road to Rt. 33
The reconstruction of existing Route 7 from Grist Mill Road in Norwalk to the
intersection of Route 7 and Route 33 in Wilton will incorporate the expansion of the
existing two-lane roadway to a four-lane facility, including safety improvements,
geometric and operational enhancements at intersections, and appropriate left-turn
lanes at critical intersections thereby enhancing safety and capacity.
$40,000,000
Widen I-95 from NY State Line to Stamford
These projects include the construction of an additional operational lane in each
direction along I-95 from the NY State Border to Stamford. This highly congested
corridor constructed in the early 1950s has outgrown its ability to serve the region
and current operations present significant congestion and safety issues. The projects
will enhance vehicular capacity, increase operational safety, and provide a significant
benefit to the economic environment, as well as the ability of the coastal route to
support tourism and recreation.
$1,660,000,000
Widen I-95 from Stamford to Bridgeport
These projects include the construction of an additional operational lane in each
direction along I-95 from Stamford to Bridgeport. This highly congested corridor
constructed in the early 1950s has outgrown its ability to serve the region and current
operations present significant congestion and safety issues. The projects will enhance
vehicular capacity, increase operational safety, and provide a significant benefit to the
economic environment, as well as the ability of the coastal route to support tourism
and recreation.
$4,085,000,000
Widen I-95 from Bridgeport to Milford Connector
These projects include the construction of an additional operational lane in each
direction along I-95 from the Bridgeport to Milford Connector. This highly congested
corridor constructed in the early 1950s has outgrown its ability to serve the region
and current operations present significant congestion and safety issues. The projects
will enhance vehicular capacity, increase operational safety, and provide a significant
benefit to the economic environment, as well as the ability of the coastal route to
support tourism and recreation.
$1,930,000,000
Widen I-95 from Milford Connector to New Haven
These projects include the construction of an additional operational lane in each
direction along I-95 from the Milford Connector to New Haven. This highly congested
corridor constructed in the early 1950s has outgrown its ability to serve the region
and current operations present significant congestion and safety issues. The projects
will enhance vehicular capacity, increase operational safety, and provide a significant
benefit to the economic environment, as well as the ability of the coastal route to
support tourism and recreation.
$1,325,000,000

Page 11-6 CONNECTICUT STATEWIDE FREIGHT PLAN
FREIGHT TRANSPORTATION IMPROVEMENT STRATEGY Final Report
Highway Projects $30,405,000,000
Reconstruct and Reconfigure Exit 59 on Rt. 15 (Wilbur Cross Parkway)
The reconstruction and reconfiguration of the existing Exit 59 interchange in New
Haven/Woodbridge on Route 15 (Wilbur Cross Parkway), addressing an area which
has substandard geometry.
$20,000,000
New York to Hartford $2,170,000,000
Reconstruction of I-84 interchange at Route 4 and Route 6 in Farmington
The reconstruction of I-84 in the Route 4 and Route 6 area in Farmington will
incorporate additional operational and safety improvements amongst interchanges to
provide improved access to Connecticut Route 9. Recommendations to be
incorporated include the removal of the on and off ramps to Connecticut Route 4
from I-84 mainline. Access will be provided through a local collector distributor
roadway. A new eastbound portion of I-84 will be constructed to carry three lanes of
traffic and eliminate the right lane drop to Connecticut Route 9. A direct connection
from Connecticut Route 4 and Route 9 southbound will be provided. These
improvements will provide better connections to all state routes and enhance
operational safety.
$130,000,000
Widen I-84 from NY State Line to Danbury Exit 3
Widening of I-84 from the NY State Line to the Danbury Exit 3, with the addition of
one operational lane. I-84 is heavily travelled by commercial vehicles and is a major
freight corridor utilized by many of the interstate trucking routes and these
improvements will provide a higher level of service for commercial operations and
improved safety for all motorists increasing capacity from 2 to 3 lanes.
$150,000,000
Widen I-84 from Danbury Exit 3 to Exit 8
Widening of I-84 near Danbury between Exit 3 and Exit 8, with the addition of one
operational lane. I-84 is heavily travelled by commercial vehicles and is a major freight
corridor utilized by many of the interstate trucking routes and these improvements will
provide a higher level of service for commercial operations and improved safety for all
motorists increasing capacity from 3 to 4 lanes.
$640,000,000
Operational Lane Improvements on I-95 Between Exits 8 and 10-
This project will provide a speed change lane on I-95 northbound from Exit 8 in
Stamford to Exit 10 in Darien. This project will also include the replacement of a
bridge over the New Haven Line (NHL), which is in poor condition and is one of the
most constrictive bridges on I-95 between New Haven and the New York State line.
The creation of speed change lanes in this area will improve operations and improve
capacity to reduce congestion.
$490,000,000
Widen I-84 from Danbury Exit 8 to Waterbury Exit 18
Widening of I-84 from Danbury Exit 8 to Waterbury Exit 18, with the addition of one
operational lane. I-84 is heavily travelled by commercial vehicles and is a major freight
corridor utilized by many of the interstate trucking routes and these improvements will
provide a higher level of service for commercial operations and improved safety for all
motorists increasing capacity from 2 to 3 lanes.
$720,000,000
Construct operational lane on I-84 between Exits 40 & 42 in West Hartford
The section of I-84 between Exits 40 and 42 has been identified as having a significant
substandard roadway cross section to accommodate the current vehicular volumes and
also presents a significant operational safety issue. The cross section will be improved
through the addition of auxiliary lanes to be constructed on I-84 eastbound between
New Britain Avenue and South Main Street and I-84 westbound between Park Road
and Ridgewood Road to increase capacity and relieve congestion and improve
operational safety.
$40,000,000
New Haven to Springfield, Mass $500,000,000

CONNECTICUT STATEWIDE FREIGHT PLAN Page 11-7
Final Report FREIGHT TRANSPORTATION IMPROVEMENT STRATEGY
Highway Projects $30,405,000,000
Operational & Safety Improvements at Rt. 9/Rt. 17 On-Ramp
Improve Route 9 northbound on-ramp from Route 7, which will incorporate an
additional acceleration lane and taper distances to enhance safety and reduce accidents
in this area.
$30,000,000
Reconfigure Interchanges of Rt. 9/Rt. 66 and Rt. 9/Rt. 17
Reconfigure interchanges with Route 9 and Route 17 and 66 in Middletown to
incorporate direct connections between the Arrigoni Bridge and Route 9, eliminating
the existing at-grade signalized intersection on Route 9 which is currently the cause of
significant congestion and a number of major accidents. These improvements will
enhance operational safety and provide enhanced air quality resulting from the removal
of the signalized intersections.
$390,000,000
Operational Improvements on I-91 at I-691/Rte 15 Interchange
Enhancements of the northbound and southbound I-91 area in Meriden between Exit
15 and Exit 20, incorporating an additional operational lane in each direction to allow
for smoother transition of the northbound on-ramp and elimination of the continual
queued right lane condition on southbound on I-91 as a result of the Wilbur Cross
Parkway Route 15 off-ramp configuration. These improvements will provide a higher
level of operations along this section of I-91 as well as enhanced safety reduction in
accidents.
$80,000,000
Eastern Connecticut $2,210,000,000
Widen I-95 from Baldwin Bridge to Gold Star Bridge (Including New I-395 /
Rt. 11 Interchange)
The widening initiative for I-95 from Goldstar Bridge to the Rhode Island State Line,
includes the addition of an operational lane along this section. The existing corridor
serves many of the intra-State and inter-State recreational and tourist areas. The
widening will provide additional capacity, enhanced safety, and access throughout the
corridor.
$1,200,000,000
Widen I-95 from Branford to Baldwin Bridge
Widen I-95 from Branford to Old Saybrook from 2 to 3 operational lanes in each
direction. Will provide additional capacity, enhanced safety, and improved access
throughout the corridor.
$720,000,000
Widen I-95 from Gold Star Bridge to Rhode Island State Line
Widen I-95 from Groton to Rhode Island State Line from 2 to 3 operational lanes in
each direction. Will provide additional capacity, enhanced safety, and improved access
throughout the corridor.
$290,000,000
Table 11-2: Roadway Bridge Improvement Project
Roadway Bridge Projects $35,190,000,000
Statewide $19,200,000,000
Bridge Needs
Funding needed to reach and maintain less than 10 percent structurally deficient bridges
statewide (by deck area) within 20 years. This cost includes all bridges within the state,
both state maintained and locally maintained bridges that are over 20 feet in length and
located on a public road. The cost includes only the rehab or replacement of the bridge
elements and excludes other related project components and costs. The cost to rehab
and or replace the individual bridges listed in this document has been removed from this
cost and represented in those individual project costs.
$18,700,000,000

Page 11-8 CONNECTICUT STATEWIDE FREIGHT PLAN
FREIGHT TRANSPORTATION IMPROVEMENT STRATEGY Final Report
Roadway Bridge Projects $35,190,000,000
Local Bridge Program
Increase the state funded local bridge program from $10 million per year to $20 million
per year for 25 years. As a result of a new round of inspections of municipal bridges with
spans less than 20 feet (most of which have not been inspected for more than 20 years),
it is anticipated that there will be a significant increase in the need for rehabilitation
projects on local bridges. In addition, a substantial increase in the number and speed of
delivery of federal local bridge projects is anticipated as a result of a new pilot program
where project design phases are managed and funded by CTDOT under 80 percent
federal and 20 percent State funds in lieu of the standard program with projects design
phases funded 80 percent federal, 20 percent local, and managed by the municipalities.
Construction phases will continue to be funded under 80 percent federal and 20 percent
local and managed by the municipalities.
$500,000,000
New York to New Haven $360,000,000
Rehab and Repair Commodore Hull Bridge on Rt. 8
This bridge, 1,600 feet in length, carries Route 8 over the Housatonic River and Route
110 in Shelton and Derby. Constructed in 1951, its structures have a failing paint system,
resulting in section loss to some steel members. This project will include abrasively
blasting clean all of the superstructure steel and applying a protective paint coating
system, to protect the structural steel from corrosion.
$35,000,000
Rehab West Rock Tunnel on Rt. 15 in Woodbridge
Built in 1949, this 1/4-mile twin tunnel conveys the Wilbur Cross Parkway under the
West Rock Ridge. It requires constant maintenance due to its poor condition and
hazards created by falling concrete, ice, and poor illumination. Rehabilitation will use
innovative means to maintain traffic flow during construction and to shorten the
duration of construction.
$235,000,000
Replace Stevenson Dam Bridge on Rt. 34
Replacement of this bridge that carries Route 34 over the Housatonic River in the
Towns of Oxford and Monroe will address substandard, deteriorating conditions and
improve road geometry which contributes to vehicular operational problems.
$90,000,000
New York to Hartford $12,335,000,000
Replace I-84 Viaduct, Hartford
This project will replace the I-84 viaduct (originally built between 1965 and 1967) in
downtown Hartford. Known as the “Aetna Viaduct,” this one-mile long series of
structures carrying 8 to 10 lanes of I-84, requires attention due to deterioration. The
urban setting, critical constraints and complexities of the area requires the extension of
work beyond the existing viaduct limits to improve the transportation infrastructure
while lessening the highway’s impact on surrounding neighborhoods and improving
community cohesion, livability and the economic vitality of Hartford.
$5,270,000,000
Replace I-84 Mixmaster, Waterbury
This interchange, built between 1965 and 1967, requires rehabilitation or replacement of
substantial bridge structures and highway ramp improvements to expand capacity,
correct operational deficiencies and enhance safety, includes expanding capacity and
enhancing safety-Of the numerous structures that form the interchange, the most
significant are I-84 EB (3,766 ft.), I-84 WB (2,461 ft.), Rt. 8 NB (2,634 ft.) and Rt. 8 SB
(1,589 ft.). The I-84/Rt. 8 interchange is unique in Connecticut as I-84 is double-decked
as it crosses Rt. 8 and the Naugatuck River. Rt. 8 is also double-decked just south of I-
84.
$7,065,000,000
New Haven to Springfield, Mass $2,295,000,000

CONNECTICUT STATEWIDE FREIGHT PLAN Page 11-9
Final Report FREIGHT TRANSPORTATION IMPROVEMENT STRATEGY
Roadway Bridge Projects $35,190,000,000
Additional Bridge Crossing Over Connecticut River-
In addition to the Arrigoni bridge, a new major bridge will be built over the Connecticut
River in the Middletown area to alleviate congestion. This option will require a
considerable amount of new road construction, including a new interchange at Route 9,
reconfiguration of the existing interchanges on Route 9 in Middletown, and construction
of connecting roads on the Portland side, and major ROW purchases.
$2,000,000,000
Replace Putnam Bridge on Rte 3 over Connecticut River
Project will replace the 2,400-foot-long, four-lane bridge carrying Rt. 3 over the
Connecticut River between Wethersfield and Glastonbury. Constructed in 1959, the
structure has been subject to multiple rehabilitation projects and emergency repairs and
continues to be a maintenance liability. Due to substandard shoulder widths,
maintenance efforts or emergency response results in a major impact to traffic. This is a
major river crossing and provides traffic relief to the other major river crossings in
Hartford and Middletown. The replacement structure will minimize maintenance needs,
improve safety and traffic flow and provide relief on other river crossings. In addition, a
6’ sidewalk will be added creating a much-needed pedestrian river crossing.
$295,000,000
Eastern Connecticut $1,000,000,000
Replace Gold Star Bridge (Northbound Only) - I-95 Over Thames River-
Replace 5,931-foot-long deck truss bridge carrying 5 travel lanes in New
London/Groton. Widened in 1975 but a significant amount of the original 1943
superstructure and substructure was retained and requires replacement.
$900,000,000
Safety & Capacity Improvements at Mohegan-Pequot Bridge - Route 2A over
Thames River-
Improve safety, relieve traffic congestion and provide better access to development
around casinos as part of Route 2/2A/32 corridor improvements in Montville/Preston.
Widen Route 2A from 1 to 2 lanes in each direction from Interchange 2 to Rt. 12.
$100,000,000

Page 11-10 CONNECTICUT STATEWIDE FREIGHT PLAN
FREIGHT TRANSPORTATION IMPROVEMENT STRATEGY Final Report
11.2.2 Policy
Streamline Trucking Permits and Regulations. Many freight stakeholders perceive Connecticut’s
regulatory environment a hindrance to operating their businesses efficiently. They complain about
difficulties tracking the status of truck drivers’ commercial licenses; onerous certification requirements
for hauling potable water, transporting fuel, or gaining access to port facilities (such as TWIC card
requirement); Department of Motor Vehicles (DMV) restrictions on the number of transactions that can
be processed per visit, which requires them to take multiple unnecessary and costly trips to the DMV
offices; the process of obtaining apportionment plates from the DMV; and the difficult process of getting
oversize and overweight vehicle permits from CTDOT. Connecticut will engage the stakeholders and
determine whether there are cost-effective ways to improve the efficiency of implementing permitting,
licensing and the enforcement of regulations in general. For example, the State could develop an online
system for drivers to easily check and track the status of their Commercial Drivers Licenses or obtain
other licenses and permits. The State could also improve the alignment of DMV rules and regulations
related to truck size, weight, and wet-weather travel with those of neighbor states and streamline the
oversize/overweight vehicle permitting process. Additionally, the state would like to expand and adopt
the current pilot program that allows oversize/overweight travel on weekends. Such business-friendly
changes to permits and regulations would provide much needed relief to freight operators and remove
barriers to efficiency and competitiveness.
11.2.3 Technology
The ability to move freight into and out of the State efficiently and reliably, regardless of incidents
related to weather, construction activity and vehicular crashes, is of critical importance to the State’s
economy. Within the past decade, innovations in the telecommunications industry and in the
development of shipping containers have enabled many companies to compete in global markets, to shift
to "just-in-time" delivery of inventory, and to realize cost savings by using multimodal transportation.
These technological advances benefit manufacturing and retailing and maintain competitive prices for
consumers, but they can be nullified by ineffective or inefficient highway operations. Extended highway
closures or incident caused delays can result in loss of revenues and contribute to industry decisions to
relocate.
CTDOT is committed to maintaining highways free of obstacles created by weather or incidents and to
plan construction projects to minimize impacts to peak hour travel. However, more can be done to take
advantage of emerging technologies to keep highways free-flowing for the benefit of freight and
passenger traffic alike, including emerging intelligent transportation systems (ITS) technologies that
better monitor system performance and communicate traffic and roadway conditions directly to motor
carriers and truck drivers.
Smart freight vision or freight advanced traveler information systems (FRATIS) would provide dynamic
travel planning, improve on-time performance and optimize intermodal drayage operations by
integrating existing Connecticut corridor data on travel times and construction activity with real-time
information on travel conditions and roadside incidents. Such systems could be implemented through
public-private partnerships and thus speed deployment. They might include:
Congestion Reduction. CTDOT currently deploys various ITS technologies including variable
message signs, web-based portals and smart phone messaging to alert travelers of travel
conditions and to suggest alternate routes, but new systems are smarter and more predictive.
Cutting-edge logistics technologies such as cloud-based, real-time road congestion and
construction notifications will create efficiencies in the movement of cargo and decrease

CONNECTICUT STATEWIDE FREIGHT PLAN Page 11-11
Final Report FREIGHT TRANSPORTATION IMPROVEMENT STRATEGY
bottlenecks. Real-time information targeted to truckers should be made available on variable
message signs along strategic routes and via privately operated phone-based or web-based
applications.
Truck Parking Information Services (TPIS). TPIS is a network of commercial and public
facilities that provide real-time information on the availability and reservation of truck parking.
Information would be pushed directly to the driver and made available on a variety of devices.
Truck Alternate Routing Services (TARS). TARS delivers a truck-specific GPS navigation
solution that accounts for truck-restricted and prohibited roads. The service would provide safe
and reliable navigation around congestion and accidents on roads that are safe for the truck to
maneuver.
Truck Travel Predictive Services (TTPS). This service would consider the driver’s current
location, predicted arrival time, current traffic conditions, historical traffic patterns, and
estimated hours of service remaining in their hours of service log. TTPS analyzes the current
traffic in comparison with the historical averages for the time of day and day of the week and
considers other factors such as persistent trends (seasons, holidays, and months), temporal
trends (construction), and dynamic trends (weather).
Truck Road Weather Travel Services (TRWTS). TRWTS is an application that pushes
roadway link-specific information on road weather to users’ in-vehicle equipment or personal
wireless devices. The freight traveler operating on Connecticut interstates would receive road
weather alerts and warnings within a shortly after adverse conditions are detected by mobile
data sources.
Truck Smart Roadside (TSR). TSR solutions include technology sharing capabilities for
sharing of data associated with the operation of commercial vehicles between customer business
systems, roadside facilities, weight-in-motion scales systems, truck parking systems, and
government systems. The data is seamlessly collected at roadsides to improve motor carrier
safety, security, operational efficiency, and freight mobility.
Weigh-in-Motion Systems. Truck safety depends upon various monitoring systems and
enforcement programs operated and managed by CTDOT and other State agencies such as the
Connecticut Department of Emergency Services and Public Protection and the Connecticut
Department of Motor Vehicles. ITS programs that contribute to safer trucking include weight-
in-motion systems, which estimate truck weights while vehicles are traveling at highway speeds.
Connecticut’s current weight-in-motion systems could be enhanced with TSR technology to
improve enforcement of overweight trucks.
Pursue Creation of a Digital Process to Automate OS/OW Truck Permits. Assess
options for and feasibility of implementing an automated, GIS-based process to map optimal
routes for oversize/overweight trucks that integrates real-time road/bridge conditions to
improve outcomes and streamline the permitting process.

Page 11-12 CONNECTICUT STATEWIDE FREIGHT PLAN
FREIGHT TRANSPORTATION IMPROVEMENT STRATEGY Final Report
11.3 FREIGHT RAIL
11.3.1 Infrastructure
Much of Connecticut’s freight rail infrastructure is aging and does not meet current national standards.
For example, many of Connecticut’s short lines and many bridges on some of its main lines cannot carry
railcars loaded to 286,000 lbs., the de facto national standard; and most freight lines are limited to
operating at FRA Class I and Class 2 standards. These constraints require Connecticut rail shippers and
customers to under-load rail cars and travel at speeds limited to 10 to 25 miles per hour. However,
there are limits to the extent to which this upgrade can be accomplished. Routes with overhead
catenary (electric) lines have not been designed to accommodate double-stacking of trains.
Rail operations in Connecticut are further complicated by deferred maintenance and the fact that the
regional and short line railroads operating within the state must interchange railcars with the national
railroads at terminals outside Connecticut. This is often time-consuming and inefficient, making rail
service even less competitive with trucking.
For freight rail to be competitive with truck freight, more investments are needed to maintain and
upgrade Connecticut’s rail infrastructure at Class 2 or better. CTDOT will pursue cooperative
agreements with the State’s private rail operators and execute public-private partnerships that would
incentivize private reinvestment in freight rail and retain and attract rail-served industries.
Upgrade all feasible lines to 286K weight-bearing capability. As the agency responsible
for the State-owned rail lines, CTDOT will work with private railroad owners to advance
programs to upgrade track and bridges to safely and feasibly accommodate 286,000 lbs. railcars,
as well as:
– Improve access to CSX Class I terminals in New Haven and West Springfield.
– Reestablish operation of the Maybrook Line (Derby, CT to Maybrook, NY via Danbury, CT).
– Develop a definitive plan for the New Haven-Hartford-Springfield Line to accommodate both
passenger and freight rail needs. There is considerable momentum to construct improvements on
the New Haven – Hartford – Springfield line including the rehabilitation of the Windsor Locks-
Enfield Connecticut River Bridge to support 286,000-lb., industry-standard load and the
rehabilitation of Harford Union Station elevated track to support 286,000-lb., industry-standard
load to maintain and enhance freight access to West Springfield Terminal. However, there has also
been discussions about electrifying the line, which may be incompatible with double-stack freight
operations.
– Maintain Pan Am line to the same class as the Springfield Line that feeds into it.
– Prioritize where full, double stack clearances are warranted and implement a capital investment
program for bridge or catenary reconstruction to provide those clearances.
– Upgrade the New England Central Railway (NECR) including replacing and increasing vertical
clearances to accommodate the heights of Phase II double-stack containers between Willimantic
and New London.

CONNECTICUT STATEWIDE FREIGHT PLAN Page 11-13
Final Report FREIGHT TRANSPORTATION IMPROVEMENT STRATEGY
Improve Rail Sidings and Transloading Facilities. Identify specific locations where new
sidings, interchange and off-loading areas, and railcar storage yards are warranted and prioritize
their construction to improve freight movements or remove bottlenecks, particularly on freight
lines that are shared with commuter rail service where daytime windows are needed for freight
movements. Provide assistance to freight railroads to implement these improvements.
Improve Intermodal Connections Between Maritime Freight and Freight Rail.
Coordinate with the Statewide Port Authority to facilitate improvements to maritime-to-rail
connections and maritime to highway connections at Connecticut’s Deepwater ports.
The projects shown in Table 11-3 from the Strategic Plan address many of these freight rail
recommendations:
Table 11-3: Freight-Beneficial Projects Identified in Long Range Statewide
Transportation Plan (LRSTP)
Rail Projects $12,175,000,000
New York to New Haven $750,000,000
Rail Freight Network
Establish annual funding program to maintain state-of-good repair across state-wide
rail freight network, including rights-of-way, bridges and structures, at-grade rail
crossings, culverts and special projects.
$750,000,000
New York to New Haven $10,225,000,000
Fixed Rail Bridges State of Good Repair
Rehab and or replace all fixed rail bridges on New Haven Line (NHL) to attain state of
good repair. This includes all fixed rail bridges on mainline and branch lines.
$2,175,000,000
Moveable Rail Bridges - State of Good Repair
Rehab and or replace all moveable rail bridges on New Haven Line (NHL) to attain
state of good repair.
$2,825,000,000
Rail Track Program
Improvements and upgrades to existing tracks on New Haven Line (NHL) including
concrete tie repair, interlocking, drainage, track, ties, rail and road bed.
$1,680,000,000
New Canaan Branch Line Improvements
Significant improvements on New Canaan branch line service between Darien and
New Canaan to increase frequency and enhance service to and from mainline.
Improvements include Springdale siding, platform and station improvements.
$45,000,000
Electrify Danbury Branch Line
Electrification of existing Danbury branch line service between South Norwalk and
Danbury would allow for extended one seat ride service on New Haven Line (NHL).
$400,000,000
Extend Rail Service from Danbury to New Milford
This includes all the estimated capital costs associated with extending rail service
from Danbury to New Milford without electrification.
$450,000,000
Waterbury Branch Line Improvements
improvements to Waterbury branch line service between Bridgeport and Waterbury
to increase frequency and enhance service to and from mainline. Improvements
include completion of signalization, grade crossings, sidings, and station improvements.
$350,000,000
Track Improvements Between Milford and New Haven
Restore four track capacities between Milford and New Haven to increase capacity
and enhance service on New Haven Line (NHL).
$300,000,000

Page 11-14 CONNECTICUT STATEWIDE FREIGHT PLAN
FREIGHT TRANSPORTATION IMPROVEMENT STRATEGY Final Report
Rail Projects $12,175,000,000
Full Capacity New Haven Line Service (NHL)
Re-align Connecticut's existing tracks and stations between New Haven and New
York to provide significant frequency and speed enhancements on New Haven Line
(NHL). This project would result in a two-track local and two track express service
on the mainline, with center island platforms at key locations between New Haven
and New York. It includes communications and signal enhancements.
$2,000,000,000
New York to Hartford $200,000,000
Berlin-Waterbury Rail Improvements
Upgrade existing freight rail line (includes track, bridges, & Terryville tunnel). Preserve
option for future passenger rail service.
$200,000,000
New Haven to Springfield, Mass $580,000,000
Rehabilitation of Connecticut River Railroad Bridge
This bridge is located over the Connecticut River between Windsor Locks and
Enfield. Major rehabilitation and replacement of the center span is needed due to age
and condition. Improvements will allow for higher load ratings and increased speeds.
$80,000,000
Track Improvements
Hartford Line improvements from Windsor to Springfield, includes double-tracking.
This improvement would allow for increased rail service from 17 round trips per day
to 25 round trips per day.
$500,000,000
Eastern Connecticut $420,000,000
Replacement of CT River Railroad Bridge
Replacement of the Amtrak moveable bridge in Old Saybrook. This project will allow
for increased load ratings, greater reliability and higher speeds for both Shore Line
East (SLE) commuter rail and Amtrak inter-city regional rail service.
$220,000,000
Freight Rail Improvements in Eastern Connecticut
Includes estimated capital costs to improve the existing NECR and P&W rail freight
lines in Eastern Connecticut from New London north to Massachusetts, preserving
options for future passenger rail service. Improvements include tracks, bridges, sidings
and grade crossings.
$200,000,000
11.3.2 Policy
Preserve rail siding access to existing industrial sites. Connecticut has many
undeveloped, under-utilized or abandoned rail-served industrial sites; however, due to
disinvestment or lack of maintenance of rail infrastructure, particularly short lines, or changes in
land use, Connecticut is losing rail sidings access. When shippers and distribution centers lose
their access to the rail network they must then transport goods by truck to an off-site transload
facility or, more likely, the goods may be shipped by truck for the entirety of the trip. CTDOT
will work cooperatively with regional partners, such as Metropolitan Planning Organizations and
Regional Councils of Governments, to implement a program that identifies rail siding access to
industrial sites where rail customers currently exist or where rail shippers may develop new
facilities and then. This identification process would be a first step in understanding the value of
rail infrastructure to better advocate for its preservation, in order to maintain rail as a viable
transportation option for the State’s shippers, maintain market competition with trucking and
improve the freight rail market share.

CONNECTICUT STATEWIDE FREIGHT PLAN Page 11-15
Final Report FREIGHT TRANSPORTATION IMPROVEMENT STRATEGY
Leverage economic development opportunities with transportation investments
and improvements. CTDOT will optimize its rail system assets by continuing to work
collaboratively with state, regional and local economic development agencies to attract new
freight rail dependent industries and develop new approaches to capture the public and private
benefits of locating at new or redeveloped rail-served sites.
Public-Private Partnerships. Institute Public-Private Partnerships (P3) between CTDOT and
private freight railroad owners and operators in Connecticut covering railroad planning,
operations, capital improvements, matching grant programs and economic development to:
– Effect fair and transparent governance of rail lines to improve safety, reduce trucks on state
roads, and mitigate highway congestion.
– Reduce barriers to funding for rail operators that do not own tracks.
– Provide tax incentives or credits for non-highway freight transport.
– Facilitate the conversion of brownfields adjacent to freight rail lines to productive industrial
development sites that could support rail freight customers.
11.3.3 Technology
Positive Train Control (PTC). According to the Federal Railroad Administration (FRA),
Congress required Class I railroad main lines handling poisonous-inhalation-hazard materials and
any railroad main lines with regularly scheduled intercity and commuter rail passenger service to
fully implement PTC by December 31, 2018. PTC uses communication/processor-based train
control technology that prevents train-to-train collisions, overspeed derailments, incursions into
established work zone limits, and the movement of a train through a main line switch in the
wrong position. CTDOT will ensure private freight rail operators in Connecticut comply with
these requirements.
Rail Bridge Database. Upgrade CTDOT’s highway and rail bridge database to provide reliable
and complete vertical and horizontal clearance information.
Modernize At-Grade Crossings. Upgrade at-grade crossing signals with full protection
including gates and modern lights.
11.4 MARITIME FREIGHT
11.4.1 Infrastructure
Intermodal Connectivity. Prioritize and construct identified intermodal connectivity
improvements between freight rail and ports (e.g. new sidings and improved tracks) and
between truck freight and ports (e.g. truck staging areas/lay down areas and improved
connections between ports and the Interstate System) in the ports of New London, New Haven
and Bridgeport.

Page 11-16 CONNECTICUT STATEWIDE FREIGHT PLAN
FREIGHT TRANSPORTATION IMPROVEMENT STRATEGY Final Report
Dredging and Maintenance. Work with CT DEEP, the US Coast Guard, and the Army
Corps of Engineers to fund and execute the dredging and maintenance of Connecticut’s
navigable waterways and deepwater channels.
– New Haven is the state’s most important cargo facility and its current business is threatened
by shoaling and poor channel maintenance.
– Scores of smaller marinas, which provide economic, tourism and recreational benefits to the
State, need dredging.
Table 11-4 presents Long Range Statewide Transportation Plan (LRSTP) projects that would improve
maritime freight movements in Connecticut
Table 11-4: Freight-Beneficial Port Projects Identified in Long Range Statewide
Transportation Plan (LRSTP)
Port Improvement Projects $711,000,000
New London Thames River Dredging
Authorized depth of Thames River Federal Navigation Project (FNP) is 35 feet though
United States Navy (USN) maintains most of channel at 40 feet. Project will provide
consistent FNP leading into State Pier Facility of 40+ feet.
$11,000,000
Port of New London/State Pier Repairs
State Pier repairs and minor improvements such as dock levelers, LED lighting, etc. $40,000,000
Port of Bridgeport Dredging
Project would remove shoaling thus return the authorized depth of the Federal
Navigation Project (FNP) to 35 feet.
$54,000,000
Harbor Maintenance
Maintenance dredging of small to midsize ports and harbors at $5 million per year for
25 years. This investment will ensure the on-going economic viability and allow for safe
passage of vessels.
$125,000,000
Rocky Hill-Glastonbury Ferry Maintenance Dredging
Remove sediment from ferry landings on both sides of the CT River. $1,000,000
Ferry Improvements
Rehab and replacement of existing vessels, tugs/barges, docks, piles, etc. $50,000,000
Port of New Haven Improvements
Includes completion of rail link to terminals, additional trackage and sidings, and
deepening of channel.
$130,000,000
Port of New London/State Pier Improvements
Port of New London/State Pier infrastructure improvements including relocation of
access roads, renovation to the piers, improvements to the bulkheads, paving of
storage areas, and the construction of a new warehouse-State Pier Strategic
Infrastructure Improvement project deepens all berths, realigns entrance gate,
removes hillock improves rail access to piers. East and West wharves
repaired/replaced as Phase 4 and 6 respectfully. Purchase of specialized cargo handling
equipment and investments to incentivize private infrastructure investments.
$300,000,000
11.4.2 Policy
Increase dry bulk and break-bulk cargoes
– Extend the service areas of ports into competitive regional markets.
– Explore cost sharing opportunities with the private sector to expand port operations.

CONNECTICUT STATEWIDE FREIGHT PLAN Page 11-17
Final Report FREIGHT TRANSPORTATION IMPROVEMENT STRATEGY
– Revise State Pier solicitation process to seek a long-term public-private partnership. Existing
short-term leases and rent structures do not incentivize/reward cargo growth.
11.5 AIR CARGO
Air freight provides transportation for high-value and extremely time sensitive cargo. While air freight
tonnage is low compared to the tonnage carried by truck and rail, air transport serves businesses
shipping high-value electronics, aerospace, bio-medical and business parcels.
Bradley International Airport (BDL), which is owned and operated by the Connecticut Airport
Authority (CAA), in Windsor Locks, CT, on State Route 20, three miles west of I-91. BDL is the largest
airport in the state and in 2014, was ranked the 54th busiest airport in the country based on passengers
enplaned. In addition to passenger service, the airport also handles air cargo, and is the primary air cargo
airport in Connecticut.
In 2015, BDL was ranked 30th in cargo landed weight, nationally. Three quarters of BDL’s air freight
currently moves on flights operated by U.S. domestic integrated carriers including FedEx and UPS. It is
expected that BDL’s strategic location between two international gateways, John F. Kennedy
International Airport in New York City and Logan International Airport in Boston, will result in cargo
tonnage continuing to increase.
11.5.1 Infrastructure
Improve Truck-to-Air Connections at BDL. Work with the CAA to facilitate
improvements to truck-to-air connections at BDL via the CAA, such as, and work with the CAA
to identify freight supportive lands near BDL that might require road improvements to facilitate
air cargo access or staging areas for air cargo truck deliveries.
Prioritize Improvements on Roads Leading to BDL. Explore whether CT Route 20
should be part of the National Highway Freight network to facilitate improved truck access to
BDL.
11.5.2 Policy
Enhance Access to Airport Oriented Development. Work with the CAA and the
Connecticut Department of Economic and Community Development to enhance access to the
Bradley Airport Development Zone (BADZ) located in the towns of East Granby, Windsor,
Windsor Locks, and Suffield. The BADZ extends enterprise zone tax incentives to airport-
related firms utilizing BDL. The zone was created by the CAA to increase BDL’s force as an
economic driver within the region. The BADZ zone has been instrumental in building
manufacturing and other production likely to increase air freight in the future.

Page 11-18 CONNECTICUT STATEWIDE FREIGHT PLAN
FREIGHT TRANSPORTATION IMPROVEMENT STRATEGY Final Report
This page intentionally left blank.
CONNECTICUT STATEWIDE FREIGHT PLAN Page 12-1
12. FREIGHT INVESTMENT PLAN
Connecticut’s Freight Investment Plan approach is to apply FAST Act freight funding for federal fiscal
years (FFY) 2017 to 2026 to existing projects addressing freight bottlenecks and congestion on the
Primary Highway Freight System. The freight-supportive projects identified previously in this plan were
ranked according to the following criteria:
Is project located on a major interstate (I-84, I-91, or I-95)?
Is project located in a freight bottleneck area?
Does project add capacity to the freight network?
Does project increase the bridge load rating?
Does project make an operational improvement?
Does project provide freight data?
A yes answer for each question equals 1 point. The minimum score is 0 points and maximum score is 6
points. Three projects were chosen for use of National Highway Freight Program (NHFP) funds and are
listed in Table 12-1.

Page 12-2 CONNECTICUT STATEWIDE FREIGHT PLAN
FREIGHT INVESTMENT PLAN Final Report
Table 12-1: Freight Projects Chosen for NHFP Funds
Freight Projects Total Cost *Sources of Funds
*Funds Programmed
Total Previous
Years FY 2018 FY 2019 FY 2020 FY 2021 FY 2022 FY 2023
Proj. No.
0151-0273
I-84
Waterbury
Upgrade Expressway
(Phase 3)
$342,883,302
NHFP Funds $59,478,537 $27,930,454 $14,844,689 $16,703,394 $0 $0 $0 $0
Other Federal Funds - NHPP $102,570,798 $102,570,798 $0 $0 $0 $0 $0 $0
Other Federal Funds - STPA $15,239,199 $15,239,199 $0 $0 $0 $0 $0 $0
Other Federal Funds - EBS $1,618,940 $1,618,940 $0 $0 $0 $0 $0 $0
Other Federal Funds - EBE $149,060 $149,060 $0 $0 $0 $0 $0 $0
Other Federal Funds - REPF $761,812 $761,812 $0 $0 $0 $0 $0 $0
Other Federal Funds - REPS $5,710,989 $5,710,989 $0 $0 $0 $0 $0 $0
Other Federal Funds -
NHPP-Exempt $8,737,307 $0 $8,737,307 $0 $0 $0 $0 $0
State Funds - 41400 & 41404 $148,616,660 $148,616,660 $0 $0 $0 $0 $0 $0
Total $342,883,302 $302,597,912 $23,581,996 $16,703,394 $0 $0 $0 $0
Proj. No.
0102-0295
I-95
Norwalk
NHS - Median Barrier /
Resurfacing
$70,000,000
NHFP Funds $37,099,248 $0 $0 $0 $10,000,000 $27,099,248 $0 $0
Other Federal Funds - NHPP $1,600,752 $0 $0 $0 $0 $1,600,752 $0 $0
State Funds - G-95 & 41400 $31,300,000 $0 $0 $0 $31,300,000 $0 $0 $0
Total $70,000,000 $0 $0 $0 $41,300,000 $28,700,000 $0 $0
Proj. No.
0056-0316
I-95
Greenwich / Stamford
Improvements from
NY State Line to Exit 7
$157,532,000
NHFP Funds $37,099,248 $0 $0 $0 $0 $0 $18,549,624 $18,549,624
Other Federal Funds - NHPP $104,679,552 $0 $0 $0 $0 $34,000,000 $35,339,776 $35,339,776
State Funds - 41400 $15,753,200 $0 $0 $0 $0 $15,753,200 $0 $0
Total $157,532,000 $0 $0 $0 $0 $49,753,200 $53,889,400 $53,889,400
* The sources and amounts of funds programmed represents a snapshot in time (as of November 1, 2017) and may be revised at any point based on funding availability, project deliverability, changes in
priorities, etc.

CONNECTICUT STATEWIDE FREIGHT PLAN Page 13-1
13. BIBLIOGRAPHY
Following is a bibliography of previously completed studies, reports and planning documents relevant to
freight transportation in Connecticut. A review of these documents combined with stakeholder meetings
and interviews provided valuable background information and insight necessary to conduct this study.
AECOM. “Connecticut Statewide Airport System Plan.” Connecticut Airport Authority, May 2016
Cambridge Systematics, Inc. “Northeast Rail Operations Study (NEROps): Phase I Final Report.” I-95
Corridor Coalition, July 2007.
Connecticut Department of Economic and Community Development. “CT Economic Strategic Plan:
Strategic Vision for Connecticut.” September 2009.
Connecticut Department of Energy and the Environment. “2013 Comprehensive Energy Strategy for
Connecticut.” February 2013.
Connecticut Department of Transportation. “2011 Master Transportation Plan.” January. 2011.
Connecticut Department of Transportation. “2012-2016 Connecticut State Rail Plan.” 2012.
Connecticut Department of Transportation. “Connecticut Aviation Freight Transportation Inventory.”
October 2003.
Connecticut Department of Transportation. “Connecticut On the Move – Strategic Long-Range
Transportation Plan 2009-2035.” June 2009.
Connecticut Department of Transportation. “Connecticut State Rail Plan: 2012-2016.” 2012.
Connecticut Department of Transportation. “Intermodal Transportation Inventory- A Synopsis of
Trucking and Warehousing, A Cross Section of the Industry in CT.” April 2003.
Connecticut Department of Transportation. “Intermodal Transportation Inventory: Marine and Pipeline
Transportation, CT Marine and Pipeline Terminals.” June 2002.
Connecticut Department of Transportation. “Master Transportation Plan: 2009-2016.” January 2009.
Connecticut Department of Transportation. “Railroad Freight Transportation Inventory – CT Railroad
Facilities.” January 2003.
Connecticut Department of Transportation. “Statewide ATMS Plan for Limited Access Highways Needs
Assessment.” March 2013.
Connecticut Department of Transportation. “Transportation in Connecticut: The Existing System.” 2014.

Page 13-2 CONNECTICUT STATEWIDE FREIGHT PLAN
BIBLIOGRAPHY Final Report
de la Torre Klausmeier Consulting, Inc. “Development of a Strategic Plan for Reducing Emissions
Associated with Freight Movement in Connecticut.” Connecticut Department of Energy and the
Environment, March 2013.
Earthtech. “Connecticut Statewide Rest Area and Service Plaza Study.” Connecticut Department of
Transportation, September 2008.
Global Insight. “Freight Movement in the Hartford Metropolitan Area: A Regional Freight Market
Overview.” Capitol Region Council of Governments, December 2005.
IBI Group. “ATMS (Advanced Traffic Management Systems) Plan.” Connecticut Department of
Transportation, 2013.
Milone and MacBroome. “State Pier Needs and Deficiencies Study: New London, CT.” Connecticut
Department of Transportation, March 2011.
Moffat and Nichols. “Connecticut’s Deep Water Port Strategy Study.” Connecticut Office of Policy and
Management, December 2012.
South Western Regional Planning Agency. “2010 South Western Region Freight Overview.” 2010.
URS. “Freight Cargo Study for Tweed New Haven Airport.” South Central Regional Council of Governments,
January 2014.