Embed Size (px)
Citation preview

International Journal of IT in Architecture, Engineering and ConstructionVolume 1 / Issue 4 / December 2003. ©Millpress 275
1 Introduction
Since CPM (Critical Path Method) introduced network
scheduling in the early 1950ʼs, many CPM-based
network scheduling methods have been developed.
PERT (Program Evaluation and Review Technique,
1958) was developed to supplement CPM by
incorporating probabilities into the duration of project
activities. PDM (Precedence Diagramming Method,
1964) diversifi ed precedence relationships between
activities. In addition, GERT (Graphical Evaluation
and Review Technique, 1966) made it possible
to model ‘what-if ̓ conditions by incorporating
probabilistic branching and loop structures into
network scheduling. These CPM-based scheduling
methods have been most widely used in the planning
and control of construction projects.
However, their usefulness has been often questioned,
particularly when a project is heavily constrained by
CPM-based scheduling methods have been most widely used in the
planning and control of construction projects. However, their usefulness has
been often questioned, particularly when a project is heavily constrained by
either time or resources. This is mainly because those CPM-based methods
lack the mechanism to effectively formulate construction plans and evaluate
feedback effects on the construction performance. As an effort to address
this issue, the Dynamic Planning and Control Methodology (DPM) has been
developed by integrating the CPM-based network scheduling concept and
the simulation approach. To be used as a standalone planning and control
tool, DPM adopts the user-defi ed dynamic modeling approach, which
allows construction planners to defi ne contents of pre-structured models
by setting the values of model parameters. Having the ability to simulate
the dynamic state of construction with the required fl exibility, DPM aims to
help prepare a robust construction plan against uncertainties. Particularly,
DPM focuses on construction feedbacks in dealing with indirect and
unanticipated events that might occur during construction. As examined in
a case study with bridge construction projects, the use of DPM would help
ensure that construction projects could be delivered in time without driving
up costs by enhancing planning and control capabilities.
user-defi ned dynamic modeling, simulation, project management, dynamic
modeling, system dynamics
Development of Dynamic Planningand Control Methodology (DPM):
based on the user-defi ned dynamic modeling approach
Monseo Park1 and Feniosky Pena-Mora2
ABSTRACT |
1. Assistant Professor, Dept of Building, School of Design and Environment, National University of Singapore, 4 Architecture Drive SDE:
5–3,3 Singapore 117566. Email: [email protected]
2. Associate Professor, Department of Civil and Environmental Engineering, University of Illinois at Urbana-Champaign, 205 North Mathews
Avenue, Urbana, IL 61801. Email: [email protected]
KEYWORDS |
International Journal of IT in Architecture, Engineering and ConstructionVolume 1 / Issue 4 / December 2003. ©Millpress276
| Monseo Park and Feniosky Pena-Mora
either time or resources. Since CPM-based scheduling
methods assume that the attributes of project activities
such as duration and production rate are known at
the beginning of a project and do not change during
the project execution, they are not adequate for
representing the actual project process [Martinez and
Ioannou, 1997]. This results in frequent updates to
refl ect the actual performance into scheduling. As
a result, CPM-based scheduling methods lack the
mechanism to effectively formulate and evaluate
construction plans, which is required to deal with
a high degree of complexities involved in todayʼs
construction projects.
Researchers on simulation-based construction
management [Halpin, 1977; Paulson, 1983; Bernold,
1989; Martinez, 1996] have argued that this incapability
of CPM-based scheduling methods can be overcome
by adopting a simulation approach, which can describe
and capture the dynamic state of construction, and
provide an analytic tool to evaluate construction plans
with a diagnostic capability. Their research results
have demonstrated that simulating construction plans
prior to physical execution can substantially enhance
the effectiveness of planning [Martinez and Ioannou,
1997]. However, despite its potential advantages
simulation-based methods have not been widely used
in practice yet. This is because they are not as fl exible
and easy to use as CPM-based methods, limiting
their simulation capability to a specifi c construction
process instead of a whole construction project. The
unpopularity of simulation-based methods is also
attributed to the lack of consideration on human
factors such as workers ̓fatigue and schedule pressure
on productivity, which is crucial to ensuring reality in
the representation of construction processes.
As an effort to address this challenging issue, we present
the Dynamic Planning and Control Methodology
(DPM), which has been developed to help prepare
a robust construction plan, focusing on construction
feedbacks in dealing with indirect and unanticipated
events during construction. To be a standalone
planning and control tool with the ability to simulate
the dynamic state of construction, DPM rigorously
integrates the CPM-based network scheduling concept
and the simulation approach. To achieve this research
goal, we have elaborated the concept of the user-
defi ned dynamic modeling approach, based on which
network scheduling components are incorporated into
system dynamics simulation models. Following a brief
introduction of the research methodology, we discuss
the implementation of DPM and its applicability with
a case study in the subsequent sections.
2 Research Methodology: System Dynamics
System dynamics was developed to apply control theory
to the analysis of industrial systems in the late 1950ʼs
[Richardson, 1985]. Since then, system dynamics has
been used to analyze industrial, economic, social and
environmental systems of all kinds [Turek, 1995]. One
of the most powerful features of system dynamics
lies in its analytic capability [Kwak, 1995], which
can provide an analytic solution for complex and
non-linear systems like construction. Construction
projects are inherently complex and dynamic,
involving multiple feedback processes and non-linear
relationships [Sterman, 1992]. In this context, a system
dynamic modeling approach is well suited to dealing
with the dynamic complexity in construction projects,
which has been proven by some researchers [Ng et al.,
1998; Peña-Mora and Park, 2001].
System dynamics modeling generally proceeds in
the following steps [Kwak, 1995]: First, based on a
modelerʼs understanding on the system, conceptual
model structures are described in the form of a causal
loop diagram to show the dynamics of variables
involved in the system. In a causal loop diagram,
variables are connected by arrows that denote the
causal infl uences between variables [Sterman,
2000]. Figure 1-a represents causal relationships
between construction progress and schedule

International Journal of IT in Architecture, Engineering and ConstructionVolume 1 / Issue 4 / December 2003. ©Millpress 277
Development of Dynamic Planning and Control Methodology (DPM) |
pressure. Appropriate schedule pressure can increase
productivity, which can facilitate the construction
progress. At the same time, higher schedule pressure
can also slow down the construction progress by
lowering work quality. As a result, increased or
decreased construction progress affects schedule
pressure again, forming feedback loops.
Having a causal loop constructed, variables in the
model structures come to have quantitative attributes
with equations implemented based on the relationships
built in the causal loop diagram. This step also
includes the identifi cation of stock and fl ow structures
(see Figure 1-b), which characterize the state of the
system and generate the information, upon which
decisions and actions are based, by giving the system
inertia and memory [Sterman, 2000]. Stocks represent
stored quantities and fl ows control quantities fl owing
into and out of stocks. For example assume the stock
and fl ow structures in Figure 1-c. ‘Rebar in Inventory ̓
represents a stock, in which rebar is accumulated as
it is delivered through the fl ow of ‘Rebar Delivery ̓
and from which stored rebar is taken out as it is used
through the fl ow of ‘Rebar Useʼ. Once this model
formation step is done, the completed model needs to
be tested and validated in accordance with the purpose
of the model. Finally, the validated model is applied to
solving the given problems.
3 Implementation of DPM
As conceptualized in Figure 2, DPM aims to be a
standalone simulation-based tool that is fl exible and
applicable enough for the planning and control of
construction projects by integrating the simulation
approach and the CPM-based network scheduling.
In this section, we discuss the implementation of
DPM with descriptions on the user-defi ned dynamic
modeling approach, the system dynamics models that
constitute DPM, and the functionality of DPM.
3.1 User-Defi ned Dynamic Modeling Approach
The concept of the user-defi ned dynamic modeling
approach has been elaborated as a vehicle to integrate
the traditional network scheduling and the simulation
approach. With this modeling approach, DPM has
generic parameters and structures, common to almost
all construction projects, with the ability to customize
for a specifi c project and to describe specifi c project
activities. As a result, project managers can defi ne
contents of pre-structured DPM models by setting the
values of model parameters.
The success of the user-defi ned dynamic modeling
Figure 1-a. Causal Loop Diagram Notation
Figure 1-b. Stock and Flow Structure
Figure 1-c. Example of Stock and Flow Structure
Rebar inInventory
Rebar Delivery Rebar Use
Rebar inInventory
Rebar Delivery Rebar Use
Rebar inInventory
Rebar Delivery Rebar Use
Rebar inInventory
Rebar Delivery Rebar Use
Schedule Pressure
Productivity Quality
Construction
Progress
-
+-
+
+
-
R
B
Schedule Pressure
Productivity Quality
Construction
Progress
-
+-
+
+
-
RR
BB
Stock
Flow
Variable
++

International Journal of IT in Architecture, Engineering and ConstructionVolume 1 / Issue 4 / December 2003. ©Millpress278
| Monseo Park and Feniosky Pena-Mora
approach depends on how well pre-structured models
can represent construction processes and dynamics
involved in a given project and how reliable the
simulation output of the models is. Focusing on
these issues, the following subsections discuss how
the concept of the user-defi ned dynamic modeling
approach has been incorporated into DPM.
Capturing Construction Dynamics
The user-defi ned dynamic modeling approach focuses
on feedback processes involved in construction.
Those feedback processes contribute to the generation
of indirect and/or unanticipated events during the
project execution and make the construction process
dynamic and unstable, which is hard to capture with
the traditional planning tools.
Suppose that construction processes consist of a set
of steps conceptualized in Figure 3. When a certain
control action is taken to reduce variations from the
planned performance, the action can fi x problems
and enhance the construction performance but at the
same time it can worsen the performance in another
Figure 2. Target Functionality of DPM (Dimensionless)
Figure 3. FeedbackProcesses duringConstruction
* Legend
Flexibility
Applicability
Reality in Representation
High
High
High
0
9
6 5
4 7
0 : CPM-Based Methods
1 : Carr (1979)
2 : Ahuja and Nandakumar (1985)
3 : Levitt and Kunz (1985)
4 : Paulson et al. (1987)5 : Bernold (1989)
6 : Halpin (1990)
7 : Padillar and Carr (1991)
8 : Martinez and Ioannou (1997)
9 : Tommelein (1998)10: Ng et al. (1998)
11: Peña-Mora and Park (2001)
12: DPM (2002)
12
3
8
1011
12
Overlapping
Splitting
Facilitate
Change
Reorganize into
Sub-Tasks
Allocate more
Resource:
Overtime, Increase Labor
Change Delivery
Time, Order
Increase
Concurrency
Perform
Monitor
Control
Plan
Balancing
Fix Problems &Enhance
Performance
Reinforcing
Worsen theProblems due to
Side Effects
Overlapping
Splitting
Facilitate
Change
Reorganize into
Sub-Tasks
Allocate more
Resource:
Overtime, Increase Labor
Change Delivery
Time, Order
Increase
Concurrency
Perform
Monitor
Control
Plan
Balancing
Fix Problems &Enhance
Performance
Reinforcing
Worsen theProblems due to
Side Effects

International Journal of IT in Architecture, Engineering and ConstructionVolume 1 / Issue 4 / December 2003. ©Millpress 279
Development of Dynamic Planning and Control Methodology (DPM) |
area due to side effects of the action. For example,
when a construction project is behind schedule, one
possible action to meet the original schedule is to
change the equipment used on a particular activity.
By replacing the current equipment with high
performance equipment, it is possible to facilitate the
construction process. However, it may take some time
for the workers to get familiar with the operation of the
new equipment or coordinating with other subsequent
processes may become more diffi cult. As a result of
low productivity and increased coordination problems,
it is also possible that changing equipment can further
delay the construction schedule.
Although many other factors can exist, the user-
defi ned dynamic modeling approach recognizes
construction changes, work dependencies among
activities, construction characteristics, and human
responses to work environment and policies as the
major factors that trigger construction feedbacks and
dynamics. As a result, this modeling approach assists
DPM in simulating construction processes more
realistically before the actual resource commitment.
Detailed descriptions on this issue can be found in
Park [2001].
Reducing the System Sensitivity
A key asset of the user-defi ned dynamic modeling
approach is that before controlling an activity, it
reduces the sensitivity to variations the activity may
experience. This feature, together with the ability
to formulate and evaluate construction plans ahead
of time, helps dampen the effect of hard-to-control
variations, while keeping control efforts minimized.
In DPM, this is implemented by adopting reliability
buffering [Park, 2001].
In contrast to the traditional contingency buffer, the
reliability buffer aims to systematically protect the
whole project schedule performance by pooling,
re-locating, re-sizing, and re-characterizing the
contingency buffers, if any exits. As depicted in
Figure 4, reliability buffering starts with taking off any
contingency buffer that is fed explicitly or implicitly
in individual activities. Taking off contingency buffers
from individual activities can make the activities benefi t
from appropriate schedule pressure, overcoming ‘the
last-minute syndromeʼ. In addition, the reliability
buffer is fed in the front of the successor activity in
precedence relationships and is characterized as a time
to fi nd problems or fi nish up work in the predecessor
and ramp up resources on the successor activity. By
putting buffer at the beginning of activities instead of
at the end of activities, the reliability buffer can deal
with the issue of ill-defi ned tasks that may require
time for defi nition. This makes it possible to focus
on activities having problems before they activate a
domino effect, as it might happen with the traditional
contingency buffer. In addition, reliability buffering
provides a systematic way in sizing a buffer based on
the simulation result of the construction process.
Smart System
Another fundamental concept to implement the user-
defi ned dynamic modeling approach is smart system
using software agent technology. Normally, the past
experience on a construction project tends not to be
utilized in the traditional planning and management.
In contrast, smart system attempts to convert the past
experience to knowledge. This knowledge-based
approach makes DPM smarter and more accurate,
as construction proceeds. At the beginning of
construction, DPM would be established with many
Figure 4. Reliability Buffering Steps
Contingency Buffer
Reliability Buffer
Activity A
Activity B
Activity C
Taking off
& Pooling
Re-Sizing, Re-Locating, &
Re-Characterizing
Re-Sizing, Re-Locating, &
Re-Characterizing
Path Pool Buffer
Contingency Buffer
Reliability Buffer
Activity A
Activity B
Activity C
Taking off
& Pooling
Re-Sizing, Re-Locating, &
Re-Characterizing
Re-Sizing, Re-Locating, &
Re-Characterizing
Path Pool Buffer

International Journal of IT in Architecture, Engineering and ConstructionVolume 1 / Issue 4 / December 2003. ©Millpress280
| Monseo Park and Feniosky Pena-Mora
assumed variables, but as construction advances,
actual performance will replace the initial input values
for a more realistic projection of the construction
performance.
3.2 System Dynamics Model Development
The user-defi ned dynamic modeling approach has
been materialized into DPM using system dynamics
models; a process model and four supporting models
for project scope, resource acquisition and allocation,
project performance, and construction policies.
In this section, we describe the process model
structure, focusing on feedback processes involved in
construction processes.
The process model presented in Figure 5 replicates the
generic construction process. In the model structure,
workfl ow during construction is represented as tasks
fl owing into and through fi ve main stocks, which are
named WorktoDo, WorkAwaitingRFIReply, WorkAwai
tingQualityManagement, WorkPendingduringPRRew
ork and WorkReleased. Available tasks at a given time
are introduced into the stock of WorktoDo through
the InitialWorkIntroduceRate. The introduced tasks
are completed through the WorkRate, unless defects
in the prerequisite predecessor work are found. The
completed tasks, then, accumulate in the stock, WorkA
waitingQualityManagement where they are waiting to
be monitored or inspected. Depending on work quality,
some completed tasks are either returned to the stock
of WorktoDo through ReworkAddressRate or released
to the successor work through WorkReleaseRate.
In addition, it is also possible for released tasks
to return to the stock of WorktoDo again through
ReworkAddressafterReleaseRate. In case predecessor
problematic work is found during the pre-checking
period, corresponding tasks fl ow from and to
WorkToDo through RequestForInformationRate,
PRChangeAccomodateRate, ReworkRequesttoPRRate
and PendingWorkReleaseRate. More detailed discus-
sions on these processes are as follows.
When predecessor defects are found during
construction, workers in the successor activity
normally ‘request for information ̓ (RFI) to workers
in the predecessor activity or project managers. If
by means of RFIs, the predecessor defects turn out
to have made by mistake and a managerial decision
is made to correct the defects in the location of the
defect generation, corresponding successor tasks are
delayed until the predecessor defects are corrected.
For example, assume that before starting the fl oor tile
work, it is found that the fl oor slab was constructed
Figure 5. Construction Process Model Structure
WorkAwait ingQuality
ManagementWorkReleased
WorktoDo
MinWork T ime
P otent ialWork
RatefromResource
ActualWork
Quality
QualityManagement
T horoughness
WorkAwait ingRFIReply
WorkRate
RequestFor
Informat ionRate
P RChange
AccomodateRate
Init ialWork
IntroduceRate
WorkReleaseRate
Fract ionofRFI
AvgQuality
ManagementT ime
WorkPendingdurin gP R
Rework ReworkRequest toP R
Rate
P endingWork
ReleaseRate
ReworkAddressRate
ReworkAddressaft er
ReleaseRate
Managerial
ChangeRatio
<Managerial
ChangeRatio>
RFIReplyT ime
AvgHiddenChange
Correct io nT imeinP R

International Journal of IT in Architecture, Engineering and ConstructionVolume 1 / Issue 4 / December 2003. ©Millpress 281
Development of Dynamic Planning and Control Methodology (DPM) |
thicker than its specifi cation due to inaccurate concrete
pouring in the fl oor pouring activity. As a result, if
the tile work proceeds with the current concrete slab
unchanged, the facility may not have the required
ceiling height. In this case, the project manager may
ask the concrete crew to correct the slab thickness by
chipping the excess concrete. Figure 6-a conceptualizes
this iteration process (L1).
However, the iteration of L1 does not take place in the
following cases. First, when predecessor defects have
been released to the successor by managerial decisions,
they are supposed to be accommodated by changing
associated successor tasks. Continuing with the fl oor
tiling work example, it is possible to fi nd the inaccurate
concrete construction just after pouring concrete in the
fl oor pouring activity. However, after comparing the
economic impact of each option (change or rework)
on the construction performance, the project manager
may decide to change the specifi cation of fl oor tiling
activity tasks such as the thickness of mortar or the
method of waterproofi ng instead of ordering rework
on the slab. In this case, corresponding successor tasks
are supposed to be changed after the management
decision is confi rmed through the answer to RFIs.
Secondly, it is also possible for predecessor defects
to be accommodated by a change decision during the
successor work. Both cases are represented in Figure
6-b (L2).
Once completed, construction tasks are internally
monitored and/or inspected by the ownerʼs
representatives. Depending on the result of quality
management, completed tasks are either released to
the successor or reworked. The following task fl ows in
the model structure represent the quality management
Figure 6-a. L1 Iteration Process
Figure 6-b. L2 Iteration Process
WorktoDo /
WorkAwaitingRFIReply /WorkPendingduringPRRework
/
RequestForInformationRate
ReworkRequesttoPRRate/
PendingWorkReleaseRate/ Floor tile tasks ready to
execute
Request clarification on the
floor slab
Floor tile tasks awaiting for
clarification on the floor slab
conditionRequest concrete chipping
Floor tile tasks pending during
concrete chipping on the floor
slab
Release pending floor
tile tasks on completing
concrete chipping
*Generic name /
Applied to a
construction activity
WorktoDo /
WorkAwaitingRFIReply /WorkPendingduringPRRework
RequestForInformationRate
Floor tile tasks ready to
execute
Request clarification on the
floor slab
Floor tile tasks awaiting for
clarification on the floor slab
condition
*Generic name /
Applied to a
construction activity
PRChangeAccomodateRate /
Accommodate inaccurately poured
concrete by changing the specification
of the tiling activity

International Journal of IT in Architecture, Engineering and ConstructionVolume 1 / Issue 4 / December 2003. ©Millpress282
| Monseo Park and Feniosky Pena-Mora
process in construction. Tasks accumulated in WorkAw
aitingQualityManagement are periodically monitored
and inspected. In principle, tasks satisfying the target
quality level and having intended functions are
approved and moved to WorkReleased, while defects
are disapproved and pass into the stock of WorktoDo
where they wait to be corrected. This process in
associated with the fl oor tiling work example is
conceptualized in Figure 6-c (L3). Meanwhile, the
iteration of L3 is governed by ActualReliability,
which is a function of the reliability of an activity,
predecessor quality impact, and schedule pressure.
An unreliable activity generates more defects than
a reliable activity. In addition, the low quality of the
predecessor work and lasting schedule pressure can
also lower the reliability of an activity.
During quality management, it is possible to release
changes to the successor by failing to notice them.
In the model structure, the degree of overlooking
defects is determined by QualityManagementThor
oughness, which is normally low, when an activity
work is complex or schedule pressure lasts throughout
the activity work period. Overlooked defects (e.g.,
inaccurately poured concrete), which are defi ned as
hidden defects, are released to the successor and can
deteriorate the successor work quality, depending on
the successor sensitivity to predecessor defects.
In summary, the feedback processes imbedded in
the process model are common in the construction
process, having nontrivial impact on the project
performance. Thus, understanding their role and
capturing their behaviors are critical to ensuring the
reliability of a planning and control tool. By repeating
the process model, DPM simulates a fl exible number
of construction activities, capturing the construction
dynamics caused by those feedbacks. Further
descriptions on the process model and other supporting
models can be found in Park [2001].
3.3 Functionality of DPM
As a result of incorporating the concept of the user-
defi ned dynamic modeling approach into system
dynamics models, DPM has the planning and control
functions conceptualized in Figure 7. Based on initial
input data and control actions taken by DPM users,
DPM creates a project plan, suggests project policies
and simulates project performance profi les. As
construction processes, the parameters in DPM can
be calibrated for getting more reality and accuracy in
projection of the project performance by comparing the
simulated performance with the actual performance.
All the simulation data and changes in the system
are stored in its database for future utilization by an
agent on the DPM system. Further descriptions on the
DPM functionality are made below in terms of the
incorporation of the existing scheduling methods and
collaboration schemes.
Incorporating Existing Scheduling Methods
DPM incorporates the concept of strategic planning
and concurrent engineering principles into its system
as well as schedule networking concepts. The
Figure 6-c. L3 Iteration Process
WorktoDo /
Concrete pouring tasks ready
to execute
WorkAwaitingQuality
Management /
WorkReleased /
WorkRate /WorkReleaseRate /
ReworkAddressRate/
Concrete pouring
*Generic name /
Applied to a
construction activity
Concrete pouring tasks
done but not inspectedApprove concrete
pouring tasks
Disapprove the concrete pouring work
Concrete pouring tasks
approved and ready to proceed
with tiling work on them

International Journal of IT in Architecture, Engineering and ConstructionVolume 1 / Issue 4 / December 2003. ©Millpress 283
Development of Dynamic Planning and Control Methodology (DPM) |
incorporated methods play their roles in the DPM
system, as conceptualized in Figure 8.
Strategic Planning and DSM
DPM implements the concept of strategic planning
by representing input data with DSM (Dependency
Structure Matrix, Steward, 1965 and Eppinger et al.,
1992) and developing smart cells. DSM representation
and smart cells make it easier to recognize
relationships between activities. In addition, they
organize input data so that input data can be effectively
utilized by other DPM functions. There are two kinds
of smart cells. Smart cells for an activity (Figure 9-a)
contain information on activity duration and activity
characteristics such as production types and reliability.
Meanwhile, those for relationship (Figure 9-b) have
information on the relationship of the associated two
Figure 7. System Architecture of DPM
Figure 8. Integrating Methodologies
Feedback & Database
DatabaseActual
HistoricData
Model Validation
Model Calibration
Ap
pli
cati
on
to P
lan
nin
g a
nd
Con
trol
Performance Profiles
Project Data Input
A B C D E F G H I J K L M N O P Q R S T
Acti vity A XActi vity B X
Acti vity C X X X X
Acti vity D X X
Acti vity E X X
Acti vity F X X X X
Acti vity G X X
Acti vity H X X
Acti vity I X X
Acti vity J X X X
Acti vity K X X
Acti vity L X X
Acti vity M X X X X X
Acti vity N X X X
Acti vity O X X
Acti vity P X X
Acti vity Q X X
Acti vity R X
Acti vity S X
Acti vity T X
Data Transfer
from Other Tools
MS P3
Shortening Target
Durations
Feeding Reliability
Buffers
Changing Network
Logic
DPM Planner
SS
FF
SS
SS
Buffer
FS
FS
SS Breaking Down
Activities
Finding a Better Policy
DPM- Generated Plan
Time
Quality Safety
Performance Profiles
DPM Simulation Engine
Database
Data
Model ValidationModel Validation Simulation AnalysisSimulation Analysis
Model Calibration
Ap
pli
cati
on
to P
lan
nin
g a
nd
Con
trol
Performance Profiles
Project Data Input
Parameter Tables
A B C D E G H J M N O P Q R S
Acti vity A XActi vity B X
Acti vity C X X X X
Acti vity D X
Acti vity E X X
Acti vity F X X X
Acti vity G X X
Acti vity H X X
Acti vity I X X
Acti vity J X X
Acti vity K X
Acti vity L X X
Acti vity M X X X X
Acti vity N X X
Acti vity O X
Acti vity P X
Acti vity Q X X
Acti vity R
Acti vity S X
Acti vity T X
Dependency Structure Matrix
Data Transfer
from Other Tools
Project
Influential Factors
Shortening Target
Durations
Feeding Reliability
Buffers
Changing Network
Logic
DPM Planner
SS
FF
SS
SS
Buffer
FS
FS
SS Breaking Down
Activities
Finding a Better Policy
DPM- Generated Plan
Cost Time
Quality Safety
Performance Profiles
AgentAgent
Insensitive
Sen
siti
vit
y F
un
ct’n
Time
Se
nsi
tivi
ty F
un
ct’n
Time
Sensitive
Sen
siti
vit
y F
un
ct’
n
Time
Highly Sensitive
Per
cen
t
Time
Slow Production
Perc
ent
Cha
nge
Time
Fast Production
Perc
ent
Cha
nge
Time
Slow Production
0 25 50 75 100
Percent Complete
0 25 50 75 100Percent Complete
Per
cent
Time
Fast Production
0 25 50 75 100
Percent Complete
Time Time TimeTime
Highly Unreliable
Re
lia
bili
ty F
un
ct’n Fairly Reliable
Rel
iab
ilit
y F
un
ct’
n Fairly Unreliable
Re
lia
bili
ty F
un
ct’n
Rel
iab
ilit
y F
un
ct’
nHighly Reliable
0 25 50 75 100
Percent Complete
A B C D E F G H
Work is Divisibleat Intervals
Time Time TimeTime
Highly Unreliable
Re
lia
bili
ty F
un
ct’n Fairly Reliable
Rel
iab
ilit
y F
unc
t’n Fairly Unreliable
Re
lia
bili
ty F
un
ct’n
Rel
iab
ilit
y F
un
ct’
nHighly Reliable
Time Time TimeTime
Highly Unreliable
Re
lia
bili
ty F
un
ct’n Fairly Reliable
Rel
iab
ilit
y F
un
ct’
n Fairly Unreliable
Re
lia
bili
ty F
un
ct’n
Rel
iab
ilit
y F
un
ct’
nHighly Reliable
Time Time TimeTime
Highly Unreliable
Re
lia
bili
ty F
un
ct’n Fairly Reliable
Rel
iab
ilit
y F
unc
t’n Fairly Unreliable
Re
lia
bili
ty F
un
ct’n
Rel
iab
ilit
y F
un
ct’
nHighly Reliable
Insensitive
Sen
siti
vit
y F
un
ct’n
Time
Se
nsi
tivi
ty F
un
ct’n
Time
Sensitive
Sen
siti
vit
y F
un
ct’
n
Time
Insensitive
Sen
siti
vit
y F
un
ct’n
Time
Se
nsi
tivi
ty F
un
ct’n
Time
Sensitive
Sen
siti
vit
y F
un
ct’
n
Time
Insensitive
Sen
siti
vit
y F
un
ct’n
Time
Se
nsi
tivi
ty F
un
ct’n
Time
Sensitive
Sen
siti
vit
y F
un
ct’
n
Time
Planning & Simulation
Change Orders
RFI
Deficiency Level
Project Costs
Construction ProgressConstruction Progress
Graph Lookup - Performance10
00 10
Graph Lookup - Performance10
00 10
Graph Lookup - Performance10
00 10
Influence CurvesGraph Loo kup - Performance
10
00 10
Influence CurvesGraph Loo kup Performance
10
10
Graph Loo kup Performance10
10
WorkAwaitin gQuality
M anagement WorkReleasedWorktoDo
WorkAwaitin gRFIReply
Reques tFor
Info rmationRate
UPChange
AccomodateRate
WorkReleas e
Rate
WorkPending duetoUPChange
PendingWork
ReleaseRate.
UPActionRequestRate.
Reproces s Requeston
WorkReleasedRate.
Reproces s Reques ton
WorknotReleas edRate.
Simulated Data
C onditio ns Precedence
Relations hips
Conditions Preced ence
R elationships
C onditio ns Preceden ce
Relations hips
Di = Df FS 0 Di = Df FS (-Li) Di = Df FS (Li)
Di > Df FS 0 Di > Df Df FS (-Li) Di > Df Df FS (Li)
B f B f Bf
Di < Df Df FS (-(Df-Di)) Di < Df Df FS (-(Li+Df-Di)) Di < Df Df FS (Li-(Df -Di))
Bf B f B f
Di = Df FF0 Di = Df Di FF (-Li) Di = Df Di FF(Li)
Di > Df FF0 Di > Df FF (-Li) Di > Df FF(Li)
B Sf = BSi+(Bi-Bf ) BSf = BSi+(B i-B f) BSf = B Si+(Bi-Bf)-(Di-Df) -(Di-Df) -(Di-Df )
Di < Df FF0 Di < Df Df FF (-Li) Di < Df Df FF(Li)
BSf = B Si-(Bf -Bi) B Sf = BSi-(Bf-B i) BSf = BSi-(Bf -Bi)+(Df-Di) +(Df -Di) +(Df-Di)
Di = Df SS 0 Di = Df SS (Li)
Di > Df Df SS 0 Di > Df Df SS (Li)
B f B f
Di < Df Df SS 0 Di < Df Df SS (Li)
B f B f
Di = Df Di SF (-Li)
Di > Df SF (-Li)
BSf = B Si+(Bi-Bf)
Di < Df Df SF (-Li)
BSf = BSi-(Bf -Bi)
B i
B i
Df
Di
B i
Di
B i
Df
B i
B i
Di
Bi
Bi
Di
Df
Di
Df
Df
Di
Bi
Df
Di Di
Di
B f
BSi
BSf
BSf
Bf
BSi
BSf
BSf
Bf
BSi
BSf
BSf
B
B f B f
BSi
BSf
BSf
B f
B f
Feedback & Database
DatabaseActual
HistoricData
Model Validation
Model Calibration
Ap
pli
cati
on
to P
lan
nin
g a
nd
Con
trol
Performance Profiles
Project Data Input
A B C D E F G H I J K L M N O P Q R S T
Acti vity A XActi vity B X
Acti vity C X X X X
Acti vity D X X
Acti vity E X X
Acti vity F X X X X
Acti vity G X X
Acti vity H X X
Acti vity I X X
Acti vity J X X X
Acti vity K X X
Acti vity L X X
Acti vity M X X X X X
Acti vity N X X X
Acti vity O X X
Acti vity P X X
Acti vity Q X X
Acti vity R X
Acti vity S X
Acti vity T X
Data Transfer
from Other Tools
MS P3
Shortening Target
Durations
Feeding Reliability
Buffers
Changing Network
Logic
DPM Planner
SS
FF
SS
SS
Buffer
FS
FS
SS Breaking Down
Activities
Finding a Better Policy
DPM- Generated Plan
Time
Quality Safety
Performance Profiles
DPM Simulation Engine
Database
Data
Model ValidationModel Validation Simulation AnalysisSimulation Analysis
Model Calibration
Ap
pli
cati
on
to P
lan
nin
g a
nd
Con
trol
Performance Profiles
Project Data Input
Parameter Tables
A B C D E G H J M N O P Q R S
Acti vity A XActi vity B X
Acti vity C X X X X
Acti vity D X
Acti vity E X X
Acti vity F X X X
Acti vity G X X
Acti vity H X X
Acti vity I X X
Acti vity J X X
Acti vity K X
Acti vity L X X
Acti vity M X X X X
Acti vity N X X
Acti vity O X
Acti vity P X
Acti vity Q X X
Acti vity R
Acti vity S X
Acti vity T X
A B C D E G H J M N O P Q R S
Acti vity A XActi vity B X
Acti vity C X X X X
Acti vity D X
Acti vity E X X
Acti vity F X X X
Acti vity G X X
Acti vity H X X
Acti vity I X X
Acti vity J X X
Acti vity K X
Acti vity L X X
Acti vity M X X X X
Acti vity N X X
Acti vity O X
Acti vity P X
Acti vity Q X X
Acti vity R
Acti vity S X
Acti vity T X
Dependency Structure Matrix
Data Transfer
from Other Tools
Project
Influential Factors
Shortening Target
Durations
Feeding Reliability
Buffers
Changing Network
Logic
DPM Planner
SS
FF
SS
SS
Buffer
FS
FS
SS Breaking Down
Activities
Finding a Better Policy
DPM- Generated Plan
Cost Time
Quality Safety
Performance Profiles
AgentAgent
Insensitive
Sen
siti
vit
y F
un
ct’n
Time
Se
nsi
tivi
ty F
un
ct’n
Time
Sensitive
Sen
siti
vit
y F
un
ct’
n
Time
Highly Sensitive
Per
cen
t
Time
Slow Production
Perc
ent
Cha
nge
Time
Fast Production
Perc
ent
Cha
nge
Time
Slow Production
0 25 50 75 100
Percent Complete
0 25 50 75 100Percent Complete
Per
cent
Time
Fast Production
0 25 50 75 100
Percent Complete
Time Time TimeTime
Highly Unreliable
Re
lia
bili
ty F
un
ct’n Fairly Reliable
Rel
iab
ilit
y F
un
ct’
n Fairly Unreliable
Re
lia
bili
ty F
un
ct’n
Rel
iab
ilit
y F
un
ct’
nHighly Reliable
0 25 50 75 100
Percent Complete
A B C D E F G H
Work is Divisibleat Intervals
Time Time TimeTime
Highly Unreliable
Re
lia
bili
ty F
un
ct’n Fairly Reliable
Rel
iab
ilit
y F
unc
t’n Fairly Unreliable
Re
lia
bili
ty F
un
ct’n
Rel
iab
ilit
y F
un
ct’
nHighly Reliable
Time Time TimeTime
Highly Unreliable
Re
lia
bili
ty F
un
ct’n Fairly Reliable
Rel
iab
ilit
y F
un
ct’
n Fairly Unreliable
Re
lia
bili
ty F
un
ct’n
Rel
iab
ilit
y F
un
ct’
nHighly Reliable
Time Time TimeTime
Highly Unreliable
Re
lia
bili
ty F
un
ct’n Fairly Reliable
Rel
iab
ilit
y F
unc
t’n Fairly Unreliable
Re
lia
bili
ty F
un
ct’n
Rel
iab
ilit
y F
un
ct’
nHighly Reliable
Insensitive
Sen
siti
vit
y F
un
ct’n
Time
Se
nsi
tivi
ty F
un
ct’n
Time
Sensitive
Sen
siti
vit
y F
un
ct’
n
Time
Insensitive
Sen
siti
vit
y F
un
ct’n
Time
Se
nsi
tivi
ty F
un
ct’n
Time
Sensitive
Sen
siti
vit
y F
un
ct’
n
Time
Insensitive
Sen
siti
vit
y F
un
ct’n
Time
Se
nsi
tivi
ty F
un
ct’n
Time
Sensitive
Sen
siti
vit
y F
un
ct’
n
Time
Planning & Simulation
Change Orders
RFI
Deficiency Level
Project Costs
Construction ProgressConstruction Progress
Graph Lookup - Performance10
00 10
Graph Lookup - Performance10
00 10
Graph Lookup - Performance10
00 10
Graph Lookup - Performance10
00 10
Graph Lookup - Performance10
00 10
Graph Lookup - Performance10
00 10
Graph Lookup - Performance10
00 10
Influence CurvesGraph Loo kup - Performance
10
00 10
Graph Loo kup - Performance10
00 10
Influence CurvesGraph Loo kup Performance
10
10
Graph Loo kup Performance10
10
WorkAwaitin gQuality
M anagement WorkReleasedWorktoDo
WorkAwaitin gRFIReply
Reques tFor
Info rmationRate
UPChange
AccomodateRate
WorkReleas e
Rate
WorkPending duetoUPChange
PendingWork
ReleaseRate.
UPActionRequestRate.
Reproces s Requeston
WorkReleasedRate.
Reproces s Reques ton
WorknotReleas edRate.
Simulated Data
C onditio ns Precedence
Relations hips
Conditions Preced ence
R elationships
C onditio ns Preceden ce
Relations hips
Di = Df FS 0 Di = Df FS (-Li) Di = Df FS (Li)
Di > Df FS 0 Di > Df Df FS (-Li) Di > Df Df FS (Li)
B f B f Bf
Di < Df Df FS (-(Df-Di)) Di < Df Df FS (-(Li+Df-Di)) Di < Df Df FS (Li-(Df -Di))
Bf B f B f
Di = Df FF0 Di = Df Di FF (-Li) Di = Df Di FF(Li)
Di > Df FF0 Di > Df FF (-Li) Di > Df FF(Li)
B Sf = BSi+(Bi-Bf ) BSf = BSi+(B i-B f) BSf = B Si+(Bi-Bf)-(Di-Df) -(Di-Df) -(Di-Df )
Di < Df FF0 Di < Df Df FF (-Li) Di < Df Df FF(Li)
BSf = B Si-(Bf -Bi) B Sf = BSi-(Bf-B i) BSf = BSi-(Bf -Bi)+(Df-Di) +(Df -Di) +(Df-Di)
Di = Df SS 0 Di = Df SS (Li)
Di > Df Df SS 0 Di > Df Df SS (Li)
B f B f
Di < Df Df SS 0 Di < Df Df SS (Li)
B f B f
Di = Df Di SF (-Li)
Di > Df SF (-Li)
BSf = B Si+(Bi-Bf)
Di < Df Df SF (-Li)
BSf = BSi-(Bf -Bi)
B i
B i
Df
Di
B i
Di
B i
Df
B i
B i
Di
Bi
Bi
Di
Df
Di
Df
Df
Di
Bi
Df
Di Di
Di
B f
BSi
BSf
BSf
Bf
BSi
BSf
BSf
Bf
BSi
BSf
BSf
B
B f B f
BSi
BSf
BSf
B f
B f
CPM & PDM
Concurrent
Engineering, Critical
Chain & Overlapping
Framework
DSM & Strategic Planning
SD Project
Management Models
PERTGERT, Q-GERT & SLAM
DPM
A B C D E F G H J K L M N O P Q R S T
Activity A X
Activity B X
Activity C X X X
Activity D X X
Activity E X
Activity F X X
Activity G X X
Activity H X X
Activity I X X
Activity J X X
Activity K X
Activity L X
Activity M X
Activity N X X
Activity O X X
Activity P X X
Activity Q X X
Activity R X
Activity S X
Activity T
WorkAwaitingQuality
ManagementWorkReleased
WorktoDo
WorkAwaitingRFIReply
WorkRate
RequestFor
InformationRate
UPChange
AccomodateRate
InitialWork
IntroduceRate
WorkRelease
Rate
WorkPendingduetoUP
Change
PendingWork
ReleaseRate.
UPAction
RequestRate.
ReprocessRequeston
WorkReleasedRate.
ReprocessRequeston
WorknotReleasedRate.
Activity A
Activity B
Activity C
Taking off &
Pooling
Re-Sizing, Re-
Locating, & Re-
Characterizing
1
Upstream Progress0
1
00 1
0 1
1
00
Dow
nst
ream
Pro
gre
ss
WorkAwaitingQualityManagement WorkReleasedWorktoDo
WorkAwaitingRFIReply
WorkRate
RequestFor
InformationRate
UPChange
AccomodateRate
InitialWork
IntroduceRate
WorkRelease
Rate
WorkPendingduetoUP
Change
PendingWork
ReleaseRate.
UPAction
RequestRate.
ReprocessRequeston
WorkReleasedRate.
ReprocessRequeston
WorknotReleasedRate.
WorkAwaitingQualityManagement WorkReleasedWorktoDo
WorkAwaitingRFIReply
WorkRate
RequestFor
InformationRate
UPChange
AccomodateRate
InitialWork
IntroduceRate
WorkRelease
Rate
WorkPendingduetoUPChange
PendingWork
ReleaseRate.
UPActionRequestRate.
ReprocessRequeston
WorkReleasedRate.
ReprocessRequeston
WorknotReleasedRate.
Upstream
Downstream
X
Type RI
Probability 100%
Lead/Lag 5 days
Type FS
GeneralSegmentation
Lag/Lead 0
days
Sensitivity
H
i
g
h
Normal
2
0
%8
0
%
Specific
L
o
w
Smart CellProbability 100%
Type RI
Normal
Normal
GeneralSegmentation
Sensitivity
H
i
g
h
Normal
2
0
%
8
0
%
Specific
L
o
w
Smart CellProbability 100%
Type RI
Normal
Normal
Lag/Lead 0
days
Shortening Target
Durations
Feeding Reliability
Buffers
Changing Network
Logic
SS
FF
SS
SS
Buffer
FS
FSSS Breaking Down
Activities
Finding a Better
Policy
Shortening Target
Durations
Feeding Reliability
Buffers
Changing Network
Logic
SS
FF
SS
SS
Buffer
FS
FSSS Breaking Down
Activities
Finding a Better
Policy
Insensitive
Sen
siti
vity
Fun
ct’n
Time
Sen
siti
vity
Fu
nct’
n
Time
Sensitive
Sen
siti
vit
y F
unc
t’n
Time
Highly Sensitive
Perc
ent
Time
Slow Production
Per
cen
t C
han
ge
Time
Fast Production
Perc
ent
Change
Time
Slow Production
0 25 50 75 100Percent Complete
0 25 50 75 100
Percent Complete
Perc
ent
Time
Fast Production
0 25 50 75 100
Percent Complete
Time Time TimeTime
Highly Unreliable
Rel
iabi
lity
Fu
nct’
n
Fairly Reliable
Rel
iab
ilit
y F
unct
’n Fairly Unreliable
Rel
iabi
lity
Fu
nct’
n
Rel
iabi
lity
Fu
nct’
nHighly Reliable
0 25 50 75 100Percent Complete
A B C D E F G H
Work is Divisible at Intervals
Time Time TimeTime
Highly Unreliable
Rel
iabi
lity
Fun
ct’n Fairly Reliable
Rel
iabi
lity
Fu
nct’
n Fairly Unreliable
Rel
iab
ilit
y F
unct
’n
Rel
iabi
lity
Fun
ct’nHighly Reliable
Time Time TimeTime
Highly Unreliable
Rel
iabi
lity
Fu
nct’
n
Fairly Reliable
Rel
iab
ilit
y F
unct
’n Fairly Unreliable
Rel
iabi
lity
Fu
nct’
n
Rel
iabi
lity
Fu
nct’
nHighly Reliable
Time Time TimeTime
Highly Unreliable
Rel
iabi
lity
Fun
ct’n Fairly Reliable
Rel
iabi
lity
Fu
nct’
n Fairly Unreliable
Rel
iab
ilit
y F
unct
’n
Rel
iabi
lity
Fun
ct’nHighly Reliable
Insensitive
Sen
siti
vity
Fu
nct’
n
Time
Sen
siti
vit
y Fu
nct
’n
Time
Sensitive
Sen
siti
vit
y Fu
nct
’n
Time
Insensitive
Sen
siti
vity
Fun
ct’n
Time
Sen
siti
vity
Fu
nct’
n
Time
Sensitive
Sen
siti
vit
y F
unc
t’n
Time
Insensitive
Sen
siti
vity
Fu
nct’
n
Time
Sen
siti
vit
y Fu
nct
’n
Time
Sensitive
Sen
siti
vit
y Fu
nct
’n
Time
Condi ti ons Pr ecedenc e
Re lati onships
C ondit ions Prec edence
R el ations hips
C onditi ons Prec edence
R el ations hips
Di = Df FS 0 Di = Df FS ( -Li) Di = Df FS (Li )
Di > Df FS 0 Di > Df D f FS ( -Li) Di > Df D f FS (Li )
B f B f B f
Di < Df Df FS (-( Df -Di) ) Di < Df D f FS (-( Li+Df -Di )) Di < Df D f FS ( Li -( Df -Di) )
B f B f B f
Di = Df FF 0 Di = Df D i FF ( -Li) Di = Df D i FF (Li )
Di > Df FF 0 Di > Df FF ( -Li) Di > Df FF (Li )
BSf = BSi +(B i-B f ) B Sf = B Si+( Bi -B f ) B Sf = B Si+( Bi -B f )
- (Di- Df ) -( Di -Df ) -( Di -Df )
Di < Df FF 0 Di < Df D f FF ( -Li) Di < Df D f FF (Li )
B Sf = B Si- (B f -B i) B Sf = B Si-( Bf -B i) B Sf = B Si-( Bf -B i)
+( Df -Di) +(Df - Di) +(Df - Di)
Di = Df SS 0 Di = Df SS (Li )
Di > Df Df SS 0 Di > Df D f SS (Li )
Bf B f
Di < Df D f SS 0 Di < Df D f SS (Li )
Bf B f
Di = Df D i SF ( -Li)
Di > Df SF ( -Li)
B Sf = B Si+( Bi -B f )
Di < Df D f SF ( -Li)
B Sf = B Si-( Bf -B i)
B i
B i
D f
Di
B i
D i
B i
D f
Bi
B i
D i
B i
B i
D i
Df
Di
D f
D f
D i
B i
D f
D i D i
Di
B f
BSi
BSf
BSf
Bf
BSi
BS f
BSf
Bf
BSi
BSf
BSf
B
B f B f
BSi
BSf
BSf
Bf
B f
Reliability UR
Segmentation
Lag/Lead 0
days
Sensitivity
H
i
g
h
Normal
2
0
%
Specific
L
o
w
Probability 100%
Normal
Smart Cell
Type RI
Production F
Sensitivity S
Pessimistic 45
Most Likely 30
Optimistic 25
Segmentation
CPM & PDM
Concurrent
Engineering, Critical
Chain & Overlapping
Framework
DSM & Strategic Planning
SD Project
Management Models
PERTGERT, Q-GERT & SLAM
DPM
A B C D E F G H J K L M N O P Q R S T
Activity A X
Activity B X
Activity C X X X
Activity D X X
Activity E X
Activity F X X
Activity G X X
Activity H X X
Activity I X X
Activity J X X
Activity K X
Activity L X
Activity M X
Activity N X X
Activity O X X
Activity P X X
Activity Q X X
Activity R X
Activity S X
Activity T
WorkAwaitingQuality
ManagementWorkReleased
WorktoDo
WorkAwaitingRFIReply
WorkRate
RequestFor
InformationRate
UPChange
AccomodateRate
InitialWork
IntroduceRate
WorkRelease
Rate
WorkPendingduetoUP
Change
PendingWork
ReleaseRate.
UPAction
RequestRate.
ReprocessRequeston
WorkReleasedRate.
ReprocessRequeston
WorknotReleasedRate.
Activity A
Activity B
Activity C
Taking off &
Pooling
Re-Sizing, Re-
Locating, & Re-
Characterizing
Activity A
Activity B
Activity C
Taking off &
Pooling
Re-Sizing, Re-
Locating, & Re-
Characterizing
1
Upstream Progress0
1
00 1
0 1
1
00
Dow
nst
ream
Pro
gre
ss
WorkAwaitingQualityManagement WorkReleasedWorktoDo
WorkAwaitingRFIReply
WorkRate
RequestFor
InformationRate
UPChange
AccomodateRate
InitialWork
IntroduceRate
WorkRelease
Rate
WorkPendingduetoUP
Change
PendingWork
ReleaseRate.
UPAction
RequestRate.
ReprocessRequeston
WorkReleasedRate.
ReprocessRequeston
WorknotReleasedRate.
WorkAwaitingQualityManagement WorkReleasedWorktoDo
WorkAwaitingRFIReply
WorkRate
RequestFor
InformationRate
UPChange
AccomodateRate
InitialWork
IntroduceRate
WorkRelease
Rate
WorkPendingduetoUPChange
PendingWork
ReleaseRate.
UPActionRequestRate.
ReprocessRequeston
WorkReleasedRate.
ReprocessRequeston
WorknotReleasedRate.
Upstream
Downstream
X
Type RI
Probability 100%
Lead/Lag 5 days
Type FS
GeneralSegmentation
Lag/Lead 0
days
Sensitivity
H
i
g
h
Normal
2
0
%8
0
%
Specific
L
o
w
Smart CellProbability 100%
Type RI
Normal
Normal
GeneralSegmentation
Sensitivity
H
i
g
h
Normal
2
0
%
8
0
%
Specific
L
o
w
Smart CellProbability 100%
Type RI
Normal
Normal
Lag/Lead 0
days
Shortening Target
Durations
Feeding Reliability
Buffers
Changing Network
Logic
SS
FF
SS
SS
Buffer
FS
FSSS Breaking Down
Activities
Finding a Better
Policy
Shortening Target
Durations
Feeding Reliability
Buffers
Changing Network
Logic
SS
FF
SS
SS
Buffer
FS
FSSS Breaking Down
Activities
Finding a Better
Policy
Shortening Target
Durations
Feeding Reliability
Buffers
Changing Network
Logic
SS
FF
SS
SS
Buffer
FS
FSSS Breaking Down
Activities
Finding a Better
Policy
Shortening Target
Durations
Feeding Reliability
Buffers
Changing Network
Logic
SS
FF
SS
SS
Buffer
FS
FSSS Breaking Down
Activities
Finding a Better
Policy
Insensitive
Sen
siti
vity
Fun
ct’n
Time
Sen
siti
vity
Fu
nct’
n
Time
Sensitive
Sen
siti
vit
y F
unc
t’n
Time
Highly Sensitive
Perc
ent
Time
Slow Production
Per
cen
t C
han
ge
Time
Fast Production
Perc
ent
Change
Time
Slow Production
0 25 50 75 100Percent Complete
0 25 50 75 100
Percent Complete
Perc
ent
Time
Fast Production
0 25 50 75 100
Percent Complete
Time Time TimeTime
Highly Unreliable
Rel
iabi
lity
Fu
nct’
n
Fairly Reliable
Rel
iab
ilit
y F
unct
’n Fairly Unreliable
Rel
iabi
lity
Fu
nct’
n
Rel
iabi
lity
Fu
nct’
nHighly Reliable
0 25 50 75 100Percent Complete
A B C D E F G H
Work is Divisible at Intervals
Time Time TimeTime
Highly Unreliable
Rel
iabi
lity
Fun
ct’n Fairly Reliable
Rel
iabi
lity
Fu
nct’
n Fairly Unreliable
Rel
iab
ilit
y F
unct
’n
Rel
iabi
lity
Fun
ct’nHighly Reliable
Time Time TimeTime
Highly Unreliable
Rel
iabi
lity
Fu
nct’
n
Fairly Reliable
Rel
iab
ilit
y F
unct
’n Fairly Unreliable
Rel
iabi
lity
Fu
nct’
n
Rel
iabi
lity
Fu
nct’
nHighly Reliable
Time Time TimeTime
Highly Unreliable
Rel
iabi
lity
Fun
ct’n Fairly Reliable
Rel
iabi
lity
Fu
nct’
n Fairly Unreliable
Rel
iab
ilit
y F
unct
’n
Rel
iabi
lity
Fun
ct’nHighly Reliable
Insensitive
Sen
siti
vity
Fu
nct’
n
Time
Sen
siti
vit
y Fu
nct
’n
Time
Sensitive
Sen
siti
vit
y Fu
nct
’n
Time
Insensitive
Sen
siti
vity
Fun
ct’n
Time
Sen
siti
vity
Fu
nct’
n
Time
Sensitive
Sen
siti
vit
y F
unc
t’n
Time
Insensitive
Sen
siti
vity
Fu
nct’
n
Time
Sen
siti
vit
y Fu
nct
’n
Time
Sensitive
Sen
siti
vit
y Fu
nct
’n
Time
Condi ti ons Pr ecedenc e
Re lati onships
C ondit ions Prec edence
R el ations hips
C onditi ons Prec edence
R el ations hips
Di = Df FS 0 Di = Df FS ( -Li) Di = Df FS (Li )
Di > Df FS 0 Di > Df D f FS ( -Li) Di > Df D f FS (Li )
B f B f B f
Di < Df Df FS (-( Df -Di) ) Di < Df D f FS (-( Li+Df -Di )) Di < Df D f FS ( Li -( Df -Di) )
B f B f B f
Di = Df FF 0 Di = Df D i FF ( -Li) Di = Df D i FF (Li )
Di > Df FF 0 Di > Df FF ( -Li) Di > Df FF (Li )
BSf = BSi +(B i-B f ) B Sf = B Si+( Bi -B f ) B Sf = B Si+( Bi -B f )
- (Di- Df ) -( Di -Df ) -( Di -Df )
Di < Df FF 0 Di < Df D f FF ( -Li) Di < Df D f FF (Li )
B Sf = B Si- (B f -B i) B Sf = B Si-( Bf -B i) B Sf = B Si-( Bf -B i)
+( Df -Di) +(Df - Di) +(Df - Di)
Di = Df SS 0 Di = Df SS (Li )
Di > Df Df SS 0 Di > Df D f SS (Li )
Bf B f
Di < Df D f SS 0 Di < Df D f SS (Li )
Bf B f
Di = Df D i SF ( -Li)
Di > Df SF ( -Li)
B Sf = B Si+( Bi -B f )
Di < Df D f SF ( -Li)
B Sf = B Si-( Bf -B i)
B i
B i
D f
Di
B i
D i
B i
D f
Bi
B i
D i
B i
B i
D i
Df
Di
D f
D f
D i
B i
D f
D i D i
Di
B f
BSi
BSf
BSf
Bf
BSi
BS f
BSf
Bf
BSi
BSf
BSf
B
B f B f
BSi
BSf
BSf
Bf
B f
Reliability UR
Segmentation
Lag/Lead 0
days
Sensitivity
H
i
g
h
Normal
2
0
%
Specific
L
o
w
Probability 100%
Normal
Smart Cell
Type RI
Production F
Sensitivity S
Pessimistic 45
Most Likely 30
Optimistic 25
Segmentation

International Journal of IT in Architecture, Engineering and ConstructionVolume 1 / Issue 4 / December 2003. ©Millpress284
| Monseo Park and Feniosky Pena-Mora
activities. Relationships represented by smart cells
include rework iteration relationships (RI) as well as
precedence relationships (FS, FF, SF, SS).
CPM & PDM
DPM implements the scheduling concept of CPM and
PDM by controlling the successor work dependency
on the predecessor work progress. Work dependencies
represented in DPM constrain the construction process
more realistically than the precedence relationships in
CPM and PDM, as exampled in Figure 10. Graph A
represents that successor work can be started only after
50% completion of the predecessor work and no more
work dependency exists thereafter, which is similar
to FS relationship in CPM and PDM. Meanwhile,
Graph B describes the work dependency such that
successor work can be progressed in proportion to the
predecessor work progress even after 50% completion
of predecessor work. Depending on the nature of
construction work, this kind of work dependency
can be more realistic. For example, consider the steel
Figure 9-a. Smart Cell for Activity
Figure 9-b. Smart Cell for Relationship
A B C D E S TActivity A XActivity B XActivity C X XActivity D X XActivity E XActivity F XActivity G XActivity H XActivity IActivity J XActivity KActivity LActivity M XActivity N XActivity O XActivity PActivity Q X XActivity R XActivity S XActivity T X
Activity Duration (Most-likely, Optimistic,Pessimistic)
Activity Production Type (Fast, Normal,Slow)
Activity Reliability Type (Reliable, Normal,Unreliable)
A B C D E S TActivity A XActivity B XActivity C X XActivity D X XActivity E XActivity F XActivity G XActivity H XActivity IActivity J XActivity KActivity LActivity M XActivity N XActivity O XActivity PActivity Q X XActivity R XActivity S XActivity T X
low
lrmrr aNonuc onrorr duP
FastF
bleeliabUnr
alNo rmrrNybilityR
eliablRel
wk12ticim isPessi
wk0ticimistOptiionuratD
wk11elyt LikMostMionuratD
yivityAct
GG H I JJJJ K L M N O P QQ RR
X XIIDD
XXXXXX X1100 XX
XX XXX
XXX XXaasstt
Xccttiioo XX XX XXXX XX
XXX XXXXXX XX
Activ ity ID
Duration
Production
Optimistic
Most Likely
Reliability
Reliable
Unreliable
Fast
No rmal
Slow
11 wk
10 wk
No rmal
Pessim istic 12 wk
i tio ost-likely, ,
Activity Production Type , No al,Slow)
Reli b ty e elia le, Normal,r l )
A B C D E F G H S TActivity A XActivity B XActivity C X X XActivity D X XActivity E XActivity F X XActivity G X XActivity H XActivity IActivity J X XActivity KActivity LActivity M XActivity N XActivity O XActivity PActivity Q X XActivity R XActivity S XActivity T X
Probability of realizing this dependencyrelationship
Precedence Relationships (FF,FS,SS,SF) orReprocess I terations (RI )
To be used to break down activities intosmaller segments. I n this case, 20% ofdownstream work can start independent ofits upstream, because that portion of work isclassified as general, administrative work,which is not dependent on upstream work.
Unique to the set of UP and DN. ie.Sensitivity of 'C' to 'A' can be different fromsensitivity of 'C' to 'B'
* I mpact of Reprocess I terations: function ofDependency Probability, UpstreamSensitivity, and Downstream Reliability
Lag or Lead Time associated with thisdependency relationship
A B C D E F G H S TActivity A XActivity B XActivity C X X XActivity D X XActivity E XActivity F X XActivity G X XActivity H XActivity IActivity J X XActivity KActivity LActivity M XActivity N XActivity O XActivity PActivity Q X XActivity R XActivity S XActivity T X
Probability of realizing this dependencyrelationship
Precedence Relationships (FF,FS,SS,SF) orReprocess I terations (RI )
To be used to break down activities intosmaller segments. I n this case, 20% ofdownstream work can start independent ofits upstream, because that portion of work isclassified as general, administrative work,which is not dependent on upstream work.
Unique to the set of UP and DN. ie.Sensitivity to A can be different fromsensitivity of to
* I mpact of Reprocess I terations: function ofDependency Probability, UpstreamSensitivity, and Downstream Reliability
Lag or Lead Time associated with thisdependency relationship
Rework Iteration (RI)
succeeding workits predecessor, since
predecessor work.
PR and SU.
ReworkPredecessor
Successor Reliability
A B C D E F G H S TActivity A XActivity B XActivity C X X XActivity D X XActivity E XActivity F X XActivity G X XActivity H XActivity IActivity J X XActivity KActivity LActivity M XActivity N XActivity O XActivity PActivity Q X XActivity R XActivity S XActivity T X
Probability of realizing this dependencyrelationship
Precedence Relationships (FF,FS,SS,SF) orReprocess I terations (RI )
To be used to break down activities intosmaller segments. I n this case, 20% ofdownstream work can start independent ofits upstream, because that portion of work isclassified as general, administrative work,which is not dependent on upstream work.
Unique to the set of UP and DN. ie.Sensitivity to A can be different fromsensitivity of to
* I mpact of Reprocess I terations: function ofDependency Probability, UpstreamSensitivity, and Downstream Reliability
Lag or Lead Time associated with thisdependency relationship
A B C D E F G H S TActivity A XActivity B XActivity C X X XActivity D X XActivity E XActivity F X XActivity G X XActivity H XActivity IActivity J X XActivity KActivity LActivity M XActivity N XActivity O XActivity PActivity Q X XActivity R XActivity S XActivity T X
Probability of realizing this dependencyrelationship
Precedence Relationships (FF,FS,SS,SF) orReprocess I terations (RI )
To be used to break down activities intosmaller segments. I n this case, 20% ofdownstream work can start independent ofits upstream, because that portion of work isclassified as general, administrative work,which is not dependent on upstream work.
Unique to the set of UP and DN. ie.Sensitivity to A can be different fromsensitivity of to
* I mpact of Reprocess I terations: function ofDependency Probability, UpstreamSensitivity, and Downstream Reliability
Low
malNormN
HighHitySen
0%80fiff cpec iSp
0%
0%
20
80
al
fiff
ener
i
Ge
SnationmentaSeg m 0%20
y
l
Day0
G
dLeadLag/ yRI
DayR0
peTyp
/
%100%1y %100%1ybil itrobaPr
EC-EC-
JJ K L M N O P QQ RR
XCCXXX
Xiill iitt
XXXXXX XXXXXX
XX X
XXXX XX
X XXXXX XXXXLLoowwXXX XXXXXXX XXXX
X XXXX XX
C-E
Gener alSeg mentation
Probabil ity
Type
Lag/Lead
RI
SensitivityHigh
Normal
100%
20%
80%Spec ific
Low
0 Day
Lag or Lead Time associated with thisdependency relationship
Rework Iteration (RI)
succeeding workits predecessor, since
predecessor work.
PR and SU.
ReworkPredecessor
Successor Reliability

International Journal of IT in Architecture, Engineering and ConstructionVolume 1 / Issue 4 / December 2003. ©Millpress 285
Development of Dynamic Planning and Control Methodology (DPM) |
member erection activity and the concrete pouring
activity for an offi ce building construction project.
Normally, concrete pouring can be started after
steel member erection on one or two fl oors is done.
However, the progress of concrete pouring is still
dependent on that of steel member erection, even after
the start of the concrete pouring activity.
PERT
PERT is taken into consideration in DPM by classifying
activity durations into ‘most-likelyʼ, ‘pessimisticʼ, and
‘optimisticʼ. Once different types of durations are
provided through a smart cell, DPM generates the
spread of simulated actual project durations having
confi dence bounds based on a Monte Carlo simulation
(see Figure 11).
GERT, Q-GERT and SLAM
For the implementation of the concepts from GERT,
Q-GERT and SLAM, rework iterations caused by
successor work defects are considered in DPM. Once
the relationship type representing those iterations (RI)
is indicated through smart cells, DPM creates rework
iterations between predecessor work and successor
Figure 10. Examples of Work Dependency
Figure 11. Examples of PERT Simulation
Upstream Progress
1
0
0 1
1
0
0
Do
wn
strea
mP
ro
gress
1Upstream Progress
Do
wn
strea
mP
ro
gres s
Work Dependency ‘A’ Work Dependency ‘B’
Upstream Progress
1
0
0 1
1
0
0
Do
wn
strea
mP
ro
gress
1Upstream Progress
Do
wn
strea
mP
ro
gres s
Work Dependency ‘A’ Work Dependency ‘B’

International Journal of IT in Architecture, Engineering and ConstructionVolume 1 / Issue 4 / December 2003. ©Millpress286
| Monseo Park and Feniosky Pena-Mora
work. The probability that governs the iteration
processes can be also defi ned by users. For example,
suppose that the activity C and the activity E in Figure
9-b represent engineering work and piling work
respectively. Engineering work has a RI relationship
with piling work, and the probability of realizing
the relationship is 100%, which means that a certain
amount of changes made during piling work would
trigger the same amount of subsequent correction
work in engineering work. Assuming that during the
pile work steel piles continued sinking under the soil,
as they could not reach a rock layer to support the
piles, the engineering work for the problem area needs
to be done again to fi nd alternative ways.
Concurrent Engineering, Overlapping Frameworkand Critical Chain
The concepts and principles of concurrent engineering
[Eppinger et al., 1992], Peña-Mora & Liʼs overlapping
framework (2001) and Critical Chain [Goldratt,
1997] are incorporated into DPM. One of the major
challenges facing concurrent engineering lies in an
overlapping practice, for which Peña-Mora and Li
(2001) developed an overlapping framework. In
their framework, task production rate, predecessor
production reliability, and successor task sensitivity
are used to determine effective overlapping strategies
in construction. In the same context, Goldratt (1997)
introduced Critical Chain, in which it is emphasized
to pull contingency buffers from individual tasks and
aggregate them for a whole project and to resolve
resource contentions. All of these methods are
systematically integrated into DPM through reliability
buffering, which was discussed earlier in this paper.
System Dynamics Project Management Models
The implications of the previous system dynamics
models in project management [Richardson and Pugh,
1981; Abel-Humid, 1984, Reichelt, 1990; Cooper,
1994, Ford and Sterman, 1997; Lyneis et al., 2001] are
imbedded in DPM. However, DPM distinguishes itself
from the previous project models, since those previous
models deal with project development under closed
environment (e.g., product development or software
development processes). As a result, they focus only
on rework cycle that has a signifi cant impact on the
performance of a project having the same repeated
processes under closed environment. In contrast,
DPM focuses on change iteration cycles, which more
frequently occur in construction than rework cycles, as
well and attempts to capture construction dynamics.
Collaboration Schemes
Many different types of commercialized software are
currently being used in the planning and control of
modern construction projects. Even project functions
working for the same project often use different types
of tools. Furthermore, they tend to be geographically
distributed and in different work conditions [Peña-
Mora and Dwivedi, 2000]. For these reasons, DPM is
designed to share project data with other existing tools
and to support various kinds of computing devices,
which is detailed below.
Project Data Sharing
As diagramed in the system architecture on Figure 7,
data input can be made through DPM input windows
or by transferring data from Primavera P3 or Microsoft
Project into DPM. Once input data are simulated, the
results are saved in the DPM database, which can
be used for the calibration of the system dynamics
models. DPM also provides a generic interface with
various planning tools. As a result, it is possible for
project management personnel to execute DPM own
functions by simulating the system dynamics models
and to do network scheduling work by calling P3
scheduling engine on the DPM platform.
Web-Based Collaboration
Due to the nature of construction, construction crews
do not always get access to a desktop computer in

International Journal of IT in Architecture, Engineering and ConstructionVolume 1 / Issue 4 / December 2003. ©Millpress 287
Development of Dynamic Planning and Control Methodology (DPM) |
their site offi ce, allowing only the use of wireless or
portable devices. Therefore, effective monitoring and
controlling require a system that can overcome the
dependency of information on a desktop computer
[Peña-Mora and Dwivedi, 2000]. To address this issue,
the DPM system architecture supports various kinds
of devices such as mobile phones, laptop computers,
and palm pilots.
To materialize these collaboration schemes into
DPM, three main tools, Java programming language,
Vensim (system dynamics modeling software, Ventana
Systems Inc.), RMI (Remote Method Invocation),
and JDBC (Java Data Base Connectivity) have been
used. As conceptualized in Figure 12, Java language
makes DPM platform-independent. Vensim provides
a simulation engine and analytical tools. To increase
distributed computing capabilities, RMI allows Java
objects running on the same or separate computers
to communicate with one another via remote method
calls. When a user starts working with DPM he/she
enters the input parameters in an applet. Then, the
applet requests simulations to the main server through
RMI. Once simulations are done, DPM simulation
results are saved in DPM database through JDBC.
Combining these three main tools, DPM is able to be
used collaboratively in heterogeneous environment.
4 Applications of DPM
The performance of DPM as a planning and control
tool, and its applicability has been being examined
with the construction of 27 bridges, which is a part of
a $400 million Design/Build/Operate/Transfer project
awarded to Modern Continental Companies, Inc. for
roadway improvements along State Route 3 in MA.
The project scope includes widening the 21-mile
of the state roadway and the existing 15 underpass
bridges, and renovating 12 overpass bridges. This
paper presents the result of a case study with the Treble
Cove Road Bridge construction, one of the overpass
Figure 12. Collaboration Scheme
Applet
Client
User Machine
Main ServerData Server
JDBC
RMI
DPM
Implementation
Internet /
Intranet
Applet
Client
User Machine
Main ServerData Server
JDBC
RMI
DPM
Implementation
Internet /
Intranet

International Journal of IT in Architecture, Engineering and ConstructionVolume 1 / Issue 4 / December 2003. ©Millpress288
| Monseo Park and Feniosky Pena-Mora
bridge renovations of the project, highlighting the
applicability of DPM in the real world settings.
For the case study, we aggregated the original project
activities to 28 design and construction activities in
accordance with the DPM fundamentals. To get the
necessary data, a series of interviews with schedulers
and engineers involved in the project were made,
through which the construction characteristics of
the project activities were obtained. In the following
subsections, fi rst, we present the base case, in which
the case project is simulated with 100% fl exible
headcount policy (level of manpower can be adjusted
as much as required during construction) and no
buffering policy (no contingency time is allowed for
activities). Then, we discuss the results of simulations
done adapting the base case with various scenarios to
measure the effect of alternative construction policies.
Finally, the most desirable set of construction policies
for the case project are suggested based on the analysis
of the DPM system behaviors.
4.1 Base Case Simulations
The simulated actual duration of the base case is 560
working days. This is 172 days longer than the CPM-
based duration of the base case, which is 388 working
days (see Figure 13-a and 13-b). The simulation result
indicates that the difference in the completion time
is mainly due to a time delay caused by non-value
adding iterations among design and construction
activities, which are not captured in the CPM-based
tools. Actually, the design development of the Treble
Cove Road Bridge construction has already shown
signifi cant delay as of Feb 1, 2001 and construction
has not been yet started. This project was awarded
to the contractor before the detailed scope of the
project had been established. As a result, changes
on the design work were frequently requested by the
owner side during sketch plan, fi nal plan, and shop
drawing submittal, which resulted in numerous design
iterations. The base case simulates this challenge and
shows how much non-value adding iterations caused
by changes can affect the project progress.
4.2 DPM System Behaviors and Policy
Recommendations
To examine the effect of labor control policies,
reliability buffering, and time components such as
Figure 13-a. DPM-Generated Activity Performance (I)
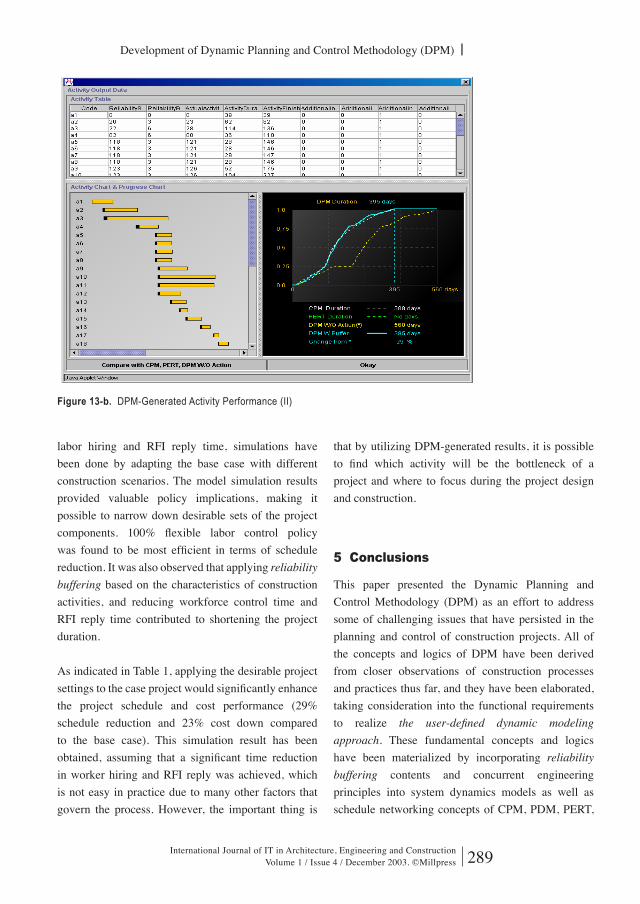
International Journal of IT in Architecture, Engineering and ConstructionVolume 1 / Issue 4 / December 2003. ©Millpress 289
Development of Dynamic Planning and Control Methodology (DPM) |
labor hiring and RFI reply time, simulations have
been done by adapting the base case with different
construction scenarios. The model simulation results
provided valuable policy implications, making it
possible to narrow down desirable sets of the project
components. 100% fl exible labor control policy
was found to be most effi cient in terms of schedule
reduction. It was also observed that applying reliability
buffering based on the characteristics of construction
activities, and reducing workforce control time and
RFI reply time contributed to shortening the project
duration.
As indicated in Table 1, applying the desirable project
settings to the case project would signifi cantly enhance
the project schedule and cost performance (29%
schedule reduction and 23% cost down compared
to the base case). This simulation result has been
obtained, assuming that a signifi cant time reduction
in worker hiring and RFI reply was achieved, which
is not easy in practice due to many other factors that
govern the process. However, the important thing is
that by utilizing DPM-generated results, it is possible
to fi nd which activity will be the bottleneck of a
project and where to focus during the project design
and construction.
5 Conclusions
This paper presented the Dynamic Planning and
Control Methodology (DPM) as an effort to address
some of challenging issues that have persisted in the
planning and control of construction projects. All of
the concepts and logics of DPM have been derived
from closer observations of construction processes
and practices thus far, and they have been elaborated,
taking consideration into the functional requirements
to realize the user-defi ned dynamic modeling
approach. These fundamental concepts and logics
have been materialized by incorporating reliability
buffering contents and concurrent engineering
principles into system dynamics models as well as
schedule networking concepts of CPM, PDM, PERT,
Figure 13-b. DPM-Generated Activity Performance (II)
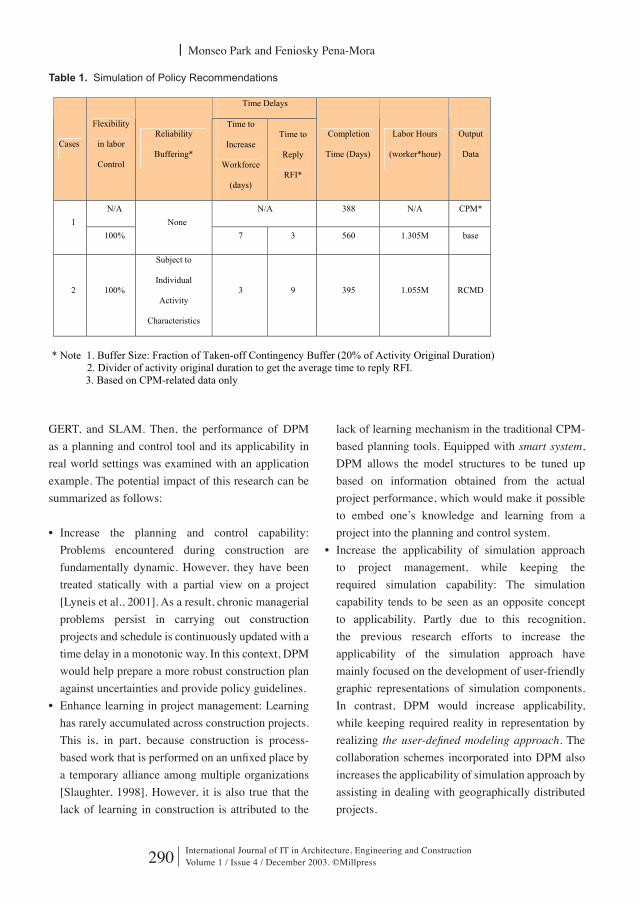
International Journal of IT in Architecture, Engineering and ConstructionVolume 1 / Issue 4 / December 2003. ©Millpress290
| Monseo Park and Feniosky Pena-Mora
GERT, and SLAM. Then, the performance of DPM
as a planning and control tool and its applicability in
real world settings was examined with an application
example. The potential impact of this research can be
summarized as follows:
• Increase the planning and control capability:
Problems encountered during construction are
fundamentally dynamic. However, they have been
treated statically with a partial view on a project
[Lyneis et al., 2001]. As a result, chronic managerial
problems persist in carrying out construction
projects and schedule is continuously updated with a
time delay in a monotonic way. In this context, DPM
would help prepare a more robust construction plan
against uncertainties and provide policy guidelines.
• Enhance learning in project management: Learning
has rarely accumulated across construction projects.
This is, in part, because construction is process-
based work that is performed on an unfi xed place by
a temporary alliance among multiple organizations
[Slaughter, 1998]. However, it is also true that the
lack of learning in construction is attributed to the
lack of learning mechanism in the traditional CPM-
based planning tools. Equipped with smart system,
DPM allows the model structures to be tuned up
based on information obtained from the actual
project performance, which would make it possible
to embed oneʼs knowledge and learning from a
project into the planning and control system.
• Increase the applicability of simulation approach
to project management, while keeping the
required simulation capability: The simulation
capability tends to be seen as an opposite concept
to applicability. Partly due to this recognition,
the previous research efforts to increase the
applicability of the simulation approach have
mainly focused on the development of user-friendly
graphic representations of simulation components.
In contrast, DPM would increase applicability,
while keeping required reality in representation by
realizing the user-defi ned modeling approach. The
collaboration schemes incorporated into DPM also
increases the applicability of simulation approach by
assisting in dealing with geographically distributed
projects.
Table 1. Simulation of Policy Recommendations
Time Delays
Cases
Flexibility
in labor
Control
Reliability
Buffering*
Time to
Increase
Workforce
(days)
Time to
Reply
RFI*
Completion
Time (Days)
Labor Hours
(worker*hour)
Output
Data
N/A N/A 388 N/A CPM*
1
100%
None
7 3 560 1.305M base
2 100%
Subject to
Individual
Activity
Characteristics
3 9 395 1.055M RCMD
* Note 1. Buffer Size: Fraction of Taken-off Contingency Buffer (20% of Activity Original Duration) 2. Divider of activity original duration to get the average time to reply RFI.
3. Based on CPM-related data only

International Journal of IT in Architecture, Engineering and ConstructionVolume 1 / Issue 4 / December 2003. ©Millpress 291
Development of Dynamic Planning and Control Methodology (DPM) |
[1] Abdel-Hamid, T. (1984), “The Dynamics of Software Development Project Management,” Doctoral Thesis, Sloan School of Management, MIT, Cambridge, MA.
[2] Ahuja, H. and Nandakumar, V. (1985), “Simulation Model to Forecast Project Completion Time,” Journal of Construction Engineering and Management, ASCE, Reston, VA, Vol. 111(4), pp. 325–342.
[3] Bernold, L. (1989), “Simulation of Non-Steady Construction Processes,” Journal of Construction Engineering and Management, ASCE, Reston, VA, Vol. 115(2), pp.163–178.
[4] Carr, R. (1979), “Simulation of Construction Project Duration,” Journal of Construction Division, ASCE, Reston, VA, Vol. 105(2), pp.117–128.
[5] Cooper, K. (1994), “The $2000 hour: How Manager Infl uence Project Performance through the Iteration Cycle,” Project Management Journal, the Project Management Institute, Newtown Square, PA, Vol. 15(1), pp.11–24.
[6] Cooper, G. and Kleinschmidt, E. (1994), “Determinants of Timeless in Product Development,” The Journal of Product Innovation Management. Elsevier Science, New York, NY, Vol. 11(5), pp. 381–391.
[7] Deitel, H. and Deitel, P. (1999), “Remote Method Invocation (RMI),” JAVA, How to program –Third Edition, Prentice Hall, Upper Saddle River, NJ, pp.983–990.
[8] Eppinger, S. and Krishnan, V. (1992), “Overlapping Product Development Activities by Analysis of Information Transfer Practice,” Sloan School of Management, MIT, Cambridge, MA, Working Paper 3478–92.
[9] Ford, D. and Sterman, J. (1997), “Dynamic Modeling of Product Development Processes”, Sloan School of Management, MIT, Cambridge, MA, Working Paper 3943–97
[10] Goldratt, E. (1997), “Critical Chain,” North River Press, Great Barrington, MA.[11] Halpin, D. (1977), “CYCLONE: Method for Modeling of Job Site Processes,” Journal
of Construction Division, ASCE, Reston, VA, Vol. 103(3), pp.489–499.[12] Homer, J., Sterman, J., Greenwood, B., and Perkola, M. (1993), “Delivery Time
Reduction in Pulp and Paper Mill Construction Projects,” Proceedings of the 1993 International System Dynamics Conference, Cancun, Mexico, pp.212–221.
[13] Kwak, S. (1995), “Policy Analysis of Hanford Tank Farm Operations with System Dynamics Approach,” Doctoral Thesis, Department of Nuclear Engineering, MIT, Cambridge, MA, pp. 34–36.
[14] Levitt, R. and Kunz, J. (1985), “Using Knowledge of Construction and Project Management for Automated Schedule Updating,” Project Management Journal, the Project Management Institute, Newtown Square, PA, Vol. 16(5), pp. 57–76.
[15] Lyneis, J., Cooper, K., and Els, S. (2001), “Strategic management of complex projects: a case study using system dynamics,” System Dynamics Review, Wiley, Hoboken, NJ, Vol. 17 (3), pp. 237–259.
[16] Martinez, J. and Ioannou, P. (1997), “State-based Probabilistic Scheduling Using STROBOSCOPE s̓ CPM Add-On,” Proceedings of Construction Congress V, ASCE, Reston, VA, pp.438–445.
[17] Martinez, J. (1996), “STROBOSCOPE: State and Resource Based Simulation of Construction Processes,” Ph.D. Thesis, Department of Civil & Environment, University of Michigan, Ann Arbor, MI.
[18] Ng, W., Khor, E., and Lee, J. (1998), “Simulation Modeling and Management of Large Basement Construction project,” Journal of Computing in Civil Engineering, ASCE, Reston, VA, Vol. 12(2), pp. 101–110.
[19] Padilla, E. and Carr, R. (1991) “Resource Strategies for Dynamic Project Management,” Journal of Construction Engineering and Management, ASCE, Reston, VA, Vol. 117(2), pp.279–293.
[20] Park, M. (2001), “Dynamic Planning and Control Methodology for Large-Scale Concurrent Construction Projects,” Doctoral Thesis, Department of Civil and Environmental Engineering, MIT, Cambridge, MA.
[21] Paulson, B. (1983), “Interactive Graphics for Simulating Construction Operations,” Journal of Construction Division, ASCE, Reston, VA, Vol. 104(1), pp.69–76.
REFERENCES |
International Journal of IT in Architecture, Engineering and ConstructionVolume 1 / Issue 4 / December 2003. ©Millpress292
| Monseo Park and Feniosky Pena-Mora
[22] Paulson, B., Chan, W. and Koo, C. (1987), “Construction operations simulation by microcomputer,” Journal of Construction Engineering and Management, ASCE, Reston, VA, Vol. 113(2), pp.302–314.
[23] Peña-Mora, F. and Li, M. (2001), “A Robust Planning and Control Methodology for Design-Build Fast-Track Civil Engineering and Architectural Projects,” Journal of Construction Engineering and Management, ASCE, Reston, VA, Vol. 127(1), pp.1–17.
[24] Peña-Mora, F. and Park, M. (2001), “Dynamic Planning for Fast-Tracking Building Construction Projects,” Journal of Construction Engineering and Management, ASCE, Reston, VA, Vol. 127(6), pp.445–456.
[25] Peña-Mora, F. and Gyanesh, D. (2000), “A Multiple Device Collaborative and Real Time Analysis Systems for Project Management in Civil Engineering,” Journal of Computing in Civil Engineering, ASCE, Reston, VA, Vol. 16(1), pp. 23–38.
[26] Reichelt, K. (1990), “Halter Marine: A Case Study in the Dangers of Litigation,” Technical Report D–4179, Sloan School of Management, MIT, Cambridge, MA.
[27] Richardson, G. (1985), “Introduction to the System Dynamics Review,” System Dynamics Review, Wiley, Hoboken, NJ, Vol. 1(1), pp.1–3.
[28] Richardson, G. and Pugh III, A. (1981), “Introduction to System Dynamics Modeling with Dynamo,” MIT Press, MIT, Cambridge, MA.
[29] Rodrigues, A. and Bowers, J. (1996), “System Dynamics in Project Management: a comparative analysis with traditional methods,” System Dynamics Review, Wiley, Hoboken, NJ, Vol. 12(2), pp.121–139.
[30] Slaughter, E. (1998), “Models of Construction Innovation,” Journal of Construction Engineering and Management, ASCE, Reston, VA, Vol. 124(3), pp. 226–231.
[31] Sterman, J. (1992), “System Dynamics Modeling for Project Management,” Sloan School of Management, MIT, Cambridge, MA, On-line Publication http://web.mit.edu/jsterman/www/, last visited May, 2000.
[32] Sterman, J. (2000), “Business Dynamics: System Thinking and Modeling for a Complex World,” McGraw-Hill Companies, New York, NY, pp. 191–232.
[33] Tommelein, I. (1998). “Pull-driven Scheduling for Pipe-Spool Installation: Simulation of Lean Construction Technique,” Journal of Construction Engineering and Management, ASCE, Reston, VA, Vol. 124 (4), pp. 279–288.
[34] Turek, M. (1995), “System Dynamics Analysis of Financial Factors in Nuclear Power Plant Operations”, Thesis (M.S.), Department of Nuclear Engineering, MIT, Cambridge, MA, pp. 15–22.
[35] Wang, W. and Demsetz, A. (2000), “Model for Evaluating Network under Correlated Uncertainty-NETCOR,” Journal of Construction Engineering and Management, ASCE, Reston, VA, Vol. 126(6), pp. 458–466.