Embed Size (px)
Citation preview

1 INTRODUCTION The emerging EU directives relating to energy (EU EPBD and the EU Directive on Emissions Trading) now places demands on building owners to rate the energy performance of their buildings. Each EU member state is committed to implement this direc-tive.
Currently, energy performance rating of build-ings is at best sporadic often consisting of an ad-hoc combination of off-shelf building management com-ponents distributed data metering equipment “glued together by several monitoring and targeting (M&T) software tools (Menzel et al. 2008) This ad-hoc combination presents many difficulties to building owners in the management and upgrade of these sys-tems as the Building Management Systems (BMS) and Energy Management Systems (EMS) can consist of a number of components utilising various infor-mation exchange protocols.
The absence of BMS standardization coupled
with competition for market share results in inde-
pendent and non-compatible system development.
BACnetTM was developed to provide an open, non-
proprietary protocol specification that allows build-
ing automation controllers of different manufacturers
to communicate with each other (ASHRAE 2003).
However BMS / EMS still uses non-standardized
proprietary interfaces.
Consequently BMS / EMS are becoming more
complex over time and are difficult for the average
operator to understand given the educational and ex-
perience previously outlined (Lowry 2002, Hyvrinen
& Krki 1996). Additional training overhead is re-
quired for each new system or system update (Agar-
wal et al. 1996). In conjunction with traditional pro-
curement policy it is conceivable that numerous
systems can appear on one site (Ahern 2006), for ex-
ample (Cylon 2009, Honeywell 2009, Siemens
2009). Hatley et al. (2005) states that in the absence
of compatible hardware and communication proto-
cols maintenance can become extremely problematic
as seamlessly integrating these systems is an ineffi-
cient overhead. In this regard, the prospective consequence of the
building behaviour and occupant/operator needs which would manage energy consumption efficiently would not be predictable with a single combined in-formation and communication platform. A promis-ing approach to overcome these shortcomings is the implementation of a holistic, modular information structure.
On that basis, the integration concepts, holistic monitoring and analysis methodologies, life-cycle oriented decision support and Information and Communication Technologies (ICT) will be de-scribed in this paper. The domain specific goal is to develop an anticipating smart building approach that
Dynamic System Architecture for Energy Efficient Building Operation: A Case Study of Kiptaş Residential Building
H.U. Gökçe, K.U. Gökçe, Donal Browne, Karsten Menzel University College Cork, Cork, Ireland
ABSTRACT: Buildings account for almost 40 percent of total energy in Europe. Holistic monitoring and analysis methodologies can reduce this by up to 30%. However, the adoption of monitoring and control sys-tems for building management and control applications is hampered by the unavailability of appropriate tool environments. In this paper an integrated model-driven approach that automates the design from component to application level will be presented to provide optimized building operations. The aim is to create a holistic environment for wireless embedded monitoring and control systems to increase the efficiency of the overall system development process and to exploit their potential for reduction of building energy consumption. To reach this objective, new methods, tools and equipments were researched and integration methods covering integrated design, energy simulation models and data warehouse technologies were developed. The findings were applied to a residential building of Kiptaş in Istanbul, Turkey and possible energy saving improvements were suggested.

operates on an energy-efficient and user-friendly ba-sis while reducing its maintenance costs.
The proposed concept is developed based on the outputs of ITOBO Research Cluster (ITOBO 2009). The ITOBO, the SFI (Science Foundation Ireland) Strategic Research Cluster for Sustainable and Op-timized Building Operation, undertakes research in Information and Communication Technology that will enable us to develop a holistic, methodological framework for lifecycle oriented information man-agement and decision support in the construction and energy management sectors.
This concept was deployed on a demonstrator building of Kiptaş in Turkey.
Kiptaş which is serving as the important company of the building sector since 1995 continues to serve for Istanbul / Turkey as being conscious of the mis-sion it has. With the catchword of “50.000 residence to Istanbul” started to the construction with “BASAK-HILAL Collective Housing Project” on 17 May 1995 (Kiptaş 2009).
2 SYSTEM ARCHITECTURE The objective of the proposed system is to integrate multiple dimensions of building information, such as performance data (e.g. energy consumption, tempra-ture, light), system data (e.g. status, switch settings) and process data (e.g. inspection, maintenance, re-pair). This model will be implemented as an exten-sion to international standards (e.g. IFC 2x2 ISO/PAS 16739, ISO-STEP 10303).
The system architecture depicted in figure 1 is constructed based on five scenarios. The result of the decomposition is specified in the form of UML-package diagrams. In this paper Data Representation and Aggregation scenario will be presented in detail and applied to a residential building block in Istan-bul, Turkey. Building is recently constructed and owned by Kiptaş Company.
Monitoring
Clients
IRUSE Cork
Model
Editor
Trinity
(Nembes)
RFID Gateway
IRUSE Cork
(Nembes)
User Interface
4C (Freuder)
IRUSE C&G
Pred. Analysis
4 C (Freuder)
IRUSE C&G, CSL
Wl. Sensors
TYN
Wl. Meters
TYN
off-the-shelf comp.
RFID Network
IRUSE Cork
(Nembes)
WSAN
Design T.
AWS
IRUSE Galway
Perform.
Spec. T.
IRUSE Galway
AWS
CSL, Tyndall, IRUSE-C
Network Protocol
Pref. Analysis
4 C (Freuder)
IRUSE G,
Wd. Sensors
IRUSE C&G
Wd. Actuat.
CSL
IRUSE (C&G)
Wl. Actuat.
TYN
off-the-shelf comp.
Intell. Control
4C (F)+ CSL
CSL, IRUSE C&G
Data Warehouse Services
IRUSE Cork
IFC Parser
IRUSE Galway
AWS, IRUSE-C
Maintenance
Clients
IRUSE Cork
4C Brown
Maintenance
Mgmt. Syst.
4C Brown
IRUSE Cork
Diagnosis
Module
IRUSE Cork
CSL, 4C B
Model
Editor
IRUSE Cork
ARIS
Server
IRUSE Cork
4C
EDM
Server
IRUSE G&C
Energy
Profiler
IRUSE Cork
(EU-FP7)
Energy
Sim. Module
IRUSE Galway
IRUSE Cork
Sched-
uling
4C Brown
IRUSE Cork
BMS Fault
Detection
?IRUSE C?
?CSL?
Network Fault
Detection
AWS
CSL
Figure 1. Proposed ITOBO Platform
2.1 Data Representation and Aggregation
This scenario addresses the representation of differ-ent data streams to various stakeholders (e.g. owner, operator, user/tenant) to provide useful information relating to the energy performance of their buildings. This provides improved alterations of the current conditions and lead to an intelligent control of the buildings. Data acquisition is based on the wired and wireless sensor and meter network. Compiled per-formance data includes (1) Energy Consumption Data (conventional and renewable sources) (2) User Comfort Data (Temperature, CO2-level, Humidity, Lux-Level), (3) Environmental Impact Data (CO2 - Footprint). Figure 2 depicts UML package diagram for Data Representation and Aggregation scenario.
Wl. Sensors
(HN.01) TYN
Wl. Meters
(O.B) TYN
off-the-shelf comp.
(HN.02) AWS
CSL, Tyndall, IRUSE-C
Network Protocol
Wl. Actuat.
(HN.04) TYN
off-the-shelf comp.
IFC Parser
(DA.02) IRUSE Galway
AWS, IRUSE-CEDM
Server
(O.D) IRUSE G&C
Energy
Sim. Module
(O.E) IRUSE Galway
IRUSE Cork
Wl. Sensors
(HN.01) TYN
Wl. Meters
(O.B) TYN
off-the-shelf comp.
(HN.02) AWS
CSL, Tyndall, IRUSE-C
Network Protocol
Wl. Actuat.
(HN.04) TYN
off-the-shelf comp.
IFC Parser
(DA.02) IRUSE Galway
AWS, IRUSE-CEDM
Server
(O.D) IRUSE G&C
Energy
Sim. Module
(O.E) IRUSE Galway
IRUSE Cork
Wl. Sensors
(HN.01) TYN
Wl. Sensors
(HN.01) TYN
Wl. Meters
(O.B) TYN
off-the-shelf comp.
Wl. Meters
(O.B) TYN
off-the-shelf comp.
(HN.02) AWS
CSL, Tyndall, IRUSE-C
Network Protocol
(HN.02) AWS
CSL, Tyndall, IRUSE-C
Network Protocol
Wl. Actuat.
(HN.04) TYN
off-the-shelf comp.
Wl. Actuat.
(HN.04) TYN
off-the-shelf comp.
IFC Parser
(DA.02) IRUSE Galway
AWS, IRUSE-C
IFC Parser
(DA.02) IRUSE Galway
AWS, IRUSE-C
IFC Parser
(DA.02) IRUSE Galway
AWS, IRUSE-CEDM
Server
(O.D) IRUSE G&C
EDM
Server
(O.D) IRUSE G&C
Energy
Sim. Module
(O.E) IRUSE Galway
IRUSE Cork
Energy
Sim. Module
(O.E) IRUSE Galway
IRUSE Cork
Figure 2. UML Package Diagram for Data Representation and Aggregation
There are three use cases have been defined for
this scenario such as network, data warehouse opera-tor and monitoring client use cases.
Use case 1 shows the extraction of raw data from the wireless network as depicted in Figure 3, UML sequence diagram.
Network
Protocol
DW
ETL Tool
sensors independently
send raw datarequests
sensed data
consistency
check
transformation into
DW data structure
Data
Warehouse
load
FACT data
confirm
completion
sensors independently
send raw data
sensors independently
send raw data
sensors independently
send raw data
responses
sensed data
timer
set timer
Network
Network
Protocol
Network
Protocol
DW
ETL Tool
DW
ETL Tool
sensors independently
send raw datarequests
sensed data
consistency
check
transformation into
DW data structure
Data
Warehouse
Data
Warehouse
load
FACT data
confirm
completion
sensors independently
send raw data
sensors independently
send raw data
sensors independently
send raw data
responses
sensed data
timertimer
set timerset timer
NetworkNetwork
Figure 3. UML Sequence Diagram for Scenario 1: Use Case 1
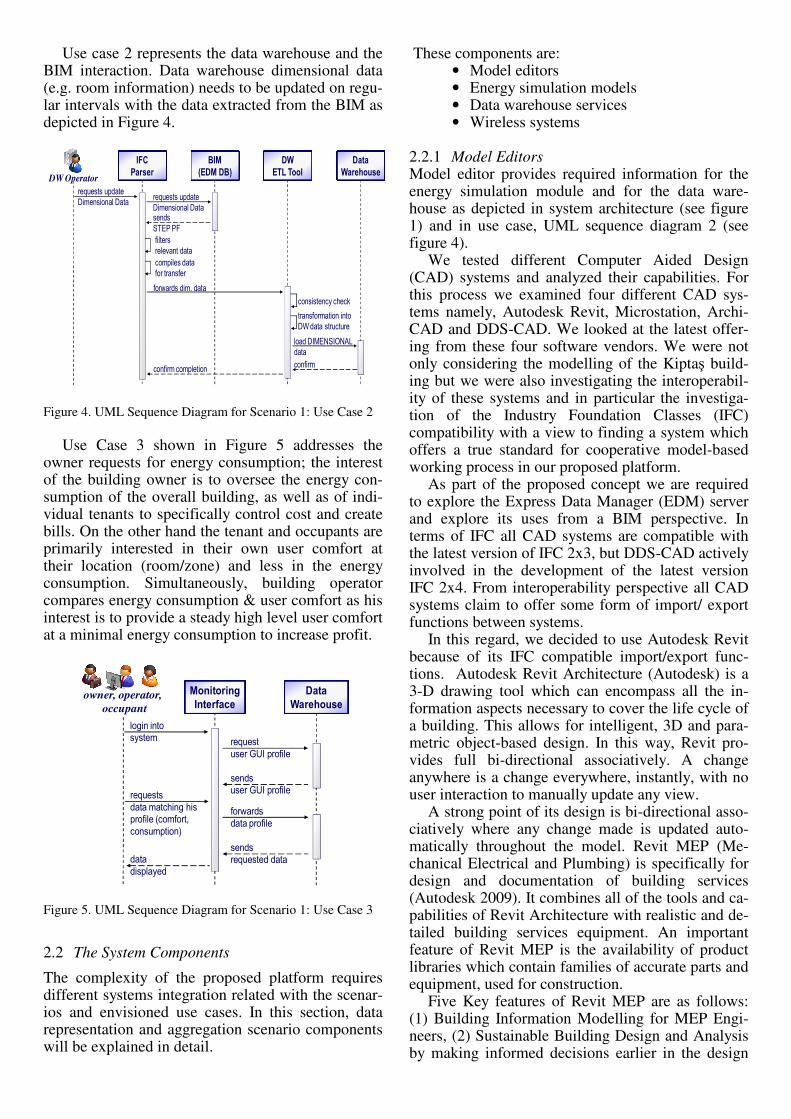
Use case 2 represents the data warehouse and the BIM interaction. Data warehouse dimensional data (e.g. room information) needs to be updated on regu-lar intervals with the data extracted from the BIM as depicted in Figure 4.
IFC
Parser
DW
ETL Tool
requests update
Dimensional Data
filters
relevant data
compiles data
for transfer
Data
Warehouse
load DIMENSIONAL
data
confirm
consistency check
transformation into
DW data structure
BIM
(EDM DB)
forwards dim. data
confirm completion
requests update
Dimensional Datasends
STEP PF
DW Operator
Figure 4. UML Sequence Diagram for Scenario 1: Use Case 2
Use Case 3 shown in Figure 5 addresses the
owner requests for energy consumption; the interest of the building owner is to oversee the energy con-sumption of the overall building, as well as of indi-vidual tenants to specifically control cost and create bills. On the other hand the tenant and occupants are primarily interested in their own user comfort at their location (room/zone) and less in the energy consumption. Simultaneously, building operator compares energy consumption & user comfort as his interest is to provide a steady high level user comfort at a minimal energy consumption to increase profit.
Data
Warehouseowner, operator,
occupant
login into
system request
user GUI profile
sends
user GUI profilerequests
data matching his
profile (comfort,
consumption)
forwards
data profile
sends
requested datadata
displayed
Monitoring
Interface
Figure 5. UML Sequence Diagram for Scenario 1: Use Case 3
2.2 The System Components
The complexity of the proposed platform requires different systems integration related with the scenar-ios and envisioned use cases. In this section, data representation and aggregation scenario components will be explained in detail.
These components are: • Model editors • Energy simulation models • Data warehouse services • Wireless systems
2.2.1 Model Editors Model editor provides required information for the energy simulation module and for the data ware-house as depicted in system architecture (see figure 1) and in use case, UML sequence diagram 2 (see figure 4).
We tested different Computer Aided Design (CAD) systems and analyzed their capabilities. For this process we examined four different CAD sys-tems namely, Autodesk Revit, Microstation, Archi-CAD and DDS-CAD. We looked at the latest offer-ing from these four software vendors. We were not only considering the modelling of the Kiptaş build-ing but we were also investigating the interoperabil-ity of these systems and in particular the investiga-tion of the Industry Foundation Classes (IFC) compatibility with a view to finding a system which offers a true standard for cooperative model-based working process in our proposed platform.
As part of the proposed concept we are required to explore the Express Data Manager (EDM) server and explore its uses from a BIM perspective. In terms of IFC all CAD systems are compatible with the latest version of IFC 2x3, but DDS-CAD actively involved in the development of the latest version IFC 2x4. From interoperability perspective all CAD systems claim to offer some form of import/ export functions between systems.
In this regard, we decided to use Autodesk Revit because of its IFC compatible import/export func-tions. Autodesk Revit Architecture (Autodesk) is a 3-D drawing tool which can encompass all the in-formation aspects necessary to cover the life cycle of a building. This allows for intelligent, 3D and para-metric object-based design. In this way, Revit pro-vides full bi-directional associatively. A change anywhere is a change everywhere, instantly, with no user interaction to manually update any view.
A strong point of its design is bi-directional asso-ciatively where any change made is updated auto-matically throughout the model. Revit MEP (Me-chanical Electrical and Plumbing) is specifically for design and documentation of building services (Autodesk 2009). It combines all of the tools and ca-pabilities of Revit Architecture with realistic and de-tailed building services equipment. An important feature of Revit MEP is the availability of product libraries which contain families of accurate parts and equipment, used for construction.
Five Key features of Revit MEP are as follows: (1) Building Information Modelling for MEP Engi-neers, (2) Sustainable Building Design and Analysis by making informed decisions earlier in the design

process supported by gbXML (3) Heating and Cool-ing Load Analysis through IES (4) Mechanical Sys-tems and Duct Layout Modelling with automatic siz-ing (5) Electrical Lighting, Wire Path Layout, and Power Circuit Layout.
2.2.2 Energy Simulation Model Energy simulation model will provide measures to predict building energy performance. Also, it will enable the building operator to perform comparisons between design intent and actual performance data.
In order to perform an energy simulation on the Revit MEP model we used the provided IES plug-in.
Integrated Environmental Solutions is an energy simulation software package (IES 2009). It is broken into a number of separate tools which are purchased and licensed separately. Some of the most relevant tools are detailed below.
Model IT is the IES tool used to create the geome-try for a building model. AutoCAD *.dfx drawings can be used as a template or models can be con-structed from scratch using known dimensions. Al-ternatively a model can be imported from compatible software programmes, e.g. Google SketchUp. When importing models into IES it is necessary that the model has been constructed correctly or it will not function. Building orientation, location and weather files can also be specified with the Model IT tool.
Once a building model is created and located, the second step is usually running a Suncast simulation. This performs solar geometry studies both for ther-mal heat gains analysis and daylight analysis which is used for site orientation and solar thermal heat gains which provides useful information for glaz-ing/shading specification. Graphical images are very useful for shaping the building geometry.
MacroFlo is a tool used where natural ventilation or mixed mode ventilation is a strategy employed in a building. It is a bulk air flow analysis tool which considers building geometry, wind patterns and in-ternal conditions. Results can be outputted to ApacheSim for total energy analysis.
ApacheSim is the central thermal analysis tool which brings together data from other tools to com-pute the energy consumption of a building and a wide variety of other energy related loads. Very de-tailed results are produced which can shape the de-sign of a building and the MEP services.
IES’s Revit plug-in Toolbar allows Revit Archi-tecture and MEP to import a 3D BIM model into IES’s software and undertake energy and thermal analysis (IES 2009).
No model rebuild is required within IES, an inter-face ‘Setting Model Properties’ guides the user. In-formation is required regarding building type, con-struction materials, and heating and cooling system types. This information can be entered for the whole building as one set of data or at room (space) level depending on stage of design or results required. For
example scheme design may allow whole building data; detailed design would likely require detailed room by room data. Once the model is established, all IES performance analysis products are accessible for the model. While the drafting and 3D modelling properties of Revit are excellent, it currently does not perform its own energy simulation. Rather it re-lies entirely on IES. Therefore solely from an energy simulation point of view, the use of Revit MEP can-not be justified. Its only function is to create the building geometry and properties before exporting to IES. However it is the building information proper-ties and being the central core of a project which Revit earns it keep.
2.2.3 Data Warehouse Services The objective of the project specific data warehouse core development is to provide a holistic information management system to store integrate and analyse complex data sets from multiple information sources such as model editors, energy simulation tools and performance framework specification tools as well as data streams collected from wired and wireless sensors and meters in order to analyse building per-formance data and to support decision making proc-ess of the stakeholders (Gökçe et al. 2009).
Figure 6 shows holistic N-dimensional informa-tion management architecture which is structured under Data Warehouse Services. System consists of three integrated main components
• Data warehouse core • Extraction, Transformation, Loading (ETL)
Tool • Information representation tools
Figure 6. Holistic N-Dimensional Information Management System Architecture

Data warehouse core consist of three subcompo-nents. These are:
1. Operational Data Store: ODS is a database designed to integrate current valued subject oriented, volatile and real time data from multiple sources such as building manage-ment system, wireless sensor network and energy unit prices (Gökçe et.al. 2009).
2. Fact Data and Dimensional Data: This is the main repository for long term storage of dy-namic data. Data collected and temporally stored in the ODS populates the fact data ta-ble.
3. Aggregated Data: This is the decision sup-port level of the multi-dimensional data warehouse. Fact data become meaningful when it is associated with the dimensional data and provides the end user the means to "slice and dice" data.
Proposed system extracts wired sensor data from building management system and wireless sensor network. Collected sensor data is stored in the opera-tional data store for data cleansing and redundancy check processes.
These pre-processed data is loaded to the fact data section of the data warehouse system via ETL (Ex-traction, Transformation and Loading) tool. Simulta-neously, data gathered from BIM (from model edi-tors and building simulation models) is loaded to the dimensional data section of the data warehouse. Populated fact data and dimensional data is aggre-gated with regards to different stakeholder require-ments in the data warehouse core and presented through specific Graphical User Interfaces (GUI).
2.2.4 Wireless System Wireless systems consist of wireless sensors, meters, actuators and top of them a wireless network plat-form. Wireless System is designed by Cylon Con-trols Limited (Cylon 2009). Cylon is one of the in-dustrial partners of the ITOBO Project acting on the hardware development side for our particular hard-ware needs located in Dublin, Ireland.
For the Kiptaş building various Cylon wireless sensors, control units, receivers (i.e. temperature, light, presence detector sensors, wireless receivers, fan control units) are developed and deployed. The control of artificial light in building automation has a direct impact on energy saving; Light sensors can be used along with the presence detector sensors to im-prove the energy management, by capturing in-door/outdoor light. They can help to make decisions on if the level of natural light is sufficient to provide the full indoor illumination level required, or if an artificial light is needed (and how much artificial light is needed in case you can regulate it).
Also, appropriate levels of light measured in lux units are important in many areas of human activity
such as close field work, general reading, and relaxa-tion which can have important psychological effects.
In this case, Cylon sensor SR04P and Sensor SR04PT are deployed.
SR04P is a space temperature sensor with set point adjustment for use in bedrooms. Sensor SR04PT (see Figure 7) is a temperature sensor with set point adjustment and presence detector for use in living rooms, kitchens and circulation areas. The presence detector can be linked into the lighting sys-tem to save power when rooms are not occupied. This system is not suitable in bedrooms as lights may need to be off when spaces are occupied.
Figure 7. SR04PT Wireless Temperature Sensor with Setpoint Adjustment and Presence Detection
The sensors are battery free and gain power from
an integrated solar cell. However it is possible to in-clude a battery if ambient light conditions are not sufficient. This is likely to be necessary in the circu-lation space and bathrooms where there is no source of natural light and artificial lights will only be lit when rooms are occupied. Battery operating lifespan is 5 to 10 years depending on operating conditions. Sensors are best located on internal walls to mini-mise external influences, cold draughts in cavities, etc. The range of these sensors is certified to be 20m through 3 Brick or concrete walls.
One Wireless Receiver (Model SRCRS 485 MODBUS) is required per home. This uses MOD-BUD open protocol to communicate with our Data Ware-house. This facilitates future expansion of the wireless network up to a maximum 1024 no. devices without need for additional BMS outstations. This links directly to an UC32.24 controller which will process and send control signals. This controller can also control the fans to minimise its usage.
3 CASE STUDY: KIPTAŞ RESIDENTIAL BUILDING
Data representation and aggregation scenario is im-plemented to a residential building located in Istan-bul, Turkey. The building is a social housing tower block. The same building design is to be repeated on different construction sites of Kiptaş. The building has 14 storeys including a double basement.
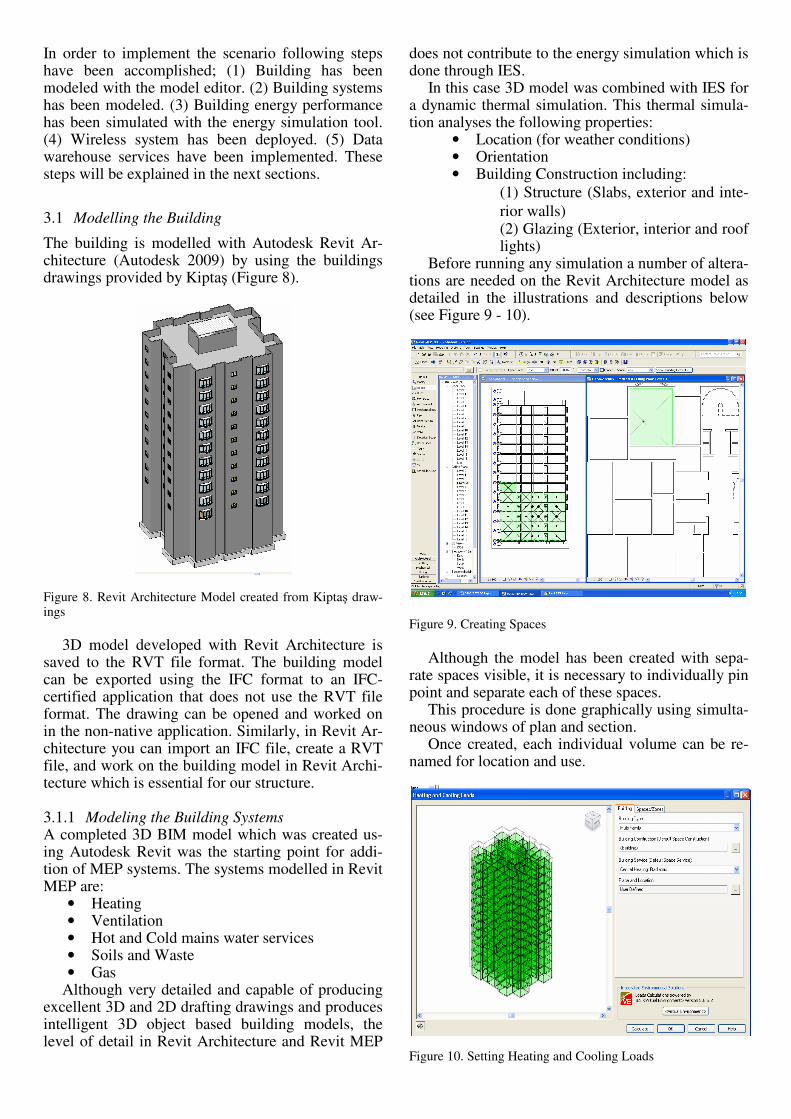
In order to implement the scenario following steps have been accomplished; (1) Building has been modeled with the model editor. (2) Building systems has been modeled. (3) Building energy performance has been simulated with the energy simulation tool. (4) Wireless system has been deployed. (5) Data warehouse services have been implemented. These steps will be explained in the next sections.
3.1 Modelling the Building
The building is modelled with Autodesk Revit Ar-chitecture (Autodesk 2009) by using the buildings drawings provided by Kiptaş (Figure 8).
Figure 8. Revit Architecture Model created from Kiptaş draw-ings
3D model developed with Revit Architecture is
saved to the RVT file format. The building model can be exported using the IFC format to an IFC-certified application that does not use the RVT file format. The drawing can be opened and worked on in the non-native application. Similarly, in Revit Ar-chitecture you can import an IFC file, create a RVT file, and work on the building model in Revit Archi-tecture which is essential for our structure.
3.1.1 Modeling the Building Systems A completed 3D BIM model which was created us-ing Autodesk Revit was the starting point for addi-tion of MEP systems. The systems modelled in Revit MEP are:
• Heating • Ventilation • Hot and Cold mains water services • Soils and Waste • Gas
Although very detailed and capable of producing excellent 3D and 2D drafting drawings and produces intelligent 3D object based building models, the level of detail in Revit Architecture and Revit MEP
does not contribute to the energy simulation which is done through IES.
In this case 3D model was combined with IES for a dynamic thermal simulation. This thermal simula-tion analyses the following properties:
• Location (for weather conditions) • Orientation • Building Construction including:
(1) Structure (Slabs, exterior and inte-
rior walls) (2) Glazing (Exterior, interior and roof lights)
Before running any simulation a number of altera-tions are needed on the Revit Architecture model as detailed in the illustrations and descriptions below (see Figure 9 - 10).
Figure 9. Creating Spaces
Although the model has been created with sepa-rate spaces visible, it is necessary to individually pin point and separate each of these spaces.
This procedure is done graphically using simulta-neous windows of plan and section.
Once created, each individual volume can be re-named for location and use.
Figure 10. Setting Heating and Cooling Loads

Heating and cooling loads allows 4 variables to be altered. For this project these were set as follows:
1. Building Type set as Multi Family for separate families homes within a single building structure.
2. Building Construction opens separate window shown below (see Figure 11).
3. Building Services set as “Central Heating Radiators”.
4. Place and Location opens separate win-dow as shown below (see Figure 11).
Figure 11. Setting Building Construction Settings
The Revit MEP allows 9 no. construction vari-
ables to be altered. These were chosen as follows: 1. Exterior walls were set as Heavy Weight
Concrete, 2. Interior Walls set as Frame Partition with
Gypsum Board, 3. Slabs set as Concrete, 4. Roofs as Light Weight Concrete, 5. Floors as Light Weight Concrete Deck, 6. Doors as Metal Doors, 7. Exterior Windows varied for different
simulations see Section 3.1.2, 8. Interior windows left as default as they are
not contained in this building, 9. Skylights left as default as they are not
contained in this building. The simulation and calculations for the building
took approximately 4 to 5minutes.
3.1.2 Simulation Results A number of simulations were performed altering different building façade properties for comparisons For example; a simulation was performed with poor quality single glazed windows with a u-value of 5.5475w/m
2ºC. This resulted in a total heating load
of 134kW for the building or 72 w/m2 which is a
reasonable result. The second simulation performed replaced the poor quality single glazed windows with large Double Glazed Reflective windows hav-ing a u-value of 2.921 w/m
2ºC. This resulted in an
improved total heating load of 116kW for the build-ing or 63 w/m
2. For the building type and climate
this can be considered to be a reasonable result. This also proves that the Revit/IES programme responded correctly to the improved construction.
3.1.3 Revit/IES Simulation Conclusions All results provided can be considered to be reason-able and accurate. When the entire design process is taken into account, the benefits of Revit Architecture and Revit MEP are clear to see. The drafting quality and properties exceed current 3D AutoCAD soft-ware on the market; the BIM properties have huge potential to save design and construction time and the software has the potential to become the central hub of any future complex design. Moreover this in-tegration supports a holistic framework for informa-tion management and decision support.
3.2 Wireless System Deployment
Wireless sensors are not currently widely utilised because of their supply cost, for example in Ireland a traditional wired sensor can be supplied and pro-grammed for approximately €70 per point whereas a similar wireless sensor may cost approximately €100 per point. However as the technology improves and scale of manufacture increases their use will become more economical, furthermore wireless sensors re-duce labour costs with less on site wiring which will add to their value. The two primary advantages of wireless sensors is ease of installation, commission-ing and their easy mobility. Moreover Wireless Em-bedded Monitoring and Control Systems may easily be added to old and new buildings and enable the re-duction of the energy-consumption by 5 to 30 per-cent (Salsbury et al. 2000, Jagemar et al. 2007, VDMA 2008).
3.2.1 Wireless Scheme Design for Kiptaş Building Figure 12 shows an architectural layout for a typical floor level.
Figure 12. Typical Kiptaş Building Layout
The layout is symmetrical and each home consists of 6 no. rooms. These are circulation hallway, kitchen, living room, two bedrooms and bathroom.
Because of the repetitiveness this scheme, design has concentrated on one home only which can be re-peated throughout the building.
The specific products (see Table 1) used here are manufactured by Cylon which also support Kiptaş Building requirements.
Table 1. Sensor Types and Models
Type Model
Temperature Sensor SR04P
Temperature Sensor SR04PT
Wireless Receiver SRCRS485MODBUS
Controller UC32.24
3.2.2 Budget Costs The likely installation costs for a single apartment were determined using a number of assumptions as given in Table 2.
Table 2. Wireless System Cost Allocation
Assumptions Wireless System
Controls Supply and Commissioning € 4,200.00
Electrician Wiring and Installation € 60.00
Main Contractor Builders Works € 100.00
Total Cost € 4,360.00
This rough estimation has been made using the
following assumptions; • Irish supply of controls equipment • Typical EU electrician labour cost of €60
for electrician & apprentice • Builders works assuming minimal con-
crete disturbance This estimation gives very general cost estimation
for a single independent apartment. Costs would be further reduced if the building
was taken as a whole and controlled centrally. This would be achieved for both systems by requiring less controllers and wireless receivers.
3.2.3 Wireless System Deployment Summary The wireless scheme design above provides a self contained and practical wireless control system for heating, ventilation and lighting within a residential unit.
For efficient energy management, the monitoring of buildings current energy consumption is of central importance, to identify and eliminate energy wasting processes. In extension, the implementation of an appropriate Building Control Systems permits en-ergy saving up to 30 percent (Salsbury et al. 2000, Jagemar et al. 2007, VDMA 2008). However, this requires inexpensive, flexible and easy to handle monitoring and control technologies (Jagemar et al. 2007, Itard et al. 2008).
Wireless devices support this approach. As they communicate wirelessly and run on batteries or har-vest energy from their environment (Enocean 2007), they can be easily installed without wiring, saving effort and cost (Kintner et al. 2002). This makes them a potential replacement of wired technologies as they can sense building performance data with high precision and accuracy requiring less installa-tion cost. This flexibility makes them especially at-tractive for energy management in residential build-ings, as they allow an easy scaling of the monitoring system size from small size system which is a neces-sity for residential units.
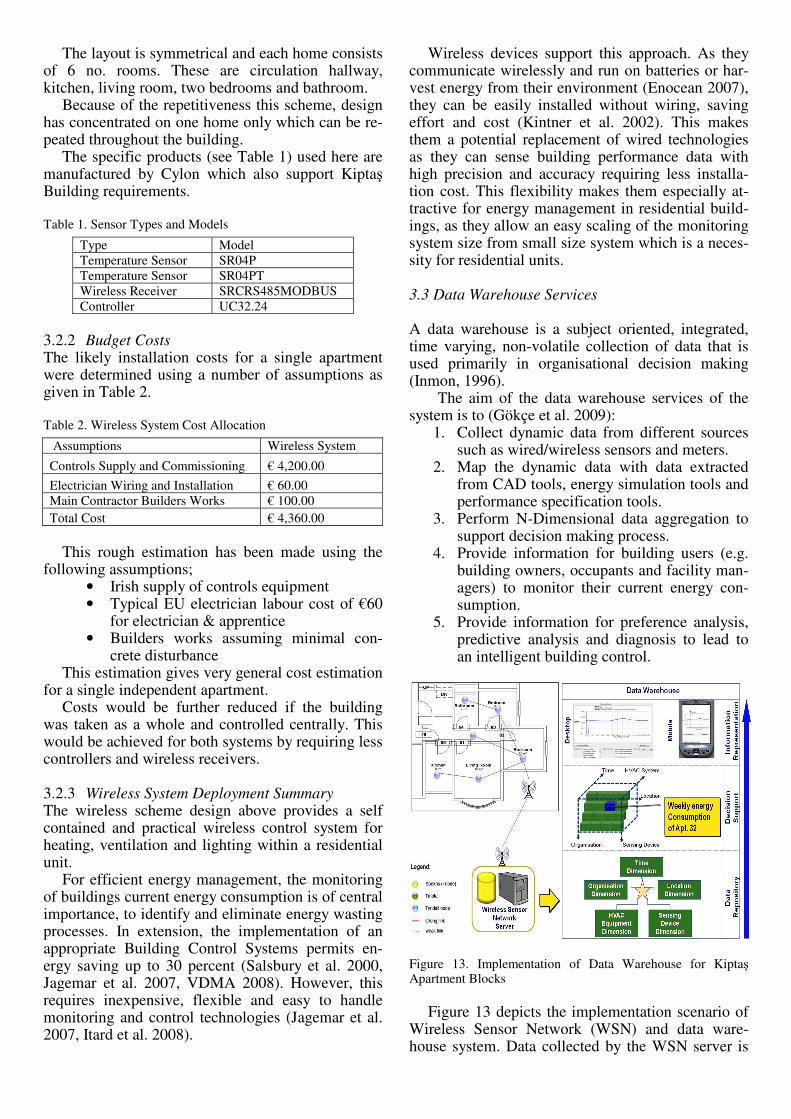
3.3 Data Warehouse Services A data warehouse is a subject oriented, integrated, time varying, non-volatile collection of data that is used primarily in organisational decision making (Inmon, 1996).
The aim of the data warehouse services of the system is to (Gökçe et al. 2009):
1. Collect dynamic data from different sources such as wired/wireless sensors and meters.
2. Map the dynamic data with data extracted from CAD tools, energy simulation tools and performance specification tools.
3. Perform N-Dimensional data aggregation to support decision making process.
4. Provide information for building users (e.g. building owners, occupants and facility man-agers) to monitor their current energy con-sumption.
5. Provide information for preference analysis, predictive analysis and diagnosis to lead to an intelligent building control.
Figure 13. Implementation of Data Warehouse for Kiptaş Apartment Blocks
Figure 13 depicts the implementation scenario of
Wireless Sensor Network (WSN) and data ware-house system. Data collected by the WSN server is

aggregated within the data warehouse and results represented through graphical user interfaces devel-oped for both mobile and desktop PC applications.
Figure 14 depicts a possible business scenario for monitoring and certification of the energy perform-ance of specific apartment blocks. In this scenario data collected by the WSN and aggregated by the data warehouse system. Results are represented via touch screen monitors installed within the flats. Si-multaneously, this aggregated information can be used to issue BER (Building Energy Rating) certifi-cate.
Figure 14. Kiptaş Business Scenario
4 POSSIBLE ENERGY SAVING IMPROVEMENTS
Aside from the alternative facades detailed above, the following MEP alterations could also be made to the existing design for this project with the aim of improving energy efficiency.
4.1 Centralised Heating Plant
The first consideration to save energy on site is im-plementation of district heating system with the pos-sible inclusion of combined heat and power plant. On large mixed use developments the diversity which can be applied to heating is as low as 12-15%. For example if one home required a maximum load of 10kw heating, then 100 homes would only require 120 to 150Kw of central plant, not 1 MW. Central-ised heating plant could also be implemented if there was a steady heat load, ideally this would require in-clusion of a nearby hotel, swimming pool or hospi-tal.
4.2 Centralised Ventilation
Centralised ventilation for building ventilation could be implemented but would likely demand too much vertical ventilation space. Ownership and mainte-nance issues would also become more complex in
this situation unlike the self contained set-up cur-rently designed.
4.3 Heat recovery
Heat recovery fans could be utilised for heating sav-ings in winter. Air to air heat recovery devices can retain up to 75% of heat. Theses devices are not as efficient in summer because of the lower tempera-ture difference between internal and external air.
4.4 Rainwater Harvesting
Implement water harvesting system, will require an additional water system and may only be feasible for upper floors due to the height to floor area ratio of the building.
4.5 Night Purge
The very heavy thermal mass of the building can be utilised for free cooling of buildings in summer. Night purging works by allowing cooler night air to naturally enter a space and remove heat from the building. The construction of the building is already suited to this. The system could be automated or with occupant education a free and simple method could be utilised depending on weather conditions.
4.6 Atrium/stack effect.
Atria are often used to take advantage of the stack effect. The stack effect takes advantage of natural convection of warm air rising but is limited to cer-tain heights. There is no atria designed in this project and would not be economically viable in a munici-pality sponsored residential project. Staircases in the building could be used as natural stacks to allow heat to rise throughout the building. However this would make the upper floors too hot for comfort and is likely to cause fire separation problems.
4.7 Solar thermal heating
On roof and as shades on south facing facades could provide a sizable amount of hot water requirements for domestic washing and cleaning. These panels are economically viable in Ireland in the right circum-stances so should also prove useful in Turkey.
4.8 Photovoltaic
PV could be utilised for electricity generation how-ever these systems are very expensive and produce little useful electricity. In Ireland the capital cost of installation exceeds the useful electricity generated by the panels over their useful lifespan (Approx 20 years). However in Turkey with greater sunshine these may be feasible.
5 CONCLUSION
The European directive EPBD (Energy Performance Building Directive 2002/91/EC-2006/32/EC) and the Turkish directive ENVER (Energy Efficiency Direc-tive 5627 18/04/2007) requires a dramatic change in the way buildings are analysed. Current building per-formance analysis focuses on assessment at earlier stages of building life cycle (BLC) with a deficiency in analysis at the later stages of operation and main-tenance. Dynamic System Architecture for Energy Efficient Building Operation described in this re-search enables continuous assessment process throughout the BLC by combining the data from dif-ferent sources and phases in a single data repository.
A single data warehouse processing geometrical, material, simulated and real time data provides en-hanced decision making capabilities to the stake-holders.
Model editors and simulation tools with industry standardised interoperability capabilities provides a dynamic information flow for efficient building op-eration.
The Kiptaş case study demonstrates the potential of the proposed system. Based on initial results, it enabled continuous building energy analysis from design through building operation. Also, results lead to possible energy saving improvements.
Finally, the system maintains the basis for: im-proving building performance; developing intelligent control routines and implementing fault diagnosis measures.
6 REFERENCES
Agarwal, R., Prasad, J. & Zanino, M. C. 1996. Training experi-ences and usage intentions: a field study of a graphical user interface, International Journal of Human-Computer Stud-ies 45 (2)(45), 215–241.
Ahern, M. 2006. Energy management in UCC, Personal Com-munication.
ASHRAE 2003. HVAC Systems and Equipment, ASRAE Pub-lications, ASHRAE.
Autodesk 2009. www.autodesk.com. Last accessed 01/06/2009. Cylon 2009. www.cylon.com. Last accessed on 01/06/2009 Gökçe H.U., Wang Y., Gökçe K.U., Menzel K. 2009. A Data-
WareHouse Architecture supporting Energy Management of Buildings, CIB-W78 Conference Proceedings, Istanbul, Turkey.
Hatley, D., Meador, R., Katipamula, S., Brambley, M. & LtCol. Carl Wouden, USAF, R. 2005. Energy management and control system: Desired capabilities and functionality, Pre-pared for HQ Air Mobility Command (AMC/CEO) PNNL-15074, PNNL-15074, Richland, Washington 99352.
Honeywell 2007. ‘Honeywell building management systems’, http://content.honeywell.com/UK/building_management_systems.html.
Hyvrinen, J. & Krki, S., eds 1996. Building Optimisation and Fault Diagnosis, System Source Book, IEA Annex, Real Time Simulation of HVAC systems for Building Optimiza-tion, Fault detection and Diagnosis, 25.
IES 2009. www.iesve.com. Last accessed on 15/05/2009.
Inmon, W. 1996. Building the Data Warehouse. Second Edi-tion, John Wiley & Sons.
ITOBO 2009. http://zuse.ucc.ie. Last accessed 01/06/2009. Kiptaş 2009. www.Kiptaş.com.tr. Last accessed on 15/05/2009. Lowry, G. 2002. Modelling user acceptance of building man-
agement systems, Automation and Construction, 11 (6), 695–705.
Menzel K., Kean M., Keller M., O’Mathuna C., Pesch D. 2008. Toward a Wireless Sensor Platform for Energy Efficient Building Operation, Tsinghua Science & Technology, Vol-ume 8, Number 1.
Siemens - APOGEE 2008. www.us.sbt.siemens.com. Last ac-cessed on 15/05/2008.
Tyndall 2009. www.tyndall.ie. Last accessed on 01/06/2009. Soekris board, http://www.soekris.com/, last accessed on
15/05/2009 Salsbury, T. & Diamond, R. 2000. Performance validation and
energy analysis of HVAC systems using simulation. Energy and Buildings, vol. 32, no. 1, pp. 5 - 17
Jagemar L., Olsson D., Schmidt F. 2007. The EPBD and Con-tinuous Commissioning, Project Report, Building EQ, EIE/06/038/SI2 .448300
VDMA (German Engineering Federation) 2008 Energy-efficiency of Buildings
Itard L., Meijer F., Vrins E., Hoiting H. 2008. Building Reno-vation and Mod-ernisation in Europe: State of the art re-view. Jan. 2008
EnOcean Alliance, Energy for free, White paper, 2007. Kintner-Meyer, M., Brambley, M., Carlon, T. & Bauman, N.
2002. Wireless sensors: technology and cost-savings for commercial buildings. 2002 ACEEE Summer Study on En-ergy Efficiency in Buildings