Embed Size (px)
Citation preview

DEVELOPMENT OF A SOLAR POWERED INDIRECT AIR COOLING COMBINED WITH DIRECT EVAPORATIVE COOLING SYSTEM FOR STORAGE OF FRUITS AND
VEGETABLES IN SUB-SAHARAN AFRICA
S. Sibanda
Submitted in fulfilment of the requirements
for the degree of PhDEng
Bioresources Engineering
School of Engineering
University of KwaZulu-Natal
Pietermaritzburg
South Africa
August 2019

i
PREFACE
The research contained in this dissertation was completed by the candidate while based in the
Discipline of Bioresources Engineering, School of Engineering, College of Agriculture,
Engineering and Science, University of KwaZulu-Natal, Pietermaritzburg, South Africa. The
Agricultural Research Council (ARC) of the Republic of South Africa financially supported the
research. The work is part of an ongoing research project funded by the National Treasury. The
support funding is referred to “The Economic Competitive Support Package commonly called
ECSP”.

ii
ABSTRACT Maintaining fruit and vegetables’ (F&V) quality requires optimal environmental conditions during
transportation, storage and marketing. High ambient in excess of 30oC and low relative humidity
(RH) below 50% characterise most agro-ecological zones of Sub-Saharan Africa (SSA), which
conditions create negative effect on F&V quality. Modern technologies like mechanical
refrigeration, hydro and vacuum cooling have been widely adopted for the modification and control
of the storage environment of high value-quality fresh produce in developed countries. Small-scale
farmers (SSF) in SSA cannot afford the high installation and maintenance costs associated with
such facilities. Low-cost evaporative cooling systems (EC) alone or combined with indirect air-
cooling (IAC) provides alternative solutions to minimize postharvest losses (PHL) in small-scale
farming.
The effectiveness of EC in providing optimum storage conditions of temperature and RH in dry
and arid climates has been investigated and is well reported in published papers worldwide.
However, the effectiveness of EC in hot and sub-humid to humid areas where the air needs sensible
cooling before contact with water through indirect air cooling has not been well investigated and
reported. Recent literature reviewed concludes that evaporative cooling coupled indirect air-
cooling (IAC+EC) should be of particular research focus because of high potential thermal
performance. Further, documented scientific information on performance of commercial scale
IAC+EC of F&V storage systems is limited. IAC+EC requires incorporation of a suitable
desiccation media as an indirect heat exchanger where electrical power is required. SSF in SSA
could access this cheaper technology if solar energy can be utilised through solar photovoltaics
(SPV) and dearth of information exists in actual performance of SPV powering IAC+EC which
factors promoted this study. Thus, the primary aim of this study was to design and evaluate the
effects of solar powered IAC+EC storage conditions on the physical, chemical and sensory quality
parameters of the star 9037 tomato variety over the 28-day experimental period. Comparisons
between tomatoes stored IAC+EC to those stored under ambient conditions was done.
A low cost SPV powered IAC+EC system with a storage chamber with a capacity 3.8 tonnes of
tomatoes was designed and fabricated in Pietermaritzburg for study under a sample tomato load.
The experimental set up consisted of SPV system, battery bank, electrical appliances, indirect heat
exchanger, psychrometric unit, and 3.8 tonne storage chamber constructed and assembled on site.

iii
In optimizing power from the SPV systems and battery bank to meet the demand load a three series-
three strings solar panels rated 330 W with short circuit current and open circuit voltage of 8.69 A
and 44.8 V, respectively, were used with a 48 V battery bank of twelve 230 AH batteries.
Based on the experiment data the SPV system produced 2639 W that is 90% of the calculated
theoretical power output. The energy yield of 2639 W was 11% higher than the power required in
running the electrical appliances for IAC+EC system. Tracking the SPV system under ambient
conditions with an average daily generation during the period of the experiment, the power and PV
array efficiencies were 81.2% and 15.1% respectively. The power output of modules increased
with temperature of the module to 25℃ and declined thereafter. It was found that the solar array
system can be used to power the IAC+EC at daytime during summer season, and the excess power,
stored in the battery ran the system until 22h00 at night when temperatures are low enough for
storage of tomatoes and SPV system was then switched off.
There were significant variations (P<0.001) between storage and ambient conditions. The
temperature inside the cooler was on average 7℃-16℃ lower and the average RH was 28% to 47%
higher than ambient conditions. The cooler efficiency varied from 86.8% to 96.7%. The IAC+EC
tested in Pietermaritzburg was found to perform at the same level as EC under dry and arid
conditions. The solar powered IAC+EC tested in this study has benefits in providing optimum
conditions for fresh produce and in reducing losses as well as being a low-cost technology that can
be a candidate for implementation in hot and to humid areas in SSA. The effect of two storage
conditions on total soluble solids, tomato firmness, colour, physiological weight loss (PWL) and
marketability of tomatoes was investigated. The storage conditions and the storage period
significantly (P≤0.001) affected the evaluated quality parameters. Low temperature IAC+EC
storage offered the greatest benefit in maintaining high marketability, reduced PWL and delayed
the peak in respiration, compared to ambient conditions. Tomatoes stored under ambient conditions
exhibited increased rates of ripening, which was evident in increased PWL, reduced firmness,
redness in skin colour, rapid increase in TSS. The green harvested tomatoes combined with
IAC+EC provided favourable conditions in maintaining lower PWL, higher marketability, higher
moisture content which are indicative of delayed ripening. The findings show that cold storage
improved the shelf life to three weeks and preserving the quality of tomatoes during short and
extended storage durations compared to storage under ambient conditions.

iv
DECLARATION ON PLAGIARISM
I, Sipho Sibanda, declare that:
(i) The research reported in this dissertation, except where otherwise indicated, is my original
work.
(ii) This dissertation has not been submitted for any degree or examination at any other
university.
(iii) This dissertation does not contain other persons’ data, pictures, graphs or other information
unless specifically acknowledged as being sourced from other persons.
(iv) This dissertation does not contain other persons’ writing unless specifically acknowledged
as being sourced from other persons. Where other written sources have been cited, then;
(a) Their words have been re-written, but the general information attributed to them has been
referenced.
(b) Where their exact words have been used, their writing has been placed inside quotation
marks and referenced.
(v) Where I have reproduced a publication of which I am an author, co-author or editor, I have
indicated in detail which part of the publication was written by myself alone and have fully
referenced such publications.
(vi) This dissertation does not contain text, graphics or tables copied and pasted from the Internet,
unless specifically acknowledged, and the source being detailed in this dissertation and the
references section.
Signed: _______________________ Date: ……. / ……. / 2019
S. Sibanda
Supervisor: _______________________ Date: ……. / ……. / 2019
Prof TS Workneh

v
DECLARATION ON PUBLICATIONS This section outlines the sections in this dissertation that have been presented/submitted to a
conference, and submitted to peer-reviewed international journals for publication. The research
reported is based on the data I collected from the various experiments. I designed the experiments,
collected, analysed the data, and wrote the presentation and the manuscripts. This work was done
under the supervision, guidance and review of my supervisor; Prof TS Workneh. The * indicates
the corresponding author.
Chapter 2
Sibanda, S, Workneh TS and Mugodo, K. 2016. Postharvest storage for fruit and vegetables
appropriate for use by small-scale farmers in South Africa. Oral presentation. Proceedings of an
ASABE Global Initiative Conference entitled Engineering and Technology Innovation for Global
Food Security, Stellenbosch, South Africa (24-27 October 2016).
*Sibanda, S, Workneh, TS and Chiyanzu, I. Potential of production, causes and extents of
postharvest losses and low-cost cooling technology for fruit and vegetable farmers in sub-Saharan
Africa: A review. Submitted to Agricultural Engineering: CIGR Journal.
Chapter 5
Sibanda, S, Workneh TS and Mugodo, K. 2017. Development of a solar battery powered
evaporative cooling system for small-scale farmers. Poster presentation. Proceedings of Third
International Conference on Global Food Security, Cape Town, South Africa, 03-06 December
2017. Book of Abstracts, 16.
Chapter 3
Sibanda, S, Workneh, TS and Manyako, E. 2018. Performance characteristics of a solar powered
photovoltaic system for evaporative cooling of fruit and vegetables. Oral presentation. South
African Institute of Agricultural Engineering Symposium. Meeting the Challenges and Growing
Agricultural Engineering. Durban, 17 – 20 September 2018.

vi
ACKNOWLEDGMENTS I thank my Lord and Saviour Jesus Christ for sustenance and guidance during the course of my
study. Special thanks to my wife Lungile for her support and patience as I spent many time away
from home during data collection and many hours in the office during thesis writing. Not forgetting
my children Busisiwe and Mayibongwe who bore the absence of a father for so long a period.
I want to express sincere gratitude to my supervisor; Prof Tilahun S Workneh for all his input and
guidance throughout this study that helped shape this research project. His insightful suggestions
and critique were instrumental in the preparation of this dissertation.
This work would not have materialised without the financial support of the Agricultural Research
Council of Republic of South Africa through the Economic Competitive Support Package. This
support was critical for the smooth running and completion of this research project.
Gratitude also goes to Messrs. Khuthadzo Mugodo and Erence Manyako for their advice as well
as assistance in the acquisition of experiment materials, laboratory space and instruments. I am
equally grateful to Messrs Alan Hill, Thabo Hlatshwayo and Mr. Khumalo for their invaluable
technical support and advice on the measurement of the electrical properties.
Finally, I thank my friends and fellow postgraduate students Siphiwe Mdlalose and Siyabonga
Gasa for their stimulating discussion, peer review and for all the times they lent a hand in my
research work.

vii
SUPERVISORS’ APPROVAL Subject to the regulations of the School of Engineering, I the supervisors of the candidate, consent to the submission of this dissertation for examination. Supervisor: _______________________ Date: ……. / ……. / 2019
Prof TS Workneh

viii
TABLE OF CONTENTS Page
PREFACE i
ABSTRACT ............................................................................................................................... ii
DECLARATION ON PLAGIARISM ...................................................................................... iv
DECLARATION ON PUBLICATIONS ................................................................................... v
ACKNOWLEDGMENTS ......................................................................................................... vi
SUPERVISORS’ APPROVAL ................................................................................................ vii
TABLE OF CONTENTS ........................................................................................................ viii
LIST OF FIGURES ................................................................................................................. xiii
LIST OF TABLES .................................................................................................................. xvi
LIST OF ABBREVIATIONS AND SYMBOLS.................................................................. xviii
1 INTRODUCTION................................................................................................................... 1
1.1 Introduction to Postharvest Factors and Cooling Technologies .......................... 1
1.2 Summary for the Introduction ............................................................................. 6
1.3 Outline of Dissertation ........................................................................................ 7
1.4 References ......................................................................................................... 10
2 LITERATURE REVIEW ...................................................................................................... 18
2.1 Introduction ....................................................................................................... 18
2.2 Potential of Fruit and Vegetables in SSA .......................................................... 18
2.3 Overview of the Horticultural Industry in SSA ................................................. 21
2.4 Postharvest Losses ............................................................................................. 23
2.5 Causes of Postharvest Losses ............................................................................ 24
2.5.1 Losses during Harvesting and Packaging ........................................................... 26
2.5.2 Losses during on-Farm Storage and Transportation .......................................... 27
2.6 Research into Cold Chain Technologies: Costs and Benefits ........................... 31
2.6.1 Mechanical Refrigeration ................................................................................... 32
2.6.2 Hydro-Cooling ................................................................................................... 32
2.6.3 Vacuum Cooling ................................................................................................ 33
2.6.4 Evaporative Cooling ........................................................................................... 34
2.7 Selection of Suitable Cooling Technology for Different Fruit and Vegetables 36

ix
2.8 Relevance of Evaporative Cooling to SSF in SSA ............................................ 43
2.9 Renewable Energy Use in Postharvest Handling of Fresh Produce .................. 45
2.9.1 Solar Power ........................................................................................................ 46
2.9.2 Wind Energy ...................................................................................................... 47
2.9.3 Relevance of Solar Energy in Cooling of Fresh Produce................................... 48
2.10 Discussions ........................................................................................................ 49
2.11 Conclusions ....................................................................................................... 51
2.12 References ......................................................................................................... 53
3 ASSESSMENT OF SOLAR ENERGY SYSTEM INTEGRATED WITH
INDIRECT AIR COOLING COMBINED WITH DIRECT EVAPORATIVE
COOLING ............................................................................................................................. 75
3.1 Introduction ....................................................................................................... 76
3.2 Materials and Methods ...................................................................................... 78
3.2.1 Design Specifications ......................................................................................... 78
3.2.2 Factors Affecting Performance of the SPV ........................................................ 79
3.2.3 Installation of SPV System ................................................................................ 80
3.2.4 Determination of the Cooling Load ................................................................... 83
3.2.5 Design Load Including Appliances .................................................................... 85
3.2.6 Determination of Bank Capacity ........................................................................ 86
3.2.7 Determination of Charging Battery to Full Capacity ......................................... 86
3.2.8 Design of the Charge Controller ........................................................................ 87
3.2.9 Design of the Inverter ......................................................................................... 88
3.2.10 Solar Panels Specifications ................................................................................ 88
3.2.11 Optimisation of the Number of Modules for the SPV System ........................... 89
3.2.12 Optimisation of Power Output from the Solar Panels ........................................ 90
3.2.13 Performance Evaluation ..................................................................................... 91
3.2.14 Payback Evaluation ............................................................................................ 93
3.3 Results and Discussions .................................................................................... 94
3.3.1 Theoretical Power and Energy ........................................................................... 94
3.3.2 PV Module and Theoretical Power Output ........................................................ 98
3.3.3 Charging and Discharging of the Battery Bank Facility .................................. 103
3.3.4 Performance Evaluation of the Electrical Components of the Design ............. 105

x
3.3.5 Efficiencies of the Designed System ................................................................ 106
3.3.6 Economic Evaluation ....................................................................................... 107
3.4 Conclusion ....................................................................................................... 109
3.5 Reference ......................................................................................................... 111
4 PERFOMANCE OF INDIRECT AIR COOLING COMBINED WITH DIRECT
EVAPORATIVE COOLING SYSTEMS ........................................................................... 118
4.1 Introduction ..................................................................................................... 119
4.2 Materials and Methods .................................................................................... 121
4.2.1 Design Information and Specifications ............................................................ 121
4.2.2 Design Considerations and Specifications for the Cooler ................................ 122
4.2.3 Sizing of the Storage Chamber ......................................................................... 122
4.2.4 Sizing of the Psychrometric Unit ..................................................................... 123
4.2.5 Water Distribution System ............................................................................... 125
4.2.6 Description of the storage chamber and psychrometric unit ............................ 125
4.2.7 Harvesting of Tomatoes and Cooling Times .................................................... 127
4.2.8 Temperature and Relative Humidity Measurements ........................................ 129
4.2.9 Cooling Efficiency ........................................................................................... 130
4.2.10 Data Collection ................................................................................................. 131
4.3 Results and Discussions .................................................................................. 131
4.3.1 Cooling Time of Tomatoes Loaded at Ambient Temperature ......................... 131
4.3.2 Variation of Temperature ................................................................................. 133
4.3.3 Variation of Relative Humidity ........................................................................ 138
4.3.4 Cooling Efficiency ........................................................................................... 142
4.4 Conclusions ..................................................................................................... 144
4.5 References ....................................................................................................... 147
5 EFFECTS OF INDIRECT AIR COOLING COMBINED WITH DIRECT
EVAPORATIVE COOLING ON THE QUALITY OF STORED TOMATO FRUIT
155
5.1 Introduction ..................................................................................................... 156
5.2 Materials and Methods .................................................................................... 158
5.2.1 Design Information and Specifications ............................................................ 158
5.2.2 Description of IAC+EC system........................................................................ 158
xi
5.2.3 Performance Assessment .................................................................................. 159
5.2.4 Sample Preparation .......................................................................................... 160
5.2.5 Research Methodology ..................................................................................... 160
5.2.6 Physical Properties ........................................................................................... 162
5.2.7 Chemical Properties ......................................................................................... 163
5.2.8 Percentage Marketability .................................................................................. 164
5.2.9 Data Collection and Analysis ........................................................................... 164
5.3 Results and Discussions .................................................................................. 165
5.3.1 Tomato Firmness .............................................................................................. 165
5.3.2 Colour ............................................................................................................... 168
5.3.3 Total Soluble Solids Content ............................................................................ 170
5.3.4 Physiological Weight Loss ............................................................................... 173
5.3.5 Marketability .................................................................................................... 175
5.4 Conclusion ....................................................................................................... 177
5.5 References ....................................................................................................... 179
6 GENERAL DISCUSSIONS, CONCLUSIONS AND RECOMMENDATIONS .............. 189
6.1 General discussions ......................................................................................... 189
6.2 Conclusions ..................................................................................................... 193
6.3 Recommendations for Future Research........................................................... 195
6.4 Practical Relevance of the Research Study ..................................................... 196
7 APPENDICEES .................................................................................................................. 198
7.1 APPENDIX 7.1: Drawings and images of the IAC+EC system ..................... 198
7.2 APPENDIX 7.2: Day of the year and angles of elevation and declination ..... 200
7.3 APPENDIX 7.3: Solar radiation at various tilt angles .................................... 203
7.4 APPENDIX 7.4 Packing of tomatoes in the chamber ..................................... 207
7.5 APPENDIX 7.5: Cooling loads ....................................................................... 208
7.6 APPENDIX 7.6: Determination of ventilation rate and fan selection............. 216
7.7 APPENDIX 7.7: Evaporative cooling pads design ......................................... 217
7.8 APPENDIX 7.8: Determination of head losses and pump selection ............... 219
7.9 APPENDIX 7.9: Primary fan specifications ................................................... 222
7.10 APPENDIX 7.9: Heat exchanger design calculations ..................................... 223

xii

xiii
LIST OF FIGURES Page
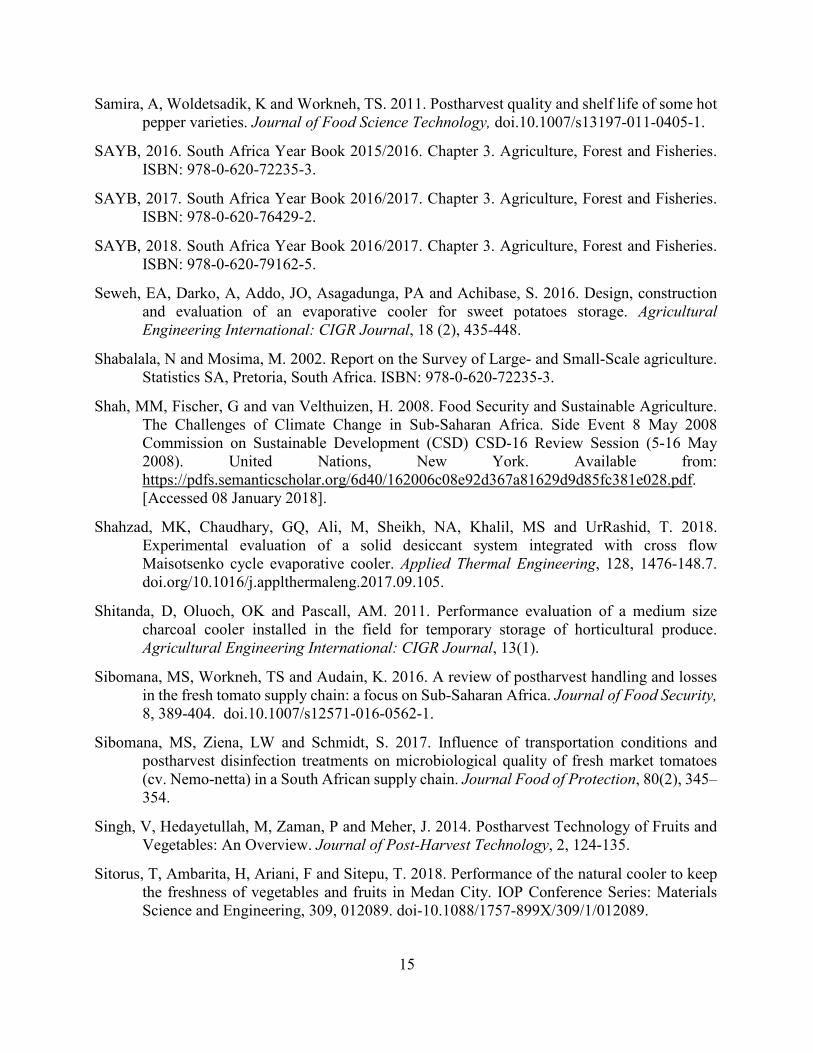
Figure 2.1 The supply value chain in South Africa for fresh produce (adapted from Directorate
Marketing 2013). ......................................................................................................... 20
Figure 2.2 Illustration of evaporative cooling (Adopted from Akton, 2009) ............................... 34
Figure 2.3 Visual observation of tomatoes stored under EC (A) versus tomatoes under ambient
conditions (B) after three weeks. ................................................................................ 35
Figure 3.1 Schematic diagram of the solar energy process flow .................................................. 81
Figure 3.2 Solar Photovoltaic system for the evaporative cooling system ................................... 90
Figure 3.3 Schematic diagram showing points of measurements of current and voltage ............ 93
Figure 3.4 Variation of solar radiation and ambient temperature at Ukulinga research station in
Pietermartitzburg. ........................................................................................................ 98
Figure 3.5 Variation of module power and solar radiation with time for SPV system at Ulukinga
Research Station in Pietermaritzburg. ....................................................................... 100
Figure 3.6 Variation of power output with temperature of the solar panels at Ukulinga Research
Station in Pietermaritzburg. ...................................................................................... 101
Figure 3.7 Charging and discharging curve for SPV battery bank ............................................. 104
Figure 4.1 Storage chamber floor plan showing arrangement of crates ....................................... 123
Figure 4.2 Schematic diagram of the psychrometric unit and the storage chamber .................... 126
Figure 4.3 Position of the data loggers ....................................................................................... 129
Figure 4.4 Cooling time graph for harvested tomatoes in the IAC+EC storage chamber at
Ukulinga .................................................................................................................... 132
Figure 4.5 Average temperature for the sensors over the 11 hottest days at Ukulinga Research
Station in Pietermaritzburg. ...................................................................................... 134

xiv
Figure 4.6 Average temperature per day over the 11 hot days at Ukulinga research station in
Pietermaritzburg. ....................................................................................................... 135
Figure 4.7 The effect of IAC+EC on temperature during daytime at Ukulinga research station in
Pietermaritzburg. ....................................................................................................... 136
Figure 4.8 Variation of relative humidity in the IAC+EC unit and storage chamber at Ukulinga
research station in Pietermaritzburg .......................................................................... 139
Figure 4.9 Average relative humidity per day over the 11 hot days at Ukulinga research station
in Pietermaritzburg. ................................................................................................... 140
Figure 4.10 Average relative humidity per day over the 11 hot days at Ukulinga research station
in Pietermaritzburg. ................................................................................................... 141
Figure 5.1 Schematic diagram of the evaporative cooling unit .................................................. 159
Figure 5.2 Experimental design .................................................................................................. 161
Figure 5.3. Tomato firmness under ambient conditions and IAC+EC ........................................ 165
Figure 5.4. Storage condition x storage period ............................................................................ 167
Figure 5.5. Maturity stage x storage period ................................................................................. 167
Figure 5.6. Percentage total soluble solids of green and pink harvested tomatoes. ..................... 172
Figure 5.7. Physiological weight loss during storage period ....................................................... 174
Figure 5.8. Percentage marketability of tomatoes during storage period ..................................... 176
Figure 7.1. Drawings for IAC+EC system (a) Temp-RH sensor positions (b) Top View (Front
View) ......................................................................................................................... 199
Figure 7.2. The skeleton of the psychometrics unit tunnel constructed from one heat exchanger
and three direct cooling pads (Pad 1, 2 and 3) (a) structural schematic. .................. 199
Figure 7.3. Pictorial image of the storage chamber in Ukulinga Research Station in
Pietermaritzburg ........................................................................................................ 200

xv
Figure 7.4. Tilting the module to the incoming light (Adopted from Honsberg and Bowden, S.
2016) ......................................................................................................................... 201
Figure 7.5 Performance curve for evaporative cooling fan .......................................................... 217
Figure 7.6 Pump characteristic curves and performance data ...................................................... 222
Figure 7.7 Selection procedure for Lytron heat exchanger .......................................................... 225

xvi
LIST OF TABLES Page
Table 2.1 Vegetable production per (1000 ton) in South Africa and the average prices at major
fresh produce markets for 2010 and 2015 (adopted from DAFF 2016) ..................... 22
Table 2.2 Postharvest losses in fruits and vegetables for selected countries in Sub-Saharan
Africa .......................................................................................................................... 24
Table 2.3 Optimum temperatures and relative humidity of selected vegetables ........................ 29
Table 2.4 Summary of advantages, disadvantages and characteristics of different cooling
technologies. ............................................................................................................... 37
Table 2.5 Properties and costs of selected pre-cooling technologies .......................................... 41
Table 3.1 Formulae used to calculate the cooling load ............................................................... 83
Table 3.2 Electrical characteristic of the solar modules ............................................................. 88
Table 3.3 Summary of solar radiation at different tilt angles (Adopted from Schulze et al.,
1999). .......................................................................................................................... 95
Table 3.4 Probability of exceedance of a monthly solar radiation (Adopted from Schulze et al.,
1999). .......................................................................................................................... 96
Table 3.5 Variation of current and voltage with time of the day, ambient and module
temperature. ............................................................................................................... 102
Table 3.6 Costs associated with establishment of SPV and IAC+EC systems ............................ 108
Table 4.1 Temperature and cooler efficiencies ......................................................................... 143
Table 5.1 Summarised produce quality attributes that were measured ..................................... 160
Table 5.2. Changes in L values and hue angle of tomatoes subjected to treatments of storage
conditions, maturity stages and storage period. ........................................................ 169
Table 5.3. Changes in TSS (%) of tomatoes subjected to treatments of storage conditions, two
maturity stages and storage period. ........................................................................... 171

xvii
Table 7.1 Solar radiation at horizontal tilt angle .......................................................................... 203
Table 7.2 Solar radiation at tilt angle = latitude + 150 ................................................................. 204
Table 7.3 Solar radiation at tilt angle = latitude ........................................................................... 205
Table 7.4 Solar radiation at tilt angle = latitude – 150 .................................................................. 206
Table 7.5 Maximum design cooling load ..................................................................................... 215
Table 7.6 Cooling load at one-third capacity ............................................................................... 215
Table 7.7 Pump head losses ......................................................................................................... 220
Table 7.8 Primary Fan Specifications .......................................................................................... 223
xviii
LIST OF ABBREVIATIONS AND SYMBOLS Abbreviation/Symbol Meaning Page
A Amperes 79
AC Alternating Current 78
AAC Amps of Alternating Current 103
ADC Amps of Direct Current 103
AGRA Africa Agriculture 1
AH Ampere Hour 79
ANOVA Analysis of Variance 129
ARC Agricultural Research Council 127
ASHRAE American Society of Heating, Refrigerating and Air-condition Engineers
3
Cp Specific Heat 81
CV Coefficient of variance 93
DAFF Department of Agriculture, Forestry & Fishiries 18
DC Direct Current 78
DEC Direct Evaporative Cooling 4
EC Evaporative cooling 3
F Perimeter heat loss factor 82
F&V Fruit and vegetables 1
FAO Food and Agriculture Organisation 1
GSES Global Sustainable Energy Solutions 74
LSD Least Significant dDfference 165
h Enthalpy of air in the storage chamber 82
Ha Hectares 19
ha Enthalpy of ambient air 82
HP Horse Power 39
IAC Indirect air cooling 4
IEA International Energy Agency 41

xix
Abbreviation/Symbol Meaning Page
IPAP Industrial Policy Action Plan 73
IRENA International Renewable Energy Agency 42
Isc Short Circuit Current 72
kWh Kilowatt Hour 5
ma Mass of air entering the chamber 82
MJ Mega Joules 49
MT Metric Tonne 38
mw Mass of water condensing in the chamber 82
NDP National Dvelopment Policy 73
OECD Organisation for Economic Cooperation Development 19
P Storage chamber perimeter 82
Pa Air-change load 82
PHL Postharvest Losses 1
PMB Pietermaritzburg 75
PV Photovoltaic 72
PWL Physiological weight loss 151
Q Heat (kJ.Kg-1) 81
R Rand 22
RH Relative humidity 1
SAWS South African Weather Services 127
SAYB South African Year Book 1
SPV Solar Photo Voltaic 43
SSF Small-Scale Farmers/Farming 1
SSA Sub-Saharan Africa 1
STC Standard Test Condition 79
T Temperature 82
TSS Total Soluble Sugars 152
UNDP United Nations Development Programme 20

xx
Abbreviation/Symbol Meaning Page
USA United States of America 38
USD United States Dollars 40
US$ United States Dollars 40
VAC Volts of Alternating Current 102
V Volts/Voltage 79
VDC Volts of Direct Current 72
Voc Open Circuit Voltage 72
W Watts 36
Ƞ Efficiency 84

1
1 INTRODUCTION
1.1 Introduction to Postharvest Factors and Cooling Technologies Agriculture is the mainstay of Sub-Saharan African (SSA) economies with about 80% of the
population directly or indirectly dependent on agriculture for employment and livelihood (Shah et
al., 2008; AGRA, 2017; Taylor, 2017). Commercial agriculture in South Africa contributes 2.5%
to the gross domestic product and another 12% through value addition from related manufacturing
and processing and 7% to formal employment (SAYB, 2017). The crops grown in tropical and sub-
tropical climates of SSA include field and horticultural crops.
Small-scale farmers (SSF) have an increased interest in the production of fresh produce because of
a shift in consumer demand to fruit and vegetables (F&V) and higher returns (Njaya, 2014; Pereira,
2014; Miller et al., 2017). South Africa’s F&V export prices and quantities have increased
tremendously and continue to maintain an upward trend since 2010 and contributing R76 967
million by the 2017/18 farming season (SAYB, 2018). Statistics in South Africa indicate that fresh
produce like tomatoes and onions have the highest annual yield quantity of 560 418 t, 689 777 t
respectively (Shabalala and Mosima, 2002; SAYB, 2016; SAYB, 2017). The downward side of
fresh produce production in SSA is the huge postharvest losses (PHL), which can be as high as 30-
50% (Kitinoja et al., 2011; van Gogh et al., 2013; FAO, 2014; Victor, 2014; Affognon et al., 2015).
In countries like South Africa, PHL are estimated at 30-50% for F&V depending on commodity
(Mashau et al., 2012). For example, losses in tomatoes are 10-30% of the total production (Etebu
et al., 2013; Sibomana et al., 2016). The sustainable development goal (SDG 12.3) requires that
by 2030 countries should halve per capita global food waste at the retail and consumer levels and
reduce food losses along production and supply chains, including PHL. Therefore, research on
postharvest interventions through development of innovative technologies that reduce PHL in SSA
are a priority (Kitinoja et al., 2011; Stathers, 2017).
SSF in SSA could potentially produce 80% of the F&V if the PHL experienced before the fresh
produce reaches the consumer were mitigated (Murthy, 2009; Arah et al., 2015). Reducing PHL of
fresh produce as sustainable way of growing the horticultural industry in SSA involves the
development of technologies for manipulation of storage environmental factors of temperature and

2
relative humidity (RH) (Thompson et al., 2002; Alamu et al., 2010; Awole et al., 2011; Azene et
al., 2011; Arah et al., 2015; Misra and Ghosh, 2018). Decreasing temperature and increasing RH
helps maintain high quality in fresh produce by providing optimal storage conditions that delay the
onset of ripening and senescence (Yahia, 2002; Kader, 2003; Perez et al., 2004; Workneh and
Woldetsadik 2004; Mashau et al., 2012; Pereira, 2014; Chijioke, 2017; Sibomana et al., 2017).
Fresh produce has high moisture content which makesF&V liable to spoilage and as living entities
continue to transpire, respire and further ripen after harvest (Wills et al., 1989; Workneh, 2010;
Seweh et al, 2016; Gupta and Dubey, 2018; Sitorus et al., 2018).
When temperature is too low and RH is too high, fresh produce can suffer from chilling injury or
the proliferation of microorganisms (Maftoonazad and Ramaswamy, 2008; Okanlawon and
Olorunnisola, 2017). When the converse occurs, promotion of excessive water loss from produce
occurs, firmness reduces and an undesirable shriveling appears (Paull, 1999; Singh et al., 2014).
To avoid these two scenarios, immediate cooling of F&V is required after harvest especially when
harvesting fresh produce at high temperatures or at an advanced stage of maturity (Rudnick and
Nowak, 1990; Paull, 1999; Brosnan and Sun, 2001; Gupta and Dubey, 2018). Cooling of fresh
produce allows for market rescheduling and improves the export conditions by allowing continuous
supply of quality product during off-season (Chopra et al., 2003; Jain, 2007; Nunes, et al., 2009;
Paul et al., 2010; Shitanda et al., 2011; Okanlawon and Olorunnisola, 2017).
Sub-optimal environmental conditions during temporary storage and transportation are prevalent
for SSF in SSA because of unavailability of cooling facilities (Jain, 2007; Etebu et al., 2013;
Sibomana et al., 2016; Cherono et al., 2018). Because of lack of investment in postharvest
infrastructure SSF are compelled to immediately sale their fresh produce in some instances at
distressed prices to the local market soon after harvest to avoid any spoilage (Kebede, 1991; Verna
and Josh, 2000; Rayaguru et al., 2010; Obura et al., 2015; Cherono and Workneh, 2018). None
ownership of cooling facilities relates to the fact that SSF in SSA own land holdings which are no
more than 1.5 ha resulting in smaller output that does not justify investment in capital-intensive
postharvest technological interventions (Makeham and Malcolm, 1986; Du Plessis et al., 2002;
Backeberg, 2006; Denison and Manona, 2007; Seweh et al., 2016).
There is a need to search for appropriate methods for SSF to reduce PHL during temporary storage
and transportation so that the produce can reach better-priced markets at relatively suitable

3
environmental conditions (Wills et al., 1998; Mandal et al., 2010; Gustavsson et al., 2011; Seweh
et al., 2016). Modern cooling technologies such as mechanical refrigeration, forced air cooling,
hydro-cooling and vacuum cooling can be utilised to reduce the temperature of the micro-
environment of F&V to between -1 and 13℃ (Thompson et al., 2002; Paull and Duarte, 2011;
Yahia, 2011). These modern cooling technologies are utilised in developed countries to extend
shelf life and to minimise PHL (Tefera et al., 2007; ASHRAE, 2011; Ambaw et al., 2013;
Sibomana et al., 2016). However, the capital cost involved, expertise of operation required, energy
requirements to operate modern cooling technologies are a serious constraint for SSF in SSA
making unfeasible their adoption (Roy and Pal, 1994; Samira et al., 2011; Seweh et al., 2016).
Some SSF in SSA are located in remote rural areas with no access to grid electricity in contrast to
large-scale commercial farmers that have economies of scale, financial muscle and access to grid
electricity (Backeberg, 2006; Kim and Ferreira, 2008; Korir et al., 2017). Studies have revealed
that conventional electric-powered mechanical cooling systems could not be of much use in rural
areas of SSA because of non-availability of energy sources (Jain 2007; Tefera et al., 2007; Kim
and Ferreira, 2008; Basediya et al., 2013; Korir et al., 2017). This, therefore, renders it difficult to
install and operate mechanical modern-day cooling technologies for SSF; implying alternative low-
cost cooling systems need to be sought (Workneh and Woldetsadik, 2004; Okanlawon and
Olorunnisola, 2017). Therefore, the focus of this study ensures use of low-cost cooling technologies
with no or less energy demand in the preservation of fresh produce for extended periods in a
marketable state (Quick, 1998; Prusky, 2011; Basediya et al., 2013; Manaf et al., 2018).
Evaporative cooling systems (EC) could be the solution to SSF challenges of PHL as a short to
medium term storage facility of F&V. It is reliable, efficient and economical for temperature
reduction and increasing RH (Jha and Chopra, 2006; Vala et al., 2014), is a tried and tested method
(Odesola and Onyebuchi, 2009; Liberty et al., 2013), is environmentally friendly (Camargo, 2007;
Okanlawon and Olorunnisola, 2017) and does not require special skills to operate (Vala et al.,
2014; Chijioke, 2017). EC is an appropriate low-cost cooling system; has a potential energy saving
of 75% compared to mechanical refrigeration; and can be assembled from local available material
in South Africa or any country (Datta et al., 1987; Jain, 2007; Odesola and Onyebuchi, 2009;
Deoraj et al., 2015; Yahaya and Akande, 2018). Therefore, evaporative cooling (EC) can address
PHL in fresh produce suffered by SSF in SSA if affordable energy sources can be accessed to

4
power the cooling system can be utilised. Understanding the performance of EC in controlling the
microenvironment is critical for its characterization as a low-cost cooling technology with potential
utilization at a commercial scale.
EC is a physical phenomenon where evaporation of a liquid, into surrounding air, cools an object
or a liquid with which it is in contact (Kitinoja and Thompson, 2010; Workneh, 2010; Olosunde et
al., 2016). Evaporation of water produces a considerable cooling effect and the faster the
evaporation the greater is the cooling (Basediya et al., 2013; Shahzad et al., 2018). The results of
the research done to date demonstrates that EC can reduce temperatures below ambient with a depression
reaching 12℃ and RH above 90% and thus showing potential for preservation of fresh produce (Tolesa and
Workneh, 2017). Two types of EC methods exist, direct evaporative cooling (EC) and indirect air-
cooling (IAC). In IAC, the air first passes through the heat exchanger as opposed to passing straight
to the humidifier as is the case with direct EC (Chaudhari et al., 2015; Gómez-Castro et al., 2018).
EC system adds moisture to the cool air and is effective in hot and dry conditions of arid or semi-
arid climates like in SSA (Thompson et al., 2002; Samira et al., 2011; Xuan et al., 2012; Hao et
al., 2013; Chijioke, 2017; Fong and Lee, 2018). Most of the work done to date on EC in SSA are
prototypes and has been limited to testing the technology on cooling small quantities of produce
(Ndukwu and Manuwa, 2014; Yahaya and Akande, 2018). The research work on EC in developed
countries and Asia has focused on cooling buildings (comfort cooling) and most research
publications are from temperate regions that markedly differ from tropical climates found in SSA
(Manuwa and Odey, 2012; Yahaya and Akande, 2018). EC is ideally for hot and dry conditions
and cannot be applied in hot and sub-humid to humid areas. Therefore, its use has been limited to
conditions in which it is applicable. In SSA work on EC has been limited to West Africa, North
Africa and East Africa with little or no work done in Southern Africa (Anyanwu, 2004; Ahmed et al., 2011;
Samira et al., 2011; Ndukwu et al., 2013). Performance of EC varies with agro-climatic conditions
(regions) as evidenced by a report by Thipe et al. (2017) and therefore, performance of EC with a focus in
Southern Africa needs investigation. Further, the studies done to date have been with miniature
structures of less than 0.2 tonnes that do not mimic the SSF conditions in SSA where up to 4 tonnes
storage chamber might needed (Mashau et al., 2012; Ndukwu and Manuwa, 2014). Because of
requirements of high temperature and low RH, EC has limitations in humid conditions and
therefore, there is a need to seek an alternative for such conditions. IAC as a principle has been

5
proposed by researchers working on green-houses and this potentially can be extended to
preservation of F&V.
IAC system sensible cools the air without any moisture addition and the expectation is it should
work better in hot and humid regions if coupled with EC (Kapilan et al., 2016). The literature
review by Misra and Ghosh (2018) showed that IAC alone had not been applied in a greenhouse
and it has not been used for cooling the microenvironment in storage of fresh produce under
practical conditions. There is no literature on IAC coupled with EC i.e. IAC+EC for the
preservation of F&V; many of the work on this technology are for comfort cooling, production
process in metallurgical shops, cooling automobile engines and tractor cabins (Ndukwu and
Manuwa, 2014). There is currently dearth of information on the performance of IAC+EC for the
preservation of F&V and this study proposes that it be investigated. This potentially, provides an
opportunity to develop and characterise an IAC+EC for hot and sub-humid to humid conditions
that are subject to high temperature and RH prevalent in coastal areas of SSA, which is innovation
in terms of developing cooling facilities for fresh produce. The review by Manaf et al. (2018)
identified IAC+EC as an encouraging system, yet research into its use is still at an initial stage and
needs further investigation. Manaf et al. (2018) also alluded that IAC+EC have high potential for
use in hot and humid weather.
As a cheap and convenient key measure to decreasing the deterioration of fresh produce, IAC +
EC integrated with alternative sources of energy other than grid, electricity would be critical in
reducing energy consumption during the cooling process as alluded to by Mahmood et al. (2016).
Possible options are the clean energy sources like solar energy that have no pressure of concerns
on global warming with significant carbon emissions (James and James, 2011). Misra and Ghosh
(2018) in their recommendations for further research on EC allude to the application of renewable
energy (solar and geothermal) for IAC+EC. From the literature available, there is no evidence of
background work in SSA of application of renewable energy as a power source for IAC+EC. Since
the majority of areas in SSA, receive an average of 5.5 kWh.m-2 of solar irradiation then it implies
that the use of solar energy is feasible (Fluri, 2009). The research gap in SA is that there is limited
investigation on SSF producing F&V research, development and performance characterization on
utilisation of solar energy and IAC+EC of fresh produce. This could assist in improving the
marketability of F&V.

6
1.2 Summary for the Introduction F&V production in the sub-tropical regions occur where the air is dry and warm and fresh produce
has high moisture content (Sitorus et al., 2018). Such environmental conditions result in SSF in
SSA experiencing high PHL. There is therefore, a need to ensure a significant percentage of this
production does not spoil through sub-optimal environment but reaches both the domestic and
international market in a palatable state. High air temperature and low RH negatively affects the
physiologically state of F&V. Optimum storage conditions are key and to maintain fruit quality
during storage and transportation. Studies need to be conducted to develop low cost appropriate
cooling technologies that ensure optimal conditions are maintained inside storage containers
especially for use by SSF. Mechanical refrigeration already exists but is expensive and has high-
energy demands and hence the need to develop technologies that have low energy requirements
(Okanlawon and Olorunnisola, 2017).
It is therefore necessary to develop and test a simple low energy input technology powered by solar
energy, appropriate, in-expensive cooling method like EC to attain optimum storage conditions for
F&V. EC is well researched and documented and is applicable in dry and hot conditions but has
functional limitations in hot and humid conditions. For EC to be extended to hot and humid areas
IAC has to be combined with EC. Literature shows that a lot of work relating to IAC+EC is yet to
be done. More scope of further research remains, to characterise IAC+EC in hot and sub-humid to
humid tropics. The design specifications of the energy source of IAC+EC system will introduce
fans for ventilation and water pump for water reticulation and an indirect heat exchanger to increase
efficacy of the cooling system. Introduction of air and water circulation systems will require
determination of storage size, sizing of the psychrometric unit and water reticulation and ventilation
systems. Hence, this study was devoted to characterization and performance evaluation of a solar
photovoltaic IAC+EC in terms of microenvironment temperature reduction and increasing RH in
the storage chamber towards the optimal recommended storage conditions. The study evaluated
the influence of the low-cost IAC+EC storage system on the tomato fruit in coastal areas with a
sub-humid to humid climate and compared temperature and RH variations within the cooling unit,
storage chamber and ambient air conditions. The overall aim of this study was to to design,
construct and evaluate the performance of a solar powered IAC+EC unit; to evaluate the changes
in the quality of IAC+EC stored tomatoes under sub-humid to humid conditions.

7
The specific objectives of this study were to:
1. To develop and evaluate a solar energy powered IAC+EC system for storage of tomato
fruit.
2. To evaluate the performance of IAC+EC in terms of cooling efficiency, an increase in RH
and a decrease in temperature under hot and sub-humid conditions.
3. To assess the physical, chemical and quality changes of tomato fruit stored in the IAC+EC
system compared to ambient conditions.
1.3 Outline of Dissertation This dissertation is organised into six chapters.
Chapter 1 Provides a general overview of the study detailing its justification and the
objectives. The chapter discusses challenges faced by small-scale farmers in
preservation of fresh produce after harvest. Evaporative cooling is identified as an
ideally cooling method for small-scale farmers with no capital to invest in expensive
systems that also require intensive energy supply. Evaporative cooling has been
limited to dry and arid areas and its efficacy in sub-humid to humid areas need to
be investigated. In hot and humid areas, indirect air-cooling is required in
combination with evaporative cooling. Indirect air-cooling coupled with
evaporative has not been well investigated. Therefore, this study proposes
characterisation of indirect air-cooling coupled with evaporative for fruit and
vegetables storage in hot and sub-humid to humid regions.
Chapter 2 Details an overview of the horticultural industry and its challenges. It reviews the
factors influencing the shelf life of fruit and vegetables. It discusses the factors
affecting postharvest losses in fruit and vegetables. This chapter considers available
modern-day cooling technologies and their inherent challenges as to why small-
scale farmers cannot adopt them and finally presents fresh produce cooling options
for small-scale farmers. The chapter considers evaporative cooling as an option for
fresh produce storage and further considers combination of indirect air-cooling and
evaporative cooling. Indirect air-cooling coupled with evaporative cooling is

8
identified as an option for hot and sub-humid to humid areas requiring extensive
investigation as it provides a potential of high thermal performance. The chapter
concludes by considering renewable energy options available to power indirect air-
cooling with evaporative cooling options for remote and scattered farmers that
cannot be connected to the national greed.
Chapter 3 Focuses on development of a solar photovoltaic array system powering an indirect
air-cooling in combination with evaporative cooling system for fresh produce. The
chapter considers the design requirements to set up a solar photovoltaic system for
indirect air-cooling, cooling load and energy requirements for electrical appliances
like water pump and fans, battery bank capacity and sizing and optimisation of solar
modules, charge controller and inverter. The chapter evaluates the performance of
the solar photovoltaic system, determines and compares the theoretical power
output to the actual power output. Variation of current and voltage with time of the
day and ambient and module temperatures are considered. The chapter provides
information on the charging and discharging curves of the bank facility. The chapter
concludes by looking at the systems efficiencies and the economic evaluation of the
solar photovoltaic system.
Chapter 4 This chapter overall investigated the performance of a combination indirect air
cooling with evaporative cooling system in temperature reduction and RH increase
in the storage for provision of optimal storage conditions for fruit and vegetables.
The theoretical design of the system was derived from the design considerations
that sized the storage chamber and cooling unit, cooling pad size and design, sizing
and selection of water pump, determination of cooling load and the ventilation rate,
sizing of fan. The chapter compares the results obtained in this study for indirect
air-cooling combined with evaporative cooling under sub-humid conditions with
results from literature of evaporative cooling systems in dry and arid conditions.
The chapter concludes by providing evidence that indirect air-cooling is effective
in areas with high humidity.
Chapter 5 Presents the effect on indirect air-cooling combined with evaporative cooling on the
physical, chemical and sensory properties of tomatoes. The effects of this system
9
on the quality of stored tomatoes are evaluated. The influence of storage
environment on different factors, such as the fruit maturity stage, the storage period
and storage conditions were investigated on tomato fruit quality during summer in
KwaZulu-Natal, South Africa. The chapter compares the physical, chemical and
sensory fresh produce results obtained in this study under sub-humid conditions
with results from literature of evaporative cooling systems in dry and arid conditions
of similar produce.
Chapter 6 This is the conclusion and recommendation chapter of this study. It highlights the
major findings of this work and makes recommendations arising from the study.

10
1.4 References Affognon, H, Mutungi, C, Sanginga, P and Borgemeister, C. 2015. Unpacking postharvest losses
in Sub-Saharan Africa: A Meta-Analysis. World development, 66, 49-68. doi.org/10.1016/j.worlddev.2014.08.002
AGRA. 2017. Africa Agriculture Status Report: The business of smallholder agriculture in Sub-Saharan Africa. Nairobi, Kenya: Alliance for a green revolution (AGRA). Issue No. 5. ISSN: 2313-5387.
Ahmed, EM, Abaas, O, Ahmed, M and Ismail, MR. 2011. Performance evaluation of three types of local evaporative cooling pads in greenhouses in Sudan. Saudi Journal of Biological Sciences, 18, 45-51.
Alamu, OJ, Nwaokocha, CN and Adunola, O. 2010. Design and Construction of a domestic passive solar food dryer. Leornado Journal of Sciences, 16, 71-82.
Ambaw, A, Verboven, P, Defraeye, T, Tijskens, E, Schenk, A, Opara, UL and Nicolai, BM. 2013. Effect of box materials on the distribution of 1-MCP gas during cold storage: A CFD study. Journal of Food Engineering, 119, 150-158.
Anyanwu, EE. 2004. Design and measured performance of a porous evaporative cooler for preservation of fruits and vegetables. Energy Conversion and Management, 45, 2187-2195.
Arah, IK, Amaglo, H, Kumah, EK and Ofori, H. 2015. Preharvest and Postharvest Factors Affecting the Quality and Shelf Life of Harvested Tomatoes: A mini review. International Journal of Agronomy. doi.org/10.1155/2015/478041.
ASHRAE. 2011. ASHRAE/USGBC/IES standard 189.1-2011. Standard for the design of high-performance green buildings. American Society of Heating, Refrigerating and Air Conditioning Engineers. Inc., Atlanta, GA.
Awole, S, Woldetsadik, K and Workneh, TS. 2011. Yield and storability of green fruits from hot pepper cultivars (Capsicum spp.). African Journal of Biotechnology, 10(59), 12662-12670.
Azene, W, Workneh TS and Woldestadik, K. 2011. Effect of packaging materials and storage environment on postharvest quality of papaya fruit. Journal of Food Science and Technology, doi.10.1007/s13197-011-0607-6.
Backeberg, GR. 2006. Reform of user charges, marketing and management of water: problem or opportunity for irrigated agriculture? Irrigation and Drainage, 55(1), 1-12.
Basediya, AL, Samuel, DVK and Beera, V. 2013. Evaporative cooling system for storage of fruits and vegetables – a review. Food Science Technology, 50(3), 429-442. doi.10.1007/s13197-011-0311-6.
Brosnan, T and Sun, DW. 2001. Precooling techniques and applications for horticultural products – a review. International Journal of Refrigeration, 24(2), 154-170.
Camargo, JR. 2007. Evaporative cooling: water for thermal comfort. An interdisciplinary. Applied Science, 3, 51-61.
11
Chaudhari, BC, Sonawane, TR, Patil, SM and Dube, A. 2015. A review on evaporative cooling technology. International Journal of Research in Advent Technology, 3(2), 88-96.
Cherono, K and Workneh, TS. 2018. A review of the role of transportation on the quality changes of fresh tomatoes and their management in South Africa and other emerging markets. International Food Research Journal, 25(6), 2211-2228.
Cherono, K, Sibomana, M and Workneh, TS. 2018. Effect of infield handling conditions and time to pre-cooling on the shelf-life and quality of tomatoes. Brazilian Journal of Food Technology. doi.org/10.1590/1981-6723.01617. ISSN: 1981-6723.
Chijioke, OV. 2017. Review of evaporative cooling systems. Greener Journal of Science, Engineering and Technological Research, 7(1), 1-20. ISSN: 2276-7835
Chopra, S, Baboo, B, Aleskha, Kudo, SK and Oberoi, HS. 2003. An effective on farm storage structure for tomatoes. Proceedings of International Seminar on Downsizing Technology for Rural Development, 591-598. RRL, Bhubaneswar, Orissa, India. October 7-9.
Datta, S, Sahgal, PN, Subrahmaniyam, S, Dhingra, SC and Kishore, VVN. 1987. Design and operating characteristics of evaporative cooling systems. International Journal Refrigeration, 10(4), 205-208.
Denison, J and Manona, S. 2007. Principles, approaches and guidelines for the participatory revitalisation of smallholder irrigation schemes: Volume 2: concepts and cases. WRC Report No. TT 309/07. Gezina, Pretoria, South Africa.
Deoraj, S, Ekwue, EI and Birch, R. 2015. An evaporative cooler for storage of fresh fruits and vegetables. West Indian Journal of Engineering, 38(1), 86-95.
Du Plessis, FJ, Van Der Stoep, I and Van Averbeke, W. 2002. Micro-irrigation for smallholders; guidelines for funders, planners, designers and support staff in South Africa. WRC Report No. TT 164/01. Gezina, Pretoria, South Africa.
Etebu, E, Nwauzoma, A and Bawo, D. 2013. Postharvest Spoilage of Tomato (Lycopersicon esculentum Mill.) and Control Strategies in Nigeria. Journal of Biology, Agriculture and Healthcare, 3, 51-61.
FAO. 2014. IFAD 2012. The state of food insecurity in the world 2012: Economic growth is necessary but not sufficient to accelerate reduction of hunger and malnutrition. FAO, Rome, Italy.
Fluri, 2009. TP. The potential of concentrating solar power in South Africa. Energy Policy, 37, 5075-5080.
Fong, KF and Lee, CK. 2018. New perspectives in solid desiccant cooling for hot and humid regions. Energy and Buildings, 158, 1152-1160.
Gómez-Castro, FM, Schneider, D, Päßler, T and Eicker, U. 2018. Review of indirect and direct solar thermal regeneration for liquid desiccant systems. Renewable and Sustainable Energy Reviews, 82(1), 545-575. doi.org/10.1016/j.rser.2017.09.053.

12
Gupta, J and Dubey, RK. 2018. Factors Affecting Post-Harvest Life of Flower Crops: A review. International Journal of Current Microbiology and Applied Sciences, 7(1), 548-557. doi.org/10.20546/ijcmas.2018.701.065.
Gustavsson, J, Cederberg, C, Sonesson, U, van Otterdijk, R and Meybeck, A. 2011. Global food losses and food waste: extent causes and prevention. Food and Agriculture Organization of the United Nations. International congress Save Food! International packaging industry fair Interpack2011, Dusseldorf, Germany.
Hao, XL, Zhu, CZ, Lin, YL, Wang, HQ, Zhang, GQ and Chen, YM. 2013. Optimizing the pad thickness of evaporative air-cooled chiller for maximum energy saving. Energy and Buildings, 61, 146-152.
Jain, D. 2007. Development and testing of two-stage evaporative cooler. Building and Environment, 42, 2549-2554.
James, SJ and James, C. 2011. Improving energy efficiency within the food cold chain. 11th International Congress on Engineering and Food (ICEF), Athens, Greece, 22-26 May 2011.
Jha, SN and Chopra, S. 2006. Selection of bricks and cooling pad for construction of evaporatively cooled storage structure. Journal of Institute of Engineers (I) (AG), 87, 25-28.
Kader, AA. 2003. A perspective on postharvest horticulture (1978-2003). HortScience, 38, 1004-1008.
Kapilan, N, Manjunath, GM and Manjunath, HN. 2016. Computational Fluid Dynamics Analysis of an Evaporative Cooling System. Strojnícky casopis–Journal of Mechanical Engineering, 66, 117-124.
Kebede, E. 1991. Processing of horticultural produce in Ethiopia. Acta Horticulturae, 270, 298-301.
Kim, DS and Ferreira, CAI. 2008. Solar refrigeration options – a state of the art review. International Journal of Refrigeration, 31, 3-15.
Kitinoja, L and Thompson, JF. 2010. Pre-cooling systems for small-scale farmers. Stewart Postharvest Review. doi.10.2212/spr.2010.2.2.
Kitinoja, L, Saran, S, Roy, SK and Kader, AA. 2011. Postharvest technology for developing countries: challenges and opportunities in research, outreach and advocacy. Science Food Agriculture, 91, 597-603.
Korir, MK, Mutwiwa, UN, Kituu, GM and Sila, DN. 2017. Effect of near infrared reflection and evaporative cooling on quality of mangoes. Agricultural Engineering International: CIGR Journal, 19(1), 162–168.
Liberty, JT, Ugwuishiwu, BO, Pukuma, SA and ODO, CE. 2013. Principles and application of evaporative cooling systems for fruits and vegetables preservation. International Journal of Current Engineering and Technology, 3(3), 1000–1006.
Makeham, JP and Malcolm, LR. 1986. The economics of tropical farm management. Cambridge University Press, Cambridge, UK.

13
Maftoonazad, N and Ramaswamy, HS. 2008. Effect of pectin-based coating on the kinetics of quality change associated with stored avocados. Journal of Food Processing and Preservation, 32(4), 621-643.
Mahmood, MH, Sultan, M, Miyazaki, T and Koyama, S. 2016. Desiccant Air-Conditioning System for Storage of Fruits and Vegetables: Pakistan Preview. Joint Journal of Novel Carbon Resource Sciences & Green Asia Strategy, 3, (1), 12-17. doi.10.5109/1657381.
Manaf, IA, Durrani, F and Eftekhari, M. 2018. A review of desiccant evaporative cooling systems in hot and humid climates. Advances Energy Research. doi.10.1080/17512549.2018.1508364.
Mandal G, Dhaliwal, HS, Mahajan, BVC. 2010. Effect of pre-harvest calcium sprays on post-harvest life of winter guava (Psidium guajava L.). Food Science Technology, 474(4), 501-506.
Manuwa, SI and Odey, SO. 2012. Evaluation of pads and geometrical shapes for constructing evaporative cooling system. Modern Applied Science, 6(6), 45-53.
Mashau, ME, Moyane, JN and Jideani, IA. 2012. Assessment of postharvest losses of fruits at Tshakhuma fruit market in Limpopo Province, South Africa. African Journal of Agricultural Research, 7(29), 4145-4150.
Miller, V, Mente, A, Dehghan, M, Rangarajan, S, Zhang, X, Swaminathan, S, Dagenais, G, Gupta, R, Mohan, V, Lear, S, Bangdiwala, SI, Schutte, AE, Wentzel-Viljoen, E, Avezum, A, Altuntas, Y, Yusoff, K, Ismail, N, Peer, N and Mapanga R. 2017. Fruit, vegetable, and legume intake, and cardiovascular disease and deaths in 18 countries (PURE): a prospective cohort study. The Lancet, 390(10107), 2037-2049. doi.org/10.1016/S0140-6736(17)32253-5.
Misra, D and Ghosh, S. 2018. Evaporative cooling technologies for greenhouses: a comprehensive review. Agricultural Engineering International: CIGR Journal, 20(11), 1-14.
Murthy, MVR. 2009. A review of technologies, models and experimental investigations of solar driers. Renewable Energy and Sustainable Energy Reviews, 13, 835-844.
Ndukwu, MC, Manuwa, SI, Olukunle, OJ and Oluwalana, IB. 2013. Development of an active evaporative cooling system for short-term storage of fruits and vegetable in a tropical climate. Agricultural Engineering International: CIGR Journal, 15(4), 307-313.
Ndukwu, MC, and Manuwa, SI. 2014. Review of research and application of evaporative cooling in preservation of fresh produce. International Journal of Agricultural and Biological Engineering, 7(5), 85-102.
Njaya, T. 2014. The economics of fruit and vegetables marketing by smallholder farmers in Murehwa and Mutoko districts in Zimbabwe. International Journal of Research in Humanities and Social Studies, 1(1), 35-43.
Nunes, MCN, Emond, JP, Rauth, M, Dea, S and Chauk, V. 2009. Environmental conditions encountered during typical consumer retail display affect fruit and vegetable quality and waste. Postharvest Biology and Technology, 51(2), 232-241.

14
Obura, JM, Banadda, N, Wanyama, J and Kiggundu, N. 2015. A critical review of selected appropriate traditional evaporative cooling as postharvest technologies in Eastern Africa. Agricultural Engineering International: CIGR Journal, 17(4), 327.
Odesola, IF and Onyebuchi, O. 2009. A Review of Porous Evaporative Cooling for the Preservation of Fruits and Vegetables. The Pacific Journal of Science and Technology, 10(2), 935-941. Available from: https://www.researchgate.net/publication/228406788 [Accessed 09 January 2018].
Okanlawon, SA and Olorunnisola, AO. 2017. Development of passive evaporative cooling systems for tomatoes Part 1: construction material characterization. Agricultural Engineering International: CIGR Journal, 19(1), 178-186.
Olosunde, WA, Aremu, AK and Okoko, P. 2016. Computer simulation of evaporative cooling storage system performance. Agricultural Engineering International: CIGR Journal, 18(4), 280-292.
Paul, V, Pandey, R and Srivastava, GC. 2010. Ripening of tomato (Solar lycopersicum L.) Part II: regulation by its stem scar region. Food Science Technology, 47(5), 527-533.
Paull, RE. 1999. Effect of temperature and relative humidity on fresh commodity quality. Postharvest Biology and Technology, 15(3), 263-277.
Paull, RE and Duarte, O (Eds). 2011. Tropical Fruits, Second edition, CAB International, London. 1-10.
Pereira, CJ. 2014. Understanding fruit and vegetable consumption: A qualitative investigation in Mitchelles Plain sub-district of Cape Town. MSc Thesis. Nutrition dissertation, Faculty of Medicine and Health Sciences, University of Stellenbosch, Stellenbosch, South Africa.
Perez, K, Mercado, J and Soto-Valdez, H. 2004. Note. Effect of Storage Temperature on the Shelf Life of Hass Avocado (Persea americana). Food Science and Technology International, 10(2), 73-77.
Prusky, D. 2011. Reduction of the incidence of postharvest quality losses, and future prospects. Food Security, 3(4), 463-474.
Quick, G. 1998. Trash: a heavy cost to bear. Farmer’s Newsletter, 150, 12-17
Rayaguru, K, Khan, MK and Sahoo, NR. 2010. Water use optimisation in zero energy cool chambers for short-term storage of fruits and vegetables in coastal area. Food Science Technology, 47(4), 437-441.
Roy, SK and Pal, RK. 1994. A low-cost cool chamber: an innovative technology for developing countries. In: Champ, BR, Highley, E and Johnson, GI, eds. Postharvest Handling of Tropical Fruits: ACIAR Proceedings, 393-395. Australian Centre for International Agricultural Research, Australia.
Rudnick, M and Nowak, J. 1990. Postharvest handling and storage of cut flowers, florists, greens and potted plants. Transport, Chapter 4, 29-66. Chapman and Hall, London.
15
Samira, A, Woldetsadik, K and Workneh, TS. 2011. Postharvest quality and shelf life of some hot pepper varieties. Journal of Food Science Technology, doi.10.1007/s13197-011-0405-1.
SAYB, 2016. South Africa Year Book 2015/2016. Chapter 3. Agriculture, Forest and Fisheries. ISBN: 978-0-620-72235-3.
SAYB, 2017. South Africa Year Book 2016/2017. Chapter 3. Agriculture, Forest and Fisheries. ISBN: 978-0-620-76429-2.
SAYB, 2018. South Africa Year Book 2016/2017. Chapter 3. Agriculture, Forest and Fisheries. ISBN: 978-0-620-79162-5.
Seweh, EA, Darko, A, Addo, JO, Asagadunga, PA and Achibase, S. 2016. Design, construction and evaluation of an evaporative cooler for sweet potatoes storage. Agricultural Engineering International: CIGR Journal, 18 (2), 435-448.
Shabalala, N and Mosima, M. 2002. Report on the Survey of Large- and Small-Scale agriculture. Statistics SA, Pretoria, South Africa. ISBN: 978-0-620-72235-3.
Shah, MM, Fischer, G and van Velthuizen, H. 2008. Food Security and Sustainable Agriculture. The Challenges of Climate Change in Sub-Saharan Africa. Side Event 8 May 2008 Commission on Sustainable Development (CSD) CSD-16 Review Session (5-16 May 2008). United Nations, New York. Available from: https://pdfs.semanticscholar.org/6d40/162006c08e92d367a81629d9d85fc381e028.pdf. [Accessed 08 January 2018].
Shahzad, MK, Chaudhary, GQ, Ali, M, Sheikh, NA, Khalil, MS and UrRashid, T. 2018. Experimental evaluation of a solid desiccant system integrated with cross flow Maisotsenko cycle evaporative cooler. Applied Thermal Engineering, 128, 1476-148.7. doi.org/10.1016/j.applthermaleng.2017.09.105.
Shitanda, D, Oluoch, OK and Pascall, AM. 2011. Performance evaluation of a medium size charcoal cooler installed in the field for temporary storage of horticultural produce. Agricultural Engineering International: CIGR Journal, 13(1).
Sibomana, MS, Workneh, TS and Audain, K. 2016. A review of postharvest handling and losses in the fresh tomato supply chain: a focus on Sub-Saharan Africa. Journal of Food Security, 8, 389-404. doi.10.1007/s12571-016-0562-1.
Sibomana, MS, Ziena, LW and Schmidt, S. 2017. Influence of transportation conditions and postharvest disinfection treatments on microbiological quality of fresh market tomatoes (cv. Nemo-netta) in a South African supply chain. Journal Food of Protection, 80(2), 345–354.
Singh, V, Hedayetullah, M, Zaman, P and Meher, J. 2014. Postharvest Technology of Fruits and Vegetables: An Overview. Journal of Post-Harvest Technology, 2, 124-135.
Sitorus, T, Ambarita, H, Ariani, F and Sitepu, T. 2018. Performance of the natural cooler to keep the freshness of vegetables and fruits in Medan City. IOP Conference Series: Materials Science and Engineering, 309, 012089. doi-10.1088/1757-899X/309/1/012089.

16
Stathers, T. 2017. Quantifying postharvest losses in Sub-Saharan Africa with focus on cereals and pulses. [Internet]. Presentation at the Bellagio workshop on Postharvest management 12-14 September 2017. Available from: http://www.fao.org/fileadmin/user_upload/food-loss-reduction/Bellagio/T.Stathers_QuantifyingPHLinSSA.PDF. [Accessed 02 October 2018].
Taylor, T. 2017. Conversable economist. [Internet]. Available from: www.conversableeconomist.blogspot.com/2017/02/agriculture-in-sub-saharan africa.html. [Accessed 23 September 2018].
Tefera, A, Workneh, TS and Woldetsadik, K. 2007. Effects of disinfection, packaging, and storage environment on the shelf life of Mango. Bio-systems Engineering, 96(2), 201-212.
Thipe, EL, Workneh, T, Odindo, A and Laing, M. 2017. Greenhouse technology for agriculture under arid conditions. Sustainable Agriculture Reviews, 22, 37–55.
Thompson, JF, Mitchell, FG, Rumsey, TR, Kasmire RF and Crisoto CC. 2002. Commercial cooling of fruits, vegetables and flowers, Publication No. 21567, 61-68. DANR publication, UC Davis, USA.
Tolesa, GN and Workneh, TS. 2017. Influence of storage environment, maturity stage and pre-storage disinfection treatments on tomato fruit quality during winter in KwaZulu-Natal, South Africa. Journal of Food Science and Technology, 54(10), 3230-3242. doi. 10.1007/s13197-017-2766-6.
Vala, KV, Saiyed, F and Joshi, DC. 2014. Evaporative cooled storage structures: An Indian Scenario. Trends in Post-Harvest Technology, 2(3), 22–32.
van Gogh, JB, Van Der Sluis, AA and Soethoudt, JM. 2013. Feasibility of a network of excellence postharvest food losses: Combining knowledge and competences to reduce food losses in developing and emerging economies. Wageningen UR Food & Biobased Research, Netherland.
Verna, LR and Josh, VK. 2000. Postharvest technology. General concepts and principles. 1: 5-6.
Victor, K. 2014. Postharvest losses and strategies to reduce them. Technical paper on Postharvest losses. Action Contre la Faim (ACF), member of ACF International. 2-25.
Wills, RBH, McGlasson, WB, Graham, D, Tlee, H and Hall, EG. 1989. Postharvest: - An introduction to the physiology and handling of fruit and vegetables, (3rd edition). Van Nostrand Reinhold, New York, USA.
Wills, R, Glasson, M, Graham, D and Joyce, D. 1998. Postharvest: An Introduction to the physiology and handling of fruit, vegetables and ornamentals, (4th edition). University of New South Wales Press, New York, USA.
Workneh, TS and Woldetsadik, K. 2004. Forced ventilation evaporative cooling: A case study on banana, papaya, orange, mandarin, and lemon. Tropical Agriculture, 8(1), 401- 404.
Workneh, TS. 2010. Feasibility and economic evaluation of low-cost evaporative cooling system in fruit and vegetables storage. African Journal of Food Agriculture, Nutrition and Development, 10(8), 2984-2997.

17
Yahaya, S and Akande, K. 2018. Development and Performance Evaluation of Pot-in-pot Cooling Device for Ilorin and its Environ. Journal of Research Information in Civil Engineering, 15(1), 2045-2059.
Yahia, EM. 2002. Avocado. In: ed. Rees, D, Farrell, G and Orchard, J, Crop Postharvest: Science and Technology, Volume 3, Ch. 8, 159-180. Jon Wiley and Sons, Chichester, West Sussex.
Yahia, EM. 2011. Modified and controlled atmospheres for the storage, transportation, and packaging of horticultural commodities, CRC press.
Xuan, YM, Xiao, F, Niu, XF, Huang, X and Wang, SW. 2012. Research and application of evaporative cooling in China: A review (I) - Research. Renewable and Sustainable Energy Reviews, 16, 3535-3546.

18
2 LITERATURE REVIEW
2.1 Introduction The aim of this review is to identify the causes of postharvest losses (PHL) in fruit and vegetables
(F&V) in relation to small-scale farming in sub-Saharan Africa (SSA). The reduction of PHL can
improve food security at household level. Farmers involved in small-scale production of fresh
produce experience high PHL due to physiological deterioration associated with technical,
biological and environmental factors. If these factors could be contained, then sufficient supplies
of fresh produce would reach the consumer thus improving both household income and nutritional
status. This article details the PHL experienced by farmers during harvesting and packaging, on-
farm temporary storage and transportation, and then considers research into cold chain
technologies; their benefits and costs. There are existing and available modern cooling technologies
but these are capital intensive and require electricity, which is not always available to small-scale
farmers (SSF). This review explores several cooling technologies and recommends direct
evaporative cooling (EC) for dry and arid climates and EC combined with indirect air-cooling
(IAC+EC) for hot and sub-humid to humid conditions. Many research studies are required on
IAC+EC for preservation of F&V as there is dearth of performance information. The review also
considers alternative power sources for cooling technologies and their integration with IAC+EC in
a bid to minimise losses experienced by SSF in SSA. Low-cost and adequate cooling technologies
are unavailable to the average SSF. However, there is scope for EC, which is simple and cheaper
technology. Solar and wind energy can be used to power fan, if forced air IAC+EC is required.
2.2 Potential of Fruit and Vegetables in SSA SSA has potential for tropical F&V production, which is further supported by the annual increases
in price and quantities produced in the last five to ten years (Ruel et al., 2005; DAFF, 2017). Two
distinct farming production levels, large-scale commercial agriculture and small-scale farming
characterize the horticultural sector in SSA. In large-scale commercial farming, farmers own large
tracts of land and have the financial capability to invest in irrigation, agricultural inputs, skilled
management, and agricultural infrastructure for crop production including postharvest operations

19
(Schalkwyk et al., 2012). SSF on the other hand on average own land holdings of less than 1.5 ha
and are characterized by low output and very little investment in infrastructure for production
(Baloyi, 2010; Salami et al., 2010; Tscharntke et al., 2015; Rahiel et al., 2018). Despite these
setbacks, SSF contribute approximately 80% of all F&V all fresh produce in SSA including South
Africa (OECD/FAO, 2016; SAYB, 2017). The challenges faced by SSF in SSA according to
Salami et al. (2010), Mpandeli and Maponya (2014) and Arah et al. (2016) relate to:
i. Security of tenure as the land is in most instances state owned;
ii. Limited access to credit because of lack of collateral and/or credit history;
iii. Farmers having to fund agricultural activities from either money generated from off-farm
activities, or remittances from family members from off-farm employment;
iv. Spending on agriculture by most African countries is less than 6% of total expenditure since
1980 and less than 1% of commercial lending goes to agriculture with most of this funding
large-scale commercial farming.
Furthermore, the fact that most SSF are located in remote areas with no access to grid electricity
compounded by poor road infrastructure connecting them to major towns hinders growth and
productivity (Kim and Ferreira, 2008; Korir et al., 2017). SSF in many instances are forced to sale
their produce at the farm gate at depressed prices or to intermediaries that offer them low prices
rendering their enterprises unprofitable (Obura et al., 2015; Seweh et al., 2016).
High PHL in F&V characterise small-scale farming, which reduce the amount of farm fresh
produce for both household consumption and sale (Baloyi, 2010; Kader, 2010; Rahiel et al., 2018).
As a result, the horticultural industry has not been significantly contributing to the economies of
the SSA countries. Appropriate post-harvest technologies for SSF in SSA have not been developed
or adopted for the handling of perishable commodities (Baloyi, 2010; Saran et al., 2012; Kasso and
Bekele, 2018). The unavailability of appropriate postharvest facilities for SSF in South Africa for
packaging, temporary storage and transportation, threatens food security in the country (Cherono
and Workneh, 2018; Rahiel et al., 2018). The traditional peddling of fresh produce at farm gate at
low prices to avoid PHL is not a lasting solution as it ultimately undermines sustenance (Sibomana
et al., 2017). Figure 2.1 shows the supply chain process of fresh produce for SSF and large-scale
growers. SSF harvest their fresh produce and sale directly at farm gate for local consumption or
intermediatories while large scale growers transport harvested fresh produce first for washing and
20
packaging in packing houses before distribution to processing industries and fresh produce markets
(Sibomana et al. 2016)
Figure 2.1 The supply value chain in South Africa for fresh produce (adapted from Directorate Marketing 2013).
Although there are a number of modern cooling technologies developed and imported into the
region, SSF have not been able to adopt and utilise such facilities as they are both capital and
energy intensive (Workneh and Woldetsadik, 2004; Ejeta, 2009; Baloyi, 2010; Rayaguru et al.,
2010; Seweh et al., 2016). The adoption of these cooling technologies, however, has largely relied
on the scale of production (Caleb et al., 2011; Prusky, 2011). For instance, large-scale farmers in
SSA have access to various cooling technologies, thus have maintained their dominance on national
fresh producers’ market (Tigist et al., 2011; Sibomana et al., 2016). Despite the numerous
researches on both production and postharvest handling of commodities in the region, there is less
adoption or application of the research results to solve the post-harvest handling problems under
SSA conditions particularly for small scale farming (Saran et al., 2012). Therefore, to discuss low
cost cooling technologies this review has found it necessary to explore causes mainly related to
postharvest physiology of crops since cooling applies to slowing down respiration and ethylene
production and extent of losses. This will lead to consideration of cooling technologies as a major
WHOLESALE
WHOLESALE-
Export agents
Canning, Sauces,
Paste
Distribution centres
Catering and Hospitality institutions
Local consumption

21
issue of this review. The review also explores alternative renewable energy options available for
possible integration with low-cost technologies to preserve F&V that SSF can access.
2.3 Overview of the Horticultural Industry in SSA Over a thousand species of F&V, consisting of different morphology and composition, are known
to exist within the region (Obura et al., 2015). In excess of 950 million people consume F&V as
food in SSA (Husain et al., 2016). Recently, there has been an expansion in fruit production that
include mangoes, bananas, citrus, avocado, papaya, pineapple, grape, apple, pear, guava and peach.
Another area of high production growth has been in vegetables, that include tomatoes, cabbages,
onions, sweet pepper; French beans, pea, lentil, leek, chilies, okra, garlic, ginger, carrot, turnip,
mushroom, lettuce, spinach and other local leafy vegetables (Ngowi et al., 2007; Banjaw, 2017).
In South Africa most F&V are grown in Limpopo province while most tropical and sub-tropical
fruits are grown in Mpumalanga province (SAYB, 2018). The humid low-lying coastal belt of
KwaZulu-Natal province is suitable for banana production while vegetables like tomatoes,
cauliflower, cabbage, carrots, etc are found in the high-lying areas of the province. The climate of
most of KwaZulu-Natal province is not really suitable for large-scale commercial production of
onions (Katundu et al., 2010; DAFF, 2016).
F&V provide the much-needed nutritional value to the population and a number of countries within
the region heavily rely on this primary commodity for revenue through the bulk export of raw or
processed fresh produce (OECD/FAO, 2016; Cherono and Workneh, 2018). Involvement in
production of F&V is an important source of income for SSF and this sub-sector provides rural
households with job opportunities throughout the value chain. There exist competing needs for
local country consumption and export of fresh produce that needs to be satisfied (Banjaw, 2017).
Moreover, the population in SSA is likely to double by the year 2045, so a more sustainable
approach to preserving fresh produce will be required to meet future food demand (UNDP, 2012).
The increasing population and shifts in consumer demand have resulted in an exponential demand
and price hikes for fresh F&V in SSA (Workneh, 2007; Ntombela, 2012; Pereira, 2014; SAYB,
2015). For example, the demand has seen annual price increases in F&V of 7% in South Africa
(SAYB, 2016) and increased fresh produce production quantities from 2010 to 2015 as shown in

22
Table 2.1. Such a scenario improves farmers’ living conditions including health and income and
improves food security at household level in the villages (Workneh, 2007; Bourne, 2009). An
increasing demand for fresh produce at the right prices is likely to move SSF from subsistence to
commercial scale production (Workneh, 2010).
Table 2.1 Vegetable production per (1000 ton) in South Africa and the average prices at major
fresh produce markets for 2010 and 2015 (adopted from DAFF 2016)
Vegetables production (1000 t)
Average price at major fresh produce market (R/tonne)
2010 2015 2010 2015 Potatoes 1 955 2 423 2 598 3 222 Tomatoes 575 539 4 233 8 310 Pumpkins 234 256 1 737 1 805 Green mealies
339 373 8 260 13 726
Onions 489 675 2 573 2 802 Sweet potatoes
60 63 1 977 3 699
Green peas 17 9 17 960 37 012 Beetroot 67 78 2 763 3 050 Caiuliflower 25 13 3 777 7 752 Cabbage 141 146 2 573 1 963 Carrots 151 201 3 251 2 132 Green Beans
23 25 5 634 1 917
Lettuce - - 3 338 5 950
One of the major challenges constraining rural households from attaining commercial farming
status is the quality deterioration that result in PHL experienced in the production cycle of fresh
produce (Sibomana et al., 2016). It is essential that the quality of fresh produce be maintained
throughout the value chain as quality has a significant relationship with customer satisfaction
(Ngcobo, 2013; Senthikumar et al., 2015). The quality of fresh produce can be maintained
through provision of optimum storage conditions, which varies with crop type and depends on
intended use, the level of quality required for the purpose, distance and time to market (Watkins,
2006; Toivonen, 2007; James and Zikankuba, 2017; Kyriacou and Rouphel, 2018).

23
2.4 Postharvest Losses PHL are the qualitative and quantitave losses in a given produce during harvest or along the value
chain of a post-harvest system. Although a recent report by the World Bank (World Bank, 2011)
indicated that an estimated US$ 4 billion worthy of grains alone is lost through PHL in SSA, the
entire F&V supply chain might be facing similar challenges (Affognon et al., 2015). Since F&V
are categorised as perishable commodities, which are susceptibility to physiological deterioration
in the supply chain (Ngcobo et al., 2012; Pathare et al., 2012; Deoraj et al., 2015; Macheka et al.,
2017). Physiological deterioration is the main root cause of PHL in the tropical and sub-tropical
regions SSA (Macheka et al., 2017). PHL have the potential to discourage farmers venturing into
production and marketing of fresh produce, and thus affecting the availability and consumption of
F&V in urban areas (Workneh, 2007; Azene et al., 2011; Affognon et al., 2015). Efforts to reduce
PHL are paramount, particularly if economically feasible as this is of great significance to farmers
and consumers alike (Johnson and Sangchote, 1994; Saquet et al., 2016; Rahiel et al., 2018).
Reducing PHL, as an important component of food security, has potential to lower food prices to
vulnerable communities in the region (Ogbuagu et al., 2017). In this food-scarce part of the world,
F&V that do not reach the intended market are a significant waste of resources (Ngcobo et al. 2012;
Kasso and Bekele, 2018). A survey carried out by Mashau et al. (2012) in the Tshakuma fruit
market, in Limpopo province of South Africa showed that fresh fruit like bananas, oranges,
avocados, paw-paws and tomatoes, experience deterioration in both quality and quantity of 43.3%
mainly due to over-ripening. This means sellers at this market lose almost half of their potential
income. In the 2011 production of tomatoes the supply chain experienced loss of produce estimated
at 10.2% (US$22.03m) in South Africa, 13.4% (US$180.9m) in Nigeria and 10.1% (US$19.99m)
in Kenya because of inadequate storage or transportation (Sibomana et al., 2017).
PHL in the supply chain of fresh produce in SSA, are difficult to estimate as there is limited official
data from different countries and there is no standard methodology to estimate them (Adeoye et
al., 2009; Affognon et al., 2015; Sibomana et al., 2016; Sheahan and Barrett, 2017). PHL in F&V
in the region are estimated to be over 50% though there are varying estimates from crop to crop
and country to country (Kader, 2005; FAO, 2008; Kader, 2010; Mashau et al., 2012; Deoraj et al.,

24
2015; Niewiara, 2016). Table 2.2 provides examples of estimated percentage PHL for F&V for
selected countries in East Africa, Central Africa, West Africa and Southern Africa.
Table 2.2 Postharvest losses in fruits and vegetables for selected countries in Sub-Saharan
Africa
Sub-region Country Estimated Postharvest Losses
(%)
References
East Africa Ethiopia 50 FAO 2005
Central Africa Rwanda 30-80 depending on product
Kitinoja et al. (2010)
West Africa Ghana 30-80 depending on product
Kitinoja et al. (2010)
Southern Africa
Swaziland 20-50 depending on product
Masarirambi et al. (2010); Mashau et al. (2012)
These high losses shown in the Table 2.2 are a precursor to food insecurity for Sub-Saharan
communities. Small scale farming exporters of F&V in region have complained of PHL
experienced during short periods of storage before (i.e. awaiting transportation) and during
transportation to markets and proposes that reduction of these should be a research priority
(Workneh and Woldetsadik, 2004; Tigist et al., 2011; Kenghe et al., 2017; Sibomana et al., 2016).
2.5 Causes of Postharvest Losses Maintenance of fresh produce quality requires precise application of optimum cold chain
conditions from harvest, grading, packaging, storage and transportation to the consumer (Tanner
and Smale, 2005; Zude, 2009; Sibomana et al., 2016). The optimum fresh produce conditions vary
according to the intended use and the targeted market; either consumption at household level, local
country consumption or export and the distance to the destination (Brosnan and Sun, 2001;
Toivonen, 2007; Sood et al., 2011; Kyriacou and Rouphel, 2018). It is important, therefore, to
understand the correlation between PHL and increased fresh produce prices resultant from a
constraint output market because of spoilage.

25
PHL may occur due to factors like environmental (Mandal et al., 2010; Rayaguru et al., 2010;
Workneh, 2010; Tyagi et al., 2017), biological and chemical, physiological (Joas and Lechaudel,
2008; Tyagi et al., 2017), as well as technical factors (Kader, 2010; Gebru and Belew, 2015). The
main environmental factors that result in significant PHL in F&V are temperature and RH (Getinet
et al., 2008; Workneh and Osthoff, 2010; Prusky, 2011; Misra and Ghosh. 2018). The biological
and chemical factors arise because F&V are prone to microbial contamination during growth,
harvest and postharvest operations (Ambaw et al., 2013a; Kasso and Bekele, 2018). Three main
types of microorganisms that affect quality of fresh produce during transportation and storage are
bacteria, yeast and mould (Alexandre et al., 2011; Marriott et al., 2018).
Physiological deterioration of fresh produce happens since F&V are living tissues that continue to
transpire, respire and further ripen even after detachment from the mother plant during harvesting
(Brosnan and Sun, 2001; Ngcobo et al., 2012; Hagos, 2014; Jedermann et al., 2017; Misra and
Ghosh, 2018). This process continues throughout the life of fresh produce. As the anaerobic process
continues, respiration increases further with more heat generation either inside or outside the fruit
(Irtwange, 2006; Rahiel et al., 2018). This sustained respiration in fresh produce means decreased
food value, associated with loss of flavor, loss of salable weight (through loss of moisture) and
more rapid deterioration (Paull and Duarte, 2011; Ait-Oubahou, 2013; Sitorus et al., 2018).
The technical factors that affect fresh produce quality are mainly associated with mechanical
damage or injury to F&V, lack of skilled labour in handling of fresh commodities and prolonged
storage time (Wilson et al., 1999; Parfitt et al., 2010; Prusky, 2011; Paull and Duarte, 2011;
Beckles, 2012; Gebru and Belew, 2015). Controlling these factors provides improved efficiency
of broader value chains and systems in fresh produce. On the other hand, social factors relate to
trends such as urbanization, where many people from rural areas move to large cities causing a
high demand for F&V in urban centres, thus increasing the need for more efficient supply-chain
systems (Parfitt et al., 2010; Kasso and Bekele, 2018). The critical issue in all this is that, the effects
of the mentioned factors are not receiving the required attention at various control points such as
harvesting, packaging, on-farm temporary storage and transportation to the market resulting in high
PHL in the fresh produce supply chain.

26
2.5.1 Losses during Harvesting and Packaging Harvest-labour especially for SSF should be skilled to know when to harvest the produce, as it is
an essential requirement of industrial postharvest handling (Beckles, 2012; Banjaw, 2017). Fresh
produce should be harvested during the coolest part of the day, either very early in the morning or
late afternoon (Botondi et al., 2003; Bachmann and Earles 2014; Arah et al., 2015; Tyagi et al.,
2017). In developing labour skills, harvesters should be trained in handling the crop carefully to
avoid injury; harvesting dry whenever possible and at proper maturity; handling each produce no
more than is necessary and avoiding careless handling e.g. dropping F&V (Tijskens, 2007; Kitinoja
et al., 2010; Prusky 2011; Mulualem et al., 2015; Cherono et al., 2018). To mitigate losses due to
technical factors of wrong timing of harvest and improper handling during harvesting, farmers must
practice good harvesting practices that will not result in injury to fresh produce (Zenebe et al.,
2015; Sibomana et al., 2016).
van Zeebroeck et al. (2007) and Banjaw (2017) describe mechanical damage as pausing a challenge
to the quality of fresh produce and having a potential to reduce the value of F&V. According to
Basediya et al. (2013), mechanical injury due to impact resultant from dropping or tossing fresh
produce during harvesting can cause splitting of fruit and internal bruising. Impact damage is
detrimental and its effect is not just limited to visual aspects but can also cause a risk of fungal and
bacterial contamination (Aba et al., 2012; Fadiji et al., 2016). Inappropriate packaging or
containers and over or under packaging of containers also can result in mechanical injury to F&V
(Wilson et al., 1999; Aharoni, 2004; Adeoye et al., 2009; Prusky, 2011; Mashau et al., 2012;
Ngcobo et al., 2012; Kasso and Bekele, 2018). Packaging should ensure produce is loaded into
convenient units for handling during distribution, storage and marketing (Wills et al., 1998; Kasso
and Bekele, 2018). However, many SSF in production of tomatoes utilise traditional baskets as
packaging material (Kereth et al., 2013; Ugonna et al., 2015). For SSF in South Africa and Ethiopia
producing fresh produce for urban markets are using plastic crates (Mashau et al., 2012; Kasso and
Bekele, 2018).
Whenever fresh produce is loaded in baskets or plastic crates, it applies a static load on itself
(Adeoye et al., 2009; Arah et al., 2015). The static load result in excessive pressure applied in the
lower part of the packaging material thus causing deformation of the produce at the bottom, which
27
may result in bruising and breakage leading to decay development (Sirisomboon et al., 2012;
Ugonna et al., 2015). This scenario obtains when baskets are used or there is over-packaging
(Sibomana et al., 2016). In under-packaging, the movement of fresh produce in the container is
high resulting in collision/friction that damages the fruit (Çakmak et al., 2010; Arah et al., 2015).
In some instances, these plastic crates have rough internal surfaces, which can injure fruit or
vegetables by contact (Sibomana et al., 2016).
Another cause of losses during harvesting and packaging is due to physiological deterioration of
fresh produce since F&V are living tissues that transpire, respire and further ripen during the period
of harvesting and packaging. The respiration rate of a product strongly determines its transit and
postharvest life (Sinha et al., 2011; Yahia, 2011; Tyagi et al., 2017). The higher the temperature at
harvest, the higher the respiration rate will be hence fresh produce in the tropical and sub-tropical
regions in SSA have a reduced shelf life (Workneh and Woldetsadik, 2004; Tefera et al., 2007;
Sandhya, 2010; Gupta and Dubey, 2018).
2.5.2 Losses during on-Farm Storage and Transportation Although not ideal for perishable produce quality, sometimes F&V are stored at the farm gate for
some period until either transport to the market is available or local buyers purchase the produce
for consumption or resale (Singh et al., 2010; Kasso and Bekele, 2018). Losses during on-farm
storage and transportation is a major contributor to the total PHL encountered by SSF in SSA fresh
produce supply chain (Emana and Gebremedhim, 2007; Buzby et al., 2014; Kiaya, 2014; Cherono
and Workneh, 2018). Often the transport and local markets are without temperature-controlled
environmental conditions (Kitinoja and Thompson, 2010; FAO, 2016; Cherono et al, 2018).
In circumstances where storage (on-farm) and transportation facilities have sub-optimum
environmental conditions, the ripening of F&V continues resulting in further physiological
deterioration (Opara et al., 2011; Yahia, 2011; Maliwichi et al., 2014; Saltveit, 2018).
Physiological, chemical and enzymatic changes are speeded when fresh produce is subjected to
high ambient temperature and low RH during temporary storage and transportation at the back of
trucks (Choudhury, 2005; Nunes et al., 2009; Fadeyibi and Osunde, 2011; Paull and Duarte, 2011;

28
Ogbuagu et al., 2017). The ambient temperatures in SSA can be 7℃ - 20℃ higher than the
recommended 15℃ for tomatoes (Kitinoja and AlHassan, 2012; Sibomana et al., 2017).
When temperature and RH are unregulated, fruit physiological deterioration and senescence
accelerates as fruit rot organisms spread rapidly at warm storage temperatures and low RH (Gharezi
et al., 2012; Ambaw et al., 2013a; Chijioke, 2017). High temperature and low RH can result in a
significant loss of nutritional value, decreased returns due to poor produce quality (wilting,
shriveling), loss of saleable weight and in many cases the whole fruit or vegetable is lost (Joas and
Lechaudel, 2008; Odesola and Onyebuchi, 2009; Gupta and Dubey, 2018).
Temperature management after harvest is fundamental in minimizing PHL and maintaining
nutrients like vitamins of F&V (Prusky, 2011; Pathare et al., 2012; Misra and Ghosh, 2018). The
sub-tropical climate obtaining in most countries in East and Southern Africa which is characterized
by high temperature, increases the rate of microbial changes and in turn activates enzymatic
reactions in produce (Brosnan and Sun, 2001; Workneh, 2010; James and Zikankuba, 2017).
Respiration rate, metabolic processes and ethylene biosynthesis of some fruit increase with room
temperature within a given range (Workneh, 2010; Wills and Golding, 2016). Respiration rates
can double, triple or even quadruple with every increase in temperature (Zagory and Kader, 1988;
Mansuri, 2015; Saltveit, 2018).
Therefore, the storage of F&V at low temperature immediately after harvesting will reduce the rate
of decomposition and microbial spoilage (Ito et al., 1988; Workneh and Osthoff, 2010;
Senthilkumar et al., 2015; Saltveit, 2018). Fresh produce shelf life can double by reducing
temperature from 10℃ to 5℃ (Sun and Zheng, 2006). Typically, the storage temperature of F&V
is 0℃ to 12℃ and most tropical and subtropical fruits require high temperatures of 5℃ to 13℃
according to (FAO, 2003; Paull and Duarte, 2011) and as shown in Table 2.3.
RH is another important aspect considered during storage and transportation of F&V (Paull and
Duarte, 2011; Prusky, 2011; Seweh et al., 2016). Occurrence of higher humidity during temporary
storage and transportation of fresh produce reduces water loss, thus maintaining produce weight,
appearance, nutritional quality and flavour, while wilting, softening and juiciness are reduced
(Kobiler et al., 2010; Basediya et al., 2013; Laguerre et al., 2013; James and Zikankuba, 2017;
Yousuf et al., 2018). According to Cantwell et al. (2009) and Nabi et al. (2017), the recommended

29
storage RH for most horticultural crops is between 70 to 95%. Table 2.3 provides a summary of
recommended storage RH for selected F&V. Most fresh produce under smallholder production is
stored at RH levels lower than recommended resulting in excessive moisture loss (Singh et al.,
2014; Banjaw, 2017). Subsequently, the F&V suffer wilting, shriveling and dryness resulting from
small moisture losses of 3-6% (Nunes et al., 2009). These changes in the produce affect
marketability or economic value especially if F&V are sold by weight (Paull and Duarte, 2011;
Yahia, 2011; Rahman et al., 2016).
Table 2.3 Optimum temperatures and relative humidity of selected vegetables
Product Optimum Temperature
Optimum Relative Humidity (%)
References
Broccoli 0 ℃ 90-95 Snowdon, (1992); Flores Gutiérrez, (2000)
Cabbage 0 ℃ 90-95 FAO (1989)
Lettuce 0 ℃ 90-95 Flores Gutiérrez, (2000)
Carrots 0 ℃ 90-95 Prusky, (2011)
Tomatoes 12-15 ℃ ≥ 85 Beckles, (2012)
Guava 5-10 ℃ 90 Basediya et al., (2013)
Mango 12 ℃ 85-90 Shitanda et al., (2011)
Potatoes 5-15 ℃ 90 Wilson et al., (1999)
Onions 1-2 ℃ 70-75 Byczynski (1997);
Garlic 0 ℃ 70-75 Byczynski (1997);
Banana (green)
13-14 ℃ 90-95 Hardenburg et al., (1986)
Cucumber 10-13 ℃ 95 Flores Gutiérrez, (2000)
The other important moist air property closely linked to RH is the vapour pressure. The difference
in vapour pressure between the ambient air and the intercellular spaces of living plant tissue
governs the migration of moisture and the rate of moisture transfer in fresh commodity storage
(Deirdre, 2015). Weight loss from perishable commodities is high if surrounding air temperature,
flesh moisture content and temperature are high as vapour pressure increases as flesh temperature
and moisture content increases. Moisture movements either in the form of vapour or liquid takes
30
place within the product to a surface and evaporates from a surface provided the humidity ratio is
high around the stored product (Becker and Fricke, 1996; Wills and Golding, 2016). Thus, under
poor postharvest management conditions of storage or in transit perishable commodities lose
excessively large weight due to existence of large vapour pressure deficit (Workneh, 2010;
Kritzinger et al., 2018).
Among other key contributors to high PHL in fresh produce is demographic and socio-economic
characteristics of smallholder F&V producers (Affognon et al., 2015). SSF have to travel to cities
to sell their fresh produce and due to lack of transport; farmers keep F&V over long periods at the
farm gate awaiting transportation to markets resulting in further mechanical damage (Kader, 2003;
Wakholi et al., 2015; Nabi et al., 2017). When this waiting period at the farm gate is prolonged,
there is further mechanical damage to produce due to over handling (Knee and Miller, 2002;
Sibomana et al., 2016; Cherono et al., 2018). The damaged F&V allow easy penetration of
microbial population into the tissue (Fadeyibi and Osunde, 2011; El-Ramady et al., 2015). This
increases chances of decay and growth of micro-organisms (Johnson et al., 1997; Pinto et al., 2004;
Rajan and Anandan, 2018). As packaged produce applies static load on itself the degree of
deformation on F&V will depend on the period the static load is applied (Idah et al 2007;
Sirisomboon et al., 2012). The longer the period the greater the deformation and stress effected on
the produce. The stress effected on the produce will also depend on the ripeness of produce, as it
ripens the same static load will inflict more internal flesh damage (Mashau et al., 2012; Sibomana
et al., 2016). The injury to produce increases if it is loaded at the back of trucks in rough road
conditions because of vibration forces experienced (Fadeyibi and Osunde, 2011; Kereth et al.,
2013; Bradbury et al., 2017). For SSF in SSA trucks that pick-up produce is not regular and if a
farmer misses the truck on a certain day it can take up to a week before there is transport to pick
up his F&V to the market (Mashau et al., 2012). To eliminate this challenge, it is required that the
duration between harvest and arrival at the markets be minimized.
If mechanical damage took place during harvesting and packaging, the F&V will be prone to
microbial contamination during storage and transportation (Ambaw et al., 2013b; Tzia et al., 2016).
Microbial decay accounts for about 15% of the postharvest decay in F&V (Workneh and Osthoff,
2010; Wills and Golding, 2016). Microbial decay is influenced by air, soil, poor sanitation,
environmental factors and moisture content of crops (Rahiel et al., 2018). Although Workneh and

31
Osthoff (2010) alluded to the fact that most microorganisms cannot grow under acidic conditions
of pH values less than 4.5, fungal growth still causes about two thirds of spoilage of F&V. This is
because fungi are much more tolerant to pH values below 4.5. Vegetables have pH values above
4.5 and near neutrality, and such levels create favourable conditions for many microorganisms such
as bacteria, yeast and fungi. Often, bacteria would have a competitive advantage in vegetables
because it grows faster than the fungi or yeast. Microbiological effect should be minimized to avoid
consumer’s risks as fresh produce can be eaten uncooked or minimally processed (Sagoo et al.,
2003; Beckles, 2012; Arah et al., 2015).
2.6 Research into Cold Chain Technologies: Costs and Benefits The maintenance of market quality of fresh produce through management of a cold chain is key to
the success of the horticultural industry, it is therefore, not only necessary to cool the product down
but to do so as quickly as possible after harvest (Paull, 1999; Senthilkumar et al., 2015; Saltveit,
2018). A cold chain is a temperature-controlled supply chain, which consists of uninterrupted range
of systems that monitor or maintain produce at a given temperature and keeps history (Wills and
Golding, 2016). According to Prusky (2011), the requirements for maintaining quality and safety
of horticultural perishables through the supply chain from harvest to consumption are the same in
developing and developed countries. For SSF in F&V production in SSA, the challenges are
beyond whether cooling technologies exist or not as there are other factors like volume to be cooled
per day, harvest temperature versus recommended storage temperature, capital and operating costs
come into play (Kitinoja and Thompson, 2010; Azene et al., 2011; Vala et al., 2014). To invest in
modern cooling technologies, SSF have to consider the cost-benefit analysis as to whether there
will be an increased financial benefit associated with the chosen technology (Ejeta, 2009; Faris,
2016). Availability of electricity is one of the critical factors to consider as an energy input to
power cooling technologies (Kitinoja et al., 2011; Seweh et al., 2016).
Possible areas of consideration should allow low energy cool storage facilities so that fresh produce
reaches markets at recommended storage conditions (Kader, 2005; Chaudhari et al., 2015; Sekyere
et al., 2016). Achieving this would ensure that both the supply of fresh produce and the shelf life
would improve significantly in SSA.
32
Kitinoja and Thompson (2010) have previously reviewed pre-cooling systems for small-scale
producers. These authors and broader literature have described various methods for preservation
of fresh F&V immediately after harvest. These cooling methods include among others, mechanical
refrigeration, hydro-cooling, vacuum cooling, forced air-cooling and evaporative cooling (EC)
(Senthilkumar et al., 2015). Mechanical refrigeration, forced air-cooling, vacuum cooling, hydro-
cooling and EC of fresh produce have previously been described in detail by reviews that include
Brosnan and Sun (2001); Thompson et al. (1998) and Senthilkumar et al. (2015), who placed
emphasis to the different performance parameters of various cooling methods. The following
publications discuss the different pre-cooling methods, Boyette et al. 1994; Singh-Negi and
Kumar-Roy, 2000; Brosnan and Sun, 2001; Wang and Sun, 2001; Jiro, 2002; Zhang and Sun, 2006;
Zheng and Sun, 2006; James et al. 2009; ASHRAE, 2011; James and James, 2011; Ambaw et al.
2013a, b; Senthilkumar et al. 2015; Misra and Ghosh, 2018.
2.6.1 Mechanical Refrigeration Mechanical refrigeration refers to the process where heat absorption takes place at one point
and heat dispersion at the other (Zou et al., 2006; Moureh et al., 2009; Sunmonu et al., 2014).
This is achieved through circulation of a refrigerant through the system by a compressor picking
heat through the evaporator inside the fresh produce space and dissipating it through the
condenser on the outside (Zou et al., 2006; Hera et al., 2007a; Vala et al., 2014; Rajan and
Anandan, 2018. The compressor can be powered through an electric motor. The refrigeration
system is energy intensive as electricity power is consumed throughout the whole cold chain
(Hera et al., 2007b; Fernandes et al., 2018). This in turn leads to high product cost since unit
energy costs make part of the unit cost for production of a given produce (Swain et al., 2009;
Seweh et al., 2016). However, where there is a ready and cheaper supply of electricity
mechanical refrigeration is the most reliable cooling technology (Kitinoja and Thompson, 2010;
Sekyere et al., 2016).
2.6.2 Hydro-Cooling Hydro-cooling is a fast, uniform cooling process of removing field heat from freshly harvested
F&V by bathing them in chilled water or running cold water over it (Vigneault et al., 2009;

33
Prusky, 2011; Gomez-Lopez, 2012; Senthilkumar et al, 2015; Chen et al., 2016). Since the
produce will be at higher temperature immediately after harvest the heat movement takes place
from the produce to the water and hence leading to cooling of produce (Rennie et al., 2003;
Wills and Golding, 2016). This process is an efficient way to remove heat as it uses water which
removes heat at least five times faster than air (Bachmann and Earles, 2014). The use of water
also provides another benefit as water serves as a means of cleaning at the same time. Hydro-
cooling reduces water loss, the rates of microbiological and biochemical changes in order to
prevent spoilage and maintain quality and increase shelf life (Gustavsson et al., 2011; Fernandes
et al., 2018). Hydro-cooling has limitations as it is only appropriate for commodities that
tolerate wetting like carrots, peaches, asparagus, cherries etc. and is not appropriate for berries,
potatoes to be stored, sweet potatoes, bulb onions, garlic, or other commodities that cannot
tolerate wetting (Kitinoja and Thompson, 2010; Bachmann and Earles, 2014; Chen et al., 2016).
2.6.3 Vacuum Cooling Vacuum cooling is a rapid EC method for porous and moist foods to meet the special cooling
requirements (Zhang and Sun, 2006; Senthilkumar et al., 2015; Chen et al., 2016). It is achieved
by the evaporation of moisture from the surface and within the produce (Sun and Zheng, 2006;
Deng et al., 2011). The evaporation is encouraged and made more efficient by reducing the pressure
to the point where boiling of water takes place at low temperature (Rennie et al., 2001; Vonasek
and Nitin, 2016.). The difference between vacuum cooling and conventional refrigeration is that
for the former, the effect is achieved by blowing cold air or other cold medium over the product
and the later describes direct transfer of heat from a produce (Rennie et al., 2003; Wills and
Golding, 2016). Speed and efficiency are the two features of vacuum cooling, which are
unsurpassed by any conventional cooling method, especially when cooling boxed or palletised
products (Sun and Wang, 2004; Rajan and Anandan, 2018). The speed and efficiency of vacuum
cooling relate to the ratio between its evaporation surface and the mass of produce (Prusky, 2011).
Cooling time, in order of 30 minutes ensures that strict cooling requirements for safety and quality
of foods can be met (Brosnan and Sun, 2001). Vacuum cooling is ideally for any product, which
has free water, and the product structure is not be damaged by the removal of such water.

34
2.6.4 Evaporative Cooling EC or humidification of surrounding air in F&V storage involves the use of principles of moist air
properties or psychometrics (Workneh, 2007; Chijioke, 2017). In EC, temperature drops
considerably and humidity increases to the suitable level for short–term on farm storage or
transportation of perishables (Jha and Kudas Aleskha, 2006; Misra and Ghosh, 2018). EC provide
cool air with a temperature 1-2℃ above wet bulb temperature of ambient air by forcing hot dry air
over a wetted pad (Chaudhari et al., 2015). The water in the pad evaporates, removing heat
(sensible heat) from the air while adding moisture and thus producing a considerable cooling effect
(La Roche, 2012; Basediya et al., 2013; Kapilan et al., 2017). The heat in fresh produce transfers
to the surrounding cool air. The air rises by natural convection in the process giving off the
absorbed heat. As a result, EC can provide a storage environment for most tropical and sub-tropical
F&V. Figure 2.2 illustrates the process of EC where the ambient temperature reduces from t1 to t2.
The evaporation and addition of moisture utilises energy from the air thus increasing its water
content from w1 to w2. A constant wet bulb line represents the process (Xichun et al., 2008).
Figure 2.2 Illustration of evaporative cooling (Adopted from Akton, 2009)
EC is regarded as a low-cost system requiring no electricity input in a passive system or just an
electric fan in a forced air system (Kitinoja and Thompson, 2010; Tigist et al., 2011; Chijioke,
2017). EC has achieved a favourable environment in storage structures for F&V where shelf life
of some fresh produce like apples, tomatoes, bananas, mangoes, potatoes and pumpkins has been
increased by factors of 1.3-5 at the same time exhibiting good appearance (Xuan et al., 2012; Hao

35
et al., 2013; Chaudhari et al., 2015; Tolesa and Workneh, 2017). In the work done by Anyanwu
(2004) the evaporative cooler increased the shelf life of tomatoes by a factor of three above open-
air storage values. Figure 2.3 shows visual observation of tomatoes stored under EC when
compared to those stored under ambient conditions after three weeks.
Figure 2.3 Visual observation of tomatoes stored under EC (A) versus tomatoes under
ambient conditions (B) after three weeks.
There are two types of evaporative coolers, direct and indirect air-cooling (Duan et al., 2012; Xuan
et al., 2012; Ahmad and Rahman, 2017). The two are similar except that in the indirect air-cooling,
the air first passes through the heat exchanger as opposed to passing straight to the humidifier as is
the case with direct cooling (Chaudhari et al., 2015). In direct EC systems, there are two types i.e.
natural ventilated (passive) and forced air-cooling (active). A natural or passive ventilated system
uses natural air circulation to drive air into the cooling chamber while in a forced air system fans
or blowers drive the ambient air through the wet pad (Ndukwu et al., 2013; Ahmad and Rahman,
2017). The fans or blowers increase the airflow rate over the wet surface improving the cooling
efficiency. In passive system, a lot of water is lost, as this system does not incorporate water
recirculation mechanism. A passive system results in poor air circulation and compromised heat
and mass transfer systems. Therefore, an active system involving fans and pump for water
circulation is preferred.
Modern cooling technologies like, mechanical refrigeration, vacuum cooling and hydro-cooling
could be used in SSA depending on, the type of fresh produce, the rate of cooling required, energy
consumption requirements, level of production, availability of funds to purchase the technology
and availability of energy (James and Zikankuba, 2017). Regrettable most SSF in SSA are located
in areas where there is no grid electricity for driving these modern cooling technologies. There are
A B
36
also issues related to, the cost of modern cooling technologies, performance of modern cooling
technologies, economies of scale and relevance to small-scale production under SSA conditions as
discussed in the next section.
2.7 Selection of Suitable Cooling Technology for Different Fruit and Vegetables Where there is, uninterrupted electricity supply, investment capital is not limited to cover purchase
and cost of installation, availability of technical skills to maintain and run the facility, mechanical
refrigeration would be the ideally cooling system (Basediya et al., 2013; Okanlawon and
Olorunnisola, 2017). However, mechanical refrigeration is not suitable for several F&V; for
example, banana, plantain, tomato etc. cannot be stored in the domestic refrigerator for a long
period as these fruits are susceptible to chilling injury (Ndukwu, 2011; Banjaw, 2017). The
selection of suitable cooling technologies for specific crop usually depend on the different
performance characteristics and parameters as described in Table 2.4.
Hydro-cooling, is achieved in a short space of time and the method is suitable for leafy produce
and because the produce is bathed in water, prevention of loss of moisture from the product is
ensured (Wang and Sun 2001; Thompson et al., 1998; Elansari and Siddiqui, 2016). The limitations
with hydro-cooling are its low energy efficiency and that requirement of containers that are water
resistant which otherwise might cause cross decay contamination (Vigneault et al., 2000;
Senthilkumar et al., 2015). The application of hydro-cooling by SSF is limited by its unsuitability
to cooling of root and grass crops and vegetables like tomatoes, apples and pepper as they have a
thick cuticle (Wang and Sun, 2001).
Forced air-cooling could be applicable to SSF but its limitation is that it requires a definite stacking
pattern, hence use of skilled operators to achieve the required loading pattern to ensure satisfactory
cooling rates (Arfin and Chau, 1988; Han et al., 2017).

37
Table 2.4 Summary of advantages, disadvantages and characteristics of different cooling technologies.
Cooling technology
Advantages Disadvantages Performance of cooling technology
References
Evaporative cooling
Low capital cost; high energy efficient; environmental benign; low weight loss; slow deterioration in quality; suitable for rural application; requires no special skill to operate; can be made from locally available materials; and easy to maintain.
Requires a constant water supply; no humidification, and high dew point; condition decreases the cooling capability; mineral deposits leading to pad and interior damage
Can maintain temperatures at 10-15℃ below ambient; Can achieve relative humidity of 90%; Can increase shelf life from 3 days to 15 days. Typical cooling time is 40-100 hours in passive cooling and 20-100 hours in fan-ventilated systems.
Anyanwu (2004) Dadhich et al. (2008) Tigist et al (2011) Basediya et al. (2013) Chaudhari et al. (2015) Chijioke (2017) Adewale & Olorunnisola, (2017) Puran and Isaac (2017) Rajan and Anandan (2018)
Hydro-cooling
Rapid cooling; prevents loss of moisture during cooling; cools and cleans the produce at the same time; and simple and effective pre-cooling method; High energy efficient.
Not uniform may leave “hot spots”; not suitable for: leafy produce; products that do not tolerate wetting; products that can be damaged by falling water; water left on surface can lead to fungus growth or discoloration; capital cost is relatively high;
Cooling can be achieved in 20-30 minutes; Water removes heat about 15 times faster than air at typical flow rates and temperature difference; Refrigeration capacity of 1.4 kW cool 500 kg produce per hour to achieve 11℃ depression;
Boyette et al. (1994) Lambrinos et al. (1997) Brosnan and Sun (2001) Rennie et al. (2001) Rennie et al. (2003) Prusky (2011) Senthilkumar et al. 2015; Puran & Isaac, 2017 Rajan & Anandan 2018

38
Cooling technology
Advantages Disadvantages Performance of cooling technology
References
the equipment is not portable.
Forced-air cooling
Faster cooling than conventional cooling; most common for cooling of flowers; and most common cooling method for produce sensitive to exposure to water; the potential for produce decay contamination is low; the equipment is portable depending on size; Capital cost is low.
Lowest energy efficiency; rapid cooling is required; forced air cooling is costlier when rapid cooling is required; and stacking pattern requires skilled operators
Doubling air velocity reduces pre-cooling time 2- 6-fold; Doubling air-flow rate from can shorten pre-cooling time by 30-40%; typical cooling times 1-10 hours
Baird et al. (1988) Han et al. (2017) Thompson and Chen (1988) Rudnicki and Nowak (1990) Brosnan and Sun (2001) Kader (2002), Tassou et al. (2010) Ambaw et al. (2013a) Takayuki et al. (2014) Senthilkumar et al. (2015) Zhao et al. (2016) Puran and Isaac (2017) Rajan and Anandan (2018)
Vacuum cooling
Rapid cooling achievable; distinct advantage over other cooling methods; cooling can achieve uniform cooling; gives highest energy efficiency; and hygienic since air only goes to the vacuum chamber; No potential for
Very capital cost; limited application to large growers; causes weight loss in the produce; only suited for produce with a high surface to volume ratio; works best only for produce like lettuce; cabbage, mushroom
Rapid cooling; method and can achieve temperatures of 1℃; Can increase shelf life from 3-5 days at ambient temperature to 14 days when combined with cold storage at 1℃; For every 5.5℃ reduction in
Kim et al. (1995) Artes and Martinez (1996) Ito et al. (1998) Brosnan and Sun (2001) Rennie et al. (2001) Rennie et al. (2003), Sun and Zheng (2006) Feng et al. (2012) Ambaw et al. (2013b) Senthilkumar et al. (2015) Puran and Isaac (2017)

39
Cooling technology
Advantages Disadvantages Performance of cooling technology
References
decay contamination; equipment is portable.
temperature there is 1% weight loss;
Rajan and Anandan (2018)

40
While vacuum cooling is a rapid cooling technology, it is only suitable for fresh produce with a
high ratio of surface to volume and is unsuitable for oranges, tomatoes and apples (McDonald and
Sun, 2000; Senthilkumar et al., 2015). Any cooling method unsuitable for tomatoes would be
unattractive as this fruit is a major commodity grown by SSF in a number of countries in the region
(Mashau et al., 2012). Another limiting factor of the use of hydro-cooling and vacuum cooling by
SSF is that both are pre-cooling methods, refrigeration is still required thereafter between the farm
and the market.
The construction and operating costs of different cooling technologies vary from relatively low to
high depending on the level of farm management (Kitinoja et al., 2011; Siddiqi and Ali, 2016).
Sometimes farmers ignore the cost of cooling technique during selection of technology as they
transfer the cost to consumers making selling price of the produce higher especially in developed
countries where there are good marketing systems (Boyette et al., 1994; Rahiel et al., 2018).
In developing countries where intermediaries set prices at farm gate, SSF may find themselves
selling their produce below the production costs. Both vacuum cooling and hydro-cooling are
regarded as expensive methods (Table 2.5) and therefore need to be operated for relatively longer
periods in a year to justify an investment (Ryall and Pentzer, 1982; Boyette et al., 1994; Deoraj et
al., 2015). Brosnan and Sun (2001) concluded that since vacuum chamber system for vacuum
cooling is expensive then this technology is only feasible for large growers that produce large
volumes of fresh produce throughout the year. Unfortunately, SSF in SSA do not have sufficient
volumes of fresh produce to warrant the use of vacuum and hydro cooling throughout the year
(Kitinoja et al., 2011). As a result, these two cooling methods are limited for products for which
they are much faster and more convenient (Ryall and Pentzer, 1982; Senthilkumar et al., 2015).
A small scale commercial mechanical refrigeration system with a capacity of one tonne complete
and ready for use in the USA will costs about US$7 000 for 3.5 kW (Kitinoja and Thompson,
2010). This cost is way above what most SSF in region can afford for a cooling capacity of one
tonne. From Table 2.5 it is possible to construct an EC system of 1-2 MT at US$1 300 at an energy
use per MT of 0.7 kWh compared to hydro-cooling whose costs while it varies is still higher than
EC and would require more than 100 kWh per MT. The energy costs to cool 1 MT of tropical
F&V using EC is $0.14 compared to $22-30 per MT to pre-cool cherries.

41
Table 2.5 Properties and costs of selected pre-cooling technologies
Cooling Technology
Purchase Price (USD)
Suitable crops Typical Size or capacity
Energy User per MT (kWh)
Cost per MT at an electricity rate of $/kWh
References
Evaporative forced-air cooling (0.1 HP fan) to 13℃
$400 Tropical fruits and vegetables
0.5 MT 0.7 $0.14 Kitinoja & Thompson (2010)
Rayaguru et al. (2010)
Basediya et al. (2013)
Chijioke (2017)
Evaporative forced-air cooling (0.5 HP fan to 13℃
$1 300 Tropical fruits and vegetables
1 to 2 MT 0.7 $0.14 Kitinoja & Thompson (2010)
Rayaguru et al. (2010)
Basediya et al. (2013)
Rajan & Anandan (2018)
Vacuum cooling to 1 ℃
Varies Produce with high surface to volume ratio
Suitable for large growers
*
*
Kim et al. (1995)
Brosnan and Sun (2001)
Elansari & Siddiqui (2016)
Hydro-cooling immersion type to 0 to 2℃
Varies Cherries 3 MT cooled in 1 hour
110 to 150 $22 to 30 Thompson et al. (1998)
Brosnan and Sun (2001)
Kitinoja & Thompson (2010)
Siddiqi & Ali (2016)

42
Cooling Technology
Purchase Price (USD)
Suitable crops Typical Size or capacity
Energy User per MT (kWh)
Cost per MT at an electricity rate of $/kWh
References
Portable forced-air cooling (1 HP) fan in existing cold room to 2℃
$1 600 All crops 3 MT cooled in 4 to 6 hours
55 $11.00 Kitinoja and Thompson (2010)
Zhao et al. (2016)
Rajan & Anandan (2018)
Portable forced-air cooling (1 HP) fan in existing cold room to 13℃
$1 600 All crops 3 MT cooled in 2 to 4 hours
35 $7.00 Zhang and Sun (2006)
Zhao et al. (2016)
Rajan & Anandan (2018)
*Values not found in literature

43
EC provides a solution, as the technology has low initial investment, low installation and
maintenance costs and in a passive system can be established without electricity (Sahdev et al.,
2016). EC presents itself as an appropriate cooling technology for small-scale farming of fresh
produce in SSA as it is appropriate for sub-tropical and tropical F&V, the volumes for cooling per
farmer per unit time are not huge and the storage temperature is around 15℃. Chaudhari et al.
(2015) reviewed the work done on EC from 1987 to 2010 and concluded that since this system is
not harmful to environment, has low initial costs, can be constructed from local available material
what is left is finding relevant and cheap energy sources for its upscaling.
2.8 Relevance of Evaporative Cooling to SSF in SSA EC is an adiabatic cooling process where the air temperature decreases without change in its total heat
content when dry air passes over or through wet surfaces (Chijioke, 2017). During adiabatic cooling of air,
its temperature decreases while the air absorbs moisture from wet surface (Olosunde et al., 2016). The
humidity ratio of the air increases also increases. The heat content of the air remains the same even after
passing a wet EC pad, although the air temperature decreases. The main aim of EC is to increase humidity
ratio, vapour pressure and RH and decrease temperature. EC is relevant to SSF as the principle of operation
is simple, can be easily constructed from local available materials (storage, cooling chamber, water tank,
cooling pad media) and the components that require maintenance like the motor, extraction fan and heat
exchanger can be repaired at low cost (Deoraj et al., 2015; Ogbuagu et al., 2017). The system uses a cheap
and environment friendly refrigerant water (Okanlawon and Olorunnisola, 2017).
Literature shows studies on EC in SSA Dzivama, 2000; Anyanwu, 2004; Olosunde, 2006; Olosunde
et al. 2009; Ahmed et al. 2011; Taye and Olorunisola, 2011; Samira et al. 2011; Liberty et al. 2013;
Ndukwu et al. 2013; Deoraj et al. 2015 and Adewela and Olorunnisola, 2017. A number of studies
have shown the attractiveness in the use of evaporative coolers by SSF in Africa as unveiled by the increased
research productivity through publications from authors in different countries: Anyanwu (2004) in Nigeria;
Ahmed et al. (2011) in Sudan, Samira et al. (2011) in Ethiopia. The results of use of EC have demonstrated
that coolers can maintain cooling spaces at temperatures below ambient with a depression reaching 12℃
(Anyanwu, 2004). In EC cooling, lies the solution for SSF in finding a method appropriate that could
alleviate storage challenges, reduce losses and improve food security at household level (Mordi and
Olorunda, 2003; Ogbuagu et al., 2017).

44
Therefore, EC is as an appropriate cooling technology for small-scale farming of fresh produce in
SSA in alleviating storage challenges and reducing fresh PHL as;
i. it is appropriate for sub-tropical and tropical F&V,
ii. the volumes for cooling per farmer per unit time are not huge normal less than 5 tonnes,
iii. the storage temperature for tropical and sub-tropical F&V is around 15℃ and RH is 85-
95%.
As EC only removes room sensible heat, it works best in hot and dry climate prevalent in SSA and
is not suited for sub-humid to humid areas like coastal regions with moderate to high RH of 70-
85% (Ahmed et al., 2011; Basediya et al., 2013; Cuce and Riffat, 2016; Ahmad and Rahman, 2017;
Chijioke, 2017). The efficiency of an evaporative cooler depends on the original humidity of the
surrounding air and the efficiency of evaporative surface (Jradi and Riffat, 2014). Therefore, the
extension of EC to such areas by incorporating suitable desiccation media i.e. indirect heat
exchanger where indirect air-cooling will take place before evaporative cooling (IAC+EC) is a
possible research area. Despite perceived favourable results so far, the IAC+EC technology
remains at development stage (Buker and Riffat, 2015).
Therefore, more focused research and contribution needs investigation for the development of this
technology. Literature studied and confirmation by Misra and Ghosh (2018) reveals that indirect
air cooling has not been used in both greenhouse cooling of fresh produce storage. Incorporation
of heat exchanger will require additional accessories like a water pump for water reticulation and
fans for ventilating the storage chamber. The review by Manaf et al. (2018) identified IAC+EC is
an encouraging system, yet research into its use is still at an initial stage and needs further
investigation. Manaf et al. (2018) also alluded that IAC+EC have high potential for use in hot and
humid weather.
The use of an indirect heat exchanger, water pump and fan(s) will require energy. Should IAC+EC
be required the energy requirements are low and the cooling technology is energy efficient. Therefore, a
possibility exists to integrate IAC+EC with use of alternative energy for example wind or solar energy
(Manaf et al., 2018). Fossil fuels could power the cooling methods but these contribute to greenhouse gas
emissions (Best et al., 2012; Goel and Sharma, 2017).

45
2.9 Renewable Energy Use in Postharvest Handling of Fresh Produce Renewable energy technologies have a high adaptation rate in many industries due to climate
mitigation, ability to enter foreign markets because of green processes, green consumer
requirements and improved corporate images of industries that use clean energy (OECD/IEA and
IRENA, 2017). Besides conventional energy sources there is an option of energy provision from
natural energy sources that include among others solar and wind energy (Szabo et al., 2011; Tyagi
et al., 2012; Mentis et al., 2015; Oliveira and Trindade, 2018). The role of renewable energy along
the different stages of food supply chain by providing requisite energy supplies especially for
powering the fresh produce cold chain is important (Toshwinal and Karale, 2013; Chaudhari et al.,
2015; Damerau et al., 2016). The role is more pronounced for remote, dispersed populations with
low and scattered energy demands (Cecelski, 2000). Both solar and wind energy represents the
largest source of renewable energy supply compared to solid biomass, biogas, hydro and
geothermal sources (Tyagi et al., 2012; Goel and Sharma, 2017).
The consumption of fossil fuel is the major contributor to the greenhouse gases emitted to the
atmosphere thus causing global warming (Schneider et al., 2000; Demirbas, 2006; Hassan and
Mohamad, 2012; Nakumuryango and Inglesi-Lotz, 2016; Goel and Sharma, 2017). Biomass is
combusted for heating and cooking and is convertible into electricity (David et al., 2002; Nunes et
al., 2016). Direct combustion of biomass produces steam, which turns turbines that drive
generators, producing electricity (Ayhan, 2006; Rolin and Porte-Agel, 2018). The cost of
producing 1 kW of electricity from wood biomass is US$0,058. Biomass combustion releases
different chemical pollutants, including fourteen carcinogens into the atmosphere (Alfheim and
Ramdahl, 1986; Godish, 1991; Nunes et al., 2016). Grid electrification is expensive and yet other
sources of energy can meet all the energy requirements (Deveci et al., 2015; Khare et al., 2016).
Senol (2012) and Lewis (2016) recognises the need to promote alternative energy supply especially
for increased productivity and for income generation.
Wind energy or power is the production of electricity by turning blades on a wind turbine (Ayhan,
2006; Foxon, 2018; Rolin and Porte-Agel, 2018). An advantage of wind turbines over other
renewable energy sources is that they can produce electricity whenever the wind blows (both during
the day and at night). Wind energy can be utilised if the annual energy available is at an average

46
speed of 5 m.s-1, and is 490 MJ.m-2 of surface perpendicular to the wind flux (Mentis, 2013).
According to Archer and Jacobson (2005) and Mentis et al. (2015), while Africa has an abundance
of wind energy, in some areas it is seasonally while in coastal regions is available throughout the
year. Solar energy seems to be the most viable alternative to fossil fuels as it is clean and renewable
since it comes from the sun (Sontake and Kalamkar, 2016; Goel and Sharma, 2017). Solar energy
is the largest source of renewable energy supply, compared to solid biomass, biogas, hydro, wind
etc. and is available in most areas of SSA throughout the year with values in excess of 2 000 kWh
m-2 (Heimiller, 2005; Best et al., 2012; Davis and MacKay, 2013; Kabir et al., 2018). In this region,
the average solar radiation ranges between 4.5 kWh.m-2 – 6.5 kWh.m-2 for an average of 6 -7
hours (Fluri, 2009; Baurzhan and Jenkins, 2016). This according to Saïdou et al. (2013) and Saxena
et al. (2013) is enough solar radiation that is convertible to electricity.
2.9.1 Solar Power There has been application of solar energy in generating solar thermal or directly conversion to
electricity through photovoltaic cells (Hassan and Mohamad, 2012; Foxon, 2018). According to
Best et al. (2012), the use of solar energy for refrigeration purposes in the Agro-industry has a
potential in developing countries. Abu-Hamdeh and Al-Muhtaseb (2010) stressed that there is a
potential energy saving of 40-50% when using solar driven air conditioning systems instead of
conventional systems. Feasibility studies of this technology when carried out in Mexico and the
Mediterranean area showed that it is possible to obtain temperatures as low as -2℃ for air-cooled
systems using solar energy as a source (Ayadi et al., 2008). There has been application of solar
energy in solar refrigeration technologies i.e. solar electric and solar thermal (Kim and Ferreira,
2008). In the solar electric system, conversion of solar energy to electricity is by use of solar
photovoltaic (SPV) cells that operate a vapour-compression refrigeration technology.
There is a lot of research work currently being carried out for absorption-based refrigeration and
air conditioning systems that use solar energy (Liu and Wang, 2004; Balaras et al., 2007; Helm et
al., 2009; Said et al., 2012; Shirazi et al., 2016). The numerous reviews found in literature is
evidence in support of solar-based refrigeration (Wang et al., 2011; Best et al., 2012; Khan and
Arsalan, 2016). Solar energy has also been integrated with EC by many researchers for cooling of
buildings (Tiwari and Jain, 2001; Maerefat and Haghighi, 2010; Naticchia et al., 2010; Finocchiaro
47
et al., 2012; Hands et al., 2016; Sahlot and Riffat 2016; Manaf et al., 2018). Naticchia et al. (2010)
exploited both air ventilation and heat exchange by use of porous insulating material as an
absorption matrix. Maerefat and Haghighi (2010) integrated a solar system employing a solar
chimney with EC cavity. This integrated system enhanced passive cooling and natural ventilation
in a solar house, and the numerical experiments showed that daytime temperatures significantly
reduced at a poor solar intensity of 200 W.m-2 and high ambient temperature of 40℃. Finocchiaro
et al. (2012) employed a solar energy assisted desiccant and EC system for building air
conditioning. In this system, solar energy regenerated a desiccant material that dehumidifies moist
air by vapour adsorption. The resultant dry and warm air was then cooled in a sensible heat
exchange and then in an evaporative cooler. Hands et al. (2016) used a two-rotor intercooled
desiccant arrangement to maximize dehumidification and provided solar energy for precooling and
preheating only. When the ambient conditions were suitable, the solar driven desiccant cooling
system met 35% of the total building cooling load.
Because of research work, there have been reasons for focusing on the potential of converting solar
energy through photovoltaic systems for use in agriculture production (Ekren et al., 2011; Mujahid
et al., 2015). This could be a basis for sustainable agricultural production at village level in SSA
The challenge is for researchers to find means of dramatically reducing the cost per solar panel to
deliver cheaper energy to SSF. It is believed that this has been achieved to a certain extent as the
price of renewable energy from solar has dropped in the last decade from US$0,18 kWh to just
US$0,03 kWh (OECD/IEA and IRENA 2017).
2.9.2 Wind Energy Wind power has versatility of uses worldwide that include home power, water-pumping
applications, running mills and other machines (Twidell and Weir, 1986; Goudarzi and Zhu, 2013).
There is scope also to extend the use of wind power to agricultural produce processing and energy
driven farming activities (Crawford et al., 2009; Hossain et al., 2016). A wind turbine operating at
an ideal location can run at maximum 30% efficiency. A 500-kW turbine at this efficiency can
yield an energy output of 1,3 million kW (e) per year at an estimated cost of US$0,007 per kWh
(e) (David et al., 2002). To date, there is no available literature showing harnessing of wind energy
for cooling purposes of fresh produce. As a result, there exists a research scope in the utilisation of

48
wind energy to support cheaper and less energy intensive cooling methods for fresh produce like
EC (Chaudhari et al., 2015; Hossain et al., 2016). Integration of wind energy with EC could be the
panacea in the reduction of PHL experienced by SSF producing F&V in SSA. When envisaging a
wind-powered system for cooling fresh produce, batteries are required for backup storage of
electricity, as wind does not blow all the times.
2.9.3 Relevance of Solar Energy in Cooling of Fresh Produce. Best et al. (2012) estimates that energy demand for cooling processes and greenhouse gas emissions will
increase by 60% by 2030 compared to 2000 levels. Kim and Ferriera (2008) have recognised that there are
energy requirements for agriculture in rural areas addressed by using alternative sources of energy other
than grid electricity. Efforts in planning and provision of the additional power requirements with clean
energy need to be in place. In Africa, there are more opportunities to use solar energy because much of the
continent has limited access to electricity (Szabo et al., 2011; Power et al., 2016).
Therefore, the high-energy demands on existing power sources and global warming threats
provides impetus for research towards technological alternatives (Hassan and Mohamad, 2012).
Among these technologies, solar energy is the most appropriate for adaptation with cooling
methods for fresh produce, as the resource is available throughout the year (Best et al., 2012). A
lot of research in this regard has been taking place.
Fan et al. (2007) and Bataineh and Taamneh (2016) reviewed the research on solar absorption and
adsorption refrigeration technologies. From this review, there is a conclusion that solar power
sorption technologies may possible be used for refrigeration, air-conditioning applications and ice
making. Other solar sorption’s are still at research study level and are not fully developed. Other
issues that still need addressing with sorption refrigeration systems regards enhancement of the
heat and mass transfer to improve performance (Chindambaram et al., 2011). As a result, most of
the systems are at the stage of demonstration and prototyping (Fan et al., 2007; Chindambaram et
al., 2011; Ahmad and Rahman, 2017). While the prospect of developing an environmentally
friendly and low energy demand, solar power sorption systems are good the cost of the refrigeration
system represents a large percentage of the cost, which will limit its use among SSF (Otanicar et
al., 2012; Zhai et al., 2011; Faris, 2016).

49
The use of solar energy for EC in all the cases has been limited to buildings and this provides an
opportunity for the extension of the same principles to the preservation of fresh produce (Ahmad
and Rahman, 2017). The use of solar energy to power electrical appliances for EC like heat
exchanger, water pump and fan is very limited and literature was not found providing evidence that
solar energy has been used for IAC+EC for fresh produce. This confirmed by Jani et al. (2018)
who alludes that there is no wide historical background for commercial application of solar energy
for in IAC+EC.
EC technology if used with forced air requires lower energy to operate water pump and fans while
it is effective in providing cold and humid air to the storage chamber. The use of SPV energy to
operate low-cost cooling technologies for F&V has a high potential. Hence, an integrated approach
of IAC+EC and solar energy as a source of power could be highly suitable for SSF that are engaged
on production of F&V in SSA. This will play a pivotal role in ensuring food security at household
level and a reliable family sustenance through income obtained from sales. With the advent of re-
distribution of land in South Africa, there will be emerging SSF in F&V production with no access
cooling facilities and integrated approach of EC and solar energy will fill the gap.
2.10 Discussions All categories of farmers’ experience high PHL in SSA, but for SSF as they lack appropriate low-
cost post-harvest cooling technologies the challenge is more pronounced. The deterioration in
quality of F&V is largely due to factors such as technical, biological and chemical, and as well as
environmental aspects. These factors affect fresh produce quality from harvesting, packaging,
temporary storage at the farm through to transportation to markets.
Training of harvesters, use of appropriate packaging material like plastic crates and ensuring that
appropriate transportation containers are used addresses issues related to technical factors. This
would significantly eliminate the exposure to mechanical damage, which is the main cause of
physiological deterioration and bacterial contamination. Biological process of metabolism such as
respiration, transpiration and biosynthesis cause fresh produce deterioration through moisture loss,
which may lead to senescence. The physiological deterioration due to biological processes is
compounded by environmental factors that can result in a significant loss of nutritional value.

50
Harnessing of biological process is through the control and management of environmental factors
of temperature and RH.
This review identified a number of conventional cooling technologies available in the market such
as forced-air cooling, vacuum cooling, hydro-cooling and mechanical refrigeration. The different
conventional cooling technologies have inherent challenges in their application by SSF in SSA.
Hydro-cooling is not suited for leafy produce and SSF require a technology that is able to cool all
vegetable types, leafy, root and grass. Forced-air cooling is a specialized technology, requiring
skilled operators who SSF do not always have. Forced air-cooling is more expensive than other
cooling methods when rapid cooling is required. In the case of vacuum cooling beside the cost,
requires sustained higher volumes throughout the year, which demand only large-scale growers
with economies of scale of growing high cash value crops can satisfy. Literature also revealed that
the conventional cooling technologies are both capital and energy intensive. SSF have no access to
capital to purchase and install conventional cooling technologies and even if they did, they would
still need to surmount the challenge of energy required for these technologies, as most of these
farmers are in remote areas with no access to grid electricity.
Further, this review also recognizes that EC is a simple and cheap method compared to
conventional cooling technologies. EC is regarded as economical and does not necessarily need
external power source as it relies on velocity of natural wind through wetted pads. EC is ideally,
for both pre-cooling and cooling and its use increases shelf life of fresh produce. EC has had a big
impact in cooling of buildings in Asia and has been practiced by some SSF in SSA. EC premises
on removal of sensible heat, which makes it relatively efficient under hot and dry climates obtaining
in SSA but has limitations in hot and sub-humid to humid areas obtaining in coastal regions. EC
has been tested at laboratory scale in dry and arid areas and the results are encouraging. For sub-
humid to humid areas, IAC coupled with EC could work, but no work-studies on such a cooling
system has been done for either greenhouse cooling or storage of fresh produce.
Conventional cooling technologies are energy intensive. Grid electricity is not available in remote
and isolated areas in SSA, while use of fossil fuels has limitation in that they emit greenhouse
gases. The alternative then is the use of renewable energy sources like solar, which is abundant in
SSA. As a result, there exists a research scope in the utilisation of solar energy to support IAC+EC
of fresh produce for hot and sub-humid to humid areas. This integrated system could be very useful

51
to SSF in SSA producing F&V in ensuring that they rise from high PHL incurring farmers to
profitable farmers who are able obtain returns enough to sustain their families.
2.11 Conclusions Literature shows that the introduction of appropriate cooling technologies for SSF will ensure
provision of cold chain systems that minimize PHL from harvesting to consumption by end user
of fresh produce. The training of harvesters and ensuring the use of appropriate transportation
containers are important to reduce the effect of technical factors on PHL. Biological processes play
a key role in aggravating PHL if not properly controlled by maintaining environmental factors of
temperature and RH at recommended storage levels as per specific requirement of each crop.
However, this review showed that in developing countries like SSA there is lack of proper cold
chain storage facilities. Hence, there is need to develop or adopt appropriate low-cost cold chain
facilities aiming at cooling of fresh produce for SSF. This is the only way SSF can rise from
subsistence farming to commercial fresh produce production. The two most limiting factors for the
adoption of advanced cooling by SSF is the initial capital cost and the energy demands, since
conventional cooling technologies are energy intensive. The alternative, then, is the use of an
integrated system that involves solar energy source combined with a low-cost cooling technology.
Based on the brief survey of literature, it is observed that a lot of research has been done on EC for
comfort cooling at prototype scale for fresh produce preservation. EC is suitable for hot and dry
regions where it is very much effective in providing a suitable microclimate inside buildings or
storages as the process relies on removal of sensible heat. The application of EC in sub-humid to
humid areas has limitation as presence of high RH leads to low dry bulb temperature. Selection of
appropriate EC system depends mainly on local environmental conditions and performance varies
from one to the other. More scope of research remains to be carried out in the hot and humid tropic
and subtropics. Extension of EC as a principle to humid areas requires inclusion of a heat exchanger
for IAC, which is a concept that is not previously documented for cooling the microenvironment
in storage of fresh produce. The incorporation of heat exchanger and other electrical appliances for
IAC require energy, which can be supplied by solar energy for SSF with no access to grid
electricity. This provides an opportunity for the use of solar energy to power a heat exchanger for
sensible cooling of air; water pump for water reticulation; fan to ventilate the IAC+EC.
52
The availability of literature pertaining to the integration of solar energy and IAC+EC, particularly
in South Africa, is limited. Innovative and convenient technologies of provision of a cold chain for
F&V after harvest are required to reduce losses that occur when fresh produce is stored under
ambient conditions. It is envisaged that by developing a low-cost cooling technology for hot and
humid areas in coastal regions a larger export market can be created, as well as providing small-
scale farmers with a niche in this export arena. The integrated system of IAC+EC with solar energy
will reduce PHL thus increasing the quantity of fresh produce that will reach the consumer.
IAC+EC systems still need development and characterization especially in Southern Africa where minimal
research has been done on EC in general. IAC+EC systems have shown great potential of development
and research opportunity for their perceived improved efficiency, high thermal performance and
low energy use. From the conclusions made above, the proposition is carrying out a study to
develop and characterise a solar powered IAC+EC system for temporary storage and transportation
of F&V with a specific focus on sub-humid to humid areas in Southern Africa.
In conclusion, there is still a lack of available research in IAC+EC systems and their performance
under hot and sub-humid to humid weather. The use of renewable energy in IAC+EC system
powered by solar still needs investigation in hot and humid country where solar power can be
harvested year-round.

53
2.12 References Aba, IP, Gana, YM, Ogbonnaya, C and Morenikeji, O. 2012. Simulated transport damage study
on fresh tomato (Lycopersicon esculentum) fruits. Agricultural Engineering International: CIGR Journal, 14(2), 119- 126.
Abu-Hamdeh, NH and Al-Muhtaseb, MTA. 2010. Optimization of solar adsorption refrigeration system using experimental and statistical techniques. Energy Conversion and Management, 51(8), 1610-1615.
Adeoye, IB, Odeleye, SO, Babalolaand, SO and Afolayan, SO. 2009. Economic analysis of tomato losses in Ibadan Metropolis, Oyo estate, Nigeria. African Journal of Basic and Applied Sciences, 1(5-6), 87-92.
Adewale, OA and Olorunnisola, AO. 2017. Development of passive evaporative cooling systems for tomatoes Part 1: construction material characterization. Agricultural Engineering International: CIGR Journal, 19(1), 178-186.
Affognon, H, Mutungia, C, Sangingac, P and Borgemeistera, C. 2015. Unpacking Postharvest Losses in Sub-Saharan Africa: A Meta-Analysis. World Development, 66, 49–68.
Ahmad, NH and Rahman, AMA. 2017. The potential of evaporative cooling window system using labu sayong in tropical Malaysia: A review. Advanced Journal of Technical and Vocational Education, 1 (1), 262-272. eISSN: 2550-2174.
Ahmed, EM, Abaas O, Ahmed, M and Ismail, MR. 2011. Performance evaluation of three types of local evaporative cooling pads in greenhouses in Sudan. Saudi Journal of Biological Sciences, 18, 45-51.
Aharoni, N. 2004. Packaging, Modified Atmosphere (MA) and Controlled Atmosphere (CA) – Principles and applications. Power Point Lecture Slides. International Research and Development Course on Postharvest Biology and Technology. The Volcani Center, Israel.
Ait-Oubahou, A. 2013. Postharvest technologies in Sub-Saharan Africa: status, problems and recommendations for improvements. 1273-1282.
Akton, A. 2009. Professional Psychrometric Analysis for Modeling Complex Industrial and
Commercial Processes. www.Aktonassoc.com.
Alfheim, I and Ramdahl, T. 1986. Mutagenic and Carcinogenic Compounds from Energy Generation. Oslo (Norway): Senter for Industriforkning.
Alexandre, EMC, Santos-Pedro, DM, Brandao, TRS and Silva, CLM. 2011. Study on thermosonication and Ultraviolet radiation processes as an alternative to blanching for some fruits and vegetables. Journal of Food Bioprocess Technology, 4, 1012-1019.
Ambaw, A, Delele, MA, Defraeye, T, Ho, QT, Opara, LU, Nicolai, BM and Verboven, P. 2013a. The use of CFD to characterize and design post-harvest storage facilities: Past, present and future. Computers and Electronics in Agriculture, 93, 184-194.

54
Ambaw, A, Verboven, P, Defraeye, T, Tijskens, E, Schenk, A, Opara, UL and Nicolai, BM. 2013b. Effect of box materials on the distribution of 1-MCP gas during cold storage: A CFD study. Journal of Food Engineering, 119, 150-158.
Anyanwu, EE. 2004. Design and measured performance of a porous evaporative cooler for preservation of fruits and vegetables. Energy Conversion and Management, 45, 2187-2195.
Arah, IK, Amaglo, H, Kumah, EK and Ofori, H. 2015. Preharvest and Postharvest Factors Affecting the Quality and Shelf Life of Harvested Tomatoes: A mini review. International Journal of Agronomy. doi.org/10.1155/2015/478041.
Arah, IK, Ahorbo, GK, Anku, EK, Kumah, EK and Amaglo, H. 2016. Postharvest Handling Practices and Treatment Methods for Tomato Handlers in Developing Countries: A Mini Review. Advances in Agriculture, 1-8.
Archer, CL and Jacobson, MZ. 2005. Evaluation of global wind power. Journal of Geophysical Research, 120(12), 1-20.
Arfin, BB and Chau KV. 1988. Cooling of strawberries in cartons with new vent whole designs. ASRAE Transactions, 1415 – 1426.
Artes, F and Martinez, JA. 1996. Influence of packaging treatments on the keeping quality of Salinas lettuce. Lebensmittel Wissenschaft and Technologies, 29, 664-668.
ASHRAE, A. 2011. ASHRAE/USGBC/IES standard 189.1-2011. Standard for the design of high-performance green buildings. American Society of Heating, Refrigerating and Air Conditioning Engineers, Inc., Atlanta, GA.
Ayadi, O, Doell, J, Aprile, M, Mottaand, M and Nunez, T. 2008. Solar energy cools milk. Proceedings of Eurosun 1st International Congress on heating, cooling and buildings, Lisbon, Portugal.
Ayhan, D. 2006. Global Renewable Energy Resources, Energy Sources, Part A: Recovery, Utilization, and Environmental Effects, 28, 8, 779-792, doi.10.1080/00908310600718742.
Azene, W, Workneh TS and Woldestadik, K. 2011. Effect of packaging materials and storage environment on postharvest quality of papaya fruit. Journal of Food Science and Technology, doi.10.1007/s13197-011-0607-6.
Bachmann, J and Earles, R. 2014. Postharvest of fruits and vegetables. (Internet). National Center for Appropriate Technology (NCAT). Available from: https://attra.ncat.org/attra-pub/viewhtml.php?id=378. [Accessed 16 August 2017].
Baird, CD, Gaffney, JJ and Talbot, MT. 1988. Design criteria for efficient and cost-effective forced air-cooling systems for fruits and vegetables. ASHRAE Transactions, 92, 1434-1441.
Balaras, CA, Grossman, G, Henning, HM, Carlos, A, Ferreiraand, I and Podesser, E. 2007. Solar air conditioning in Europe – an overview. Renewable and Sustainable Energy Reviews, 11(2), 299-314.
Baloyi, JK. 2010. Analysis of constraints facing smallholder farmers in the Agribusiness value chain. A case study of farmers in the Limpopo province. Masters in Agricultural
55
Economics Thesis. Department of agricultural Economics, Extension and Rural Development. Faculty of Natural and Agricultural Sciences, University of Pretoria, South Africa.
Banjaw, TD. 2017. Review of Post-Harvest Loss of Horticultural Crops in Ethiopia, its Causes and Mitigation Strategies. Journal of Plant Sciences and Agricultural Research, 2(1), 6.
Basediya, ALD, Samuel, VK and Beera, V. 2013. Evaporative cooling system for storage of fruits and vegetables – a review. Food Science Technology, 50(3), 429-442. doi.0.1007/s13197-011-0311-6.
Bataineh, K and Taamneh, Y. 2016. Review and recent improvements of solar sorption cooling systems. Energy and Buildings, 128, 22-37. doi.org/10.1016/j.enbuild.2016.06.075.
Baurzhan, S and Jenkins, GP. 2016. Off-grid solar PV: Is it an affordable or appropriate solution for rural electrification in Sub-Saharan African countries? Renewable and Sustainable Energy Reviews, 60, 1405-1418. doi.org/10.1016/j.rser.2016.03.016.
Becker, BR and Fricke, BA. 1996. Transpiration and respiration of fruits and vegetables. Refrigeration Science and Technology, 6, 110-121.
Beckles, DM. 2012. Factors affecting the postharvest soluble solids and sugar content of tomato (Solanum lycopersicum L.) fruit. Postharvest Biology and Technology, 63,129-140.
Best, B, Aceves, JJ, Islas, HJM, Manzini, SFB, Pilatowsky, PIF, Scoccia, R and Motta, M. 2012. Solar cooling in the food industry in Mexico: A case study. Applied Thermal Engineering, doi: 10.1016/j.applthermaleng. 2011.12.036.
Botondi, R, De Santis, D, Bellincontro, A, Vizovitis, K and Mencarelli, F. 2003. Influence of ethylene inhabitation by 1-menthylcyclopropene on apricot quality, volatile production, and glycosidase activity of low- and high-aroma varieties of apricots. Agricultural Food Chemistry, 51, 1189-1200.
Bourne, PA. 2009. The implication of utility access on gender: The case of Jamaica. European Journal of Social Sciences, 8(4), 614-625.
Boyette, MD, Wilson, LG and Estes, EA. 1994. Hydro-cooling. AG-414-4. North Carolina Cooperative Extension Services, Raleigh /North Carolina Agricultural and Technical State University, Greensboro.
Bradbury, A, Hine, J, Njenga, P, Otto, A, Muhia, G and Willilo, S. 2017. Evaluation of the Effect of Road Condition on the Quality of Agricultural Produce. Phase 2 Report. TRL Limited, IFRTD, RAF2109A. ReCAP Project Management Unit, Cardno Emerging Market (UK) Ltd Oxford House, Oxford Road Thame OX9 2AH United Kingdom.
Brosnan, T and Sun, D. 2001. Precooling techniques and applications for horticultural products – a review. International Journal of Refrigeration, 24(2), 154-170.
Buker, MS and Riffat, SB. 2015. Recent developments in solar assisted liquid desiccant evaporative cooling technology—A review. Energy and Buildings, 96, 95–108. doi.10.1016/j.enbuild.2015.03.020.

56
Buzby, JC, Farah-Wells, H and Hyman, J. 2014. The estimated amount, value, and calories of postharvest food losses at the retail and consumer levels in the United States. USDAERS Economic Information Bulletin 121.
Byczynski, L. 1997. Storage crops extend the season. Growing for market, 1, 4-5.
Çakmak, B, Alayunt, F, Akdeniz, C, Can, Z and Aksoy, U. 2010. The Assessment of the Quality Losses of Fresh Fig Fruits during Transportation. Tarım Bilimleri Dergisi, 16(3).
Caleb, OJ, Opara, UL and Witthuhn, CR. 2011. Modified atmosphere packaging of pomegranate fruit and arils: a review. Journal of Food and Bioprocess Technology, doi 10.1007/s11947-011-0525-7.
Cantwell, MI., Nie, X and Hong, G. 2009. Impact of storage conditions on grape tomato quality. Sixth ISHS Postharvest Symposium, International Society of Horticultural Science, Antalya, Turkey.
Cecelski, E. 2000. Enabling equitable access to rural electrification: current thinking and major activities in energy, poverty and gender. Briefing Paper. Alternative Energy Policy and Project Development Support in Asia: Emphasis on Poverty Alleviation and Women, Asia Alternative Energy Unit, The World Bank, Washington DC.
Chaudhari, BC, Sonawane, TR, Patil, SM and Dube, A. 2015. A review on evaporative cooling technology. International Journal of Research in Advent Technology, 3(2), 88-96.
Chen, Y, Evans, P, Hammack, TS, Brown, EW and Macarisin, D. 2016. Internalization of Listeria monocytogenes in whole Avocado. Journal of Food Protection, 79(8), 1440-1445. doi.org/10.4315/0362-028X.JFP-16-075.
Cherono, K and Workneh, TS. 2018. A review of the role of transportation on the quality changes of fresh tomatoes and their management in South Africa and other emerging markets. International Food Research Journal, 25(6), 2211-2228.
Cherono, K, Sibomana, M and Workneh, TS. 2018. Effect of infield handling conditions and time to pre-cooling on the shelf-life and quality of tomatoes. Brazilian Journal of Food Technology. doi.org/10.1590/1981-6723.01617. ISSN 1981-6723.
Chijioke, OV. 2017. Review of evaporative cooling systems. Greener Journal of Science, Engineering and Technological Research. 7(1), 1-20. ISSN: 2276-7835.
Chindambaram, LA, Ramana, AS, Kamaraj, G and Velraj, R. 2011. Review of solar cooling methods and thermal storage options. Renewable and Sustainable Energy Reviews, 15, 3220-3228.
Choudhury, ML. 2005. Recent developments in reducing postharvest losses in Asia-Pacific region. Postharvest management of Fruit and Vegetables in the Asia-Pacific Region. Reports of the APO seminar held in India, 5-11 October 2004 and Marketing and Food Safety: Challenges in Postharvest Management of Agricultural/Horticultural Products in Islamic Republic of Iran, 23-28 July 2005, ISBN: 92-833-7051-1.
Crawford, TZ, Duncan, NC, McGrowder, DA, Crawford, AD, Gordon, LA, Cugala, D, José, L, Mahumane, C and Mangana, S. 2009. Fruit flies’ pest status, with emphasis on the

57
occurrence of the invasive fruit fly, Bactrocera invadens (Diptera: Tephritidae) in Mozambique. African Crop Science Society Conference, Cape Town, September 2009.
Cuce, PM and Riffat, S. 2016. A state-of-the-art review of evaporative cooling systems for building applications. Renewable and Sustainable Energy Reviews, 54, 1240–1249. doi.10.1016/j.rser.2015.10.066.
Dadhich, SM, Dadhich, H and Verma, RC. 2008. Comparative study on storage of fruits and vegetables in evaporative cool chamber and ambient. International Journal of Food Engineering, 4(1), 1-11.
DAFF. 2016. Abstracts of Agricultural Statistics. Department of Agriculture, Forestry and Fisheries. Republic of South Africa.
DAFF. 2017. Annual report. Department of Agriculture, Forestry and Fisheries. Department of Agriculture, Forestry and Fisheries. ISBN: 978-1-86871-438-4.
Damerau, K, Patt, AG and vanVliet, OP. 2016. Water saving potentials and possible tradeoffs for future food and energy supply. Global Environmental Change, 39, 15–25.
David, P, Megan, H, Michele, G, Mathew, Z, Richard, A, Katrina, B, Jeff, E, Benita, H, Ryan, S, Anat, G and Thomas, S. 2002. Renewable Energy: Current and Potential Issues. Biological Science, 52, (12), 1111-1120. doi.10.1641/0006-3568(2002)052.
Davis, J and MacKay, F. 2013. Solar Energy in the Context of Energy Use, Energy Transportation, and Energy Storage [Internet]. University of Cambridge. Cambridge, UK. Available from: http://www.inference.eng.cam.ac.uk/sustainable/book/tex/RSsolar.pdf [Accessed 17 April 2016].
Deirdre, H. 2015. Water relations in harvested fresh produce. The postharvest education foundation. White paper No. 15-01. ISBN 978-1-62027-005-9.
Demirbaş, A. 2006. Global Renewable Energy Resources, Energy Part A: Recovery, Utilization, and Environmental Effects, 28 (8), 779-792. doi.10.1080/00908310600718742.
Deng, Y, Song, X and Li, Y. 2011. Impact of Pressure Reduction Rate on the Quality of Steamed Stuffed Bun. Journal Agricultural Science Technology, 13, 377-386.
Deoraj, S, Ekwue, EI and Birch, R. 2015. An evaporative cooler for storage of fresh fruits and vegetables. West Indian Journal of Engineering, 38(1), 86-95.
Deveci, O, Onkol, M, Unver, HO and Ozturk, Z. 2015. Design and development of a low-cost solar powered drip irrigation system using Systems Modelling Language. Journal of Cleaner Production, 102, 529-544.
Directorate Marketing. 2013. A profile of the South African tomato market value chain. Department of Agriculture, Forestry and Fisheries, Pretoria, South Africa.
Duan, Z, Zhan, C, Zhang, X and Mustafa, M. 2012. “Indirect evaporative cooling: Past, present and future potentials,” Renewable and Sustainable Energy Reviews, 16, 6823-6850.

58
Dzivama, AU. 2000. Performance evaluation of an active cooling system for the storage of fruits and vegetables. Ph.D. Thesis. Ibadan: University of Ibadan.
Ejeta, G. 2009. Revitalising agricultural research for global food security. Food Security, 1, 391-401.
Ekren, O, Yilanci, A, Cetin, E and Ozturk, HK. 2011. Experimental Performance of a PV –Powered Refrigeration System. Journal of Electronics and Electrical Engineering, 8, 114-133.
Elansari, AM and Siddiqui, MW. 2016. Postharvest Management of Horticultural Crops Practices for Quality Preservation. Chapter 1. Recent Advances in Postharvest Cooling of Horticultural Produce.
El-Ramady, HR, Domokos-Szabolcsy, É, Abdalla, NA, Taha, HS and Fári, M. 2015. Postharvest management of fruits and vegetables storage sustainable agriculture reviews, 65–152. New York, NY: Springer.
Emana, B and Gebremedhin, H. 2007. Constrains and opportunities of horticulture production and marketing in Eastern Ethiopia, DCG Report No. 46. Harar, Ethiopia.
Fadeyibi, A and Osunde, ZD. 2011. Measures against damage of some perishable products on transit. Advances in Agriculture, Sciences and Engineering Research, 1(1), 1-8.
Fan, Y, Luo, L and Souyri, B. 2007. Review of solar sorption refrigeration technologies: Development and applications. Renewable and Sustainable Energy Reviews, 11, 1758-1775.
FAO. 1989. Prevention of post-harvest food losses fruits, vegetables and root crops a training manual. Training Series, 17(2). Rome: Italy.
FAO. 2003. Handling and preservation of fruits and vegetables by combined methods for rural areas. Technical Manual, Bulletin 149. Food and Agriculture Organisations of the United Nations, ISBN 92-5-104861-4, Rome.
FAO. 2005. Harvest handling and losses. Food and Agriculture Organisations of the United Nations, Rome
FAO. 2008. The world vegetable center. Newsletter. Food and Agriculture Organisations of the United Nations, Rome.
FAO. 2016. The state of food and agriculture: Climate change, agriculture and food security. Food and Agriculture Organization of the United Nations. Available from: www.fao.org/publications. [Accessed 13 January 2017].
Faris, A. 2016. Review on Avocado Value Chain in Ethiopia. Industrial Engineering Letters, 6(3), 33-40.
Fadiji, T, Coetzee, C, Pathare, P and Opara, UL. 2016. Susceptibility to impact damage of apples inside ventilated corrugated paperboard packages: Effects of package design. Journal of Postharvest Biology and Technology, 111, 286-296.
59
Feng, C, Drummond, L, Zhang, Z, Sun, D-W and Wang, Q. 2012. Vacuum Cooling of Meat Products: Current State-of-the-Art Research Advances. Critical Reviews in Food Science and Nutrition, 52(11), 1024-1038. doi.10.1080/10408398.2011.594186.
Fernandes, L, Saraiva, JA, Pereira, JA, Casal, S and Ramalhosa, E. 2018. Post-harvest technologies applied to edible flowers: a review. Food Reviews International, doi.10.1080/87559129.2018.1473422.
Finocchiaro, P, Beccali, M and Nocke, B. 2012. Advanced solar assisted desiccant and evaporative cooling system with wet heat exchangers. Solar Energy, 86, 608-618.
Flores Gutiérrez, AA. 2000. Manejo Postcosecha de Frutas y Hortalizas en Venezuela. Experiencias y Recomendaciones. 2nd edit. UNELLEZ, San Carlos, Cojedes, Venezuela, 86-102.
Fluri, TP. 2009. The potential of concentrating solar power in South Africa. Energy Policy, 37(12), 5075-5080.
Foxon, TJ. 2018. Energy and economic growth. Why we need a new pathway to prosperity. Routledge, 711 Third Avenue, New York, NY, 10017.
Gebru H and Belew, D. 2015. Extent, Causes and Reduction Strategies of Postharvest Losses of Fresh Fruits and Vegetables – A Review. Journal of Biology, Agriculture and Healthcare, 5(5).
Getinet, H, Workneh, TS and Woldetsadik, K. 2008. The effect of cultivar, maturity and storage environment on quality of tomatoes. Food Engineering, 87, 467-478.
Gharezi, M, Joshi, N and Sadeghian, E. 2012. Effect of Post-Harvest Treatment on Stored Cherry Tomatoes. Journal of Nutrition Food Science, 2(8). doi.org/10.4172/2155-9600.1000157.
Godish, T. 1991. Air Quality. Chelsea (MI): Lewis Publishers.
Goel, S and Sharma, R. 2017. Performance evaluation of standalone, grid connected and hybrid renewable energy systems for rural application: A comparative review. Renewable and Sustainable Energy Reviews, 78, 1378-1389.
Gomez-Lopez, VM. 2012. Decontamination of Fresh and Minimally Processed Produce. John Wiley and Sons. Inc., 9600 Garsington Riad, Oxford, United Kingdom.
Goudarzi, N and Zhu, WD. 2013. A review on the development of wind turbine generators across the world. International Journal of Dynamics and Control, 1(3), 192-202. doi.org/10.1007/s40435-013-0016-y
Gupta, J and Dubey, RK. 2018. Factors Affecting Post-Harvest Life of Flower Crops: A review. International Journal of Current Microbiology and Applied Sciences, 7(1), 548-557. doi.org/10.20546/ijcmas.2018.701.065.
Gustavsson, J, Cederberg, C, Sonesson, U, Van Otterdijk, R and Meybeck, A. 2011. Global food losses and food waste: extent, causes and prevention, FAO Rome.

60
Hagos, DG. 2014. Supply Chain Management (SCM) Approach to Reduce Post-Harvest Losses with Special Emphasis on Cabbage Supply from Akaki to Addis Ababa. A Thesis Submitted to the School of Graduate Studies of Addis Ababa University in Partial Fulfillment of the Requirement for the Degree of Master of Science in Civil Engineering.
Han, JW, Qian, JP, Zhao, CJ, Yang, XT and Fan, BL. 2017. Mathematical modelling of cooling efficiency of ventilated packaging: Integral performance evaluation. International Journal on Heat and Mass Transfer, 111, 386-397 doi.org/10.1016/j.ijheatmasstransfer.2017.04.015.
Hands, S, Sethuvenkatraman, S, Peristy, M, Rowe, D and White, S. 2016. Performance analysis & energy benefits of a desiccant based solar assisted trigeneration system in a building. Renewable Energy, 85, 865-879. doi.org/10.1016/j.renene.2015.07.013.
Hao, XL, Zhu, CZ, Lin, YL, Wang, HQ, Zhang, GQ and Chen, YM. 2013. Optimizing the pad thickness of evaporative air-cooled chiller for maximum energy saving. Energy and Buildings, 61, 146-152.
Hardenburg, RE., Watada, AE and Wang, CY. 1986. The Commercial Storage of Fruits, Vegetables, and Florist and Nursery Stocks, USDA Handbook No. 66 (revised), 136. USDA, Washington, USA.
Hassan, HZ and Mohamad, AA. 2012. A review on solar cold production through absorption technology. Renewable Energy and Sustainable Energy Reviews, 16, 5331-5348.
Heimiller, D. 2005. Africa Annual Direct Normal Solar Radiation [Internet]. Economic Community of West African States Accra, Ghana. Available from: http://en.openei.org/wiki/File:NREL-africa-dir.pdf. [Accessed 18 April 2016].
Helm, M, Keil, C, Heibler, S, Mehling, H and Schweigler, C. 2009. Solar heating and cooling system with absorption chiller and low temperature latent heat storage: energetic performance and operational experiment. International Journal of Refrigeration, 32(4), 596-606.
Hera, D, Drughean, L and Girip, A. 2007a. Improvement of the energy efficiency in the refrigeration plants. 22nd International Congress of Refrigeration, 1, 859-865. ISBN: 978-1-62276-045-9.
Hera, D, Ilie, A and Dumitrescu, R. 2007b. Aspects regarding the energy efficiency’s increase in the case of refrigeration systems and heating pumps in Bucharest-Romania. 22nd International Congress of Refrigeration, 5, 4136-4143. ISBN: 978-1-62276-045-9.
Hossain, MS, Madlool, NA, Rahima, NA, Selvaraja, J, Pandeya, AK and Khan, AF. 2016. Role of smart grid in renewable energy: An overview. Renewable and Sustainable Energy Reviews, 60, 1168-1184. doi.org/10.1016/j.rser.2015.09.098.
Husain, I, Patierno, K, Zosa- Feranil, I and Smith, R. 2016. Fostering Economic Growth, Equity, and Resilience in Sub-Saharan Africa: The Role of Family Planning. USAID Report 2016.
Idah, PA, Ajisegiri, ESA and Yisa, MG. 2007. Fruits and vegetables handling and transportation in Nigeria. AU Journal of Technology, 10(3), 175–183.

61
Irtwange, SV. 2006. Application of modified atmosphere packaging and related technology in postharvest handling of fresh fruits and vegetables. Agricultural Engineering International, 4, 1-12.
Ito, H, Takase, N and Sato, E. 1988. Effect of low temperature on keeping quality of butterbur during distribution. Research Bulletin of the Aichi ken Agricultural Research Center 20: 269-277, ISSN 0388-7995.
James, SJ, Swain, MJ, Brown, T, Evans, JA, Tassou, SA, Ge, YT, Eames, I, Missenden, J, Maidment, G and Baglee, D. 2009. Improving the energy efficiency of food refrigeration operations. Proceedings of the Institute of Refrigeration, Session 2008-09. 5-1-5-8.
James, SJ and James, C. 2011. Improving energy efficiency within the food cold chain. 11th International Congress on Engineering and Food (ICEF) 22-26 May 2011. Athens, Greece.
James, A and Zikankuba, V. 2017. Postharvest management of fruits and vegetable: A potential for reducing poverty, hidden hunger and malnutrition in sub-Sahara Africa. Cogent Food and Agriculture, 3, 1312052. doi.org/10.1080/23311932.2017.1312052.
Jani, DB, Mishra, M and Pradeep, KS. 2018. A critical review on application of solar energy as renewable regeneration heat source in solid desiccant – vapor compression hybrid cooling system. Journal of Building Engineering, 18, 107-124. doi.org/10.1016/j.jobe.2018.03.012.
Jedermann, R, Nicometo, M, Uysal, I and Lang, W. 2017. Reducing food losses by intelligent food logistics. Food Control, 77, 221-234.
Jha, SN and Kudas Aleskha, SK. 2006. Determination of physical properties of pads for maximising cooling in evaporative cooled store. Agricultural Engineering, 43(4), 92-97.
Jiro, S. 2002. Method of preserving fresh food. US patent No. US2002/0037347A1.
Joas, J and Lechaudel, M. 2008. A comprehensive integrated approach for more effective control of tropical fruit quality. Stewart Postharvest Review, 4, 1-14.
Johnson, GI and Sangchote, S. 1994. Control of postharvest diseases of tropical fruits: Challenges for the 21st century. In: Postharvest handling of fruits, ACIAR Proceedings, 50, 140-161.
Johnson, GI, sharp JL, Mine, DL and Oostluyse, SA. 1997. Postharvest technology and quarantine treatments. In: Litz R E, (Ed). The Mango: Botany, Production and Uses, 44-506. Tropical Research and Education Center, Florida, USA.
Jradi, M and Riffat, S. 2014. Experimental and numerical investigation of a dew-point cooling system for thermal comfort in buildings. Applied Energy, 132, 524–535.
Kabir, E, Kumar, P, Kumar, S, Adelodun, AA and Kim, KH. 2018. Solar energy: Potential and future prospects. Renewable Energy Reviews, 82, 894-900.
Kader, AA. (Ed.). 2002. Postharvest technology of horticultural crops, third ed. Cooperative Extension of University of California, Division of Agriculture and Natural Resources, University of California, Davis, CA, Publication no. 3311.

62
Kader, AA. 2003. A perspective on postharvest horticulture (1978-2003). HortScience, 38, 1004-1008.
Kader, AA. 2005. Increasing food availability by reducing postharvest losses of fresh produce. Acta Horticulturae, 682, 2168-2175.
Kader, AA. 2010. Handling horticultural perishables in developing countries versus developed countries. Acta Horticulturae, 877, 121-126.
Kapilan, N, Manjunath, GM and Manjunath, HN. 2017. Computational Fluid Dynamics Analysis of an Evaporative Cooling System. Strojnícky casopis–Journal of Mechanical Engineering, 66, 117-124.
Kasso, M and Bekele, A. 2018. Post-harvest loss and quality deterioration of horticultural crops in Dire Dawa Region, Ethiopia. Journal of the Saudi Society of Agricultural Sciences, 17, 88-96.
Katundu, M, Hendriks, S, Bower and Siwela, M. 2010. Can sequential farming help smallholder
organic farmers meet consumer expectations for organic potatoes? Food Quality and
Preference, 21, 379-384.
Kenghe, R, Fule, N and Kenghe, K. 2017. Design, development and performance evaluation of an on-farm evaporative cooler. International Journal of Science Technology and Society, 3(2-2), 1-5.
Kereth, GA, Lymo, M, Mbwana, HA, Mongi, RJ and Ruhembe, C. 2013. Assessment of postharvest handling practices: knowledge and losses of fruits in Bagamoyo districtof Tanzania. Food Science and Quality Management, 11, 8-15.
Khan, J and Arsalan, MH. 2016. Solar power technologies for sustainable electricity generation – A review. Renewable and Sustainable Energy Reviews, 55, 414-425. doi.org/10.1016/j.rser.2015.10.135.
Khare, V, Nema, S and Baredar, P. 2016. Solar–wind hybrid renewable energy system: A review. Renewable and Sustainable Energy Reviews, 58, 23-33. ISSN 1364-0321. doi.org/10.1016/j.rser.2015.12.223.
Kiaya, V. 2014. Post-harvest losses and strategies to reduce them. New York, NY: Action Contre la Faim (ACF International).
Kim, BS, Kim, DC, Lee, SE, Nahmgoong, Choi, MJ and Joong, MC. 1995. Freshness prolongation of crisphead lettuce by vacuum cooling. Agricultural Chemistry and Biotechnology, 38(3), 239-247.
Kim, DS and Ferreira, CAI. 2008. Solar refrigeration options – a state of the art review. International Journal of Refrigeration, 31, 3-15.
Kitinoja, L, AlHassan, HA, Saran, S, and Roy, SK. 2010. Identification of appropriate postharvest technologies for improving market access and incomes for small horticultural farmers in

63
sub-Saharan Africa and South Asia. IHC Postharvest Symposium August 23, 2010. Lisbon, Portugal.
Kitinoja, L and Thompson, JF. 2010. Pre-cooling systems for small-scale producers. Stewart Postharvest Review, doi.10.2212/spr.2010.2.2.
Kitinoja, L, Saran, S, Roy, SK and Kader, AA. 2011. Postharvest technology for developing countries: challenges and opportunities in research, outreach and advocacy. Journal of Science Food Agriculture, 91, 597-603.
Kitinoja, L and AlHassan, HY. 2012. Identification of appropriate postharvest technologies for small-scale horticultural farmers and marketers in Sub-Saharan Africa and South Asia – Part 1. Postharvest losses and quality assessments. Acta Horticulturae, 31–40.
Knee, M and Miller, AR. 2002. Mechanical Injury. In: (ed) Knee, M. Fruit quality and its biological basis, 157-179. Sheffield academic press, Sheffield.
Kobiler, I, Akerman, M, Huberman, L and Prusky, D. 2010. Integration of pre- and postharvest treatments for the control of black spot caused by Alternaria alternata in stored persimmon fruits. Postharvest Biology and Technology, 59, 166–171.
Korir, MK, Mutwiwa, UN, Kituu, GM and Sila, DN. 2017. Effect of near infrared reflection and evaporative cooling on quality of mangoes. Agricultural Engineering International: CIGR Journal, 19(1), 162–168.
Kritzinger, I, Theron, KI, Lötze, GFA and Lötze, E. 2018. Peel water vapour permeance of Japanese plums as indicator of susceptibility to postharvest shriveling. Scientia Horticulturae, 242, 188-194. doi.org/10.1016/j.scienta.2018.07.033.
Kyriacou, MC and Rouphel, Y. 2018. Towards a new definition of quality for fresh fruits and vegetables. Scientia Horticulturae, 234, 463-469. doi.org/10.1016/j.scienta.2017.09.046
Laguerre, O, Hoang, HM and Flick, D. 2013. Experimental investigation and modelling in the food cold chain: Thermal and quality evolution. Trends in Food Science and Technology, 29, 87-97.
Lambrinos, G, Assimaki, H, Manolopoulou, H, Sfakiotakis, E and Porlimgis, J. 1997. Air pre-cooling and hydro-cooling of Hayward Kiwifruit. Acta Horticulturae, 444, 561-566.
La Roche, PM. 2012. “Passive Cooling Systems,” in Carbon Neutral Architectural Design, Boca Raton, FL: CRC Press. 7, (7.4), 242-258.
Lewis, NS. 2016. Research opportunities to advance solar energy utilization. Review. Science, 351, 627, doi.10.1126/science. aad1920.
Liberty, JT, Ugwuishiwu, BO, Pukuma, SA and Odo, CE. 2013. Principles and application of evaporative cooling systems for fruits and vegetables preservation. International Journal of Current Engineering and Technology, 3(3), 1000-1006.
Liu, YL and Wang, RZ. 2004. Performance prediction of a solar/ gas driving double effect LiBr_ H2O absorption system. Renewable Energy, 29(10), 1677-1695.

64
Macheka, L, Spelt, E, Van Der Vorst, JG and Luning, PA. 2017. Exploration of logistics and quality control activities in view of context characteristics and postharvest losses in fresh produce chains: a case study for tomatoes. Food Control, 77, 221-234. doi.org/10.1016/j.foodcont.2017.02.037.
Maerefat, M and Haghighi, AP. 2010. Natural cooling of stand-alone houses using solar chimney and evaporative cooling cavity. Renewable Energy, 35, 2040-2052.
Maliwichi, LL, Pfumayaramba, TK and Katlego, T. 2014. An analysis of constraints that affect smallholder farmers in the production of tomatoes in Ga-Mphahlele, Lepelle Nkumbi municipality, Limpopo Province, South Africa. Journal of Human Ecology, 47(3), 269–274.
Manaf, IA, Durrani, F and Eftekhari, M. 2018. A review of desiccant evaporative cooling systems in hot and humid climates. Advances Energy Research. doi.10.1080/17512549.2018.1508364.
Mandal, G, Dhaliwal, HS and Mahajan, BVC. 2010. Effect of pre-harvest calcium sprays on post-harvest life of winter guava (Psidium guajava L.). Food Science Technology, 474(4), 501-506.
Mansuri, SM. 2015. Development of Solar Powered Evaporative Cooled Rural Storage Structure for Fruits and Vegetables. MSc Thesis. Indian Agricultural Research Institute. Division Of Agricultural Engineering Indian Agricultural Research Institute. http://www.krishikosh.egranth.ac.in/handle/1/5810021382.
Marriott, NG, Schilling, MW and Gravani, RB. 2018. Principles of food sanitation. 6th edition. Springer. ISBN 978-3-319-67164-2. doi.org/10.1007/978-3-319-67166-6.
Masarirambi, MT, Mavuso, V, Songwe, VD, Nkambule, TP and Mhazo, N. 2010. Indigenous postharvest handling and processing of traditional vegetables in Swaziland: A review. African Journal of Agricultural Research, 5(24), 3333-3341.
Mashau, ME, Moyane, JN and Jideani, IA. 2012. Assessment of post-harvest losses of fruits at Tshakhuma fruit market in Limpopo province, South Africa. African Journal of Agricultural Research, 7(29), 4145-4150.
Mentis, D. 2013. Wind Energy Assessment in Africa A GIS-based Approach. Unpublished Master of Science Thesis, KTH School of Industrial Engineering and Management, vetenskap och konst KTH, Stockholm, Sweden.
Mentis, D, Hermann, S, Howells, M, Welsch, M and Siyal, SH. 2015. Assessing the technical wind energy potential in Africa a GIS-based approach. Renewable Energy, 83, 110-125.
McDonald, K and Sun, DW. 2000. Vacuum cooling technology for the food processing industry. Food Engineering, 45, 55-65.
Misra, D and Ghosh, S. 2018. Evaporative cooling technologies for greenhouses: a comprehensive review. Agricultural Engineering International: CIGR Journal, 20(11), 1-14.
Mordi, JI and Olorunda, AO. 2003. Effect of evaporative cooler environment on the visual qualities and storage life of fresh tomatoes. Food Science Technology, 40(6), 587-591.

65
Moureh, J, Tapsoba, S, Derens, E and Flick D. 2009. Air velocity characteristics within vented pallets loaded in a refrigerated vehicle with and without air ducts. International Journal of Refrigeration, 32 (2), 220-234.
Mpandeli, S and Maponya, P. 2014. Constraints and Challenges Facing the Small-Scale Farmers in Limpopo Province, South Africa. Journal of Agricultural Science, 6(4), 135-143. doi.10.5539/jas. v6n4p135.
Mujahid, M, Gandhidasan, P, Rehman, S and Al-Hadhrami, LM. 2015. A review on desiccant based evaporative cooling systems. Renewable and Sustainable Energy Reviews, 45, 145–159. doi.10.1016/j.rser.2015.01.05.
Mulualem, AM, Jema, H, Kebede, W and Amare, A. 2015. Determinants of Postharvest Banana Loss in the Marketing Chain of Central Ethiopia. Food Science and Quality Management, 37, 52-63.
Nabi, SU, Raja, WH, Kumawat, KL, Mir, JI, Sharma, OC, Singh, DB and Sheikh, MA. 2017. Post Harvest Diseases of Temperate Fruits and their Management Strategies-A Review. International Journal of Pure and Applied Bioscience, 5(3), 885-898. doi.org/10.18782/2320-7051.2981
Nakumuryango, A and Inglesi-Lotz, R. 2016. South Africa’s performance on renewable energy and its relative position against the OECD countries and the rest of Africa. Renewable and Sustainable Energy Reviews, 56, 999-1007. doi.org/10.1016/j.rser.2015.12.013.
Naticchia, B, D’Orazio, M and Persico, I. 2010. Energy performance evaluation of a novel evaporative cooling technique. Energy and Buildings, 42, 1926-1938.
Ndukwu, NM. 2011. Development of Clay Evaporative Cooler for Fruit and Vegetables Preservation. Agricultural Engineering International, CIGR Journal, 13(1), 1-6.
Ndukwu, MC, Manuwa, SI, Olukunle, OJ and Oluwalana, IB. 2013. Development of an active evaporative cooling system for short-term storage of fruits and vegetable in a tropical climate. Agricultural Engineering International: CIGR Journal, 15(4), 307-313.
Ngcobo, MEK. 2013. Resistance to airflow and cooling patterns through multi-scale packaging of table grapes. PhD thesis, Faculty of AgriSciences, Stellenbosch University, Cape Town, South Africa.
Ngcobo, MEK, Delele, MA, Opara, UL, Zietsman, CJ and Meyer, CJ. 2012. Resistance to airflow and cooling patterns through multi-scale packaging of table grapes. International Refrigeration, 35(2), 445-452.
Ngowi, AVF, Mbise, TJ, Ijani, ASM, London, L and Ajayi, OC. 2007. Smallholder vegetable farmers in Northern Tanzania: Pesticides use practices, perceptions, cost and health effects. Crop Protection, 26(11), 1617–1624.
Niewiara, M. 2016. Postharvest loss: Global collaboration needed to solve a global problem. i-ACES, 2, 29–36.

66
Ntombela, S. 2012. South African fruit trade flow. Promoting market access for South African agriculture. Issue No. 6, June 2012. National Agricultural Marketing Council, Pretoria, South Africa.
Nunes, MCN, Emond, JP, Rauth, M, Dea, S and Chauk, V. 2009. Environmental conditions encountered during typical consumer retail display affect fruit and vegetable quality and waste. Postharvest Biology and Technology, 51(2), 232-241.
Nunes, LJR, Matias, JCO and Catalão, JPS. 2016. Biomass combustion systems: A review on the physical and chemical properties of the ashes. Renewable and Sustainable Energy Reviews, 53, 235-242. doi.org/10.1016/j.rser.2015.08.053.
Obura, JM, Banadda, N, Wanyama, J and Kiggundu, N. 2015. A critical review of selected appropriate traditional evaporative cooling as postharvest technologies in Eastern Africa. Agricultural Engineering International: CIGR Journal, 17(4), 327.
Odesola, IF and Onyebuchi, O. 2009. A review of porous evaporative cooling for the preservation of fruits and vegetables. Pacific Journal Science Technology, 27(1), 19-21.
OECD/FAO. 2016. “Agriculture in Sub-Saharan Africa: Prospects and challenges for the next decade”, in OECD-FAO Agricultural Outlook 2016-2025, Paris.
OECD/IEA and IRENA 2017. Chapter [1 to 4] of Perspectives for the energy transition – investment needs for a low-carbon energy system ©OECD/IEA and IRENA 2017.
Ogbuagu, NJ, Oluka SI and Ugwu, KC. 2017. Development of a passive evaporative cooling structure for storage of fresh fruits and vegetables. Journal of Emerging Technologies and Innovative Research, 4(8), 179-186. ISSN-2349-5162.
Okanlawon, SA and Olorunnisola, AO. 2017. Development of passive evaporative cooling systems for tomatoes Part 1: construction material characterization. Agricultural Engineering International: CIGR Journal, 19(1), 178-186.
Oliveira, JFG and Trindade, TCG. 2018. Renewable Energy Sources. In: Sustainability Performance Evaluation of Renewable Energy Sources: The Case of Brazil. Springer, Cham, 19-43. doi.org/10.1007/978-3-319-77607-1-2.
Olosunde, WA. 2006. Performance evaluation of Absorbent materials in the Evaporative cooling system for the storage of fruit and vegetable M.Sc. Project Report, Department of Agricultural and Environmental Engineering, University of Ibadan, Ibadan.
Olosunde, WA, Igbeka, JC and Olurin, TO. 2009. Performance evaluation of absorbent materials in evaporative cooling system for the storage of fruits and vegetables. International Journal of Food Engineering, 5(3), 1–15.
Olosunde, WA, Aremu, AK and Okoko, P. 2016. Computer simulation of evaporative cooling storage system performance. Agricultural Engineering International: CIGR Journal, 18(4), 280-292.
Opara, UL, Al-Ani, R and Al-Rahbi, NM. 2011. Effect of fruit ripening stage on physico-chemical properties, nutritional composition and antioxidant components of tomato (Lycopersicum esculentum) cultivars. Food and Bioprocess Technology, 5, 3236-3243.

67
Otanicar, T, Robert, AT and Patrick, EP. 2012. Prospects for solar cooling – An economic and environmental assessment. Solar Energy, 86, 1287-1299.
Parfitt, J, Barthel, M and Macnaughton, S. 2010. Food waste within food supply chains: quantification and potential for change to 2050. Philosophical Transactions of the Royal Society B-Biological Sciences, 365, 3065-3081.
Pathare, PB, Opara, UL, Vigneault, C, Delele, MA and Al-Said, FA. 2012. Design of packaging vents for cooling fresh horticultural produce: Review paper. Food Bioprocess Technology, 5, 2031-2045.
Paull, RE. 1999. Effect of temperature and relative humidity on fresh commodity quality. Postharvest Biology and Technology, 15, 263-277.
Paull, RE and Duarte, O. 2011. Tropical Fruits, CAB International.
Pereira, CJ. 2014. Understanding fruit and vegetable consumption: A qualitative investigation in Mitchelles Plain sub-district of Cape Town. MSc Thesis. Nutrition dissertation, Faculty of Medicine and Health Sciences, University of Stellenbosch, Stellenbosch, South Africa.
Pinto, AC, Alues, RE and Pereira, MEC. 2004. Efficiency of different heat treatment procedures in controlling disease of mango fruits. In: Proceedings of the seventh International Mango Symposium. Acta Horticulture, 645, 551 -553.
Power, M, Newell, P, Baker, L, Bulkeley, H, Kirshner, J and Smithe, A. 2016. The political economy of energy transitions in Mozambique and South Africa: The role of the Rising Powers. Energy Research and Social Science, 17, 10-19. doi.org/10.1016/j.erss.
Prusky, D. 2011. Reduction of the incidence of postharvest quality losses, and future prospects. Food Security, 3(4), 463-474.
Puran, B and Isaac, WAP. 2017. Postharvest Handling of Indigenous and Underutilized Fruits in Trinidad and Tobago. Chapter 9. doi.org/10.5772/intechopen.70424.
Rahiel, HA, Zenebe, AK, Leake, GW and Gebremedhin, BW. 2018. Assessment of production potential and post‑harvest losses of fruits and vegetables in northern region of Ethiopia. Agriculture and Food Security, 7, 29. doi.org/10.1186/s40066-018-0181-5.
Rahman, MM, Moniruzzaman, M, Ahmad, MR, Sarker, BC and Alam, MK. 2016. Maturity stages affect the postharvest quality and shelf-life of fruits of strawberry genotypes growing in subtropical regions. Journal of the Saudi Society of Agricultural Sciences, 15, (1), 28-37. doi.org/10.1016/j.jssas.2014.05.002
Rajan, ABK and Anandan, SS. 2018. Post-Harvest Management of Fruits and Vegetables in India: Past, Present and Future. TAGA Journal, 1, 2385-2414. ISSN: 1748-0345.
Rayaguru, K, Khan, MK and Sahoo, NR. 2010. Water use optimisation in zero energy cool chambers for short-term storage of fruits and vegetables in coastal area. Food Science Technology, 47(4), 437-441.
Rennie, TJ, Raghavan, GSV, Vigneault C and Gariépy Y. 2001. Trans. ASAE, 44(1), 89-93.

68
Rennie, T, Vigneault, C, DeEll JR and Raghavan, GSV. 2003. Cooling and Storage. Handbook of Postharvest Technology: Cereals, fruits, vegetables, tea and spices. Ed. Chakraverty, MA, Raghavan GSV, Ramaswamy H S. Marcel Dekker Inc., New York (NY), USA, 505-538.
Rolin, VFC and Porte-Agel, F. 2018. Experimental investigation of vertical-axis wind-turbine wakes in boundary layer flow. Renewable Energy, 118, 1-13.
Rudnicki, M and Nowak, J. 1990. Postharvest handling and storage of cut flowers, florists, greens and potted plants. Transport, Chapter 4, 29-66. Chapman and Hall, London.
Ruel, MT, Minot, N and Smith, L. 2005. Patterns and determinants of fruit and vegetable consumption in Sub-Saharan Africa: A multi-country comparison. Background paper for the joint FAO/WHO workshop on fruit and vegetables for health, September 1–3, 2004, Kobe, Japan. Washington, D.C: International Food Policy Research Institute.
Ryall, AL and Pentzer, WT. 1982. Handling, transportation and storage of fruits and vegetables. AVI Publishing Company, Westport, Connecticut, USA.
Sagoo, SK, Little, CL, Griffith, CJ and Mitchell, RT. 2003. A study of cleaning standards and practices in food premises in the United Kingdom. Communication Disorders Public Health, 6, 6-17.
Sahdev, M, Kumar, M and Dhingra, AK. 2016. A review on applications of greenhouse drying and its performance. Agricultural Engineering International: CIGR Journal, 18(2), 395-412.
Sahlot, M and Riffat, SB. 2016. Desiccant cooling systems: a review. International Journal of Low-Carbon Technologies, 489-505. doi.10.1093/ijlct/ctv032.
Said, SAM, El-Shaarawi, MAI and Siddiqui, MU. 2012. Alternative designs for a 24-h operating solar-powered absorption refrigeration technology. International Journal on Refrigeration, doi.org/10.1016/j.ijrefrig.2012.06.008.
Saïdou, M, Mohamadou, K and Gregoire, S. 2013. Photovoltaic Water Pumping System in Niger. Application of Solar Energy. Chapter 07. doi.org/10.5772/54790.
Salami, A, Kamara, AB and Brixiova, Z. 2010. Smallholder Agriculture in East Africa: Trends, Constraints and Opportunities, Working Papers Series N° 105 African Development Bank, Tunis, Tunisia.
Saltveit, ME. 2018. Respiratory Metabolism - Chapter 4. Postharvest Physiology and Biochemistry of Fruits and Vegetables, 73-91. doi.org/10.1016/B978-0-12-813278-4.00004-X.
Samira, A, Woldetsadik, K and Workneh, TS. 2011. Postharvest quality and shelf life of some hot pepper varieties. Journal of Food Science Technology, doi.10.1007/s13197-011-0405-1.
Sandhya. 2010. Modified atmosphere packaging of fresh produce: Current status and future needs. LWT-Food Science and Technology, 43, 381-392.
Saquet, A, Barbosa, A and Almeida, D. 2016. Cooling rates of fruits and vegetables. CYTEF 2016 − VIII Iberian Congress VI Ibero-American Refrigeration Sciences and Technologies. Coimbra-Portugal, 3-6 May, 2016.

69
Saran, S, Roy, SK and Kitinoja, L. 2012. Appropriate Postharvest Technologies for Small Scale Horticultural Farmers and Marketers in Sub-Saharan Africa and South Asia – Part 2. Field Trial Results and Identification of Research Needs for Selected Crops. Proc. XXVIIIth IHC-IS on Postharvest Technology in the Global Market Eds.: MI. Cantwell and DPF. Almeida. Acta Hort, 934, 41-52.
SAYB. 2015. South African Year Book 2014/15, Agriculture. Department of Communication and Information System. Republic of South Africa. ISBN: 978-0-9922078-6-1.
SAYB, 2016. South Africa Year Book 2015/2016. Chapter 3. Agriculture, Forest and Fisheries. ISBN: 978-0-620-72235-3.
SAYB, 2017. South Africa Year Book 2016/2017. Chapter 3. Agriculture, Forest and Fisheries. ISBN: 978-0-620-76429-2.
Saxena, A, Agarwal, N and Srivastava, G. 2013. Design and Performance of solar air heater with long term heat storage. International Journal of Heat and Mass Transfer, 60, 8-16.
Schalkwyk, HD, Groenewald, JA, Fraser, GCG, Obi, A and Tilburg, A. 2012. Unlocking markets to smallholders: Lessons from South Africa Mansholt publication series - l, 10. doi.10.3920/978-90-8686-168-2.
Schneider, SH, Easterling, WE and Mearms, LO. 2000. Adaptation: Sensitivity to natural variability, agent assumptions, and dynamic climatic changes. Climatic Change, 45, 203-221.
Senol, R. 2012. An analysis of solar energy and irrigation systems in Turkey. Energy Policy, 47, 478-486.
Sekyere, CKK, Forson, FK, Amo-Aidoo, A and Afriyie, JK. 2016. Experimental Studies on an Evaporative Cooler as an option to mitigate post-harvest losses experienced by commercial producers of vegetables in Ghana. International Journal of Engineering Trends and Technology, 33(9), 453-461. ISSN: 2231-5381.
Senthilkumar, S, Vijayakumar, RM and Kumar, S. 2015. Advances in Precooling techniques and their implications in horticulture sector: A Review. International Journal of Environmental & Agriculture Research, 1(1), 24-30.
Seweh EA, Darko, A, Addo, JO, Asagadunga, PA and Achibase. S. 2016. Design, construction and evaluation of an evaporative cooler for sweet potatoes storage. Agricultural Engineering International: CIGR Journal, 18 (2), 435-448.
Sheahan, M and Barrett, CB. 2017. Review: Food loss and waste in Sub-Saharan Africa. Food Policy, 70, 1–12.
Shitanda, D, Oluoch, OK and Pascall, AM. 2011. Performance evaluation of a medium size charcoal cooler installed in the field for temporary storage of horticultural produce. Agricultural Engineering International: CIGR Journal, 13(1).
Shirazi, A, Pintaldi, S, White, SD, Morrison, GL, Rosengarten, G and Taylora, RA. 2016. Solar-assisted absorption air-conditioning systems in buildings: Control strategies and

70
operational modes. Applied Thermal Engineering, 92, 246-260. doi.org/10.1016/j.applthermaleng.2015.09.081.
Sibomana, MS, Workneh, TS and Audain, K. 2016. A review of postharvest handling and losses in the fresh tomato supply chain: a focus on Sub-Saharan Africa. Journal of Food Security, 8, 389-404. doi.10.1007/s12571-016-0562-1.
Sibomana, MS, Ziena, LW and Schmidt, S. 2017. Influence of transportation conditions and postharvest disinfection treatments on microbiological quality of fresh market tomatoes (cv. Nemo-netta) in a South African supply chain. Journal Food Protection, 80(2), 345–354.
Siddiqi, M (Ed.) and Ali, A. (Ed.). 2016. Postharvest Management of Horticultural Crops. New York: Apple academic press. eBook ISBN 9781771883351.
Singh-Negi, P and Kumar–Roy, S. 2000. Effect of low-cost storage and packaging on quality and nutritive value of fresh and dehydrated carrots. Science of Food and Agriculture, 80(15), 2169-2175.
Singh, S, Singh, AK, Joshi, HK, Lata, K and Bagle, BG. 2010. Effect of zero energy cool chamber and post-harvest treatments on shelf-life of fruits under semi-arid environment of Western India. Food Science Technology, 47(4), 446-449.
Singh, V, Hedayetullah, M, Zaman, P and Meher, J. 2014. Postharvest Technology of Fruits and Vegetables: An Overview. Journal of Post-Harvest Technology, 2, 124-135.
Sinha, NK, Hui, YH, Evranuz, EÖ, Siddiqi, M and Ahmed, J. 2011. Handbook of vegetables and vegetable processing, Whiley-Blackwell, John Wiley & Sons.
Sirisomboon, P, Tanaka, M and Kojima, T. 2012. Evaluation of tomato textural mechanical properties. Journal of Food Engineering, 111(4), 618–624.
Sitorus, T, Ambarita, H, Ariani, F and Sitepu, T. 2018. Performance of the natural cooler to keep the freshness of vegetables and fruits in Medan City. IOP Conference Series: Materials Science and Engineering, 309, 012089. doi.10.1088/1757-899X/309/1/012089.
Snowdon, AL. 1992. A colour atlas of post-harvest diseases and disorders of fruits and vegetables: Volume 2, Vegetables. CRC Press, Boca Raton, FL.
Sontake, VC and Kalamkar, VR. 2016. Solar photovoltaic water pumping system - A comprehensive review. Renewable and Sustainable Energy Reviews, 59, 1038-1067.
Sood, M, Kaul, RK, Bhat, A, Singh, A and Singh, J. 2011. Effect of harvesting methods and postharvest treatments on quality of tomato. Journal of Food Science and Technology, 12(1), 58-62.
Sun, W and Wang, L. 2004. Experimental investigation of performance of vacuum cooling for commercial large cooked meat joints. Journal of Food Engineering, 61(4), 527–532.
Sun, W and Zheng, L. 2006. Vacuum cooling technology for the agri-food industry: Past, present and future. Food Engineering, 77, 203-214.

71
Sunmonu, M, Falua, KJ and David, AO. 2014. Development of a low-cost refrigerator for fruits and vegetables storage. International Journal of Basic and Applied Science, 2(3), 85-93.
Swain, MJ, Evans, JE and James, SJ. 2009. Energy consumption in the UK food chill chain – primary chilling. Food Manufacturing Efficiency, 2(2), 25-33.
Szabo, S, Bódis, K, Huld, T and Moner-Girona, M. 2011. Energy solutions in rural Africa: mapping electrification costs of distributed solar and diesel generation versus grid extension. Environmental Research Letters, 6(3), 1-9.
Takayuki, A, Tetsuya, T, Shigeyasu, T and Shigeki, H. 2014. Calculation Method for Forced-Air Convection Cooling Heat Transfer Coefficient of Multiple Rows of Memory Cards. Journal of Electronics Cooling and Thermal Control, 4, 70-77. doi.org/10.4236/jectc.2014.43008.
Tanner, D and Smale, N. 2005. Sea transportation of fruits and vegetables: an update. Stewart Postharvest Review, 1(1), 1-10.
Tassou, SA, Lewis, JS, Ge, YT, Hadawey A and Chaer, I. 2010. A review of emerging technologies for food refrigeration applications. Applied Thermal Engineering, 30, 263276.
Taye, SM and Olorunisola, PF. 2011. Development of an evaporative cooling system for the preservation of fresh vegetables. African Journal of Food Science, 5(4), 255–266.
Tefera, A, Workneh, TS and Woldetsadik, K. 2007. Effects of disinfection, packaging, and storage environment on the shelf life of Mango. Bio-systems Engineering, 96(2), 201-212.
Thompson, JF and Chen, YL. 1988. Comparative energy uses of vacuum, hydro, and forced air coolers for fruits and vegetables. ASHRAE Transactions, 92, 1427-33.
Thompson, JF, Mitchell, FG, Rumsey, TR, Kasmire, RF and Crisoto CC. 1998. Commercial cooling of fruits, vegetables and flowers, Publication No. 21567, 61-68. DANR publication, UC Davis, USA.
Tigist, M, Workneh, TS and Woldetsadik, K. 2011. Effects of variety on quality of tomato stored under ambient temperature conditions. Food Science Technology, 50(3), 467-478. doi.10.1007/s13197-011-0378-0.
Tijskens, E. 2007. Impact damage of apples during transport and handling. Post- harvest Biology Technology, 45(2), 157-167.
Tiwari, GN and Jain D. 2001. Modelling and optimal design of evaporative cooling system in controlled environment greenhouse. Energy Conversion and Management, 43, 2235-2250.
Toivonen, PMA. 2007. Fruit maturation and ripening and their relationship to quality. Steward Postharvest Review, 3, 1-5.
Tolesa, GN and Workneh, TS. 2017. Influence of storage environment, maturity stage and pre-storage disinfection treatments on tomato fruit quality during winter in KwaZulu-Natal, South Africa. Journal of Food Science and Technology, 54(10), 3230-3242. doi.10.1007/s13197-017-2766-6.

72
Toshwinal, U and Karale, SR. 2013. A review paper on Solar Dryer. International Journal of Engineering Research, 3(2), 2248-9622.
Tscharntke, T, Milder, JC, Schroth, G, Clough, Y, Declerck, F, Waldron, A, Rice, R and Ghazoul, J. 2015. Conserving Biodiversity through Certification of Tropical Agroforestry Crops at Local and Landscape Scales. Journal of the Society for Conservation Biology, 8(1), 14-23. doi.10.1111/conl.12110.
Twidell, J and Weir, T. 1986. Renewable Energy Sources. E. and F.N. Spon, London, U.K.
Tyagi, VW, Panwar, NL, Rahim, NA and Kothari, R. 2012. Review on solar air heating system with and without thermal energy storage. Renewable and Sustainable Energy Reviews, 16, 2289 -2303.
Tyagi, S, Sahay, S, Imran, M, Rashmi, K and Mahesh, SS. 2017. Pre-harvest Factors Influencing the Postharvest Quality of Fruits: A Review. Current Journal of Applied Science and Technology, 23(4), 1-12. ISSN: 2231-0843.
Tzia, C, Tasios, L, Spiliotaki, T, Chranioti, C and Giannou, V. 2016. Edible coatings and films to preserve quality of fresh fruits and vegetables handbook of food processing. CRC Press. 531–570.
Ugonna, CU, Jolaoso, MA and Onwualu, AP. 2015. Tomato value chain in Nigeria: issues, challenges and strategies. Journal of Scientific and Reports, 7(7), 501-515.
UNDP. 2012. Demographic Projections, the Environment and Food Security in Sub-Saharan Africa. Global Trends and Future Scenarios, New York, 2012.
Vala, KV, Saiyed, F and Joshi, DC. 2014. Evaporative Cooled Storage Structures: An Indian Scenario. Trends in Post-Harvest Technology, 2(3), 22-32.
van Zeebroeck, M, Van linden, V, Ramon, H, De Baerdemaeker, J, Nicolaï, BM and Tijskens, E. 2007. Impact damage of apples during transport and handling. Post-harvest Biology Technology, 45(2), 157-167.
Vigneault, C, Sargent, SS and Bartz, JA. 2000. Postharvest decay Risk Associated with Hydro-cooling Tomatoes. Plant Disease, 84(12), 1314-1318.
Vigneault, C, Thompson, J and Wu, S. 2009. Designing container for handling fresh horticultural produce. Postharvest Technologies for Horticultural Crops, 2, 25-47.
Vonasek, E and Nitin N. 2016. Influence of vacuum cooling on Escherichia coli O157:H7 infiltration in fresh leafy greens via a multiphoton-imaging approach. Appl Environ Microbiol, 82,106–115. doi.10.1128/AEM.02327-15.
Wakholi, C, Cho, BK, Mo, C and Kim, MS. 2015. Current state of postharvest fruit and vegetable management in East Africa. Journal of Biosystems Engineering, 40, 238–249. doi.org/10.5307/JBE.2015.40.3.238.
Wang, LJ and Sun, DW. 2001. Rapid cooling of porous and moisture foods by using vacuum cooling technology. Trends in Food Science and Technology, 12, 174-184.

73
Wang, K, Abdelazizo, O, Kisari, P, Vineyard, EA. 2011. State –of –the- art review on crystallization control technologies for water/ LiBr absorption heat pumps. International Journal of Refrigeration, 34(6), 1325-1337.
Watkins, CB. 2006. The use of 1-methylecyclopropene (1-MCP) on fruits and vegetables. Biotechnological Advance, 24, 389-409.
Wills, RBH, McGlasson, WB, Graham, D, Tlee, H and Hall, EG. 1989. Postharvest: - An introduction to the physiology and handling of fruit and vegetables, (3rd edition). Van Nostrand Reinhold, New York, USA.
Wills, R, Glasson, M, Graham, D and Joyce, D. 1998. Postharvest: An Introduction to the Physiology and Handling of Fruit, Vegetables and Ornamentals, (4th edition). University of New South Wales Press, New York, USA.
Wills RBH and Golding JB. 2016. Postharvest: An introduction to the physiology and handling of fruit and vegetables. NewSouth Publishing. Sydney Australia. ISBN 9781742247854.
Wilson, LG, Boyette, MD and Estes, EA. 1999. Postharvest handling and cooling of fresh fruits, vegetables and flowers for small farms. Horticulture information leaflets, 800-Chapter 17, 804. North Carolina Cooperative Extension Service, USA.
Workneh, TS. 2007. Present status and future prospects of postharvest preservation technology of fresh fruit and vegetables in Ethiopia. Journal of the Ethiopian Society of Chemical Engineers, 10(1), 1-11.
Workneh, TS. 2010. Feasibility and economic evaluation of low-cost evaporative cooling system in fruit and vegetables storage. African Journal of Food Agriculture, Nutrition and Development, 10(8), 2984-2997.
Workneh, TS and Woldetsadik, K. 2004. Forced ventilation evaporative cooling: A case study on banana, papaya, orange, mandarin, and lemon. Tropical Agriculture, 8(1), 401- 404.
Workneh, TS and Osthoff, G. 2010. A review on integrated agro-technology of vegetables. African Journal of Biotechnology, 9(54), 9307-9327.
World Bank. 2011. Missing food: the case of postharvest grain losses in Sub-Saharan Africa. Report No. 60371-AFR, NW, Washington, DC.
Xichun, W, Jianlei, N and Van Paassen, AHC. 2008. Raising evaporative cooling potentials using combined cooled ceiling and MPCM slurry storage. Energy and buildings, 40(9), 1691–1698.
Xuan, YM, Xiao, F, Niu, XF, Huang, X and Wang, SW. 2012. Research and application of evaporative cooling in China: A review (I) - Research. Renewable and Sustainable Energy Reviews, 16, 3535-3546.
Yahia, EM. 2011. Modified and controlled atmospheres for the storage, transportation, and packaging of horticultural commodities, CRC press.

74
Yousuf, B, Qadri, OS and Srivastava, AK. 2018. Recent developments in shelf-life extension of fresh-cut fruits and vegetables by application of different edible coatings: A review. LWT, 89, 198-209. doi.org/10.1016/j.lwt.2017.10.051
Zagory, D and Kader, AA. 1988. Modified atmosphere packaging of fresh produce. Food Technology, 70-77.
Zenebe, W, Ali, M, Derbew, B, Zekarias, S and Adam, B. 2015. Assessment of Banana Postharvest Handling Practices and Losses in Ethiopia. Journal of Biology, Agriculture and Healthcare, 5(17).
Zhai, XQ, Qu, M, Yue, LI and Wang, RZ. 2011. A review for research and new design options of solar absorption cooling systems. Renewable and Sustainable Energy Reviews, 15, 4416-4423.
Zhang, Z and Sun, DW. 2006. Effect of cooling methods on the cooling efficiencies and qualities of cooked broccoli and carrot slices. Journal of Food Engineering, 77, 320-326.
Zhao, CJ, Jia-Wei Han, J-W, Yang, X-T, Qian, J-P and Fan, B-L. 2016. A review of computational fluid dynamics for forced-air cooling process. Applied Energy, 168, 314-331.
Zheng, LY and Sun, DW. 2006. Innovative Applications of Power Ultrasound during Food Freezing Processes - A Review, Trends in Food Science and Technology, 17(1), 16-23.
Zou, Q, Opara LU and McKibbin, R. 2006. A CFD modeling system for airflow and heat transfer in ventilated packaging for fresh foods: II. Computational solution, software development, and model testing. Journal of Food Engineering, 77(4), 1048-1058.
Zude, M. 2009. Optical Monitoring of Fresh Produce and Processed Agricultural Crops. CRC Press, New York.

75
3 ASSESSMENT OF SOLAR ENERGY SYSTEM INTEGRATED
WITH INDIRECT AIR COOLING COMBINED WITH
DIRECT EVAPORATIVE COOLING Abstract
In this study, a solar photovoltaic (SPV) system generating power to run a 53 m3 storage for indirect
air-cooling combined with evaporating cooling (IAC+EC) for providing a cool environment for
storage of tomatoes was evaluated based on actual performance. The experimental set up consisted
of nine 330 W solar modules, twelve 230 AH batteries for battery bank facility, 145 VDC (60 A)
solar charge controller, 5 kW (125A) inverter, electrical appliances of 290 W ventilation fan and
260 W water pump, psychrometric unit, and 3.8 tonne tomato storage chamber constructed and
assembled on site. The psychrometric unit consisted of three-cooling pad layer and 1 760 W
indirect heat exchanger. The modules had a short circuit current (Isc) and open circuit voltage (Voc)
of 8.69 A and 44.8 V respectively and were arranged in a three series-three strings and were used
in conjunction with a three string-48V system bank facility. The performance evaluation of the
system was done under no-load and sample-load, with full recirculation of air inside the cold
storage chamber using solar array module yield and efficiencies of the photovoltaic array, inverter,
battery and solar charge controller. Based on the experiment data the SPV system produced 2639
W that is 90% of the calculated theoretical power output. The energy yield of 2 639 W was 11%
higher than the power required in running the electrical appliances for IAC+EC system. Tracking
the SPV system under ambient conditions with an average daily generation during the period of
the experiment, the power and photovoltaic (PV) array efficiencies were 81.2% and 15.1%
respectively. The power output of modules increased with temperature of the module to 24℃ and
declined thereafter. The power generated by the SPV system depended on the climatic variables,
such as solar irradiance availability and ambient temperature at the site and the time of the day. It
was found that the solar array system can be used to power the IAC+EC at daytime during summer
season, and the excess power, which was stored in the battery, could run the system until 22h00 at
night when temperatures were low enough for storage of tomatoes and SPV system was then
switched off. SPV systems can run IAC+EC, which is ideally for small-scale farmers that are not
connected to the national grid as it has low initial capital investment of R 130 190 with a payback
period of 1.9 years for a 53 m3 storage structure.

76
3.1 Introduction Small-scale farmers (SSF) in South Africa have identified the need to access appropriate small-
scale low-cost postharvest technologies for long-term storage of fresh produce to maintain quality
and extend shelf life (Baiphethi and Jacobs, 2009; Mashau et al., 2012; NDP, 2012; IPAP, 2013;
DAFF, 2016; SAYB, 2016). Facilities like mechanical refrigeration, hydro-cooling, forced air-
cooling and vacuum cooling exists but are expensive to SSF because of high initial capital
investments, high energy input, higher production volumes for economies of scale (Tefera et al.,
2007; Baloyi, 2010; Paull and Duarte, 2011; Prusky, 2011; Yahaya and Akande, 2018). Literature
reveals that there is currently no available modernized cooling technology accessible to SSF in
SSA for storage of their fresh produce (Ntombela, 2012; Mashau et al., 2012; Manaf et al., 2018).
This study considers adoption of evaporative cooling system (EC) which is best suited for SSF as
the initial capital and running costs are low and the technology is efficient, economical and has a
potential energy saving of about 75% (Workneh, 2010; Ndukwu et al., 2013; Rajan and Anandan,
2018). EC functions by the removal of sensible heat and therefore works best in hot and dry climate
prevalent in SSA. For EC to be extended to areas, which are hot and sub-humid to humid indirect
air cooling (IAC) has to be considered to be able considerable reduce air temperature before the air
enters the evaporative cooling unit. IAC in addition to EC will be referred as IAC+EC in this
chapter. For IAC to be feasible an indirect heat exchanger is incorporated and the energy
requirements can be supplied by solar energy. Misra and Ghosh (2018) in their recommendations
for further research on EC allude to further investigation on the use of solar and geothermal for
IAC. Therefore, the integration of IAC+EC with solar energy is a new research focus whose results
will provide a cooling facility to SSF in remote areas of SSA with no access to grid electricity.
Use of solar energy has increased in importance in the recent past as an alternative energy source
as prices of grid electricity and fossil fuels escalate (Young, 2013; Damerau et al., 2016; Yahyaoui
et al., 2016; Goel and Sharma, 2017). The use of solar energy in SSA has been limited for domestic
(Chow, 2010) with limited extension to water pumping systems as documented by publications of
Chandel et al. (2015) and Sontake and Kalamkar (2016). The use of solar energy for commercial
fresh produce cooling and storage is still unutilized and undocumented, even though there could
be clear advantages, of low generating costs, suitability for remote areas and being environmentally
friendly (Rehman and Al-Hadhrami, 2010; Parida et al., 2011; Deveci et al., 2015; Sontake and

77
Kalamkar, 2016). In literature, there is no information on the integration of IAC+EC with solar
energy that provides the energy requirements derived from actual performance data for a specific
size of a cooler of storage chamber. In South Africa, the average solar radiation is 4.5–6.5 kWh.m-
2 for 6 -7 hours (Heimiller, 2005; Fluri, 2009; Best et al., 2012; Davis and MacKay, 2013). This
according to Saxena et al. (2013) is enough solar radiation to run a Photovoltaic (PV) system for
rural applications. Solar Photovoltaic (SPV) is an attractive solution providing autonomous fruit
and vegetables (F&V) storage system in remote areas or dispersed populations. The SPV system
provides the autonomous installation with the needed energy, optimal sized in relation to
intermittent climatic parameters of solar radiation and the ambient temperature (Yahyaoui, 2016;
Yahyaoui et al., 2016). For F&V cooling, the removal of heat to achieve optimum storage
conditions, the size of PV modules surface and accessories like charge controller and inverter, the
battery bank capacity are critical (Khatib et al., 2013a; Chandel et al., 2015; Kazem et al., 2017).
The battery bank is to import/export energy depending on need for applications that operate during
both day and night as this study proposes (Kazem et al., 2014).
Though there are arguments that SPV systems are expensive, such systems should find application
for SSF in remote, isolated, dispersed populations or in rugged terrain where it is un-economical
to stretch the utility grid (Shaahid and El-Amin, 2009; Khatib et al., 2013b; Khare et al., 2016).
SPV systems are modular, low maintenance, easy and quick to install. It is easy to expand SPV
systems, as demand increase to generate power where it is required without the need for
transmission line (Olomiyesan et al., 2015). In South Africa with the pending land re-distribution
exercises, new commercial SSF will emerge with an additional burden on the national grid for
more energy requirements that can be met by use of solar energy. The prices of solar panels and
batteries is decreasing year after year (Gopal et al., 2013; GSES, 2015; Foxon, 2018). As prices
fall, farmers will afford to buy more solar panels and batteries thus motivating farmers to migrate
to high value fresh produce and adopt solar powered EC systems. The expected decline in prices
of accessories, the non-availability of studies in energy requirements, and performance assessment
of SPV powered IAC+EC systems under South Africa conditions have motivated this study. If the
installation of solar powered IAC+EC is successful, this will feel the gap in South Africa that could
be created by the land re-distribution with no supporting fresh produce cooling infrastructure.

78
There has been testing of SPV in powering miniature-evaporating coolers of capacities less than a
0.2 tonnes in other countries (Eltawil and Samuel, 2007; Razak et al., 2007; Duffie and Beckman,
2013; Foxon, 2018). There is need to conduct studies that will fully mimic the temporary storage
requirements of SSF and provide evidence of the efficacy of solar energy in such instances.
Currently, there is no literature and data of a cooperation, which used solar energy to power any
IAC+EC system for small-scale cold storage of F&V in SSA. For this to happen, one can consider
a stand-alone solar powered system with a battery storage facility as SPV systems have a sunshine
dependent output that does not necessarily match with the load on a 24-hour cycle. There is no
study on the use of solar energy–battery hybrid to power a water pump, indirect heat exchanger
and fan for IAC+EC. As a result, a hybrid system of solar/battery system is recommended by this
study. To solve this problem and encourage commercial SSF to adopt solar energy as their main
source of power, a demonstration unit was designed and constructed in order to motivate them to
adopt solar power, as it is a sustainable and renewable. This study also will provide data on the
performance of SPV in powering a 3.8 tonne sized storage chamber for tomatoes.
The objective of this study is to:
1. Construction of a small-scale IAC+EC system of 3.8 tonnes storage capacity for tomatoes.
2. Designing, installation and performance evaluation of solar-battery system.
3. Evaluating the performance of SPV-battery based IAC+EC system.
3.2 Materials and Methods This section presents the methodology followed in design, fabrication of solar photovoltaic
(SPV) powered IAC+EC system to attain favourable conditions for tomato storage under
different operating conditions.
3.2.1 Design Specifications The design of the cooling unit provides the optimum storage temperature and relative humidity
(RH) for tomatoes in Pietermaritzburg (PMB) in KwaZulu Natal province. The design and

79
construction of the evaporative cooler premises on the PMB environmental requirements and
considerations with the following specifications:
(a) The SPV should provide energy to drive water pump, heat exchanger and fans. The
following will be considered:
• The design-cooling load to produce the required power for the IAC+EC system will
be determined. The cooling load will determine the ventilation rate (fan rating and
size) for the storage chamber.
• The electrical load considering all appliances (pump, heat exchanger and fans) will be
calculated and this will determine the amount of power required per hour to run the
SPV system.
• Solar panel configurations will be obtained from the total energy required.
• From the amount of power required per hour to run the system, the battery bank
facility will be determined.
• A short-circuit configurations from the solar panels will be used to calculate the solar
charge controller rating and also taking into considerations the numbers of strings.
The solar charge controller will be rated at or above the amperage and voltage
requirements of the solar array system.
(b) The input rating of the inverter size will be at least 25% greater than the cooling and
application loads as the inverter size should be larger than the load size.
(c) The IAC+EC unit had to be able to maintain the temperature inside the storage chamber at
the wet bulb temperature of the prevailing ambient air conditions.
3.2.2 Factors Affecting Performance of the SPV The efficiency factor of PV modules influences the performance ratio of the PV system. The higher
the efficiency of PV modules, the higher the performance value (with corresponding higher solar
irradiation at the location). The efficiency of solar energy conversion for solar cells is 15-19% and
is dependent on whether the solar module is monocrystalline, polycrystalline or thin-films type
(Huang et al., 2013). Monocrystalline modules have the highest energy conversion efficiency;

80
polycrystalline modules are in between, whilst thin-films are least expensive and least efficient in
comparison (GSES, 2015; Bai et al., 2016). Monocrystalline modules were chosen for this study
to ensure we get the highest possible amount of energy from the available solar radiation, the
highest efficiency and least cost from the permutations of the solar array system.
Factors affecting module output
For solar arrays to produce maximum power output, they must be at an optimal tilt angle to trap
maximum radiation (Gunerhan and Hepbasli, 2007; Tripathy et al., 2017). According to Morales
(2010) the optimum tilt angle correlates with latitude and is considered being equal to the latitude
or latitude ± 15o (+ for winter and – for summer). Asowata et al. (2012) and Stanciu and Stanciu
(2014) in their work in nine locations in South Africa recommend that the optimum tilt angle for
a fixed solar collector should be the same as the latitude of the location. The optimal tilt angle
depends on the season and the latitude of the area (Kaddoura et al., 2016). For higher power
output, incorporation of solar trackers allows automatic adjusting of the collector tilt angle of solar
arrays to, follow the sun’s change in elevation during the day and always face the sun (GSES,
2015; Pedro et al., 2016). In this study, no solar tracking device was available and to determine,
the optimum tilt angle historical data for the selected area will be used as provided by Schulze et
al. (1999).
The other factors of consideration are power dissipation, stagnation, conduction losses, efficiency
factors of the inverter and controller and differences in solar cell technologies of the modules (Sun
et al., 2016). The aggregate sun-oriented radiation received at a given geographical location varies
depending on the length of the insolation on a specific day and the power of sunlight-based vitality
(Honsberg and Bowden, 2016; See Appendix 7.2 and Figure 7.4). Variations also arise because of
latitude and the day or time of the year (Morales, 2010; Tripathy et al., 2017). All the factors are
considered in Appendix 7.3 and for this study; the solar radiation values recorded by over 50 years
and captured in the South African Atlas 18 of Agro-hydrology will be used.
3.2.3 Installation of SPV System The experiments were carried out at Ukulinga research station which is a research station for the
University of KwaZulu Natal in PMB in South Africa (30º24’S, 29º24’E). The experimental set up

81
consisted of SPV panels, battery bank facility, charge controller and inverter, and evaporative
cooling unit, storage chamber constructed and assembled on site (Eltawil and Samuel, 2007). The
cooling unit consisted of indirect heat exchanger (M14-20, 8874 BTU/Hr) (see Appendix 7.1 and
Appendix 7.9) with performance rating of 1760 W and three-layer charcoal granules cooling pads.
A 31/33 W (UF25GC12, AC 115 V, 50/60 Hz) constant speed positive pressure fan was connected
to the indirect heat exchanger to facilitate airflow across the heat exchanger. A 290 W fan was
directly mounted at the entrance of the storage chamber 0.5 m above the floor to ventilate the
storage chamber 3.6 m. s-1.
The solar array system consisted of 9 x 330 W modules (2.01 m x 1.02 m, SETSOLAR
manufacturer) installed and fixed on one rectangular metal manual tilt-frame and mounted facing
south on an inclined angle of tilt = -15o as recommended by Strnadel et al (2013) and Ronoh (2017).
Inclining modules prevents accumulation of dust on their surface and contributes to a natural
cooling effect according Li et al. (2005). To avoid shading on the PV modules, panels were
positioned away from trees and buildings that could throw shadows resulting in modules absorbing
less solar irradiation than normal and thus affecting the efficiency of the system (Ramaprabha and
Mathur, 2009). The panels were dusted and dirty was removed from the surface to ensure no soiling
according to Sun et al. (2016).
Figure 3.1 Schematic diagram of the solar energy process flow
Solar panels
Charge controller
Batteries
Inverter
Pump, fans, heat- exchanger

82
The manually operated frame allowed tilting to angle of tilt = -15o that resulted in optimum power
output. The modules were at 2 m distance from the storage chamber. The circuit output voltage of
each module at the point of peak power output is 44.80 V and short circuit current is about 8.69 A.
The above values were at the specified standard test conditions (STC) of 1000 W.m-2 solar radiation
at 25℃ cell operating temperature and an air mass of 1.5. Under field conditions, the output power
is normally less than the rated peak power. The power generated from the SPV modules was
transmitted to the solar charge controller prior to charging the solar batteries and the inverter
converted DC to AC. Figure 3.1 is a schematic layout of the solar system and also shows how the
rest of the components were connected.
The solar charge controller (SANTAKUPS, PC16-6015F) ensured constant voltage and current to
the load from the batteries according to Deveci et al. (2015). The solar charge controller had
maximum input ratings of 60 A current and DC voltage of 145 VDC. A 5-kW inverter (125 A
Sinowave, P11-LW5000NC48-C) with rated efficiency of 85% was chosen as its characteristics
match the system in terms of voltage input, AC power output, efficiency, frequency and voltage
regulation as described by Chandel et al. (2015). Twelve fully charged 230 AH batteries (Gel) with
a 90% efficiency arranged as a three-string 48V system were utilised to start the experiments and
this temporarily stored energy generated by solar panels for overnight use. The distance between
the battery and the inverter was made as short as possible. The wiring chosen ensured that the
voltage loss of the PV system and batteries was less than 0.5% (Eltawil and Samuel, 2007; Saxena
et al., 2013). Cable wiring and sizing kept loss of energy as minimal as possible and prevented
overheating. A multi-meter (Fluke 381) measured both open circuit voltage and current, voltage
and current under location and at different positions. Thermocouples connected to data loggers
measured the PV module temperatures at hour intervals as module temperature influences the
performance of solar systems (Sun et al., 2016). The solar radiation data from the South African
Weather Services was used. The various heat load in the storage chamber were calculated using
the standard equations as discussed in section 3.2.4 and the cooling capacity together with the load
from electrical appliances (fan, heat exchanger and water pump) was used to size the solar array
system. The solar array system was sized and modules arranged to produce sufficient voltage and
current to power the electrical appliances and ventilate the storage chamber to the required
environmental conditions.
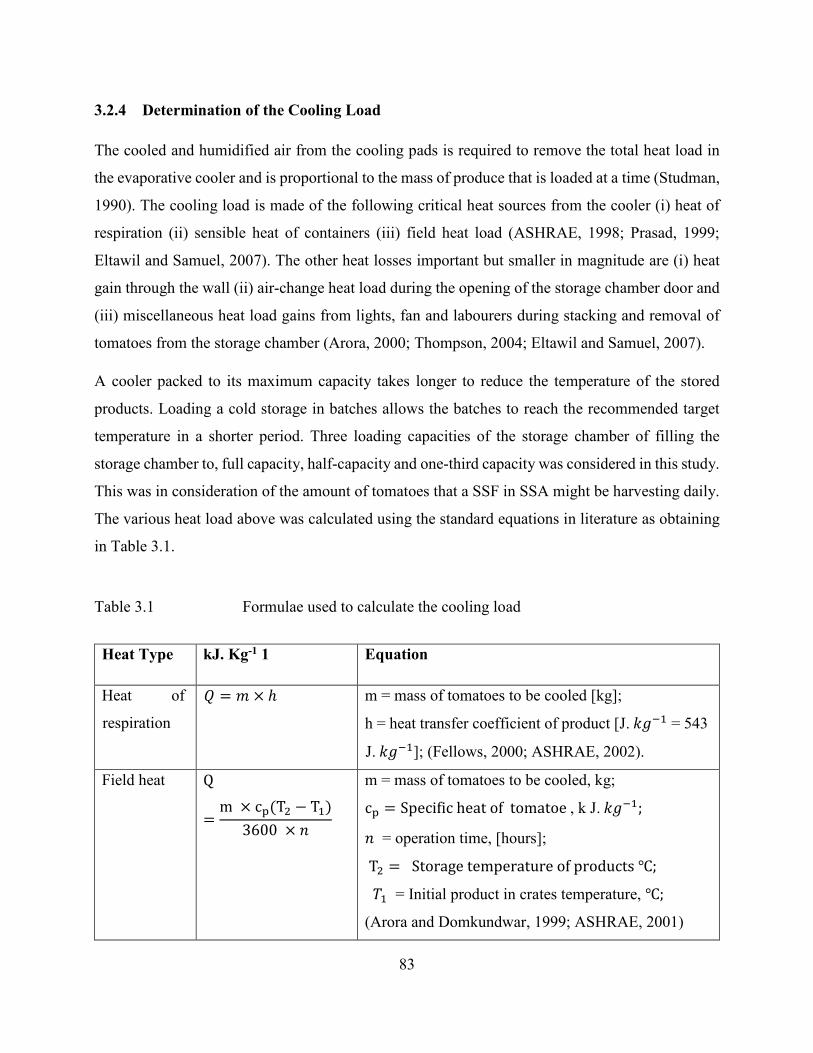
83
3.2.4 Determination of the Cooling Load The cooled and humidified air from the cooling pads is required to remove the total heat load in
the evaporative cooler and is proportional to the mass of produce that is loaded at a time (Studman,
1990). The cooling load is made of the following critical heat sources from the cooler (i) heat of
respiration (ii) sensible heat of containers (iii) field heat load (ASHRAE, 1998; Prasad, 1999;
Eltawil and Samuel, 2007). The other heat losses important but smaller in magnitude are (i) heat
gain through the wall (ii) air-change heat load during the opening of the storage chamber door and
(iii) miscellaneous heat load gains from lights, fan and labourers during stacking and removal of
tomatoes from the storage chamber (Arora, 2000; Thompson, 2004; Eltawil and Samuel, 2007).
A cooler packed to its maximum capacity takes longer to reduce the temperature of the stored
products. Loading a cold storage in batches allows the batches to reach the recommended target
temperature in a shorter period. Three loading capacities of the storage chamber of filling the
storage chamber to, full capacity, half-capacity and one-third capacity was considered in this study.
This was in consideration of the amount of tomatoes that a SSF in SSA might be harvesting daily.
The various heat load above was calculated using the standard equations in literature as obtaining
in Table 3.1.
Table 3.1 Formulae used to calculate the cooling load
Heat Type kJ. Kg-1 1 Equation
Heat of
respiration
𝑄𝑄 = 𝑚𝑚 × ℎ m = mass of tomatoes to be cooled [kg];
h = heat transfer coefficient of product [J. 𝑘𝑘𝑘𝑘−1 = 543
J. 𝑘𝑘𝑘𝑘−1]; (Fellows, 2000; ASHRAE, 2002).
Field heat Q
=m × cp(T2 − T1)
3600 × 𝑛𝑛
m = mass of tomatoes to be cooled, kg;
cp = Specific heat of tomatoe , k J. 𝑘𝑘𝑘𝑘−1;
𝑛𝑛 = operation time, [hours];
T2 = Storage temperature of products ℃;
𝑇𝑇1 = Initial product in crates temperature, ℃;
(Arora and Domkundwar, 1999; ASHRAE, 2001)

84
Heat Type kJ. Kg-1 1 Equation
Sensible
heat from
containers
Q
=m × cp(T2 − T1)
3600 × 𝑛𝑛
m = mass of product to be cooled [kg];
cp = Specific heat of crates[KJ. 𝑘𝑘𝑘𝑘−1];
𝑛𝑛 = operation time [hours];
T2 = Storage temperature of tomatoes[℃ ];
𝑇𝑇1 = Initial tomatoes temperature [℃].
(ASHRAE, 2001 and Fellows, 2000).
Heat
leakages
through
walls, roofs
Q =𝑘𝑘 × A(T2 − T1)
x
(Fellows, 2000;
ASHRAE, 2002)
m = mass of product to be cooled, [kg];
cp = Specific heat of tomatoe [kJ. 𝑘𝑘𝑘𝑘−1];
𝑛𝑛 = operation time [hours];
T2 = Storage temperature of products [℃] and
𝑇𝑇1 = Initial product in crates temperature [℃].
Heat loss
through the
floor
𝑄𝑄𝑓𝑓 = 𝐹𝐹𝐹𝐹(𝑇𝑇𝑜𝑜 − 𝑇𝑇𝑖𝑖) F = perimeter heat loss factor [W.m-1. K-1] and
P = storage chamber perimeter [m].
(Albright, 1990).
Air-change
load
𝐹𝐹𝑎𝑎= 𝑚𝑚𝑎𝑎(ℎ𝑎𝑎 − ℎ)
+ 𝑚𝑚𝑤𝑤𝐶𝐶𝑝𝑝𝑤𝑤(𝑇𝑇𝑎𝑎 − 𝑇𝑇)
(ASHRAE, 2002)
Pa = air change load [W];
ma = mass of air entering the chamber/hr [kg. s-1];
ha = enthalpy of ambient air [kJ.kg-1];
mw = mass of water condensing in chamber/hr
[kg];
h = enthalpy of air in the storage chamber [kJ.kg-1];
Cpw = specific heat capacity of water [kJ.kg-1. ºC-1];
Ta = ambient air temperature [°C] and
T = air temperature inside the chamber [°C].
Operators
and lights
𝑄𝑄𝑂𝑂&𝐿𝐿
=𝑄𝑄
3600 × 𝑛𝑛
Q = Total amount of heat that lights and operators
release in the chamber [kW], and
n = number of hours per day [hours].
(Fellows, 2000)

85
Using the formulae, the amount of heat load to be removed when the storage chamber is filled with
tomatoes to full capacity is 8 220 W and when filled to one-third capacity is 4 252 W (see Table
7.5 and Table 7.6 in Appendix 7.5). When the tomatoes have cooled to the required storage
temperature, part of the cooling is no longer necessary. Less cooling is required to maintain the
required temperature in the store and the cooling system can operate for a shorter period or the
cooling capacity can be reduced.
According to Thompson (2004), the design load is calculated as:
𝐷𝐷𝐷𝐷𝐷𝐷𝐷𝐷𝑘𝑘𝑛𝑛 𝑙𝑙𝑙𝑙𝑙𝑙𝑙𝑙 = 1.1 × 𝐴𝐴𝐴𝐴𝐴𝐴𝐴𝐴𝑙𝑙𝑙𝑙 𝑙𝑙𝑙𝑙𝑙𝑙𝑙𝑙 (3.1)
Therefore, 𝐷𝐷𝐷𝐷𝐷𝐷𝐷𝐷𝑘𝑘𝑛𝑛 𝑙𝑙𝑙𝑙𝑙𝑙𝑙𝑙 = 1.1 × 4252 𝑊𝑊 = 4677 𝑊𝑊
From the cooling load of 4677 W the required ventilation rate for the storage chamber is 0.234 m-
3. s-1 requiring a 308,7/6-6/P3HL/25/PA @1.440 min-1 fan which provides an air-flow rate of 0.278
m-3. s-1 at static pressure of 68.27 Pa with a power rating of 290 W and air velocity of 3.6 m. s-1
(Appendix 7.6).
3.2.5 Design Load Including Appliances The designed solar array system accommodates the cooling load in the storage chamber and the
appliances that include a heat exchanger with fan, second fan ventilating the storage chamber and
water pump and operates for 5 hours into the night.
Total load (w) = 1760 + 290 + 260 = 2310 𝑊𝑊
The power required in a day here referred to as the daily (w-h) is calculated from the equation
Daily (w − h) = Total Power Consumption × Operating Hours × Loss factor (3.2)
Therefore, Daily (w − h) = 2310 × 5 × 1.2 = 13860 𝑊𝑊
The allowable battery discharge is limited at a minimum of 50% to prolong their shelf life.
Therefore, the daily watt-hours at 50 % discharge doubles to obtain the system capacity using the
following equation that divides the daily (w-h) by 0.5.
50% depth of depletion of the battery = Watt Hours/day 0.5
(3.3)

86
50% depth of depletion of the battery =13860
0.5= 27720 Wh
Power produced/h = Total Power Consumption×Operating Hours×Loss factor Sunshine hours
(3.4)
Power producedhour
=27720
6.7= 4137.3 W. h − 1
Therefore, this system will produce 4 137.3 W. h-1 to cool 3 825 kg of tomatoes.
3.2.6 Determination of Bank Capacity The battery capacity was determined with reference to the electrical appliances’ specifications for
the daily watt-hours at 50% discharge and this is in accordance with Linden (2002) as given in
equation (3.5). The required battery size bank to store / supply required amp-hours is;
Battery Bank Capacity = System Capacity System Voltage
(3.5)
Therefore, the battery bank capacity using a 48V system = 2772048
= 577 𝐴𝐴𝐴𝐴
The battery bank capacity is 577 AH using a 48-V system and available battery in the market is a
230 AH with a 90% efficiency. The number of batteries required to run the system with 3 825 kg
of tomatoes is
Number of strings of 48V system =Battery Bank Capacity
AH of battery=
527230
= 2.5~3
Therefore, the total number of batteries is 4 × 3 = 12 𝑏𝑏𝑙𝑙𝐴𝐴𝐴𝐴𝐷𝐷𝑏𝑏𝐷𝐷𝐷𝐷𝐷𝐷
3.2.7 Determination of Charging Battery to Full Capacity The time required to fully charge the batteries is important as it helps understand how long it takes
to fully-charge the batteries to run the system during non-effective sunlight periods. The charging
time to fully-charge the batteries is defined by equation 3.6:
𝑄𝑄𝑡𝑡 = 𝐶𝐶′
𝐼𝐼𝐶𝐶 (3.6)

87
Where, Qt = charging time (hours); C′ = battery capacity (AH) and C′ = 1.4 × C;
IC = charge current of the battery (A) and,
𝐼𝐼 𝐶𝐶 = 10% × 𝐶𝐶; Where, C = rated capacity of the battery (Ah) = 230 AH;
• 𝐼𝐼 𝐶𝐶 = 10% × 230𝐴𝐴 = 23𝐴𝐴 and Cˈ = 1.4 × 230 = 322 𝐴𝐴𝐴𝐴
• 𝑄𝑄𝑡𝑡 = 32223
= 14 ℎ𝑙𝑙𝐴𝐴𝑏𝑏𝐷𝐷
Therefore, the charging time to full capacity when the battery has been discharged to 50% depletion
is 14 hours.
3.2.8 Design of the Charge Controller The solar array system should produce sufficient current and voltage to the cooling load and
associated applications and according to Eltawil and Samuel (2007). To achieve this the system
can be connected either in parallel or in series or a combination of both. When solar panels are in
series, the voltage is increased and when in parallel the current is increased (Smith, 1976). The
best option to achieve the power requirements for this study is having three solar panels in series
of three strings, considering the inverter and charge controller sizes. The charge controller controls
the charging and discharging of the battery by providing a constant current and voltage to the load
from batteries (Deveci et al., 2015). For the power requirements of this study the available charge
controller is a TriStar solar charge controller (t 60) with a maximum rated input current of 60 A
and DC voltage of 145 VDC.
The input power to the solar charge controller is given by equation 3.7
𝐹𝐹𝑜𝑜𝑜𝑜𝑡𝑡 = ƞ𝑐𝑐𝑜𝑜𝑐𝑐𝑡𝑡𝑐𝑐𝑜𝑜𝑐𝑐𝑐𝑐𝑐𝑐𝑐𝑐 × 𝐹𝐹𝑖𝑖𝑐𝑐 (3.7)
Where
Pout = power output from inverter (W);
ƞc = efficiency of the charge controller from the supplier (90%) and
Pin = power input to the charge controller.

88
3.2.9 Design of the Inverter The inverter powers the equipment (pump, fans and heat exchanger) that may require 2-3 times the
running wattage power; therefore, the inverter of the system was sized to be more than the actual
power requirement of the whole system. An inverter of 5 kW, 48 V with a 125 A-fuse was used.
The input power to the inverter system is output power from the charge controller (equation 3.8).
The output power can be calculated by incorporating the efficiency of the inverter.
𝐹𝐹𝑜𝑜𝑜𝑜𝑡𝑡 = ƞ𝐼𝐼 × 𝐹𝐹𝑖𝑖𝑐𝑐 (3.8)
Where
Pout = power output from inverter (W); ȠI = efficiency of the inverter from the supplier (90%) and
Pin = power input to the inverter.
3.2.10 Solar Panels Specifications The solar panels available in the market that were used are monocrystalline solar modules with the
specifications summarized in Table 3.2.
Table 3.2 Electrical characteristic of the solar modules
Description Measurement Units
Nominal Power (Pmax) 350 W
Rated Voltage (Vmpp) 36.6 V
Rated Current (Impp) 8.2 A
Short Circuit Current (Isc) 8.7 A
Open Circuit Voltage (Voc) 44.8 V
Minimum Power 330 W
Quantity 9 -

89
The specifications are from the manufacturer at nominal operating cell temperature with an
insolation of 1000 W. m−2, the cell temperature at 25℃ and air mass at 1.5.
3.2.11 Optimisation of the Number of Modules for the SPV System The optimization of the hybrid SPV system considering the number and sizes of modules and
batteries will require a balance between the system voltage and current that will supply the required
power (Erdinc and Uzunoglu, 2012). A number of combinations need to considered, series, parallel
and combination of both in different permutations as recommended by Goel and Sharma (2017).
A parallel connection with two panels in series will provide the following scenario;
The output voltage will be: 𝑂𝑂𝐴𝐴𝐴𝐴𝑂𝑂𝐴𝐴𝐴𝐴 𝑣𝑣𝑙𝑙𝑙𝑙𝐴𝐴𝑙𝑙𝑘𝑘𝐷𝐷 = 3 × 44.8 𝑉𝑉𝐷𝐷𝐶𝐶 = 134.4 𝑉𝑉𝐷𝐷𝐶𝐶
The output current will be: 𝑂𝑂𝐴𝐴𝐴𝐴𝑂𝑂𝐴𝐴𝐴𝐴 𝐴𝐴𝐴𝐴𝑏𝑏𝑏𝑏𝐷𝐷𝑛𝑛𝐴𝐴 = 3 × 8.7 𝐴𝐴 = 26.1 𝐴𝐴
Total power output: 𝐹𝐹𝑙𝑙𝑃𝑃𝐷𝐷𝑏𝑏 𝑜𝑜𝑜𝑜𝑡𝑡𝑝𝑝𝑜𝑜𝑡𝑡 = 134.4 × 26.1 = 3507.8 𝑊𝑊
Hence, the solar array system was a three-series-three-strings i.e. consisting of three solar modules
in series and parallel to other two sets (Figure 3.2). In each set, the modules were connected in
series and the sets were connected in parallel to each other. This arrangement was ideally for the
system, as it did not overload the available solar charge controller.
𝐼𝐼𝐴𝐴 𝑏𝑏𝑙𝑙𝐴𝐴𝐷𝐷𝑛𝑛𝑘𝑘 = 𝑁𝑁 × 𝐼𝐼𝐷𝐷𝐴𝐴
𝐼𝐼𝐴𝐴 𝑏𝑏𝑙𝑙𝐴𝐴𝐷𝐷𝑛𝑛𝑘𝑘 = 3 × 8.7 = 26.1 𝐴𝐴
The average monthly power output (Pout) from the optimal solar radiation was calculated using
equation 3.9.
𝐹𝐹𝑜𝑜𝑜𝑜𝑡𝑡 = ƞ𝑝𝑝𝑎𝑎𝑐𝑐𝑐𝑐𝑐𝑐 × 𝐺𝐺 × 𝐴𝐴𝑝𝑝𝑎𝑎𝑐𝑐𝑐𝑐𝑐𝑐 × 𝑁𝑁𝑝𝑝𝑎𝑎𝑐𝑐𝑐𝑐𝑐𝑐𝑝𝑝 (3.9)
Where
Pout = average monthly power output (W);
ηpanel = overall PV module efficiency (=0.1522);
Npanels = number of PV modules (9);
Apanel = area of the module, m2 = 2.01m x 1.02m = 2.0502 m2 and

90
G = solar radiation (W.m-2).
The energy produced at the minimum solar radiation was calculated from Equation 3.10.
𝐸𝐸𝑝𝑝𝑐𝑐𝑜𝑜𝑝𝑝𝑜𝑜𝑐𝑐𝑐𝑐𝑝𝑝 = 𝑃𝑃𝑜𝑜𝑜𝑜𝑜𝑜×𝐷𝐷1𝑁𝑁𝑝𝑝𝑝𝑝𝑝𝑝𝑝𝑝𝑝𝑝𝑝𝑝×𝐴𝐴𝑝𝑝𝑝𝑝𝑝𝑝𝑝𝑝𝑝𝑝
(3.10)
Eproduced = energy produce on a day length Dl (Wh. m−2) and
Dl = average monthly day length (hours);
Figure 3.2 Solar Photovoltaic system for the evaporative cooling system
3.2.12 Optimisation of Power Output from the Solar Panels Tilt angle of a solar panel impacts on the solar radiation incident on a surface. To optimize the
power output from the solar panels, different tilt angles of the panels were taken into consideration
in this study. Solar insolation is a function of latitude and tilt angle of the panel according to
Honsberg and Bowden (2016) and equation 3.11 shows the relationship.

91
𝑆𝑆ℎ = 𝑆𝑆𝑖𝑖 × Sinα (3.11)
Where
Sh = horizontal solar radiation (W. m−2);
Si = incident solar radiation (W. m−2) and;
α = elevation angle (0).
The solar radiation on the module at the module tilt angle (𝛽𝛽) was calculated from the incident
solar radiation (Honsberg and Bowden, 2016).
𝑆𝑆𝑚𝑚𝑜𝑜𝑝𝑝𝑜𝑜𝑐𝑐𝑐𝑐 = 𝑆𝑆𝑖𝑖 𝑆𝑆𝐷𝐷𝑛𝑛(𝛼𝛼 + 𝛽𝛽) (3.12)
Where β = solar module tilt angle (0) and Smodule = solar module radiation (W. m−2).
To optimize the power output from the solar panels, different tilt angles of the panels were taken
into consideration in this study. Solar insolation is calculated from equation 3.11
𝑆𝑆ℎ = 𝑆𝑆𝑖𝑖 × Sinα
Therefore,
𝑆𝑆𝑖𝑖 =𝑆𝑆ℎ
Sinα
In order to optimise solar radiation the tilt angle was varied with ± 460 to the latitude of PMB. For
the months of June and September considering tilt angles of (i) tilt = horizontal plane (ii) tilt =+150,
tilt = latitude and tilt = -150. The experiments in this study were conducted during the last week of
August into the third week of September, however solar radiation data for June was also considered
as it is the month that PMB receives the least radiation.
3.2.13 Performance Evaluation The solar radiation values recorded by Schulze et al. (1999) over 50 years’ and captured in the
South African Atlas 18 of Agro-hydrology and climatology for PMB were extracted to obtain the
average solar radiation for each month at different tilt angles. The solar radiation data at Ukulinga
Research Station for selected 11 days during the experiment where the maximum temperatures

92
were above 27℃ was obtained from the South African Weather Services (SAWS). On the first day
of the experiment, the battery bank facility powered the SPV system under load conditions while
connected to the charge controller until the system cut off. The following day the batteries were
charged under load conditions from 08h00 to 17h00 and the system was then discharged from
17h00 until 10h00 under load conditions. As the batteries were charging, the voltage was recorded
from the charge controller at 30 minutes’ intervals from 08h00 to 17h00 during the charging period
and during the discharge period when the SPV was using power stored in the battery bank facility.
On the days of the experiment, the solar modules supplied the energy requirements during the day
from 08h00 to 17h00 and thereafter the battery bank supplied energy until 22h00 when the system
was switched off. By 22h00, the temperature had fallen below 20℃. A voltage greater than the
battery voltage was applied to the system causing current to flow through the battery in the reverse
direction to that when the battery is supplying current and in this way the battery was charged. The
rate of charge or current that flowed depended on the difference between the battery voltage and
the voltage that the solar panels supplied. The series voltage of the system of 44.8 V was capable
of producing over 50 volts in the 48V-battery system thus ensuring that the batteries fully charge.
The charge controller ensured that the batteries were not over charged otherwise they would be
damaged.
During evaluation, there were five positions (Figure 3.3) identified to evaluate the performance of
the solar array system. A Fluke 381 multi-meter measured both open circuit voltage and current,
voltage and current under location and different positions.
For position 1, the simultaneous readings of current and voltage were measured using a multi-meter
at the exit point of the panels and at the entrance point of the solar charge controller.
The test procedures to be followed are:
The power output tests were done by measuring both the voltage and current at different points
and these values were used to calculate the power output using the Ohm’s Law.
(a) Measurements at position 1 of the system (the input side of the solar charge controller).
The voltage and current measured at this point were used to calculate solar modules
power output and was compared with the theoretical calculation of the power output
from the solar modules;

93
(b) Position 2 measures both voltage and current at the exit of the charge controller and the
input of the inverter. The difference in the readings obtained from position 1 and 2
determines the efficiency of the charge controller;
(c) Position 3 read voltage and current to and from the batteries, and
(d) Position 4 read current and voltage between the inverter and heat exchanger, pump and
fans. The power difference between position 2 and 4 determines the inverter efficiency,
which will be compared to the manufacturer’s efficiency. Measurements at this point
also provides how much power the appliances draw.
Figure 3.3 Schematic diagram showing points of measurements of current and voltage
3.2.14 Payback Evaluation The costs of establishing storage facilities should be determined prior to choosing the storage
facility unless there are no options because of extenuating circumstances like choice of renewable
energy because SSF are located in remote, dispersed areas with no access to grid electricity. The
predominant costs for storage facilities are construction, operation and maintenance (Emily et al.,
2015; Sahdev et al., 2016). The installation costs were obtained from enumerating the material
used and labour to construct the IAC+EC system i.e. psychrometric unit, storage chamber and SPV
system. The cost analysis of choosing a facility involves considering the payback which Newnan
(2002) defined as the investment of time required for the project of an investment to equal the cost
of the investment period. The payback period for this study was calculated using the equation by
Workneh (2010) and Wang et al. (2015):
Solar
panels Charge controller
Batteries (4x12 V)
Inverter Pump /1
3
2 4
Storage chamber

94
𝐹𝐹𝑙𝑙𝑃𝑃𝑏𝑏𝑙𝑙𝐴𝐴𝑘𝑘 𝑂𝑂𝐷𝐷𝑏𝑏𝐷𝐷𝑙𝑙𝑙𝑙 (𝑃𝑃𝐷𝐷𝑙𝑙𝑏𝑏𝐷𝐷) =𝐼𝐼𝑛𝑛𝐷𝐷𝐴𝐴𝐷𝐷𝑙𝑙𝑙𝑙 𝐴𝐴𝑙𝑙𝐷𝐷𝐴𝐴𝐷𝐷
𝐶𝐶𝑙𝑙𝐷𝐷𝐴𝐴 𝐷𝐷𝑙𝑙𝑣𝑣𝐷𝐷𝑛𝑛𝑘𝑘𝐷𝐷 𝑂𝑂𝐷𝐷𝑏𝑏 𝑃𝑃𝐷𝐷𝑙𝑙𝑏𝑏 3.11
The operating costs are zero rated for comparison as the same farm workers will be used to operate
the IAC+EC and are therefore no additional labour is required. The maintenance costs are assumed
as 10% of the initial costs per annum according to Emana and Nigussie (2011).
𝑀𝑀𝑙𝑙𝑛𝑛𝐴𝐴𝐷𝐷𝑛𝑛𝑙𝑙𝑛𝑛𝐴𝐴𝐷𝐷 𝐴𝐴𝑙𝑙𝐷𝐷𝐴𝐴𝐷𝐷 = 0.10 𝑥𝑥 𝐷𝐷𝑛𝑛𝐷𝐷𝐴𝐴𝐷𝐷𝑙𝑙𝑙𝑙 𝐴𝐴𝑙𝑙𝐷𝐷𝐴𝐴𝐷𝐷 3.12
3.3 Results and Discussions
3.3.1 Theoretical Power and Energy The performance of SPV systems depends on the tilt angle and orientation of the array. In studying,
the effect of insolation on modules a solar tracking device helps in adjusting the position of the
solar panels so that the highest possible energy output obtains compared to a fixed PV system.
This necessitates that installations of the modules be at an optimal tilt angle that maximizes the
solar radiation captured by PV panels. In the absence of a tracker for this study, data obtained by
Schulze et al. (1999) over 50 years who used four positions of solar radiation at horizontal, tilt =
+150, tilt =latitude and tilt =-150 to measure solar radiation received in different areas in South
Africa was used. The solar radiation data at different tilt angles data for PMB is summarised in
Tables 7.1 to Table 7.4 in Appendix 7.3. This data is utilised for calculating the optimum power
and energy output from the SPV in Ukulinga research station (in PMB). Table 3.3 is a summary
of the solar radiation at different tilt angles and the solar radiation at optimised solar radiation
taken over a period of 50 years extracted from Schulze et al. (1999). The average optimum solar
radiation received in PMB in June and September are 539.93 W.m-2 at tilt = +150 and 1 168.66
W.m-2 at tilt = -150 respectively as shown in Table 3.3. A fixed optimum tilt angle equal to -150
latitude for September was used for PMB as provided by Schulze et al. (1999) as he did a more
detailed work covering the whole of South Africa than Asowata et al. (2012) and Stanciu and
Stanciu (2014) who recommended one fixed tilt angle equal to the latitude of the area. Table 3.3
shows that the value for tilt =-150 is higher than the value for tilt =latitude for the month of
September in PMB.

95
Table 3.3 Summary of solar radiation at different tilt angles (Adopted from Schulze et al.,
1999).
Radiation in W. m-2 at different tilts
Month Horizontal Tilt = +15 Tilt = Lat Tilt = -15 Optimal
radiation
Optimal
power
Jan 1 032.41 1 032.59 1 127.00 1 144.61 1 144.61 3 214.48
Feb 873.02 897.27 928.93 897.27 928.93 2 608.77
Mar 807.69 725.68 711.03 647.93 807.69 2 268.29
Apr 692.43 545.70 513.90 447.07 692.43 1 944.60
May 540.94 402.29 373.12 318.52 540.94 1 519.16
June 485.23 539.93 508.72 442.83 539.93 1 516.32
July 534.98 631.07 619.84 566.36 631.07 1 772.27
Aug 600.69 840.92 873.06 845.70 873.06 2 451.87
Sept 754.56 1 041.68 1 144.16 1 168.66 1 168.66 3 282.02
Oct 873.66 1 487.48 1 712.79 1 821.37 1 821.37 5 115.06
Nov 1 170.63 1 646.56 1 928.77 2 079.54 2 079.54 5 840.11
Dec 1 263.89 1 318.96 1 524.50 1 626.15 1 626.15 4 566.82
Probability of exceedance is the chance of an event occurring in a given period. In this case, the
probability shows the percentage of the working period in which a given solar irradiance is
exceeded and this helps assess the viability of stand-alone SPV systems at a particular location. At
20% of the time in each month there is a higher radiation received in PMB than in 50% and 80%
of the time i.e. in September there is a 50% chance to receive 1 092.71 W.m-2 and 80% chance to
receive 998.94 W.m-2. As the exceedance probability increases, the amount of radiation received
decreases. Relatively lower percentages are recorded at high irradiance levels and the converse is
true. The high irradiance levels, which are associated with a direct beam component, that is spread
more widely with very small individual frequency percentages. For the purpose of calculation of a

96
50%, exceedance probability is used as it was closer to the values obtained during the period of the
experiment.
Table 3.4 Probability of exceedance of a monthly solar radiation (Adopted from Schulze et
al., 1999).
Month CV Exceedance Probability Solar radiation (W.m-2)
20% 50% 80%
Jan 7.00 1 365.74 1 296.30 1 203.70
Feb 6.00 1 212.52 1 150.79 1 080.25
Mar 6.00 1 051.28 1 004.27 957.26
April 5.00 845.41 809.18 764.90
May 5.00 646.93 614.04 570.18
June 15.10 559.07 530.94 502.81
July 6.00 579.56 548.70 517.83
August 6.00 798.33 756.67 715.00
September 8.00 1 149.90 1 092.71 998.94
October 8.00 1 241.04 1 173.84 1 075.27
November 8.00 1 453.37 1 369.05 1 254.96
December 7.00 1 416.67 1 337.96 1 240.74
From equation 3.9 and solar radiation data from Table 3.4, the theoretical power output is;
𝐹𝐹𝑜𝑜𝑜𝑜𝑡𝑡 = 0.1522 × 530.94 × 2.0502 × 9 = 1491.1 𝑊𝑊, for the month of June and for the month of
September, 𝐹𝐹𝑜𝑜𝑜𝑜𝑡𝑡 = 0.1522 × 1092.71 × 2.0502 × 9 = 3068.7 𝑊𝑊
Therefore, the incident solar radiation calculated for June 2017 and September 2017 where 530.94
W. m−2 producing a module power of 1 491W at tilt = +150 and 1 092.71 W. m−2 producing a
module power of 3 068.7 W at tilt = -150. The theoretical power output in September is very

97
significant and from Table 3.4 the theoretical power output for November will even be higher as
the area receives more solar irradiation in the month. In November, the theoretical power output is
high and coincides with higher cooling loads as the ambient temperature is also relatively higher.
This is the reason why most of the large-scale SPV systems are built in arid and semi-arid areas,
where the solar insolation levels are high (Sayyah et al., 2014). However, caution has to be taken
as high ambient temperature affects performance of the SPV system due to high cell temperature
(Rao et al., 2014; Ronoh, 2017).
From equation 3.10 and Table 3.4, the theoretical energy output is given as:
𝐸𝐸𝑝𝑝𝑐𝑐𝑜𝑜𝑝𝑝𝑜𝑜𝑐𝑐𝑐𝑐𝑝𝑝 = 1491×7.909×2.0502
= 638.4 Wh. m−2 for June and
𝐸𝐸𝑝𝑝𝑐𝑐𝑜𝑜𝑝𝑝𝑜𝑜𝑐𝑐𝑐𝑐𝑝𝑝 = 3068.7×6.709×2.0502
= 1098.9 Wh. m−2 for September.
The design shows that the expected power output is 638.4 Wh. m−2 and 1 114.39 Wh. m−2
respectively for the months of June and September at 50% probability of exceedance for PMB. The
theoretical power and energy are low in June because solar insolation levels are low. To generate
adequate energy under such circumstances would require more solar modules and this would
increase the cost of installation of SPV. The sizing of stand-alone SPV considers meeting electrical
loads requirements with lowest average daily solar insolation on the array surface usually during
winter months. To ensure optimization of the solar insolation a switch could be incorporated to the
system coupling the electrical load (pump, fans and heat exchanger) to the PV array directly when
the storage battery is fully charged. Optimising the system is important, as the cost of installation
is reduced allowing utilisation of SPV by emerging farmers in low cost cooling technologies like
IAC+EC (Chandel et al., 2015; Goel and Sharma, 2017). However, the temperatures are also
generally low in winter (June), and in most cases, the maximum temperatures are 16℃-20℃. Under
such conditions for tomatoes and many tropical and sub-tropical F&V in SSA, either no cooling or
minimal cooling will be required during short periods as alluded to by Kitinoja and AlHassan
(2012) and Punja et al. (2016).
From equation 3.7 the output power from the charge controller is:
Therefore, 𝐹𝐹𝑜𝑜𝑜𝑜𝑡𝑡 = 0.9 × 1491 = 1341.9 𝑊𝑊 in June and 𝐹𝐹𝑜𝑜𝑜𝑜𝑡𝑡 = 0.9 × 3068.7 = 2761.8 𝑊𝑊 in
September. From equation 3.8 the output power of the inverter is:

98
Therefore, 𝐹𝐹𝑜𝑜𝑜𝑜𝑡𝑡 = 0.9 × 1341.9 = 1207.71 𝑊𝑊 in June and 𝐹𝐹𝑜𝑜𝑜𝑜𝑡𝑡 = 0.9 × 2761.8 = 2485.6 𝑊𝑊 in
September.
This means that the power available to run the electrical components during the period of the
experiment is 2 485.6 W. The inverter converts VDC to 220 Volts, hence, the current that should
flow to the electrical components can be obtained from Ohm’s law:
𝐼𝐼𝑎𝑎𝑝𝑝𝑝𝑝𝑐𝑐𝑖𝑖𝑎𝑎𝑐𝑐𝑐𝑐𝑐𝑐𝑝𝑝 =2485.6
220= 11.3 A
3.3.2 PV Module and Theoretical Power Output Ambient air temperature and solar radiation outside the IAC+EC system around the SPV system
was studied, clear and, sunny days were selected for the experiment. It was observed that ambient
temperatures and solar radiation were low in the morning and increased from 08h00 to between
12h00 to 14h00 and thereafter decreased towards 18h00 (Figure 3.4).
Figure 3.4 Variation of solar radiation and ambient temperature at Ukulinga research station in
Pietermartitzburg.
22
25
28
31
34
0
200
400
600
800
1000
1200
8:00 9:00 10:00 11:00 12:00 13:00 14:00 15:00 16:00 17:00 18:00
Am
bien
t Tem
pera
ture
o C
Sola
r-rad
iatio
n, W
m-2
Time of the day in hours from 08h00 to 18h00
Solar-radiation ambient

99
Ambient temperature increased due to increasing incident solar radiation from morning until
afternoon 13h00-14h00 and then decreasing from then onwards towards evening and sunset as also
confirmed by Madhava et al. (2017). The average insolation values rose from 293.4 W.m-2 at 08h00
in the morning to 1 037.6 W.m-2 at mid-day. A similar trend was observed by Eltawil and Samuel
(2007). At any location like PMB, the length of the path the radiation takes from source to ground
level varies with time of the day as the spectrum of the radiation changes through each day because
of the changing absorption and scattering path length (Ronoh, 2017). The graph relates to data
obtained on a clear day where the solar insolation increases from early morning to a peak at midday
and then decreases to zero at night. The peak is achieved at midday as the sun is overhead and its
path length is shortened. At midday, less solar radiation is scattered or absorbed by atmospheric
mediums, and more direct radiation reaches the modules compared to any other time of the day
and Olomiyesan et al. (2015) complements these results.
Figure 3.5 shows the variation of the practical PV and the theoretical solar irradiance with solar
radiation during the period of study from 08h00 to 18h00. The practical PV module output Pmodule
and the theoretical power output from the solar irradiance Pirridance increased with solar radiation
to a peak between 12h00 and 14h00 and decreased thereafter as shown in Figure 3.5. The measured
results from the present study agree with findings of Li et al. (2005). The solar irradiance received
and practical power output had very similar trends with the maximum and minimum values at the
same hours during the selected 11 clear and sunny days. This shows that the amount of electricity
generated by SPV system is largely depended on the availability of the solar energy at a particular
location as corroborated by Li et al. (2005). From Table 3.3 the highest average solar radiation
received in PMB over 50 years in the month of September is 1 168.66 W.m-2 providing an optimal
power of 3 282 W compared to 1 092.7 W.m-2 (Table 3.4) producing 3 068.7 W at 50% probability
of exceedance. The average peak solar radiation during the period of the experiment in August and
September was 1 037.6 W.m-2 providing an optimal power of 2 639.1 W.
The practical power output of 2 639.1 W when using equations 3.2–3.4 translates 4 726.7 W.h-1
actual energy produced by the solar modules and to be stored by batteries in order to cool the 3.8
tonnes of tomatoes from 17h00 to 22h00. To cool one tonne of tomatoes, using IAC+EC requires
1 200 W.h-1. The value of 1 200 W.h-1 compares to the value of 700 W.h-1 for forced air evaporative
cooling of tropical F&V using a 0.1 HP mentioned by Kitinoja and Thompson (2010). The

100
difference in power requirements can be attributable to the additional indirect heat exchanger that
was incorporated in this experiment. The power requirements a solar powered IAC+EC system are
low when compared hydro-cooling (immersion type) to 0 to 2℃ or hydro-cooling (shower type) to
7℃ where the energy required to cool 1 metric tonne of produce is 35-150 kWh.
Figure 3.5 Variation of module power and solar radiation with time for SPV system at
Ulukinga Research Station in Pietermaritzburg.
The theoretical power output from the solar irradiance Pirridance was determined and compared with
the actual power output to establish how much power SPV Pmodule can produce in the month of
September in PMB. Figure 3.5 shows that the practical power output (Pmodule) from the solar
panels of a peak of 2 639 W was 10% less than the theoretical power output (Pirridance) of 2 914 W
during the period of the experiment. However, the practical power output of 2 639 W is 11% higher
the design load for electrical appliances of 2 310 W. The difference between the theoretical and
the practical power output is attributable to the efficiency of the solar panels of 15.4%, which was
lower end of the rated solar panel efficiency of 15-19%. The other contributors are environmental
100
200
300
400
500
600
700
800
900
1000
1100
0
500
1000
1500
2000
2500
3000
8:00 9:00 10:00 11:00 12:00 13:00 14:00 15:00 16:00 17:00 18:00
Sola
r rad
iatio
n W
m-2
Pow
er (W
)
Time of the day
PV Module W Pirradiance W Irradiance W/m2

101
factors of module temperature, soiling material accumulating on the module surfaces, resistance
in the wiring and connections and in some instances, modules of the same type have slight
differences in electrical characteristics. The solar modules need regular cleaning as soiling, is
regarded as one of the significant contributors to reduction of the power output of SPV systems as
it reduces the solar radiation reaching the surface of modules as alluded to by Ghazi et al. (2014).
When modules are soiled, the dust particles deposited on the surface absorb and scatter the
incoming incident light and this might have contributed to the reduction of the Pmodule value
(Sayyah et al., 2014).
The power output increased with module temperature (Figure 3.6) until about 25℃, which
coincided with the highest ambient temperature at midday.
Figure 3.6 Variation of power output with temperature of the solar panels at Ukulinga Research
Station in Pietermaritzburg.
The power output declined after 25℃ module temperature. This corroborates the work done by
Bai et al. (2016) which showed that though solar panels are designed to operate in the presence of
the sun, high heat reduce panels’ capacity to generate power. When the module surface
23
24
25
26
27
28
29
30
31
32
33
500
1000
1500
2000
2500
3000
19 20 21 22 23 24 25 26 27A
mbi
ent
tem
pera
ture
(o C)
Pow
er o
utpu
t (W
)
Temperature of the solar panels (oC)PV Module W Pirradiance W Ambient Temp oC

102
temperature increases beyond a certain level, the atoms in the material vibrate resulting in a
reduction in the conductance of the electron traveling through the electrical component (Olcan,
2015). Many standard grade solar panels may produce 1% less electricity for every 9.44℃
temperature above 25℃ (Bai et al., 2016).
The maximum power of the solar array system was achieved at 31℃-33℃ ambient temperature,
which coincided with optimum solar panel temperature of 25℃. Similar results were obtained by
Ya’acob et al. (2014) who had the highest generated power data at 32.5℃–34.5℃ ambient
temperature. The PV module output voltage remained static with ambient temperature (Table 3.5),
which indirectly affected the temperature of solar panels. The PV module output voltage also did
not change with changes in insolation on the selected days, as the weather was sunny and clear.
Table 3.5 Variation of current and voltage with time of the day, ambient and module
temperature.
Time of the day Panel
Temp℃
Ambient
Temp℃
Voltage
(V)
Current (A) Irradiance
W. m-2
08h00 18.82 23.41 130.09 5.73 293.4
09h00 19.88 25.23 130.83 10.83 557.4
10h00 21.70 27.68 131.01 15.47 796.9
11h00 23.92 29.66 131.62 18.25 944.5
12h00 25.03 31.34 131.67 20.04 1 037.6
13h00 25.11 31.98 131.33 20.08 1 036.9
14h00 25.05 31.84 131.16 17.90 922.9
15h00 22.98 30.39 130.85 14.08 724.4
16h00 21.99 28.42 130.64 9.47 486.3
17h00 20.94 25.45 130.21 5.11 261.6
18h00 20.22 23.11 129.38 2.61 132.6

103
This could be attributable to the fact that module output voltage cannot increase beyond certain
limit of photons equivalent to energy gap as explained by Shaltout et al. (1995). On the selected
days, the short circuit current increased with insolation due to the increase in the number of photons
generating the current. Increased solar panel temperature increases the kinetic energy of the
photons resulting in increased current. The increased PV module temperature arose from high
insolation heating and high ambient temperature. Ramamurthy et al. (1992) made similar
observations.
Solar energy is one of the major sources of renewable energies available in SSA and SPV are
currently utilised in many agricultural applications. For this study the SPV system of 9 modules
(3-series 3 string) of 330 W each and a battery bank (12 x 230 AH) was able to supply the
appliances with the needed electrical power and provided sufficient energy to charge the battery
bank. Optimal sizing of SPV systems in order to supply load demand is important because of high
capital investment costs and benefits of preservation of fresh produce in the case of solar energy
powered IAC+EC systems.
3.3.3 Charging and Discharging of the Battery Bank Facility Figure 3.7 shows the charging-discharging curve for the battery bank for the SPV powering the
IAC+EC system. The system voltage rose from 43.8 V at 08h00 to peak at just above 50 V on both
days. On the selected days, the system voltage increased from 08h00 to 14h00 with increase in
module power output and increase in insolation. The batteries began to discharge from 17h00 when
insolation was lower as the sun approached the west to set. The batteries powered the IAC+EC unit
with all appliances from 17h00 to 22h00. The SPV system powering the IAC+EC was switched
off from this time, as the temperatures were on average lower than 20℃, which is temporarily fine
for storage of tomatoes.
The energy supply from the solar panel charged the batteries for overnight operation of the
IAC+EC system. The battery bank facility was rightly sized and provided enough power for the
electrical appliances until 22h00. The battery bank reliability to supply the required energy
depended on accommodating fluctuations, which are considered as independent, then the energy

104
requirements of discharge and charge events can be considered independently. The achieved
components’ size allowed the load to be supplied during the requested cooling duration, the battery
bank to operate safely, and provided energy for the next five hours into the night during which
period the temperatures will have dropped to 20℃ and lower. The power was switched off at 22h00,
as the ambient temperature by this time was 20℃ and below and fresh produce such as tomatoes
can tolerate temperatures of 13-21℃ for short periods (Kitinoja and AlHassan, 2012; Punja et al.,
2016). This implies that the IAC+EC system can be designed to operate five hours into the night
and then be switched off until 09h00 when ambient temperatures begin to rise above 20℃ (section
4.3.3). Such an approach allowed reduction of the number of solar panels and batteries required to
power the IAC+EC systems and thus in turn reduced the capital investment in the facility.
Figure 3.7 Charging and discharging curve for SPV battery bank
43
44
45
46
47
48
49
50
51
8:00 9:00 10:00 11:00 12:00 13:00 14:00 15:00 16:00 17:00 18:00 19:00 20:00 21:00 22:00
Volta
ge o
f the
48V
bat
tery
faci
lity
Time of the day as the battery charges
Day1 Day2
DischargingCharging

105
3.3.4 Performance Evaluation of the Electrical Components of the Design During evaluation, there were four major tests to evaluate the performance and assess the electrical
components of the design for the 3-string 3-series solar module system and three-string 48 V
battery system. At point 1 (refer to Figure 3.3), voltage and current were measured at the exit point
of the solar modules and at the entrance point of the solar charge controller to determine the voltage
drop through the PV cables.
For measurements taken at the exit point of solar modules, the voltage was 129.1V while the
reading at the entrance point of the charge controller were 127.3V. Therefore,
𝑉𝑉𝑝𝑝𝑐𝑐𝑜𝑜𝑝𝑝 (%) =129.1 − 127.3
127.3× 100% = 1.4%
This practical voltage drops as calculated provides reasonable efficiency of operation occurrence
as the voltage drop is less than 3% as defined by Early et al. (2014).
For the measurements taken at position 1 (Figure 3.3), the input side of the solar charge controller
the voltage was 127.3V and the current was 20.1 A and using Ohms law
𝐹𝐹 = 𝑉𝑉𝐼𝐼 = 127.3𝑉𝑉 × 20.1𝐴𝐴 = 2558.7 𝑊𝑊
Therefore, the power input to the charge controller was 2 558.7 W.
For the measurements at position 3, the average current supplied by the solar to the batteries was
measured to be 18.01 A and the voltage was 127.3 Vdc.
For the measurements at position 2, the exit of the charge controller and the input of the inverter
the measured current and voltage were 19.5 A and 125.4 V
𝐹𝐹 = 𝑉𝑉𝐼𝐼 = 125.4𝑉𝑉 × 19.5𝐴𝐴 = 2445.3 𝑊𝑊
The inverter converted DC to AC, the AC current and voltage measured between the inverter and
the load at position 4 was 19.87 AAC and 205 VAC respectively. And from Ohms law
𝐹𝐹 = 𝑉𝑉𝐼𝐼 = 205𝑉𝑉 × 19.2𝐴𝐴 = 3936 𝑊𝑊
To convert the AC power to DC power to compare with supplied power we use the formula
𝑉𝑉𝐷𝐷𝐶𝐶 = 0.636𝑉𝑉𝐴𝐴𝐶𝐶 = 3936 × 0.636 = 2503.3 𝑊𝑊

106
Hence, the power supplied is enough to run the electrical appliances that include the heat
exchanger, water pump and fan.
The current drawn by the load from the batteries through the inverter was measured to be 19.4
ADC and the voltage was also measured to be 129.1 VDC.
𝐹𝐹 = 𝑉𝑉𝐼𝐼 = 129𝑉𝑉 × 22.8𝐴𝐴 = 2941.2 𝑊𝑊
Therefore, the DC power of 2 941.2 W.
3.3.5 Efficiencies of the Designed System The solar panel efficiency is calculated from the relationship between current and the voltage
measured between the solar panels and the charge controller and theoretical power output of the
solar panels.
ƞ𝑝𝑝𝑜𝑜𝑐𝑐𝑎𝑎𝑐𝑐 𝑝𝑝𝑎𝑎𝑐𝑐𝑐𝑐𝑐𝑐 =𝐹𝐹𝑚𝑚𝑐𝑐𝑎𝑎𝑝𝑝𝑜𝑜𝑐𝑐𝑐𝑐𝑝𝑝𝐺𝐺 × 𝐴𝐴 × 𝑁𝑁
× 100% =2941
1037.6 × 2.0502 × 9× 100% = 15.4%
The efficiency of the solar panels was 15.4% as solar cells have a threshold photon energy
corresponding to the particular energy band gap below which electricity conversion does not take
place. Photons of longer wavelength do not generate electron–hole pairs but only dissipate their
energy as heat in the cell. However, most common PV module converts 4–17% as explained by
Chow (2010) of the incoming solar radiation into electricity. The efficiency of 15.4% is within the
monocrystalline efficiency of 15-19%. The reasons why a low-end efficiency was obtained could
be that solar modules work best when module temperature is below 25℃. Higher ambient
temperatures of above 32℃ increase the module temperatures and that could cause a slight increase
in current as the semiconductor properties of solar cells to shift, resulting in a much larger decrease
in voltage as alluded to by Bai et al. (2016). Some solar panels may produce as much as 1% less
electricity for every -9.44℃ temperature above 25℃. The other reason why there is a variation
could be that the annual peak accumulated output is calculated using the PV module efficiency
under a reference sunlight of irradiance 1 000 W.m-2 with a solar cell temperature of 25℃. In
reality, solar radiation at a location varies with the weather condition; season and time of day, as a
result the technical information provided for STC might not occur in practice.
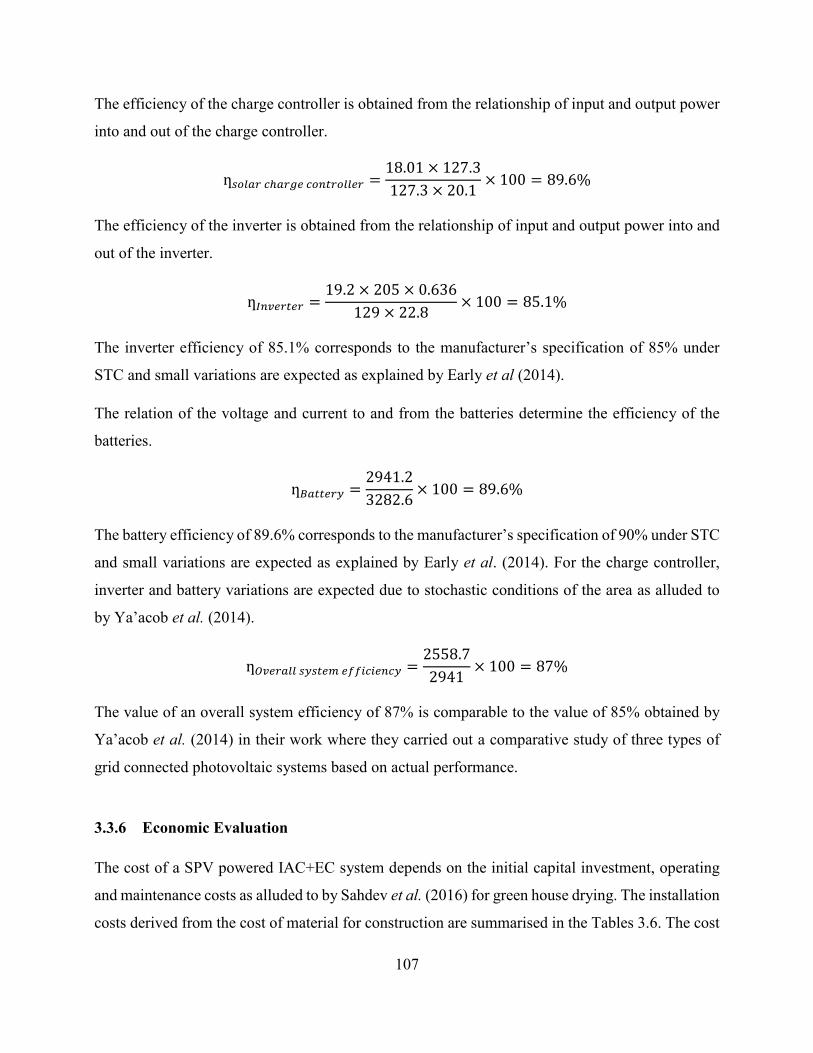
107
The efficiency of the charge controller is obtained from the relationship of input and output power
into and out of the charge controller.
ƞ𝑝𝑝𝑜𝑜𝑐𝑐𝑎𝑎𝑐𝑐 𝑐𝑐ℎ𝑎𝑎𝑐𝑐𝑎𝑎𝑐𝑐 𝑐𝑐𝑜𝑜𝑐𝑐𝑡𝑡𝑐𝑐𝑜𝑜𝑐𝑐𝑐𝑐𝑐𝑐𝑐𝑐 =18.01 × 127.3127.3 × 20.1
× 100 = 89.6%
The efficiency of the inverter is obtained from the relationship of input and output power into and
out of the inverter.
ƞ𝐼𝐼𝑐𝑐𝐼𝐼𝑐𝑐𝑐𝑐𝑡𝑡𝑐𝑐𝑐𝑐 =19.2 × 205 × 0.636
129 × 22.8× 100 = 85.1%
The inverter efficiency of 85.1% corresponds to the manufacturer’s specification of 85% under
STC and small variations are expected as explained by Early et al (2014).
The relation of the voltage and current to and from the batteries determine the efficiency of the
batteries.
ƞ𝐵𝐵𝑎𝑎𝑡𝑡𝑡𝑡𝑐𝑐𝑐𝑐𝐵𝐵 =2941.23282.6
× 100 = 89.6%
The battery efficiency of 89.6% corresponds to the manufacturer’s specification of 90% under STC
and small variations are expected as explained by Early et al. (2014). For the charge controller,
inverter and battery variations are expected due to stochastic conditions of the area as alluded to
by Ya’acob et al. (2014).
ƞ𝑂𝑂𝐼𝐼𝑐𝑐𝑐𝑐𝑎𝑎𝑐𝑐𝑐𝑐 𝑝𝑝𝐵𝐵𝑝𝑝𝑡𝑡𝑐𝑐𝑚𝑚 𝑐𝑐𝑓𝑓𝑓𝑓𝑖𝑖𝑐𝑐𝑖𝑖𝑐𝑐𝑐𝑐𝑐𝑐𝐵𝐵 =2558.72941
× 100 = 87%
The value of an overall system efficiency of 87% is comparable to the value of 85% obtained by
Ya’acob et al. (2014) in their work where they carried out a comparative study of three types of
grid connected photovoltaic systems based on actual performance.
3.3.6 Economic Evaluation The cost of a SPV powered IAC+EC system depends on the initial capital investment, operating
and maintenance costs as alluded to by Sahdev et al. (2016) for green house drying. The installation
costs derived from the cost of material for construction are summarised in the Tables 3.6. The cost

108
of installing a solar powered IAC+EC system are enumerated and summed in Table 3.6. The
operating costs are zero rated for comparison as the same farm workers will be used to operate the
IAC+EC and are therefore no additional labour. The maintenance costs are assumed as 10% of the
initial costs per annum according to Emana and Nigussie (2011).
𝑀𝑀𝑙𝑙𝑛𝑛𝐴𝐴𝐷𝐷𝑛𝑛𝑙𝑙𝑛𝑛𝐴𝐴𝐷𝐷 𝐴𝐴𝑙𝑙𝐷𝐷𝐴𝐴𝐷𝐷 = 0.10𝑥𝑥𝑥𝑥130190 = 𝑥𝑥13,019
Payback period was calculated using equation 3.11. The capital cost of the cooler was R 130 190
and assuming that each SSF in PMB invests in one IAC+EC and that there are no risks of losses in
the evaporative cooled storage.
Table 3.6 Costs associated with establishment of SPV and IAC+EC systems
Direct Costs Unit price (R) Total costs (R)
Solar panels (9 x 330 W) 3 800 34 200
Solar batteries (230 AH x 12) 4 250 51 000
Charge controller 4 490 4 490
Inverter 10 500 10 500
Heat exchanger (1) 4 650 4 650
Water pump (0.26 kW) 1 200 1 200
Fan (x2) 2 200 4 400
Water tank and Float (250 litres) 1 250 1 250
Water circulation system 950 950
Charcoal for pads 650 650
Insulating material 900 900
Storage chamber 6 000 6 000
Labour 10 000 10 000

109
Grand Total R130 190
The storage chamber accommodates 3 825 kg of tomatoes and the marketability of the fruit within
14 days is good at 64% and 39% for pink harvested tomatoes in the IAC+EC and under ambient
respectively; 78% and 47% for green harvested tomatoes in the IAC+EC and under ambient
respectively (section 5.3.2). There is an average difference of 28% in marketability of tomatoes in
IAC+EC and ambient conditions. If the 3 825 kg stored in the IAC+EC are sold in 14 days, then
the farmer is able to store two batches per month totaling 7 625 kg. In 12 months, a farmer can
store 91 500 kg under continuous production and are available for sale under 100% marketability.
The difference for tomatoes available for sale in per year as result of the use of cooler if the price
of tomatoes is R 3 per kg.
𝑆𝑆𝑙𝑙𝑣𝑣𝐷𝐷𝑛𝑛𝑘𝑘𝐷𝐷 𝑂𝑂𝐷𝐷𝑏𝑏 𝑃𝑃𝐷𝐷𝑙𝑙𝑏𝑏 = 0.28𝑥𝑥91500𝑥𝑥3 = 𝑥𝑥76,860
The payback period is calculated from Workneh (2010) equation:
𝐹𝐹𝑙𝑙𝑃𝑃𝑏𝑏𝑙𝑙𝐴𝐴𝑘𝑘 𝑂𝑂𝐷𝐷𝑏𝑏𝐷𝐷𝑙𝑙𝑙𝑙 (𝑃𝑃𝐷𝐷𝑙𝑙𝑏𝑏𝐷𝐷) =14320976860
= 1.86
SSF can adopt IAC+EC technology in hot and sub-humid to humid areas, as this should be viable
as it takes 1.9 years to recoup the initial capital investment. Workneh (2010) and Wayua et al.
(2012) found payback periods of 1.2 years and 1.3 years in their research activities for EC. The
most important economic benefit of use of IAC+EC is safeguarding against high PHL incurred by
SSF if the produce is stored under ambient environmental conditions. In addition, the materials
used for construction were locally sourced and are inexpensive. Therefore, the use of IAC+EC in
F&V production in hot and humid areas should be promoted as an alternative technology for SSF
and emerging farmers. While mechanical refrigerators of the same capacity could be cheaper but
they require electricity, which is not available.
3.4 Conclusion The use of SPV systems is increasing as installations costs are decreasing and the application is
finding expression in remote and isolated communities and in new farming setting ups of small-
scale farmers with no access to cooling facilities. Electricity supply is of great concern, as it is

110
inadequate and in SSA, not everyone is connected to the national grid in the near future. This has
turned interest to renewable energy sources like solar as a means of bridging the energy gap and
providing environmentally friendly energy. In this study, a SPV system IAC+EC is evaluated based
on actual performance. This experiment explored the possibility of integrating of solar energy to
power IAC+EC targeting SFF in remote areas with no access to grid electricity.
Most of the literature does not give actual figures of energy required by different cooling systems,
it mostly states which cooling systems are more energy intensive to others. Energy required to
operate modern cooling systems are greater than the energy required to operate IAC+EC. The SPV
systems used in the study supplied energy during the critical period of the day when temperatures
are high from 08h00 to 22h00. To cool one tonne of tomatoes, using IAC+EC requires 1 200 W.h-
1 and the batteries had to store 4 726.7 W.h-1 to provide energy for the 3.8 tonne storage chamber
to cool tomatoes from 17h00 to 22h00 when the IAC+EC system was switched off. The efficiency
of the solar panels was 15.4% and the overall systems efficiency was 88%. The energy to power
an IAC+EC system relates to the size of the solar array required to provide the energy and the cost
of the system. The study also concludes that combinations of the solar array system can be used to
power the cooling system at daytime during summer season and the excess energy can be stored in
the battery to run the system for another five hours into the night. A bigger and expensive system
is required to run all-nighttime. The cost to construct an IAC+EC system integrated with a SPV
system were R 130 190 with a 10% annual maintenance costs and the payback period was observed
to be 1.9 years. A payback period of 1.9 years is regarded as economically viable as the SPV
powered IAC+EC safeguards SSF reliance on ambient storage environment to mitigate PHL.
Therefore, where grid electricity or other commercial energy sources are unavailable and solar
energy is available, IAC+EC is a viable alternative to these more complex and costlier modern-
day cooling systems. This shows that stand alone SPV systems have an expression in rural,
dispersed and remote areas where grid electricity supply may not be readily accessible. Integrated
solar and indirect EC is an attractive alternative for SSF with no access to cooling technologies in
developing countries especially African countries, where issues of land re-distribution are topical
and there will be a significant small-scale commercial in these remote areas, which require cooling
facilities for their fresh produce.

111
3.5 Reference Albright, LD. 1990. Environmental control for animals and plants. ASAE, St Joseph, USA.
Arora, CP. 2000. Refrigeration and air- conditioning, McGraw Hill.
Arora, SC and Domkundwar, S. 1999. A course in heat & mass transfer. Dhanpat Rai & CO. (Pvt.) Ltd.
Asowata, O, Swart, J and Pienaar, C. 2012.Optimum tilt angles for photovoltaic panels during winter months in the Vaal Triangle, South Africa. Smart Grid and Renewable Energy, 3, 119 - 125.
ASHRAE. 1998. ASHRAE Handbook, Refrigeration. American Society of Heating, Refrigeration and Air-Conditioning Engineers, Inc. SI Edition.
ASHRAE Handbook. 2001. Fundamentals. ASHRAE Inc, Atlanta, USA
ASHRAE handbook. 2002. Ashrae transactions.
Bai, A, Popp, J, Balogh, P, Gabnai, Z, Pályi, B. Farkas, I, Pintér, G and Zsiborács, H. 2016. Technical and economic effects of cooling of monocrystalline photovoltaic modules under Hungarian conditions. Renewable and Sustainable Energy Review, 60, 1086-1099.
Baiphethi, MN and Jacobs, PT. 2009. The contribution of subsistence farming to food security in South Africa. Agrekon, 48, 4.
Baloyi, JK. 2010. Analysis of constraints facing smallholder farmers in the Agribusiness value chain. A case study of farmers in the Limpopo province. Masters in Agricultural Economics Thesis. Department of agricultural Economics, Extension and Rural Development. Faculty of Natural and Agricultural Sciences, University of Pretoria, South Africa.
Best, B, Aceves, JJ, Islas, HJM, Manzini, SFB, Pilatowsky, PIF, Scoccia, R and Motta, M. 2012. Solar cooling in the food industry in Mexico: A case study. Applied Thermal Engineering, doi: 10.1016/j.applthermaleng. 2011.12.036.
Chandel, SS, Nagaraju, NM and Chandel, R. 2015. Review of solar photovoltaic water pumping system technology for irrigation and community drinking water supplies. Renewable and Sustainable Energy Reviews, 49, 1084-1099.
Chow, TT. 2010. A review on photovoltaic/thermal hybrid solar technology. Applied Energy, 87, 365–379.
DAFF. 2016. Annual report. Department of Agriculture, Forestry and Fisheries. ISBN: 978-1-86871-438-4.
Damerau, K, Patt, AG and vanVliet, OP. 2016. Water saving potentials and possible tradeoffs for future food and energy supply. Global Environmental Change, 39, 15–25.
Davis, J and MacKay, F. 2013. Solar Energy in the Context of Energy Use, Energy Transportation, and Energy Storage [Internet]. University of Cambridge. Cambridge, UK. Available from:

112
http://www.inference.eng.cam.ac.uk/sustainable/book/tex/RSsolar.pdf [Accessed 17 April 2016].
Deveci, O, Onkol, M, Unver, HO and Ozturk, Z. 2015. Design and development of a low-cost solar powered drip irrigation system using Systems Modelling Language. Journal of Cleaner Production, 102, 529-544.
Duffie, JA and Beckman, WA. 2013. Solar engineering of thermal process. Fourth edition. Wiley, New York.
Early, MW, Coache, CD and Monzi, G. 2014. National electrical code hand book. ISBN 9781455905447.
Eltawil, MA and Samuel, DVK. 2007. Performance and economic evaluation of solar photovoltaic powered cooling system for potato storage. Agricultural Engineering International: CIGR Journal, Manuscript EE 07 008. Vol. IX.
Emana, B and Nigussie, M. 2011. Potato Value Chain Analysis and Development in Ethiopia. Report No. 13. International Potato Center (CIP-Ethiopia), Addis Ababa, Ethiopia.
Emily, G, Kelley, H, Daniel, Q and Dagan, T. 2015. Scalability and Economic Feasibility of Cool Storage Implementation in East Africa. Report No. 331. Massachusetts Institute of Technology, Cambridge, USA.
Erdinc, O and Uzunoglu, M. 2012. Optimum design of hybrid renewable energy systems: overview of different approaches. Renew Sustain Energy Rev, 16(3), 1412–1425.
Fellows, P. 2000. Food processing technology - Principles and Practice. Second edition, CRC press, Boca Ratton, Florida.
Fluri, TP. 2009. The potential of concentrating solar power in South Africa. Energy Policy, 37(12), 5075-5080.
Foxon, TJ. 2018. Energy and economic growth. Why we need a new pathway to prosperity. Routledge, 711 Third Avenue, New York, NY, 10017.
Ghazi, S, Sayigh, A and Ip, K. 2014. Dust effect on flat surfaces - A review paper. Renewable and Sustainable Energy Reviews, 33, 742–751.
Goel, S and Sharma, R. 2017. Performance evaluation of standalone, grid connected and hybrid renewable energy systems for rural application: A comparative review. Renewable and Sustainable Energy Reviews, 78, 1378-1389.
Gopal, C, Mohanraj, M, Chandramohan, P and Chandrasekar, P. 2013. Renewable energy source water pumping systems—A literature review. Renewable and Sustainable Energy Reviews, 25, 351-370.
Gunerhan, H and Hepbasli, A. 2007. Determination of the optimum tilt angle of solar collectors for buildings. Building and Environment, 42, 779-783.
GSES 2015. Solar-powered pumping in agriculture. In: A Guide to System Selection and Design. NSW Farmers, New South wales, Australia.

113
Heimiller, D. 2005. Africa Annual Direct Normal Solar Radiation. [Internet]. Economic Community of West African States Accra, Ghana. Available from: http://en.openei.org/wiki/File:NREL-africa-dir.pdf [Accessed 18 April 2016].
Honsberg, C and Bowden, S. 2016. Tilting the module to the incoming light reduces the module output. [Internet]. PV Education, University of New South Wales, School of Photovoltaic and Renewable Energy, Australia. Available from: http://www.pveducation.org/pvcdrom/introduction/solar-energy. 2018]. [Accessed 04 June 2017].
Huang, BJ, Huang, YC, Chen, GY, Hsu, PC and Li, K. 2013. Improving solar PV system efficiency using one-axis 3-position sun tracking. Energy Procedia, 33, 280-287.
IPAP. 2013. Industrial Policy Action Plan. Economic Sectors and Employment Cluster IPAP 2013/14 – 2015/16. The Department of Trade and Industry. the dti | IPAP 2013/14 - 2015/16. ISBN: 978-0-620-56339-0.
Kaddoura, TO, Ramli, MAM and Al-Turkib, YA. 2016. On the estimation of the optimum tilt angle of PV panel in Saudi Arabia. Renewable and Sustainable Energy Reviews, 65, 626-634. doi.org/10.1016/j.rser.2016.07.032.
Kazem, HA, Khatib, T, Sopian, K and Elmenreich, W. 2014. Performance and feasibility assessment of a 1.4 kW roof top grid-connected photovoltaic power system under desertic weather conditions. Energy and Building, 82, 123–129.
Kazem, HA, Al-Waeli, AHA, Chaichan, MT, Al-Mamari, AS and Al-Kabi, AH. 2017. Design, measurement and evaluation of photovoltaic pumping system for rural areas in Oman. Environ Dev Sustain, 19, 1041–1053. doi.10.1007/s10668-016-9773-z.
Khare, V, Nema, S and Baredar, P. 2016. Solar–wind hybrid renewable energy system: A review. Renewable and Sustainable Energy Reviews, 58, 23-33. ISSN 1364-0321. doi.org/10.1016/j.rser.2015.12.223.
Khatib, T, Mohamed, A and K. Sopian, K. 2013a. A review of photovoltaic systems size optimization techniques. Renewable Sustainable Energy Review, 22, 454–465. doi.org/10.1016/j.rser.2013.02.023.
Khatib, T, Sopian, K and Kazem, HA. 2013b. Actual performance and characteristic of a grid connected photovoltaic power system in the tropics: A short-term evaluation. Energy Conversion Management, 71, 115–119. doi.org/10.1016/j.enconman.2013.03.030.
Kitinoja, L and Thompson, JF. 2010. Pre-cooling systems for small-scale producers. Stewart Postharvest Review, doi.10.2212/spr.2010.2.2.
Kitinoja, L and AlHassan, HY. 2012. Identification of appropriate postharvest technologies for small-scale horticultural farmers and marketers in Sub-Saharan Africa and South Asia – Part 1. Postharvest losses and quality assessments. Acta Horticulturae, 31–40.
Li, DHW, Cheung, GHW and Lam, JC. 2005. Analysis of the operational performance and efficiency characteristic for photovoltaic system in Hong Kong. Energy Conversion and Management, 46, 1107–1118.

114
Linden, D. 2002. Handbook of Batteries, McDraw- Hill Handbooks, 3.1–3.24.
Madhava, M, Kumar, S, Rao, DB, Smith, DD and Kumar, HVH. 2017. Performance evaluation of photovoltaic hybrid greenhouse dryer under no-load condition. Agricultural Engineering International: CIGR Journal, 19(2), 93-101.
Manaf, IA, Durrani, F and Eftekhari, M. 2018. A review of desiccant evaporative cooling systems in hot and humid climates. Advances Energy Research. doi. 10.1080/17512549.2018.1508364.
Mashau, ME, Moyane, JN and Jideani, IA. 2012. Assessment of post-harvest losses of fruits at Tshakhuma fruit market in Limpopo province, South Africa. African Journal of Agricultural Research, 7(29), 4145-4150.
Misra, D and Ghosh, S. 2018. Evaporative cooling technologies for greenhouses: a comprehensive review. Agricultural Engineering International: CIGR Journal, 20(11), 1-14.
Morales, TD. 2010. Design of small photovoltaic (PV) solar-powered water pump systems. United States Department of Agriculture (USDA), Natural Resources Conservation Service (NRCS), Technical Note 28, 1–64.
Newnan, DG. 2002. Engineering Economic Analysis. Engineering Press Inc., California Sericulture Extension Center No. 1-9 and Sericulture Sub- Division. Silk yarn quality development by farmer groups in Thailand. Proceedings of XIXth Congress of the International Sericultural Commission, Bangkok, Thailand, 1980, 568–574.
NDP. 2012. National Development Plan for South Africa, Vision 2030. RP 270/2011. ISBN: 978-0-621-40475-3.
Ndukwu, MC, Manuwa, SI, Olukunle, OJ and Oluwalana, IB. 2013. Development of an active evaporative cooling system for short-term storage of fruits and vegetable in a tropical climate. Agricultural Engineering International: CIGR Journal, 15(4), 307-313.
Ntombela, S. 2012. South African fruit trade flow. Promoting market access for South African agriculture. Issue No. 6, June 2012. National Agricultural Marketing Council, Pretoria, South Africa.
Olcan, C. 2015. Multi-objective analytical model for optimal sizing of stand-alone photovoltaic water pumping systems. Energy Conversion and Management, 23, 358-369.
Olomiyesan, BM, Oyedum, OD, Ugwuoke, PE, Ezenwora, JA and Ibrahim, AG. 2015. Solar energy for power generation: A review of solar radiation measurement processes and global solar radiation modelling techniques. Nigerian Journal of Solar Energy, 26, 1-8.
Parida, B, Iniyanb, S and Goicc, R. 2011. A review of solar photovoltaic technologies. Renewable and Sustainable Energy Reviews, 15, 1625–1636.
Paull, RE and Duarte, O (Eds). 2011. Tropical fruits, Second edition, CAB International, London. 1-10.

115
Pedro, MLPM, João, FAM and António, LMJ. 2016. Comparative analysis of overheating prevention and stagnation handling measures for photovoltaic-thermal (PV-T) systems. Energy Procedia, 91, 346-355.
Prasad, M. 1999. Refrigeration and air conditioning. New Age International (P) Limited, Publishers.
Prusky, D. 2011. Reduction of the incidence of postharvest quality losses, and future prospects. Food Security, 3(4), 463-474.
Punja, ZK, Rodriguez, G and Tirajoh, A. 2016. Effects of Bacillus subtilis strain QST 713 and storage temperatures on post-harvest disease development on greenhouse tomatoes. Crop Protection, 84, 98-104. doi.org/10.1016/j.cropro.2016.02.011
Rajan, ABK and Anandan, SS. 2018. Post-Harvest Management of Fruits and Vegetables in India: Past, Present and Future. TAGA Journal, 1, 2385-2414. ISSN: 1748-0345.
Ramamurthy, V, Tiku, P, Radhamohan, V and Rao, MVB. 1992. Evaluation of outdoor performance of polycrystalline silicon photovoltaic panel. 6th International photovoltaic science and engineering conference, New Delhi, February 10-14, 917-923.
Ramaprabha, R and Mathur, BL. 2009. Impact of partial shading on solar PVC module containing series connected cells. International Journal of Recent Trends in Engineering, 2(7), 56-60.
Rao, A, Pillai, R, Mani, M and Ramamurthy, P. 2014. Influence of dust deposition on photovoltaic panel performance. In Energy Procedia, 690–700.
Razak, JA, Sopian, K and Ali, Y. 2007. Optimization of renewable energy hybrid system by minimizing excess capacity. Energy, 1(3), 77-81.
Rehman, S and Al-Hadhrami, LM. 2010. Study of a solar PV-diesel-battery hybrid power system for a remotely located population near Rafha, Saudi Arabia. Energy, 35, 4986-4995.
Ronoh, EK. 2017. Prediction of total solar irradiance on tilted greenhouse surfaces. Agricultural Engineering International: CIGR Journal, 19(1), 114-121.
Sayyah, A, Horenstein, MN and Mazumder, MK. 2014. Energy yield loss caused by dust deposition on photovoltaic panels. Solar Energy, 107, 576–604.
Sahdev, M, Kumar, M and Dhingra, AK. 2016. A review on applications of greenhouse drying and its performance. Agricultural Engineering International: CIGR Journal, 18(2), 395-412.
SAYB. 2016. South African Year Book 2015/16, Agriculture. Department of Communication and Information System. Republic of South Africa. ISBN: 978-0-620-72235-3.
Saxena, A, Agarwal, N and Srivastava, G. 2013. Design and Performance of solar air heater with long term heat storage. International Journal of Heat and Mass Transfer, 60, 8-16.
Schulze, RE, Maharaj, M, Lynch, SD, Howe, BJ and Melvil-Thomson. 1999. South African Atlas of Agrohydrology and Climatology. School of Bioresources Engineering and Environmental Hydrology University of Natal, Pietermaritzburg, South Africa.

116
Shaahid, SM and El-Amin, I. 2009. Techno-economic evaluation of off-grid hybrid Photovoltaic–diesel–battery power systems for rural electrification in Saudi Arabia—A way forward for sustainable development. Renewable and Sustainable Energy Reviews, 13, 625–633.
Shaltout, MAM, Mahrous, AM, Ghettas, AE and Fattah, YA. 1995. Photovoltaic performance under real desert conditions near Cairo. Renewable Energy, 6(5-6), 533-536.
Smith, JS. 1976. Circuits, Devices, and Systems. 3rd edition. John Wiley & Sons. New York, N.Y.
Sontake, VC and Kalamkar, VR. 2016. Solar photovoltaic water pumping system - A comprehensive review. Renewable and Sustainable Energy Reviews, 59, 1038-1067.
Stanciu, C and Stanciu, D. 2014. Optimum tilt angle for flat plate collectors all over the world - a declination dependence formula and comparisons of three solar radiation models. Journal of Energy Conversion and Management, 81, 133-143.
Strnadel B, Hlaváčb, LM and Gembalová, L. 2013. Effect of steel structure on the declination angle in AWJ cutting. International Journal of Machine Tools and Manufacture, 64, 12-19.
Studman, C. 1990. Agricultural and Horticultural Engineering, Butterworth’s Agricultural Books, New Zealand.
Sun, LL, Li, M, Yuan, YP, Cao, XL, Lei, B and Yu, NY. 2016. Effect of tilt angle and connection mode of PVT modules on the energy efficiency of a hot water system for high-rise residential buildings. Renewable Energy, 93, 291-301.
Tefera, A, Workneh, TS and Woldetsadik, K. 2007. Effects of disinfection, packaging, and storage environment on the shelf life of Mango. Bio-systems Engineering, 96(2), 201-212.
Thompson, JF. 2004. The commercial storage of fruits, vegetables, and florist and nursery stocks. A revised draft of Agriculture Handbook No. 66, USDA, ARS.
Tripathy, M, Yadav, S, Sadhu, PK and Panda, SK. 2017. Determination of optimum tilt angle and accurate insolation of BIPV panel influenced by adverse effect of shadow. Renewable Energy, 104, 211-223. doi.org/10.1016/j.renene.2016.12.034.
Wang, XQ, Li, XP, Li, YR and Wu, CM. 2015. Payback period estimation and parameter optimization of subcritical organic Rankine cycle system for waste heat recovery. Energy, 88, 734-745.
Wayua, FO, Okoth, MW and Wangoh, J. 2012. Design and Performance Assessment of a Low-Cost Evaporative Cooler for Storage of Camel Milk in Arid Pastoral Areas of Kenya. International Journal of Food Engineering, 8(1), Article 16. doi.10.1515/1556-3758.2323.
Workneh, TS. 2010. Feasibility and economic evaluation of low-cost evaporative cooling system in fruit and vegetables storage. African Journal of Food Agriculture, Nutrition and Development, 10(8), 2984-2997.
Ya'acob, ME, Hizam, H, Khatib, T and Radzi, MAM. 2014. A comparative study of three types of grid connected photovoltaic systems based on actual performance. Energy Conversion and Management, 78, 8-13.

117
Yahaya, S and Akande, K. 2018. Development and Performance Evaluation of Pot-in-pot Cooling Device for Ilorin and its Environ. Journal of Research Information in Civil Engineering, 15(1), 2045-2059.
Yahyaoui, I. 2016. Specifications of Photovoltaic Pumping Systems in Agriculture: Sizing, Fuzzy Energy Management and Economic Sensitivity Analysis. Elsevier. Book, ISBN: 9780128120392, Alternative Energy.
Yahyaoui, I, Tadeo, F and Segatto, MV. 2016. Energy and water management for drip irrigation of tomatoes in a semi-arid district. Agricultural Water Management. doi.org/10.1016/j.agwat.2016.08.003.
Young, R. 2013. Saving Water and Energy Together: Helping Utilities Build Better Programs. American Council for an Energy-Efficient Economy, report number E13H.

118
4 PERFOMANCE OF INDIRECT AIR COOLING COMBINED
WITH DIRECT EVAPORATIVE COOLING SYSTEMS Abstract
The aim of this study was to explore influence of indirect air-cooling (IAC) through a heat
exchanger before air enters the evaporative cooling unit (IAC+EC) for cooling the
microenvironment and increasing relative humidity (RH) in the storage chamber for hot and sub-
humid to humid regions. The other objective was to carry out a quantitative performance evaluation
study of small-scale farmer sized temporary storage for fresh produce in terms of provision of an
optimum microenvironment of temperature and RH. A low cost solar photovoltaic (SPV) powered
IAC+EC system consisting of SPV system, battery bank, electrical appliances, IAC unit,
evaporative cooling unit, and 3.8 tonne storage chamber (53 m3) was constructed and assembled at
Ukulinga research center at the University of KwaZulu Natal in Pietermaritzburg. The EC system
incorporated a suitable desiccation media (heat exchanger) for IAC. Performance evaluation was
conducted under conditions storage of 150 kg sample tomatoes. The performance of the IAC+EC
was evaluated based on the temperature and the RH measured hourly from 05h00 to 22h00.
Temperature and RH were measured in various positions in the storage chamber, at the entrance to
the storage chamber and outside the storage structure to give the ambient conditions. There were
significant variations (P<0.001) in temperature and RH between storage and ambient conditions.
The temperature inside the storage chamber was on average 7℃-16℃ lower while the average RH
was 13%-41% higher than ambient conditions. Temperature and RH at the exhaust end of the
IAC+EC storage chamber were 16.40 ℃ and 88.9% compared to 30.9℃ and 47.6% under ambient
conditions, which can enhance the shelf life of fruit and vegetables (F&V) of moderate respiration
rates. The temperature after the last cooling pad rose by 0.75℃ at the fan to 15.73℃ at the entrance
to the storage chamber while RH decreased by 2% to 93.8%. Inside the storage chamber, the
temperature varied between 15.7℃ and 16.4℃ and the RH varied between 93.8% and 89.6% at
different locations respectively. The cooler efficiency varied from 88.04% to 95.6%. The IAC+EC
was found to perform at the same level as evaporative cooling under dry and arid conditions. The
solar powered IAC+EC tested in this study has benefits in providing optimum conditions for fresh
produce and in reducing losses as well as being a low-cost technology that can be utilised in hot in
sub-humid to humid areas in sub-Saharan Africa.

119
4.1 Introduction The World Bank (World Bank, 2011) reports grains and fresh produce worth more than US$ 4
billion of is lost through postharvest losses (PHL) in Sub-Saharan Africa (SSA). The entire fruit
and vegetables (F&V) supply chain faces even more dire challenges resultant from high PHL
estimated at 26.4% (FAO, 2013; Affognon et al., 2015). In SSA during the period of glut, F&V
not immediately consumed or sold rot away in the farms or else small-scale farmers (SSF) dispose
of to intermediaries at low and unprofitable prices (Kiggundu et al., 2016; Korir et al., 2017).
SSF in the Embo area of KwaZulu-Natal in South Africa claim to miss premium market prices
for their organic potatoes due to amongst other factors lack of proper storage facilities (Katundu
et al., 2010). Modern cooling technologies like mechanical refrigeration, hydro and vacuum
cooling have been widely adopted for the modification and control of the storage environment of
high value-quality fresh produce in developed countries (Jensen, 2002; Waaijenberg, 2004; van
Henten et al., 2006; Okanlawon and Olorunnisola, 2017). Availing such facilities to SSF could
assist in the reduction of PHL through control of temperature and RH, which are the two most
important environmental factors that affect shelf life of F&V (Tyagi et al., 2017; Saltveit, 2018).
SSF in SSA cannot afford the high installation and maintenance costs of modern storage facilities
available in the market (Adebisi et al., 2009; Ndukwu and Manuwa, 2014). Furthermore, modern
cooling technologies are energy intensive limiting availability to SSF located in remote areas with
no access to grid electricity (Kim and Ferreira, 2008; Chaudhari et al., 2015; Korir et al., 2017).
However, evaporative cooling (EC) has low initial investment, installation and maintenance costs
compared to modern technologies and can be set up without a power grid source (Tigist et al.,
2011; Okanlawon and Olorunnisola, 2017). EC has a potential energy saving of about 75% and
relies on velocity of natural wind through wetted pads to provide a cooling effect for preservation
of organoleptic properties of food (Amer et al., 2015; Misra and Ghosh, 2018). EC is a technology
that can succeed in use by SSF in SSA as it can easily be constructed using available materials,
comes at an appropriate scale in operation and economics, can have more than one use (year-round
utility) (Liberty et al., 2014; Tabrez and Chaurasia, 2014; Chijioke, 2017). These are the critical
reasons why this study is focusing on EC as a panacea to reducing PHL for SSF in SSA.

120
Most of the research in EC in developed countries and Asia has focused on EC of buildings as
opposed to cooling fresh agricultural produce. Literature shows many laboratory scale studies on EC in
SSA as summarised by Ndukwu and Manuwa (2014) where the technology has achieved maintaining
cooling spaces at temperatures below ambient with a depression reaching 12℃ and RH above 90%. The
EC systems studied so far are prototypes; with low storage capacity and environment specific and their
effectiveness at a commercial scale and in other regions in SSA needs investigation (Abbouda and
Almuhanna, 2012; Zakari et al., 2016).
The current research has been limited to east Africa, West Africa and North Africa with few studies done
in the Southern African (Ndukwu et al., 2013). EC removes room sensible heat, is effective in hot
and arid areas, and has limitations in hot and humid areas because of the inherent high RH of local
air, which leads to low dry bulb temperature (Deoraj et al., 2015). The extension of EC to such
areas requires incorporating a suitable desiccation media (heat exchanger) or indirect air-cooling
(IAC) before EC, which is a research focus for this study. Performance of EC systems varies with
climatic conditions (regions) as evidenced by a report by Thipe et al. (2017) where in greenhouse EC, fan-
pad ventilation performed better than natural ventilation in Southern African regions, while in the tropical
and Mediterranean climates, the reverse was true. There is need to develop and test and characterise IAC
coupled with evaporative cooling system (IAC+EC) in southern Africa sized big enough to mimic the
quantities of fresh produce that a SSF requires to cool per unit time. Literature review done for EC for
preservation of fresh produce and greenhouse application shows that IAC+EC has not been applied
for such purposes as corroborated by Misra and Ghosh (2018). Ogbuagu et al. (2017) alludes that
IAC+EC systems have shown great potential of development and research opportunity for their
perceived improved efficiency, high thermal performance and low energy use. Therefore, this study
proposes use of an IAC+EC with three-layer charcoal granule cooling pads. The IAC+EC system
will require an energy source to power the heat exchanger, fans and water pump for air and water
circulation (Razak et al., 2007; Shaahid and El-Amin 2009).
Integrating IAC+EC with solar energy is critical for SSF with no access to grid electricity in remote
areas or in rugged terrain where it is un-economical to stretch the utility grid (Kim and Ferriera,
2008; Szabo et al., 2011; Parida et al., 2011; Hassan and Mohamad, 2012; Chaudhari et al., 2015;
Kazem et al., 2017). Solar energy is available in quantities of 2 000 kWh m-2 per year with solar
radiation of 4.5 – 6.5 kWh.m-2 for 6 -7 hours per day in SSA which is enough for conversion to

121
electricity for applications like EC needs (Rehman and Al-Hadhrami, 2010; Best et al., 2012; Davis
and MacKay, 2013; Saxena et al., 2013; Olomiyesan et al., 2015). To ensure energy is available at
night a solar/battery hybrid system can be utilised where the battery bank stores energy during the
day (GSES, 2015). Integration of solar/battery facilities and provision of SSF sized IAC+EC
system is a new phenomenon proposed in this study for use in areas without access to grid
electricity and along coastal areas with hot and sub-humid to humid conditions.
The phenomenon of commercial exploitation of IAC+EC system for storage of fresh produce under
hot and sub-humid to humid conditions is untapped in Southern Africa and requires profiling and
evaluation. To solve this problem and encourage adaptation of low-cost cooling methods a SSF
sized demonstration able to store about 4 tonnes of tomatoes was designed and constructed.
Therefore, the objective of this study is to evaluate the performance of SSF sized IAC+EC system
for storage of fresh produce under hot and sub-humid to humid conditions in South Africa.
4.2 Materials and Methods
4.2.1 Design Information and Specifications The cooling unit design provided the optimum storage temperature and RH for the selected fresh
produce for KwaZulu Natal province and specifically PMB, which is predominantly hot and sub-
humid. The average long-term minimum and maximum temperatures in September range from
10.0 - 17.1 oC and 12 - 27 oC respectively, while the relative humidity ranges from 61.1 – 68.1 %
(Schulze and Maharaj, 2007). The following factors should be taken into cognisance:
• in the IAC+EC system, the ambient air conditions limit the lowest temperature attained and
that;
• the IAC+EC system can only cool to the wet bulb temperature of the ambient air
temperature (ASHRAE Handbook, 2004).
• mature green (breaker stage) and pink tomatoes require a storage temperature varying
between 13℃ and 21℃ and RH of 90 to 95% (Thompson et al., 1998).

122
4.2.2 Design Considerations and Specifications for the Cooler The following design considerations were made:
1. The IAC+EC storage chamber size to mimic quantities of fresh produce that a SSF’ in SSA
requires to cold store at a unit time.
2. The IAC+EC constructed from local available material.
3. Incorporation of a water re-circulation system supplying a constant water flow rate.
4. Incorporation of forced air-circulation system to supply a constant ventilation rate.
5. Incorporation of a desiccation media system for indirect cooling of air before EC.
Based on the above-mentioned considerations, the design and construction of IAC+EC system had
the following specifications:
1. The IAC+EC unit to maintain the temperature inside the storage chamber at the wet bulb
temperature of the prevailing ambient air conditions.
2. The IAC+EC unit to maintain the RH in the storage chamber at 80 - 95%.
3. The cooling pads had to be available in South Africa and made from relatively cheap
material.
4. The fan attached to the indirect heat exchanger to provide airflow velocities of 2.0 -2.2 m.s-
1 across the cooling pads.
5. The fan at the entrance to the storage chamber to provide airflow velocities ranging between
3 - 4.0 m. s-1 to maximize the efficiency of the IAC+EC.
6. The solar array system to power the heat exchanger, fans and the pump.
4.2.3 Sizing of the Storage Chamber The sizing of the storage chamber was based on the requirement to store about 3.8 tonnes of
tomatoes using packing crates found in PMB of sizes 500 mm long × 300 mm wide × 230 mm
high with each crate holding about 12.5 kg of tomatoes. The packing of crates left at least 5%
venting with a spacing of 100 mm between the tomato layers to allow adequate airflow according
to Schuur (1988) and Sarvacos and Kostaropolous (2002). A provision of 0.9-metre walkways in
between the crates for ease of packing and unpacking. The vertical stacking of tomatoes in the
crates inside the storage chamber ensured a spacing of 25 mm between the crates according to
Kim and Ferreira (2008). This arrangement accommodated 3 825 kg of tomatoes assuming a bulk

123
density of tomatoes is 694 kg.m-3 according to Sharan and Rawale (2009) as detailed in Appendix
7.3. Three hundred and six crates (51 stacked to 6) of 12.5 kg tomatoes can packed in the storage
chamber as shown in Figure 4.1. Appendix 7.3 provides a pictorial image of the storage chamber.
Figure 4.1 Storage chamber floor plan showing arrangement of crates
4.2.4 Sizing of the Psychrometric Unit Heat exchanger
A heat exchanger was chosen according to Holman (1989) in Appendix 7.9 for substantial
temperature reduction effect and a minimal increase in RH for hot and sub-humid to humid climatic
regions.
Air circulation
The required ventilation rate ensured that a continuous heat removal process obtains as described
by Hellickson and Walker (1983) and Grubinger and Sanford (2015) to produce airflow across the
indirect heat exchanger and cooling pads and to enhance evaporation in the chamber. Two fans
were used, one fan attached to the heat exchanger to facilitate airflow in the psychrometric unit and
another at the entrance to the chamber to ventilate the chamber as proposed by Babaremu et al.
(2018).

124
Air circulation across the cooling unit
A 31/33 W (UF25GC12, AC 115 V, 50/60 Hz) constant speed positive pressure fan with a flow
rate of 0.25 m3. s-1 was bought with the heat exchanger and supplied air across the psychrometric
unit consisting of the heat exchanger and cooling pads at constant speed of 2.1 m. s-1 (Table 7.8
and Appendix 7.9). This fan was able to overcome a maximum pressure drop of 50 Pa across the
heat exchanger and 130 Pa across each cooling pad as prescribed by Thompson et al. (1998) and
Gunhan et al. (2007).
Air circulation across the storage chamber
Introduction of cold air into the storage chamber facilitates warm air to escape from the storage
chamber through exhaust holes and for this to happen a 290 W (308,7/6-6/P3HL/25/PA) fan was
installed at the inlet/entrance to the storage chamber just after the cooling pads. The selection of
the fan derived from the required ventilation rate of 0.234 m³. s-1 (Appendix 7.6) calculated from
the total cooling load (Appendix 7.5). The selected fan was the closest found in PMB with an
airflow rate of 0.278 m³. s-1 and air velocity of 3.6 m. s-1 at a static pressure of 68.27 Pa and Figure
7.5 shows its performance curve.
Pad design
The cooling pad was made of charcoal granules to provide a very porous structure able to hold
water (Obura et al., 2015). Charcoal is locally available, relatively cheap and achieves cooling
efficiency of up to 92% (Workneh and Woldetsadik, 2004; Getinet et al., 2008). Standard equations
were used in calculating the pad area, thickness and volume as determined by Gupta et al. (1995)
as shown in Appendix 7.7. The charcoal cooling pads were vertically mounted to allow uniform
flow of water, free flow of air and achievement of maximum capillarity and evaporation (Gunhan
et al., 2007). Based on literature from Gunhan et al. (2007) and Liao et al. (1998) a design air
velocity of 2.1 m. s-1 from the fan attached to the heat exchanger facilitated air velocity across the
cooling pads.
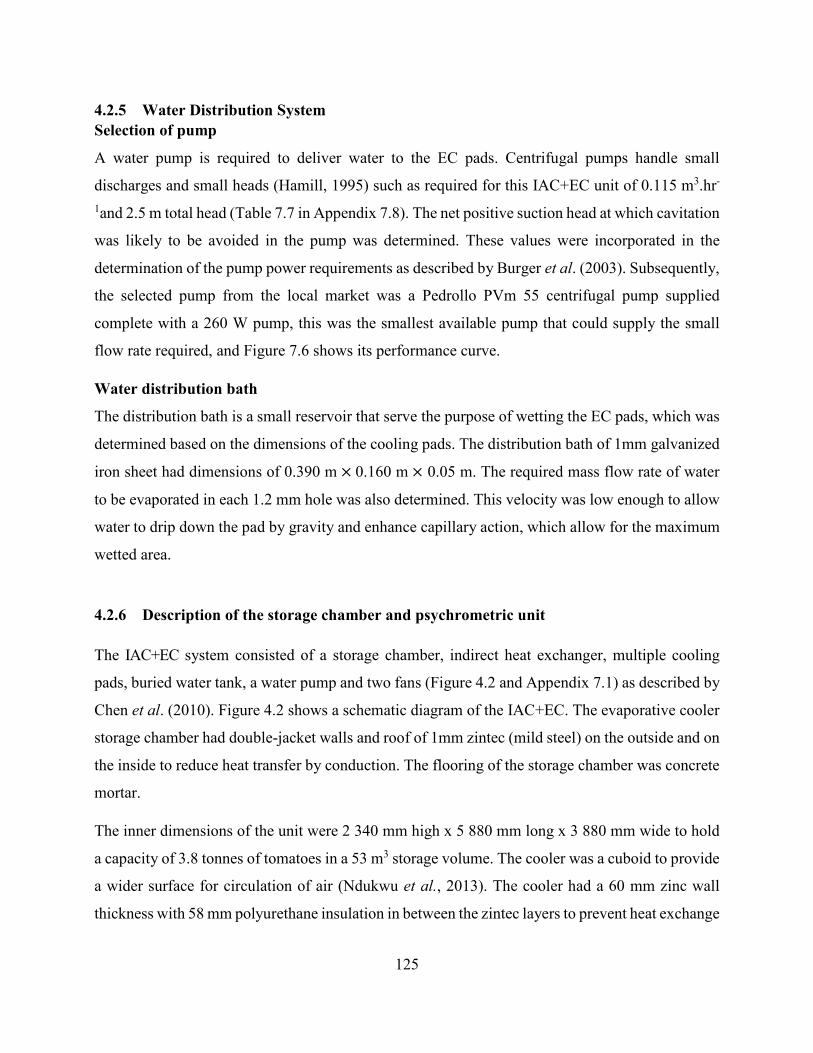
125
4.2.5 Water Distribution System Selection of pump
A water pump is required to deliver water to the EC pads. Centrifugal pumps handle small
discharges and small heads (Hamill, 1995) such as required for this IAC+EC unit of 0.115 m3.hr-
1and 2.5 m total head (Table 7.7 in Appendix 7.8). The net positive suction head at which cavitation
was likely to be avoided in the pump was determined. These values were incorporated in the
determination of the pump power requirements as described by Burger et al. (2003). Subsequently,
the selected pump from the local market was a Pedrollo PVm 55 centrifugal pump supplied
complete with a 260 W pump, this was the smallest available pump that could supply the small
flow rate required, and Figure 7.6 shows its performance curve.
Water distribution bath
The distribution bath is a small reservoir that serve the purpose of wetting the EC pads, which was
determined based on the dimensions of the cooling pads. The distribution bath of 1mm galvanized
iron sheet had dimensions of 0.390 m × 0.160 m × 0.05 m. The required mass flow rate of water
to be evaporated in each 1.2 mm hole was also determined. This velocity was low enough to allow
water to drip down the pad by gravity and enhance capillary action, which allow for the maximum
wetted area.
4.2.6 Description of the storage chamber and psychrometric unit The IAC+EC system consisted of a storage chamber, indirect heat exchanger, multiple cooling
pads, buried water tank, a water pump and two fans (Figure 4.2 and Appendix 7.1) as described by
Chen et al. (2010). Figure 4.2 shows a schematic diagram of the IAC+EC. The evaporative cooler
storage chamber had double-jacket walls and roof of 1mm zintec (mild steel) on the outside and on
the inside to reduce heat transfer by conduction. The flooring of the storage chamber was concrete
mortar.
The inner dimensions of the unit were 2 340 mm high x 5 880 mm long x 3 880 mm wide to hold
a capacity of 3.8 tonnes of tomatoes in a 53 m3 storage volume. The cooler was a cuboid to provide
a wider surface for circulation of air (Ndukwu et al., 2013). The cooler had a 60 mm zinc wall
thickness with 58 mm polyurethane insulation in between the zintec layers to prevent heat exchange

126
(Babaremu et al., 2018). The door (90cm wide) to the storage chamber was made of the same
material and had the same height and thickness as the rest of the storage chamber. The outside of
the walls and roof were white colored to increase the reflectivity of the material and decrease the
rate of absorption of heat (Babaremu et al., 2018). Figure 4.2 is a schematic diagram of
psychometric unit and in summary the Fan on the left blows ambient air through indirect heat
exchanger and three pads while the fan on the right forces the air through the room.
Figure 4.2 Schematic diagram of the psychrometric unit and the storage chamber
Incorporation of an indirect heat exchanger brought the temperature as close to the wet bulb
temperature by indirect cooling of the air before coming into contact with water. After the heat
exchanger, were three layers of vertically mounted charcoal granules cooling pads primarily
mounted so, as the area in Ukulinga research station is not dusty. Through forced convection, a
31/33 W (UF25GC12, AC 115 V, 50/60 Hz) constant speed positive pressure fan purchased
mounted next to the indirect heat exchanger facilitated optimum airflow at 2.1 m. s-1 velocity by
forcing air through the heat exchanger and the three layers of cooling pads into the storage chamber.
A 290 W (308,7/6-6/P3HL/25/PA) fan pushed the air coming from the cooling unit into the storage
chamber at an airflow rate of 0.278 m³. s-1 and air velocity of 3.6 m. s-1. Inside this storage chamber,
the air picked up heat from the tomatoes and the warm air escaped from the storage chamber
through six (100 mm-diameter) air (exhaust) vents. These air vents were opposite the inlet, three

127
at the bottom and three at the top and they facilitated continuous heat removal as described by
Seweh et al. (2016).
The water distribution system was designed so that, water continuously pumped from an
underground storage (supplied from the mains) using a 260 W Pedrollo PVm 55 centrifugal pump
placed at the surface as recommended by Nkolisa et al. (2018). An underground tank maintained
the water temperature as low as possible and created a temperature gradient between the air stream
and the water stream in the heat exchanger thus facilitating heat transfer. The circulation system
pushed water from the underground storage tank, through the indirect heat exchanger and sprinkled
water continuously over the vertical mounted IAC+EC pads into the storage chamber, and thus
increasing RH and decreasing temperature (Babaremu et al., 2018). From the chamber, the water
returned to the underground storage tank and ball valve float prevented the tank from over filling
and flowing over. A collecting bath below the EC pads sloping at 5% allowed water to flow freely
to the bottom and return to the tank (von Zabeltitz and Baudoin, 1999). The pump, fans and indirect
heat exchanger were connected to SPV array system consisting of a 3 string-3 series 330W
(SETSOLAR, PC 16-6015F) solar modules with 44.80 V rated voltage and 8.69 A current, solar
charge controller (SANTAKUPS PC16-6015F) of ratings 60 A and 145 VDC, inverter (5 kW
(60A), P11-LW5000NC48-C), twelve 230 AH battery recharged.
4.2.7 Harvesting of Tomatoes and Cooling Times Tomato Star 9037 cultivar was harvested into plastic crates from a nearby farm in PMB. Harvesting
of the tomatoes was done before 11h00 (field temperature of 31.5℃) and the tomatoes were
immediately loaded in a car and transported to Ukulinga research station located 31 km away
(29.67° S and 30.40° E, 840 m above sea level). The tomatoes were prepared on arrival for the
experiment at room temperature. Visual inspection helped discard tomatoes with bruises and signs
of infection from the fruits used as samples (Getinet et al., 2011). The selected tomatoes were
packed and kept in crates under ambient conditions until the start of the experiment on the same
day at 14h00 (ambient temperature of 31℃). The half-cooling time and seven-eighths cooling time
were used for the determination of cooling time of tomatoes from the field temperature to the
optimum storage temperature as in Equation 4.1 to 4.4. The seven-eighths cooling time is more

128
practical as the temperature of the produce at seven-eighths is close enough to the target storage
temperature according to Brosnan and Sun (2001).
𝑍𝑍 = 𝑙𝑙𝑛𝑛 �0.5𝐶𝐶� (4.1)
𝑆𝑆 = ln �8𝑗𝑗𝐶𝐶� (4.2)
Where Z = half cooling time [hours]; S = seven eighths cooling time [hours],
C = cooling coefficient [dimensionless], and J = lag factor [dimensionless],
(Brosnan and Sun, 2001).
𝐶𝐶 = ln �𝑌𝑌𝜃𝜃� (4.3)
𝑌𝑌 =𝑇𝑇 − 𝑇𝑇𝑚𝑚𝑇𝑇𝑖𝑖 − 𝑇𝑇𝑚𝑚
(4.4)
Where Y = temperature ratio [℃]; T = temperature at any point in the product [℃];
Tm = temperature of cooling medium (air) [℃]; Ti = initial temperature [℃] and
C = cooling time or operating time [hours] (Brosnan and Sun, 2001).
At the start of the experiment, the crated tomatoes were placed on wooden pallets to keep produce
off the ground, reducing the likelihood of infection of tomatoes with soil borne diseases and mould
as described by Obura et al. (2015). The tomatoes were then kept under ambient conditions and
cooling environment.

129
4.2.8 Temperature and Relative Humidity Measurements The procedure by Ho et al. (2010) and Akdemir et al. (2013) was followed to select nine
positions (Figure 4.3) including centre and boundary environmental conditions of temperature
and RH in the storage chamber to determine the performance of the IAC+EC system. The
boundary conditions were:
• Temperature and RH at inlet and exhaust ends of the storage chamber.
• Temperature and RH on the ground floor and ceiling of the storage chamber:
• Temperature and RH on the surface of left and right walls of the storage chamber.
Figure 4.3 Position of the data loggers
Digital HOBOs (HOBO Prov2 Part No. U23-001) were located in nine different positions in
the storage chamber capturing the different cooler environments as shown in Figure 4.3. One

130
HOBO was located inside the psychrometric unit after the last cooling pad to capture the
condition of the air going into the storage chamber. Another HOBO captured the ambient
conditions.
The digital HOBOs measured air temperature and RH at different positions in the storage stage,
after the cooling pads in psychrometric unit of air supplied to the storage chamber and ambient
conditions. The door of the storage chamber was closed and readings recorded hourly throughout
the day from day0 to day 28 i.e. from 25 August 2017 to 22 September 2017. The average
psychrometric unit, storage chamber and ambient temperature and RH were calculated from the 28
days’ data separately for each time. Ambient air temperature data was obtained from ARC-SAWS
weather station located within Ukulinga research station. The air velocity measurements were taken
inside the psychrometric unit, at the inlet to the storage chamber and along the same symmetry line
in equal distances at the centre, exit side of the storage and were recorded every hour using an
anemometer (Lutran 4201) for one day from 08h00 to 16h00. Experiments were carried out
throughout the period with the daytime powered by the solar array and the nighttime by the
batteries. Days where the maximum temperature was above 26℃ were isolated for analysis.
4.2.9 Cooling Efficiency The cooling efficiency (η) of the cooler, indicating the extent to which the dry bulb temperature of
the cooled air approaches the wet bulb temperature of the ambient air was calculated as defined in
Equation 4.5 (Olosunde et al., 2016). The cooling efficiency (η) equation is a widely used index
for evaluating the performance of direct EC media (Xuan et al., 2012). The cooling efficiency of
the IAC+EC system indicates the extent to which the dry bulb temperature of the cooled air
approaches the wet bulb temperature of the ambient air as calculated using Equation 4.5 (ASHRAE
Handbook, 2004; Lertsatitthanakorn et al., 2006; Olosunde et al., 2016).
𝜂𝜂 = 100 × 𝑇𝑇𝑑𝑑𝑝𝑝− 𝑇𝑇𝑑𝑑𝑑𝑑𝑇𝑇𝑑𝑑𝑝𝑝− 𝑇𝑇𝑤𝑤𝑝𝑝
(4.5)
Where η = cooling efficiency of EC unit (%);

131
Tda = dry bulb temperature of ambient air entering the cooling unit (°C);
Tdc = dry bulb temperature of cooled air-cooling leaving unit (°C) and
Twa = wet bulb temperature of ambient air entering the cooling unit (°C).
4.2.10 Data Collection The experiment consisted of two cooling approaches, IAC+EC and the control, which was ambient
conditions. A comparison of storage and outside temperatures and RH was done. The experimental
data collection involved the hourly measurement throughout the day of environmental parameters
of temperature and RH for the 28 days of the experiment. However, data for 11 hot days with
temperature above 26℃ were selected and used for analysis. In the selected 11 days there was a
significant temperature and relative humidity gradient between ambient and cold storage
conditions that would affect the metabolism rate between the two storage conditions. Of the
selected days, data collated between 05h00 to 22h00 of each day was used for analysis. From 22h00
to 05h00, the average ambient temperatures in PMB is below 20℃ and the IAC+EC system was
switch off during this period as tomatoes can tolerate temperatures between 13-21 ℃. The data
obtained at the centre inlet, centre of the storage chamber and the centre of wall on the exhaust side
was used for analysis and discussions. The experiment was mainly concerned with evaluating the
cooling performance, in terms of the temperature reduction, RH change and efficiency of cooling
of the two cooling approaches. GenStat Version 18 was used for the statistical analysis. Analysis
of variance (ANOVA) by means of the GENSTAT statistical software, 18th edition determined the
differences. Duncan’s Multiple Range Test, with a significance level of 0.05 separated the means.
4.3 Results and Discussions
4.3.1 Cooling Time of Tomatoes Loaded at Ambient Temperature According to Thompson et al. (2001), cooling of tomatoes should take place within 16 hours
otherwise, a marked deterioration in quality occurs after this period. The IAC+EC system for this
study used a hybrid of solar module and a battery bank facility to provide energy for the water
pump, heat exchanger and fans. The battery bank facility provided energy for five hours after the

132
sunshine period as it takes some time for the ambient air temperature to decrease substantially after
sunset. As a result, the cooler was switched off 5-hours into the night time to allow the ambient
temperature to cool down to 20℃ and below.
In determining the time required to cool tomatoes from the field temperature to the optimum
storage temperature, half-cooling time and seven-eighths cooling time methods as defined by
equations 4.1 to 4.4 were used with the following assumptions made that θ = 16 hours; T = 15℃;
Tm = 14℃; Ti = 32℃; and j = 1. From these assumptions and equations for half and seventh-eighth
cooling times, the cooling time and the corresponding cooling temperature were calculated and are
presented in Figure 4.4, which shows the cooling time graph for tomatoes harvested at an ambient
air temperature of 32℃. From Figure 4.4, it took 33 hours for tomatoes to cool from 32℃ to 13℃,
which is the lowest optimum storage condition. This provided a temperature gradient of 19℃.
Figure 4.4 Cooling time graph for harvested tomatoes in the IAC+EC storage chamber at Ukulinga
Research Station in Pietermaritzburg.
12
16
20
24
28
32
0 4 8 12 16 20 24 28 32 36
Tem
pera
ture
(0 C)
Cooling time (hours)

133
On the first day the freshly harvested tomatoes are placed in the storage chamber and within 16
hours, the fruit flesh temperature drops from 32℃ to 14℃ , which is within the optimum storage
for tomatoes of 13℃ . In the next 16 hours temperature dropped by a further 1℃. The initial tomato
temperature dropped rapidly especially for the first four hours of cooling and slowed down as the
product temperature approached the target optimum recommended temperature. This is in line with
observation by Thompson et al. (1998) that the rate of heat removed from fresh produce like
tomatoes is directly influenced by the temperature gradient of the product and the cooling medium.
This means when packing tomatoes in the IAC+EC storage chamber in batches, it is possible that
on the first day of stacking the tomato fruit’ temperature drops from 32℃ to 14℃ within 16 hours
and to 13℃ on the next day within the next sixteen hours after which the next batch can be placed.
This means that IAC+EC is a viable cooling facility option for the immediate reduction of flesh
temperature of harvested fresh produce for SSF in SSA. In the calculations the seven-eighths
cooling time gave more practical values as the temperature of the tomatoes at seven-eighths was
close enough to the target storage temperature as corroborated by Brosnan and Sun (2001).
4.3.2 Variation of Temperature Temperature inside the psychometric unit and storage chamber were studied on eleven clear, sunny
days during the period end-August to end-September 2017 where the maximum temperature was
above 26℃. Temperature is one of the most important factors that needing management at optimum
conditions in the storage life of fresh produce like tomatoes (Arah et al., 2015; Seweh et al, 2016).
Temperature was recorded from eleven positions as shown in Figure 4.5.
The initial results and discussions consider all the nine positions in the chamber but there is then a
special focus on environmental conditions pertaining to the inlet to the chamber, centre of the
chamber and the centre of the exhaust end. Figure 4.5 provides information on the average
temperature recorded over the eleven days from the eleven data logger positions that includes
ambient obtained from SAWS station (D-1), one psychometrics unit position after the last cooling
pad (D-2) and nine storage positions (D-3 to D-11). There was a significant variation (P<0.001)
between ambient and the psychometrics unit position and the nine storage chamber temperatures.
The ambient temperature was on average 10.5℃ and 9.5℃ higher than the last cooling pad
temperature and the average storage temperature respectively. A significant temperature gradient

134
between the storage temperature and ambient temperature provides an effective heat transfer of the
stored produce, cooling pad and a cold room. There was also a significant variation (P<0.001) in
temperature between the psychometric unit and the storage chamber temperature. The lowest
average temperature was obtained at the outlet of the psychometric unit (15.77℃), while the highest
average temperature was observed at the left (16.92℃: D-9) and right side (16.93℃: D-10) of the
roof at the exhaust end of the storage chamber.
Figure 4.5 Average temperature for the sensors over the 11 hottest days at Ukulinga Research
Station in Pietermaritzburg.
When considering the conditions in storage chamber only, there was significant variation in
temperature (P<0.001) between the different data logger positions at the entrance, centre and
exhaust end. The lowest temperature was recorded near the inlet to the storage chamber (16.2℃)
while the highest temperature was observed at the exhaust end (16.9℃). The significant differences
in temperature in relation to the position of sensor in the storage chamber could influence the
quality of F&V stored inside the IAC+EC storage chamber. Determining the ventilation rate to
maintain a uniform air distribution throughout the storage chamber is important as it ensures that
optimal storage environment is provided to maintain the physiological condition of fresh produce
(Jradi and Riffat, 2014; Tolesa and Workneh, 2017). The average temperature distribution inside
the storage chamber varied from 16.2℃ to 16.9 ℃, implying that the IAC+EC provided optimum
0
5
10
15
20
25
30
D-1 D-2 D-3 D-4 D-5 D-6 D-7 D-8 D-9 D-10 D-11
Aver
age
Tem
pera
ture
(ºC
)
Data logger position
CV = 5.1%LSD (0.05)=1.36

135
temperature condition for the storage of most of the tropical and sub-tropical F&V. The results
show that IAC+EC under hot and sub-humid conditions of PMB can reduce the temperature to the
same extend as EC alone in hot and arid conditions as evidenced by the work of Ndukwu et al.
(2013). In their work at an ambient temperature of 32℃, the EC system provided the storage
conditions of 19.2 ℃. Zakari et al. (2016) obtained similar results where temperature drop of up
10℃ was achieved when evaluating EC system of capacity of 0.6 m3 under hot and dry conditions
where they used jute bag as pad material.
Figure 4.6 depicts a similar scenario when observing the variation of average temperature per day
in the 11 selected days for the four strategic data logger positions; in the psychometrics unit just
after the last cooling pad and storage chamber (at inlet, centre and exhaust end). The cold air
coming from the last cooling pad in the psychrometric unit was forced into the chamber by the
ventilating fan at the entrance to the chamber.
Figure 4.6 Average temperature per day over the 11 hot days at Ukulinga research station in
Pietermaritzburg.
12
16
20
24
28
32
Day1 Day2 Day3 Day4 Day5 Day6 Day7 Day8 Day9 Day10 Day11
Tem
pera
ture
o C
Average daily temperature for selected days with maximum temperature above 26 oC
after pads ambient centre exhaust inlet
CV = 14.3%LSD (0.05) = 1.30

136
A 1℃ temperature rise was observed inside the storage chamber between the air entering the
storage chamber and the temperature recorded immediately after the inlet to the chamber. This
could have possibly resulted due to air leaks into the storage chamber and air picking heat from the
stored tomato fruit. There is less than 1℃ difference in temperature between the air entering storage
chamber and the air exiting the storage chamber at the exhaust end. This is attributable to the
appropriate ventilation rate applied that provides a quick steady distribution of air throughout the
storage chamber and the fact that the storage chamber was filled with sample tomatoes of 150 kg
instead of 3 825 kg. It is possible that the temperature at the exhaust end can be high when the
storage chamber is filled to capacity as the air picks heat from stored produce.
Figure 4.7 shows the hourly characteristics of ambient air and exit to the psychometric unit, cooler
air at the inlet, centre and exhaust positions of the cooler.
Figure 4.7 The effect of IAC+EC on temperature during daytime at Ukulinga research station
in Pietermaritzburg.
The temperature gradient between the ambient and at inlet to the storage chamber (D3) from 10h00
and 16h00, the hottest part of the day, was 10 - 12℃, which is comparable to the results obtained
12
15
18
21
24
27
30
33
5:00 7:00 9:00 11:00 13:00 15:00 17:00 19:00 21:00 23:00
Tem
pera
ture
o C
Time of the day
after pads ambient centre exhaust inlet

137
by Ndukwu et al. (2013) of gradients of up to 13℃ during the same period of the day. It was
observed that psychometric unit, storage chamber and the ambient temperatures increased from
05h00 until between 13h00 to 14h00 and thereafter starting decreasing to about 26℃ at 17h00. The
temperature decreased due to increasing incident solar radiation from morning until afternoon
13h00-14h00 and then decreasing from then onwards towards evening and sunset as also confirmed
by Madhava et al. (2017). The period from 05h00 to 17h00-18h00 is the time during which cooling
is important for F&V to reduce physiological activities and to maintain freshness (Getinet et al.,
2008). This implies that the EC technology in general and IAC+EC in particular is highly suitable
for fresh produce pre-cooling and for short-term storage in hot and sub-humid to humid areas. The
maximum temperature gradient between the storage chamber and ambient was found between
09h00 and 17h00 and this is the period that cooling for fresh produce is required. Anyanwu (2004)
and Tolesa and Workneh (2017) made similar observations.
The ambient temperature flattened out from 19h00 and reached 20℃ by 22h00 implying that the
IAC+EC system can be designed to operate five hours into the night and be switched off until
05h00 of the following day as fresh produce like tomatoes can tolerate for short periods
temperatures of 13-21℃. Such an approach will reduce the number of solar panels and batteries
required to power the IAC+EC systems and thus will in turn reduce the capital investment in the
facility and encourage a lot of SSF to venture into the lucrative fresh produce market.
From the Figure 3.4 in section 3.3.2 at 13h00, the ambient air temperature could be significantly
(P<0.001) dropped down by 11-13℃ by the effect of IAC+EC at the inlet, centre and exhaust
positions of the cooler. The IAC+EC system maintained an average temperature between 16℃ and
21℃ during the hottest time of the day (11h00 am to 14h00) where ambient temperatures ranged
from 29℃ and 32℃. The midday period is the critical time in which cooling of fresh produce is
important to maintain quality (Tolesa and Workneh, 2017). Controlling temperature within
optimum levels is necessary especially in the sub-tropical climate obtaining in most countries in
East and Southern Africa characterized by high temperature, to reduce the rate of microbial changes
and in turn activates enzymatic reactions in produce (Brosnan and Sun 2001). The average hourly
ambient air temperature rose significantly from 18℃ at 05h00 to a maximum average of 30 ℃ and
32℃ between midday and 14h00 and dropped to 20℃ and below after 19h00 while the storage
chamber conditions were maintained at 13 to 16℃ during the same period, which agrees with
138
Tolesa and Workneh (2017). The IAC+EC system achieved temperature of 13 to 16 ℃ and this
agrees with that reported, by ASHRAE (1982) and Zakari et al. (2016) that obtained 13 to 21℃
and 13.75 to 14.75℃ respectively. This is moderately acceptable. However, the ambient
temperature greater than 23℃ are well above that recommended by ASHRAE (1982) of 13 to 21℃
lead to deterioration and thereby reduce the shelf life of fresh F&V storage.
By design, cooling systems like EC significantly reduce ambient air temperature to a safe storage
temperature range for tomatoes according Thompson et al. (1998). The temperature inside the
storage chamber was lower than ambient at any period of the day while temperatures in the storage
chamber varied in a narrow range. Therefore, the mean air properties of temperature in the
evaporative cooler are more suitable for storage of tomatoes than the mean ambient air properties.
It is critical that there is no deviation in provision of optimum storage temperature either too low
or too high as such conditions can result in either chilling injury or physiological disorders for fresh
produce stored in cold storage (de Castro et al 2005; El-Refaie and Kaseb, 2009; Rajan and
Anandan, 2018).
Thus, it is clear that the IAC+EC is able to reduce temperature to appropriate storage level for a
number of tropical and sub-tropical F&V and therefore such facilities need to be installed for SSF
throughout the humid and sub-humid tropical regions in order to promote F&V production. EC
would be used to solve the problem associated with cooling F&V.
4.3.3 Variation of Relative Humidity RH of the IAC+EC system were studied on eleven clear, sunny days where the maximum
temperature was above 26℃. RH was recorded from eleven positions as shown in Figure 4.8. The
initial results and discussions consider all the nine positions in the chamber but there is then a
special focus on environmental conditions pertaining to the inlet to the storage chamber, centre of
the chamber and the centre of the exhaust end.
Figure 4.8 shows that there was a significant variation (P<0.001) in ambient, exit point of the
psychrometric unit and the storage chamber RH at various positions at entrance, centre and exhaust.
The highest average RH was obtained at the outlet of the psychometric unit (D-2), the lowest

139
average RH was at the ambient (D-1) and inside the storage chamber the lowest average RH was
at the exhaust end (D-10). The average ambient RH was 65.37%.
Figure 4.8 Variation of relative humidity in the IAC+EC unit and storage chamber at Ukulinga
research station in Pietermaritzburg
It was also observed that there was significant variation in RH (P<0.001) between the different data
logger positions at the entrance, centre and exhaust end of the storage chamber. The highest RH of
93.8% was recorded near the inlet to the chamber while the lowest RH inside the storage chamber
was observed at the exhaust end. The RH in the storage chamber ranged from 89.6% – 93.8%,
which was the maximum possible level of saturation of air by humidification for IAC+EC as 100%
RH is not achievable because 100% saturation is impossible as alluded to by Xuan et al. (2012) in
a direct evaporative cooling experiment. To achieve 100% will require a cooling pad with a 100%
efficiency and the contact time between air and water should be long enough to allow for 100%
heat and mass transfer, which in reality does not happen (Manuwa and Odey, 2012).
Figure 4.9 depicts a similar scenario when observing the variation of RH in the eleven selected
days for the four strategic data logger positions; in the psychometrics unit just after the last cooling
pad and storage chamber (at inlet, centre and exhaust end). The cold air coming from the last
0102030405060708090
100
D-1 D-2 D-3 D-4 D-5 D-6 D-7 D-8 D-9 D-10 D-11
Aver
age
Rel
ativ
e H
umid
ity (%
)
Data logger position
CV = 4.5%LSD(0.05) = 1.26

140
cooling pad, next to the storage chamber inlet, centre of the chamber and centre of the exhaust end.
A two percent RH drop was recorded inside the storage chamber between the air entering the
storage chamber and the RH recorded immediately after the inlet to the chamber. This resulted
from air picking heat from the stored tomato fruit causing an increase in temperature. The IAC+EC
system maintained the RH in the storage chamber constant and within the recommended levels of
85-95% throughout the period of observation. This is in sharp contrast with the ambient RH that
fluctuated throughout the period well below the recommended storage levels.
Figure 4.9 Average relative humidity per day over the 11 hot days at Ukulinga research station
in Pietermaritzburg.
At the same time from Figure 4.10 at 14h00, the ambient RH of 46.6% could be significantly
(P<0.001) brought to 90.9%, 88.6% and 87.8% RH at inlet, centre and exhaust positions by the
effect of the IAC+EC. The small temperature increases after the psychometric unit into the inlet of
the storage change resulted into a 2% drop in RH and a further reduction from 94.1 % RH to 90.5
% at the exit end of the storage chamber as air picks up heat from the produce. Observations are
that RH decreased marginally with time of day in the storage chamber while ambient RH decreased
with time of the day was found to be very low values at midday and towards the afternoon. This
50556065707580859095
100
Day1 Day2 Day3 Day4 Day5 Day6 Day7 Day8 Day9 Day10 Day11
Rel
ativ
e H
umid
ity (%
)
Selected days with maximum temperature above 26 oC
after pads ambient centre exhaust inlet
CV = 6.6%LSD(0.05) = 1.83

141
was due to increase in temperature inside and outside the cooler, resulting in increased water
holding capacity of the air in the cooler. Madhava et al. (2017) had a similar observation in their
study in evaluating the performance of a photovoltaic ventilated greenhouse. During the period
after 14h00, the RH increased as the ambient and storage temperatures decreased.
Figure 4.10 Average relative humidity per day over the 11 hot days at Ukulinga research
station in Pietermaritzburg.
The RH inside the storage chamber was higher than ambient at any period of the day as the
temperature inside the chamber was lower than the ambient at any period of the day. The general
low ambient RH results in faster removal moisture from the wet surface of the F&V (Awole et al.,
2011). This implies that during this period of the day, cooling of fresh produce under ambient RH
conditions leads to physiological deterioration of fresh produce quality. In the same period, for the
IAC+EC system the RH inside the storage chamber was high due to humidification resultant from
the indirect heat exchanger and the cooling pads providing a conducive environment suitable for
extending the shelf life of F&V.
40
50
60
70
80
90
100
5:00 7:00 9:00 11:00 13:00 15:00 17:00 19:00 21:00
Rel
ativ
e H
umid
ity (%
)
Selected days with maximum temperature above 26 oC
after pads ambient centre exhaust inlet
CV = 9.9%
LSD (0.005) =3.08

142
The RH at entrance was always higher than the corresponding times at the centre and exhaust end.
This was due to increasing temperatures at corresponding points due to cold air picking up heat
from the tomatoes. The RH followed the same pattern at all four positions along the length of the
day with a minimum of 87% at the exhaust end at 14h00. The maintenance of RH above 85% is
important in maintaining weight, appearance, nutritional quality and flavour, while softening and
juiciness of tomatoes are reduced (Basediya et al., 2013). The values of 85>RH<95 are ideally
storage conditions for produce like avocados, bananas, cucumbers, mangoes, oranges, papaya,
sweet potatoes and tomatoes (ASHRAE, 1982; Cantwell et al., 2009). The IAC+EC system
increased ambient RH from 47% to 87 to 93%, which closely agrees with that reported by
ASHRAE (1982) and Zakari et al. (2016) that obtained 75 to 88%. However, the result of average
ambient RH ranging from 44 to 65% between 10h00 and 17h00 was below that recommended by
ASHRAE (1982) and hence this will reduce the shelf life of fresh F&V storage.
With such RH levels in the storage chamber, there will be minimal water loss from the tomatoes
thus maintenance of saleable weight, appearance, nutritional quality and reduction in softening and
juiciness as alluded to by Kobiler et al. (2010) and Laguerre et al. (2013). This demonstrates that
the use of IAC+EC significantly increases the storage chamber RH and thus prolonging the shelf
life of tomatoes and many other fresh produces.
4.3.4 Cooling Efficiency The period from 05h00 to 19h00 during the evaluation period was considered to determine cooling
efficiency. The cooler efficiencies for 05h00 to 19h00 are shown in Table 4.1. From Table 4.1 the
cooler efficiency ranged between 86.8% and 97%. Between 05h00 and 09h00, the efficiency was
about 92-95% and was rising in the period achieving highest efficiencies between 09h00 to 14h00,
then declining thereafter to 86.8% by 18h00, and started rising from there. The cooling curve
efficiency shows that higher cooling efficiency obtains with higher temperature and lower RH of
ambient air in the afternoon when the solar irradiation is highest. This is desirable state as the
cooling load is highest at the time that the solar photovoltaic is providing the highest power as
corroborated by Ndukwu et al. (2013). The decline in efficiency is linkable to the increase in
ambient dry bulb temperature as the solar radiation increased during the day and the results are
within the findings by the study of Seweh et al. (2016) on direct evaporative cooling under hot and

143
dry conditions. The cooling efficiency of IAC+EC is affected by factors such as, type of cooling
pad, pad design, thickness of pad, airflow rates and outside air temperature and RH
(Lertsatitthanakorn et al., 2006).
Table 4.1 Temperature and cooler efficiencies
Time of
the day
Dry bulb
ambient air
(℃)
Ambient relative
humidity (%)
Wet bulb
ambient air
(℃)
Dry bulb
cooled air
(℃)
Cooler
efficiency (%)
05h00 18.82 80.69 12.60 13.06 92.6
06h00 20.30 78.27 13.21 13.62 94.3
07h00 21.74 76.55 14.68 15.19 94.2
08h00 23.41 73.93 15.30 15.81 94.9
09h00 25.23 68.13 16.61 17.01 96.4
10h00 27.68 64.34 17.58 17.98 97.0
11h00 29.66 59.21 16.72 17.41 95.3
12h00 31.34 54.14 19.63 20.11 96.6
13h00 31.98 48.77 19.90 20.42 96.7
14h00 31.84 46.55 19.30 19.94 95.7
15h00 30.39 48.73 17.92 18.77 93.8
16h00 28.42 52.71 18.02 18.83 93.3
17h00 25.45 58.78 16.31 17.61 86.8
18h00 23.11 63.39 14.60 15.82 86.8
19h00 20.75 68.31 13.33 14.35 87.2

144
Average 26.0 41.0 16.38 16.99 93.5
The efficiency of the cooling for IAC+EC systems as shown in Table 4.1 indicates that the
Psychrometric unit was on average 93.5% efficient in reducing the ambient temperature as it
entered the indirect heat exchanger and the three-layer cooling pads. These results are comparable
to the direct evaporative cooling experiments done by Zakari et al. (2016) and Babaremu et al.
(2018) who obtained efficiencies of 83% and 86% respectively. The results imply that the
combination of the indirect heat exchanger for indirect air-cooling and the evaporative cooling
produces reasonable reduction in ambient air temperature to a minimum temperature approaching
ambient air wet bulb temperature. At these prevailing hot and sub-humid conditions, the cooler was
able to preserve freshly harvested tomatoes for more than 21 days. The results obtained in this
experiment shows that IAC+EC can be utilised in coastal areas providing cooling efficiencies
similar to those obtained in direct evaporative cooling under dry and hot conditions.
4.4 Conclusions The lack of cooling facilities and knowledge by SSF in SSA postharvest handling of fresh produce
results in a significant amount of harvested F&V decaying between the farmers’ field and the
market. To alleviate this challenge, a low-cost, IAC+EC storage system was developed for SSF in
hot and sub-humid to humid areas. The environmental conditions provided by IAC+EC system
significantly (P<0.001) increased RH and decreased temperature which conditions are requisites
for transportation and temporary storage of fresh produce. EC offers an advantage over mechanical
refrigerating systems, which decrease both temperature and RH at the same time with high-energy
consumption while IAC+ EC decrease temperature by 7-16℃ and increased RH by 13-41% with a
considerable low amount of energy. In addition, IAC+ EC is more suitable for storage of F&V that
do not require very low temperature (below 12℃) . The storage chamber environmental conditions
were hardly influenced by external solar radiation conditions whilst the ambient conditions were.
The IAC+EC was able to maintain temperatures of 20℃ and below during the midday hours which
is the hottest part of the day where cooling is required. The ambient air temperature increased from
an average of 18.8 ℃ at 05h00 in response to increasing solar radiation and the peak of 32.0
℃ coincided with peak solar radiation at mid-day (13h00). The temperature gradient ranged from

145
7℃ to 16℃ between the IAC+EC system and the ambient conditions. Low temperature inhibits
ethylene production through reducing the enzymatic activities of the tomato fruit and thus
prolonging the shelf life. Similarly, RH reduced with increasing solar radiation. The lowest RH
levels were in the middle of the day, coinciding with peak solar radiation. The RH gradient ranged
from 13% to 43% between the IAC+EC storage chamber and ambient conditions. The increase in
the temperature and reduction in RH under ambient conditions increases the water holding capacity
of the ambient air hence would increase moisture loss from fresh produce resulting in wilting and
shriveling. It is therefore important to reduce temperature and increase RH from midday to late
afternoon.
In the IAC+EC system, the indirect heat exchanger helped significantly reduce the air temperature
in the storage chamber while the EC unit increased the RH i.e. the moisture content of the air thus
providing thermal comfort to fresh produce. Controlling the environmental factors within
recommended levels in the storage chamber helps prevent the physiological weight loss in fresh
produce and thus extending shelf life. The RH in for the IAC+EC was within the recommended
range of most tropical and sub-tropical F&V for the storage. The benefit of the indirect heat
exchanger and multiple charcoal cooling pads in the reduction of temperature was exploited in
helping to maintain the high RH.
The IAC+EC system under the hot and sub-humid to humid conditions performed to the same extent
as the EC under dry and arid conditions where temperature is high and RH is low. This has tended
to limit the application of EC but with the incorporation of an indirect heat exchanger, it can be
extended to sub-humid to humid conditions. These results clearly demonstrate that the IAC+EC
system is useful in the study area of hot and sub-humid to humid climate for preservation of F&V,
especially during the hottest time of the day when cooling is most needed. The results are more
interesting as the study is a deviation from the norm where most studies have been carried out on
miniature structures of less than 0.2 tonnes and in this experiment, the structure is 53 m3 with a 3.8
tonne carrying capacity of tomatoes. The results on IAC+EC system recommends and pave way for
adaptation by SSF as the system’s energy requirements were supplied by SPV systems thus availing
a suitable cooling structure for farmers in isolated, dispersed and remote areas. It is expected that
EC in general and IAC+EC in particular will provide relief to SSF in coastal areas that will emerge

146
from the pending land re-distribution in South Africa as the current facilities and available grid
electricity might not suffice curter for new needs.
The work presented in this chapter is important because there is a scarcity of quantitative
characterization of the performance of low-cost IAC+EC technology for cooling the
microenvironment in the storage in order to maintain the quality of fresh produce, which can be
used by SSF, emerging farmers’ and cooperatives. This work has also contributed to improving the
understanding of the effect of low-cost IAC+EC technology in provision of a microenvironment
for storage of F&V under hot and sub-humid to humid conditions in Southern Africa. This study
characterised IAC+EC and clearly demonstrated that the cooling system could maintain the inside
environmental conditions of air temperature and RH approximately constant and at recommended
levels for tomatoes and most tropical and sub-tropical F&V. This work has therefore, contributed
to improving the understanding of the effect of low-cost IAC+EC technology on temperature
reduction and RH increase under hot and sub-humid to humid conditions in Southern Africa.
IAC+EC is therefore, recommended for storage tropical and sub-tropical F&V as it can increase
their shelf life.

147
4.5 References Abbouda, KS and Almuhanna, EA. 2012. Improvement of Evaporative Cooling System Efficiency
in Greenhouses. International Journal on Latest Trends in Agriculture and Food Sciences,
2(2), 83-89.
Adebisi, OW, Igbeka, JC and Olurin, TO. 2009. Performance evaluation of absorbent materials in
evaporative cooling system for the storage of fruits and vegetables. International Journal
of Food Engineering, 5(3), 1-14.
Affognon, H, Mutungi, C, Sanginga, P and Borgemeister, C. 2015. Unpacking postharvest losses
in Sub-Saharan Africa: A Meta-analysis. World development, 66, 49-68.
doi.org/10.1016/j.worlddev.2014.08.002.
Akdemir, S, Ozturk, S, Edis, FO and Bal, E. 2013. CFD Modelling of Two Different Cold Stores
Ambient Factors. IERI Procedia, 5, 28-40.
Amer, O, Boukhanouf, R and Ibrahim, HG. 2015. A Review of Evaporative Cooling Technologies.
International Journal of Environmental Science and Development, 6(2), 111-117.
Anyanwu, EE. 2004. Design and measured performance of a porous evaporative cooler for
preservation of fruits and vegetables. Energy Conversion and Management, 45, 2187-2195.
Awole, S, Woldetsadik, K and Workneh, TS. 2011. Yield and storability of green fruits from hot
pepper cultivars (Capsicum spp.). African Journal of Biotechnology, 10(59), 12662-12670.
Arah, IK, Amaglo, H, Kumah, EK and Ofori, H. 2015. Preharvest and Postharvest Factors
Affecting the Quality and Shelf Life of Harvested Tomatoes: A mini review. International
Journal of Agronomy. dx.doi.org/10.1155/2015/478041.
ASHRAE. 1982. Handbook of Standards. American Society of Heating and Refrigeration and Air
Conditioning.
ASHRAE. 2004. Handbook. HVAC Systems and equipment. ASHRAE Inc, Atlanta, USA.
Babaremu, KO, Omodara, MA, Fayomi, SI, Okokpujie, IP and Oluwafemi, JO. 2018. Design and
Optimization of an Active Evaporative Cooling System. International Journal of
Mechanical Engineering and Technology, 9(10), 1051–1061.
Basediya, ALD, Samuel, VK and Beera, V. 2013. Evaporative cooling system for storage of fruits
and vegetables – a review. Food Science Technology, 50(3), 429-442. doi.10.1007/s13197-
011-0311-6.

148
Best, B, Aceves, JJ, Islas, HJM, Manzini, SFB, Pilatowsky, PIF, Scoccia, R and Motta, M. 2012.
Solar cooling in the food industry in Mexico: A case study. Applied Thermal Engineering,
doi.10.1016/j.applthermaleng. 2011.12.036.
Brosnan, T and Sun, DW. 2001. Precooling techniques and applications for horticultural products
– a review. International Journal of Refrigeration, 24(2), 154-170.
Burger, JH, Heyns, PJ, Hoffman, E, Kleynhans, EPJ, Koegeleberg, FH, Lategan, MT, Mulder, DJ,
Smal, HS, Stimie, CM, Uys, WJ, van der Merwe, FPJ, van der Stoep, I and Viljoen, PD.
2003. Irrigation Design Manual, Pumps. Agricultural Research Council, Pretoria, South
Africa.
Cantwell, MI, Nie, X and Hong, G. 2009. Impact of storage conditions on grape tomato quality.
Sixth ISHS Postharvest Symposium, International Society of Horticultural Science,
Antalya, Turkey.
Chaudhari, BC, Sonawane, TR, Patil, SM and Dube, A. 2015. A review on evaporative cooling
technology. International Journal of Research in Advent Technology, 3(2), 88-96.
Chen, Q, Yang, K, Wang, M, Pan, N and Guo, Z-Y. 2010. A new approach to analysis and
optimization of evaporative cooling system I: Theory. Energy, 35(6), 2448-2454.
Chijioke, OV. 2017. Review on Evaporative Cooling Systems. Greener Journal of Science,
Engineering and Technological Research, 7(1), 1-20. ISSN: 2276-7835.
doi.org/10.15580/GJSETR.2017.1.031817038.
Davis, J and MacKay, F. 2013. Solar Energy in the Context of Energy Use, Energy Transportation,
and Energy Storage [Internet]. University of Cambridge. Cambridge, UK. Available from:
http://www.inference.eng.cam.ac.uk/sustainable/book/tex/RSsolar.pdf. [Accessed 17
April 2016].
de Castro, LR, Vigneault, C, Charles, MT and Cortez, LAB. 2005. Effect of cooling delay and
cold-chain breakage on Santa Clara‟ tomato. Journal of Food, Agriculture and
Environment, 3(1), 49-54.
Deoraj, S, Ekwue, EI and Birch, R. 2015. An evaporative cooler for the storage of fresh fruits and
vegetables. The West Indian Journal of Engineering, 38(1), 86–95.
El-Refaie, MF and Kaseb, S. 2009. Speculation in the feasibility of evaporative cooling. Building
and Environment, 44, 826-838.

149
FAO. 2013. The state of food insecurity in the world. [Internet]. FAO, Rome, Italy. Available
from: http://www.fao.org/publications/sofi/en/.[Accessed 17 June 2017].
Getinet, H, Seyoum, T and Woldetsadik, K. 2008. The effect of cultivar, maturity stage and storage
environment on quality of tomatoes. Journal Food Engineering, 87, 467–478.
Getinet, H, Workneh, TS and Woldetsadik, K. 2011. Effect of maturity stages, variety and storage
environment on sugar content of tomato stored in multiple pads evaporative cooler. African
Journal of Biotechnology, 10(80), 18481-18492.
Grubinger, V and Sanford, S. 2015. Ventilation and Cooling Systems for Animal Housing.
[Internet]. Coorporative Extension System, San Antonio, USA. Available from:
http://articles.extension.org/pages/32633/ventilation-and-cooling-systems-for-animal-
housing#Mechanical_Ventilation. [Accessed 12 June 2017].
GSES 2015. Solar-powered pumping in agriculture. In: A Guide to System Selection and Design.
NSW Farmers, New South wales, Australia.
Gunhan, T, Demir, V and Yagcioglu, AK. 2007. Evaluation of the Suitability of Some Local
Materials as Cooling Pads. Biosystems Engineering, 96 (3), 369-377.
Gupta, CP, Abbas, A and Bhutta, MS. 1995. Thermal comfort inside a tractor cab by evaporative
cooling system. Transaction of ASAE, 38(6), 1667-1675.
Hassan, HZ and Mohamad, AA. 2012. A review on solar cold production through absorption
technology. Renewable Energy and Sustainable Energy Reviews, 16, 5331-5348.
Hamill, L. 1995. Understanding hydraulics. Macmillan Press, London, UK.
Hellickson, MA and Walker, JN. 1983. Ventilation of agricultural structures. ASAE, St Joseph,
USA.
Ho, SH, Rosario, L and Rahman, MM. 2010. Numerical simulation of temperature and velocity in
a refrigerated warehouse. International Journal of Refrigeration-Revue Internationale Du
Froid, 33, 1015-1025.
Holman, JP. 1989. Heat transfer. McGraw-Hill, Singapore.
Jensen, MH. 2002. Controlled environment agriculture in deserts, tropics and temperate regions-
a world review. In: eds. Chen, S and Li, TT, International symposium on design and
environmental control of tropical and subtropical greenhouses, 1-9. Acta Hort 578,
Taichung, Taiwan.

150
Jradi, M and Riffat, S. 2014. Experimental and numerical investigation of a dew-point cooling
system for thermal comfort in buildings. Applied Energy, 132, 524–535.
Kazem, HA, Al-Waeli, AHA, Chaichan, MT, Al-Mamari, AS and Al-Kabi, AH. 2017. Design,
measurement and evaluation of photovoltaic pumping system for rural areas in Oman.
Journal of Environment Development and Sustainability, 19, 1041–1053.
doi.10.1007/s10668-016-9773-z.
Katundu, M, Hendriks, S, Bower and Siwela, M. 2010. Can sequential farming help smallholder
organic farmers meet consumer expectations for organic potatoes? Food Quality and
Preference, 21, 379-384.
Kiggundu, N, Wanyama, J, Galyaki, C, Banadda, N, Muyonga, JH, Zziwa, A and Kabenge, I.
2016. Solar fruit drying technologies for smallholder farmers in Uganda, A review of
design constraints and solutions. Agricultural Engineering International: CIGR Journal,
18(4), 200-210.
Kim, DS and Ferreira, CAI. 2008. Solar refrigeration options – a state of the art review.
International Journal of Refrigeration, 31, 3-15.
Kobiler, I, Akerman, M, Huberman, L and Prusky, D. 2010. Integration of pre- and postharvest
treatments for the control of black spot caused by Alternaria alternata in stored persimmon
fruits. Journal of Postharvest Biology and Technology, 59, 166–171.
Korir, MK, Mutwiwa, UN, Kituu, GM and Sila, DN. 2017. Effect of near infrared reflection and
evaporative cooling on quality of mangoes. Agricultural Engineering International: CIGR
Journal, 19(1), 162–168.
Laguerre, O, Hoang, HM and Flick, D. 2013. Experimental investigation and modelling in the food
cold chain: Thermal and quality evolution. Trends in Food Science and Technology, 29,
87-97.
Lertsatitthanakorn, C, Rerngwongwitaya, S and Soponronnarit, S. 2006. Field experiments and
economic evaluation of an evaporative cooling system in a silkworm rearing house.
Biosystems Engineering, 93(2), 213-219.
Liao, CM, Singh, S and Wang, TS. 1998. Characterizing the performance of alternative
evaporative cooling pad media in thermal environmental control applications. Journal of

151
Environmental Science and Health, Part A-Toxic/Hazardous Substances & Environmental
Engineering, 33(7), 1391-1417.
Liberty, JT, Agidi, G and Okonkwo, WI. 2014. Predicting Storability of Fruits and Vegetables in
Passive Evaporative Cooling Structures. International Journal of Scientific Engineering
and Technology, 3(5), 518–523.
Madhava, M, Kumar, S, Rao, DB, Smith, DD and Kumar, HVH. 2017. Performance evaluation of
photovoltaic hybrid greenhouse dryer under no-load condition. Agricultural Engineering
International: CIGR Journal, 19(2), 93-101.
Manuwa, SI and Odey, SO. 2012. Evaluation of pads and geometrical shapes for constructing
evaporative cooling system. Modern Applied Science, 6(6), 45-53.
Misra, D and Ghosh, S. 2018. Evaporative cooling technologies for greenhouses: a comprehensive
review. Agricultural Engineering International: CIGR Journal, 20(11), 1-14
Ndukwu, MC and Manuwa, SI. 2014. Review of research and application of evaporative cooling
in preservation of fresh produce. International Journal of Agricultural and Biological
Engineering, 7(5), 85-102.
Ndukwu, MC, Manuwa, SI, Olukunle, OJ and Oluwalana, IB. 2013. Development of an active
evaporative cooling system for short-term storage of fruits and vegetable in a tropical
climate. Agricultural Engineering International: CIGR Journal, 15(4), 307-313.
Nkolisa, N, Magwaza, LS, Workneh, TS and Chimphango, A. 2018. Evaluating evaporative
cooling system as an energy- free and cost- effective method for postharvest storage of
tomatoes (Solanum lycopersicum L.) for smallholder farmers. Scientia Horticulturae, 241,
131-143. doi.org/10.1016/j.scienta.2018.06.079.
Obura, JM, Banadda, N, Wanyama, J and Kiggundu, N. 2015. A critical review of selected
appropriate traditional evaporative cooling as postharvest technologies in Eastern Africa.
Agricultural Engineering International: CIGR Journal, 17(4), 327-336.
Ogbuagu, NJ, Green, IA, Anyanwu, CN and Ume, JI. 2017. Performance evaluation of a
composite-padded evaporative storage bin. Nigeria Journal of Technology (NIJOTECH),
36(1), 302-307.

152
Okanlawon, SA and Olorunnisola, AO. 2017. Development of passive evaporative cooling
systems for tomatoes Part 1: construction material characterization. Agricultural
Engineering International: CIGR Journal, 19(1), 178-186.
Olomiyesan, BM, Oyedum, OD, Ugwuoke, PE, Ezenwora, JA and Ibrahim, AG. 2015. Solar
Energy for Power Generation: A Review of Solar Radiation Measurement Processes and
Global Solar Radiation Modelling Techniques. Nigerian Journal of Solar Energy, 26, 1-8.
Olosunde, WA, Aremu, AK and Okoko, P. 2016. Computer simulation of evaporative cooling
storage system performance. Agricultural Engineering International: CIGR Journal,
18(4), 280-292.
Parida, B, Iniyanb, S and Goicc, R. 2011. A review of solar photovoltaic technologies. Renewable
and Sustainable Energy Reviews, 15, 1625-1636.
Rajan, ABK and Anandan, SS. 2018. Post-Harvest Management of Fruits and Vegetables in India:
Past, Present and Future. TAGA Journal, 1, 2385-2414. ISSN: 1748-0345.
Razak, JA, Sopian, K and Ali, Y. 2007. Optimization of renewable energy hybrid system by
minimizing excess capacity. Energy, 1(3), 77-81.
Rehman, S and Al-Hadhrami, LM. 2010. Study of a solar PV-diesel-battery hybrid power system
for a remotely located population near Rafha, Saudi Arabia. Energy, 35, 4986-4995.
Saltveit, ME. 2018. Respiratory Metabolism - Chapter 4. Postharvest Physiology and Biochemistry
of Fruits and Vegetables, 73-91. doi.org/10.1016/B978-0-12-813278-4.00004-X.
Sarvacos, GD and Kostaropolous, AE. 2002. Handbook of Food Processing Equipment. Kluwer
Academic, London.
Saxena, EM, Agarwal, N and Srivastava, G. 2013. Design and Performance of solar air heater with
long term heat storage. International Journal of Heat and Mass Transfer, 60, 8-16.
Schuur, CM. 1988. Packaging of fruit vegetables and root crops. FAO Corporate Document
Repository, Barbados.
Seweh, M, Darko, JO, Addo, A, Asagadunga, PA and Achibase, S. 2016. Design, construction and
evaluation of an evaporative cooler for sweet potatoes storage. Agricultural Engineering
International: CIGR Journal, 18(2), 435-448.

153
Shaahid, SM and El-Amin, I. 2009. Techno-economic evaluation of off-grid hybrid Photovoltaic–
diesel–battery power systems for rural electrification in Saudi Arabia - A way forward for
sustainable development. Renewable and Sustainable Energy Reviews, 13, 625–633.
Sharan, G and Rawale, K. 2009. New packaging options for transporting tomatoes in India. ITDG
Food Chain, 29, 15-18.
Szabo, S, Bódis, K, Huld, T and Moner-Girona, M. 2011. Energy solutions in rural Africa:
mapping electrification costs of distributed solar and diesel generation versus grid
extension. Environmental Research Letters, 6(3), 1-9.
Tabrez, S and Chaurasia, PBL. 2014. A Study on different materials used as insulation in solar
passive cool chamber for loading of vegetables. International Journal Engineering. Tech.
& Computer Res, 2, 74-81.
Thipe, EL, Workneh, T, Odindo, A and Laing, M. 2017. Greenhouse technology for agriculture
under arid conditions. Sustainable Agriculture Reviews, 22, 37–55.
Thompson, JF, Mitchell, FG, Rumsey, TR, Kasmire RF and Crisoto, CC. 1998. Commercial
cooling of fruits, vegetables and flowers. Publication No. 21567, 61-68. DANR
publication, UC Davis, USA.
Thompson, J, Cantwell, M, Arpaia, ML, Kader, A, Crisosto, C and Smilanick, J. 2001. Effect of
cooling delays on fruit and vegetable quality. Perishables Handling Quarterly, 105, 1-4.
Tigist, M, Workneh, TS and Woldetsadik, K. 2011. Effects of variety on quality of tomato stored
under ambient temperature conditions. Food Science Technology, 50(3), 467-478. doi.
10.1007/s13197-011-0378-0.
Tolesa, GN and Workneh, TS. 2017. Influence of storage environment, maturity stage and pre-
storage disinfection treatments on tomato fruit quality during winter in KwaZulu-Natal,
South Africa. Journal of Food Science and Technology, 54(10), 3230-3242.
doi.10.1007/s13197-017-2766-6.
Tyagi, S, Sahay, S, Imran, M, Rashmi, K and Mahesh, SS. 2017. Pre-harvest Factors Influencing
the Postharvest Quality of Fruits: A Review. Current Journal of Applied Science and
Technology, 23(4), 1-12. ISSN: 2231-0843.
van Henten, EJ, Bakker, JC, Marcelis, LFM, Van ’t Ooster, A, Dekker, E, Stanghellini, CB,
Vanthoor, B, Van Randeraat, B and Westra, J. 2006. The adaptive greenhouse - An

154
integrated systems approach to developing protected cultivation systems. In: eds. Marcelis,
LFM, van Straten, G Stanghellini, C and Heuvelink, E. 3rd International Symposium on
Models for Plant Growth, Environmental Control and Farm Management in Protected
Cultivation: 399-406. ActaHort, 718, Wageningen, Netherlands.
von Zabeltitz and Baudoin, WO. 1999. Greenhouse and shelter structures for tropical regions. FAO
plant and protection paper 154. Rome, Italy.
Waaijenberg, D. 2004. Design, construction and maintenance of greenhouse structures. In: eds.
Kamaruddin, R, Rukuniddin, H and Hamid, NRA, Proceedings of International
Symposium on Greenhouses, Environmental Controls and In-house Mechanization for
Crop Production in the Tropics and Sub-tropics, 31-42. ActaHort 710, Pahang, Malaysia .
World Bank. 2011. Missing food: the case of postharvest grain losses in Sub-Saharan Africa.
Report No. 60371-AFR, NW, Washington, DC.
Workneh, TS and Woldetsadik, K. 2004. Forced ventilation evaporative cooling: A case study on
banana, papaya, orange, mandarin, and lemon. Tropical Agriculture, 8(1), 401- 404.
Xuan, YM, Xiao, F, Niu, XF, Huang, X and Wang, SW. 2012. Research and application of
evaporative cooling in China: A review (I). Renewable and Sustainable Energy Reviews,
16(5), 3535–3546.
Zakari, MD, Abubakar, YS, Muhammad, YB, Shanono, NJ, Nasidi, NM, Abubakar, MS,
Muhammed, AI, Lawan, I and Ahmad, RK. 2016. Design and construction of an
evaporative cooling system for the storage of fresh tomatoes. Asian research publishing
Network (ARPN) Journals of Engineering and Applied Sciences, 11(4), 2340-2348.

155
5 EFFECTS OF INDIRECT AIR COOLING COMBINED WITH
DIRECT EVAPORATIVE COOLING ON THE QUALITY OF
STORED TOMATO FRUIT Abstract Low-cost cooling systems either as direct evaporative cooling for dry and arid climates or
combined indirect air cooling and evaporative cooling (IAC+EC) for hot and sub-humid to humid
climates can provide an optimum storage environment in small-scale farming. A 53 m3 solar
powered evaporative cooler for temporary storage of tomato fruit was developed to improve the
shelf life of tomatoes for small-scale farmers (SSF) in Southern Africa by reducing indoor
temperature and increasing RH. This study aimed at investigating the effect of IAC+EC, maturity
stage at harvesting and period of storage on the quality of tomatoes. The effect of these factors on
total soluble solids (TTS), tomato firmness, colour, physiological weight loss (PWL) and
marketability of tomatoes (star 9037) was investigated by monitoring the storage of green and pink
maturity stage harvested fruit over 28 days under both IAC+EC and ambient conditions with data
collated every seven days. Storage condition, maturity stage at harvesting and the storage period
had significant effect (<0.001) on the overall quality of tomatoes. The tomatoes stored in the
IAC+EC system were 18.9% firmer, maintained 10.5% lower concentration of sugars, increased
the hue angle by 3%, had 6.31% lower PWL and were 24.8% more marketability than tomatoes
stored under ambient conditions. The tomatoes harvested at the green stage were 20.2% firmer,
had 6.6% lower TSS content, increased the hue angle by 4.9%, had a 3.1% lower PWL and were
11.6% more marketable than the pink harvested tomatoes. As the period of storage of tomatoes
increased from zero to 28 days’ firmness decreased from 11.2 N to 4.3 N, TSS content increased
from 4.0 to 4.7%, the hue angle decreased by 27.2%, PWL increased from zero to 10.4% and
marketability decreased to 29.5%. The testing of the IAC+EC shows that the fresh tomato fruit can
be stored under hot and sub-humid environment for an average of 21 days with negligible changes
in weight, color, firmness and rotting as compared to ambient condition. SSF and farmers that will
emerge from land re-distribution in South Africa can adopt the use IAC+EC system for the storage
of fresh tomatoes as this increases the shelf life of tomatoes.

156
5.1 Introduction Tomato is a widely consumed vegetable in the world with a global annual production estimated at
1.60 million metric tonnes (Tigist et al., 2011; Bergougnox, 2014). In South Africa, the tomato is
the second most important vegetable after potatoes grown by both small and large-scale farmers
with a gross income of over USD 210 million (Directorate Marketing 2013; FAOSTAT 2014).
Limpopo province grows 75% of the total production (DAFF, 2014a, b; Sibomana et al., 2016).
Tomato fruit is climacteric with a short shelf life of 2 to 3 weeks and exhibits high postharvest
losses (PHL) of 20-50% and requires immediate cooling after harvesting to slow the ripening
process and maintain quality (FAOSTAT 2014; Affognon et al., 2015; Wang et al, 2016; Macheka
et al., 2017; Saltveit, 2018). Hence, the selection of the tomato as experimental fruit for this study.
A reduction in PHL is crucial for increasing market participation, improving the welfare of tomato
growers and increasing food availability (DAFF, 2013; Adepoju, 2014; Sibomana et al., 2016).
Appropriate postharvest technologies for fresh tomato fruit that provide optimum conditions of low
temperature of 10 ℃ to 15℃ and high relative humidity (RH) of 85-95% from the time of
harvesting, storage and transportation to the market are indispensable (Tshiala and Olwoch, 2012;
Ait-Oubahou, 2013; Chijioke, 2017; Babaremu et al., 2018).
The quality of fresh tomatoes is determined by considering parameters classified into physical,
chemical, biochemical and sensory properties (Garg and Cheema, 2011; Baldwin et al., 2015). The
physical properties are firmness (Pinheiro et al., 2013; Vinha et al., 2013; Thipe, 2014), skin colour
(Gonçalves et al., 2007) and physiological moisture loss (Shahnawaz et al., 2012). The main
chemical properties are total soluble solids (Beckles, 2012), citric acid and pH (Babitha and
Kiranmayi, 2010). The sensory properties of tomatoes include flavour and marketability (Beckles,
2012; Haile, 2018). The balance of sugar content and acidity influences the flavour of tomatoes
(Garcia and Barrett, 2006). TSS are a measure for tomato quality (Anthon et al., 2011). The TSS
is a refractometric index that indicates the percentage proportion of dissolved solids in a solution
expressed as oBrix (Abd Allah et al., 2011; Anthon et al., 2011; Saad et al., 2016). TSS (ºBrix) are
one of physical and chemical parameters used as an index of determining tomato ripening. The
colour of the tomato is the first external characteristic that determines both consumer acceptance

157
and ripeness (Goncalves et al., 2007; Pinheiro et al., 2015). The determination of skin colour of
produce assists in determining the maturity stage of produce immediately after harvest.
Modern day cooling systems like mechanical refrigeration, hydro-cooling and vacuum cooling
delay or halt the deterioration in F&V qualities of colour, firmness, soluble sugar content and pH
(Brosnan and Sun, 2001; Wang and Sun, 2001; Zheng and Sun, 2006; James et al., 2009). However,
modern cooling technologies require high throughput operations and besides have high installation
and maintenance costs and high energy input normally from the grid which SSF in most remote
areas in SSA have no access to (Cecelski, 2000; Kim and Ferreira, 2008; Ejeta, 2009; Katundu et
al., 2010; Rayaguru et al., 2010; Ndukwu and Manuwa, 2014; Wills and Golding, 2016).
Evaporative cooling (EC) has a potential of adoption by SSF because of low, initial investment
requirements, installation and maintenance costs, and energy requirements (Kitinoja and
Thompson, 2010; Tigist et al., 2011; Fernandes et al., 2018). Most of the research in EC in the
developed countries has focused on cooling buildings as opposed to cooling fresh agricultural
produce (Ndukwu et al., 2013; Deoraj et al., 2015). The evaporative cooling systems studied so far in
sub-Saharan Africa (SSA) for preservation of F&V are prototypes with low storage capacity. A lot of this
work has been having been limited to west and east Africa; the technology might not perform accordingly
if extended southern Africa as alluded by Thipe et al. (2017). EC works best in hot and dry conditions as it
relies on removal of sensible heat and for it to be extended to hot and humid regions will require that the air
be indirectly cooled by incorporation of desiccation medium before evaporative cooling (Misra and Ghosh,
2018). Use of indirect air-cooling combined with evaporative cooling (IAC+EC) in for provision of cool
environment for storage of fresh produce is undocumented and a new research focus (Manaf et al., 2018).
Use of IAC+EC would require an indirect heat exchanger, water pump for water circulation, fans to blow
the ambient air into the system and this requires energy that can be supplied by solar (Ndukwu et
al., 2013; Rahiel et al., 2018). An investigation into the efficacy of IAC+EC on the ability to
maintain quality or extend shelf life of tomatoes is required as recommended by Ogbuagu et al.
(2017). The performance of the IAC+EC is putting to test the recommendations of Amer et al.
(2015); Deoraj et al. (2015); Ogbuagu et al. (2017) and Misra and Ghosh (2018) who realised the
potential of the system. This study seeks to provide performance data on the efficacy of solar-
powered IAC+EC for preservation of F&V quality under hot and humid conditions. Therefore, the
objective of this study was to determine the quality and shelf life extension of tomatoes through

158
evaluation of changes in physical, chemical changes and sensory qualities of tomato variety
harvested at two maturity stages and stored under a IAC+EC and ambient conditions.
5.2 Materials and Methods
5.2.1 Design Information and Specifications The design of the IAC+EC provided the optimum storage temperature and RH for the tomato fruit
for KwaZulu Natal province. Ambient air conditions limited the lowest temperature attained in the
IAC+EC as it can only cool to the wet bulb temperature of the ambient air temperature (ASHRAE
Handbook, 2004). The IAC+EC had to be able to maintain the temperature inside the storage
chamber at the wet bulb temperature of the prevailing ambient air conditions and maintain the RH
in the storage chamber at 80 - 95%.
5.2.2 Description of IAC+EC system The IAC+EC consisted of a storage chamber, indirect heat exchanger, multiple charcoal cooling
pads, buried water tank, a pump and two fans and Figure 5.1 shows a schematic diagram of the
system. The evaporative cooler storage chamber had white double-jacket walls and roof of 1 mm
zintec (mild steel) on the outside and on the inside and a floor of concrete mortar. The inner
dimensions of the unit were 2 340 mm high x 5 880 mm long x 3 880 mm wide to hold a capacity
of 3.8 tonnes. The cooler had a 60mm zinc wall thickness with 58 mm polyurethane insulation in
between the zintec layers. The door for access into the storage chamber was made of the same
material as the rest of the storage chamber. It had the same height as the storage chamber with a
thickness of 900 mm and thickness of 60 mm. The indirect heat exchanger was included for
sensible cooling of the air before coming into contact with water as it passes through the pads for
adiabatic cooling. The material selected for cooling pad was charcoal and the pads were vertically
mounted. Six exhaust vents opposite the inlet, three at the bottom and three at the top, provided
for air outlet from the system into the atmosphere. The water continuously pumped from an
underground storage using a 0.26 kW Pedrollo PVm 55 centrifugal pump placed at the surface.
The water circulated throughout the cooling system (through the heat exchanger and sprinkled
water on the EC pads) and a return valve released it back to the storage tank.

159
Figure 5.1 Schematic diagram of the evaporative cooling unit
A 0.29 kW (308,7/6-6/P3HL/25/PA) drove air into the storage chamber at an airflow rate of 0,278
m³. s-1 and air velocity of 3.6 m. s-1. Connected to a SPV system consisting of a 145 VDC (60 A)
charge controller, 5 kW (60 A) inverter, 12 x 230 AH batteries recharged by 9 x 330 W solar panels
were water pump, fans and 1,8 kW indirect heat exchanger.
5.2.3 Performance Assessment Evaluation of the cooler performance through determination of physical and chemical properties
and marketability of the tomatoes in storage over a 28-day period was undertaken. The warm and
dry season is the period when cooling intervention are most useful and experiments were therefore
done during this time. For the fullest advantage of harnessing the IAC+EC effect, the cooler was
located in an area with good ventilation. The experimental procedures focused on the IAC+EC
performance within 7 days’ cycle period over a 28-days duration. Investigations of patterns of
tomato quality changes in both the storage chamber and under ambient conditions were undertaken.
The shelf lives and quality attributes of the tomato fruit i.e. firmness; physiological weight loss and
colour were evaluated between the fruit stored in the IAC+EC storage chamber against ambient
conditions.

160
5.2.4 Sample Preparation Tomato Star 9037 cultivar was harvested into plastic crates at physiologically matured and ripen
stage with half at green and the other at pink mature stage from a nearby farm in PMB. Harvesting
of the tomatoes was done early in morning before 10h00 and the tomatoes were immediately loaded
in a vehicle and transported to Ukulinga research station located 31 km away (29.67° S and 30.40°
E, at an altitude of 721). The tomatoes were visual inspected to discard those with bruises and signs
of infection from the fruit used as samples (Getinet et al., 2011; Saad et al., 2016). Selection of
tomatoes which were uniform, unblemished, having similar size and colour was done and these
were washed under a running tap to remove any dirt or soil particles and to reduce microbial
population on the surface (Nath et al., 2012). After washing, the tomatoes were surface dried with
a soft clean cloth, which was free from contaminating materials and then the fruit was subdivided
into plastic crates. The crates were then stored under room temperature in food processing
laboratory and under IAC+EC conditions in the storage chamber in three replications. The crates
were stacked on a 200 mm stand to prevent any transfer of desease from the ground to the tomatoes
(FAO, 2011). A sample from each treatment and replication was analyzed periodical for physical
and chemical properties, and sensory qualities as summarized in the Table 5.1.
Table 5.1 Summarised produce quality attributes that were measured
Quality attributes Reference
Physical properties Texture or firmness Kassim et al. (2013)
Colour Batu, 2004; Kassim et al. (2013)
Chemical
properties
Physiological weight loss Workneh et al. (2009); Kassim (2013)
Total soluble solids Beckles (2012)
Sensory qualities Percentage marketability Nath et al. (2012)
5.2.5 Research Methodology The experimental design used in the study consisted of a factorial combination of one tomato
variety, two storage conditions (IAC+EC storage chamber and ambient), two maturity stages at
harvesting (green-breaker stage and pink). Figure 5.2 shows the experimental design. Each storage
condition-maturity stage was replicated three times (three crates). In each replica, 25 tomatoes were

161
marked and five were selected for physical and chemical measurements over five-storage periods
of day0, day7, day14, day21 and day28.
Figure 5.2 Experimental design
A total of 150 kg (12.5 kg of tomatoes per crate x 12 crates) of tomatoes were prepared for storage
under IAC combined three-layer charcoal granules pads EC conditions and ambient conditions.
The 150 kg tomatoes consisted of 75 kg of pink colour stage and 75 kg green colour stage harvested
fruits. Each one of the two-maturity stage harvested tomatoes of 75 kg were subdivided into two
lots of 37.5 kg (12.5 kg of three replications of each storage condition and maturity stage at
harvesting) in preparation for storage IAC+EC and ambient conditions. Assessment of five
sampled tomatoes for quality attributes of physical properties (firmness and colour), chemical
properties (physiological weight loss and TSS) and marketability on days 0, 7, 14, 21 and 28 of
storage was undertaken.
Tom
ato
Varie
ty
Ambient
Green
Rep 1
Rep 2
Rep 3
Pink
Rep 1
Rep 2
Rep 3
Cold Storage
Green
Rep 1
Rep 2
Rep 3
Pink
Rep 1
Rep 2
Rep 3

162
5.2.6 Physical Properties
5.2.6.1 Firmness (Puncture force) In fruit and vegetables, firmness can be defined as the resistance to puncture, which is a mechanical
property of the fruit according to Singh and Reddy (2006). The texture characteristics of tomato
fruit in terms of firmness was determined through puncturing the surface using an Instron Universal
Testing Machine (Model 3345) in combination with the Instron Bluehill 2 Version 2.25 software
as described by Sirisomboon et al. (2012). A probe of diameter 2 mm punched tomatoes mounted
horizontal on a curved platform (to ensure stability during the compression test). The probe
attached to a load cell drove into the tomato at a crosshead speed of 3 mm.s-1 to travel to a depth
of 7.5 mm according to the procedure used by Tolesa and Workneh (2017). The maximum force
required to puncture the fruit is the exterior fruit firmness as described by Aguilar-Mendez et al.
(2008).
5.2.6.2 Colour Changes in colour are a criterion for quality determination and are associated with chlorophyll
degradation and biosynthesis of lycopene (Nino-Medina et al., 2013). The tomato colour indicators
were determined, using a digital CR-400 Chroma meter during the storage period. The CR-400 and
estimated Hunter value L, a and b where according to Nath et al. (2012), ‘a’ (‘+’ value indicated
redness and ‘−’ value indicated greenness), ‘b’ (‘+’ value indicated yellowness and ‘−’ value
indicated blueness) and ‘L’ (varies from 0 to 100 where ‘100’ indicated white and ‘0’ indicated
black). The chromo meter was calibrated with a white paper before measurements were taken at
day0, day7, day14, day21 and day28. Each sampled tomato was measured for L*, a* and b* at
three equatorial positions (blossom end, stem-end and mid-way), which were averaged to
determine the overall values for L*, a* and b* using the procedure by Cherono et al. (2018). The
changes in the colour of tomatoes were measured in terms of the L* value and the hue angle (h°),
as these are important quality parameters used as a measure for market value of produce. Using a*
and b*, the hue angle (ho) for each tomato fruit was calculated from the equation (Saad et al., 2016)
𝐴𝐴𝐴𝐴𝐷𝐷 𝑙𝑙𝑛𝑛𝑘𝑘𝑙𝑙𝐷𝐷 = 𝐴𝐴𝑙𝑙𝑛𝑛−1 �𝑏𝑏𝑎𝑎� (5.2)

163
5.2.7 Chemical Properties
5.2.7.1 Physiological weight loss PWL is one method amongst others that determines the quality of stored tomatoes (Islam and
Morimoto, 2016). Weighed five samples of the stored tomatoes from each treatment using a scale
(Teraoka, DIGI SM 300) at the start of the experiment and on seven-day intervals at days 7, 14, 21
and 28. PWL was calculated as cumulative percentage weight loss based on the initial tomato
sample weight (before storage) and loss in weight recorded at the time of sampling at 7, 14, 21 and
28 days during storage (Nath et al., 2012; Caron et al., 2013). The following formula used by Islam
and Morimoto (2016) computed the percentage differential weight loss for each sample per each
interval as percentage weight loss of the initial weight.
%Weight loss = Weight(t=0)−Weight(t=t)
Weight(t=0)x100 (5.3)
Where 𝑊𝑊𝐷𝐷𝐷𝐷𝑘𝑘ℎ𝐴𝐴(𝑡𝑡=0)= average weight of sample at the start of experiment /interval and 𝑊𝑊𝐷𝐷𝐷𝐷𝑘𝑘ℎ𝐴𝐴(𝑡𝑡=𝑡𝑡)= average weight of the same sample of produce at t = t
The percentage cumulative weight loss was determined by summing the respective physiological
weight losses (Getinet et al., 2008; Awole et al., 2011).
5.2.7.2 Total Soluble Solids After harvesting and during storage, the tomato fruit continues to ripen. During the ripening
process, stored starch in the fruit transforms to sugars. As the ripening process, progresses further
the sugar levels in the fruit increases (Ross et al., 2010). Cleaning, cutting into smaller slices using
a knife and crushing (using a blender) each sample tomato from each treatment produced a blended
and homogenized tomato puree (Ranganna, 1995). A clean cloth then sieved the puree into a small
container and the puree was used for estimation of TSS. The TSS were determined using an RFM
340+ digital refractometer (± 0.1% Brix) by placing a few drops of the puree on the prism (Getinet
et al., 2008; Maftoonazad and Ramaswamy, 2008). TSS measurements were taken at day0, day7,
day14, day21 and day28. Between samples, the prism was cleaned with distilled water using a soft
clean cloth according to Saad et al. (2016)
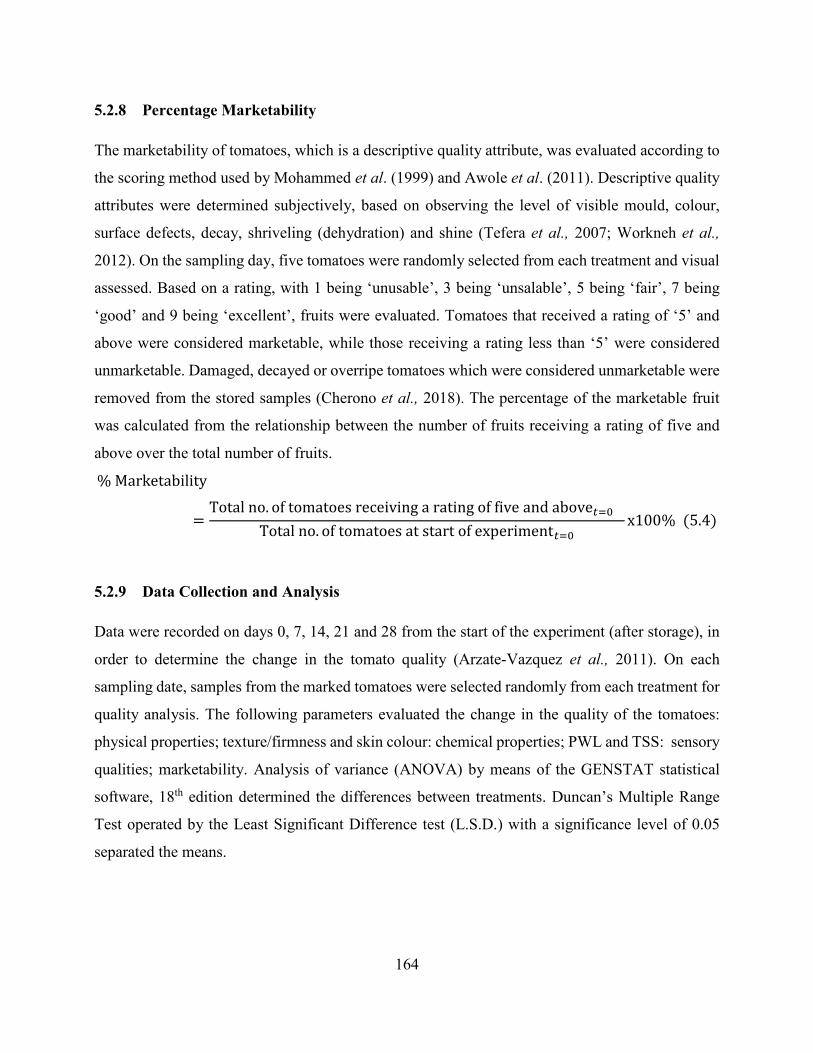
164
5.2.8 Percentage Marketability The marketability of tomatoes, which is a descriptive quality attribute, was evaluated according to
the scoring method used by Mohammed et al. (1999) and Awole et al. (2011). Descriptive quality
attributes were determined subjectively, based on observing the level of visible mould, colour,
surface defects, decay, shriveling (dehydration) and shine (Tefera et al., 2007; Workneh et al.,
2012). On the sampling day, five tomatoes were randomly selected from each treatment and visual
assessed. Based on a rating, with 1 being ‘unusable’, 3 being ‘unsalable’, 5 being ‘fair’, 7 being
‘good’ and 9 being ‘excellent’, fruits were evaluated. Tomatoes that received a rating of ‘5’ and
above were considered marketable, while those receiving a rating less than ‘5’ were considered
unmarketable. Damaged, decayed or overripe tomatoes which were considered unmarketable were
removed from the stored samples (Cherono et al., 2018). The percentage of the marketable fruit
was calculated from the relationship between the number of fruits receiving a rating of five and
above over the total number of fruits.
% Marketability
=Total no. of tomatoes receiving a rating of five and above𝑡𝑡=0
Total no. of tomatoes at start of experiment𝑡𝑡=0x100% (5.4)
5.2.9 Data Collection and Analysis Data were recorded on days 0, 7, 14, 21 and 28 from the start of the experiment (after storage), in
order to determine the change in the tomato quality (Arzate-Vazquez et al., 2011). On each
sampling date, samples from the marked tomatoes were selected randomly from each treatment for
quality analysis. The following parameters evaluated the change in the quality of the tomatoes:
physical properties; texture/firmness and skin colour: chemical properties; PWL and TSS: sensory
qualities; marketability. Analysis of variance (ANOVA) by means of the GENSTAT statistical
software, 18th edition determined the differences between treatments. Duncan’s Multiple Range
Test operated by the Least Significant Difference test (L.S.D.) with a significance level of 0.05
separated the means.

165
5.3 Results and Discussions
5.3.1 Tomato Firmness Firmness is the ultimate quality index influencing consumers’ in decision making at the time of
selection of tomatoes to purchase or not (Thipe, 2014; Salveit, 2018). For tomatoes in transit or
under storage, the increase in temperature may lead to the loss of firmness due to the activation of
enzymes responsible for cell wall degradation (Tolesa and Workneh, 2017). Hence, the control of
temperature during storage of fresh produce is very important. The firmness of tomatoes is
determined by using a deformation test (Batu, 2004). The effects of storage conditions, maturity
stage at harvesting and storage period on the firmness of the tomatoes were significant (P<0.001)
as shown in Figure 5.3.
Figure 5.3. Tomato firmness under ambient conditions and IAC+EC
The tomatoes stored in the IAC+EC storage chamber were 18.9% more resistant to puncture, with
8.84 N, compared to those stored under ambient conditions with 7.17 N, which are averages over
the 28-day period. A firmness value of greater than 8.46 N mm.-1 indicates that tomatoes are very
firm and suitable for supermarket shelves (Batu, 2004). The result indicates that IAC+EC kept the
tomato structure intact and firm under the hot and humid conditions, which might contribute to the
0
2
4
6
8
10
12
14
0 7 14 21 28
Tom
ato
Firm
nes (
N)
Storage Period (Days)
amb-green amb-pink EC-green EC-pink
CV = 3.6%LSD(0.05) = 1.45

166
preservation of F&V quality leading to an extended shelf life and this agrees with findings of Zakari
et al. (2016) using EC under dry and arid conditions. Higher ambient temperatures and lower RH
encourage increased tomato physiological activity resulting loss of fruit firmness due to the
breakdown of cellulose, pectin and lignin by pectinesterases (PE), polygalacturonase (PG) and β-
galacturose (β-gal) in the cell wall (Tigist et al., 2013). It is based on this background that the use
of IAC+EC performs as effectively as EC in dry and arid conditions for storing fresh tomatoes is
significant and cannot be over emphasized.
Comparison of the firmness between the two harvesting maturity stages showed that the overall
average firmness for the green-harvested tomatoes was 20.2% higher, with 8.74 N, than that of
pink-harvested, which had an overall average of 7.27 N. The reduced firmness in pink harvested
tomatoes is attributable to a physiological breakdown of the fruit cell wall as the fruit ripened from
green to pink (Viskelis et al., 2008). The average firmness of tomatoes decreased significantly with
storage period from 11.16 N-day0, 9.76 N-day7, 7.81 N-day14, 7.03 N-day21 and 4.28 N-day28.
The decline over the 28-day period is 61.6%. The longer the storage period, the longer enzymatic
activity continues causing more tissue softening and affecting firmness (Pinheiro et al., 2013).
Tolesa and Workneh (2017) obtained a similar pattern in their study where they observed a decline
in tomato firmness over storage period. The decrease in firmness is attributable to physiological
deterioration in tomato as the fruit continues to transpire, respire and further ripen (Ngcobo et al.,
2012; Salveit, 2018). By day 21, the firmness of green-harvested tomatoes stored under IAC+EC
was 8.86 N. The maturity stage at harvesting affects the firmness of the tomato fruit (Vinha et al.,
2013).
There were significant effects due to the interaction of storage conditions × harvesting maturity
stage (P<0.05), storage conditions × storage period (P<0.001) and maturity stage x storage period
(P<0.005) on the firmness of tomatoes as shown in Figure 5.4 and Figure 5.5. From Figure 5.4
tomatoes stored under IAC+EC maintained firmness for long periods than sampled tomatoes stored
under ambient conditions. By day14, sampled tomatoes under ambient conditions had a firmness
6.32 N a value lower than 8.46 N, which is the recommended firmness for tomatoes suitable for
supermarket shelves (Batu, 2004). By day21 tomatoes, stored IAC+EC had a firmness of 8.45 N a
value almost equal the firmness for tomatoes suitable for supermarket shelves.

167
Figure 5.4. Storage condition x storage period
From Figure 5.5 the green harvested tomatoes were firmer than the pink harvested tomatoes over
the storage period. By day 21 green harvested tomatoes had a firmness of 8.86 N which was higher
than 7.38 N for pink harvested tomatoes at day14.
Figure 5.5. Maturity stage x storage period
0
2
4
6
8
10
12
0 7 14 21 28
Frui
t Firm
ness
(N)
Storage period (days)
ambient cooler
CV = 3.6%LSD(0.05) = 0.65
0
2
4
6
8
10
12
14
0 7 14 21 28
Frui
t Firm
ness
(N)
Storage period (days
green pink
CV = 3.6%LSD(0.05) = 1.03

168
The green stage harvested tomatoes when subjected to IAC+EC conditions gave the highest
average firmness of 9.82 N followed by the pink harvested tomatoes with a breaking force of 7.86
N while the green and pink harvested fruits under ambient conditions had 7.66 N and 6.68 N
breaking force respectively. The indication from the results is that storage of less mature tomatoes
under IAC+EC provides firmer tomatoes over the storage period compared to all other
combinations. A lower firmness of tomatoes regardless of stage of maturity at harvesting is
indicating a weaker flesh skin often associated with ripe and soft fruit resultant of physiological
deteriorations because of more rapid metabolism as confirmed by Sirisomboon et al. (2012).
The combinations of storage condition x storage period and maturity stage x storage period show
green breaker stage tomatoes stored under IAC+EC conditions retained firmness (above 8.76 N)
for an extended period of 21 days while the pink harvested retained firmness up to 14 days.
According to Batu (2004), a firmness of 8.76 N is the minimum firmness requirement for very
marketable fruit in supermarkets. Tomatoes in cold storage maintained higher firmness over the
storage period than ambient air stored tomatoes.
5.3.2 Colour Table 5.2 shows that both the h° and L* value was significantly (P≤0.05) influenced by storage
condition, maturity stage at harvesting and the storage period. The tomatoes stored in the IAC+EC
storage chamber had an overall 1% higher L* value and 3% higher h° value for the 28 days of
storage, compared to those stored under ambient conditions. The h° and L* values decreased
progressively over the period of storage from 76.61% at day0 to 49.45% at day28 and 53.47% at
day0 to 35.36% at day28 respectively and the minimum values were reached on the last day of
observation. A decrease in both h° and L* values with storage period indicates progression of
colour change from green or pink to red as the fruit ripens. Cherono et al. (2018) had similar
observation of colour changes with storage time. There are three colour changes of tomatoes during
various stages of development, namely a green colour (chlorophyll), an orange colour (β-carotene)
and a red colour (lycopene) according to Pinheiro et al. (2013). As a tomato ripens, there is colour
change from green to white through chlorophyll degradation, then white to red by carotenoid
biosynthesis (Hahn, 2002).

169
Table 5.2. Changes in L values and hue angle of tomatoes subjected to treatments of storage conditions,
maturity stages and storage period.
L values
Treatment Day0 Day7 Day14 Day21 Day28
Green, ambient 57.49k 46.16h 41.52fg 39.16cdef 34.12a
Pink, ambient 49.95j 45.16h 41.38 dfg 37.95bc 35.12a
Green, cooler 57.08k 46.71h 47.13hi 38.96cde 36.12ab
Pink, cooler 49.35ij 46.77h 42.47g 38.95cd 36.07ab
Significance level
Storage (A) <0.05
Maturity (B) <0.001
Day (C) <0.001
A x B NS
A x C <0.05
B x C <0.001
A x B x C <0.05
LSD0.05 = 1.168, CV (%) = 4.2, SE = 0.812
H values
Treatment Day0 Day7 Day14 Day21 Day28
Green, ambient 84.68d 56.31abc 51.55a 52.91a 48.31a
Pink, ambient 69.33c 53.83a 53.74a 52.14a 49.43a
Green, cooler 84.78d 58.10abc 68.53bc 55.73ab 50.43a
Pink, cooler 67.64bc 59.35abc 53.13a 54.38a 49.64a
Significance level
Storage (A) <0.05
Maturity (B) <0.001
Day (C) <0.001
A x B NS
A x C NS

170
B x C <0.001
A x B x C <0.05
LSD0.05 = 6.803, CV (%) = 9.2, SE = 3.416
The lowest values coincide with time when the tomatoes have attained a deep red colour. Saltveit
(2003) and Zakari et al. (2016) on their work on EC made similar observations. The average L
values over the 28 days of observation for green tomatoes was 44.44% and 42.36% for pink
tomatoes while the average h° values were 61.13% and 56.26% respectively.
The interactions of maturity stage × period of storage had significant (P<0.05) effects on the h°
and the L* values of the tomatoes over the 28-day storage period. Further, the two-way interaction
of storage conditions × period of storage significantly (P<0.05) influenced the changes in the L
values of sampled tomatoes. The 3-way interaction of storage conditions x maturity stage x period
of storage had a significant (P<0.05) effect on the values of h° and the L* of the sampled tomatoes
under IAC+EC (Table 5.2). The green harvested tomatoes had the highest values of h° and the L*
when storage in the IAC+EC storage chamber when observed over the period of storage. Therefore,
the combination of green harvested tomatoes and IAC+EC environment is ideal for maintaining
quality of tomatoes under sub-humid conditions an observation also made by Tolesa and Workneh
(2017). Therefore, storage temperature, variety, storage period and maturity stage at harvesting
factors influence the skin colour of fresh produce as alluded to by Baltazar et al. (2008).
5.3.3 Total Soluble Solids Content Table 5.3 presents the TSS of green and pink harvested tomatoes subjected to either ambient
conditions or IAC+EC storage conditions over 28 days. The storage conditions, the stage of
maturity at harvesting and the storage period significantly (P≤0.001) had an influence the TSS. A
general increasing trend in the TSS was observed but was most evident at ambient conditions,
compared to the IAC+EC storage conditions. The tomatoes stored in the IAC+EC storage chamber
had on average TSS values of 4.10 compared to 4.58 for ambient conditions while on average green
harvested and pink harvested tomatoes had TSS values of 4.19 and 4.49 over the storage period.

171
Lower TSS values imply a lower concentration of sugar. Similar findings were observed by Tefera
et al. (2007) and Maftoonazad and Ramaswamy (2008) on the storage of mangoes.
Table 5.3. Changes in TSS (%) of tomatoes subjected to treatments of storage conditions, two
maturity stages and storage period.
Total Soluble Solids (%)
Treatment Day0 Day7 Day14 Day21 Day28
Green, ambient 3.848ab 4.446bcdef 4.472cdef 4.538def 4.980fg
Pink, ambient 4.194abcd 4.604def 4.610def 4.816efg 5.294g
Green, cooler 3.832a 4.068abcd 4.140abcd 4.162abcd 4.402cde
Pink, cooler 4.174abcd 4.336abcde 4.368abcde 4.421cdef 4.564def
Significance level
Storage (A) <0.001
Maturity (B) <0.001
Day (C) <0.001
A x B NS
A x C <0.05
B x C NS
A x B x C NS
LSD0.05 = 0.0.163, CV (%) = 1.9, SE = 0.135
• The means separation was carried out by the Duncan’s multiple range test (p<0.05) and the
column means with similar superscripted letter(s) are not significantly different.
• A-storage environments; B-maturity stages; C-days of storage.
ºBrix tends to increase as the ripening proceeds (Sammi and Masud, 2007). At low temperature
and high RH storage conditions, the rate of increase was slower, compared to storage at ambient
conditions. The increased temperature and reduced RH at ambient conditions is attributed to

172
the increased hydrolysis of carbohydrates stored within the tomatoes into soluble sugars. This,
therefore, resulted in a higher TSS content and a reduced tomato shelf life, which is undesirable.
Figure 5.6. Percentage total soluble solids of green and pink harvested tomatoes.
The two-way interactions between storage conditions and storage period significantly (P≤0.05)
influenced the TSS accumulation (Figure 5.6). The tomatoes that were stored in the IAC+EC
storage chamber regardless of maturity stage at harvest had lower TSS than those stored under
ambient conditions. This agrees with Young et al. (1993) that concluded changes that occur in
sugar content during the development of tomato fruit increases progressively throughout the
storage period as the fruit matures and ripens associated with the first appearance of yellow pigment
in the walls of the fruit at the breaker stage through to red.
Soluble solids determine the sweetness of tomatoes, but there are other compounds responsible for
flavour characteristics, such as acids and volatiles (Bumgarner and Kleinhenz, 2012). When
tomatoes mature, the sugar levels increase, due to the metabolism of stored carbohydrates, lipids
and proteins (Garcia and Barrett, 2006). At a later stage, these sugars are utilised for maintenance
during growth, thus resulting in senescence (Beckles, 2012). TSS are a good index for the quality
control of tomatoes. It is therefore very critical that for adoption postharvest cooling technologies,
0
1
2
3
4
5
6
0 7 14 21 28
Tota
l sol
uble
solid
s (%
)
Days of storage
ambient cooler
CV=1.9% LSD(0.05)=0.37

173
such as IAC+EC to slow down respiration and ethylene production and to thus retard ripening and
senescence.
5.3.4 Physiological Weight Loss The large proportion of water tomatoes contain, which constitutes up to 90% of the fresh weight
largely influences the fruit size (Babitha and Kiranmayi, 2010; Zakari et al., 2016). The perishable
nature of tomatoes is a function of this large amount of water (Shahnawaz et al., 2012). The
physiological moisture loss varies and is dependent on the magnitude of the surrounding air-
temperature and RH (Workneh and Osthoff, 2010). High temperature and low RH induce high
respiration rate, which is the main cause of PWL (loss in saleable weight) and wilting (Mhina and
Lyimo, 2013; Arah et al., 2015; Jedermann et al., 2017). The PWL of tomatoes harvested at the
green-breaker stage and pink maturity stages, subjected to storage conditions of either IAC+EC or
ambient conditions, and stored over 28 days are here presented. During the period of observation,
the storage conditions, the maturity stage and the storage period were found to be highly significant
(P≤0.001) with regard to the tomato PWL (Figure 5.7). The highest PWL was found in tomatoes
stored under ambient conditions (9.5%) due to the considerably higher temperatures (± 26℃) and
lower RH (< 60%), compared to the IAC+EC storage conditions (3.2%) over the 28 days storage
period. Pink harvested tomatoes exhibited a higher PWL (7.9%) compared to green harvested
tomatoes (4.8%) over the 28-day storage period. Sampled tomatoes stored under ambient
conditions had PWL of 9.4% by day7 and 14.5% by day28 compared to 2.2% and 6.4% for
IAC+EC for the same period. These conditions induced a larger vapour pressure deficit between
the fruit and the surrounding external environment, as a result creating a driving force for moisture
loss from the fruit (Getinet et al., 2008; Thompson et al., 2018). The rate at which the moisture
was lost by the tomatoes under ambient conditions occurred at a faster rate than under IAC+EC
consequently contributing to a higher increase in the PWL. These findings are consistent with
reported observations by Islam and Morimoto (2016).
PWL increased progressively over the period of storage and the highest values were reached on the
last day of observation. There was continuous loss of moisture over time due to transpiration from
the tomatoes and respiration under ambient conditions. This is the reason was PWL increased with
storage period as the tomato fruit continues to ripen. The PWL was more pronounced under

174
ambient conditions implying that senescence may occur earlier and, therefore, result in a shorter
shelf life. Cherono et al. (2018) in their research study had similar observations. Therefore, the use
of IAC+EC system for preserving and improving the shelf life of tomatoes cannot be avoided.
Figure 5.7. Physiological weight loss during storage period
FAO (1989) and Zakari et al. (2016) reported that water constitutes a large portion of most F&V
and when lost from fresh produce translates to reduction in weight results in wilting and less
marketability; hence, it is important to maintain the weight of fresh tomatoes to maximize profit.
The two-way interactions between (a) storage condition x maturity stage (b) storage condition x
storage period and (c) maturity stage x storage period was found to be significant at P≤0.001. Green
harvested tomatoes stored under IAC+EC conditions resulted in the lower PWL of 2.59%
compared to pink under ambient at 11.79%. The variations are attributable to lower physiological
activity in green tomatoes and the vital role of lower temperature under IAC+EC conditions that
reduce rate of moisture loss and the amount of PWL in the tomatoes. The delay in harvesting of
tomatoes may increase their susceptibility of decay and PWL as alluded to by Adewoyin (2017).
The PWL increased progressively with storage period for tomatoes stored under ambient
0
2
4
6
8
10
12
14
16
18
7 14 21 28
Cum
ulat
ive
Wei
ght L
oss (
%)
Storage period (days)
amb-green amb-pink EC-green EC-pink
CV=8.3% LSD (0.05) =1.33

175
conditions and IAC+EC conditions and at the same increased progressively for tomatoes harvested
either at the green-breaker stage or at pink stage.
The three-way interaction between storage conditions x stage of maturity x storage period were
found to have a significant (P≤0.05) effect on the tomato PWL. Pink tomatoes stored under ambient
had a PWL of 12.45% over a 7 day-storage period while the green-breaker stage harvested tomatoes
had a PWL of 13.86% by day14 of storage. The green-breaker stage and pink harvested tomatoes
subjected to the IAC+EC conditions had a PWL of 3.61% and 4.97% respectively by day21 of
storage. This implies that by day21 the tomatoes under IAC+EC had not lost freshness and had no
wilting appearance as such characteristics only exhibit after 5% PWL according to Sondi and
Salopek-Sondi (2004). The PWL of green harvested tomatoes and stored in the IAC+EC storage
chamber was 4.99% by day-28, exhibiting the lowest decrease. The green harvested and pink
harvested tomatoes stored under IAC+EC stored over 28 days had a PWL below 8%, which in
within the region that sustain good quality of tomatoes. According to Getinet et al. (2008), a 10%
PWL corresponds to the threshold level for the termination of shelf life of fresh produce.
The results obtained mean that the rate at which the moisture was lost by the tomatoes occurred at
a faster rate, when the fruit was subjected to ambient storage conditions and thus translating to an
increase in the PWL. The implications are that senescence may occur earlier resulting in a shorter
shelf life for both stages of tomato maturity. The physiological moisture loss from tomatoes varies
and is dependent on the magnitude of the surrounding air-temperature and RH. High temperature
and low RH induce high respiration rate, which is the main cause of PWL (loss in saleable weight)
and wilting. The physiological nature of tomato that includes high moisture content, high
respiration rate, and soft texture make it more vulnerable to post harvest qualitative changes and
losses and therefore requires storage facility systems like IAC+EC. The IAC+EC conditions
provide a low temperature-high RH environment that inactivated the enzymes responsible for the
ripening process.
5.3.5 Marketability Visual signs in fresh fruit are the first quality attributes that consumers consider when making
decisions to buy and these largely influence marketability (USDA, 2011; Siddiqui et al., 2015).

176
The storage conditions, maturity stage at harvesting and the storage period significantly (P≤0.001)
influenced the marketability (Figure 5.8).
Figure 5.8. Percentage marketability of tomatoes during storage period
The percentage of marketability of tomatoes was at 100% on Day 0 and decreased with storage
period for all treatments. Tomatoes stored in the IAC+EC storage chamber had on average a higher
percentage marketability (70.38%) than those under ambient conditions (48.61%). Furthermore,
green stage of maturity harvested tomatoes had a higher marketability of 38.4% by day28 compared
pink harvested tomatoes of 20.6%. The higher percentage of marketability of tomatoes under
IAC+EC is attributable to the low temperature storage conditions of the storage chamber, which
resulted in lower moisture losses. The results are in conformity with the work done by Getinet et
al. (2008) and Awole et al. (2011) and Rahman et al. (2016) for results obtained on strawberries.
Higher ambient temperatures translate to higher moisture loss in fresh produce causing loss of
marketable weight and inadvertently affecting appearance (wilting and shriveling) resulting in less
marketability. As moisture is lost, the textural quality of tomatoes reduces thereby enhancing
softening, loss of crispness and juiciness, and reduction in nutritional quality.
Marketability drastically decreased at ambient conditions from 100% to 42.9% by day14 and could
have decreased further if there were more days with high temperatures during the period of
0102030405060708090
100
0 7 14 21 28
Perc
enta
ge m
arke
tabi
lity
of fr
uits
Storage period (days)
amb-green amb-pink EC-green EC-pink
CV = 8.3%LSD (0.05) = 0.94

177
observation. The sharp decline in marketability is because of excessive softening and shriveling
caused by moisture loss, which is one of the factors leading to the PWL. Several tomatoes subjected
to ambient conditions by day21 experienced decay, shriveling and extreme softness and were
discarded while those still in good condition were retained to be observed again in day28. Under
IAC+EC, the green harvested tomatoes were at 63.5% and 57.5% marketability at day21 and day28
while for pink harvested tomatoes there was a sharp decline from 50.1% marketability at day21 to
28.1% at day28. Therefore, IAC+EC preserved the organoleptic properties of the tomatoes.
5.4 Conclusion This study was undertaken to determine the effects of postharvest storage environment, as well as
tomato maturity stage at harvest and storage period on the postharvest quality of stored tomatoes.
The deductions from the study is that the physical, chemical and subjective sensory quality
parameters of tomatoes are largely dependent on maturity stage at harvest and storage environment
as well as storage period. The storage conditions, stage of tomato fruit harvesting and the storage
period consistently significantly (P>0.001) affected all of the analyzed tomato-fruit quality
parameters. The IAC and EC systems ran at the same time to bring cumulative effect on air
temperature and RH inside the storage chamber compared to ambient conditions. The IAC+EC
system had a positive effect on the quality parameters and this extended the shelf life of tomatoes
compared to samples that were stored under ambient conditions. The unbridled ambient conditions
accelerated the tomato fruit ripening process, which was most evident in the conversion of the skin
colour from green/pink to pink/red and the rapid reduction in firmness. This was more evident for
pink harvested tomatoes, which on average were 20.2% softer, had 6.6% higher concentration of
sugars, 3.1% higher PWL, 4.9% increase in hue angle and were 11.6% less marketable. The rapid
ripening process under ambient conditions resulted in 18.9% reduced firmness, 10.5% increased
TSS, 6.31% increased PWL, 3% reduction in hue angle and 24.8% reduced marketability.
Compared to ambient storage, IAC+EC storage limited the PWL to 8% over 28 days, while ambient
storage took 14 days to get to the same. The IAC+EC system increased shelf life of green-harvested
tomatoes to 28 days with an improved marketability of 57.5% with PWL of 5%. The IAC+EC
system inhibited ethylene production through reduction of enzymatic activities of tomatoes and
thus prolonged shelf life and increasing the quality of fresh produce.

178
The objective of the current study was different from the previous research studies, which focused
on prototype sized EC, since it considered low-cost IAC+EC technology tested on SSF sized, as
well as the maturity stage of the tomato fruit on the quality during the storage period. The findings
of this study showed that all green and pink tomatoes suffered a decrease in firmness and
marketability, increase in PWL, TSS and hue angle, over 28 days. The tomatoes stored in IAC+EC
storage chamber showed a higher firmness and marketability, a decrease in PWL, TSS and hue
angle, when compared to the ambient conditions over the storage period. The green stage harvested
tomatoes stored in the IAC+EC storage conclusively improved the shelf life and marketability of
tomatoes. Therefore, a farmer in hot and humid areas can use a combination of tomatoes harvested
at the green stage and IAC+EC to maintain a better quality of tomatoes and to extend their shelf
life.
The work presented in this chapter is important because there is a scarcity of both quantitative and
qualitative characterization of the performance of low-cost IAC+EC technology for cooling the
microenvironment in the storage in order to maintain the quality of the tomato fruit, which can be
used by small-scale and emerging farmers’ cooperatives. This work has also contributed to
improving the understanding of the effect of low-cost IAC+EC technology on the quality
characteristics of fresh tomato fruit preserved under hot and sub-humid to humid conditions in
Southern Africa. This study characterised the performance of IAC+EC and clearly demonstrated
that the cooling system could maintain the physical, chemical and sensory characteristics of fresh
tomatoes and most tropical and sub-tropical F&V. This study on IAC+EC has shown the
considerable potential towards enhancing the performance and cooling capacity of the system for
preservation of F&V. IAC+EC is therefore, recommended for storage of tropical and sub-tropical
F&V as it can increase their shelf life.

179
5.5 References Abd Allah, EF, Hashem, A and Al-Huqail, A. 2011. Biological-based strategies to reduce
postharvest losses of tomato. African Journal of Biotechnology, 10(32), 6040-6044.
Adepoju, AO. 2014. Post-harvest losses and welfare of tomato farmers in Ogbomosho, Osun state,
Nigeria. Journal of Stored Products and Postharvest Research, 5(2), 8–13.
Adewoyin, OB. 2017. Effects of packaging materials and storage conditions on storability of
pepper (Capsicum frutescens L.) fruits. Journal of Postharvest Technology, 5(4), 62-70.
Affognon, H, Mutungi, C, Saginga, P and Borgmeister, C. 2015. Unpacking postharvest losses in
Sub-Saharan Africa: a meta-analysis. World Development, 66, 49–68.
Ait-Oubahou, A. 2013. Postharvest technologies in sub-Saharan Africa: status, problems and
recommendations for improvements. 1273-1282.
Aguilar-Mendez, MA, Martin-Martinez, ES, Tomas, SA, Cruz-Orea, A and Jaime-Fonseca, MR.
2008. Gelatine-starch films: Physicochemical properties and their application in extending
the post-harvest shelf life of avocado (Persea americana). Journal of the Science of Food
and Agriculture, 88(2), 185-193.
Amer, O, Boukhanouf, R and Ibrahim, HG. 2015. A Review of Evaporative Cooling Technologies.
International Journal of Environmental Science and Development, 6(2), 111-117.
Anthon, GE, LeStrange, M and Barret, DM. 2011. Changes in pH, acids, sugars and other quality
parameters during extended vine holding of ripe processing tomatoes. Journal of Science
Food Agriculture, 91(7), 1175-1181.
Arah, IK, Amaglo, H, Kumah, EK and Ofori, H. 2015. Preharvest and postharvest factors affecting
the quality and shelf life of harvested tomatoes: a mini review. International Journal of
Agronomy, 1-6. http://dx.doi.org/10.1155/2015/478041.
ASHRAE. 2004. Handbook. HVAC Systems and equipment. ASHRAE Inc, Atlanta, USA.
Awole, S, Woldetsadik, K and Workneh, TS. 2011. Yield and storability of green fruits from hot
pepper cultivars (Capsicum spp.). African Journal of Biotechnology, 10(59), 12662-12670.
Arzate-Vazquez, I, Chanona-Pérez, JJ, de Jesus Perea-Flores, M, Calderón-Domínguez, G,
Moreno-Armendáriz, MA, Calvo, H, Godoy-Calderón, S, Quevedo, R and Gutiérrez-

180
López, G. 2011. Image processing applied to classification of avocado variety Hass (Persea
americana Mill.) during the ripening process. Food and Bioprocess Technology, 4(7),
1307-1313.
Babaremu, KO, Omodara, MA, Fayomi, SI, Okokpujie, IP and Oluwafemi, JO. 2018. Design and
Optimization of an Active Evaporative Cooling System. International Journal of
Mechanical Engineering and Technology, 9(10), 1051–1061.
Babitha, B and Kiranmayi. 2010. Effect of Storage Conditions on the Post-Harvest Quality of
Tomato (Lycopersicon esculentum). Research Journal of Agricultural Sciences, 1(4), 409-
411.
Baldwin, EA, Scott, JW and Bai, J. 2015. Sensory and chemical flavor analyses of tomato
genotypes grown in Florida during three different growing seasons in multiple years.
Journal of the American Society for Horticultural Science, 140(5), 490–503.
Baltazar, A, Aranda, JI and González-Aguilar, G. 2008. Bayesian classification of ripening stages
of tomato fruit using acoustic impact and colorimeter sensor data. Computers and
Electronics in Agriculture, 60, 113–121.
Batu, A. 2004. Determination of acceptable firmness and colour values of tomatoes. Journal of
Food Engineering, 61, 471-475.
Beckles, DM. 2012. Factors affecting the postharvest soluble solids and sugar content of tomato
(Solanum lycopersicum L.) fruit. Postharvest Biology and Technology, 63, 129-140.
Bergougnoux, V. 2014. The history of tomato: from domestication to biopharming. Biotechnology
Advances, 32, 170-89.
Brosnan, T and Sun, DW. 2001. Precooling techniques and applications for horticultural products
– a review. International Journal of Refrigeration, 24(2), 154-170
Bumgarner NR and Kleinhenz, MD. 2012. Using oBrix as an indicator of vegetable quality. A
summary of the measurement method. Fact Sheet no. HYG-1652-12 Agriculture and
Natural Resources. Department of Horticulture and Crop Science. The Ohio State
University, Ohio Agricultural Research and Development Centre.
Caron, VC, Tessmer, MA, Mello, SC and Jacomino, AP. 2013. Quality of mini tomatoes harvested
at two maturity stages and kept chilled in three packages. Horticultura Brasileira, 31(2),
279-286. http://dx.doi.org/10.1590/S0102- 05362013000200017.

181
Cecelski, E. 2000. Enabling equitable access to rural electrification: current thinking and major
activities in energy, poverty and gender. Briefing Paper. Alternative Energy Policy and
Project Development Support in Asia: Emphasis on Poverty Alleviation and Women, Asia
Alternative Energy Unit, The World Bank, Washington D.C.
Cherono, K, Sibomana, M and Workneh, TS. 2018. Effect of infield handling conditions and time
to pre-cooling on the shelf-life and quality of tomatoes. Brazilian Journal of Food
Technology. https://doi.org/10.1590/1981-6723.01617. ISSN 1981-6723.
Chijioke, OV. 2017. Review of evaporative cooling systems. Greener Journal of Science,
Engineering and Technological Research, 7(1), 1-20. ISSN: 2276-7835.
DAFF. 2013. Production guidelines for tomato. [Internet]. Directorate on Agricultural Information
Services, Pretoria, South Africa.
DAFF. 2014a. Trends in the agricultural sector. Pretoria: National Department of Agriculture, 52,
49–50.
DAFF. 2014b. Production guidelines for tomato. Pretoria: National Department of Agriculture,
22.
Deoraj, S, Ekwue, EI and Birch, R. 2015. An evaporative cooler for storage of fresh fruits and
vegetables. West Indian Journal of Engineering, 38(1), 86-95.
Directorate Marketing. 2013. A profile of the South African tomato market value chain.
Department of Agriculture, Forestry and Fisheries, Pretoria, South Africa.
Ejeta, G. 2009. Revitalising agricultural research for global food security. Food Security, 1, 391-
401.
FAO. 1989. Prevention of post-harvest food losses fruits, vegetables and root crops a training manual. Training Series, 17(2). Rome: Italy.
FAO. 2011. Packaging in fresh produce supply chains in Southeast Asia. Food and Agriculture Organization of the United Nations Regional Office for Asia and the Pacific Bangkok, 2011. ISBN 978-92-5-106998-1.
FAOSTAT. 2014. Online statistical database of the Food and Agricultural Organisation of the
United Nation [Internet]. Available from: http://faostat.fao.org/. [Accessed 18 June 2017).
Fernandes, L, Saraiva, JA, Pereira, JA, Casal, S and Ramalhosa, E. 2018. Post-harvest technologies
applied to edible flowers: a review. Food Reviews International, doi:
10.1080/87559129.2018.1473422.

182
Garcia, E and Barrett, DM. 2006. Evaluation of processing tomatoes from two consecutive
growing seasons: quality attributes, peelability and yield. Journal of Food Processing and
Preservation, 30(1), 20-36. doi:10.1111/j.1745-4549.2005. 00044.x
Garg, N and Cheema, DS. 2011. Assessment of fruit quality attributes of tomato hybrids involving
ripening mutants under high temperature conditions. Scientia Horticulturae, 131, 29–38
Getinet, H, Workneh, TS and Woldetsadik, K. 2008. The effect of cultivar, maturity and storage
environment on quality of tomatoes. Food Engineering, 87, 467-478
Getinet, H, Workneh, TS and Woldetsadik, K. 2011. Effect of maturity stages, variety and storage
environment on sugar content of tomato stored in multiple pads evaporative cooler. African
Journal of Biotechnology, 10(80), 18481-18492.
Gonçalves, B, Silva, AP, Moutinho-Pereira, J, Bacelar, E, Rosa, E and Meyer, AS. 2007. Effect of
ripeness and postharvest storage on the evolution of colour and anthocyanins in cherries
(Prunus avium L.). Food Chemistry, 103(3), 976-984
Hahn, F. 2002. Multi-spectral prediction of unripe tomatoes. Bio-systems Engineering, 81(2), 147-
155.
Haile, A. 2018. Shelf life and quality of tomato (Lycopersicon esculentum Mill.) fruits as affected
by different Packaging Materials. African Journal of Food Science,2(2), 21-27.
doi:10.5897/AJFS2017.1568.
Islam, M and Morimoto, T. 2016. Quality of fresh tomato fruit stored inside a solar adsorption
cooling storage system as function of low-pressure treatment. Agricultural Engineering
International: CIGR Journal, 18(3), 258-265.
James, SJ, Swain, MJ, Brown, T, Evans, JA, Tassou, SA, Ge, YT, Eames, I, Missenden, J,
Maidment, G and Baglee, D. 2009. Improving the energy efficiency of food refrigeration
operations. Proceedings of the Institute of Refrigeration, Session 2008-09. 5-1-5-8.
Jedermann, R, Nicometo, M, Uysal, I and Lang, W. 2017. Reducing food losses by intelligent food
logistics. Food Control, 77, 221-234.
Kassim, A. 2013. Evaluating the effects of pre-packaging, packaging and varying storage
environment, treatments on the quality of avocados (persea Americana mill.) MSc in
Engineering Thesis. College of Agriculture, University of KwaZulu Natal,
Pietermaritzburg, South Africa.
183
Kassim, A, Workneh, TS and Bezuidenhout, CN. 2013. A Review on Postharvest Handling of
Avocado Fruit. African Journal of Agricultural Research, 8(21), 2385-2402.
Katundu, M, Hendriks, S, Bower and Siwela, M. 2010. Can sequential farming help smallholder
organic farmers meet consumer expectations for organic potatoes? Food Quality and
Preference, 21, 379-384.
Kim, DS and Ferreira, CAI. 2008. Solar refrigeration options – a state of the art review.
International Journal of Refrigeration, 31, 3-15.
Kitinoja, L and Thompson, JF. 2010. Pre-cooling systems for small-scale producers. Stewart
Postharvest Review, doi: 10.2212/spr.2010.2.2.
Macheka, L, Spelt, E, Van Der Vorst, JG and Luning, PA. 2017. Exploration of logistics and
quality control activities in view of context characteristics and postharvest losses in fresh
produce chains: a case study for tomatoes. Food Control, 77, 221-234.
dx.doi.org/10.1016/j.foodcont.2017.02.037.
Maftoonazad, N and Ramaswamy, HS. 2008. Effect of pectin-based coating on the kinetics of
quality change associated with stored avocados. Journal of Food Processing and
Preservation, 32(4), 621-643.
Manaf, IA, Durrani, F and Eftekhari, M. 2018. A review of desiccant evaporative cooling systems in hot and humid climates. Advances Energy Research. doi: 10.1080/17512549.2018.1508364.
Mhina, EI and Lyimo, M. 2013. Effect of post-harvest handling practices on physico-chemical
composition of tomato. Journal of Agricultural Technology, 9(6), 1655-1664.
Misra, D and Ghosh, S. 2018. Evaporative cooling technologies for greenhouses: a comprehensive
review. Agricultural Engineering International: CIGR Journal, 20(11), 1-14
Mohammed, M, Wilson, LA and Gomes, PI. 1999. Postharvest Sensory and physiochemical
attributes of processing and non-processing tomato cultivars. Journal of Food Quality, 22,
167–182.
Nath, A, Deka, BC, Singh, A, Patel, RK, Paul, D, Misra, LK and Ojha, H. 2012. Extension of shelf
life of pear fruits using different packaging materials. Journal of Food Science Technology,
49(5), 556–563. doi.10.1007/s13197-011-0305-4.
Ngcobo, MEK, Delele, MA, Opara, UL, Zietsman, CJ and Meyer, CJ. 2012. Resistance to airflow and cooling patterns through multi-scale packaging of table grapes. International Refrigeration, 35(2), 445-452.

184
Ndukwu, MC, Manuwa, SI, Olukunle, OJ and Oluwalana, IB. 2013. Development of an active
evaporative cooling system for short-term storage of fruits and vegetable in a tropical
climate. Agricultural Engineering International: CIGR Journal, 15(4), 307-313.
Ndukwu, MC and Manuwa, SI. 2014. Review of research and application of evaporative cooling
in preservation of fresh produce. International Journal of Agricultural & Biological
Engineering, 7(5), 85-102.
Nino- Medina, G, Rivera-Castro, JC, Vidales-Contreras, JA, Rodriguez-Fuentes, H and Luna-
Maldonado, AI. 2013. Physicochemical parameters for obtaining prediction models in the
postharvest quality of tomatoes (Solanum lycopersicum L.). Transactions on Machine
Learning and Data Mining, 6(2), 81-91.
Ogbuagu, NJ, Oluka, SI and Ugwu, KC. 2017. Development of a passive evaporative cooling
structure for storage of fresh fruits and vegetables. Journal of Emerging Technologies and
Innovative Research, 4(8), 179-186. ISSN-2349-5162.
Pinheiro, J, Alegria, C, Abreu, M, Goncalves, EM and Silva, CLM. 2013. Kinetics of changes in
the physical quality parameters of fresh tomato fruits (Solanum lycopersicum, cv. ‘Zinc’)
during storage. Journal of Food Engineering, 114, 338-345.
Pinheiro, J, Alegria, C, Abreu, M, Sol, M, Gonçalves, EM and Silva, CLM. 2015. Postharvest
quality of refrigerated tomato fruit (Solanum lycopersicum, cv. Zinac) at two maturity
stages following heat treatment. Journal of Food Processing and Preservation, 39(6), 697-
709. dx.doi. org/10.1111/jfpp.12279.
Rahman, MM, Moniruzzaman, M, Ahmad, MR, Sarker, BC and Alam, MK. 2016. Maturity stages affect the postharvest quality and shelf-life of fruits of strawberry genotypes growing in subtropical regions. Journal of the Saudi Society of Agricultural Sciences, 15, (1), 28-37. doi.org/10.1016/j.jssas.2014.05.002
Rahiel, HA, Zenebe, AK, Leake, GW and Gebremedhin, BW. 2018. Assessment of production
potential and post‑harvest losses of fruits and vegetables in northern region of Ethiopia.
Agriculture and Food Security, 7, 29. doi.org/10.1186/s40066-018-0181-5.
Ranganna, S. 1995. Handbook of analysis and quality control for fruits and vegetable products,
2nd edition. Tata McGraw Hill Publishing Co. Ltd, New Delhi, India.

185
Rayaguru, K, Khan, MK and Sahoo, NR. 2010. Water use optimisation in zero energy cool
chambers for short-term storage of fruits and vegetables in coastal area. Food Science
Technology, 47(4), 437-441.
Ross, GA, David, AB, Jeremy, NB, Kevin, JP and Robert, JS. 2010. Plants in action. Ed. David
Brummell, Edition 2. Plant and Food Research, Palmerston North, Auckland.
Saad, A, Ibrahim, A and El-Bialee, N. 2016. Internal quality assessment of tomato fruits using
image color analysis. Agricultural Engineering International: CIGR Journal, 18(1), 339-
352.
Saltveit, ME. 2003. Temperature extremes. In: (eds) Bartz JA, and Brecht JK. Postharvest
physiology and pathology of vegetables, 457-483. Marcel Dekker, New York, USA.
Saltveit, ME. 2018. Respiratory Metabolism - Chapter 4. Postharvest Physiology and Biochemistry
of Fruits and Vegetables, 73-91. doi.org/10.1016/B978-0-12-813278-4.00004-X.
Sammi, S and Masud, T. 2007. Effect of different packaging systems on storage life and quality
of tomato (Lycopersicon esculentum var. Rio Grande) during different ripening stages.
Journal of Food Safety, 9, 37–44.
Shahnawaz, M, Sheikh, SA, Panwr, AA, Khaskheli, SG, and Awan, FA. 2012. Effect of hot
water treatment on the chemical, sensorial properties and ripening quality of Chaunsa
mango (Mangifera indica L.). Journal of Basic Applied Sciences, 8, 328–333.
Sibomana, MS, Workneh, TS and Audain, K. 2016. A review of postharvest handling and losses
in the fresh tomato supply chain: a focus on Sub-Saharan Africa. Journal of Food Security,
8, 389-404. doi.10.1007/s12571-016-0562-1.
Siddiqui, MW, Patel, VB and Ahmad, MS. 2015. Effect of climate change on postharvest quality
of fruits. In Choudhary, ML, Patel, VB, Siddiqui, MW and Mahdi, SS (Eds.), Climate
dynamics in horticultural science: Principles and applications, 1, 313-326. Apple Academic
Press, Waretown, New Jersey.
Singh, KK and Reddy, BS. 2006. Post-harvest physico-mechanical properties of orange peel and fruit. Journal of Food Engineering, 73(2), 112-120.
Sirisomboon, P, Tanaka, M and Kojima, T. 2012. Evaluation of tomato textural mechanical properties. Journal of Food Engineering, 111(4), 618–624.

186
Sondi, I and Salopek-Sondi, B. 2004. Silver nano-particles as antimicrobial agent: a case study on
E. Coli as a model for gram-negative bacteria. Journal of Colloid and Interface Science,
275(1), 177-182.
Tefera, A, Seyoum, T and Woldetsadik K. 2007. Effect of Disinfection, Packaging, and Storage
Environment on the Shelf Life of Mango. Biosystems Engineering, 96(2), 201– 212.
Thipe, EL. 2014. Comparative analysis of two greenhouse microclimates in the sub-humid climate
of South Africa. MSc in Engineering Thesis. College of Agriculture, University of
KwaZulu Natal, Pietermaritzburg, South Africa.
Thipe, EL, Workneh, T, Odindo, A and Laing, M. 2017. Greenhouse technology for agriculture
under arid conditions. Sustainable Agriculture Reviews, 22, 37–55.
Thompson, AK, Prange, RK, Bancroft, R and Puttongsiri, T. 2018. Controlled atmosphere storage
of fruit and vegetables. 3rd edition. CABI, Nosworthy way, Wallingford, Oxfordshire,
OX10 8DE, UK. ISBN 9781786393753
Tigist, M, Workneh, TS and Woldetsadik, K. 2011. Effects of variety on quality of tomato stored
under ambient temperature conditions. Food Science Technology, 50(3), 467-478.
doi.10.1007/s13197-011-0378-0.
Tigist, M, Workneh, T and Woldetsadik, K. 2013. Effects of variety on the quality of tomato stored
under ambient conditions. Journal of Food Science and Technology, 50(3), 477-486.
Tolesa, GN and Workneh, TS. 2017. Influence of storage environment, maturity stage and pre-
storage disinfection treatments on tomato fruit quality during winter in KwaZulu-Natal,
South Africa. Journal of Food Science and Technology, 54(10), 3230-3242.
doi.10.1007/s13197-017-2766-6.
Tshiala, MF and Olwoch, JM. 2012. Impact of climate variability on tomato production in
Limpopo province, South Africa. African Journal on Agricultural Research, 5(2), 2945-
2951.
USDA. 2011. United States standard for grades of fresh tomatoes. USDA, Agricultural Marketing
Services, Washington DC, USA.
Vinha, AF, Barreira, SVP, Castro, A, Costa, A and Oliveira, BPP. 2013. Influence of the storage
conditions on the physicochemical properties, antioxidant activity and microbial flora of

187
different tomato (Lycopersicon esculentum L.) cultivars. Journal of Agricultural Science,
5(2), 118-128.
Viskelis, P, Jankauskiene, J and Bobinaite, R. 2008. Content of carotenoids and physical properties
of tomatoes harvested at different ripening stages. In: Ciprovica, I, Karklina, D,
Venskutonis, PR, Vokk, R, Verhe, R, Lucke, FK, Kuka, P, Rukshan, L and Shleikin, A,
eds. Foodbalt, 3rd Baltic Conference on Food Science and Technology, 166-170. Jelgava,
Latvia.
Wang, LJ and Sun, DW. 2001. Rapid cooling of porous and moisture foods by using vacuum
cooling technology. Trends in Food science and Technology, 12, 174-184.
Wang, L, Baldwin, EA and Bai, J. 2016. Recent Advance in Aromatic Volatile Research in Tomato
Fruit: The Metabolisms and Regulations. Food Bioprocess Technology, 9(2), 203-216.
doi.org/10.1007/s11947-015-1638-1.
Wills, RBH and Golding, JB. 2016. Postharvest: An introduction to the physiology and handling
of fruit and vegetables. New South Publishing, Sydney Australia. ISBN 9781742247854.
Workneh, TS, Osthoff, G and Steyn, MS. 2009. Integrated agrotechnology with preharvest
ComCat®treatment, modified atmosphere packaging and forced ventilation evaporative
cooling of tomatoes. African Journal of Biotechnology, 8(5), 860-872.
Workneh, TS and Osthoff, G. 2010. A review on integrated agro-technology of vegetables. African
Journal of Biotechnology, 9(54), 9307-9327.
Workneh, TS, Osthoff, G and Steyn, MS. 2012. Effects of preharvest treatment, disinfections,
packaging and storage environment on quality of tomato. Journal of Food Science
Technology, 49(6), 685–694. doi.10.1007/s13197-011-0391-3.
Young, TE, Juvik, JA and Sullivan, JG. 1993. Accumulation of the Components of Total Solids in
Ripening Fruits of Tomato. Journal of American Society of Horticultural Science, 118(2),
286-292.
Zakari, MD, Abubakar, YS, Muhammad, YB, Shanono, NJ, Nasidi, NM, Abubakar, MS,
Muhammed, AI, Lawan, I and Ahmad, RK. 2016. Design and construction of an
evaporative cooling system for the storage of fresh tomatoes. Asian Research Publishing
Network (ARPN). Journals of Engineering and Applied Sciences, 11(4), 2340-2348.

188
Zheng, LY and Sun, DW. 2006. Innovative Applications of Power Ultrasound during Food
Freezing Processes - A Review. Trends in Food Science and Technology, 17(1), 16-23.

189
6 GENERAL DISCUSSIONS, CONCLUSIONS AND
RECOMMENDATIONS
6.1 General discussions The overall aim of this study was to design, construct and evaluate an integrated solar powered-
postharvest cooling technology for storage of fruit and vegetables (F&V) in Southern Africa and
specifically under hot and sub-humid to humid conditions. The study addressed the challenge of
huge postharvest losses (PHL) experienced in F&V especially during the glut period for small-
scale farmers (SSF) in sub-Saharan Africa (SSA). The delay between one harvest and the next as
SSF await transport to the market, requires cooling for fresh produce to maintain quality and extend
shelf life. Many SSF lose a significant portion of their fresh produce harvest because of lack of
access to postharvest handling facilities. Cooling facilities remove field heat, which
consequentially reduces physiological deterioration. A number of modern cooling facilities like
mechanical refrigeration, hydro-cooling and vacuum cooling exists and are mainly exploited by
large scale growers who can finance the high initial investment costs, maintenance costs,
throughput and energy requirements.
Several research studies focusing on SSF in remote and isolated areas with no access to grid
electricity, recommend low-cost cooling technologies, such as the evaporative cooling (EC) which
work best in arid and semi-arid climatic regions for short-term storage of fresh produce. EC systems
preserve fresh produce by the removal of sensible heat. EC systems encountered in literature
reviews were very small direct evaporative coolers and for experimental purposes only, tested
under hot and dry conditions mostly in North, East and West Africa. Literature also revealed that
it is possible for EC systems for both greenhouse application and fresh produce preservation to
work under one climatic condition and fail in another. Hence, the importance of developing and
testing EC systems for specific climates and regions is necessary. Work on EC in SSA has been
limited to other regions and there is dearth of information on the performance of EC systems in the
Southern African sub-region.

190
EC has limitations in hot and sub-humid to humid areas because of inherent high humidity of the
local air, which leads to low dry bulb temperature drops. Literature review proposes exploration of
a combination of indirect air cooling and evaporative cooing (IAC+EC) for hot and humid areas
like coastal regions in Sub-Saharan Africa. Despite the forecasted favourable results, the indirect
air-cooling assisted EC is still an undeveloped technology and more focused research and
investigation needs carrying out, a focus of this study. The novelty of such research is the
introduction of indirect heat exchanger for sensible cooling of air before reaching the cooling pads
for small-scale farmer sized storage structures. This study proposed investigation of an IAC+EC
of fresh produce under hot and sub-humid to humidity conditions in Southern Africa. Literature
reveals that to date EC has been done either direct or a combination of direct and indirect cooling
for both greenhouse application and for cooling the microenvironment in fresh produce storage.
There is little literature showing some attention to miniature IAC+EC experiments for comfort
cooling, production process in metallurgical shops, cooling automobile engines and tractor cabins.
Otherwise this area of research remains untaaped there is currently dearth of information on the
performance of such a system for preservation of F&V. This has provided an opportunity to
develop and characterise an IAC+EC for hot and sub-humid to humid conditions prevalent in
coastal areas of SSA, which is innovation in terms of developing cooling facilities.
Because of coupling IAC unit on the EC system, additional electrical appliances of heat exchanger,
fans for ventilation and water pump for reticulation are required and these need energy provision.
As the study addresses SSF in remote areas with no access to electricity, use of solar energy was
is the immediate option as it is abundant in most parts of SSA. Solar photovoltaic (SPV) systems
can run IAC+EC and provide other advantages of low initial capital investment, and can be
installed as an autonomous system to serve farmers that cannot be connected to the national grid.
The amount of energy required to power an IAC+EC system is related to the size of the air
ventilation system, water reticulations system, and desiccating media, which is the focus of this
study. There exists a dearth of information regarding the actual performance and energy
requirements of solar powered IAC+EC system under hot and sub-humid to humid conditions in
Southern Africa.This study sought to provide data on the actual energy requirements for the cooling
load and the performance of solar photovoltaics (SPV) in powering a small-scale farme sized
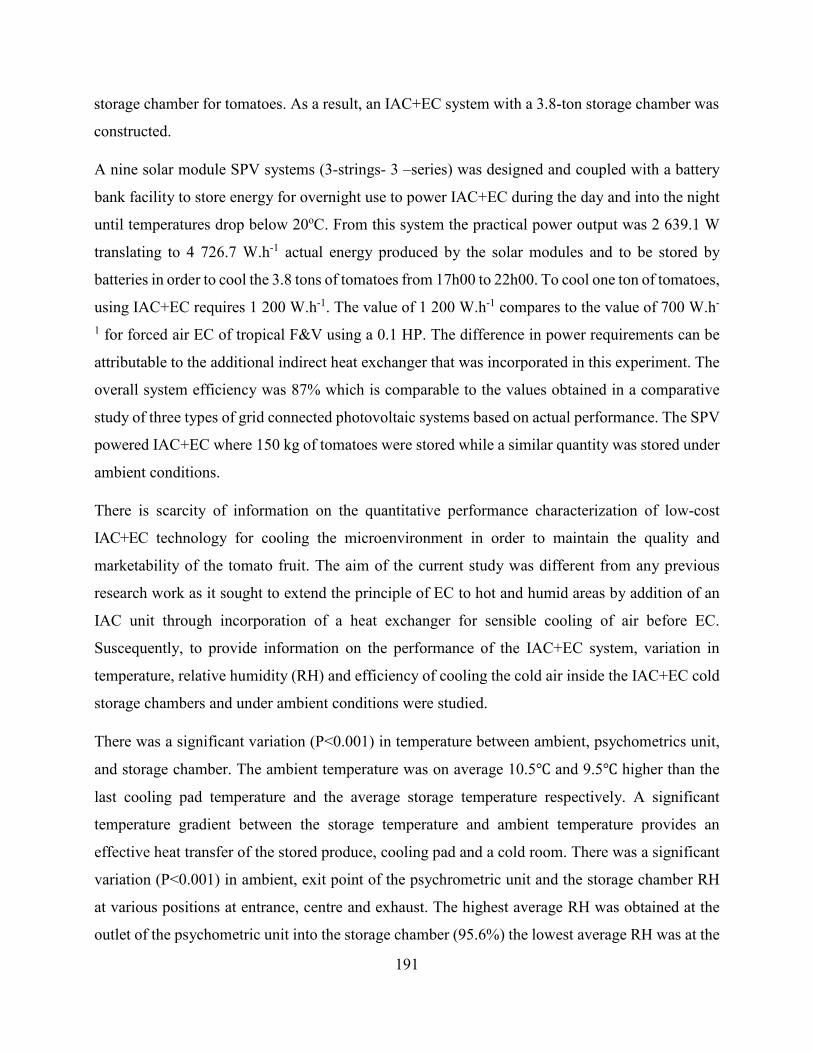
191
storage chamber for tomatoes. As a result, an IAC+EC system with a 3.8-ton storage chamber was
constructed.
A nine solar module SPV systems (3-strings- 3 –series) was designed and coupled with a battery
bank facility to store energy for overnight use to power IAC+EC during the day and into the night
until temperatures drop below 20oC. From this system the practical power output was 2 639.1 W
translating to 4 726.7 W.h-1 actual energy produced by the solar modules and to be stored by
batteries in order to cool the 3.8 tons of tomatoes from 17h00 to 22h00. To cool one ton of tomatoes,
using IAC+EC requires 1 200 W.h-1. The value of 1 200 W.h-1 compares to the value of 700 W.h-
1 for forced air EC of tropical F&V using a 0.1 HP. The difference in power requirements can be
attributable to the additional indirect heat exchanger that was incorporated in this experiment. The
overall system efficiency was 87% which is comparable to the values obtained in a comparative
study of three types of grid connected photovoltaic systems based on actual performance. The SPV
powered IAC+EC where 150 kg of tomatoes were stored while a similar quantity was stored under
ambient conditions.
There is scarcity of information on the quantitative performance characterization of low-cost
IAC+EC technology for cooling the microenvironment in order to maintain the quality and
marketability of the tomato fruit. The aim of the current study was different from any previous
research work as it sought to extend the principle of EC to hot and humid areas by addition of an
IAC unit through incorporation of a heat exchanger for sensible cooling of air before EC.
Suscequently, to provide information on the performance of the IAC+EC system, variation in
temperature, relative humidity (RH) and efficiency of cooling the cold air inside the IAC+EC cold
storage chambers and under ambient conditions were studied.
There was a significant variation (P<0.001) in temperature between ambient, psychometrics unit,
and storage chamber. The ambient temperature was on average 10.5℃ and 9.5℃ higher than the
last cooling pad temperature and the average storage temperature respectively. A significant
temperature gradient between the storage temperature and ambient temperature provides an
effective heat transfer of the stored produce, cooling pad and a cold room. There was a significant
variation (P<0.001) in ambient, exit point of the psychrometric unit and the storage chamber RH
at various positions at entrance, centre and exhaust. The highest average RH was obtained at the
outlet of the psychometric unit into the storage chamber (95.6%) the lowest average RH was at the

192
ambient (65.4%). The cooler efficiency ranged between 86.8% and 97%. Between 05h00 and
09h00 of each day, the efficiency was about 92-95% and the values increased from 05h00 to 14h00,
then declining thereafter to 86.8% by 18h00. The cooling curve efficiency shows that higher
cooling efficiency obtain with higher temperature and lower RH of ambient air in the afternoon
when the solar irradiation is highest. This is a desirable state as the cooling load is highest at the
time that the SPV is providing the highest power.
There is scarcity of information on the qualitative performance of stored fresh produce under
IAC+EC technology. In response, an analysis of low-cost cooling technologies (IAC+EC) under
hot and sub-humid areas, tomatoes harvested at different maturity stage and storage periods on the
quality and marketability was carried out. The study determined the best storage conditions for
maintaining the quality and marketability of tomatoes during the storage period. There were
significant effects due to the interaction of storage conditions × harvesting maturity stage (P<0.05),
storage conditions × storage period (P<0.001) and maturity stage x storage period (P<0.005) on the
firmness of tomatoes. Tomatoes stored under IAC+EC maintained firmness for long periods than
sampled tomatoes stored under ambient conditions. By day14, sampled tomatoes under ambient
conditions had a firmness 6.32 N a value lower than 8.46 N, which is the recommended firmness
for tomatoes suitable for supermarket shelves. By day21 tomatoes, stored IAC+EC had a firmness
of 8.45 N a value almost equal the firmness for tomatoes suitable for supermarket shelves. The 3-
way interaction of storage conditions x maturity stage x period of storage had a significant (P<0.05)
effect on the values of h° and the L* of the sampled tomatoes under IAC+EC. The green harvested
tomatoes had the highest values of h° and the L* when storage in the IAC+EC storage chamber
when observed over the period of storage. The two-way interactions between storage conditions
and storage period significantly (P≤0.05) influenced the TSS accumulation. The tomatoes that were
stored in the IAC+EC storage chamber regardless of maturity stage at harvest had lower TSS than
those stored under ambient conditions as changes occur in sugar content during the development
of tomato fruit increases progressively throughout the storage period as the fruit matures and ripens
associated with the first appearance of yellow pigment in the walls of the fruit at the breaker stage
through to red. The highest PWL was found in tomatoes stored under ambient conditions (9.5%)
due to the considerably higher temperatures (± 26℃) and lower RH (< 60%), compared to the
IAC+EC storage conditions (3.2%) over the 28 days storage period. Pink harvested tomatoes

193
exhibited a higher PWL (7.9%) compared to green harvested tomatoes (4.8%) over the 28-day
storage period. Sampled tomatoes stored under ambient conditions had PWL of 9.4% by day7 and
14.5% by day28 compared to 2.2% and 6.4% for IAC+EC for the same period. Marketability
drastically decreased at ambient conditions from 100% to 42.9% by day14 and could have
decreased further if there were more days with high temperatures during the period of observation.
Under IAC+EC, the green harvested tomatoes were at 63.5% and 57.5% marketability at day21
and day28 while for pink harvested tomatoes there was a sharp decline from 50.1% marketability
at day21 to 28.1% at day28. Therefore, IAC+EC preserved the organoleptic properties of the
tomatoes.
6.2 Conclusions Modern cooling facilities like mechanical refrigeration, hydro-cooling and vacuum cooling were
found to be unaffordable by SSF because of high initial investment costs, maintenance costs,
throughput and energy requirements. From literature reviewed it is concluded that low-cost
(material and energy) cooling technologies are vital for reduction of PHL in fresh produce under
SSF in SSA. Selection of appropriate EC system depends mainly on local environmental conditions
and performance varies from one to the other. Literature also concluded that more scope of research
remains to be carried out to extent EC to hot and humid areas and this study proposes an additional
unit of IAC for EC to be extended to such places. Recent literature concludes that IAC+EC should
be of particular research interest because of potential high thermal performance. The inclusion of
a heat exchanger for IAC is a concept that is not previously documented for cooling the
microenvironment in storage of fresh produce and energy provision is required to power it. This
provides an opportunity for the use of solar energy to power a heat exchanger for sensible cooling
of air; water pump for water reticulation; fan to ventilate the storage chamber. From literature there
is dearth of information on the performance of EC systems in the Southern African sub-region.
From the literature evaluated this study proposes a different approach from the tradition of use of
prototypes and laboratory scale set ups by constructing a 3.8-ton (53 m3) storage chamber that
mimics the amount of tomatoes a SSF needed to provide a cool environment for fresh produce
between periods of one truckload and the next.
The energy supply from the solar panels was able to meet energy needs of powering the IAC+EC
system during daytime and charging the battery bank for overnight operation of the cooling system

194
until the temperatures were low enough. To cool one tonne of tomatoes, using IAC+EC requires 1
200 W.h-1 and the batteries had to store 4 726.7 W.h-1 to provide energy for the 3.8-ton storage
chamber to cool tomatoes from 17h00 to 22h00 when the IAC+EC system was switched off.
Therefore, the SPV systems used in the study supplied the energy during the critical period of the
day when temperatures are high from 08h00 to 22h00 of each day. The study clearly showed that
combinations of the solar array system can be used to power the cooling system at daytime during
summer season and the excess power can be stored in a battery bank for use during the night hours.
The energy of 2 639 W which can be supplied by 9 x 330 W solar panels, is enough to power a
3.8-ton storage chamber for tomatoes. The cost to establish this size of cooling system were R 190
190 with a payback period of 1.9 years to recoup the initial capital investment. Therefore, where
grid electricity or other commercial energy sources are unavailable and solar energy is available,
IAC+EC is a viable alternative to these more complex and costlier modern-day cooling systems.
This shows that stand alone SPV systems have an expression in rural, dispersed and remote areas
where grid electricity supply may not be readily accessible. Based on the results it is recommended
that solar energy be integrated with IAC+EC for more effective reduction of decay and maintaining
the F&V quality in areas that cannot be connected to the national grid.
The IAC+EC maintained a 13-41% higher RH and achieved 7-16℃ temperature gradient with
ambient temperature and the microenvironment created was within the optimum range for the
short-term storage of tomatoes. The cooler efficiency was 86.8-96.7% indicating that the
combination of IAC and direct EC system was efficient in reducing the ambient temperature
towards the wet bulb temperature. The IAC+EC system obtained similar results attained for EC
system in hot and dry regions as temperature was reduced to 14-16℃ and RH raised to over 96%
in the storage chamber. This work has contributed to improving the understanding of the effect of
low-cost IAC+EC technology in provision of a microenvironment for storage of F&V under hot
and sub-humid to humid conditions in Southern Africa. This study clearly demonstrated that the
IAC+EC system could maintain the inside environmental conditions of air temperature and RH
approximately constant and at recommended levels for tomatoes and most tropical and sub-tropical
F&V. This work has therefore, contributed to improving the understanding of the effect of low-
cost IAC+EC technology on temperature reduction and RH increase under hot and sub-humid to
humid conditions in Southern Africa. IAC+EC is therefore, recommended for storage tropical and
sub-tropical F&V as it can increase their shelf life.

195
On the qualitative performance of stored fresh produce under IAC+EC technology the findings of
this study showed that all green and pink tomatoes experienced a decrease in firmness and hue
angle over 28 days’ experimental period. The tomatoes stored in the IAC+EC storage showed an
18.9% higher firmness, 10.5% lower concentration of sugars, 3% reduction in physiological weight
loss, 3% higher hue angle and 24.8% increase in marketability, when compared to the ambient
conditions of the stored tomatoes. IAC+EC storage reduced the PWL by 5% over 28 days, while
by day21 the tomatoes stored under ambient conditions experienced decay, shriveling and extreme
softness and were discarded. From the experiment, deductions are that the IAC+EC system
increased shelf life of green-harvested tomatoes to 28 days with a 57.5% marketability. The
combinations of green maturity stage at harvesting and IAC+EC storage greatly extended the shelf
life and improved the marketability of tomatoes. Therefore, a farmer can use a combination of
tomatoes harvested at the green stage and IAC+EC to maintain a better quality of tomatoes and to
extend their shelf life. Based on the results the IAC+EC system can be recommended for use by
SSF. Therefore, the characterisation of the performance of IAC+EC has clearly demonstrated that
the cooling system could maintain the physical, chemical and sensory characteristics of fresh
tomatoes and most tropical and sub-tropical F&V. This work has contributed to improving the
understanding of the effect of low-cost IAC+EC technology on the quality characteristics of fresh
tomato fruit preserved under hot and sub-humid to humid conditions in Southern Africa.
Finally, the work presented in this thesis is important because there is a scarcity of both quantitative
and qualitative information on the performance of solar powered low-cost IAC+EC systems on the
quality of the tomato fruit stored for extended storage periods under hot and humid conditions. The
thesis has provided critical data for decision making by SSF and potential emerging farmers under
the land re-distribution program in South Africa. This work has contributed to improved
understanding of the effect of low-cost IAC+EC systems on the quality characteristics of fresh the
tomato fruit subjected to this technology.
6.3 Recommendations for Future Research It is expected that ongoing research will be conducted on the unit in terms of testing it on other
F&V such as bananas, spinach, carrots or even on other horticultural commodities under full load
(53 m3 of fresh produce). The unit is immobile which limits its use between farms and market.

196
Some of the modifications and recommendations relating to the IAC+EC systems are as follows:
1. To automate the power provision system so that once the temperature in the storage
chamber falls below 20℃, power supply is disconnected.
2. The storage chamber to be mobile for cold storage transportation of F&V from the source
to the market.
3. Use of surrounding air kinetic energy from a mobile storage transportation as a source of
power for operation of the IAC+EC when in transit.
6.4 Practical Relevance of the Research Study This research study addresses the following practical issues relating to F&V:
1. The implementation of low cost and environmentally friendly cooling system in addressing
the challenge of PHL in F&V.
2. The storage chamber and psychrometric unit constructed from locally sourced materials.
3. Solar energy used a power source to drive the electrical appliances of the water reticulation
and ventilation systems of the IAC+EC system.
4. The psychrometric unit of the IAC+EC system reduced temperature to 14-16℃ and
increased RH of the storage chamber to 90-93%, which are optimum storage conditions for
most tropical and sub-tropical F&V.
5. The IAC+EC increased the shelf life of green-harvested tomatoes to 28 days with a 57.5%
marketability.
6. There is now a greater understanding of the performance of IAC+EC for preservation of
F&V in Southern Africa under humid conditions.
7. This IAC+EC principle can be extended to other F&V.
8. The implementation of the SSF sized EC system means farmers could reduce their lack of
storage facilities by direct adoption.
9. Small-scale farmers in remote, isolated, dispersed populations with no access to grid
electricity can now access, a low-cost appropriate EC system for most tropical and sub-
tropical F&V.

197
It is anticipated that the findings of this study will be applied to suit the postharvest handling of
F&V in South Africa for both local and export markets.

198
7 APPENDICEES
7.1 APPENDIX 7.1: Drawings and images of the IAC+EC system
(a)
(b)
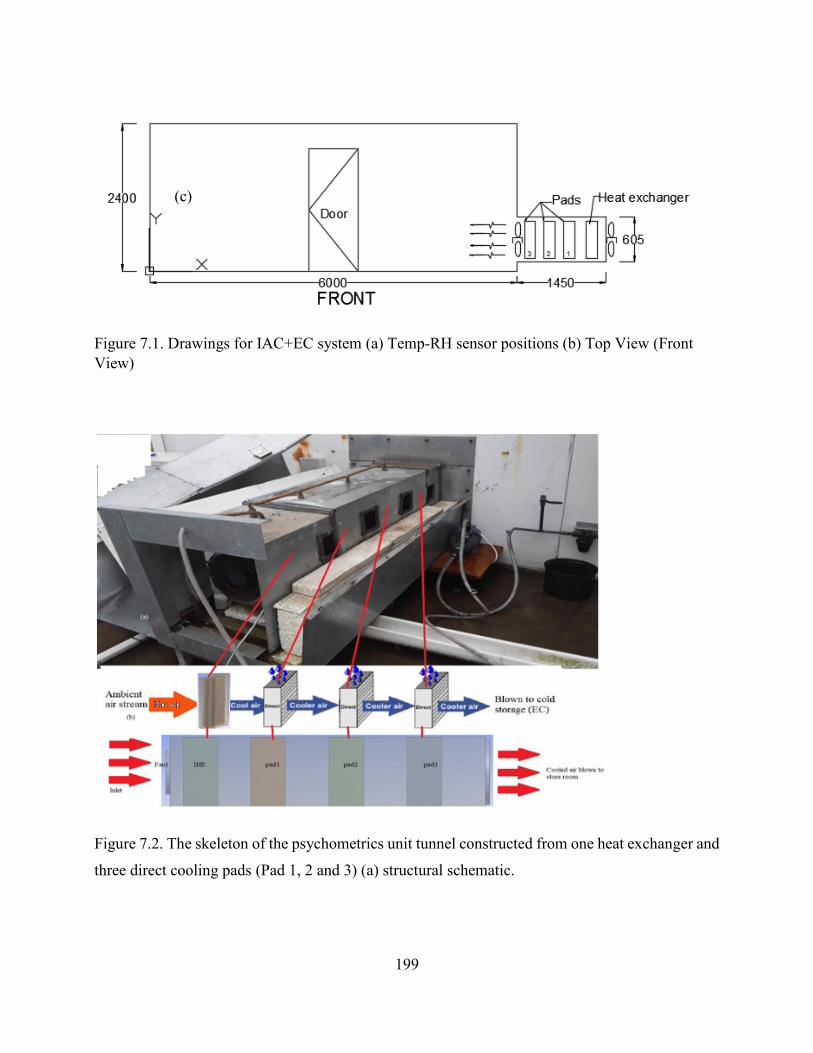
199
Figure 7.1. Drawings for IAC+EC system (a) Temp-RH sensor positions (b) Top View (Front View)
Figure 7.2. The skeleton of the psychometrics unit tunnel constructed from one heat exchanger and
three direct cooling pads (Pad 1, 2 and 3) (a) structural schematic.
(c)

200
Figure 7.3. Pictorial image of the storage chamber in Ukulinga Research Station in
Pietermaritzburg
7.2 APPENDIX 7.2: Day of the year and angles of elevation and declination The other factors of consideration are power dissipation, stagnation, conduction losses, efficiency
factors of the inverter and controller and differences in solar cell technologies of the modules. The
aggregate sun-oriented radiation received at a given area on earth varies depending on t©he length
of the insolation on a specific day and the power of sunlight-based vitality. Variations also arise
because of latitude and the day or time of the year. Equation 7.1 calculates the day of the year.
𝑙𝑙 = 𝐷𝐷 + 𝐷𝐷 (7.1)
Where, d= day of the year (days); D = day of the month (days), and
i = total number of days of the previous months of the same year (days).
The number of days is obtained from equation 7.1 𝑙𝑙 = 𝐷𝐷 + 𝐷𝐷
For 22 June 2017, 𝑙𝑙 = 151 + 22 = 173 𝑙𝑙𝑙𝑙𝑃𝑃𝐷𝐷
For 22 September 2017, 𝑙𝑙 = 243 + 22 = 265 𝑙𝑙𝑙𝑙𝑃𝑃𝐷𝐷

201
The incident power on a PV module varies with power contained in the sunlight and the angle
between the module and the sun. This implies that the power density is maximum when the PV
module is perpendicular to the sun. However, as the angle between the sun and a fixed surface
changes continuously, the incident sunlight is more than the power density on a fixed PV module.
Figure 7.2 shows solar radiation received by any surface at different angles. In this study, the solar
radiation values recorded over 50 years’ and captured in the South African Atlas 18 of Agro-
hydrology and climatology will be used.
From Figure 7.4 several useful angles are derived:
1. The tilt angle of the solar panel determines the optimum energy yield and is defined as the
angle at which the solar panel is oriented against the horizontal plane.
2. δ is the declination angle and varies with the day of the year. It is the angle made between
the plane of the equator and the line joining the two centres of the earth and the sun and the
value lies between -23.45 ≤ δ ≤ 23.45.
3. The elevation angle (α) is the angle between the horizontal plane and the incident solar
radiation.
Figure 7.4. Tilting the module to the incoming light (Adopted from Honsberg and Bowden, S.
2016)

202
The equator of the earth is tilted at 23.45 degrees with respect to the plane of the earth’s orbit
around the sun and the declination varies from 23.45 degrees north to 23.45 degrees south at various
times of the year as the earth orbits the sun. The declination angle 𝛿𝛿 shown in Figure 7.1 is
determined through equation 7.2
𝛿𝛿 = −23.45 sin �360365
(284 + 𝑙𝑙)� (7.2)
Where δ = declination angle (0) and d = day of the year (days).
The declination angle for this study is calculated from equation 7.2 and on 22 June 2017 the
declination
𝛿𝛿 = −23.45 sin �360365
(284 + 173)� = − 23.45˚and on the 22nd of September 2017 which is at
equinoxes, declination is:
𝛿𝛿 = −23.45 sin�360365
(284 + 265)� = 0˚
The elevation angle (α) (see Figure 7.1) is the angle between the horizontal plane and the incident
solar radiation and is calculated by the equation:
𝛼𝛼 = 90 + 𝛿𝛿 − φ (7.3)
Where α = elevation angle (0); δ = declination angle (0), where φ = 29.6006o in PMB.
Therefore, on 22 June declination 𝛿𝛿 is (-23.450) and 22 September 00 and PMB latitude (φ) of -
29.6006 o, the elevation angle (α) are 96.15060 and 119.60060 respectively.

203
7.3 APPENDIX 7.3: Solar radiation at various tilt angles Table 7.1 Solar radiation at horizontal tilt angle
Horizontal Solar hours Horizontal
Tilt angle Latitude
Declination angle
Elevation angle Day Incident Module
MJ.m-2 hours W.m-2 β φ δ α days W.m-2 W.m-2
January 22.3 6.00 1 032.41 0.00 -29.60 19.93 139.53 22.00 1 590.61 1 032.41
February 19.8 6.30 873.02 0.00 -29.60 10.87 130.47 53.00 1 147.59 873.02
March 18.9 6.50 807.69 0.00 -29.60 0.00 119.60 81.00 928.93 807.69
April 17.2 6.90 692.43 0.00 -29.60 -11.93 107.67 112.00 726.73 692.43
May 14.8 7.60 540.94 0.00 -29.60 -20.34 99.26 142.00 548.08 540.94
June 13.8 7.90 485.23 0.00 -29.60 -23.45 96.15 173.00 488.04 485.23
July 15.6 8.10 534.98 0.00 -29.60 -20.24 99.36 203.00 542.20 534.98
August 17.3 8.00 600.69 0.00 -29.60 -11.40 108.20 234.00 632.32 600.69
September 18.2 6.70 754.56 0.00 -29.60 0.61 120.21 265.00 873.11 754.56
October 19.5 6.20 873.66 0.00 -29.60 12.10 131.70 295.00 1 170.16 873.66
November 23.6 5.60 1 170.63 0.00 -29.60 20.64 140.24 326.00 1 830.22 1 170.63
December 27.3 6.00 1 263.89 0.00 -29.60 23.44 143.05 356.00 2 102.33 1 263.89

204
Table 7.2 Solar radiation at tilt angle = latitude + 150
Horizontal Solar hours Horizontal
Tilt angle Latitude
Declinatio n angle
Elevation angle Day Incident Module
MJ.m-2 hours W.m-2 β φ δ α days W.m-2 W.m-2
January 22.30 6.00 1 032.41 -14.60 -29.60 21.27 140.87 15.00 1 635.93 1 318.96
February 19.80 6.30 873.02 -14.60 -29.60 10.87 130.47 53.00 1 147.59 1 032.59
March 18.90 6.50 807.69 -14.60 -29.60 0.00 119.60 81.00 928.93 897.27
April 17.20 6.90 692.43 -14.60 -29.60 -11.93 107.67 112.00 726.73 725.68
May 14.80 7.60 540.94 -14.60 -29.60 -20.34 99.26 142.00 548.08 545.70
June 11.50 7.90 404.36 -14.60 -29.60 -23.45 96.15 173.00 406.70 402.29
July 15.60 8.10 534.98 -14.60 -29.60 -20.24 99.36 203.00 542.20 539.93
August 17.30 8.00 600.69 -14.60 -29.60 -11.40 108.20 234.00 632.32 631.07
September 18.20 6.70 754.56 -14.60 -29.60 0.61 120.21 265.00 873.11 840.92
October 19.50 6.20 873.66 -14.60 -29.60 12.10 131.70 295.00 1 170.16 1 041.68
November 23.60 5.60 1 170.63 -14.60 -29.60 20.64 140.24 326.00 1 830.22 1 487.48
December 27.30 6.00 1 263.89 -14.60 -29.60 23.44 143.05 356.00 2 102.33 1 646.56

205
Table 7.3 Solar radiation at tilt angle = latitude
Horizontal Solar hours Horizontal
Tilt angle Latitude
Declination angle
Elevation angle Day Incident Module
MJ.m-2 hours W.m-2 β φ δ α days W.m-2 W.m-2
January 22.30 6.00 1 032.41 -29.60 -29.60 21.27 140.87 15.00 1 635.93 1 524.50
February 19.80 6.30 873.02 -29.60 -29.60 10.87 130.47 53.00 1 147.59 1 127.00
March 18.90 6.50 807.69 -29.60 -29.60 0.00 119.60 81.00 928.93 928.93
April 17.20 6.90 692.43 -29.60 -29.60 -11.93 107.67 112.00 726.73 711.03
May 14.80 7.60 540.94 -29.60 -29.60 -20.34 99.26 142.00 548.08 513.90
June 11.50 7.90 404.36 -29.60 -29.60 -23.45 96.15 173.00 406.70 373.12
July 15.60 8.10 534.98 -29.60 -29.60 -20.24 99.36 203.00 542.20 508.72
August 17.30 8.00 600.69 -29.60 -29.60 -11.40 108.20 234.00 632.32 619.84
September 18.20 6.70 754.56 -29.60 -29.60 0.61 120.21 265.00 873.11 873.06
October 19.50 6.20 873.66 -29.60 -29.60 12.10 131.70 295.00 1 170.16 1 144.16
November 23.60 5.60 1 170.63 -29.60 -29.60 20.64 140.24 326.00 1 830.22 1 712.79
December 27.30 6.00 1 263.89 -29.60 -29.60 23.44 143.05 356.00 2 102.33 1 928.77
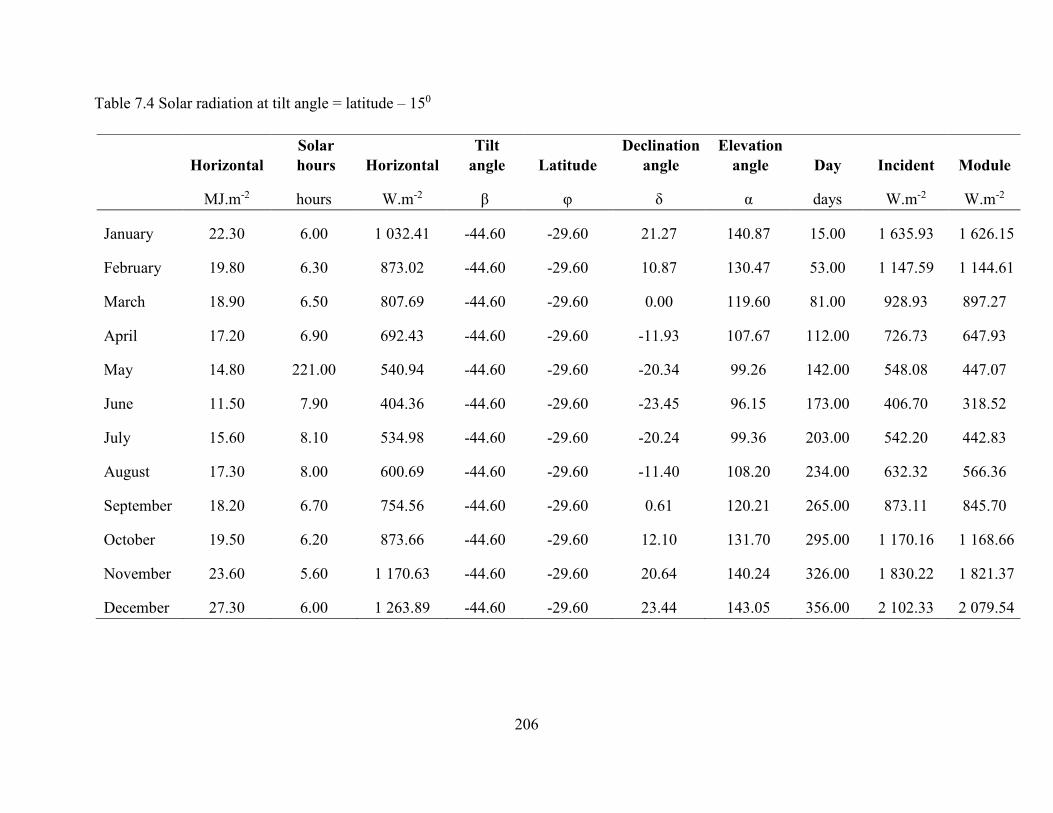
206
Table 7.4 Solar radiation at tilt angle = latitude – 150
Horizontal Solar hours Horizontal
Tilt angle Latitude
Declination angle
Elevation angle Day Incident Module
MJ.m-2 hours W.m-2 β φ δ α days W.m-2 W.m-2
January 22.30 6.00 1 032.41 -44.60 -29.60 21.27 140.87 15.00 1 635.93 1 626.15
February 19.80 6.30 873.02 -44.60 -29.60 10.87 130.47 53.00 1 147.59 1 144.61
March 18.90 6.50 807.69 -44.60 -29.60 0.00 119.60 81.00 928.93 897.27
April 17.20 6.90 692.43 -44.60 -29.60 -11.93 107.67 112.00 726.73 647.93
May 14.80 221.00 540.94 -44.60 -29.60 -20.34 99.26 142.00 548.08 447.07
June 11.50 7.90 404.36 -44.60 -29.60 -23.45 96.15 173.00 406.70 318.52
July 15.60 8.10 534.98 -44.60 -29.60 -20.24 99.36 203.00 542.20 442.83
August 17.30 8.00 600.69 -44.60 -29.60 -11.40 108.20 234.00 632.32 566.36
September 18.20 6.70 754.56 -44.60 -29.60 0.61 120.21 265.00 873.11 845.70
October 19.50 6.20 873.66 -44.60 -29.60 12.10 131.70 295.00 1 170.16 1 168.66
November 23.60 5.60 1 170.63 -44.60 -29.60 20.64 140.24 326.00 1 830.22 1 821.37
December 27.30 6.00 1 263.89 -44.60 -29.60 23.44 143.05 356.00 2 102.33 2 079.54

207
7.4 APPENDIX 7.4 Packing of tomatoes in the chamber 500 mm long x 300 mm wide x 230 mm high plastic packing crates were selected as ideally for
storage of tomatoes, which also farmers in KZN are using. The packing crates had at least 5%
venting spacing of 100 mm allowed between packed crates for adequate airflow between
tomatoes. The number of crates that the cooler could contain was determined by considering the
dimensions for the storage chamber as follows.
In determining, the number of crates that could be stacked horizontally the following was
accommodated:
(i) packing space of 100 mm was accommodated according to the procedure.
(ii) 0.9 m walkways were left in between the crates for ease of packing and unpacking.
(iii) 500 mm long x 300 mm wide x 230 mm high crates are used
The following image shows the storage chamber looks like.
Horizontal stacking
𝑁𝑁𝐴𝐴𝑚𝑚𝑏𝑏𝐷𝐷𝑏𝑏 𝑙𝑙𝑜𝑜 𝐴𝐴𝑏𝑏𝑙𝑙𝐴𝐴𝐷𝐷𝐷𝐷 𝑙𝑙𝑙𝑙𝑙𝑙𝑛𝑛𝑘𝑘 𝐴𝐴ℎ𝐷𝐷 𝑙𝑙𝐷𝐷𝑛𝑛𝑘𝑘𝐴𝐴ℎ 𝑙𝑙𝑜𝑜 𝐴𝐴ℎ𝐷𝐷 𝐷𝐷𝐴𝐴𝑙𝑙𝑏𝑏𝑙𝑙𝑘𝑘𝐷𝐷 𝐴𝐴ℎ𝑙𝑙𝑚𝑚𝑏𝑏𝐷𝐷𝑏𝑏 =5.88 𝑚𝑚0.30 𝑚𝑚
= 19 𝐴𝐴𝑏𝑏𝑙𝑙𝐴𝐴𝐷𝐷𝐷𝐷
𝑁𝑁𝐴𝐴𝑚𝑚𝑏𝑏𝐷𝐷𝑏𝑏 𝑙𝑙𝑜𝑜 𝐴𝐴𝑏𝑏𝑙𝑙𝐴𝐴𝐷𝐷𝐷𝐷 𝐷𝐷𝑛𝑛 𝐴𝐴ℎ𝐷𝐷 𝑚𝑚𝐷𝐷𝑙𝑙𝑙𝑙𝑙𝑙𝐷𝐷 𝑙𝑙𝑛𝑛𝑙𝑙 𝑙𝑙𝑙𝑙𝑙𝑙𝑛𝑛𝑘𝑘 𝐴𝐴ℎ𝐷𝐷 𝐷𝐷𝐴𝐴𝑙𝑙𝑏𝑏𝑙𝑙𝑘𝑘𝐷𝐷 𝐴𝐴ℎ𝑙𝑙𝑚𝑚𝑏𝑏𝐷𝐷𝑏𝑏 𝑃𝑃𝑙𝑙𝑙𝑙𝑙𝑙 𝑛𝑛𝐷𝐷𝑥𝑥𝐴𝐴 𝐴𝐴𝑙𝑙 𝐴𝐴ℎ𝐷𝐷 𝑙𝑙𝑙𝑙𝑙𝑙𝑏𝑏
= 2 ×5.88 𝑚𝑚 − 0.90 𝑚𝑚
0.30 𝑚𝑚= 32 𝐴𝐴𝑏𝑏𝑙𝑙𝐴𝐴𝐷𝐷𝐷𝐷
𝑇𝑇𝑙𝑙𝐴𝐴𝑙𝑙𝑙𝑙 𝑛𝑛𝐴𝐴𝑚𝑚𝑏𝑏𝐷𝐷𝑏𝑏 𝑙𝑙𝑜𝑜 𝐴𝐴𝑏𝑏𝑙𝑙𝐴𝐴𝐷𝐷𝐷𝐷 𝐴𝐴ℎ𝑙𝑙𝐴𝐴 𝐴𝐴𝑙𝑙𝑛𝑛 𝑏𝑏𝐷𝐷 𝐷𝐷𝐴𝐴𝑙𝑙𝑏𝑏𝐷𝐷𝑙𝑙 𝑙𝑙𝑛𝑛 𝐴𝐴ℎ𝐷𝐷 𝑜𝑜𝑙𝑙𝑙𝑙𝑙𝑙𝑏𝑏 𝑙𝑙𝑜𝑜𝐷𝐷𝐴𝐴𝑙𝑙𝑏𝑏𝑙𝑙𝑘𝑘𝐷𝐷 𝐴𝐴ℎ𝑙𝑙𝑚𝑚𝑏𝑏𝐷𝐷𝑏𝑏 = 19 + 32
= 51 𝐴𝐴𝑏𝑏𝑙𝑙𝐴𝐴𝐷𝐷𝐷𝐷
Vertical stacking of crates
In considering, the vertical stacking of the crates in the chamber a spacing between crates of 25
mm was left between the crates. Therefore,
𝐴𝐴𝐷𝐷𝐷𝐷𝑘𝑘ℎ𝐴𝐴 𝑙𝑙𝑜𝑜 𝐷𝐷𝐴𝐴𝑙𝑙𝐴𝐴𝑘𝑘𝐷𝐷𝑛𝑛𝑘𝑘 = ℎ𝐷𝐷𝐷𝐷𝑘𝑘ℎ𝐴𝐴 𝑙𝑙𝑜𝑜 𝐴𝐴𝑏𝑏𝑙𝑙𝐴𝐴𝐷𝐷 + 0.025 𝑚𝑚 = 0.255 𝑚𝑚

208
The bottom crates were stacked on a 200 mm stand and a minimum distance of 500 mm was left
between the roof and the stacked crates. Therefore,
𝑇𝑇𝑙𝑙𝐴𝐴𝑙𝑙𝑙𝑙 𝑛𝑛𝐴𝐴𝑚𝑚𝑏𝑏𝐷𝐷𝑏𝑏 𝑙𝑙𝑜𝑜 𝐴𝐴𝑏𝑏𝑙𝑙𝐴𝐴𝐷𝐷𝐷𝐷 𝐷𝐷𝐴𝐴𝑙𝑙𝑘𝑘𝐷𝐷𝑙𝑙 𝑣𝑣𝐷𝐷𝑏𝑏𝐴𝐴𝐷𝐷𝐴𝐴𝑙𝑙𝑙𝑙𝑙𝑙𝑃𝑃 =2.340 𝑚𝑚 − (0.2 𝑚𝑚 + 0.5 𝑚𝑚)
0.255 𝑚𝑚= 6 𝐴𝐴𝑏𝑏𝑙𝑙𝐴𝐴𝐷𝐷𝐷𝐷
Therefore, a maximum of six crates can be stacked vertically.
Total capacity of the storage chamber
𝑇𝑇𝑙𝑙𝐴𝐴𝑙𝑙𝑙𝑙 𝑛𝑛𝐴𝐴𝑚𝑚𝑏𝑏𝐷𝐷𝑏𝑏 𝑙𝑙𝑜𝑜 𝐴𝐴𝑏𝑏𝑙𝑙𝐴𝐴𝐷𝐷𝐷𝐷 𝐷𝐷𝐴𝐴𝑙𝑙𝑏𝑏𝐷𝐷𝑙𝑙 𝐷𝐷𝑛𝑛 𝐴𝐴ℎ𝐷𝐷 𝐷𝐷𝐴𝐴𝑙𝑙𝑏𝑏𝑙𝑙𝑘𝑘𝐷𝐷 𝐴𝐴ℎ𝑙𝑙𝑚𝑚𝑏𝑏𝐷𝐷𝑏𝑏 = 6 × 51 = 306 𝐴𝐴𝑏𝑏𝑙𝑙𝐴𝐴𝐷𝐷𝐷𝐷
The mass of tomatoes that can be stored in crate is used to calculate the total mass that can be
stored in the chamber. In packing tomatoes in a crate, there is a space of 0.12 m left in between
the tomato layers.
𝑉𝑉𝑙𝑙𝑙𝑙𝐴𝐴𝑚𝑚𝐷𝐷 𝑙𝑙𝐴𝐴𝐴𝐴𝐴𝐴𝑂𝑂𝐷𝐷𝐷𝐷𝑙𝑙 𝑏𝑏𝑃𝑃 𝐴𝐴𝑙𝑙𝑚𝑚𝑙𝑙𝐴𝐴𝑙𝑙𝐷𝐷𝐷𝐷 𝐷𝐷𝑛𝑛 𝑙𝑙𝑛𝑛𝐷𝐷 𝐴𝐴𝑏𝑏𝑙𝑙𝐴𝐴𝐷𝐷 = 0.51 𝑚𝑚 × 0.28 𝑚𝑚 × (0.38 − 0.12)
= 0.018 𝑚𝑚3
Assuming that the bulk density of tomatoes is 694 kg.m-3, mass of tomatoes per crate was
calculated as:
𝑀𝑀𝑙𝑙𝐷𝐷𝐷𝐷 𝑂𝑂𝐷𝐷𝑏𝑏 𝐴𝐴𝑏𝑏𝑙𝑙𝐴𝐴𝐷𝐷 = 694 𝑘𝑘𝑘𝑘.𝑚𝑚−3 × 0.018 𝑚𝑚3 = 12.5 𝑘𝑘𝑘𝑘 𝑂𝑂𝐷𝐷𝑏𝑏 𝐴𝐴𝑏𝑏𝑙𝑙𝐴𝐴𝐷𝐷
𝑇𝑇𝑙𝑙𝐴𝐴𝑙𝑙𝑙𝑙 𝑚𝑚𝑙𝑙𝐷𝐷𝐷𝐷 𝑙𝑙𝑜𝑜 𝐴𝐴𝑙𝑙𝑚𝑚𝑙𝑙𝐴𝐴𝑙𝑙𝐷𝐷𝐷𝐷 𝐴𝐴ℎ𝑙𝑙𝐴𝐴 𝐴𝐴𝑙𝑙𝑛𝑛 𝑏𝑏𝐷𝐷 𝐷𝐷𝐴𝐴𝑙𝑙𝑏𝑏𝐷𝐷𝑙𝑙 𝐷𝐷𝑛𝑛 𝐷𝐷𝐴𝐴𝑙𝑙𝑏𝑏𝑙𝑙𝑘𝑘𝐷𝐷 𝐴𝐴ℎ𝑙𝑙𝑚𝑚𝑏𝑏𝐷𝐷𝑏𝑏 = 12.5 𝑘𝑘𝑘𝑘 × 306 𝐴𝐴𝑏𝑏𝑙𝑙𝐴𝐴𝐷𝐷𝐷𝐷
≈ 3825 𝑘𝑘𝑘𝑘
Three hundred and six (306) crates could be packed in the storage chamber. Each crate can hold
12.5 kg of tomatoes and based on this computation, the storage capacity of the chamber was found
to be approximately 3 825 kg as shown in the following section.
7.5 APPENDIX 7.5: Cooling loads The cooling loads to be removed from the storage chamber for cooling purposes are respiration
heat, field heat, heat gain through the wall, air change heat load every time the storage chamber
door is opened and miscellaneous heat gains from lights, fan and labourers during stacking and
removal of tomatoes from the storage chamber.
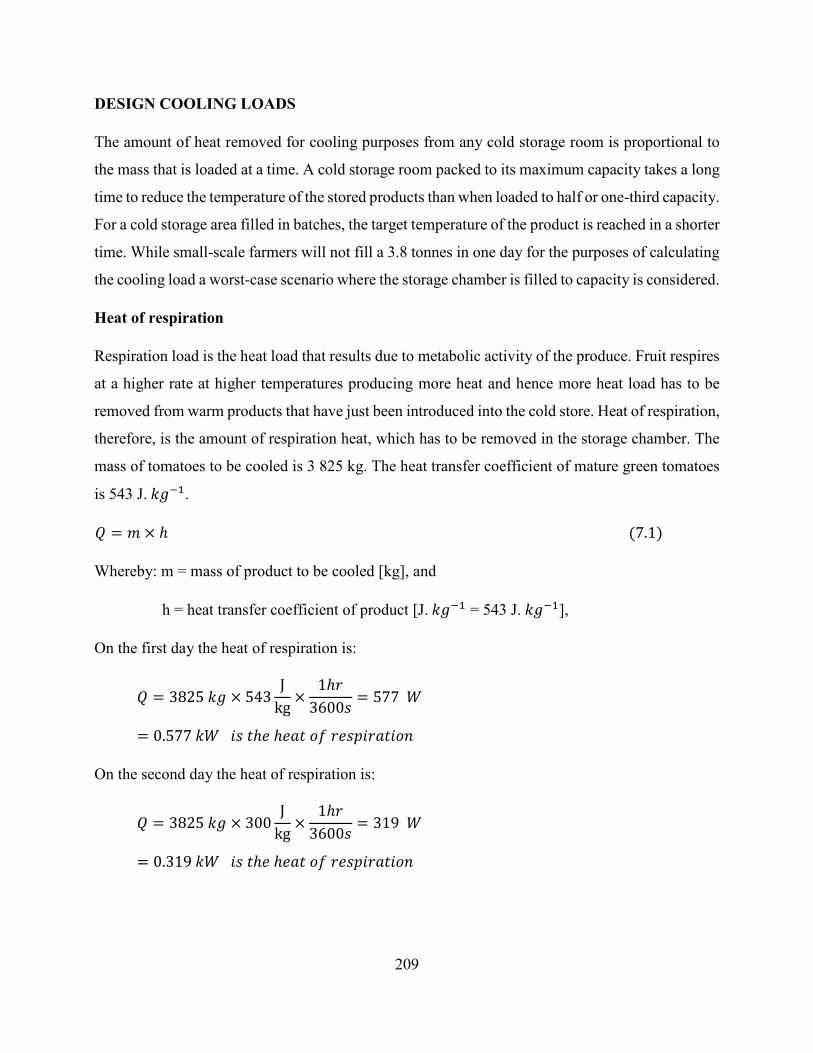
209
DESIGN COOLING LOADS
The amount of heat removed for cooling purposes from any cold storage room is proportional to
the mass that is loaded at a time. A cold storage room packed to its maximum capacity takes a long
time to reduce the temperature of the stored products than when loaded to half or one-third capacity.
For a cold storage area filled in batches, the target temperature of the product is reached in a shorter
time. While small-scale farmers will not fill a 3.8 tonnes in one day for the purposes of calculating
the cooling load a worst-case scenario where the storage chamber is filled to capacity is considered.
Heat of respiration
Respiration load is the heat load that results due to metabolic activity of the produce. Fruit respires
at a higher rate at higher temperatures producing more heat and hence more heat load has to be
removed from warm products that have just been introduced into the cold store. Heat of respiration,
therefore, is the amount of respiration heat, which has to be removed in the storage chamber. The
mass of tomatoes to be cooled is 3 825 kg. The heat transfer coefficient of mature green tomatoes
is 543 J. 𝑘𝑘𝑘𝑘−1.
𝑄𝑄 = 𝑚𝑚 × ℎ (7.1)
Whereby: m = mass of product to be cooled [kg], and
h = heat transfer coefficient of product [J. 𝑘𝑘𝑘𝑘−1 = 543 J. 𝑘𝑘𝑘𝑘−1],
On the first day the heat of respiration is:
𝑄𝑄 = 3825 𝑘𝑘𝑘𝑘 × 543J
kg×
1ℎ𝑏𝑏3600𝐷𝐷
= 577 𝑊𝑊
= 0.577 𝑘𝑘𝑊𝑊 𝐷𝐷𝐷𝐷 𝐴𝐴ℎ𝐷𝐷 ℎ𝐷𝐷𝑙𝑙𝐴𝐴 𝑙𝑙𝑜𝑜 𝑏𝑏𝐷𝐷𝐷𝐷𝑂𝑂𝐷𝐷𝑏𝑏𝑙𝑙𝐴𝐴𝐷𝐷𝑙𝑙𝑛𝑛
On the second day the heat of respiration is:
𝑄𝑄 = 3825 𝑘𝑘𝑘𝑘 × 300J
kg×
1ℎ𝑏𝑏3600𝐷𝐷
= 319 𝑊𝑊
= 0.319 𝑘𝑘𝑊𝑊 𝐷𝐷𝐷𝐷 𝐴𝐴ℎ𝐷𝐷 ℎ𝐷𝐷𝑙𝑙𝐴𝐴 𝑙𝑙𝑜𝑜 𝑏𝑏𝐷𝐷𝐷𝐷𝑂𝑂𝐷𝐷𝑏𝑏𝑙𝑙𝐴𝐴𝐷𝐷𝑙𝑙𝑛𝑛

210
Sensible heat of containers
Crates, which are inside the storage chamber increase the amount of heat circulating inside the
storage room causing deviations in the storage room temperature. The containers used for storage
of the tomatoes are 500 mm long × 300 mm wide × 230 mm high and each weigh approximately
1.8 kg with specific heat of 1.67 kJ. 𝑘𝑘𝑘𝑘−1. The containers in this study are packed with fresh
tomatoes at the farm at ambient temperature of 32℃ and brought to the storage chamber for cooling
12-14 ℃ . Three hundred and six crates can fit inside the storage chamber.
Q =m × cp(T2 − T1)
3600 × 𝑛𝑛 (7.2)
Where: m = mass of product to be cooled [kg],
cp = Specific heat of crates[KJ. 𝑘𝑘𝑘𝑘−1],
𝑛𝑛 = operation time [hrs],
T2 = Storage temperature of products in crates [℃ ], and
𝑇𝑇1 = Initial crates temperature [℃],
On the first day, the temperature will decrease from 32℃ to 15℃ and therefore the sensible heat
of containers will be:
Q =306 × 1.8 × 1.67(32 − 15)
3600 × 16= 0.271 kW is the sensible heat of containers
On the second day, the temperature will decline to 14℃ from 15℃ and therefore the sensible heat
of containers will be:
Q =306 × 1.8 × 1.67(15 − 14)
3600 × 16= 0.016 kW
Field heat
Field heat is the heat removed from the freshly harvested tomatoes by introducing into the cold
store by reducing the field temperature of the tomatoes to the desired storage temperature. Field
heat in the case of this study, therefore, is the amount of heat removed from the tomatoes as they

211
cool from initial harvest temperature to final storage temperature. The mass of the tomatoes is 3
825 kg and the operating time is assumed at 16 hours. The specific heat of tomatoes is 4.02
kJ. 𝑘𝑘𝑘𝑘−1) and the field heat is calculated as from the equation:
Q =m × cp(T2 − T1)
3600 × 𝑛𝑛
Where:
m = mass of product to be cooled, kg
cp = Specific heat of tomatoe , k J. 𝑘𝑘𝑘𝑘−1
𝑛𝑛 = operation time, hrs
T2 = Storage temperature of products in crates,℃
𝑇𝑇1 = Initial product in crates temperature, ℃
On the first day, the temperature will decline from 32℃ to 15℃ and therefore the field heat of
containers will be:
Q =3825 × 4.02(32 − 15)
3600 × 16= 4.504 kW
On the second day, the temperature will decline to 14℃ from 15℃ and therefore the field heat of
containers will be:
Q =3825 × 3.99(15 − 14)
3600 × 16= 0.265 kW
Heat loss through walls and roofs
In a storage chamber, there is heat transfer because of leakages between the outside air and inside
air through the walls and the roof as a result of the temperature gradient between the outside and
inside temperature and is computed from the equation:
Q =𝑘𝑘 × A(T2 − T1)
x (7.3)
Where: k = Thermal conductivity [W.𝑚𝑚−1.𝐾𝐾−1],

212
A = Surface area [ 𝑚𝑚2],
𝑥𝑥 = Thickness of insulation material [m],
T2 = Storage temperature of products in crates[℃ ], and
𝑇𝑇1 = Initial product in crates temperature [℃],
The walls are 2.0 m high and × 1.98m wide and 1.825m high x 1.98m long the roof is 1.98 m wide
× 2.0 m length. The insulation material is polyurethane with thermal conductivity of 0.026
W.𝑚𝑚−1. 𝐾𝐾−1 and the thickness of the insulation is 60 mm.
𝐴𝐴𝑏𝑏𝐷𝐷𝑙𝑙 𝑙𝑙𝑜𝑜 𝑏𝑏𝑙𝑙𝑙𝑙𝑜𝑜 + 𝑃𝑃𝑙𝑙𝑙𝑙𝑙𝑙𝐷𝐷 = (6𝑚𝑚 × 4𝑚𝑚) + (6𝑚𝑚 × 2.4 𝑚𝑚 × 2) + (4𝑚𝑚 × 2.4𝑚𝑚 × 2 ) = 72 𝑚𝑚2
Q =0.026 × 72(32 − 15)
0.05= 0.637 kW
Heat loss through floor area
The heat loss through the floor is given by the formula according to Albright (1990).
𝑄𝑄𝑓𝑓 = 𝐹𝐹𝐹𝐹(𝑇𝑇𝑜𝑜 − 𝑇𝑇𝑖𝑖) (7.4)
Where F = perimeter heat loss factor [W.m-1. K-1], and
P = storage chamber perimeter [m], (Albright, 1990).
The perimeter heat loss factor of 1.6 W.m-1. K-1 is used. The perimeter, P of the floor is obtained
by the summation of the dimensions of the rectangular storage chamber as:
𝐹𝐹 = (𝐿𝐿𝐷𝐷𝑛𝑛𝑘𝑘𝐴𝐴ℎ(𝑚𝑚) × 𝑊𝑊𝐷𝐷𝑙𝑙𝐴𝐴ℎ(𝑚𝑚)) × 2 = (6 𝑚𝑚 × 2 𝐷𝐷𝐷𝐷𝑙𝑙𝐷𝐷𝐷𝐷) + (4 𝑚𝑚 × 2 𝐷𝐷𝐷𝐷𝑙𝑙𝐷𝐷𝐷𝐷) = 20 𝑚𝑚
With values F = 1.6 W.m-1. K-1 and P = 20m
𝑄𝑄𝑓𝑓 = 1.6 𝑊𝑊.𝑚𝑚−1.𝐾𝐾−1 × 20 𝑚𝑚 × (32 − 15) = 0.544 𝑘𝑘𝑊𝑊
Air infiltration
Air-change heat load rises from warm air entering the storage chamber every time the door is
opened. The temperature of such air has to be reduced to the storage temperature and any water
that condenses has to be compensated. The infiltration (air-change load) is the heat gain through

213
doorways from air exchange. In this study, the width of the door is 0.55 m and the height are 1.8
m. PVC will cover the door entrance.
Air change load:
𝐹𝐹𝑎𝑎 = 𝑚𝑚𝑎𝑎(ℎ𝑎𝑎 − ℎ) + 𝑚𝑚𝑤𝑤𝐶𝐶𝑝𝑝𝑤𝑤(𝑇𝑇𝑎𝑎 − 𝑇𝑇) (7.5)
Where Pa = air change load [W],
ma = mass of air entering the chamber every hour [kg. s-1],
ha = enthalpy of ambient air [kJ.kg-1],
mw = mass of water condensing in the chamber every hour [kg],
h = enthalpy of air in the storage chamber [kJ.kg-1],
Cpw = specific heat capacity of water [kJ.kg-1. ºC-1],
Ta = ambient air temperature [°C], and
T = air temperature inside the chamber [°C]
Assuming that ha = 50 kJ.kg-1,
𝑀𝑀𝑙𝑙𝐷𝐷𝐷𝐷 𝑙𝑙𝑜𝑜 𝐴𝐴𝐷𝐷𝑏𝑏 (𝑚𝑚𝑎𝑎) =𝑣𝑣𝑙𝑙𝑙𝑙𝐴𝐴𝑚𝑚𝐷𝐷 𝑙𝑙𝑜𝑜 𝐴𝐴ℎ𝐷𝐷 𝐷𝐷𝐴𝐴𝑙𝑙𝑏𝑏𝑙𝑙𝑘𝑘𝐷𝐷 𝐴𝐴ℎ𝑙𝑙𝑚𝑚𝑏𝑏𝐷𝐷𝑏𝑏
𝑆𝑆𝑂𝑂𝐷𝐷𝐴𝐴𝐷𝐷𝑜𝑜𝐷𝐷𝐴𝐴 𝑣𝑣𝑙𝑙𝑙𝑙𝐴𝐴𝑚𝑚𝐷𝐷 𝑙𝑙𝑜𝑜 𝑙𝑙𝑏𝑏𝑃𝑃 𝐴𝐴𝐷𝐷𝑏𝑏 × 3600𝐷𝐷 (7.6)
=53.4 𝑚𝑚3
0.874 𝑚𝑚3.𝑘𝑘𝑘𝑘−1 × 3600𝐷𝐷=
61.098 𝑘𝑘𝑘𝑘3600𝐷𝐷
(𝑚𝑚𝑤𝑤) = 𝐴𝐴𝐴𝐴𝑚𝑚𝐷𝐷𝑙𝑙𝐷𝐷𝐴𝐴𝑃𝑃 𝑏𝑏𝑙𝑙𝐴𝐴𝐷𝐷𝑙𝑙 × 𝑀𝑀𝑙𝑙𝐷𝐷𝐷𝐷 𝑙𝑙𝑜𝑜 𝑃𝑃𝑙𝑙𝐴𝐴𝐷𝐷𝑏𝑏 (7.7)
Maximum condensation occurs when temperature drops to wet bulb temperature of outside ambient
air at 17.7℃.
𝑚𝑚𝑤𝑤 =(12.7 − 7)𝑘𝑘.𝑘𝑘𝑘𝑘−1
3600 𝐷𝐷× 61.098 𝑘𝑘𝑘𝑘 = 0.0967 𝑘𝑘. 𝐷𝐷−1 = 9.67 × 10⁻⁵ 𝑘𝑘𝑘𝑘. 𝐷𝐷−1
𝑚𝑚𝑎𝑎(ℎ𝑎𝑎 − ℎ) = 0.01697 𝑘𝑘𝑘𝑘. 𝐷𝐷−1(50 − 20.5)𝑘𝑘𝑘𝑘.𝑘𝑘𝑘𝑘−1 = 0.5006 𝑘𝑘𝑊𝑊

214
𝑚𝑚𝑤𝑤𝐴𝐴𝑝𝑝𝑤𝑤(𝑇𝑇𝑎𝑎 − 𝑇𝑇) = 9.67 × 10⁻⁵ 𝑘𝑘𝑘𝑘. 𝐷𝐷−1 × 4.18 𝑘𝑘𝑘𝑘.𝑘𝑘𝑘𝑘−1℃−1(32 − 12)℃ = 0.0081 𝑘𝑘𝑊𝑊
𝐹𝐹𝑎𝑎 = 0.5087𝑘𝑘𝑊𝑊 ≈ 0.51 𝑘𝑘𝑊𝑊
Heat from operators and lights
The operators or people who pack and unpack tomatoes in the storage chamber release heat and
the lights, which are switched on during packing and unpacking of product. Miscellaneous heat
loads are the heat loads generated by labour, equipment such as fans, electric motor and lights.
Heat evolved by operators and lights is obtained by assuming that two operators will enter the
cooling chamber at a time as it is relatively small and the chamber will only have one light of 60
W. Each operator will spend four hours loading and unloading crates and one person produces
about 1000 kJ.hr-1.
𝑄𝑄𝑂𝑂&𝐿𝐿 = 𝑄𝑄 3600 ×𝑐𝑐
(7.8)
Q = Total amount of heat that lights and operators release in the chamber [kW], and
n = number of hours per day [hours],
Heat evolved by operators and lights is determined as:
𝐴𝐴𝐷𝐷𝑙𝑙𝐴𝐴 𝑘𝑘𝐷𝐷𝑛𝑛𝐷𝐷𝑏𝑏𝑙𝑙𝐴𝐴𝐷𝐷𝑙𝑙 𝑏𝑏𝑃𝑃 𝑙𝑙𝑂𝑂𝐷𝐷𝑏𝑏𝑙𝑙𝐴𝐴𝑙𝑙𝑏𝑏𝐷𝐷 𝑙𝑙𝐴𝐴𝑏𝑏𝐷𝐷𝑛𝑛𝑘𝑘 𝑂𝑂𝑙𝑙𝐴𝐴𝑘𝑘𝐷𝐷𝑛𝑛𝑘𝑘 𝑙𝑙𝑛𝑛𝑙𝑙 𝐴𝐴𝑛𝑛𝑂𝑂𝑙𝑙𝐴𝐴𝑘𝑘𝐷𝐷𝑛𝑛𝑘𝑘 = 2 × 1000 × 4
= 8000 𝑘𝑘𝑘𝑘
𝑇𝑇ℎ𝐷𝐷𝑛𝑛 𝐴𝐴ℎ𝐷𝐷 𝑏𝑏𝑙𝑙𝐴𝐴𝐷𝐷 𝑙𝑙𝑜𝑜 ℎ𝐷𝐷𝑙𝑙𝐴𝐴 𝑏𝑏𝐷𝐷𝑚𝑚𝑙𝑙𝑣𝑣𝑙𝑙𝑙𝑙 =8000𝑘𝑘𝑘𝑘
16 × 3600= 0.14 𝑘𝑘𝑊𝑊
In addition, the heat due to lighting
𝐴𝐴𝐷𝐷𝑙𝑙𝐴𝐴 𝑙𝑙𝑜𝑜 𝐴𝐴ℎ𝐷𝐷 60𝑊𝑊 𝑏𝑏𝐴𝐴𝑙𝑙𝑏𝑏 = 60 𝑊𝑊 = 0.006 𝑘𝑘𝑊𝑊
Total heat due to lights and operators is:
Total heat due to lights and operators = 0.14 + 0.006 = 0.20 𝑘𝑘𝑊𝑊

215
Table 7.5 Maximum design cooling load
Heat source Day 1 Day 2 Total
Sensible heat
(containers)
0.27 kW 0.016 kW 0.287 kW
Field heat (tomatoes) 4.504 kW 0.265 kW 4.769 kW
Heat of respiration 0.577 kW 0.319 kW 0.896 kW
Wall and roof heat gain 0. 637 kW 0. 637 kW
Floor heat gain 0. 544 kW 0. 544 kW
Air-change load 0.509 kW 0.509 kW
Lights 0.06 kW 0.06 kW
Labour 0.14 kW 0.14 kW
Fan 0.38 kW 0.38 kW
Total 8.22 kW
The same procedure was used to calculate the heat load when the storage chamber is filled to one
third of its capacity on the first day. Table 7.6 shows the cooling loads for one-third capacity.
Table 7.6 Cooling load at one-third capacity
Heat source Day 1 Day 2 Total
Sensible heat (containers) 0.090 kW 0.005 kW 0.095 Kw
Field heat (tomatoes) 1.501 kW 0.088 kW 1.589 kW
Heat of respiration 0.192 kW 0.106 kW 0.298 kW
Wall and roof heat gain 0. 637 kW 0. 637 kW

216
Floor heat gain 0. 544 kW 0. 544 kW
Air-change load 0.509 kW 0.509 kW
Lights 0.06 Kw 0.06 kW
Labour 0.14 Kw 0.14 kW
Fan 0.38 Kw 0.38 kW
Total 4.252 kW
Design load = 1.1 × Actual load (Thompson, 2004), therefore design load is calculated as:
𝐷𝐷𝐷𝐷𝐷𝐷𝐷𝐷𝑘𝑘𝑛𝑛 𝑙𝑙𝑙𝑙𝑙𝑙𝑙𝑙 = 1.1 × 4.252 𝑘𝑘𝑊𝑊 = 4.677 𝑘𝑘𝑊𝑊
7.6 APPENDIX 7.6: Determination of ventilation rate and fan selection Mechanical ventilation systems using fans and air inlets and outlets are required for temperature
regulation in the storage chamber. In the psychrometric unit, the fan attached to the indirect heat
exchanger evaporates water from the cooling pads by blowing air across the pads thus creating an
evaporative cooling effect. The second ventilation fan at the inlet of the storage chamber blows out
warm and wet air whilst introducing cool and dry fresh air. The ventilation rate 𝑉𝑉 is calculated
from equation 7.9.
𝑉𝑉 = 𝑞𝑞𝑝𝑝
1006𝜌𝜌𝑎𝑎𝑖𝑖𝑐𝑐(𝑇𝑇𝑜𝑜 − 𝑇𝑇𝑖𝑖) (7.9)
Where V = ventilation rate required [m3. s-1],
ρair = density of air [kg.m-3],
To = outside air temperature [°C], and
Ti = inside air temperature [°C],
𝑉𝑉 =4677 𝑊𝑊
1006 × 1.105 × (32 − 14) = 0.234 𝑚𝑚3. 𝐷𝐷−1

217
Fan selection for storage chamber
Using a ventilation rate of 0.234 m3. s-1 a 308,7/6-6/P3HL/25/PA @1.440min-1 @ 100%
Immersion fan was selected that provides an air-flow rate of 0.278 m-3s-1 at static pressure of 68.27
Pa with a power rating of 0.290 kW and air velocity of 3.6 m. s-1. Its performance curve is shown
in Figure 7.5 below.
Figure 7.5 Performance curve for evaporative cooling fan
7.7 APPENDIX 7.7: Evaporative cooling pads design The amount of cooling required, the required airflow rate and the air velocity have already been
determined in Appendix 7.4 and Appendix 7.5 and face velocity was obtained from literature. To
size the cooling pads equation 7.10 determines the area of cooling pads:
𝐴𝐴𝑝𝑝 = 𝑄𝑄 𝑣𝑣
(7.10)
Where Ap = cooling pad area [m2],
Q = volumetric flow rate [m3. s-1], and
v = recommended face velocity [m.s-1].
0 05 , 0 1 , 0 15 , 0 2 , 0 , 25 0 0 3 , 0 35 , , 0 4 0
20 40 60 80
100 120 140 160 180
0 0 , 04
08 0 , 12 , 0
0 16 ,
Pw (1) ηtot (1)
pst (1)
Pressure (p) [Pa]
Air flow (Q) [m³/s]

218
Assuming a face velocity of 1.5 m. s-1 and a cooling pad thickness is 0.15 m. In Appendix 7.5, Q
was determined as 0.234 m3. s-1.
𝐴𝐴 =0.234 𝑚𝑚3. 𝐷𝐷−1
1.5 𝑚𝑚. 𝐷𝐷−1= 0.156 𝑚𝑚2
The available cooling pads are size standardized with options of choosing from: Height: (500 mm,
600 mm, 900 mm,1000 mm) +(30 mm height Water distribution pad), Width: (300 mm, 600 mm)
and Thickness: (50 mm, 75 mm, 100 mm, 150 mm). From the available cooling pad sizes the
smallest option will provide 0.5 m x 0.3 m = 0.15 m2 which is very close to what is required.
Alternatively using coal that was readily available
𝐼𝐼𝑜𝑜 𝐷𝐷𝐴𝐴 𝐷𝐷𝐷𝐷 𝑙𝑙𝐷𝐷𝐷𝐷𝐴𝐴𝑚𝑚𝐷𝐷𝑙𝑙 𝐴𝐴ℎ𝑙𝑙𝐴𝐴 𝐴𝐴 = 𝐿𝐿 × 𝑊𝑊 7.11
Where L = length of cooling pad [m], and
W = width of cooling pad [m].
In choosing square shaped cooling pads implies that the length and width are the same
𝑇𝑇ℎ𝐷𝐷𝑛𝑛 𝐿𝐿 = 𝑊𝑊 = �0.156 𝑚𝑚2 = 0.395 𝑚𝑚 ~0.40 𝑚𝑚
The pad volume and amount of charcoal required, assuming a bulk density of charcoal of 200 kg.m-3 are derived from equations 7.12 and 7.13:
𝑉𝑉 = 𝐴𝐴 × 𝐴𝐴 (7.12)
Where V = volume of each cooling pads [m3],
A = air flow area [m2], and
t = thickness of the cooling pads [m].
𝑉𝑉 = 0.156 𝑚𝑚2 × 0.15 𝑚𝑚 = 0.0234 𝑚𝑚3
Mass of charcoal per cooling pad is given by equation 7.13:
𝑚𝑚 = 𝑉𝑉 × 𝜌𝜌 (7.13)
Where m = mass of charcoal per cooling pad [kg]
V = volume per cooling pad [m3]
ρ = bulk density of charcoal [kg.m-3]
𝑚𝑚 = 0.0234 𝑚𝑚3 × 200 𝑘𝑘𝑘𝑘.𝑚𝑚−3 = 4.68 kg

219
7.8 APPENDIX 7.8: Determination of head losses and pump selection Centrifugal pumps deliver water to the cooling pads. Centrifugal pumps handle small discharges
and small heads such as the discharge found for this evaporative cooling unit. The required
discharge was 0.115 m3.hr-1 and the total head against which the pump must discharge was 3.33 m
and a net positive suction head of 8.31 m. The power requirement for the pump was determined as
0.072 kW. From these specifications, the smallest pump in the local market satisifying the
requirements were Pedrollo PVm 55 centrifugal pump supplied complete with a 0.26 kW motor.
The total head against which the pump must discharge
𝐴𝐴𝑇𝑇 = 𝐴𝐴𝑆𝑆 + 𝐴𝐴𝐹𝐹𝑆𝑆 + 𝐴𝐴𝐷𝐷 + ℎ𝐹𝐹𝐷𝐷 + 𝐴𝐴𝐸𝐸𝐸𝐸 (7.14)
Where HT = total head against which the pump must discharge [m],
HS = static suction lift [m],
hFS = head loss due to friction in the suction pipe [m],
HD = static delivery lift to the discharge point into the water distribution bath at the top of the cooling pads [m],
hFD = friction losses in the delivery pipe [m], and
HEX = Pressure loss in the heat exchanger [m]
Discharge = 0.117 m3.hr-1,
HS = 0.72 m,
HD = 1.1 m (maximum),
hFD = 50 Pa. m-1 for a 15 mm pipe delivering 0.117 m3.hr-1 (Figure 7.3) and delivery pipe length is 3.3 m.
ℎ𝐹𝐹𝐷𝐷 = 50 𝐹𝐹𝑙𝑙.𝑚𝑚−1 × 3.3 𝑚𝑚 ×10 𝑚𝑚
100 000= 0.0165 𝑚𝑚
hFS = 50 Pa. m-1 (from Figure 7.3) and suction pipe length is 0.7 m
ℎ𝐹𝐹𝑆𝑆 = 50 𝐹𝐹𝑙𝑙.𝑚𝑚−1 × 0.7 𝑚𝑚 ×10 𝑚𝑚
100 000= 0.0035 𝑚𝑚
HEX = 0.7 m (From Table 7.3) Specifications for Lytron Heat Exchangers)

220
The pump head losses are summarized in Table 7.7.
Table 7.7 Pump head losses
Component Head loss (m)
Heat exchanger 0.7
Delivery pipe friction 0.0165
Static delivery lift 1
Suction pipe friction 0.035
Suction pipe lift 0.7
Total head loss 2.5 m
Net positive suction head for the pump (NPSH) available:
𝑁𝑁𝐹𝐹𝑆𝑆𝐴𝐴𝑎𝑎𝐼𝐼𝑎𝑎𝑖𝑖𝑐𝑐𝑎𝑎𝑏𝑏𝑐𝑐𝑐𝑐 = ℎ𝑝𝑝− ℎ𝑓𝑓 − ℎ𝐼𝐼𝑝𝑝−ℎ𝑝𝑝 (7.15)
Where hd = atmospheric pressure [m],
hf = suction line losses [m],
hvp = vapour pressure of water [m], and
hs = static suction head [m]
At Pietermaritzburg elevation of 750 m, hd = 9.4 m and hvp = 0.32 m for water at 25 °C.
𝑁𝑁𝐹𝐹𝑆𝑆𝐴𝐴𝑎𝑎𝐼𝐼𝑎𝑎𝑖𝑖𝑐𝑐𝑎𝑎𝑏𝑏𝑐𝑐𝑐𝑐 = 9.4 𝑚𝑚 − 0.075 𝑚𝑚− 0.32 𝑚𝑚 − 0.7 𝑚𝑚 = 8.31 𝑚𝑚
Pump Power Requirements
𝐹𝐹 =𝜌𝜌 × 𝑘𝑘 × 𝐴𝐴 × 𝑄𝑄
36 000 × 𝜂𝜂 (7.16)
Where P = pump power requirement

221
ρ = density of water (kg.m-3)
g = acceleration due to gravity (kg.m. s-2)
H = head required (m)
Q = flow discharge (m3.hr-1)
η = pump efficiency,
η = 0.84
𝐹𝐹 = 1000 × 9.81 × 2.3 × 0.115
36 000 × 0.84= 0.086 𝑘𝑘𝑊𝑊
The pump selected was a Pedrollo PVm 55.
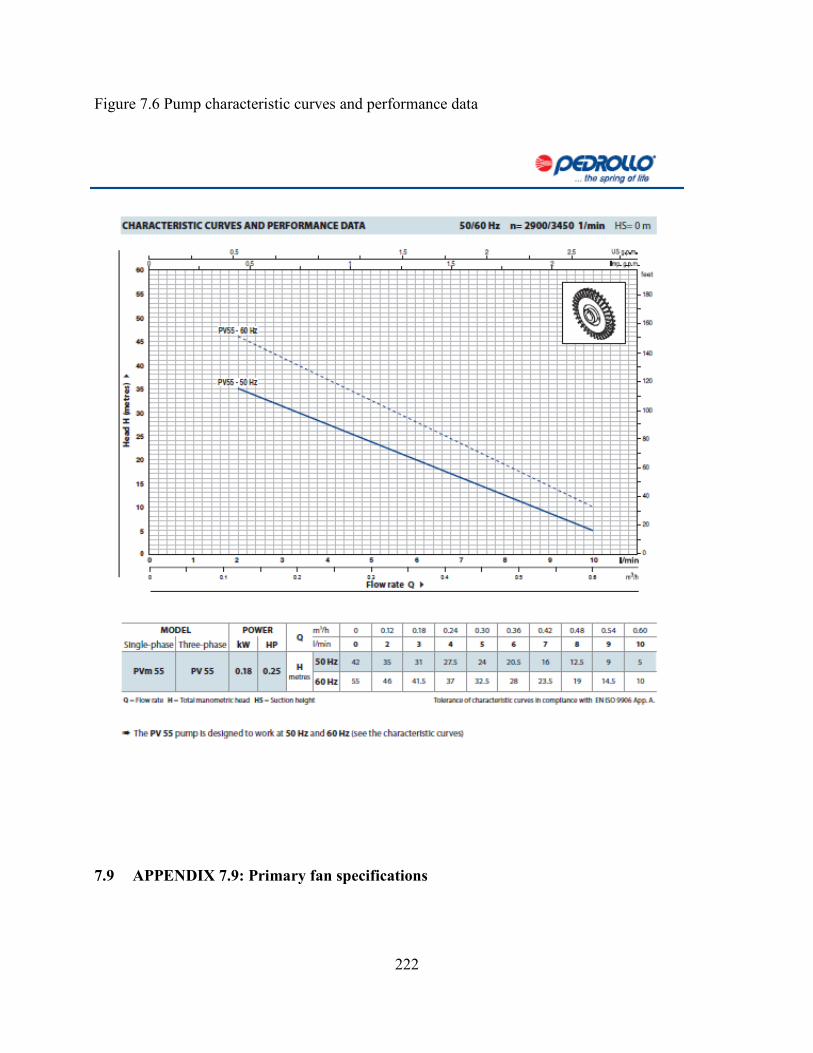
222
Figure 7.6 Pump characteristic curves and performance data
7.9 APPENDIX 7.9: Primary fan specifications

223
A fan with the specifications shown in Table 7.8 was mounted on the storage chamber with the
centre at 492.5 mm above the floor and 2.252 m from the far-left end corner.
Table 7.8 Primary Fan Specifications
Economy Code Power Rating
(kW)
Flow Rate
(m3. s-1)
Size (mm)
H × W × Ø Grill Code
OW354 0.12 0.25 340 × 340 × 260 OW595
Unlike the rest of the psychrometric unit components, the fan was directly mounted on the storage
chamber after which the psychrometric unit was aligned and attached to the side of the storage
chamber. The primary fan was working on the South African standard frequency and voltage (50
Hz, 220 volts) while a transformer was necessary for the secondary fan to drop the voltage from
240 V to 220 V.
7.10 APPENDIX 7.9: Heat exchanger design calculations The following image shows the enclosure for the heat exchanger and the cooling pads.
The psychometrics unit tunnel constructed from M14-20 indirect heat exchanger and three direct
cooling pads (Pad 1, 2 and 3) (a) structural schematic, (b) arrangements
𝑄𝑄 = 𝑈𝑈𝐴𝐴∆𝑇𝑇 = ṁ𝐶𝐶𝑝𝑝(𝑇𝑇𝑎𝑎𝑖𝑖 − 𝑇𝑇𝑎𝑎𝑜𝑜) (7.17)
ṁ =𝑉𝑉𝜌𝜌
(7.18)
Where V = required ventilation rate [m3. s-1],
ρ = density of air [kg.m-3],
Cp = specific heat capacity of air at inlet [kJ.kg-1. ℃-1],
Tai = temperature of air at the inlet section of the heat exchanger [℃],
Tao = desired temperature of exiting air [℃], and

224
ṁ = mass flow rate of air [kg. s-1]
ρ = 1.020 kg.m-3
Cp= 1.006 kJ.kg-1. ℃-1
V = 0.234 m3. s-1
Tai-Tao = 32℃ - 25℃ = 7℃
Q = 0.234 m3s−1 × 1.020 kg. m−3 × 1006 J. kg−1.℃−1 × 7 ℃
= 1681 W
The heat exchanger was selected according to the heat exchanger selection procedure for Lytron
heat exchangers (Figure 7.6).
𝑄𝑄𝐼𝐼𝑇𝑇𝐷𝐷
= 1342 𝑊𝑊
(32 − 25)℃= 192 𝑊𝑊.℃−1
Where ITD = initial temperature difference (inlet air temperature – inlet water temperature). From
Lytron heat exchanger catalogue specifications in Figure 7.6, model number M14–120 was
selected. From the performance graphs for M14 - 120 in Figure 7.6, the pressure drop of water
flowing in the heat exchanger was found to be 0.7 m.

225
Figure 7.7 Selection procedure for Lytron heat exchanger