Embed Size (px)
Citation preview

Development of a regenerative friction model to enhance braking simulation with the multibody software VOCO
Moncef ToumiResearch Engineer, Railenium
Michel Sebès1, Karl Laden2, Hugues Chollet1, Mohammed Bouallaga3
IFSTTAR1, Bombardier Transportation2, Railenium3
Join the conversation on Twitter at #EuroBrake19
Contents
o Introduction
o Proposed model
o Simulation results
o Conclusion
#EuroBrake19 2

Contents
o Introduction
o Proposed model
o Simulation results
o Conclusion
#EuroBrake19 3

Introduction
A WSP device shall : Minimize the stopping distance Avoid wheel blocking Minimize extensive wheel slide Minimize wheel and rail damage
Braking tests are necessary for : Wheel Slide Protection (WSP)
device certification Vehicle homologation
On-bench tests could be used to : Reduce the number of real braking tests Reduce the cost for vehicle homologation Optimization of parameter sets before real testing
#EuroBrake19
UIC and EN Standards
DynamicBraking test
WSP certification and Vehicle Homologation
DynamicBraking test
Delivery
On-benchtest +
4

IntroductionStandards to respect for WSP tests : EN15595 and UIC541-05 3rd ed
Co-simulation in a Hardware In the Loop (HIL) environment Allows to test full WSP device Hardware components
(WSP CU, speed sensors, dump valve,…) Wheelset speeds and braking efforts are exchanged
in real time between the WSP device and the simulator
The Simulator need to reproduce : Vehicle dynamics behavior Wheel-rail contact Adhesion coefficient 𝜇 ….
#EuroBrake19
Source : UIC 541-05 3rd ed.
Depends on :• Distance• Time• Slide• Vehicle speed• Temperature
5
ED b
rake
forc
e+

IntroductionAdhesion coefficient in braking simulation
#EuroBrake19
𝜇 = 𝑓(𝑥, 𝑡, 𝑠, 𝑉, 𝑇)
Time t : Adhesion recovery
Slip s : Falling friction
Rail
First wheelset
Third body layer
Rolling direction
- Wheel self cleaning- Rail cleaning Adhesion recovery
Need to be estimated from measurements
Position 𝒙 : initial rail conditions
V : Train Velocity
[O. Polach, 2005]
6

IntroductionThe multibody software VOCO
VOCO is the simulator chosen in this project to simulate train braking
Historically developed by IFSTTAR railway dynamic team and recently acquired by ESI Group
Classically used to study longitudinal and lateral train dynamics (critical speed, derailment,…)
Very good performance for real time simulation (important for simulation using a HIL procedure)
Allow to use variable adhesion coefficient in distance but not in time Adhesion recovery due to axle sliding is generally neglected.
VOCO performances were evaluated during a benchmarking campaign in the French project CERVIFER and during an international benchmarking campaign [1]
#EuroBrake19 7
[1] : Qing Wu et al., International benchmarking of longitudinal train dynamics simulators : results

Contents
o Introduction
o Proposed model
o Simulation results
o Conclusion
#EuroBrake19 8

Axle iAxlei+1
Braking performances(Braking distance, velocities…)
Distance
𝜇𝑚𝑎𝑥
𝜇0
Liquid film
Rail
Proposed modelGeneral resolution in VOCO and WSP algorithm
#EuroBrake19
Initial setting (Vehicle model, trackgeometry, initial speed, initial adhesion,…)
Multibodysoftware VOCO Software : Simplified WSP
algorithm
Calculate contact forces
Calculate axles and train velocities
Loo
p in
tim
e
Parameters of co-simulation and WSP system
Torques
Dynamic resolution
WSP system
velocities
Calculate recovered adhesionbetween wheel and rail
𝜇 = 𝜇max + 𝜇0 − 𝜇max 𝑒−𝑃𝑃0
𝜇0 : initial adhesion𝜇max : maximum adhesion limit𝑃0 : parameter of the model (regeneration rate)
Update adhesion 𝜇
Dissipated power at contacts
𝑃 = (𝐹𝑥𝜈𝑥 + 𝐹𝑦𝜈𝑦). 𝑉
𝐹𝑥 : longitudinal force𝐹𝑦 : transverse force
𝜈𝑥, 𝜈𝑦 : creepages
V : train speed
Adhesion recovery model
9

Proposed modelInitial adhesion coefficient 𝜇0
Assumptions :• Sliding wheels• Same adhesion coefficient 𝜇0 at right and left wheel• Same static load 𝑄0 at right and left
FPD applied to first sliding axle :
#EuroBrake19
𝐽a 𝜔a = 𝐶𝐸𝐷 + 𝐶𝑏𝑠 − 𝑅0 𝐹𝑥r + 𝐹𝑥l
𝐶𝐸𝐷 : Torque due to electrodynamic brake𝐶𝑏𝑠 : Torque due to brake shoe
𝜔a =𝑑𝜔a
𝑑𝑡: Deceleration of first sliding axle
𝐽a = Inertial mass of first sliding axle𝑄0 = Static load per wheel for first sliding axle
𝑅0
𝐶𝑏𝑠 = 𝐹𝑡𝑅0
Forces and torques acting on driven axle
𝐹𝑡 = 𝜇𝑔𝑠𝐹𝑏𝑐
BC pressure
𝐶𝐸𝐷
Rolling direction
𝐹𝑥𝑟 = 𝐹𝑥𝑙 = 𝜇0𝑄0𝛍𝟎 =𝐶𝐸𝐷 + 𝐶𝑏𝑠 − 𝐽a 𝜔a
2 × 𝑅0𝑄0
10

Contents
o Introduction
o Proposed model
o Simulation results
o Conclusion
#EuroBrake19 11
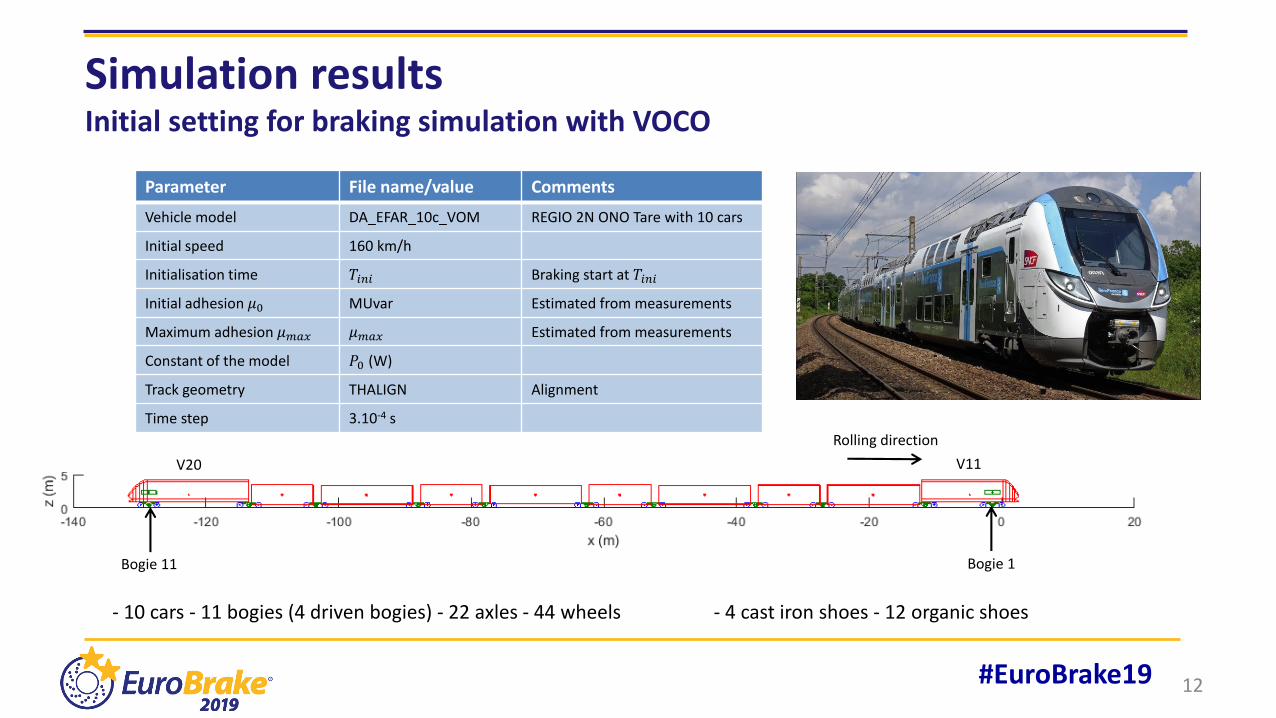
Simulation resultsInitial setting for braking simulation with VOCO
#EuroBrake19
Parameter File name/value Comments
Vehicle model DA_EFAR_10c_VOM REGIO 2N ONO Tare with 10 cars
Initial speed 160 km/h
Initialisation time 𝑇𝑖𝑛𝑖 Braking start at 𝑇𝑖𝑛𝑖
Initial adhesion 𝜇0 MUvar Estimated from measurements
Maximum adhesion 𝜇𝑚𝑎𝑥 𝜇𝑚𝑎𝑥 Estimated from measurements
Constant of the model 𝑃0 (W)
Track geometry THALIGN Alignment
Time step 3.10-4 s
- 10 cars - 11 bogies (4 driven bogies) - 22 axles - 44 wheels
Rolling direction
V11V20
- 4 cast iron shoes - 12 organic shoes
12
Bogie 1Bogie 11

Simulation resultsDry conditions at V=160 km/h – Axle speeds and braking distance
#EuroBrake19
- Very good agreement between simulation and measurement for braking distance and axle speeds- Useful to set a reference braking distance for simulations and tests with low adhesion (UIC541-05)
Braking distance=915 m Braking distance=929 m
< 2 % compared to measurement
𝜇=0.3
13

Simulation resultsWet conditions at V=160 km/h (6 % concentration soap - EN15595)– Axle speeds and braking distance
#EuroBrake19
- Good agreement between simulation and measurement for braking distance (<2%)- Same number of sliding axles (4 axles) but with different speed shapes due to different WSP algorithm- Need of a better WSP algorithm
Braking distance= 985 m Braking distance= 975 m
Simplified WSP algorithm
Real WSP device
P0=20 kW𝝁𝟎=variable𝝁𝒎𝒂𝒙=0.15
14

Simulation resultsWet conditions at V=160 km/h (6 % concentration soap - EN15595)– Axle speeds and braking distance with different WSP limits
#EuroBrake19
s1=5%s2=10%s3=20%s4=25%
s1=3%s2=7%s3=12%s4=15%
- Reducing sliding limits of the simplified WSP algorithm improves speed profiles leading to better agreement between simulation and measurement
- Lack of agreement when train speed becomes low
P0=20 kW𝝁𝟎=variable𝝁𝒎𝒂𝒙=0.15
15

Simulation resultsAdhesion recovery in dry and wet conditions at V=160 km/h– Braking distance
#EuroBrake19
- In dry conditions where adhesion coefficient is sufficiently high (when 𝜇>T/N according to Coulomb law), sliding between wheels and rail don’t occur and the amount of adhesion regeneration is very small
- Adhesion recovery don’t matter ! because initial adhesion is already high enough to prevent sliding
Stopping distance extension = 894 m
Same initial adhesion profile
- In wet conditions, adhesion is low leading to wheels sliding and high dissipated power at contact and high amount of adhesion regeneration
- Not using the adhesion recovery model leads to high braking surdistance- Adhesion recovery model is essential to simulate braking in presence of
low adhesion coefficient
Same braking distance with and withoutusing the adhesion recovery model
16

#EuroBrake19
P0=20 kW𝜇max=0.15
Simulation resultsWet conditions at V=160 km/h – Adhesion recovery (rail cleaning)
Start of braking
17
- Adhesion recovery model is activeonly when braking start
- Final adhesion profile might beused as initial adhesion for othersimulation

Simulation resultsWet conditions at V=160 km/h – Adhesion recovery (rail cleaning)
#EuroBrake19
P0=20 kW𝝁𝒎𝒂𝒙=0.15
- With current parameter set, the contribution of 8axles in the « rail cleaning process » is sufficientto reach saturation
𝝁𝒎𝒂𝒙 = 𝟎, 𝟏𝟓
18

#EuroBrake19
Simulation resultsWet conditions at V=160 km/h – Adhesion recovery : Effect of P0 parameter with constant 𝝁𝐦𝐚𝐱=0.15
P0=20 kW
Medium amount of regeneration(only 5 axles are participating inthe cleaning process)
Small amount of regeneration(No adhesion recovery at all)
High amount of regeneration(First axle completely recoveradhesion to 𝜇max=0.15)
P0= 2000 kW P0=2 kW
19

Contents
o Introduction
o Proposed model
o Simulation results
o Conclusion
#EuroBrake19 20

Conclusion
- New method is proposed to model low adhesion recovery (rail cleaning) during braking (or traction) using few parameters
- The adhesion recovery model improves considerably braking simulation in low adhesion
- The agreement between calculation and measurement can be improved by using a better WSP algorithm or real WSP device
- The self cleaning procured by the block shoes shall be considered
#EuroBrake19 21

Thank you for your attentionContact information :
#EuroBrake19
RaileniumMoncef Toumi([email protected])Mohammed Bouallaga([email protected])
IFSTTARMichel Sebès([email protected])Hugues Chollet([email protected])
Bombardier TransportationKarl Laden([email protected])
22

#EuroBrake19 23

IntroductionContact models and adhesion coefficient in multibody softwares
Most multibody softwares allow to use variable adhesion coefficient in distance but not in time Adhesion recovery due to axle sliding is generally neglected.
During braking (and traction), axle sliding can be high in low adhesion leading to wheels and rail cleaning.
In the multibody software VOCO, tangential contact forces are calculated using the Vermeulen & Johnson law in order to have better calculation time :
#EuroBrake19
t linF F
2
1 11 3
3 27
3
lin lin lin
n n n
linn
lin n
F F Fsi
F F F
FFsi
F F
24
The expressions of 𝐹𝑙𝑖𝑛 are fitted with FASTSIM and take into account the spin creepage

Proposed modelSimplified WSP algorithm* and torque calculation
#EuroBrake19
Start : GOTO State 1
1 Fill IF (slip > s2=10%) THEN GOTO State 2
2 Hold IF (slip < s1=5%) THEN GOTO State 1IF (slip > s4=25%) THEN GOTO State 3
3 Vent IF (slip < s3=20%) THEN GOTO State 2𝑠𝑙𝑖𝑝 =
𝑉𝑒ℎ𝑖𝑐𝑙𝑒 𝑣𝑒𝑙𝑜𝑐𝑖𝑡𝑦 − 𝑎𝑥𝑙𝑒 𝑣𝑒𝑙𝑜𝑐𝑖𝑡𝑦
𝑉𝑒ℎ𝑖𝑐𝑙𝑒 𝑣𝑒𝑙𝑜𝑐𝑖𝑡𝑦
Torque increase (Fill) : 𝐶 = 𝐶𝑙𝑖𝑚(1 − 𝑒−
𝑡
𝑇𝑜𝑖)
Torque decrease (Vent) : 𝐶 = 𝑒−
𝑡
𝑇𝑜𝑑
𝑅𝑠
𝑅0
𝐹𝑡 = 𝜇𝑔𝑑𝐹𝑏𝑐
𝐶𝑑𝑏 = 𝐹𝑡𝑅𝑠
𝑅0
𝐶𝑏𝑠 = 𝐹𝑡𝑅0
Driven axle Trailer axle
𝑪lim = 𝒎𝒂𝒙(𝑪𝑬𝑫 + 𝑪𝒃𝒔) 𝑪lim = 𝒎𝒂𝒙(𝑪𝒅𝒃)
𝐹𝑡 = 𝜇𝑔𝑠𝐹𝑏𝑐
𝐹𝑏𝑐 = f(BC pressure)
BC pressure
𝐶𝐸𝐷 = 𝐹𝐸𝐷𝑅0
Rolling direction
BC pressure and electrodynamicforce 𝐹𝐸𝐷 are given frommeasurements
Disc brakeBrake shoe
25
* Used for Shift2rail robin tests

Future workUsing real WSP device with a HIL procedure
#EuroBrake19
Initial setting (Vehicle model, trackgeometry, initial speed, initial adhesion,…)
Multibodysoftware VOCO
Braking performances (brakingdistance, axles velocities,…)
Simplified WSP algorithm=> Real WSP device
(Hardware)
Calculate contact forces
Calculate axles and train velocities
Loo
p in
tim
e
Parameters of co-simulation and WSP system
Torques
Dynamic resolution
WSP system
velocities
Calculate new adhesionbetween wheel and rail
𝜇 = 𝜇max + 𝜇0 − 𝜇max 𝑒−𝑃𝑃0
𝜇0 : initial adhesion𝜇max : maximum adhesion limit𝑃0 : parameter of the model
Dissipated power at contacts
𝑃 =
𝑖=1
𝑁𝐵
(𝐹𝑥𝑖𝜈𝑥𝑖)² + (𝐹𝑦𝑖𝜈𝑦𝑖)² ∙ V
𝐹𝑥 : longitudinal force𝐹𝑦 : lateral force
𝜈𝑥, 𝜈𝑦 : creepages
V : train speed
Adhesion recovery model
Source : UIC 541-05, 3rd ed. WSP test rig – class 1
26
Update adhesion 𝜇

Simulation resultsDry conditions at V=200 km/h – Axle speeds and braking distance
#EuroBrake19
- Very good agreement between simulation and measurement for braking distance and axle speeds
Braking distance=1409 m Braking distance=1430 m
< 2 % compared to measurement
𝜇=0.3
27

Simulation resultsWet conditions at V=160 km/h (6 % concentration soap - EN15595) – Deceleration profile
#EuroBrake19
P0=20 kW𝝁𝒎𝒂𝒙=0.15
- Good agreement between simulation and measurement for the deceleration profile
28


![REGENERATIVE BRAKING SYSTEM IN ELECTRIC VEHICLES · REGENERATIVE BRAKING SYSTEM IN ELECTRIC VEHICLES ... REGENERATIVE BRAKING SYSTEM ... Regenerative action during braking[9]](https://img.dokumen.tips/doc/110x75/5adccef67f8b9a1a088c7cf0/regenerative-braking-system-in-electric-vehicles-braking-system-in-electric-vehicles.jpg)