Embed Size (px)
Citation preview


DEVELOPMENT AND OPTIMIZATION OF
REFERENCE MEASUREMENT PROCEDURES
PhD thesis
Patricia Kaiser
INSTAND e.V
Düsseldorf, Germany
and
Department of Biochemistry
Albert Szent-Györgyi Medical Center
University of Szeged, Hungary
2006

This thesis is dedicated
to my son Marvin

LIST OF PUBLICATIONS RELATED TO THE THESIS
[I] Xie, Y., Zacharias, E., Hoff, P., Tegtmeier, F. Ion channel involvement in anoxic
depolarisation induced by cardiac arrest in rat brain. J. Cereb. Blood Flow Metab.,15,
587-594 (1995)
[II] Kress, M., Meißner, D., Kaiser, P., Hanke, R. Wood, W.G. Determination of
theophylline by HPLC and GC-IDMS, the effect of chemically similar xanthine
derivatives on the specificity of the method and the possibility of paracetamol as
interfering substance. Clin. Lab. 48, 541-551 (2002)
[III] Kress, M., Meißner, D., Kaiser, P., Hanke, R., Wood, W.G. The measurement of
theophylline in human serum or plasma using gas chromatography and isotope
dilution-mass-spectrometry (GC-IDMS) taking other substituted xanthines into
consideration. Clin. Lab. 48, 535-540 (2002)
[IV] Kress, M., Meißner, D., Kaiser, P., Wood, W.G. How to make things work again-
Troubleshooting using the GC-IDMS determination of triacylglycerols as an example.
Clin. Lab. 48, 635-646 (2002)
[V] Kaiser, P., Kramer, U., Meißner, D., Kress, M., Wood, W.G., Reinauer, H.
Determination of the cardiac glycosides digoxin and digitoxin by liquid
chromatography combined with isotope-dilution mass spectrometry (LC-IDMS) - a
candidate reference measurement procedure. Clin. Lab. 49, 329-343 (2003)
[VI] Kaiser, P., Akerboom, T., Wood, W.G., Reinauer, H. A novel LC-IDMS/MS method
for the determination of the cardiac glycosides digoxin and digitoxin using caesium
adducts. Clin. Lab. 52, 37-42 (2006)
[VII] Kaiser, P., Akerboom, T., Wood, W.G., Reinauer, H. A new approach for the
determination of immunosuppressive drugs using HPLC-MS/MS and Cs+ adducts.
Ger.Med.Sci.4: Doc01 (2006)

ACKNOWLEDGEMENTS
I would like to thank my supervisors Prof. Dr. Dux and Prof. Dr. Reinauer for giving me the
topic and opportunity to perform this study and for all their help during these years.
I am also grateful to Prof. Dr. Wood for all his useful advice and support during the
preparation of this thesis.
My thanks are due to my colleagues in the reference laboratory at INSTAND e.V. Udo
Kramer, Michael Kress, Dieane Meißner, Ulrike Speith, and Dr. Akerboom for their valuable
suggestions and support, and I express my thanks to Karin Schumann for help in preparation
of documents and presentation for publications and lectures.
Finally I like to thank my husband Dipl.-Ing. Christian Kaiser for all his support and
understanding patience.

TABLE OF CONTENTS
1. INTRODUCTION 1
2. AIMS AND SCOPE 7
3. MATERIALS AND METHODS 8
3.1 HPLC measurements 8
3.1.1 Measurement conditions for determination of glibenclamide 8
3.1.2 Measurement conditions for determination of theophylline 9
3.2 GC-MS measurements 9
3.2.1 Measurement conditions for determination of theophylline 9
3.3 LC-MS and LC-MS/MS measurements 11
3.3.1 Measurement conditions for determination of HbA1c 11
3.3.2 Measurement conditions for determination of digoxin and digitoxin 14
3.3.3 Measurement conditions for determination of sirolimus, everolimus,
tacrolimus, cyclosporin A 16
4. RESULTS AND DISCUSSION 19
4.1 Determination of glibenclamide by HPLC and fluorescence detection 20
4.2 Determination of theophylline by GC-IDMS and HPLC diode array
detection 21
4.3 Determination of HbA1c by LC-MS 25
4.4 Determination of digoxin and digitoxin by LC-MS and LC-MS/MS 35
4.5 Determination of sirolimus, everolimus, tacrolimus, cyclosporin A
by LC-MS/MS 41
5. SUMMARY 47
6. REFERENCES 50

LIST OF ABBREVIATIONS
amu atomic mass unit
EN European Norm
EQA External Quality Assessment
EQAS External Quality Assessment Schemes
GC Gas Chromatography
GC-IDMS Gas Chromatography-Isotope Dilution Mass Spectrometry
GC-MS Gas Chromatography- Mass Spectrometry
HbA1c Haemoglobin A1c
HbA0 Haemoglobin A0
HPLC High Performance Liquid Chromatography
IFCC International Federation of Clinical Chemistry and Laboratory
Medicine
IQA Internal Quality Assessment
ISO International Organisation for Standardization
IVDMD In Vitro Diagnostic Medical Device
JCTLM Joint Committee for Traceability in Laboratory Medicine
LC Liquid-Chromatography
LC-ESI-MS Liquid-Chromatography-Electrospray Ionisation-
Mass Spectrometry
LC-IDMS Liquid-Chromatography-Isotope Dilution Mass Spectrometry
LC-MS Liquid-Chromatography-Mass Spectrometry
LC-MS/MS Liquid-Chromatography-Mass Spectrometry/ Mass Spectrometry
MRM Multiple Reaction Monitoring
m/z mass-charge-ratio
RiliBÄK Richtlinien der Bundesärztekammer
Guideline of the Federal Medical Council for Quality Assurance
of Quantitative Analyses in Laboratory Medicine
psi pounds per square inch
SI International System of Units
SIM Selected Ion Monitoring
TFA trifluoroacetic acid

for API 4000 mass spectrometer :
CAD collisionally activated dissociation
CE collision energy
CID collision induced dissociation
CUR curtain gas
CXP collision cell exit potential
DP declustering potential
EP entrance potential
GS1 nebulizer gas
GS2 heater gas
ihe interface heater
IS ion spray voltage
TEM temperature
TERMS AND DEFINITIONS
analyte
component indicated in the name of a measurable quantity (ISO 18153: 2003)
accuracy of measurement
closeness of the agreement between the result of a measurement and a true value of a
measurand (ISO 17511:2003)
assigned value
value attributed to a particular quantity and accepted, sometimes by convention, as having
an uncertainty appropriate for a given purpose (EN 14136:2004)
bias
the difference between the expectation of the test results and a true value of the measurand
NOTE: An estimator is the “statistical sample bias of measurements” which is the “average
minus its reference value”. (ISO 171511:2003)
external quality assessment (=EQA)
determination of individual and collective laboratory performance, and performance
characteristics of examination procedures by means of interlaboratory comparison
(EN 14136:2004)

median
one type of average, found by arranging the values in order and then selecting the one in
the middle
precision of measurements
closeness of agreement between independent results of measurements obtained under
stipulated conditions
NOTE 1 Precision of measurement cannot be given a numerical value in terms of the
measurand , only descriptions such as “sufficient” or “insufficient” for a stated purpose.
NOTE 2 The degree of precision is usually expressed numerically by the statistical
measures of imprecision of measurements, such as standard deviation and coefficient of
variation, that are inversely related to precision.
NOTE 3 “Precision” of a given measurement procedure is subdivided according to the
specified precision conditions. “Repeatability” relates to essentially unchanged conditions and
is often termed “within-serial” or “within-run precision”. “Reproducibility” [between-run
precision] relates to changes in conditions, e.g. time, different laboratories, operators, and
measuring systems (including different calibrators and reagent batches) (ISO 17511:2003)
primary standard
standard that is designated or widely acknowledged as having the highest metrological
qualities and whose value is accepted without reference to other standards of the same
quantity (ISO 17511:2003)
reference interval (= biological reference interval)
central 95 % interval of the distribution of reference values (ISO 15189:2003)
reference material
substances which are used to obtain the metrological traceability, both through time,
distances, and different measurement procedures (ISO 15195:2005)
reference measurement procedure
thoroughly investigated measurement procedure shown to yield values having an uncertainty
of measurement commensurate with its intended use, especially in assessing the trueness of
other measurement procedures for the same quantity and in characterizing reference
materials (EN 14136:2004)

target value
accepted reference value (EN 14136:2004)
trueness of measurement
closeness of agreement between the average value obtained from a large series of results of
measurements and a true value of a measurand (ISO 15189:2003)
true value
value consistent of a definition of a given particular quantity. True values are by nature
indeterminate (ISO 17511:2003)
secondary standard
standard whose value is assigned by comparison with a primary standard of the same
quantity (ISO 17511:2003)
uncertainty of measurement
parameter associated with the result of a measurement, that characterizes the dispersion of
the values that could reasonably be attributed to the measurand (ISO 15189:2003);
the measurement uncertainty is inherent to the measurement procedure and shall be
distinguished from effects of mistake, that is a deviation from the prescribed procedure (ISO
15193:2005)
The uncertainty of measurement can be estimated by repeated measurements of a given
sample and the standard deviation estimated from the results.
Youden plot
graphical technique for comparing the between laboratory variability including the
acceptability criteria

Scan modi used with the mass spectrometer API 4000:
Q1 scan
a full scan using the first quadrupole (Q1); the ion intensity is returned for every requested
mass in the scan range
Q1 Multiple Ion scan (= SIM)
a scan using the first quadrupole (Q1); the ion intensity is returned for the specified point
mass
MRM (Multiple Reaction Monitoring) scan
mode of operating a triple quadrupole instrument so that an ion of given mass (Q1) must
fragment or dissociate to give a product ion of specific mass (Q3) for a response to be
detected; it is used for a very specific target compound analysis
Product Ion scan
a MS/MS full scan where the first quadrupole (Q1) is fixed to transmit a specific precursor ion
and the third quadrupole (Q3) sweeps a mass range; it is an experiment that will search for
all of the products of a particular precursor ion.
Precursor Ion scan
a MS/MS scan where the third quadrupole (Q3) is fixed at a specified mass-to-charge ratio
and the first quadrupole (Q1) sweeps a mass range; it is a scan for the ion of a specific
mass-to-charge ratio that is generating a specific product ion.
Neutral Loss scan
MS/MS scan where both the first quadrupole (Q1) and the third quadrupole (Q3) sweep a
mass range, a fixed mass apart; a response is observed if the ion chosen by the first
analyzer fragments by losing the neutral loss specified.
1/53
1. INTRODUCTION
In the European Union harmonized regulations and rules for manufacturers and customers of
“in vitro diagnostic medical devices (IVDMD)” have been implemented. In this free and common
market, basic regulations have been issued in the “Directive 98/79/EC of the European
Parliament and of the Council on in vitro Diagnostic Medical Devices” [1]. The Common Market
is an “area without internal frontiers in which the free movement of goods, persons, services
and capital is ensured” [1]. The maintenance or improvement of a high level of health
protection is one of the main objectives. The access of products on this market – with the
exception of the analytes in Annex II of [1] – is in the hand of the manufactures who have to
follow a conformity assessment procedure and the rules for the affixing the CE-label on their
products (see Annex III in [1]). The “vigilance of the market” is left mainly to the organizers of
external quality assessment schemes. The relevant paragraph (Article 11, paragraph 2) clearly
expresses this new function of the External Quality Assessment Schemes (EQAS):
“Where a Member State requires medical practitioners, the medical institutions or the
organisers of external quality assessment schemes to inform the competent authorities of any
incidents referred to in paragraph 1, it shall take the necessary steps to ensure that the
manufacturer of the device concerned, or his authorised representative, is also informed of the
incident”.
In the “Essential Requirements” (Annex I of [1]) of the IVDMD-directive one regulation is of
special importance in the context of performance characteristics of IVDMDs, that is the
“traceability” of values.
“The traceability of values assigned to calibrators and/or control materials must be assured
through available reference measurement procedures and/or available reference material of a
higher order”.
Another definition of the traceability is given in the VIM [2]: “A property of the result of a
measurement or the value of a measurement standard whereby it can be related, with a stated
uncertainty of measurement to stated references, usually national or international measurement
standards, through an unbroken chain of comparisons”.
The whole process of traceability in laboratory analyses is demonstrated in figure 1.

2/53
Figure 1 Flowchart of the traceability of reference methods and routine methods to the highest
metrological order that is the SI units
The traceability of routine methods should be directly related to reference materials and
reference measurement procedure and finally to the SI units (figure 1). The traceability concept
is applied by using primary and secondary standards, reference measurement procedures and
certified reference materials (CRM). The manufacturers should calibrate their analytical systems
with reference measurement procedures and/or certified reference materials, thus getting a link
between IQA and EQA.
Based on the Article 11 of the IVDMD Directive a mandated European Standard EN 14136 [3]
was developed, where again the criteria for the evaluation of kits and instruments in EQAS have
been defined. In paragraph 6.1.3 of the EN 14136 the assigning of values in survey samples
should be traceable to a specific metrological level (as shown in EN ISO 17511: 2002"In vitro
diagnostic medical devices- Measurement of quantities in samples of biological origin-
Metrological traceability of values assigned to calibrators and control materials" [4] and EN ISO
18153: 2000 "In vitro diagnostic medical devices- Measurement of quantities in samples of
biological origin- Metrological traceability of values for catalytic concentration of enzymes
assigned to calibrators and control materials" [5]). The most accurate procedures to assign

3/53
common and reliable target values for quality control samples are the reference measurement
procedures.
In Germany the “Guideline of the Federal Medical Council for Quality Assurance of Quantitative
Analyses in Laboratory Medicine” [6] consequently requires the use of reference measurement
procedures for setting target values for a number of analytes, to ensure the comparability of
results in laboratory medicine.
The main characteristics of reference measurement procedures are described in the ISO
Standard 15193: 2005 "In vitro diagnostic medical devices- Measurement of quantities in
samples of biological origin- Presentation of reference measurement procedures" [7]. In the
introduction of this ISO Standard a definition is given for the use of reference measurement
procedures:
“Reference measurement systems are needed for producing useful and reliable results of
measurement, whether in science, technology, or routine service so as to be comparable and
ultimately traceable to measurement standards of the highest metrological level. Analytical
reference measurement procedures play a crucial role in this metrological system because they
can be used
- in assessing performance characteristics of measuring systems – comprising
measuring instruments, auxiliary equipment as well as reagents,
- in demonstrating the functional interchangeability of different routine measurement
procedures purporting to measure the same quality
- in assigning values to reference materials that are then used to purposes of
calibration or control of routine measurement procedures and
- in detecting analytical influence quantities in patient sample.”
Descriptions, definitions, and classifications of reference materials are given in the ISO Standard
15194- “In vitro diagnostics medical devices- Measurement of quantities in samples of biological
origin- Description of reference materials” [8].
According to this ISO Standard reference materials are “standards of highest metrological level "
and "are used to obtain this traceability, both through time, distance, and different
measurement procedures.”
The use of the reference materials can be used to establish the “unbroken chain of
comparisons”, required in VIM [2] and ISO Standards [4]. The requirements for reference
laboratories to fulfil the criteria of the reference measurement system are defined in the ISO

4/53
Standard 15195- “Laboratory Medicine- Requirements for reference measurement laboratories”
[9].
Summarizing, the advantages of using reference measurement procedures for setting target
values are:
1. There is only one target value for each analyte in an EQA sample.
2. The results between different methods and laboratories are directly comparable.
3. There will be uniform reference intervals in a population for the analytes in all
laboratories.
4. An analytical basis of international epidemiological studies is given.
5. Methods with the highest accuracy are favoured on the market.
6. Obsolete methods can be identified and eliminated.
Reference measurement procedures should be used
1) for the determination of target values for internal and external quality control
samples
2) for calibrating of kits and instruments
3) to get identical reference ranges for a defined population in all laboratories
4) for evaluation of the performance of in-vitro diagnostic medical devices
5) to establish a basis for the comparability of results of epidemiological studies
According to the ISO Standards 17025 [10] the development of reference measurement
procedures is a dynamic process with continuous quality improvement. For reference
measurement procedures it is desirable to use measurement systems of highest quality and
performance. Therefore, established reference measurement procedures should be continously
evaluated and optimized or replaced if necessary by a new method, if better analytical
equipments, methods or materials are available. This continuous process of improvement in
analytical quality is one basic principle of quality management in medical laboratories and also
the aim of this study.
In the ISO Standard 15193 [7] a reference measurement procedure is defined as a “thoroughly
investigated measurement procedure shown to yield values having an uncertainty of
measurement commensurate with its intended use, especially in assessing the trueness of other
measurement procedures for the same quantity and characterizing reference materials”.

5/53
Unfortunately, the ISO Standard does not define the main features of a candidate and an
accepted reference measurement procedure. An essential requirement of an accepted reference
measurement procedure is that the procedure is confirmed by international intercomparison
studies (see JCTLM and IFCC Working Group on Standardization of HbA1c).
In contrast to reference measurement procedures routine methods used in the clinical
laboratories are mostly designed for a high throughput of analyses combined with a short
turnaround time at acceptable costs and performance. The continuous process of improvement
in analytical quality is also an important strategy for routine measurement procedures.
Examples for the progression in analytical quality are the optimization of the reference
measurement procedure for triacylglycerols [IV] and the method development for determination
of glibenclamide and theophylline in biological matrices [11,I,II,III].
In our reference laboratory 31 reference measurement procedures have been established and
are in use. This analytical program covers the requirements of the actual “Guideline of the
Federal Medical Council for Quality Assurance of Quantitative Analyses in Laboratory Medicine”
[6].
The analytical principles of the reference measurement procedures are listed in table 1.
analytical principle analyte
coulometry chloride
flame emission photometry Na+, K+
atomic absorption spectrometry Ca++, Mg++, Li+
photometry total protein, albumin, phosphate, bilirubin
enzyme-kinetic measurement ALT, ASAT, CK, -GT, LDH
GC-MS glucose, cholesterol, creatinine, triglycerides,
theophylline, steroid hormones (cortisol,
17 -oestradiol, progesterone, aldosterone,
testosterone) thyroxine, uric acid, urea
LC-MS and LC-MS/MS digoxin, digitoxin, HbA1c
Table 1 Analytical principles of reference measurement procedures

6/53
These reference measurement procedures are used for the determination of target values in
the EQAS in several countries. The fundamental difference of this evaluation procedure from
the “consensus value principle” is that the same target values with the same acceptability range
are set for all laboratories and by this way comparable results are collected in laboratory
medicine. The reliability of the reference measurement procedure must be permanently
controlled and continuously evaluated with the effect, that the reference measurement
procedures are dynamic, because of this continuously evaluation and improvement process.
Manufacturers are carefully observing the performance of the reference measurement
procedures and the results of their customers in the EQAS.
The Federal Medical Council of Germany favours the development of reference measurement
procedures. These are enclosed in the Guideline of the Federal Medical Council for Quality
Assurance of Quantitative Analyses in Laboratory Medicine [6].
This strategy promoting the comparability of laboratory analyses at the highest level of
accuracy supports the high quality of patient care and reduces costs in the health care system.

7/53
2. AIMS AND SCOPE
The aim of this study was to improve the quality of the medical laboratory performance by
providing reference measurement procedures for several analytes for internal and external
quality assessment. The study focused on the implementation, improvement and evaluation of
existing reference measurement procedures and the development of new reference
measurement procedures using GC-MS and LC-MS.
The Guideline of the Federal Medical Council for Quality Assurance of Quantitative Analyses in
Laboratory Medicine of Germany requires reference measurement procedures for setting target
values for selected analytes in internal and external quality control. Following the Guideline this
study deals with the reference measurement procedures for HbA1c, theophylline, digoxin,
digitoxin, and additionally for glibenclamide, and immunosuppressive drugs.
A highly sensitive method for determination of glibenclamide has been developed in my diploma
thesis [11] and was used for drug monitoring in the German Diabetes Research Institute and
for preclinical studies [I]. On the basis of this method a reference measurement procedure is on
the way to be established, which will then be used for setting target values in the new EQAS.
The reference measurement procedure for theophylline has been evaluated and established in
our laboratory and is used in our EQA schemes for determination of the target values [II,III].
The reference measurement procedure for HbA1c had been developed in an international
cooperation [12]. This reference measurement procedure has been improved through extensive
evaluation with different mass spectrometers. The use of this modified reference measurement
procedure is demonstrated in international intercomparison studies and in EQAS.
For digoxin and digitoxin a new reference measurement procedure has been developed. With
this method a new analytical principle in LC-MS/MS is introduced, by means of quantitative
analysis of Cs+ adducts, both in SIM and in MRM mode [V,VI].
The measurement of Cs+ adducts in LC-MS/MS described here is a new principle in the
determination of immunosuppressive drugs (sirolimus, everolimus, tacrolimus, and cyclosporin
A). This new method has been established in this study and will be a solid basis for the
development of an accepted reference measurement procedure [VII].

8/53
3. MATERIALS AND METHODS
3.1 HPLC measurements
3.1.1 Measurement conditions for determination of glibenclamide [I]
The HPLC system was from Merck Hitachi (Merck, Darmstadt, Germany), consisting of an L-
6000 pump and an F-1050 fluorescence spectrophotometer. For sample injections a manual
injection system from Rheodyne (Rheodyne Europe GmbH, Bensheim, Germany) was used.
Chromatographic separation was performed with a LiChrospher Si 60 column, 4 x 250 mm, 10
µm from Agilent Technologies Deutschland GmbH (Böblingen, Germany).
Isocratic elution was performed by using a mobile phase consisting of 1-octanol/2-methoxy-2-
methylpropane/n-heptane (15:10:75; v/v/v). The flow rate was 2 ml/min. The fluorescence detector
was set to the excitation wavelength of 450 nm and to the emission wavelength of 510 nm.
Sample preparation was performed as follows:
For extraction 1 ml serum was used and 200 ng of the 4-methylcyclohexyl analogue of
glibenclamide (N-4-beta-(2-methoxy-5-chlorobenzamido) -ethylbenzosulfonyl-N'- (4-methylcyclo-
hexyl)-urea) was added as internal standard. The pH of the sample was set to pH 3 by addition
of 1 mol/l HCl. 5 ml chloroform was added to the acidified sample.
The sample was shaken for about 3 min and then centrifuged for 5 min at 3000 x g. The
organic phase was evaporated to dryness under a stream of nitrogen. For derivatization the
residue was dissolved in 450 µl 7-chloro-4-nitrobenzo-2-oxa-1, 3-diazole (NBD-Cl) in a
concentration of 1 mg/ml 3-methyl-1-butanol. The solution was heated to 120 °C for 30 min.
After the derivatization the solution was evaporated to dryness and dissolved in elution
buffer/3-methylbutyl acetate (4:1, v/v) for HPLC injection.
For determination of glibenclamide in brain, the brain tissue of one rat was weighed, 100 ng
internal standard (N-4-beta-(2-methoxy-5-chlorobenzamido) -ethylbenzosulfonyl-N'- (4-methyl-
cyclohexyl)-urea) was added and the sample was homogenized in 2 ml perchloric acid (5 %
v/v) using an Ultra Turrax homogenizer (IKA-Werke GmbH & Co. KG, Staufen, Germany). The
sample was centrifuged (5 min, 3000 x g) and the supernatant was extracted with 5 ml
chloroform. Derivatization was performed as described for serum samples.
®

9/53
3.1.2 Measurement conditions for determination of theophylline [II]
The HPLC system used was from Merck Hitachi (Merck, Darmstadt, Germany), consisting of an
L-7100 pump, L-7200 autosampler and an L-7450 diode-array detector.
Chromatographic separation was performed with a Nautilus C18 column 4.6 x 250 mm, 5 µm
from Macherey und Nagel (Düren, Germany).
Isocratic elution was performed by using a mobile phase consisting of 0.02 mol/l acetate-
phospate buffer, pH 3.0 containing 9.6 % v/v acetonitrile. The run time was 10 min. The flow
rate was 0.9 ml/min. The injection volume was 10 µl.
The diode-array detector was set to 275 nm.
Sample preparation was performed as described in [II]. 1,3-dimethyl-7-(2-hydroxyethyl)-
xanthine was used as internal standard.
3.2 GC-MS measurements
3.2.1 Measurement conditions for determination of theophylline [III]
The following equipment was used for GC-MS measurements:
The gas-chromatograph was from Varian model 3400 (Darmstadt, Germany) coupled with a
mass spectrometer TSQ 7000 from Thermo Electron Corporation (Dreieich, Germany). The
injection system was a cold-start injector from Gerstel (Mülheim an der Ruhr, Germany).
Standard material of theophylline (declared purity 99 %) was purchased from Sigma-Aldrich
(Taufkirchen, Germany). 2-13C ,1,3-15N2-theophylline (declared purity 2-13C,99%;1,3-15N2 98%)
was obtained from Cambridge Isotope Laboratories (Andover, MA, USA)). Other chemicals were
purchased as described in [III].
Chromatographic separation was performed using a FS- Supreme-5 GC column from
Chromatography Service (Langerwehe, Germany) with a length of 30 m, an internal diameter of
0.25 mm and a film thickness of 0.25 µm. The temperature programmes of the GC and the
cold-injection system are shown in table 2:

10/53
Event Setting Gas chromatograph Setting Cold injection system
initial temperature [°C] 170 60
initial isothermal period [min] 5
programme rate [°C/min] 30 10
final temperature [°C] 300 280
final isothermal period [min] 3 1
Table 2 Temperature programme of the gas chromatograph and the cold injection system
The transfer line was set to 280 °C. The injection volume was 2 µl.
The settings of the TSQ 7000 mass spectrometer and the detection masses for theophylline and
the internal standard 2-13C ,1,3-15N2-theophylline are shown in tables 3 and 4.
Event Setting
filament 200 µA
multiplier 1500 V
scan time 0.5 s
scan width 0.4 amu
gas pressure 10 psi
Table 3 Settings of the TSQ 7000 mass spectrometer
analyte m/z [amu]
theophylline 237
2-13C ,1,3-15N2-theophylline 240
Table 4 Detection masses for theophylline and internal standard
Sample preparation and derivatization is described in [III].
The volume of serum and standards was adjusted to an amount of 5 µg theophylline in the
sample. By an iterative approach the internal standard 2-13C ,1,3-15N2-theophylline was added
giving the ratio of sample to internal standard of 1:1.

11/53
3.3 LC-MS and LC-MS/MS measurements
LC-MS and LC-MS/MS measurements were performed using the following equipment:
The HPLC system used was from Shimadzu (Duisburg, Germany) consisting of a SCL-10A
system controller, three LC-10AD vp pumps (A, B, C), a DGU-14A degasser; a SIL-10AD
autoinjector; a CTU-10AS column oven; and a FCU-12A Flow Switch (rotary valve)
The Mass Spectrometer was an API 4000 equipped with a TurboVTM ESI source with TurboIon
SprayTM probe from Applied Biosystems (MDS-Sciex, Darmstadt, Germany).
A syringe pump was used for optimization of the ESI source parameters (DP, EP, CUR, GS1,
GS2, TEM) during method development and for daily control of analytical sensitivity and for
determination of the accurate masses.
3.3.1 Measurement conditions for determination of HbA1c
The original reference measurement procedure for the determination of HbA1c in human blood
has been developed in collaboration with an international group of laboratories and has been
described in detail in [17].
The principle of measurement of the IFCC reference measurement procedure is based on the
determination of the ratio of glycated to non-glycated N-terminal hexapeptide of the -chain of
haemoglobin.
The method has three steps:
In the first step the whole blood sample is hemolysed. In the second step a proteolytic cleavage
of haemoglobin is performed.
For proteolysis the haemolysed sample is treated with endoproteinase Glu-C to cleave the
amino acid chain at the Glu-Glu positions. During the enzymatic cleavage of the -chain of
haemoglobin glycated and non-glycated N-terminal hexapeptides are generated.
In the third step the hexapeptides are separated chromatographically and measured by LC-ESI-
MS.
Quantification is performed by external calibration. For calibration six mixtures of
chromatographically purified HbA1c and HbA0 are analysed. For the calibration curve the ratio of
the concentration of HbA1c and HbA0 is plotted against the ratio of their peak areas. The
percentage of HbA1c in the sample can be calculated from the regression curve.

12/53
For proteolysis endoproteinase Glu-C (EC: 2326424) was purchased from Roche Diagnostics
(Penzberg, Germany). Calibrators and controls were delivered by the IFCC Working Group on
HbA1c Standardisation [18]. All reagents used for sample preparation and HPLC separation were
of supra pure quality.
The hexapeptides were separated by HPLC with a ZORBAX SB-CN column (2.1 x 150 mm, 5µm,
Axel Semrau GmbH, Sprockhövel, Germany).
The optimized conditions for determination of HbA1c were as follows:
Elution was performed by using a binary gradient consisting of eluent A (pump A): 0.07 % v/v
TFA in water and eluent B (pump B): 0.07 % v/v TFA in acetonitrile. The flow rate was 350
µl/min. The column temperature was 50 °C. In order to avoid contamination of the ESI source a
switching valve system (rotary valve A) was introduced. At position 0 of rotary valve A the eluate
was passed into the ESI source. At position 1 the eluate was discarded, during which the ESI
source is supplied with 50 % acetonitrile, delivered by pump C. The injection volume was 2 µl.
The HPLC conditions for determination of HbA1c, the settings of the API 4000 mass
spectrometer and, the detection masses in the Q1 multiple ion mode for the ß-N-terminal
hexapeptides of HbA1c and HbA0 are shown in tables 5, 6, and 7.
Time Module Events Setting
0.01 pumps % B 0
0.02 subcontroller rotary valve A 1
3.00 pumps % B 0
5.00 subcontroller rotary valve A 0
9.00 pumps % B 10
16.40 subcontroller rotary valve A 1
16.50 pumps % B 10
16.60 pumps % B 100
19.50 pumps % B 100
19.60 pumps % B 0
27.00 subcontroller rotary valve A 0
28.00 system controller stop
Table 5 HPLC conditions for determination of HbA1c

13/53
Event (program abbreviation) Setting
CUR 50.00
GS1 40.00
GS2 70.00
IS 5000.00
TEM 150.00
ihe ON
DP 30.00
EP 10.00
Table 6 Settings of the API 4000 mass spectrometer for Q1 multiple ion mode
analyte Q1 multiple ion
m/z [amu]
ß-N-terminal hexapeptide of HbA0 348.3
ß-N-terminal hexapeptide of HbA1c 429.3
Table 7 Detection masses in Q1 multiple ion mode for the ß-N-terminal hexapeptides
of HbA1c and HbA0
The MS detection of the hexapeptides was performed in the positive ion mode.
Lyophilised EQA samples were reconstituted according to the instruction of the sample
manufacturers. Samples, calibrators and controls and the protocol of measurement were
prepared according to the IFCC reference measurement procedure for HbA1c [17,18].
According to this reference measurement procedure for HbA1c the analyses were performed in
the following sequence:
calibrator A calibrator B calibrator C calibrator D calibrator E calibrator F
control A control B sample 1 to 10 control C control D
calibrator A calibrator B calibrator C calibrator D calibrator E calibrator F
All samples are injected in duplicate.
Four sequences of measurement are performed for setting one target value.

14/53
3.3.2 Measurement conditions for determination of digoxin and digitoxin [V,VI]:
Separation of the drugs was performed on a LiChrospher RP-18 column (5 µm, 125 x 2 mm)
equipped with a LiChrospher RP-18 pre-column (5 µm, 10 x 2 mm).
Standard material of digoxin (declared purity 99.8 %) and digitoxin (declared purity 99.0%)
were delivered by LGC Promochem GmbH (Wesel, Germany). Other chemicals were purchased
as described in [V,VI].
Elution was performed by using a binary gradient consisting of eluent A (pump A): 0.1 % v/v
formic acid in water + 100 µmol/l caesium hydroxide (adjusted to pH 7 with formic acid) and
eluent B (pump B): 0.1 % v/v formic acid in methanol + 100 µmol/l caesium hydroxide (adjusted
to pH 7 with formic acid). The flow rate was 300 µl/min. The column temperature was 40 °C. In
order to avoid contamination of the ESI source a switching valve system (rotary valve A) was
introduced. At position 0 of rotary valve A the eluate was passed into the ESI source. At
position 1 the eluate was discarded, during which the ESI source is supplied with 50 % CH3OH,
delivered by pump C. The injection volume was 10 µl.
The HPLC conditions for the separation of digoxin and digitoxin, the settings of the API 4000
mass spectrometer and, the detection masses in Q1 multiple ion mode and MRM mode of
native and deuterated glycosides are shown in tables 8, 9, 10, and 11.
Time Module Events Setting
0.01 pumps %B 50
0.02 subcontroller rotary valve A 1
4.50 subcontroller rotary valve A 0
8.00 pumps %B 77
8.50 pumps %B 100
8.51 subcontroller rotary valve A 1
9.50 pumps %B 100
10.00 pumps %B 50
14.50 subcontroller rotary valve A 0
15.00 system controller stop
Table 8 HPLC conditions for the separation of digoxin

15/53
Time Module Events Setting
0.01 pumps %B 50
0.02 subcontroller rotary valve A 1
4.50 subcontroller rotary valve A 0
5.00 pumps %B 80
9.00 pumps %B 80
9.50 pumps %B 100
9.51 subcontroller rotary valve A 1
10.50 pumps %B 100
11.00 pumps %B 50
14.50 subcontroller rotary valve A 0
15.00 system controller stop
Table 9 HPLC conditions for the separation of digitoxin
Event (program abbreviation) Setting
CAD 5.00
CUR 20.00
GS1 30.00
GS2 60.00
IS 5500.00
TEM 350.00
ihe ON
DP 111.00
EP 10.00
CE 49.00
CXP 26.00
Table 10 Settings of the API 4000 mass spectrometer for Q1 multiple ion mode and
MRM mode, respectively

16/53
analyte Q1 multiple ion MRM
m/z [amu]
precursor ion m/z [amu]
product ion
m/z [amu]
digitoxin 897.3 897.3 132.9
digitoxin-2H3 900.3 900.3 132.9
digoxin 913.3 913.3 132.9
digoxin-2H3 11916.3 916.3 132.9
Table 11 Detection masses in Q1 multiple ion mode and MRM mode of native and
deuterated glycosides
The MS detection was performed in the positive ion mode.
Preparation of the deuterated standards and the extraction procedure for serum and plasma
samples is described in [V,VI]. The volume of serum and standards was adjusted to an absolute
amount of 1ng digoxin or digitoxin present in the sample. By an iterative approach the
deuterated internal standard was added giving the ratio of sample to internal standard of 1:1.
3.3.3 Measurement conditions for determination of sirolimus, everolimus,
tacrolimus and cyclosporin A [VII]:
The chromatographic separation of the immunosuppressive drugs was performed on a phenyl-
hexyl-RP column (Luna®, 2 x 150 mm, 5 µm, Phenomenex, Aschaffenburg, Germany).
Standard materials of sirolimus (declared purity > 99 %) and tacrolimus (declared purity > 99
%) and cyclosporin A (declared purity > 99 %) were delivered by LC Laboratories (Woburn,
MA, USA). Everolimus was a gift from Recipe (München, Germany). 32-desmethoxy-rapamycin
was a donation from Wyatt, St. Davids, PA, USA. Ascomycin was purchased from Sigma-Aldrich,
(Taufkirchen, Germany). Other chemicals were obtained as described in [VII].
A ternary gradient was used for elution consisting of eluent A (pump A): 0.1 % v/v formic acid in
water + 0.1 mmol/l caesium hydroxide (adjusted to pH 7 with formic acid); eluent B (pump B): 0.1
% v/v formic acid in methanol + 0.1 mmol/l caesium hydroxide (adjusted to pH 7 with formic acid)
and eluent C (pump C): 0.1 % v/v formic acid in acetonitrile + 0.1 mmol/l caesium hydroxide
(adjusted to pH 7 with formic acid). The flow rate was 300 µl/min. The column temperature was
set at 50 °C. In order to avoid contamination of the ESI source a switching valve system (rotary
valve A) was introduced. At position 0 of rotary valve A the eluate was passed into the ESI
source. At position 1 the eluate was discarded. The injection volume was 10 µl.

17/53
The HPLC conditions for the separation of for the immunosuppressive drugs and the internal
standards, the settings of the API 4000 mass spectrometer, and the detection masses in the
MRM mode are shown in tables 12, 13, and 14.
Time Module Events Setting
0.01 pumps % B 50
0.02 subcontroller rotary valve A 1
1.00 pumps % B 78
6.00 subcontroller rotary valve A 0
16.00 pumps % B 78
16.05 pumps % C 0
20.00 pumps % B 33
20.01 pumps % C 39
30.05 pumps % B 33
30.10 pumps % C 39
31.00 pumps % C 100
31.05 pumps % B 0
37.05 pumps % C 100
37.10 pumps % B 0
38.00 pumps % C 0
38.05 pumps % B 50
42.00 controller Stop
Table 12 HPLC conditions for the separation of immunosuppressive drugs and the internal standards

18/53
Event (program abbreviation) Setting
CAD 12
CUR 15.00
GS1 60.00
GS2 30.00
IS 5500.00
TEM 350.00
ihe ON
DP 140.00
EP 10.00
CE 100.00
CXP 14.00
Table 13 Settings of the API 4000 mass spectrometer for MRM mode
analyte MRM
precursor ion
m/z [amu]
product ion
m/z [amu]
tacrolimus 936.9 132.9
sirolimus 1046.8 132.9
everolimus 1090.8 132.9
cyclosporin A 1335.0 132.9
ascomycin 924.9 132.9
32-desmethoxy-rapamycin 1016.5 132.9
cyclosporin D 1349.2 132.9
Table 14 Detection masses in the MRM mode for the immunosuppressive drugs and the internal standards
The MS detection was performed in the positive ion mode.
Standard solutions were prepared by dissolving the pure standard material of sirolimus,
everolimus, tacrolimus and cyclosporin A, respectively in methanol.
19/53
4. RESULTS AND DISCUSSION
According to the ISO Standard 15193 [7] “useful and reliable results of measurement” for
reference measurement procedure are required which are “ultimately traceable to measurement
standards of highest metrological order”. Additionally, the uncertainty of measurement of the
values has to be determined.
In this study the traceability of the results is given by reference measurement procedures using
primary and secondary standards.
The trueness of measurements has been determined by using certified secondary reference
materials. When no certified reference material was available, the trueness of measurements
was determined by recovery studies.
The uncertainty of measurement was determined by repeated measurements of a sample. The
measurement uncertainty is generally caused by different factors. These factors have been well
determined in our laboratory for the accreditation process. A main component of the total
measurement uncertainty is the uncertainty of the primary or secondary reference material.
Other components of the total uncertainty originate from several steps in sample preparation,
such as pipetting and weighing, or influences due to fluctuations in room temperature, humidity
during sample preparation, or from peak integration. The uncertainty of measurement in this
study is represented by an estimated relative standard deviation (coefficient of variation).
When no international acceptability criteria for accuracy and precision are given, in this study
the criteria for the evaluation of the reference measurement procedure were derived from the
“German Guideline of the “Federal Medical Council for Quality Assurance of Quantitative
Analysis in Laboratory Medicine” (RiliBÄK) [6]. The requirements for precision and accuracy for
reference laboratories using reference measurement procedures were set at 1/3 of those for
precision and accuracy of the routine laboratories (see column 5 and 6 of the current RiliBÄK).
The reference measurement procedures in this study have been established and evaluated with
these analytical criteria.

20/53
4.1 Determination of glibenclamide by HPLC and fluorescence detection [I]
Glibenclamide is a member of sulfonylureas and is used as oral antidiabetic drug for the therapy
of diabetes type 2.
chemical formula C23H28 ClN3O5S
molecular weight [g/mol] 494,0
Figure 2 Structure of glibenclamide
In the early 1990s mainly immunological methods were used for therapeutic drug monitoring of
glibenclamide [13,14]. The immunological methods were sensitive for the detection and
quantification of glibenclamide, but they had a poor analytical specificity. They were not able to
distinguish the drug from its metabolites and from structurally related sulfonylureas.
To advance the analytical quality of routine measurement of glibenclamide in patient samples a
reliable, sensitive and specific analytical method by the use of HPLC and fluorescence detection
was developed at the German Diabetes Research Institute (see diploma thesis “Methoden-
Entwicklung zur Bestimmung von Glibenclamid in biologischem Material mittels
Hochdruckflüssigkeitschromatographie unter Verwendung eines Fluoreszenz-Detektors” [11]).
This analytical principle of measurement was used for routine measurement in the clinical
laboratory for many years. Moreover, the method could be adapted to determine glibenclamide
for preclinical research. In a research study the rat brain tissue concentrations of glibenclamide
after intravenous or local application have been determined, to investigate the effect of the
drug on the ischemia-induced K+ efflux changes [I].
Since the strategy of continuous improvement in analytical quality is still in process, in the
meantime an LC-MS method for the determination of glibenclamide in serum has been
developed on the basis of this diploma thesis [11] in the German Diabetes Research Institute
[15,16]. As will be shown with digoxin, digitoxin (see 4.4) and immunosuppressive drugs (see
4.5) this method is on the way to be further improved by using the new analytical principle in
LC-MS/MS (measurement of Cs+ adducts) to a reference measurement procedure at INSTAND
e.V. and will be used for setting target values in a new EQAS, thus promoting the comparability
of results in drug monitoring of antidiabetic drugs.

21/53
4.2 Determination of theophylline by GC-IDMS and HPLC diode array detection
[II, III]
Theophylline is a member of the xanthine family and is used in the therapy of bronchial asthma
and chronic obstructive pulmonary diseases.
chemical formula C7H8 N4O2
molecular weight [g/mol] 180.17
Figure 3 Structure of theophylline
Several analytical measurement procedures for determination of theophylline in blood are
available [19,20,21], but analytical problems may occur in routine methods by interferences of
other xanthines and metabolites of theophylline. Theophylline is closely related in structure to
naturally occurring xanthines in beverages such as coffee, tea and cocoa, which may either
interfere with the immunoassay determination or – in the case of caffeine – be metabolised to
theophylline. The main substance group which may interfere with the determination of the
closely related theophylline (1,3-dimethylxanthine) are the dimethylxanthines theobromine (3,7-
dimethylxanthine) from cocoa – and paraxanthine (1,7-dimethylxanthine) the main metabolite
of caffeine. They differ in structure in the positions of the methyl groups on the xanthine moiety.
According to the Guideline of the German Federal Medical Council for Quality Assurance of
Quantitative Analyses in Laboratory Medicine reference measurement procedure values are
required for setting target values for theophylline in EQAS.
The existing routine method for the determination of theophylline in serum [20] was optimized
and further developed to be established as reference measurement procedure. The principle of
the method is a gas chromatography, isotope dilution-mass spectrometry (GC-IDMS) procedure.
The internal standard used for this method was the purchasable 2-13C,1,3-15N2-theophylline.
The derivatization of all xanthines was made with N-methyl-N-trimethylsilyltrifluoroacetamide
(MSTFA). The extraction and derivatization procedures were examined in detail and optimized
stepwise during the development of the method. By optimization of the chromatographic

22/53
conditions a separation of all dimethylxanthines was obtained. To obtain high accuracy and a
good precision standard solutions and serum samples were quantified gravimetrically during
sample preparation. The volume of serum and standards was adjusted giving an amount of 5
µg theophylline in the sample. Internal standard was then added so that the ratio of sample to
internal standard was 1:1.
Since no certified reference material was available the evaluation of the trueness of the
established GC-IDMS method was performed by recovery studies.
In serum samples, spiked with known amounts of theophylline, the mean recoveries in
therapeutic ranges for theophylline was 99.78 % with a mean bias of 0.22 % (n = 20). The
imprecision in EQAS samples (n=27 over a 4-day period) was between 0.527 % and 1.14 %,
respectively.
The analytical specificity and trueness of the GC-IDMS method was verified by comparison with
a HPLC-diode array method, following the well accepted strategy that the reliability of the
results is given, when agreement is achieved by two principally different methods. Therefore, a
HPLC method has been developed, which allows the baseline separation of all
dimethylxanthines and related compounds, which could lead to interferences: theophylline,
theobromine, paraxanthine, paracetamol, caffeine, and uric acid.
The mean recoveries in spiked serum samples with the HPLC method were between 86 % and
101 % between 1.25 and 100 ng/ml for all compounds tested.The imprecision in EQAS samples
was between 2.87 % (n=10) and 3.27 % (n=10), respectively.
A good correlation of the results between GC-IDMS and HPLC-diode array measurements was
obtained, which indicates the good accuracy and specificity of the established GC-IDMS
measurement procedure.
Unfortunately, an international network of reference laboratories for theophylline does not exist
at the present time.
Our reference measurement procedure for theophylline is used for setting target value in the
EQAS. An example for the evaluation of an EQA scheme for theophylline is shown in figure 4.
The acceptability range for routine measurement of the participants of ± 30 % for theophylline
is given by the Guideline of the Federal Medical Council for Quality Assurance of Quantitative
Analysis in Laboratory Medicine. The central square dot indicates the target values for sample A
and sample B. 96.3 % of the participants had successfully analysed the sample A and 98.6 %
the sample B.

23/53
sample B [ng/ml]
sample A [ng/ml]
theophylline
sample target value [ng/ml]
cv[%]
acceptability range [ng/ml]
mean value [ng/ml]
cv[%]
successfulparticipations [%]
A 40.1 0.488 29.6 – 50.6 39.7 9.02 96.3
B 7.45 0.539 5.51 – 9.39 7.86 7.98 98.6
Figure 4 Youden-plot with target value, acceptability criteria and statistical data
of the participants in an External Quality Assessment Scheme
for theophylline run by INSTAND e. V. (2005)
In the same survey for theophylline the results of the customers of one manufacturer (figure 5)
had systematic deviation from the reference method value, indicating an analytical problem
(calibration, specificity) of the routine measurement system used. The manufacturer of this
analytical system had been informed, according to Article 11 of the Directive 98/79/EC of the
European Parliament and of the Council [1].

24/53
sample B [ng/ml]
sample A [ng/ml]
theophylline
sample target value [ng/ml]
cv[%]
acceptability range [ng/ml]
mean value [ng/ml]
cv[%]
successfulparticipations [%]
A 40.1 0.488 29.6 – 50.6 51.1 9.00 41.7
B 7.45 0.539 5.51 – 9.39 10.4 9.40 13.9
Figure 5 Youden-plot with target value, acceptability criteria and statistical data
of the participants in an External Quality Assessment Scheme
for theophylline run by INSTAND e. V. (2005)
Demonstration of an analytical problem of a routine method
A development of an isotope-dilution LC-MS/MS method for the determination of theophylline is
on the way in our laboratory. On the basis of the publication of Beaudry et al. [22] the
development of a method for setting target values in EQAS samples for theophylline will be
further investigated.

25/53
4.3 Determination of HbA1c by LC-MS
Glycated haemoglobin is an important parameter for the assessment of diabetes management
in patient care [23,24]. The main analyte of glycated haemoglobins is HbA1c. HbA1c is a
postsynthetic modification of haemoglobin A0 by covalent attachment of glucose to the N-
terminal valine of the - chains. The reaction is thermodynamically controlled, i.e. the extent of
formation of HbA1c is controlled by the concentration of glucose in blood.
HbA0 Val – His – Leu – Thr – Pro – Glu – Glu – Lys –
GlucHbA1c –Val – His – Leu – Thr – Pro – Glu – Glu – Lys –
Figure 6 Figure 7
Model of the quarternary structure N-terminal aminoacids of the -chain of haemoglobin
of haemoglobin
HbA1c is a retrospective analyte reflecting the mean glucose concentration of the patient during
the previous four to six weeks. The mean HbA1c level reflects the compliance of the patient with
the doctor in the management of the carbohydrate metabolism and is an indicator for the
therapeutic success of the diabetes centres.
Several clinical studies, such as the DCCT (Diabetes Control and Complications Trial) study [23],
have demonstrated, that an intensive metabolic control of diabetes reduces the onset and
progression of diabetic complications in patients. According the DCCT study, a well managed
diabetic patient should have an HbA1c level less than 6.5 % of the haemoglobin. For the
comparability of the analytical results is of great importance to have a reference measurement
procedure and a standardized calibration of the routine methods. The organizers of the DCCT
study agreed to standardize the measurement of HbA1c according to the calibration used for

26/53
NGSP (National Glycohaemoglobin Standardisation Program), an HPLC method based on cation-
exchange chromatography [25,26,27]. The agreement of a consensus value for calibration
made it possible to compare the results of the different diabetes centres, however it did not
improve the analytical accuracy. The calibration of the NGSP method is not traceable to a
primary standard of HbA1c. The so called “HbA1c” peak in the HPLC chromatogram of cation-
exchange chromatography is contaminated with about 2 % with other haemoglobin fractions.
There was a need for a reference measurement procedure for the determination of HbA1c. Such
a reference measurement procedure has been developed and validated by the IFCC Working
Group on HbA1c Standardisation [17]. This IFCC reference method allows the international
comparison of HbA1c measurements at the highest level of accuracy.
In contrast to the NGSP calibration in the IFCC calibration the traceability of measurement
results is achieved by chromatographically purified calibration standards of HbA0 and HbA1c.
Two different principles of measurement for HbA1c are introduced by the IFCC, the LC-ESI-MS
method and the HPLC/capillary electrophoresis method. Both methods have been established in
our reference laboratory at INSTAND e.V.
The quantification of the IFCC reference method is based on calibration using external
standards. For this kind of calibration an excellent long-term stability of the analytical
measurement system is of utmost importance. According to the protocol of the IFCC reference
measurement procedure for HbA1c the calibrators must be measured before and after the
controls and EQAS samples for which the target values have to be analysed. The total analytical
time for measurement, including calibrators, controls and EQAS samples is about 24 h. The
quality of the results is highly dependent on the long-term stability of the mass spectrometer
used. In a stable analytical system, the repeated calibration curves should be congruent.
We tested the long-term stability (measuring period of about 24 h) of three different
electrospray ionisation source- mass spectrometers:
MSQ (Thermo Finnigan)
Quantum ultra (Thermo Finnigan)
API 4000 (Applied Biosystems).
All mass spectrometers were equipped with an HPLC-system from Shimadzu. The three LC-MS
systems were tested under standardised conditions as requested in the IFCC reference
measurement procedure over one measuring period of 24 h (see 3. MATERIALS AND
METHODS].

27/53
Two of the mass spectrometers were not appropriate for this type of analysis. Both the MSQ and the
Quantum ultra mass spectrometers revealed a long-term system instability (figure 8 and figure 9).
y = 0,7157x - 0,0019
R2 = 0,9992
y = 0,6392x - 0,0021
R2 = 0,9979
-0,02
0
0,02
0,04
0,06
0,08
0,1
0,12
0,14
0 0,05 0,1 0,15 0,2
ratio conc. HbA1c/HbA0
rati
o a
rea
Hb
A1
c/H
bA
0
calibration 1
calibration 2
Figure 8 Calibration curves at the beginning (calibration 1) and
at the end (calibration 2) of a measuring sequence (24 h) for HbA1c
performed by using a MSQ mass spectrometer
y = 3,723x - 0,0039
R2 = 0,9997
y = 3,5384x - 0,0057
R2 = 0,9995
-0,1
0
0,1
0,2
0,3
0,4
0,5
0,6
0,7
0 0,05 0,1 0,15 0,2
ratio conc. HbA1c/HbA0
rati
o a
rea
Hb
A1
c/H
bA
0
calibration 1
calibration 2
Figure 9 Calibration curves at the beginning (calibration 1) and
at the end (calibration 2) of a measuring sequence (24 h) for HbA1c
performed by using a Quantum ultra mass spectrometer

28/53
The calibration curve 1 (in the beginning of the sequence) and calibration 2 (in the end of the
sequence) were calculated by plotting the ratio of the concentration of HbA1c and HbA0 versus
the ratio of the peak area of the N-terminal hexapeptides of HbA1c and HbA0 and following
linear regression.
Using the MSQ and Quantum ultra a decrease of the slope of the calibration curves 2 in relation
to calibration 1 was observed.
The decreasing slope of the calibration curves is caused by different decrease of the absolute
signal intensity of the glycated and native hexapeptides in the LC-MS systems. This was
demonstrated by repeated injection of the same haemolysate sample (see figure 10).
3000000
3500000
4000000
4500000
5000000
5500000
0 5 10 15 20 25 30
number of injections
are
a area HbA0 * 0.1
area HbA1c
area HbA0 · 0.1
Figure 10 Stability-test of absolute signal intensities for HbA1c and HbA0 by repeated
measurements of a haemolysate performed by using a MSQ mass spectrometer
0,09000
0,10000
0,11000
0,12000
0,13000
0,14000
0,15000
0 5 10 15 20 25 30
number of injections
rati
o a
rea
ratio area
HbA1c/HbA0
Figure 11 Stability-test of the peak area ratio for HbA1c and HbA0 by repeated
measurements of a haemolysate performed by using a MSQ mass spectrometer

29/53
During the measuring period a continuous decay of signal intensity occurred, both for HbA1c
and HbA0. Moreover, the rates of decay were different. This results in a continuous decay of the
ratio of the peak areas of the -N-terminal hexapeptides of HbA1c and HbA0 (see figure 11).
Constant ratios are very critical for the accuracy and precision of the results. With the drifting
systems we were not able to accomplish the acceptability criteria of the IFCC network for HbA1c
standardisation.
The best results were obtained using the mass spectrometer API 4000 from Applied Biosystems.
The calibration curves were nearly congruent within one measuring period (figure 12).
y = 0,9413x - 0,0015
R2 = 0,9997
y = 0,9384x - 0,0014
R2 = 0,9997
-0,02
0
0,02
0,04
0,06
0,08
0,1
0,12
0,14
0,16
0,18
0 0,05 0,1 0,15 0,2
ratio conc. HbA1c/HbA0
rati
o a
rea
Hb
A1
c/H
bA
0
calibration 1
calibration 2
Figure 12 Calibration curves at the beginning (calibration 1) and
at the end (calibration 2) of a measuring sequence (24 h) for HbA1c
performed by using an API 4000 mass spectrometer
Repeated injections of a haemolysate sample resulted in constant absolute signal intensities as
(figures 13 and 14).

30/53
0
50000
100000
150000
200000
250000
300000
350000
400000
450000
500000
0 5 10 15 20 25
number of injections
are
a
area HbA0 *0.1
area HbA1c
area HbA0 · 0.1
area HbA1c
Figure 13 Stability-test of absolute signal intensities for HbA1c and HbA0 by repeated
measurements of a haemolysate
performed by using an API 4000 mass spectrometer
0,03000
0,04000
0,05000
0,06000
0,07000
0,08000
0,09000
0,10000
0 5 10 15 20 25 30
number of injections
rati
o a
rea
ratio area
HbA1c/HbA0
Figure 14 Stability-test of the peak area ratio for HbA1c and HbA0 by repeated
measurements of a haemolysate
performed by using an API 4000 mass spectrometer

31/53
The technical design of the electrospray ionisation interface of the LC-MS system is the critical
element for the stability of calibration and analysis. The long-term instability of signal intensity
could not be corrected, since no internal standards were available and calibration using external
standards had to be used.
Therefore the API 4000 electrospray ionisation – mass spectrometer was used for the further
measurements.
During optimization of the HPLC conditions for the determination of HbA1c we modified the
IFCC reference measurement procedure in several steps. In long-term evaluation, peak tailing,
unexpected peaks and an instability of the retention time in the chromatographic separation
was observed. A poor reproducibility of column selectivity and separation characteristics from
batch-to-batch was detected.
The precision is highly dependent on the stability of the retention time. The stability of the
retention times and the peak form was improved by increasing the concentration of TFA in the
elution buffer, which was originally at 0.025 %. The best results were obtained by adding 0.07
% TFA to the eluents. By changing the gradient elution profile the -N-terminal hexapeptides of
HbA1c and HbA0 eluted in the plateau phase of 10 % of eluent B. The restitution of the
equilibrium of the cyano-column after rinsing the column with acetonitrile at the end of each
analytical cycle is critical to achieve highest precision of measurement. The run time was
necessarily extended from 23 min to 28 min. Using this modified HPLC conditions column
selectivity and separation characteristics were highly reproducible from batch-to-batch. These
modifications in the HPLC conditions improved the imprecision of repeated measurements from
more than 3 % of the original IFCC conditions (depending on the column batch) to a coefficient
of variation of 1.35 %.
Another important aspect is the prevention of system overloading. We observed, that the
concentration of HbA1c in samples, which are prepared according the IFCC reference procedure,
is too high for injection direct into the LC-MS system, when using the API 4000. Injecting 1 µl
of the haemolysates the calibration curve was not linear over the required concentration range.
Additionally, accuracy and precision was not satisfactory. The dilution of samples did not
improve the results. Therefore, a post column flow splitting system was installed, leading to
1/10 of the elution flow into the ESI-MS system. Applying these modifications of the HPLC
conditions, stable retention times, a symmetric peak form without any peak tailing, no
unexpected peaks and linear regression curves were obtained. A typical HPLC-MS
chromatogram of a haemolysate sample is shown in figure 15.

32/53
Figure 15 HPLC-MS chromatogram of a haemolysate sample containing 8.22 % HbA1c
upper trace: ß-N-terminal hexapeptide of HbA1c (RT 10.2 min, m/z 429.3 amu)
lower trace: ß-N-terminal hexapeptide of HbA0 (RT 9.8 min, m/z 348.3 amu)
Using these modifications we have assessed the analytical trueness by measurements of a
certified reference material supplied by the network for HbA1c standardisation. The method had a
bias between 0.1 % and 0.65 %. The coefficients of variation were between 0.92 % and 1.98 %.
Additionally, we verified the analytical specificity and accuracy of the optimized LC-ESI-MS
method by comparing the results with those obtained by the HPLC/capillary electrophoresis
IFCC reference method.
Using this optimized measurement procedure we participated in several studies of the IFCC
Working Group on Standardisation of HbA1c.
This working group includes about 15 laboratories from various countries. Twice a year
international intercomparison studies were organized.
In these studies five samples of unknown concentration were analysed according to the
measurement protocol of the IFCC reference measurement procedure for HbA1c (sequence see
3. MATERIAL AND METHODS).

33/53
For evaluation of the measurements of each sample the difference between the median value
of each individual laboratory and the overall median value of all participants are plotted against
the overall median value. A linear regression analysis of the results of each participant is made.
The slope of the regression curve is a measure for the proportional bias, the intercept a
measure for the systematic bias. Slope and intercept define the limit of acceptability.
A typical evaluation is shown in figure 16. The results of our laboratory are presented as
laboratory number 17a.
sample median: overall median value
of all participants
(for each sample)
lab median: median value
of a single laboratory
(for each sample)
lab_17a
(by kind permission of the IFCC Working Group on Standardization of HbA1c)
Figure 16 Evaluation of an international intercomparison study of the IFCC Network Standardisation of HbA1c
(Results of INSTAND e.V.: lab_17a)
The consensus mean of the approved data of each sample is the new assigned value. The
intercomparison studies are used to renew the approval status of the network laboratories and
for setting target values for new batches for controls and calibrators.
The established reference measurement procedure was used for setting target values in the
external quality assessment schemes. The results of a typical survey are shown in figure 17.
The acceptability criteria of ± 20 % for routine measurements of HbA1c are shown as a frame.
The central square dot indicates the two reference measurement values (target values) for

34/53
sample A and sample B. 97.2 % of the participants had successfully analysed the sample A and
98.8 % the sample B.
Unfortunately, for routine laboratories the reference measurement values for HbA1c have to be
transformed according the calculation formula of the IFCC Working Group into NGSP values,
because the manufacturers decided to comply with DCCT-requirements and calibrate their
commercial test systems with reference to the NGSP procedure for the next few years, before
introducing the IFCC calibration.
sample B [%]
sample A [%]
HbA1c
sample target * value [%]
cv[%]
acceptability range [%]
mean value [%]
cv[%]
successfulparticipations [%]
A 5.52 2.07 4.41 – 6.63 5.59 8.20 97.2
B 10.50 2.19 8.39 – 12.70 10.50 6.50 98.8
Figure 17 Youden-plot with target value, acceptability criteria and statistical data
of the participants in an External Quality Assessment Scheme
for HbA1c run by INSTAND e. V. (2005)
* converted from IFCC to NGSP values with the following formula:
NGSP = (0.9148 x IFCC) + 2.152
Further development of the reference measurement procedure to variant haemoglobins (like
HbF, HbC or HbS) and using labelled glycated and non glycated -N-terminal hexapeptides as
internal standards for a LC-IDMS reference measurement procedure is in progress.

35/53
4.4 Determination of digoxin and digitoxin by LC-MS and LC-MS/MS [V, VI]
Digoxin and digitoxin are cardiac glycosides, which are used for the therapy of cardiac diseases.
The structure of digoxin is shown in figure 18. Digoxin is an analogue of digitoxin and differs only
in the presence of a hydroxy-group at position 12 (see – R in figure 18) of the steroid residue.
R
chemical formula molecular weight [g/mol]
digoxin C41H64O14 780.94
digitoxin C41H64O13 764.94
Figure 18 Structure of digoxin (R = OH) and digitoxin (R = H)
The Guidelines of the Federal Medical Council for Quality Assurance of Quantitative Analyses in
Laboratory Medicine made it mandatory to establish reference measurement procedures for
determination of digoxin and digitoxin. The reference measurement procedure was published in
2003 [V]. The method describes a LC-MS method, using the SIM mode, combined with isotope
dilution after a liquid-liquid extraction. The essential benefit of the method was the observation
that digoxin and digitoxin form caesium (Cs+) adducts. This new principle of measurement was
adapted to LC-MS/MS [VI] to allow quantitative determination of the cardiac glycosides at high
yield and improved specificity in the MRM mode.
In LC-MS many molecules form adducts with alkali ions such as Na+ and K+ [28,29]. Adduct
formation with Na+ or K+, originating from the HPLC system (solvent, glasware, column), turned
out as problem in analysis because the analytical sensitivity may be reduced [28] and tandem
mass spectroscopic studies may be limited [30,31]. Several studies have been conducted, to
control the problems of adduct formation during LC-ESI-MS analysis. One strategy is to avoid
the formation of alkali metal adducts using ultra pure solvents, which are free of alkali metal
impurities [31] or through competition by forming a stable complex with the alkali metal ions
[30]. Another strategy enhances adduct formation by use of solvent additives, such as sodium

36/53
salts [32], primary amines [28], silver nitrate [49] or ammonium salts [33]. It must be admitted,
that the analysis of the fragmentation pattern of these adducts is not convenient [33].
Analytical sensitivity [34] and specificity are highly affected by the composition of the mobile
phase. Adding an excess of Cs+ ions to the elution buffer, it is possible to shift the equilibrium
of adduct formation to one main product and the Na+ and K+ adducts are reduced or even
eliminated.
The mass spectrometry full-scan (Q1 scan) of a standard solution of digoxin (figure 19) shows,
that without addition of Cs+ ions digoxin is distributed into numerous fragments. The digoxin
adduct with sodium ions [M+Na]+ m/z 803.6 amu is dominant. Additionally the mass of
protonated digoxin [M+H]+ m/z 781.6 amu and the protonated and sodiated fragments of
digoxin minus one, two and three digitoxose molecules can be detected. The mass of the K+
adduct of digoxin [M+K]+ m/z 819.7 amu is also detectable, but not labelled in this spectrum.
Figure 19 Q1 scan of a digoxin standard solution (without Cs+ ions)
When Cs+ ions are added to the elution buffer (figure 20), nearly the full signal intensity enters
in the Cs+ adduct of digoxin [M+Cs]+ m/z 913.6 amu. The Cs+ adduct formation has a
stabilizing effect on the whole molecule, avoiding an undesirable fragmentation as seen without
Cs+ ions.

37/53
Figure 20 Q1 scan of a digoxin standard solution (with Cs+ ions)
The same observation is made in the LC-MS spectrum of digitoxin.
At the same digitoxin concentration the Cs+ adduct produces much higher peak values than the
sodium adduct. The depression of ion signal intensity caused by high concentrations of
electrolytes has been described previously [50]. Therefore, the influence of Cs+ concentration in
the elution buffer on the signal intensity of the Cs+ adducts was examined. A reduction of Cs+
concentration from 0.1 mmol/l to 0.01 mmol/l decreases the signal intensity. An increase of the
Cs+ concentration above 0.1 mmol/l in the elution buffer does not increase the signal intensity
of the Cs+ adducts. By the use of 0.1 mmol/l Cs+ in the elution buffer we obtained stable and
reproducible results.
The advantage of measuring Cs+ adducts in the Q1 Multiple Ion mode is an increase in signal
and an increase in analytical specificity. This effect results in higher precision and a lower limit
of detection.
In the MRM mode the Cs+ adduct decomposes in a way that the Cs+ ion is detectable as
product ion. The Cs+ adduct is split into a neutral molecule and a positive charged caesium ion.
By optimized selection of the ESI source parameters, in the product ion scan the signal of the

38/53
Cs+ adduct can be completely reduced, resulting in a maximized intensity of the Cs+ ion signal.
An efficient dissociation of up to 80 % from the caesium-drug-complex to the caesium ion could
be obtained. Under our conditions the Cs+ ion is the only charged product from Cs+ adducts.
The Cs+ adducts of digoxin and digitoxin become measurable as Cs+ ion in the MRM mode in
high signal intensity (figure 21).
Inte
nsity,
cp
s
m/z
Figure 21 Product Ion scan of the Cs+ adduct of digitoxin (m/z 897.3 amu) in a
digitoxin standard solution
Correspondingly, we investigated the effect of the other alkali metals Na+, K+ and Rb+ in MRM
transmission. The Na+ ions were not detectable in the same way like Cs+ ions in the MRM
mode. By addition of K+ and Rb+ ions the same kind of MRM transmission as seen by addition
of Cs+ ions was observed. In the Q1 multiple ion mode K+ and Rb+ adducts could be detected,
which were measurable as K+ and Rb+ ion, respectively, as product ion in the MRM mode. In
contrast to caesium, which is mono isotopic, potassium and rubidium have naturally occuring
isotopes. Therefore, the signal of the product ion of the K+ or Rb+ adduct is split into two
components, thus reducing the signal intensity of the target mass. Additionally, the higher
molecular weight of caesium is more convenient for a specific detection.
The loss of a neutral molecule and the clear origin of the Cs+ ion as product ion of the CS+
adduct was clarified in [VII].
A scheme of the measuring principle of Cs+ adducts in SIM (Q1 Multiple Ion) mode and MRM
mode is shown in figure 22 [VI].

39/53
Figure 22 Scheme of the principle of measurement of Cs+ adducts
SIM and MRM
(by kind permission of Clin.Lab.)
For serum samples a special extraction procedure was developed as described in [V,VI].
As internal standards stable isotope-labelled compounds were synthesized in our laboratory
with modification of the original procedure [48,V,VI]. To obtain high accuracy and a good
precision standard solutions and serum samples were quantified gravimetrically during sample
preparation. The volume of serum and standards was adjusted in such a way that an amount of
1 ng of the drug was present in the sample. Internal standard was then added giving the ratio
of sample to internal standard of 1:1.
Since no certified reference material is available the trueness of the newly established method
was investigated by recovery studies. In spiked serum samples the mean recoveries in
therapeutic ranges for digoxin was 99.95 % (n=28) and for digitoxin 100.2 % (n=35), with a
bias of 0.05 % and 0.2 % respectively. In the Q1 Multiple Ion mode the between-run
imprecision was between 1.26 % and 2.91 % (n=7) for digoxin and 0.79 % and 2.00 % (n=7)
for digitoxin. The corresponding coefficients of variation in EQAS samples were between 1.26 %
and 3.18 % (n=6) and 1.21 % and 1.46 % (n=8), respectively. In the MRM mode the
coefficients of variation were between 1.65 % and 2.28 % (n=6) for digoxin and 1.13 % and
1.44 % (n=6) for digitoxin.
These results are well within the requirements of the Guidelines of the German Federal Medical
Council for Quality Assurance of Quantitative Analyses in Laboratory Medicine.
Unfortunately, an international network of reference laboratories for digoxin and digitoxin does
not exist for interlaboratory comparison studies.

40/53
Our candidate reference measurement procedure is used for setting target values in the EQAS.
A typical evaluation of an EQA survey for digoxin is shown in figure 23. The acceptability limits
for routine measurement of ± 30 % for digoxin are shown as a frame. The central square dot
indicates the two target values for sample A and sample B. 98.9 % of the participants had
successfully analysed the sample A and 94.5 % the sample B.
sample B [ng/ml]
sample A [ng/ml]
digoxin
sample target value
[ng/ml]
cv
[%]
acceptability range
[ng/ml]
mean value
[ng/ml]
cv
[%]
successful
participations [%]
A 2.40 2.54 1.68 – 3.12 2.49 9.42 98.9
B 1.57 1.68 1.09 – 2.50 1.76 10.1 94.5
Figure 23 Youden-plot with target value, acceptability criteria and statistical data
of the participants in an External Quality Assessment Scheme
for digoxin run by INSTAND e. V. (2005)
Similar results have been collected for digitoxin in EQAS.

41/53
4.5 Determination of sirolimus, everolimus, tacrolimus, cyclosporin A by
LC-MS/MS [VII]
The therapeutic drug monitoring (TDM) of immunosuppressive drugs in blood of organ-
transplanted patients is of utmost importance to prevent intoxication or the rejection of the
transplanted organ due to incorrect dosage. The most frequently used immunosuppressive
drugs are the mTOR inhibitors sirolimus and everolimus and the calcineurin inhibitors tacrolimus
and cyclosporin A.
The chemical structures of these compounds are shown in figures 24-27.
Figure 24 Structure of sirolimus Figure 25 Structure of everolimus
Figure 26 Structure of tacrolimus Figure 27 Structure of cyclosporin A
chemical formula molecular weight [g/mol]
sirolimus C51H79NO13 914.19
everolimus C53H83NO14 958.2
tacrolimus C44H69NO12 804.03
cyclosporin A C62H111N11O12 1202.64

42/53
The routine methods for the determination of immunosuppressive drugs are immunoassays [35,
36,37], HPLC [38] and LC-MS [39,40,41] methods. In LC-MS routine measurement NH4+
adducts are measured in MRM mode without chromatographic separation of the drugs. This
procedure has a low specificity [33] and is prone to mass interferences [42]. In patient samples
problems may occur, due to the presence of metabolites, causing a positive bias of published
LC-MS methods [43,33]. Until now no accepted reference measurement procedure for these
drugs is available. Recent data from EQAS clearly show the poor comparability of the results
obtained by routine methods for the same analyte. Large differences of results were observed
using the kits of different manufacturers (figure 28).
320.0
272.5
225.0
177.5
130.0
cycl
ospo
rin A
con
c. [
ng/
ml]
manufacturersAB BW O MI RO ZX
manufacturers
D
Figure 28 External quality assessment scheme for cyclosporin A, run by INSTAND e.V (2005).
Box-plots of the results of participating laboratories using different
analytical systems
There is a need for development of reference measurement procedures in order to achieve
comparability of results. On the way to develop reference measurement procedures for these
drugs we applied the experience of the Cs+ adduct formation to the measurement of the
immunosuppressive drugs.
All four immunosuppressive drugs form adducts with Cs+ that are measurable in the MRM mode
with Cs+ ion as product ion.
The main charged product in the MRM transmission for the immunosuppressive drugs is the Cs+
ion, like in digoxin and digitoxin, (figure 29).

43/53
Figure 29 Product Ion scan of a cyclosporin A standard solution (1 µg/ml in eluent B)
infused at a flow rate of 10 µl/min
For chromatographic separation various stationary phases were tested with different mobile
phases, containing Cs+, water, methanol and/or acetonitrile, with different elution profiles.
Mobile aqueous phases with different pH, adjusted with formic acid, were also tested. Since the
four immunosuppressive drugs are highly lipophilic, C18 reversed phase columns show a strong
retention, especially for cyclosporin A [44]. We tested several C18 columns, consisting of
different polymer and silica based materials and chemically modified reversed phase materials,
with different kinds of end-capping, particle, and pore sizes. The best results were obtained
using a phenyl-hexyl-phase. Using a ternary gradient elution profile we could separate all four
drugs and cyclosporin D (figure 30).

44/53
8.59
12.70
24.12
11.5927.16
Figure 30 HPLC-MS/MS chromatogram (overlaid graphs of single mass traces)
of a standard mixture of tacrolimus (8.59 min), sirolimus (11.59 min),
everolimus (12.70 min), cyclosporin A (24.12 min) and cyclosporin D
(27.16 min), 10 µl (1 µg/ml) injected
Since labelled internal standards are not available, analogue substances as internal standards
were used for quantification. Ascomycin was used for the quantification of tacrolimus, 32-
desmethoxy-rapamycin for sirolimus and everolimus and cyclosporin D for cyclosporin A.
area ratio sirolimus /
32-desmethoxy-rapamycin everolimus /
32-desmethoxy-rapamycin tacrolimus / ascomycin
cyclosporin A / cyclosporin D
mean 2,52 2,89 1,20 1,09
n 25 25 25 25
SD 0,06 0,06 0,03 0,02
CV [%] 2,57 2,11 2,31 2,11
Table 15 Imprecision of measurements of a standard mixture of tacrolimus, sirolimus,
everolimus, cyclosporin A, cyclosporin D, ascomycin, and 32-desmethoxy-
rapamycin

45/53
Whereas the precision of measurement in a standard mixture of pure substances of tacrolimus,
sirolimus, everolimus, cyclosporin A, cyclosporin D, ascomycin and 32-desmethoxy-rapamycin is
excellent (table 15), the accuracy has to be determined using certified reference materials,
which is unfortunately not available.
The HPLC separation of the immunosuppressive drugs and the use of Cs+ ion for forming
adducts is a good precondition to establish a reference measurement procedure. This new
principle of measurement of these drugs may be improved by using stable-isotope-labelled
drugs as internal standards, which will be produced in our laboratory.
New technologies using electrospray ionisation sources as interfaces, considerably improved the
stability in LC-MS and LC-MS/MS analysis. Hence the accuracy and precision of results became
comparable to those attained by GC-MS. In contrast to GC-MC methods LC-MS analysis does
not require chemical derivatization of the analytes. Therefore GC-MS methods are more and
more substituted by LC-MS, even in reference measurement procedures [45].
High throughput LC-MS methods may be used in routine analysis, sometimes called “quick-and-
dirty” procedures rely exclusively on the specificity of the mass spectrometer by selecting one
“specific” product ion mass. They are not appropriate for reference measurement procedures.
The reference measurement procedure requires a higher specificity, accuracy and precision,
which is only given by careful sample preparation, chromatographic separation of the analytes
[38,47] and mass analysis, thus eliminating undesirable matrix effects and ion suppression
[29,46]. Only by this way mass interferences can be avoided [37].
The most reliable quantification is performed using isotope-labelled internal standards. These
internal standards may be purchased (as for 2-13C ,1,3-15N2-theophylline for determination of
theophylline) , produced by specialized institutes (labelled glycated and not glycated
hexapeptides for determination of HbA1c) or self prepared (for instance digoxin-2H3 and
digitoxin-2H3 for determination of digoxin and digitoxin ).
The isotope-labelling of analytes may be difficult as is the case with immunosuppressive drugs.
In this field studies in our laboratory are on the way.
Development and optimization in the reference laboratory is a never completed process. This
study demonstrates an actual status in a dynamic system.
A LC-MS/MS reference measurement procedure is on the way to be established for
glibenclamide, measuring Cs+ adducts of the drug for setting target values in a new EQAS. For
theophylline an isotope-dilution LC-MS/MS method is actually developed. A further development
of the reference measurement procedure for HbA1c using labelled gycated and non glycated ß-

46/53
N-terminal hexapeptides as internal standard for a LC-IDMS reference measurement procedure
is in process. The method for determination of the immunosuppressive agents sirolimus,
everolimus, tacrolimus and cyclosporin A measuring Cs+ adducts will be further developed to be
proposed as a reference measurement procedure.
Reference measurement procedures improve calibration of routine methods, the comparison of
the performance of routine methods and the objective monitoring of commercially available test
kits. Reference measurement procedures lead to comparable reference intervals of analytes
thus forming a reliable basis for epidemiological studies and better patient care.
In the future additional international networks should be established, to get reference
measurement procedures confirmed and accepted at international level.

47/53
5. SUMMARY
Reference measurement procedures in laboratory medicine are necessary to get reliable and
comparable results in laboratory analyses and thus improve patient care.
This study demonstrates that the development of reference measurement procedures is a
highly dynamic process. Maintenance, evaluation, and progressive improvements to the highest
technical level are a permanent objective of reference measurement laboratories.
Three reference measurement procedures and the basis for the development of two additional
reference measurement procedures are presented in this study:
reference measurement procedure for determination of theophylline [II, III]
reference measurement procedure for determination of HbA1c
reference measurement procedure for determination of digoxin and digitoxin [V, VI]
basis for a reference measurement procedure for determination of sirolimus, everolimus,
tacrolimus, cyclosporin A [VII], and glibenclamide [I]
An isotope dilution GC-MS method for determination of theophylline was optimized and further
developed to be proposed as a reference measurement procedure.
In serum samples spiked with theophylline in therapeutic range the mean recovery was 99.78
% with a bias 0.22 %. The imprecision in commercial control material was between 0.527 %
and 1.14 %, respectively. To verify the analytical specificity and accuracy of the GC- IDMS
method a HPLC-diode array method was developed for comparison and confirmation of
results. The HPLC-diode array method allows the separation of all dimethylxanthines and
related compounds, that may cause interferences: theophylline, theobromine, paraxanthine,
paracetamol, caffeine, and uric acid. The good correlation between the results obtained from
GC-IDMS and HPLC-diode array measurements confirms the specificity of GC-IDMS
measurement procedures.
The GC-IDMS reference measurement procedure is actually used for setting target values in
EQAS for theophylline.
The IFCC reference measurement procedure for HbA1c is a LC-MS method with quantification
by external standards. This method has been optimized and evaluated. The long-term stability
of several LC-MS measuring instruments and their effect on the quality of the results has been
evaluated. The HPLC conditions were optimized by changing the composition of the buffer, the

48/53
gradient elution profile and using a splitting system. By the use of the appropriate LC-MS
equipment and the optimized HPLC conditions successful measurements were made in several
international intercomparison studies of the IFCC Working Group on HbA1c Standardisation. The
method had a bias between 0.1 % and 0.65 %. The imprecision of the procedure was
below 2.0 %, which was well within the acceptability criteria for the reference
measurement laboratories of the IFCC network for HbA1c. The optimized reference
measurement procedure for determination of HbA1c is actually used for setting target values in
our external quality assessment schemes at INSTAND e.V. The reference laboratory at
INSTAND e.V. is accepted as an IFCC-Reference Laboratory for HbA1c (one of less than 20 in
the world).
An important progress in the development of LC-MS methods as reference measurement
procedures for the determination of digoxin, digitoxin and the immunosuppressive drugs
sirolimus, everolimus, tacrolimus and cyclosporin A was the discovery, that these compounds
are forming adducts with Cs+ ions, which are detectable both in SIM and in MRM mode. By
adding an excess of Cs+ ions to the elution buffer Cs+ adducts could be obtained. In MRM Cs+ is
measurable as product ion of the Cs+ adducts of the drugs. This new principle in HPLC-mass
spectrometry analysis results in a higher analytical specificity and better signal-to-noise ratio, by
replacement of undesirable adduct formations with Na+ and K+
a stabilizing effect of the Cs+ adduct on undesirable in source fragmentation
a clearly defined fragmentation pattern in MRM transmission
Our reference measurement procedure for the determination of digoxin and digitoxin is an
isotope dilution LC-MS analysis with electrospray ionisation after a liquid-liquid extraction. The
isotope-labelling of the pure analytes was performed in our laboratory.
In the SIM mode the Cs+ adduct of deuterated and native digoxin and digitoxin has been
measured. The LC-MS measurement procedure was further modified to a LC-MS/MS method.
The mean recovery in spiked serum samples in the therapeutic range for digoxin was 99.95 %
and for digitoxin 100.2 %, the bias was 0.05 % and 0.2 % respectively. In the SIM mode the
imprecision was between 1.26 % and 2.91 % for digoxin and 0.79 % and 2.00 % for digitoxin.
In EQAS samples the corresponding coefficients of variation were between 1.26 % and
3.18 % and 1.21 % and 1.46 %, respectively. In the MRM mode the coefficients of
variation were between 1.65 % and 2.28 % for digoxin and 1.13 % and 1.44 % for digitoxin.

49/53
The newly developed reference measurement procedure for determination of digoxin and
digitoxin is used for setting target values in External Quality Assessment Schemes.
A new basis was developed for a reference measurement procedure for the determination of
immunosuppressive drugs. The immunosuppressive drugs sirolimus, everolimus, tacrolimus and
cyclosporin A were measured as Cs+ adducts in the MRM mode. Analogues of the drugs were
used as internal standards. In contrast to existing routine methods the immunosuppressive
drugs could be chromatographically separated using a ternary gradient profile. In standard
solutions the coefficient of variation was between 2.11 % and 2.57 %. On the basis of this
principle of measurement the further development of the method to a reference measurement
procedure is on the way. For a better quantification we are producing stable isotope-labelled
internal standards in our laboratory.
The analytical basis for a reference measurement procedure for glibenclamide and other
sulfonylureas is established. The development of a reference measurement procedure for
glibenclamide for setting target values in EQAS is an actual project at INSTAND e.V.
The study demonstrates how reference measurement procedures are developed, improved and
evaluated and shows, that reference measurement procedures are thoroughly investigated
measurement procedures enclosed in a dynamic process of optimization, leading to traceable
and reliable results on highest metrological order. Providing and using reference measurement
procedures improves the quality of the medicine laboratory performance.

50/53
6. REFERENCES
1. Directive 98/79/EC of the European Parliament and of the Council on in vitro diagnostic
medical devices. Official Journal of the European Communities (1998)
2. VIM: International Vocabulary of Basic and General Terms in Metrology; DIN Deutsches
Institut für Normierung e.V., Beuth Verlag GmbH, 2. Auflage (1994)
3. EN 14136: 2004 Use of external quality assessment schemes in the assessment of the
performance of in vitro diagnostic examination procedures
4. EN ISO 17511: 2002 In vitro diagnostic medical devices- Measurement of quantities in
samples of biological origin- Metrological traceability of values assigned to calibrators
and control materials
5. EN ISO 18153: 2000 In vitro diagnostic medical devices- Measurement of quantities in
samples of biological origin- Metrological traceability of values for catalytic concentration
of enzymes assigned to calibrators and control materials
6. Guideline of the Federal Medical Council for Quality Assurance of Quantitative Analyses
in Laboratory Medicine. Deutsches Ärzteblatt 98, 2747-2759 (2001)
7. ISO 15193: 2005 In vitro diagnostic medical devices- Measurement of quantities in
samples of biological origin- Presentation of reference measurement procedures
8. ISO 15194: 2005 In vitro diagnostics medical devices- Measurement of quantities in
samples of biological origin- Description of reference materials
9. ISO 15195: 2003 Laboratory Medicine- Requirements for reference measurement
laboratories
10. ISO 17025: 2005 General requirements for the competence of testing and calibration
laboratories
11. Hoff, P. Methoden-Entwicklung zur Bestimmung von Glibenclamid in biologischem
Material mittels Hochdruckflüssigkeitschromatographie unter Verwendung eines
Fluoreszenz-Detektors. Diploma thesis, Niederrhein University of Applied Sciences,
Krefeld, Germany (1992)
12. Standard, Measurements and Testing; Contract no. SMT4_CT98-2248; European
Commision (11-09-1990)
13. Kawashima, K., Kuzuya, T., Matsuda, A. Radioimmunosassay of glibenclamide. Diabetes
28, 221-226 (1979)
14. Matsuda, A., Kuzuya, T., Sugita, Y., Kawashima, K. Plasma levels of glibenclamide in
diabetic patients during its routine clinical administration determined by a specific
radioimmunoassay. Horm. Metab. Res. 15, 425-428 (1983)
51/53
15. Susanto, F., Reinauer, H. Glibenclamide in serum: comparison of high-performance
liquid chromatography using fluorescence detector and liquid chromatography/mass
spectrometry with atmospheric-pressure chemical-ionization (APCI LC/MS). Fresenius J.
Anal. Chem. 356, 352-357 (1996)
16. Susanto, F., Reinauer, H. Screening and simultaneous quantitative measurement of six
sulfonylureas in serum by liquid chromatography/mass spectrometry with atmospheric-
pressure chemical-ionisation (APCI LC/MS). Fresenius J. Anal. Chem. 357, 1202-1205
(1997)
17. Jeppsson, J.O., Kobold, U., Barr, J., Finke, A., Hoelzel, W., Hoshino, T., Miedema, K.,
Mosca, A., Mauri, P., Paroni, R., Thienpont, L., Umemoto, M., Weykamp, C. Approved
IFCC reference method for the measurement of HbA1c in human blood.
Clin.Chem.Lab.Med. 40, 78-89 (2002)
18. www.ifcchba1c.com
19. Varshosaz, J., Ghafghazi, T., Raisi, A., Falamarzian, M. Biopharmaceutical
characterization of oral theophylline and aminophylline tablets. Quantitative correlation
between dissolution and bioavailability studies. Eur. J. Pharm. Biopharm. 50, 301-306
(2000)
20. Susanto, F., Humfeld, S., Niederau, C.M., Reinauer, H. A method for the determination
of theophylline in serum by isotope dilution mass spectrometry. Fresenius J. Anal. Chem.
344, 549-553 (1992)
21. Thienpont, L.M.,Van Nieuwenhove, B., Stöckl, D., De Leenheer, A.P. Candidate reference
method for determining serum theophylline applied to target-setting in external quality
assessment and routine method evaluation. Clin. Chem. 40, 1503-1511 (1994)
22. Beaudry, F., Lavoie, J.P., Vachon, P. Development of an electrospray ionization mass
spectrometric method for the quantification of theophylline in horse serum. Biomed.
Chromatogr. 19, 643-648 (2005)
23. The Diabetes Control and Complications Trial Research Group, “The effect of intensive
treatment of diabetes on the development and progression of longterm complications in
insulin-dependent diabetes mellitus”. N. Engl. J. Med. 329, 977-986 (1993)
24. ADA., Clinical Practice Guidelines 2001. Diabetes Care 24, 1-133 (2001)
25. Little, R.R., Wiedmeyer, H.M., England J.D., Wilke, A.L., Rohlfing, C.L., Wians, F.H.,
Jacobson, J.M., Zellmer, V., Goldstein, D.E. Interlaboratory standardization of
measurements of glycohemoglobins. Clin. Chem. 38, 2363-2364 (1992)
26. Goldstein, D.E., Little, R.R., Wiedmeyer, H.M., England J.D., McKenzie, E.M. Glycated
Hemoglobin: Methologies and clinical applications. Clin. Chem. 32, B64-B70 (1986)

52/53
27. NCCLS. Development of Designated Comparison Methods for Analytes in the Clinical
Laboratory - Second Edition; Proposed Guideline. NCCLS publication NRSCL6-P2.
Villanova, PA: NCCLS;1993.
28. Mortier, K.A., Zhang, G.F., van Peteghem, C.H., Lambert, W.E. Adduct formation in
quantitative bioanalysis: effect of ionization conditions on paclitaxel. J. Am. Soc. Mass
Spectrom. 15, 585-592 (2004)
29. Lambert, W. Pitfalls in LC-MS(-MS) analysis. T + K 71, 64-68 (2004) [presented at the
Joint GTFCh/TIAFT Symposium “Analytical Pitfalls and Trends in Clinical and Forensic
Toxicology” during the Analytical Conference, May 12th, Munich 2004
30. Lopes, N.P., Stark, C.B.W., Hong, H., Gates, P.J., Staunton, J. A study of the effect of
pH, solvent system, cone potential and the addition of crown ethers on the formation of
the monensin protonated parent ion in electrospray mass spectrometry. Analyst 126,
1630-1632 (2001)
31. Emmert, J., Pfluger, M., Wahl, F. Influence of Na+ and K+ concentration in solvents on
mass spectra of peptides in LC/ESI-MS. LC GC Europe , 646-649(December 2004)
32. Sugergat, H., Unger, K.K., Emmert, J., Wendt, J. Mandel, F. Determination of digoxin in
human serum by LC-MS with on-line sample preparation. Agilent Technologies, The
Application Book, 12-13 (April 2002)
33. Vogeser, M., Spöhrer U. Pitfall in the high-throughput quantification of whole blood
cyclosporin A using liquid chromatography-tandem mass spectrometry. Clin. Chem. Lab.
Med. 43, 400-402 (2005)
34. Gao, S., Zhang, Z.P., Karnes, H.T. Sensitivity enhancement in liquid
chromatography/atmospheric pressure ionization mass spectrometry using derivatization
and mobile phase additives. J. Chromatogr. B 825, 98-110 (2005)
35. Fillee, C., Mourad, M., Squifflet, J.P., Malaise, J., Lerut, J., Reding, R., Borghgraef, P.,
Vanbinst, R., Wallemacq, P.E. Evaluation of a new immunoassay to measure sirolimus
blood concentrations compared to a tandem mass-spectrometric chromatographic
analysis. Transplant Proc. 37, 2890-2891 (2005)
36. Johnson, R.N., Sargon, R., Woollard, G., Davidson, J. An evaluation of the Abbott IMx
sirolimus assay in relation to a high-performance liquid chromatography-ultraviolet
method. Ann. Clin. Biochem. 42, 394-397 (2005)
37. Westley, I.S., Morris, R.G., Taylor, P.J., Salm, P., James, M.J. CEDIA sirolimus assay
compared with HPLC-MS/MS and HPLC-UV in transplant recipient specimens. Ther. Drug
Monit. 27, 309-314 (2005)
38. Khoschsorur, G. Simultaneous measurement of sirolimus and everolimus in whole blood
by HPLC with ultraviolet detection. Clin. Chem. 51, 1721-1724 (2005)
53/53
39. Streit F., Armstrong V.W., Oellerich M. Rapid liquid chromatography-tandem mass
spectrometry routine method for simultaneous determination of sirolimus, everolimus,
tacrolimus and cyclosporin A in whole blood. Clin. Chem. 48, 955-958 (2002)
40. Ceglarek U., Lembcke J., Fiedler G.M., Werner M., Witzigmann H., Hauss J.P., Thiery J.
Rapid simultaneous quantification of immunosuppressants in transplant patients by
turbulent flow chromatography combined with tandem mass spectrometry. Clin. Chim.
Acta 346,181-190 (2004)
41. Vogeser M., Fleischer C., Meiser B., Groetzner J., Spöhrer U., Seidel D. Quantification of
sirolimus by liquid chromatography-tandem mass spectrometry using on-line solid-phase
extraction. Clin. Chem. Lab. Med. 40, 40-45 (2002)
42. Streit F., Armstrong V.W., Oellerich M. Mass interferences in quantification of cyclosporin
using tandem mass spectrometry without chromatography. Ther.Drug Monit. 25, 506
(2003)
43. Roberts, N.B., Dutton, J., Higgins, G., Allars, L. Evaluation of a novel semi-automated
HPLC procedure for whole blood cyclosporin A confirms equivalence to adjusted
monoclonal values from Abbott TDx. Clin. Chem. Lab. Med.43, 228-236 (2005)
44. Hatsis, P. Volmer, D.A. Evaluation of a cyano stationary phase for the determination of
tacrolimus, sirolimus and cyclosporin A in whole blood by high-performance liquid
chromatography-tandem mass spectrometry. J. Chromatogr. 809, 287-294 (2004)
45. Tai, S.S.C., Welch, M.J. Development and evaluation of a reference measurement
procedure for the determination of estradiol-17 in human serum using isotope-dilution
liquid chromatography-tandem mass spectrometry. Anal. Chem. 77, 6359-6363 (2005)
46. King, R., Bonfiglio, R., Fernandez-Metzler, C., Miller-Stein, C., Olah, T. Mechanistic
investigation of ionization suppression in electrospray ionization. Am.Soc.Mass Spectrom.
11, 942-950 (2000)
47. Balogh, M.P. Debating resolution and mass accuracy. LC-GC Europe 17, 152-159 (2004)
48. Kessler, A. Massenspektrometrische Isotopenverdünnungsanalyse von Digoxin und
Digitoxin in menschlichem Serum – Referenzmethode in der klinischen Chemie.
Dissertation zur Erlangung des Doktorgrades der Mathematisch-Naturwissenschaftlichen
Fakultät der Rheinischen Friedrich-Wilhelms-Universität Bonn (2001)
49. Marwah, A., Marwah, P., Lardy, H. Analysis of ergosteroids. VIII: Enhancement of signal
response of neutral steroidal compounds in liquid chromatographic-electrospray
ionization mass spectrometric analysis by mobile phase additives. J. Chromatogr. A,
964, 137-151 (2002)
50. Ikonomou, M.G., Blades, A.T., Kebarle, P. Investigations of the electrospray interface for
liquid chromatography/mass spectrometry. Anal. Chem. 62, 957-967 (1990)

I
Xie, Y., Zacharias, E., Hoff, P., Tegtmeier, F.
“Ion channel involvement in anoxic depolarisation induced by cardiac arrest in rat brain”
J. Cereb. Blood Flow Metab.15, 587-594 (1995)


II
Kress, M., Meißner, D., Kaiser, P., Hanke, R., Wood, W.G.
“Determination of theophylline by HPLC and GC-IDMS, the effect of chemically similar
xanthine derivatives on the specificity of the method and the possibility of paracetamol as
interfering substance”
Clin. Lab. 48, 541-551 (2002)


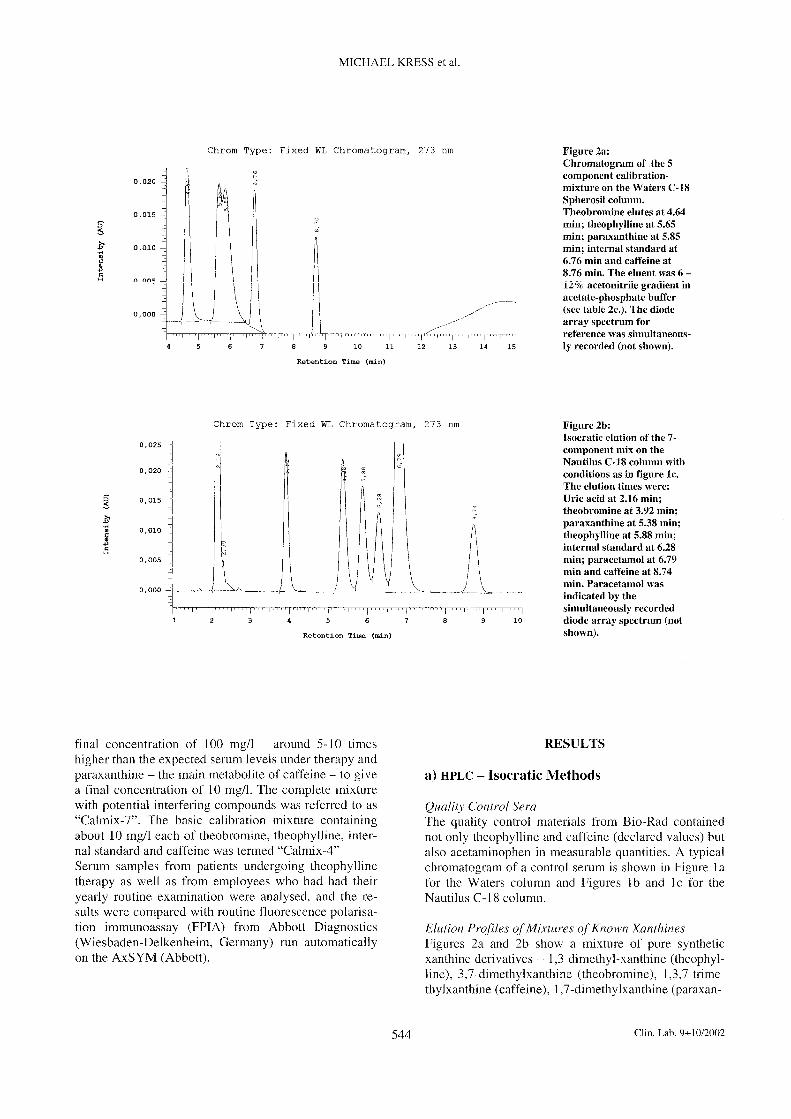


III
Kress, M., Meißner, D., Kaiser, P., Hanke, R., Wood, W.G.
“The measurement of theophylline in human serum or plasma using gas chromatography
and isotope dilution-mass-spectrometry (GC-IDMS) taking other substituted xanthines
into consideration”
Clin. Lab. 48, 535-540 (2002)


IV
Kress, M., Meißner, D., Kaiser, P., Wood, W.G.
“How to make things work again- Troubleshooting using the GC-IDMS
determination of triacylglycerols as an example”
Clin. Lab. 48,635-646 (2002)


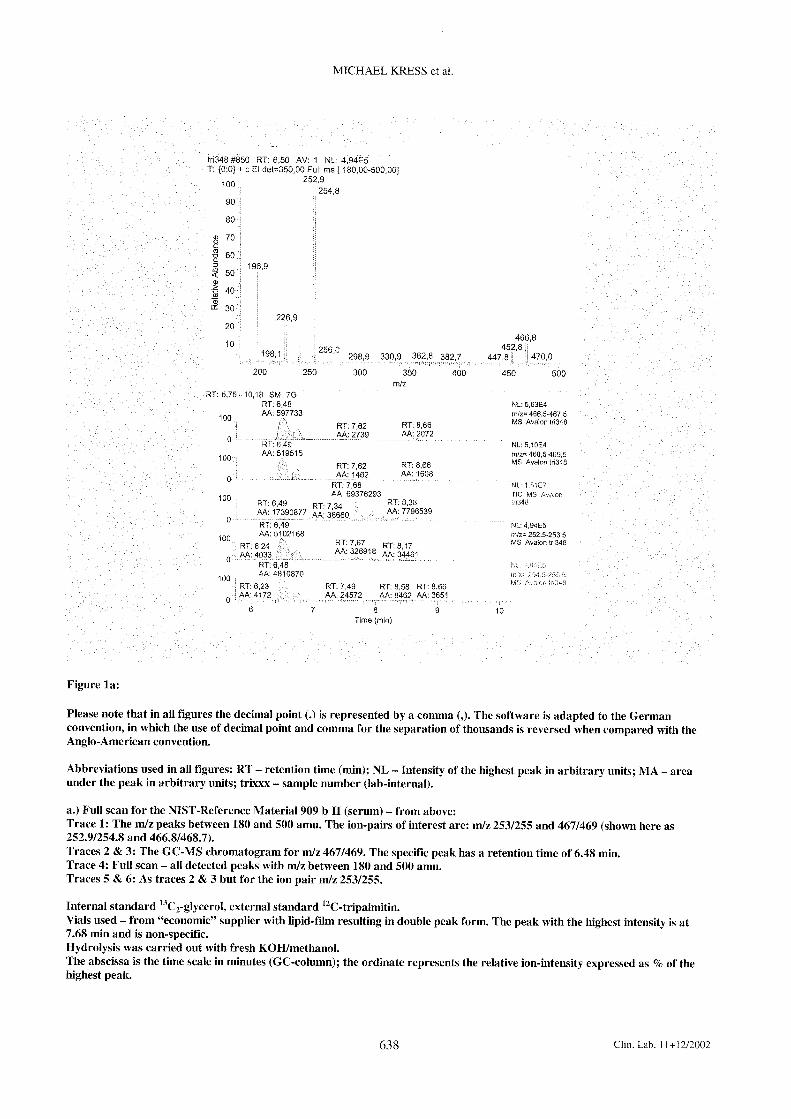


V
Kaiser, P., Kramer, U., Meißner, D., Kress, M., Wood, W.G., Reinauer, H.
“Determination of the cardiac glycosides digoxin and digitoxin by liquid chromatography
combined with isotope-dilution mass spectrometry (LC-IDMS)
- a candidate reference measurement procedure”
Clin. Lab. 49, 329-343 (2003)


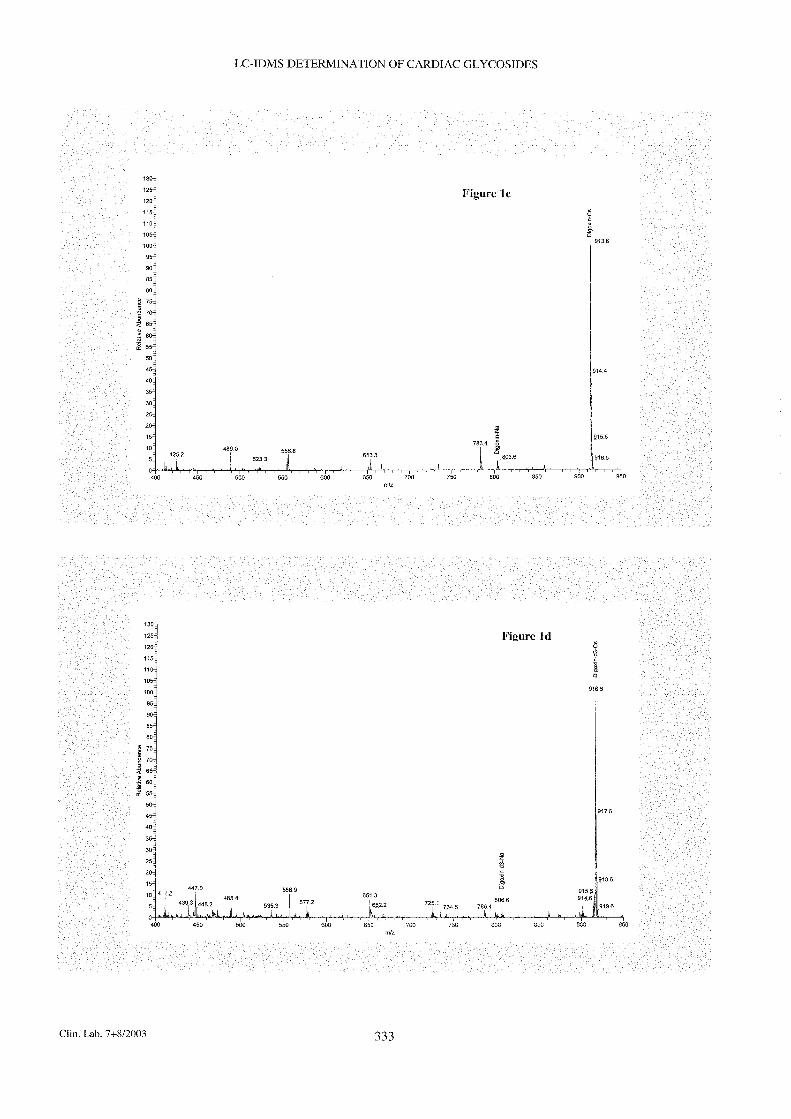


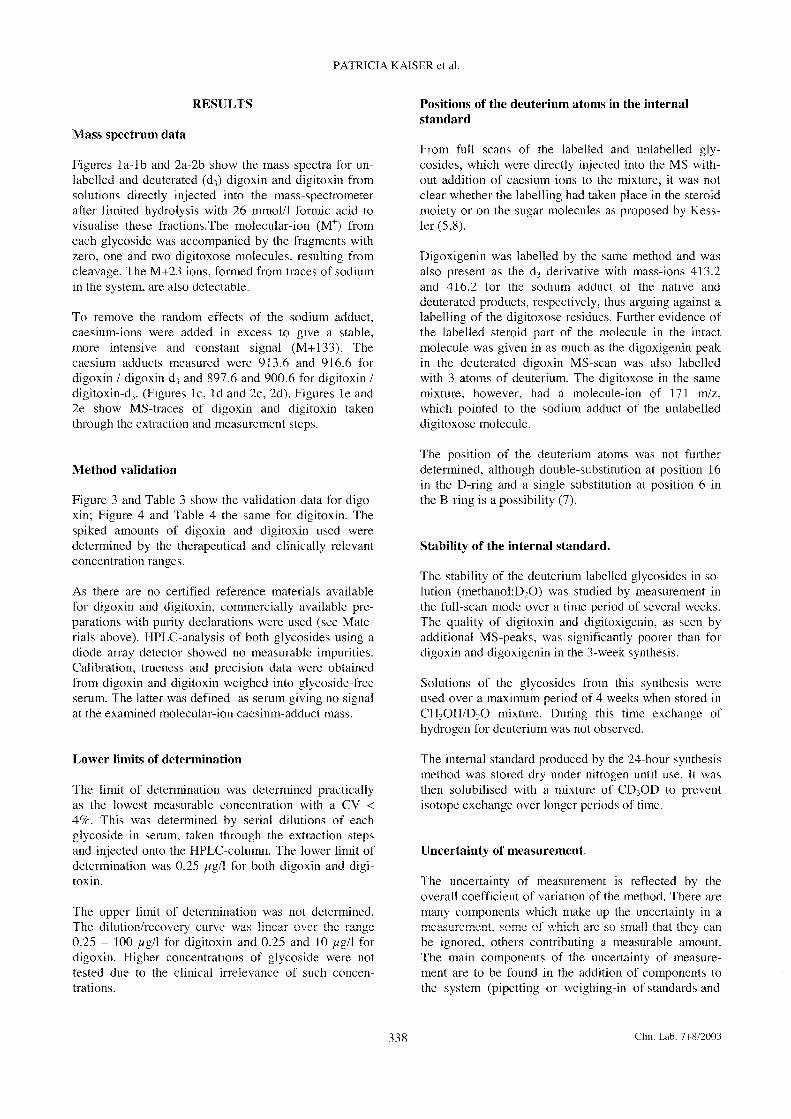


VI
Kaiser, P., Akerboom, T., Wood, W.G., Reinauer, H.
“A novel LC-IDMS/MS method for the determination of the cardiac glycosides digoxin and
digitoxin using caesium adducts”
Clin. Lab. 52, 37-42 (2006)


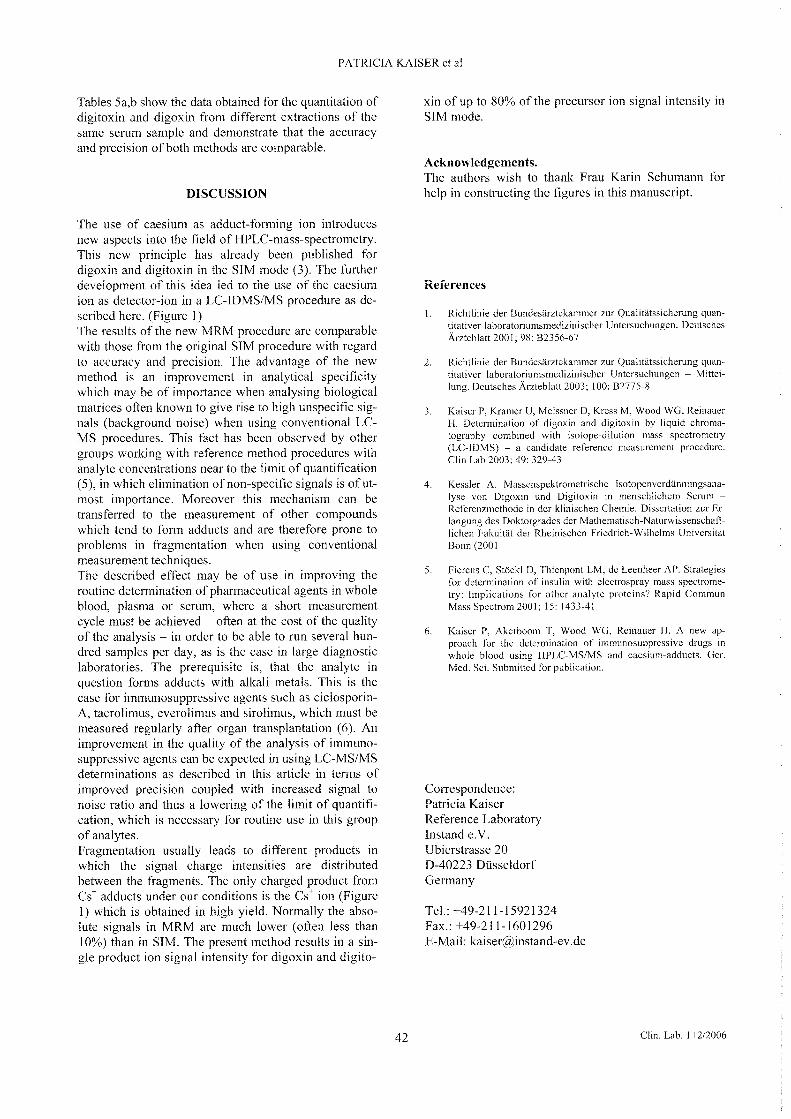

VII
Kaiser, P., Akerboom, T., Wood, W.G., Reinauer, H.
“A new approach for the determination of immunosuppressive drugs using
HPLC-MS/MS and Cs+ adducts”
Ger.Med.Sci.4: Doc01 (2006)


Research Article
A new approach for the determination of immunosuppressive drugs using HPLC-MS/MS and Cs
+ adducts
Neuer Ansatz zur Bestimmung von Immunsuppressiva unter Einsatz von HPLC-MS/MS und Cs
+-Addukten
Patricia Kaiser1*
, Theodorus Akerboom2, William Graham Wood
1, Hans
Reinauer1
1Reference Laboratory, Instand e.V., Düsseldorf, Germany 2Department of Clinical Chemistry and Laboratory Diagnostics, Heinrich-Heine- University, Düsseldorf, Germany
GMS Ger Med Sci 2006;4:Doc01 provisional PDF
Abstract
In this study a new principle of measurement in LC-MS/MS (liquid chromatography mass spectro-metry) for determination of the immunosuppressive drugs sirolimus, everolimus, tacrolimus, and cyclosporin A has been introduced by using the Cs
+ ion as the product ion in the multiple reaction
monitoring mode (MRM).
Separation of the immunosuppressive agents was achieved using a phenyl-hexyl-RP column together with a ternary gradient elution profile, consisting of water, methanol and acetonitrile combined with 0.1% v/v formic acid and 0.1 mmol/l Cs
+.
Quantification was performed using cyclosporin D, ascomycin and 32-desmethoxy-rapamycin as internal standards.
The inter-run precision of this new method, expressed as the coefficient of variation, was 2.57% for sirolimus, 2.11% for everolimus, 2.31% for tacrolimus and 2.11% for cyclosporin A.
Keywords: immunosuppressive drugs, LC-MS/MS, Cs+ adducts
Zusammenfassung
Ein neues Messprinzip in der LC-MS/MS (Flüssigchromatographie mit Massenspektrometrie) wird zur Bestimmung der Immunsuppressiva Sirolimus, Everolimus, Tacrolimus und Cyclosporin A vorgestellt. Hierbei wird das Cs
+-Ion als Produkt-Ion im MRM (multiple reaction monitoring) Modus gemessen.
Eine chromatographische Trennung der Immunsuppressiva wurde mit einer Phenyl-Hexyl-RP Säule erzielt. Die Elution erfolgte unter Verwendung eines ternären Gradienten aus Wasser, Methanol und Acetonitril mit 0,1% v/v Ameisensäure und 0,1 mmol/l Cs
+. Für die Quantifizierung wurden Cyclosporin
D, Ascomycin und 32-Desmethoxy-Rapamycin eingesetzt. Die Wiederholpräzision der neuen Methode
*Corresponding author: Dipl. Ing. Patricia Kaiser, Reference Laboratory, Instand e.V., Ubierstr. 20, 40223 Düsseldorf, Tel.: +49-211-15921324, Fax: +49-211-1601296, eMail: [email protected]

Kaiser et al. A new approach for the determination of immunosuppressive drugs using HPLC-MS/MS and Cs+ adducts. GMS
Ger Med Sci. 2006;4:Doc01. provisional PDF
2
hat einen Varianzkoeffizienten (VK) von 2,57% für Sirolimus, 2,11% für Everolimus, 2,31% für Tacrolimus und 2,11% für Cyclosporin A.
Schlüsselwörter: Immunosuppressiva, LC-MS/MS, Cs+-Addukte
Introduction
The therapeutic drug monitoring (TDM) of immunosuppressive drugs in blood of organ-transplanted patients is of utmost importance to prevent intoxication or rejection due to incorrect dosage. Commonly used immunosuppressive agents are calcineurin inhibitors such as cyclosporin A and tacrolimus or the mTOR inhibitors sirolimus and everolimus. Recently a new therapeutic strategy has been to combine immunosuppressive drugs with different mechanisms of action in order to reduce undesirable side effects. This often leads to a lowering of the therapeutic concentrations of these drugs. Analytical problems occur in the detection of clinically relevant low levels of immunosuppressive agents, which in turn requires a more sensitive analytical measurement procedure at low analyte concentrations for all the drugs used.
Several LC-MS/MS methods for routine measurement of immunosuppressive drugs in whole blood have been described [1], [2], [3]. These routine methods have been designed for high throughput combined with a short turnaround time. Methods without chromatographic separation of the analytes require cycles of only a few minutes per sample. Unfortunately, co-elution of the compounds usually leads to a bias in the analytical results, due to a lack of specificity of the mass transition in the MRM mode of the LC-MS/MS measurements [4], [5]. Avoidance of this phenomenon requires separation and detection of the parent substances from the different metabolites with biological activity.
LC-MS/MS procedures for determination of serum levels of digoxin and digitoxin have been recently published from this laboratory [6], [7] using Cs
+ adduct formation, which allows potential improvement
of both analytical sensitivity and specificity.
The aim of the present study was to develop a method for determination of immunosuppressive agents, by utilising the principle of measurement of Cs
+ adducts, thus forming the basis of a reliable
method for defining target values for immunosuppressive drugs in external quality assessment schemes (EQAS).
This article describes a LC-MS/MS method with complete chromatographic separation of the immuno-suppressive drugs cyclosporin A (cyclosporin A, Sandimmune
®), tacrolimus (FK-506, Prograf
®),
sirolimus (rapamycin, Rapamune®) and everolimus (Certican
®), with cyclosporin D, ascomycin and 32-
desmethoxy-rapamycin as internal standards.
Materials and methods
Chemicals
Rapamycin (>99%), tacrolimus (FK-506, >99%) and cyclosporin A (>99%) were obtained from LC Laboratories, Woburn, MA, USA. Cyclosporin D and everolimus were a kind gift from Recipe, München, Germany. 32-desmethoxy-rapamycin was a kind donation from Wyatt, St. Davids, PA, USA. Ascomycin, formic acid (98%, puriss. p.a.) and cesium hydroxide (purity 99.97%), were purchased from Sigma-Aldrich, Taufkirchen, Germany. Methanol (LiChrosolv) was obtained from Merck, Darmstadt, Germany.
Water was prepared using the purification system Direct-Q™ 5 (Millipore GmbH, Eschborn, Germany).
Apparatus
The HPLC system used was from Shimadzu (Duisburg, Germany) consisting of a SCL-10A system controller, three LC-10ADvp pumps (A, B, C), a DGU-14A degasser; a SIL-10AD autoinjector; a CTU-10AS column oven; and a FCU-12A Flow Switch (rotary valve).
The Mass Spectrometer was a 4000 QTrap equipped with a TurboVTM
ESI source with Turboion Spray
TM probe from Applied Biosystems (MDS-Sciex, Darmstadt, Germany).

Kaiser et al. A new approach for the determination of immunosuppressive drugs using HPLC-MS/MS and Cs+ adducts. GMS
Ger Med Sci. 2006;4:Doc01. provisional PDF
3
HPLC-MS/MS measurement conditions
The chromatographic separation was performed on a phenyl-hexyl-RP column (Luna®, 2 x 150 mm, 5
µm, Phenomenex, Aschaffenburg, Germany).
A ternary gradient was used for elution consisting of eluent A (pump A): 0.1% v/v HCOOH in water + 0.1 mmol/l CsOOCH; eluent B (pump B): 0.1% v/v HCOOH in methanol + 0.1 mmol/l CsOOCH and eluent C (pump C): 0.1% v/v HCOOH in CH3CN + 0.1 mmol/l CsOOCH. CsOOCH was produced by neutralising CsOH with HCOOH to pH 7. The flow rate was 300 µl/min. The column temperature was set at 50°C. In order to avoid contamination of the ESI source a switching valve system (rotary valve A) was introduced. At position 0 of rotary valve A the eluate is passed into the ESI source. At position 1 the eluate is directed into waste (Figure 1, Table 1).
Figure 1: Gradient profile for HPLC separation (% of eluent B in green, % of eluent C in blue)
Table 1: Gradient profile for HPLC separation in detail
The MS detection was performed in the positive ion mode. The mass transitions (m/z) for MS detection are given in Table 2. The m/z of 132.9 amu is the mass of the Cs
+ ion.

Kaiser et al. A new approach for the determination of immunosuppressive drugs using HPLC-MS/MS and Cs+ adducts. GMS
Ger Med Sci. 2006;4:Doc01. provisional PDF
4
Table 2: Mass transitions of the four immunosuppressive agents tacrolimus, sirolimus, everolimus and cyclosporin A and the internal standards ascomycin, 32-desmethoxy-rapamycin and cyclosporin D
The settings of the mass spectrometer are given in Table 3. (The abbreviations for settings are specific to the 4000 Q TRAP software used to control the system.)
Table 3: Instrument settings in the 4000 Q TRAP for MRM mode
Results
As shown in previous publications [6], [7] the generation of Cs+ ion adducts combined with LC-MS/MS
offered great advantages in analysis of digoxin and digitoxin, both in SIM and in MRM mode. It was observed, that in the MRM mode, the Cs
+ adduct as parent ion decomposes in a way that the Cs
+ ion
becomes detectable as product ion.
This principle of measurement was investigated for the immunosuppressive agents tacrolimus, sirolimus, everolimus, cyclosporin A together with the analogues ascomycin, 32-desmethoxy-rapamycin and cyclosporin D used as internal standards.

Kaiser et al. A new approach for the determination of immunosuppressive drugs using HPLC-MS/MS and Cs+ adducts. GMS
Ger Med Sci. 2006;4:Doc01. provisional PDF
5
The generation of Cs+ adducts is examplified for cyclosporin A in Figure 2. The Q1 scan was
performed by using a standard solution, dissolved in eluent B, which contained 0.1 mM Cs+. Under
these conditions the singly charged Cs+ adduct generates the major signal (1335 amu). Only small
amounds of the protonated form (1203 amu), the Na+ adduct (1225 amu) and the K
+ adduct (1241
amu) are visible. Na+ and K
+ probably originate from the manufacturing procedure and can be
separated by HPLC.
Figure 2: Q1 scan of a cyclosporin A standard solution (1 µg/ml in eluent B) infused at a flow rate of 10 µl/min

Kaiser et al. A new approach for the determination of immunosuppressive drugs using HPLC-MS/MS and Cs+ adducts. GMS
Ger Med Sci. 2006;4:Doc01. provisional PDF
6
Fragmentation of the cyclosporin A Cs+ adduct was studied using an 4000 Q TRAP in the enhanced
product ion scan mode (Figure 3). The ion trap option offers a high mass resolution. In the product ion scan of Cs
+ adduct of cyclosporin A with a parent mass of 1335 amu, the mass of 132.9 amu is the
main signal. The isotope pattern of this signal and the defined mass indicates that this signal originates solely from Cs
+.
Figure 3: Enhanced product ion scan of a cyclosporin A standard solution (1 µg/ml in eluent B) infused at a flow rate of 10 µl/min

Kaiser et al. A new approach for the determination of immunosuppressive drugs using HPLC-MS/MS and Cs+ adducts. GMS
Ger Med Sci. 2006;4:Doc01. provisional PDF
7
During the mass transition the mass of 1202 amu is lost (Figure 4). This value corresponds to the mass of the unprotonated cyclosporin A molecule. Thus, it can be considered, that cyclosporin A is split off in form of a neutral molecule in the fragmentation process. This concept is supported by the results of the neutral loss scan. This scan demonstrates, that the only source of the neutral loss of the unprotonated cyclosporin A molecule is the Cs
+ adduct of cyclosporin A with the mass of 1235 amu.
Figure 4: Neutral loss scan of mass 1202 amu (1 µg/ml in eluent B) infused at a flow rate of 10 µl/min

Kaiser et al. A new approach for the determination of immunosuppressive drugs using HPLC-MS/MS and Cs+ adducts. GMS
Ger Med Sci. 2006;4:Doc01. provisional PDF
8
The adduct formation with Cs+ and the subsequent collision induced dissociation with Cs
+ as the
product ion was observed for all seven analytes. This principle of detection was used for the development of the chromatographic separation of all immunosuppressive drugs. A baseline separation was realized by using a ternary gradient (Figure 5).
Figure 5: HPLC-MS/MS chromatogram (overlaid graphs of single mass traces) of a standard mixture of tacrolimus (8.59 min), sirolimus (11.59 min), everolimus (12.70 min), cyclosporin A (24.12 min) and cyclosporin D (27.16 min), 10 µl (1 µg/ml) injected (for details see Table 2, Figure1)
In Figures 6-12 chromatograms of standard solutions of tacrolimus (Figure 6), sirolimus (Figure 7), everolimus (Figure 8), cyclosporin A (Figure 9) and the analogues cyclosporin D (Figure 10), ascomycin (Figure 11) and 32-desmethoxy-rapamycin (Figure 12) are shown in separate runs. In addition to the declared components, these standard solutions contain additional substances (Figures 6-10), which are separated during the chromatographic procedure. Tacrolimus, sirolimus, everolimus, ascomycin and 32-desmethoxy-rapamycin contain isobaric components, which probably represent isomers, as has been described elsewhere [8]. For the cyclosporins A and D cross contamination is observed (Figures 11-12). Cyclosporin A contains about 5% cyclosporin D and cyclosporin D contains about 1% cyclosporin A. This is of importance, as cyclosporin D is used as internal standard for quantification of cyclosporin A.

Kaiser et al. A new approach for the determination of immunosuppressive drugs using HPLC-MS/MS and Cs+ adducts. GMS
Ger Med Sci. 2006;4:Doc01. provisional PDF
9
Figure 6: HPLC-MS/MS chromatogram (overlaid graphs of mass traces defined in Table 2) of a tacrolimus standard solution, 10 µl (1 µg/ml)
Figure 7: HPLC-MS/MS chromatogram (overlaid graphs of mass traces defined in Table 2) of a sirolimus standard solution, 10 µl (1 µg/ml)

Kaiser et al. A new approach for the determination of immunosuppressive drugs using HPLC-MS/MS and Cs+ adducts. GMS
Ger Med Sci. 2006;4:Doc01. provisional PDF
10
Figure 8: HPLC-MS/MS chromatogram (overlaid graphs of mass traces defined in Table 2) of an everolimus standard solution, 10 µl (1 µg/ml)

Kaiser et al. A new approach for the determination of immunosuppressive drugs using HPLC-MS/MS and Cs+ adducts. GMS
Ger Med Sci. 2006;4:Doc01. provisional PDF
11
Figure 9: HPLC-MS/MS chromatogram of a cyclosporin A standard solution, 10 µl (1 µg/ml)upper panel: overlaid graphs of mass traces defined in Table 2lower panel: extracted mass trace of cyclosporin D

Kaiser et al. A new approach for the determination of immunosuppressive drugs using HPLC-MS/MS and Cs+ adducts. GMS
Ger Med Sci. 2006;4:Doc01. provisional PDF
12
Figure 10: HPLC-MS/MS chromatogram of a cyclosporin D standard solution, 10 µl (1 µg/ml)upper panel: overlaid graphs of mass traces defined in Table 2lower panel: extracted mass trace of cyclosporin A

Kaiser et al. A new approach for the determination of immunosuppressive drugs using HPLC-MS/MS and Cs+ adducts. GMS
Ger Med Sci. 2006;4:Doc01. provisional PDF
13
Figure 11: HPLC-MS/MS chromatogram (overlaid graphs of mass traces defined in Table 2) of a ascomycin standard solution, 10 µl (1 µg/ml)
Figure 12: HPLC-MS/MS chromatogram (overlaid graphs of mass traces defined in Table 2) of a 32-desmethoxy-rapamycin standard solution, 10 µl (1 µg/ml)
For quantification of tacrolimus, ascomycin was used as internal standard, for sirolimus and everolimus the internal standard used was 32-desmethoxy-rapamycin.
The validity of this method was tested during the course of this study, in which the inter-run precision was measured using standard solutions. The precision measured – expressed as the coefficient of variation (CV) - under these conditions was 2.57% for sirolimus, 2.11% for everolimus, 2.31% for tacrolimus and 2.11% for cyclosporin A (Table 4).

Kaiser et al. A new approach for the determination of immunosuppressive drugs using HPLC-MS/MS and Cs+ adducts. GMS
Ger Med Sci. 2006;4:Doc01. provisional PDF
14
Table 4: Inter run precision of a standard mixture of tacrolimus, sirolimus, everolimus, cyclosporin A, cyclosporin D, ascomycin and 32-desmethoxy-rapamycin
Discussion
Recent LC-MS/MS measurements of immunosuppressive drugs have often used NH4+ adducts, which
give rise to several different product ions [4]. Addition of Cs+ ions reduced the number of product ions
to one single product ion, namely the Cs+ ion, which is measurable with high specificity and high signal
intensity. It is of utmost importance to have a highly specific analytical method with high accuracy and precision for use as an intended reference measurement procedure. The specificity of current LC-MS/MS methods should be improved by chromatographic separation [9]. In the method presented here, all four immunosuppressive drugs are fully separated. Different internal standards listed in the text have been used for the quantification of the four immunosuppressive drugs. The best results were obtained using the corresponding analogues, namely ascomycin for tacrolimus, 32-desmethoxy-rapamycin for sirolimus and everolimus and cyclosporin D for cyclosporin A. This has been discussed elsewhere by Vogeser et al [4].
A baseline separation of cyclosporin D from cyclosporin A has been realized, as well as the separation of sirolimus from 32-desmethoxy-rapamycin. If needed, separation of everolimus from the internal standard 32-desmethoxy-rapamycin or tacrolimus from the internal standard ascomycin can be made by slight modifications of the ternary gradient profile.
Until now, there are no pure reference materials available for the immunosuppressive agents. All analytes used have been extracted from biological sources and contain sodium and potassium ions (see Figure 2) which can be removed by chromatographic separation so that the presence of Na
+ and
K+ adducts was less than 2%.
The high throughput routine methods which have been published for determination of immunosuppressive drugs do not separate the different immunosuppressive agents chromatographically. As a result, the routine methods currently in use are not suitable for setting target values in EQAS. They have limited specificity [4] and are prone to mass interferences [5]. In patient samples problems may occur during quantification, due to the presence of metabolites. At least 13 metabolites have been described for cyclosporin A [10]. The metabolites are usually more hydrophilic than the parent substance, due to hydroxylation, and can be separated by modifying the ternary gradient system used here.
For optimal quantification it is desirable to have stable isotope labelled analytes as internal standards [11]. Unfortunately, at present there are no commercial sources for isotopically labelled immunosuppressive agents. When stable-labelled compounds become available the method presented here can be developed into a reference measurement procedure for immunosuppressive drugs.
References
1. Streit F, Armstrong VW, Oellerich M. Rapid liquid chromatography-tandem mass spectrometry routine method for simultaneous determination of sirolimus, everolimus, tacrolimus, and cyclosporin A in whole blood. Clin Chem. 2002;48(6 Pt 1):955-8.
2. Ceglarek U, Lembcke J, Fiedler GM, Werner M, Witzigmann H, Hauss JP, Thiery J. Rapid simultaneous quantification of immunosuppressants in transplant patients by turbulent flow chromatography combined with tandem mass spectrometry. Clin Chim Acta. 2004;346(2):181-90.

Kaiser et al. A new approach for the determination of immunosuppressive drugs using HPLC-MS/MS and Cs+ adducts. GMS
Ger Med Sci. 2006;4:Doc01. provisional PDF
15
3. Vogeser M, Fleischer C, Meiser B, Groetzner J, Spöhrer U, Seidel D. Quantification of sirolimus by liquid chromatography-tandem mass spectrometry using on-line solid-phase extraction. Clin Chem Lab Med. 2002;40(1):40-5.
4. Vogeser M, Spöhrer U. Pitfall in the high-throughput quantification of whole blood cyclosporin A using liquid chromatography-tandem mass spectrometry. Clin Chem Lab Med. 2005;43(4):400-2.
5. Streit F, Armstrong VW, Oellerich M. Mass interferences in quantification of cyclosporin using tandem mass spectrometry without chromatography. Ther Drug Monit. 2003;25(4):506. Abstract 80.
6. Kaiser P, Kramer U, Meissner D, Kress M, Wood WG, Reinauer H. Determination of the cardiac glycosides digoxin and digitoxin by liquid chromatography combined with isotope-dilution mass spectrometry (LC-IDMS)-a candidate reference measurement procedure. Clin Lab. 2003; 49(7-8):329-43.
7. Kaiser P, Akerboom T, Wood WG, Reinauer H. A novel LC-IDMS/MS method for the determination of the cardiac glycosides digoxin and digitoxin using Cs+ adducts. Clin Lab. 2006: in press.
8. Kirchner GI, Vidal C, Winkler M, Mueller L, Jacobsen W, Franzke A, Sewing KF. LC/ESI-MS allows simultaneous and specific quantification of SDZ RAD and cyclosporine, including groups of their metabolites in human blood. Ther Drug Monit. 1999;21(1):116-22.
9. Vogeser M, Zachoval R, Spöhrer U, Jacob K. Potential lack of specificity using electrospray tandem-mass spectrometry for the analysis of mycophenolic acid in serum. Ther Drug Monit. 2001;23(6):722-4.
10. Tuominen J, Suortti T, Ishikawa K, Lundell J, Koga Y. Separation of cyclosporins by high-performance liquid chromatography and mass spectrometric study of cyclosporin metabolites. Rapid Commun Mass Spectrom. 1998;12(16):1085-91.
11. Taylor PJ, Brown SR, Cooper DP, Salm P, Morris MR, Pillans PI, Lynch SV. Evaluation of 3 internal standards for the measurement of cyclosporin by HPLC-mass spectrometry. Clin Chem. 2005;51(10):1890-3.