Embed Size (px)
Citation preview

83
DEVELOPING YOUNG STUDENTS’ INFORMAL INFERENCE SKILLS IN DATA ANALYSIS7
EFI PAPARISTODEMOU
European University Cyprus [email protected]
MARIA MELETIOU-MAVROTHERIS
European University Cyprus [email protected]
ABSTRACT
This paper focuses on developing students’ informal inference skills, reporting on how a group of third grade students formulated and evaluated data-based inferences using the dynamic statistics data-visualization environment TinkerPlotsTM (Konold & Miller, 2005), software specifically designed to meet the learning needs of students in the early grades. Children analyzed collected data using TinkerPlots as an investigation tool, and made a presentation of their findings to the whole school. Findings from the study support the view that statistics instruction can promote the development of learners’ inferential reasoning at an early age, through an informal, data-based approach. They also suggest that the use of dynamic statistics software has the potential to enhance statistics instruction by making inferential reasoning accessible to young learners. Keywords: Statistics education research, Elementary education, TinkerPlots, Informal
statistical inference
1. OVERVIEW OF PROBLEM
Statistics, the science of learning from data, is divided into two main areas: descriptive statistics and inferential statistics. Descriptive statistics is the branch of statistics devoted to the organization, summarization, and presentation of data. It involves using tabular, graphical, and numerical techniques to analyse and describe a dataset. Inferential statistics, on the other hand, is intended to reach conclusions that extend beyond the immediate data, to deduce that observed patterns in the data at hand are also present in some broader context. It improves decision-making in a variety of real-world situations by providing tools that enable the drawing of causal inferences, or inferences to populations using sample-based evidence. Although statistical inference is the cornerstone of modern statistical concepts and methods, grasping the key ideas related to inferential statistics is a known area of difficulty for students (Green, 1982; Rubin, Bruce, & Tenney, 1990; Garfield & Ahlgren, 1998; Gordon & Gordon, 1992; Rubin, Hammerman, & Konold, 2006).
Traditionally, statistical inference is presented in the statistics classroom as a set of formal tests and procedures, through which information contained in sample data is used either to estimate the values of the respective population parameters (i.e., construct confidence intervals), or to check claims made regarding the values of population Statistics Education Research Journal, 7(2), 83-106, http://www.stat.auckland.ac.nz/serj © International Association for Statistical Education (IASE/ISI), November, 2008

84
parameters (i.e., perform hypothesis testing). Given the conceptual difficulties involved in understanding formal statistical inferential methods, introduction to statistical inference has traditionally been reserved for the high school or college level. At the lower levels of schooling, students’ exposure to statistical concepts has been restricted to basic descriptive statistics. In recent years, however, leaders in mathematics education have advocated a much wider and deeper role for statistics in school mathematics (Shaughnessy, Ciancetta, Best, & Canada, 2004). It is now widely recognized that the foundations for statistical reasoning, including fundamental ideas of inferential statistics, should be laid in the earliest years of schooling rather than being reserved for high school or university studies (National Council of Teachers of Mathematics, 2000).
Advances of technology provide new tools and opportunities for the development of early statistical reasoning. Having such a set of tools widely available to young learners has the potential to give children access to advanced statistical topics including inferential statistics and the broader process of statistical investigation (Makar & Rubin, 2007), by removing computational barriers to inquiry. This leads to a shift in the focus of statistics instruction at the school level from learning statistical tools and procedures (e.g., graphical representations, numerical measures) towards more holistic, process-oriented approaches that go beyond data analysis techniques (Makar & Rubin). Statistics can be presented as an investigative process that involves formulating questions, collecting data, analyzing data, and drawing data-based conclusions and inferences (Guidelines for Assessment and Instruction in Statistical Education (GAISE) Report, 2005).
This paper reports on how a group of third-grade (8-year-old) students formulated and evaluated data-based inferences using the dynamic statistics data-visualization software TinkerPlotsTM (Konold & Miller, 2005), a statistical package specifically designed to meet the learning needs of students in the elementary and middle grades. We examine the role of the dynamic statistics tool in scaffolding and extending these young students’ informal ideas of inference (Ben-Zvi, 2006).
2. LITERATURE REVIEW
Since formal statistical inference ideas and techniques are beyond the reach of young learners, an informal approach to statistical inference is necessary in the early years of schooling (Ben-Zvi, 2006). Developing students’ informal ideas of inference is a topic of current interest to many statistics educators, who have acknowledged the fact that despite their difficulties with the formal methods of statistical inference, students do have some sound intuitions about data (Rubin et al., 2006; Bakker, 2004), which can be refined and moved towards reasoning that has inferential qualities (Rubin et al.).
According to Watson (2007), informal statistical inference represents a continuum of experience from the point when students start to pose questions about datasets to the point when they are about to meet formal inferential statistics. Along the way from informal to formal inference, a number of important ideas are added to the student package. Rubin et al. (2006) define informal inference as reasoning that involves consideration of the following related ideas:
(i) properties of aggregates rather than properties of individual cases, (ii) sample size and its effect on the accuracy of population estimates or on process
signals, (iii) controlling for bias, and (iv) tendency, distinguishing between claims that are always true and those that are
often or sometimes true.

85
Ben-Zvi (2006) links informal inferential reasoning to argumentation and the need for data-based evidence. Deriving logical conclusions from data is accompanied by the need to provide persuasive arguments based on data analysis. Integration and cultivation of informal inference and informal argumentation seem to be essential in constructing students’ statistical knowledge and reasoning in rich learning contexts (Ben-Zvi).
Zieffler, delMas, Garfield, and Gould (2007) view informal reasoning about statistical inference as the way in which students build connections between observed sample data and unknown or theoretical populations, and how they make arguments or use evidence to support these connections. Building such connections between sample and population lies at the heart of informal statistical inference (Johnston-Wilder, Ainley, & Pratt, 2007). Makar and Rubin (2007) regard informal inferential reasoning in statistics as a reasoned but informal process of creating or testing generalizations from data that extend beyond the data collected. They consider the following three principles to be essential to informal inference:
(i) Making generalizations (predictions, parameter estimates, conclusions) that extend “beyond the data,”
(ii) using data as evidence for these generalizations, and (iii) using probabilistic language in describing the generalizations, including
references to levels of certainty about the conclusions drawn. Recent advances of technology provide schoolteachers and college instructors with
new tools for adopting informal, data-driven approaches to statistical inference that can help lay the conceptual groundwork for formal inferential reasoning (Rubin et al., 2006). The appearance, in particular, of dynamic statistics learning environments (e.g., TinkerPlots and FathomTM), which are designed explicitly to facilitate the visualization of statistical concepts, provides enormous potential for making inferential reasoning accessible to students. These new technological tools provide a medium for the design of activities that integrate experiential and formal pieces of knowledge, allowing students to make direct connections between physical experience and its formal representations (Pratt, 1998; Paparistodemou, Noss, & Pratt, 2008). Students can experiment with statistical ideas, articulate their informal theories, use the theories to make conjectures, and then use the experimental results to test and modify these conjectures. Several researchers have, in recent years, been exploiting the affordances provided by these modern technologies for promoting learners’ ability to reason and argue about data-based inferences, with very encouraging results (e.g., Bakker, 2004; Ben-Zvi, 2006; Meletiou-Mavrotheris, 2003; Rubin et al., 2006).
Some of the studies have demonstrated that even young children can develop powerful notions about inference when using appropriate data visualization tools. Ben-Zvi (2006) studied fifth-graders’ learning processes in an exploratory interdisciplinary learning context that used the dynamic software TinkerPlots to scaffold and extend students’ statistical reasoning. He described how the unique features of the software, in combination with a carefully designed learning trajectory based on growing samples heuristics, supported young learners in deriving persuasive arguments based on data analysis. Pratt (2000) found that 10-year-old students working with the Chance-Maker microworld were able to develop deep understanding of the ways in which empirical probability, theoretical probability, and sample size are related to the drawing of valid inferences. Stohl and Tarr (2002) described how two average-ability sixth-grade students were able, through using a variety of microworld tools, to formulate and evaluate inferences based on simulation data.
Although the emergence of studies specifically focusing on informal inferential reasoning has begun to shed some light on this important aspect of statistical reasoning,

86
research on the topic is still at an embryonic stage. Since the investigation of informal inferential reasoning is a very recent endeavour, research “is only just grappling with understanding the conceptual building blocks for informal inferential reasoning as a pathway towards formal statistical inference,” both in terms of the discipline and in terms of student cognition (Pfannkuch, 2006). In particular, there exists a gap in knowledge regarding young learners’ informal notions of statistical inference. The current study contributes to bridging this gap by providing insights into ways in which instruction can facilitate young students’ development of informal inferential reasoning through the provision of appropriate, technology-rich instructional settings that allow them to formulate and test conjectures regarding real datasets of interest to them.
3. PURPOSE/GOALS OF STUDY
The study reported in this article aimed at fostering third-grade students’ informal
notions of inference through adopting a hands-on, project-based approach to statistics using the dynamic statistics software TinkerPlots as an investigation tool and social activity focusing on making data-based arguments (Stohl & Tarr, 2002). This research is part of a larger, ongoing multifaceted program for the teaching and learning of early statistical reasoning in Cyprus, designed in response to the high level of interest in statistical reasoning and the need for further research on its development across grades and curricula. The conceptual “Framework for Teaching Statistics within the K-12 Mathematics Curriculum” (GAISE report, 2005), guided the program design. This framework focuses on building learners’ conceptual understanding of the statistical process by emphasizing and revisiting, with increasing sophistication through the grade levels, a set of central statistical ideas. It uses a spiral approach to the statistics curriculum, so that instructional programs from pre-kindergarten through high school encourage students to gradually develop understanding of statistics as an investigative process that involves the following components:
(i) clarifying the problem at hand and formulating questions (hypotheses) that can be answered with data,
(ii) designing and employing a plan to collect appropriate data, (iii) selecting appropriate graphical or numerical methods to analyze the data:
summarizing the data, making conjectures, drawing conclusions, making generalizations, and
(iv) interpreting the results of the analysis and relating the interpretation to the original question.
Consistent with a theoretical perspective on statistics instruction at the school level, the study was focused on building young learners’ informal inferential reasoning by enabling them to experience and develop the “big ideas” of statistics through the collection and exploration of real data of interest to them. The term informal inference is used here to describe the drawing of conclusions from data that is based mainly on looking at, comparing, and reasoning from distributions of data (Pfannkuch, 2006). Based on a case study of a group of 8-year-old students, the following questions regarding young learners’ development of informal notions of inference were explored:
(i) How do young learners begin to reason about informal inference in a learning environment that adopted a hands-on, project-based approach to statistics?
(ii) How can the opportunities provided by a dynamic learning environment for formulating and justifying data-based inferences, be utilized in the early years of schooling to scaffold and extend students’ informal statistical reasoning (Ben-Zvi, 2006)?

87
4. METHODOLOGY
4.1. CONTEXT AND PARTICIPANTS The study took place during the 2006 Fall (Autumn) semester in a third-grade
mathematics classroom in an urban primary school in Cyprus. Twenty-two students (about 8 years old) participated in this research. The students’ reasoning about informal inference was studied through genuine statistical endeavours using the dynamical statistics environment TinkerPlots.
TinkerPlots is a recently developed dynamic data-visualization package intended primarily for elementary and middle grades. The software offers an easy-to-learn interface that encourages student activity. Using TinkerPlots, young learners can start exploring data without having knowledge of conventional types of graphs or of different data types. Through performing simple actions such as ordering data according to the values of a variable or sorting data into categories, children can develop a wide variety of both standard graphical displays (e.g., bar graphs, pie charts, scatterplots), but also unconventional data representations of their own invention (Ben-Zvi, 2000). They can progressively organize data to answer their questions. TinkerPlots aims at genuine data analysis with multivariate data sets from the start, by beginning with students’ own ideas and working towards conventional statistical notions and graphs (Bakker, 2002).
Students participated in data-centered activities, in contexts familiar to them. After collecting real data about themselves, they worked in small groups to explore the data and to formulate and evaluate data-based inferences, using TinkerPlots as an investigative tool. These children had some previous experiences with graphing ‘by hand’, like collecting data from their class (e.g., the colours that their classmates like), making simple graphs (usually object graphs or bar graphs) by using grid paper, and drawing conclusions like finding the most popular colour amongst the children of their class and the number of children that liked this colour. They had no previous exposure to TinkerPlots other than going through a short tutorial which introduced them to the main features of the software. They became acquainted with TinkerPlots while analyzing data in this study.
The role of the researchers during the activities was that of participant observers. This stance indicates that as well as observing through participating in activities, the observer can ask the subjects to explain various aspects of what is going on (Burgess, 1984). The researchers were interacting with the students while they worked in mixed groups on the activities, and they were probing the children in order to better understand their thinking beyond their actions. The role of the researchers fell into probing interventions, experimental interventions, and technical interventions (cf. Pratt, 1998; Paparistodemou, 2004). Probing interventions aimed to make children’s thinking transparent when it came to inferring the reasons that might lie behind their actions. Experimental interventions sought to make some change in the directions of the activity with possible implications for conceptual change. For example, whenever the opportunity arose, the researchers stepped in to encourage students to draw generalizations which extended beyond the data at hand. Technical interventions were made to give explanations about TinkerPlots software.
A case study design was employed in the study. It was judged that this research strategy was well suitable to exploring, discovering, and gaining insight into young children’s perceptions, actions and interactions with the dynamic software TinkerPlots and with each other. The study was exploratory in nature, since very little is currently known about children’s notions regarding informal inference. Thus, its purpose was not to prove or disprove hypotheses, but rather to generate descriptions based upon in-depth
88
investigation of students’ interactions with the technological tool and with each other, and of the impact these might have on their perceptions regarding informal inference. These descriptions, although of limited generalizability (Wegerif & Mercer, 1997), may be used to understand similar situations and can inform future research.
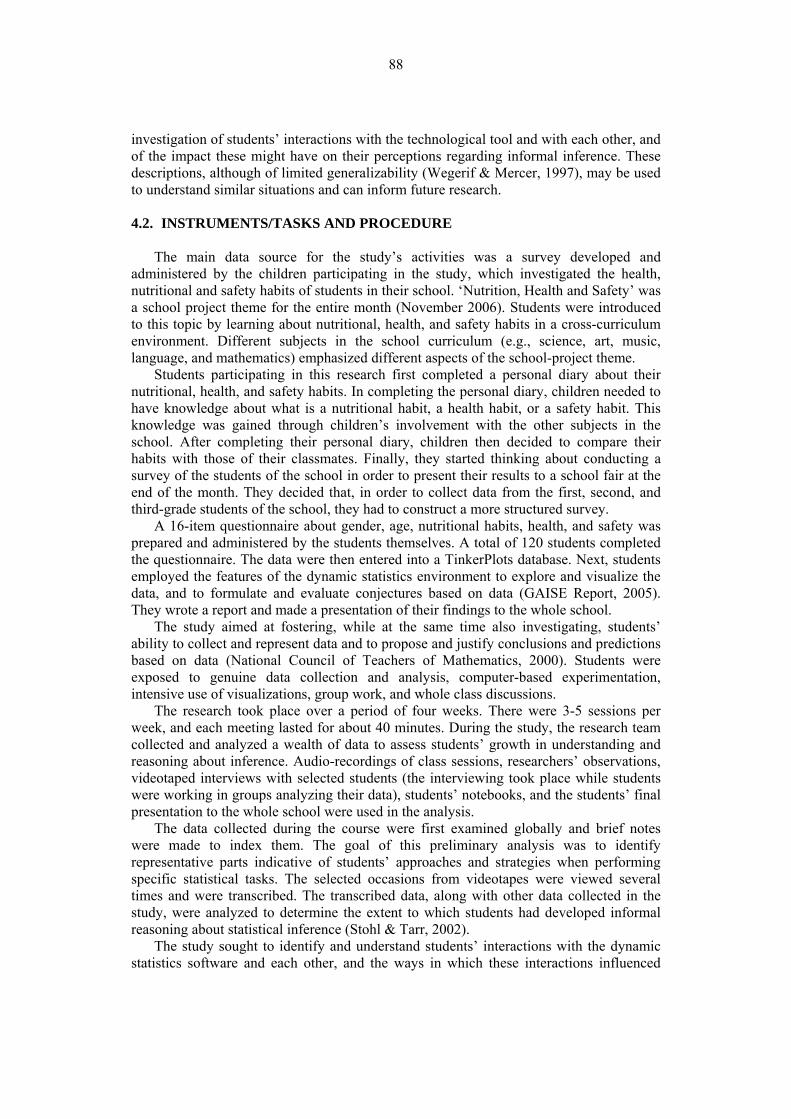
4.2. INSTRUMENTS/TASKS AND PROCEDURE
The main data source for the study’s activities was a survey developed and
administered by the children participating in the study, which investigated the health, nutritional and safety habits of students in their school. ‘Nutrition, Health and Safety’ was a school project theme for the entire month (November 2006). Students were introduced to this topic by learning about nutritional, health, and safety habits in a cross-curriculum environment. Different subjects in the school curriculum (e.g., science, art, music, language, and mathematics) emphasized different aspects of the school-project theme.
Students participating in this research first completed a personal diary about their nutritional, health, and safety habits. In completing the personal diary, children needed to have knowledge about what is a nutritional habit, a health habit, or a safety habit. This knowledge was gained through children’s involvement with the other subjects in the school. After completing their personal diary, children then decided to compare their habits with those of their classmates. Finally, they started thinking about conducting a survey of the students of the school in order to present their results to a school fair at the end of the month. They decided that, in order to collect data from the first, second, and third-grade students of the school, they had to construct a more structured survey.
A 16-item questionnaire about gender, age, nutritional habits, health, and safety was prepared and administered by the students themselves. A total of 120 students completed the questionnaire. The data were then entered into a TinkerPlots database. Next, students employed the features of the dynamic statistics environment to explore and visualize the data, and to formulate and evaluate conjectures based on data (GAISE Report, 2005). They wrote a report and made a presentation of their findings to the whole school.
The study aimed at fostering, while at the same time also investigating, students’ ability to collect and represent data and to propose and justify conclusions and predictions based on data (National Council of Teachers of Mathematics, 2000). Students were exposed to genuine data collection and analysis, computer-based experimentation, intensive use of visualizations, group work, and whole class discussions.
The research took place over a period of four weeks. There were 3-5 sessions per week, and each meeting lasted for about 40 minutes. During the study, the research team collected and analyzed a wealth of data to assess students’ growth in understanding and reasoning about inference. Audio-recordings of class sessions, researchers’ observations, videotaped interviews with selected students (the interviewing took place while students were working in groups analyzing their data), students’ notebooks, and the students’ final presentation to the whole school were used in the analysis.
The data collected during the course were first examined globally and brief notes were made to index them. The goal of this preliminary analysis was to identify representative parts indicative of students’ approaches and strategies when performing specific statistical tasks. The selected occasions from videotapes were viewed several times and were transcribed. The transcribed data, along with other data collected in the study, were analyzed to determine the extent to which students had developed informal reasoning about statistical inference (Stohl & Tarr, 2002).
The study sought to identify and understand students’ interactions with the dynamic statistics software and each other, and the ways in which these interactions influenced

89
their inferential reasoning. Through empirical analysis of the data, inductively derived descriptions and explanations were obtained. These descriptions formed the study findings that are outlined in the next section.
The initial coding scheme of the transcripts was based on our interpretations of the existing literature review (e.g., GAISE Report as it is described in Section 3). The final coding system of the transcripts, which emerged after many sweeps through the data, was based on three general groups: (a) data-based argumentation, (b) data-based argumentation and generalization, and (c) data argumentation and chance. Data based argumentation refers to children’s conclusions based on the data they had collected; Data-based argumentation and generalization refers to children’s conclusions about their data and using the data to draw inferences about a larger population without engaging the idea of chance; and Data argumentation and Chance refers to children’s conclusions about and using the data to draw inferences about an unknown population by engaging the idea of chance (e.g., using expressions such as ‘more likely’, ‘might be’, ‘more possible to’).
After analyzing the data using the particular coding system that we employed in our study (see also Paparistodemou & Meletiou, 2007), we came across Makar and Rubin’s (2007) framework which refers to three key principles of informal inference—generalizations ‘beyond the data’, probabilistic language, and data as evidence. The authors used primary-school classroom episodes and excerpts of interviews with the teachers to illustrate the framework and reiterate the importance of embedding statistical learning within the context of statistical inquiry. Makar and Rubin’s framework empowered our coding system of analysis for understanding young learners’ informal inference.
5. RESULTS
Students decided to analyze their data using TinkerPlots, in order to present their
findings at the school fair. The first researcher helped children to code their data on TinkerPlots data cards. Their data cards consisted of the following 16 attributes (see appendix for the questionnaire): gender, grade (1st year: Grade A, 2nd year: Grade B, 3rd year: Grade C), breakfast (what they eat for breakfast), snacks (what they eat between meals), lunch, dinner, the food they eat most often, eating sweets (how many sweets they eat every day), eating fruits (how many fruits they eat every day), exercising (if they play any sports), sleeping (what time they go to bed at night), teeth brushing (how many times they brush their teeth every day), using zebra crossing, running on the stairs (whether they run on school stairs), swinging with the chair (whether they swing on their chair in their classroom), playing with scissors (whether they play with scissors in class).
Children’s interest on this task was high as they were very much involved with their school project. The following group of students, for example, gives a good justification as to why their class had decided to conduct an anonymous survey:
Researcher (R): What did you find interesting about the survey? Chris: I remember that one boy was eating pizza for breakfast! R: Was it something that he told you as a joke, or was it true? David: I think that it was true. R: Why do you think so? David: Because we asked them not to write their name on the questionnaire,
not to think that we are going to shout at them. Danai: So, they did not write down their name in order not to tell any lies.
90
NO
YE
At this age, personal experience and interest play a key role in children’s interactions with data. Personal interest played a key role in motivating children to get actively involved with the project, and to start reasoning about informal inference.
The snapshots presented in the following sections come from students’ interactions with the software and with each other while analyzing the data. These snapshots show children’s informal statistical inferential reasoning while trying to derive conclusions from data. The emphasis is placed on data-based argumentations, data-based argumentation and generalization and data argumentation and chance. On the graphs presented below, children used english characters for greek words, as there were not greek characters on the software.
5.1. DATA-BASED ARGUMENTATION
Data-based argumentation refers to children’s conclusions based on the data they had
collected. In the following snapshot, a group of three children is trying to analyze responses to the question “Do you play with scissors in class?” (“OXI”=NO, “NAI”=YES). They first create a bar graph showing that 113 out of the 120 children that completed the survey did not play with scissors in class (Figure 1).
Collection 1
NAI
OXI
0 20 40 60 80 100
7
113
PSA
LID
IA
count, ordered by PSALIDIA
PSALIDIANAIOXI
Fuse Rectangular
Figure 1. Answers to the question “Do you play with scissors (‘PSALIDIA’) in the class?”
R: What can we see here? Basil: Most of the children are not playing with scissors. Philip: Playing with scissors is very dangerous… Some of the children are
playing with scissors. Seven of them… Basil: Most of the children who are playing with scissors belong to Grade A.
The children’s first reaction to this graph is to make the general conclusion that most
of the children do not play with scissors. They relate this data-based conclusion with their personal experience that playing with scissors is dangerous. They also draw a conjecture
NO
YES

91
based solely on their personal beliefs, that the majority of children playing with scissors belong to Grade A. The researcher intervenes here, prompting children and encouraging them to support this conjecture with data.
R: Do you have any evidence about this? Basil: Yes … (he is trying to make a graph) R: What are you trying to do? Basil: To put the grade … (see Figure 2) Basil: It is not only Grade A students who are playing with scissors, but also
Grade B and Grade C students. R: Of students playing with scissors, how many are in Grade A? Basil: Four. [Actually in the graph there are only three children in Grade A
playing with scissors.] R: In grades B and C? Basil: Two. R: Is that a big difference? Basil: No … it is not a big difference. Mary: Most of the children in Grade A are not playing with scissors … the
same for Grade B and Grade C. Basil: But most children from the ones that are playing with scissors belong to
Grade A.
Collection 1
A
B
C
0 5 10 15 20 25 30 35 40
38
39
43
TAXI
count, ordered by PSALIDIA
PSALIDIANAIOXI
Fuse Rectangular
Figure 2. A fuse rectangular graph for grade (‘TAXI’) and playing with scissors (‘PSALIDIA’)
Mary compares Grade A with the other two Grades and, based on data, draws the conclusion that the majority of children in all three grades do not play with scissors. Basil attempts here to find evidence in the data to justify his personal belief that most of the children who play with scissors belong to Grade A. It is possible to distinguish here the juxtaposition of using personal experiences (like younger children do not know that scissors are dangerous) and the data as ‘seen’ in TinkerPlots. Interacting with TinkerPlots, Basil realizes that it is not only Grade A students who play with scissors. Although

92
NO
YES
agreeing that differences in the number of children playing with scissors in different grades are small, he still emphasizes that his personal belief was correct.
5.2. DATA-BASED ARGUMENTATION AND GENERALIZATION
Data-based argumentation and generalization refers to children’s conclusions about their data and using the data to draw inferences about a larger population without engaging the idea of chance. In the following excerpt, another group of students is trying to determine whether children in their school are exercising. Specifically, these students are analyzing responses to the survey question “Do you play any sports?” (see Figure 3).
Collection 1
NAI
OXI
0 10 20 30 40 50 60 70 80 90
92
28
ATH
LHM
A
count, ordered by TAXI
TAXIAB
C
Fuse Rectangular
Figure 3. Exercising (‘ATHLHMA’ [sic]) in different grades (‘TAXI’), (“OXI”=NO, “NAI”=YES)
R: What can you see on the graph? Melisa: We can see how many children are exercising in each class. R: What can you conclude about exercising? Bob: We can see that most of the children are exercising. R: Who are these children? Margaret: The children of grades A, B and C. R: What can we say about grades? Melisa: Most of the children that are exercising belong to grade C. R: Ah! Can we conclude something else about grades? Bob: Yes! Children in grade C are exercising more than children in grade B
and grade A. R: If we wanted now to include in our study the whole school, to include
in our data also grades D, E, F what do you think we would conclude? Bob: The older you are in the school the more you exercise.

93
Melisa: That most of the children in the whole school are exercising, but also that some, not many, children are not exercising.
R: Who will be more? Margaret: The children who are exercising.
The students in this snapshot draw conclusions about exercising in relation to grade
level. Children provide here a data-based argumentation as to why they concluded that children in their school do exercise. In the children’s words, the seeds of inferential reasoning are seen. The researcher decided to work with children further by asking the them to consider whether they thought that the data they had (and had already discussed) would be similar to what one would find in other classes (data they didn’t have). Although the speculation about larger sets was occurring on the initiative of the researcher, it is interesting how the individual analysis of each grade led them to the conclusion that older children in their school are exercising more. Based on their data and from individual analysis, children drew conclusions for the distribution of the data set of a bigger population.
This group of children continues by comparing their own, individual responses to the survey data.
R: Do you remember what you had put down in your questionnaire? Margaret: Yes … that I am exercising … so most of the children will be
exercising. We need to exercise… R: How many children are not exercising? Bob: 28 and the ones who are exercising are 92. R: Did you expect to have children that do not exercise? Bob: I did expect it. Because the girls do not have a sport to do. R: Do you think that it is only girls who do not exercise? Bob: And some boys … I think that for a young child it is difficult to
exercise. R: Are the children who do not exercise only from grade A? Bob: And from other grades … they might not know how to exercise … Margaret: I noticed something! Grade B and Grade C might have the same
number of children. Melisa: We can see the numbers … in Grade A there are more children who are
not exercising. [The difference between grades is not that big.] Margaret: I also see the number of boys and girls in each class.
In this snapshot, peer-interaction seems conducive to deriving conclusions from data.
The children here look at their graph axes in order to compare frequencies based on gender. In this snapshot it is possible to recognize once more the use of personal experience, which is used for justifying the data as ‘seen’ in TinkerPlots. The children bring their personal experience in making sense of data. Although the difference between the children who are exercising is not that big, Melisa uses the numbers on the graph to support her personal experience. Moreover, Margaret wants to explore their data further. She goes ahead to draw a new graph (Figure 4).
Margaret: I notice that in the ‘No’ answer there are more girls than boys. Bob: The boys are fewer than the girls. R: What do you mean in the ‘No’ answer?
94
NO
YES
Collection 1
NAI
OXI
92
28
ATH
LHM
A
ordered by FYLO
FYLOAK
Fuse Circular
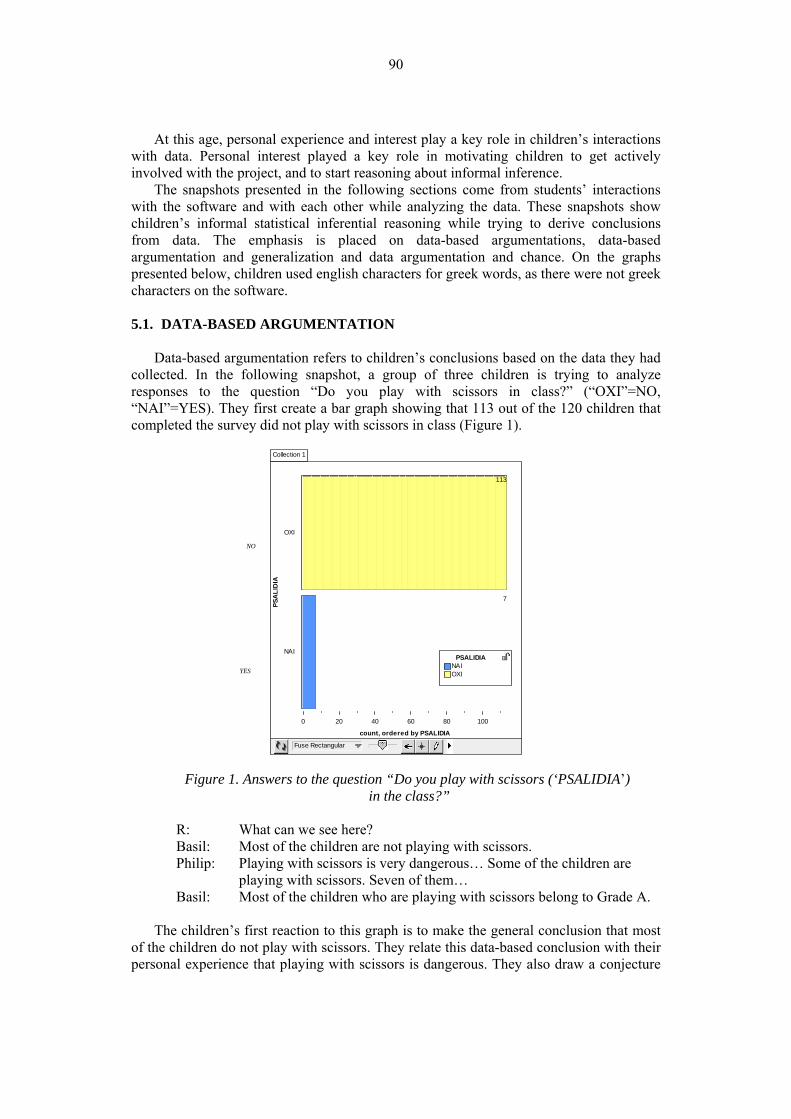
Figure 4. Exercising (‘ATHLHMA’) and gender (‘FYLO’=GENDER: “A”=BOY, “K”=GIRL)
Margaret: That from the children that are not exercising, there are more girls than
boys. Melisa: Most of the children who are exercising are boys, while girls are not
that many. R: So … Bob: Most of the children who are exercising are boys and most of the
children in our survey are exercising. R: If you go to another school what do you think you will notice? Bob: The same thing … R: What? Melisa: Boys are exercising more than girls. R: What about if I give the survey to all the schools in Cyprus? Margaret: The children in Cyprus are exercising. Bob: Not all of them … Margaret: Half of them … Bob: Not half of them. … Only one quarter of the children in Cyprus are not
exercising. R: Why? Bob: Because we see here that most of the children in our school are
exercising. R: But, can we say the same thing for all the children of Cyprus? Bob: Yes … we see it … most of the children would like to exercise. If not,
they would get bored. R: So, you are saying that only one quarter of the children in Cyprus is not
exercising. From this quarter, what would you say about boys and girls?

95
NO
YES
Bob: Girls will be more. R: Why? Bob: Because they do not have a sport to do. Only dance and ballet . … Also,
from the children who are not exercising, children in grade A are more, because they are not enthusiastic about sports yet.
The children go beyond their data and draw general conclusions about all Cypriot
children when prompted by the researcher. Again, the speculation about larger sets occurred only on prompting of the researcher, but it is interesting that the children elaborate on the scenario and try to give a general percentage of the whole population of children who exercise in Cyprus. It is not surprising that at the beginning of this snapshot children make additive comparisons rather than proportional reasoning in comparing groups. But, when they talk about ‘half’ and use the pie charts, the children use intuitive ideas based on “part-whole” relationships seen in the graphs. The presence of the word “of” in the description is significant as it usually flags the part-whole understanding present (Watson, 2006). Moreover, they use their personal experience to give explanations for the results they observe in the data.
This group of children continues to interact with TinkerPlots in order to interpret their data (see Figure 5).
Collection 1
NAI
OXI
92
28
ATH
LHM
A
ordered by PSALIDIA
PSALIDIANAIOXI
Fuse Circular
Figure 5. Exercising (‘ATHLHMA’) and playing with scissors (‘PSALIDIA’) Melisa: Oh! I have done something else! R: What have you done? Bob: Ah! We can see here if the children who are exercising are playing with
scissors. R: Great! And what can you conclude?

96
Bob: Children who are exercising are not playing so much with scissors, but there are some children who are playing with them. But, of the children who are not exercising, there are more children who are playing with scissors.
R: Why? Bob: Because we see it here. [He is showing on the graph.] Melisa: They do not know that it is not good for them to play with scissors. Bob: Ah! Maybe with scissors they cut themselves and they cannot exercise! R: If we give this survey to the whole school [Grades A-F] will we notice
the same thing? Bob: No! R: Why? Bob: Because the children will be older and they will know that they should
not do these things. R: If we go to another school that has only the lower grades? [Grades A-
C] Melisa: Yes! I think grade A children will be playing more with scissors… Bob: I would like to see a graph about grades and scissors. R: Ah! Can you make it?
Bob is trying to make an argument about the relation between playing with scissors
and exercising. His initial conclusion is based on the graphs, although at the end he and Melisa are creating a fictitious scenario in order to justify their data. Creating this scenario is the reason the children over-generalize their data, but on the other hand it is also the reason to drive Bob’s curiosity about finding out what the data show regarding the relation between playing with scissors and grade level. Bob goes ahead and draws the pie-charts in Figure 6.
Collection 1
A
B
C
38
39
43
TAXI
ordered by PSALIDIA
PSALIDIANAIOXI
Fuse Circular
Figure 6. A pie-chart graph for grade (‘TAXI’) and playing with scissors (‘PSALIDIA’)

97
Margaret: I can see that Grade A children are playing more with scissors. Bob: I prefer to see it on a rectangular graph. [Meaning a horizontal bar
graph.] It shows it more clearly. [See Figure 2.] R: What can you notice now? Bob: That the children in Grades B and C who are playing with scissors are
fewer than the children in Grade A. In Grade A, children are younger and play more with scissors. [He is pointing to the graph.]
R: If we ask all the children in our school? Margaret: Most of them will not play with scissors. R: What can we say about all children in Cyprus? Bob: Again, one quarter…. No, less than one quarter are playing with
scissors. R: Where can we find this? Bob: See the numbers … 4 and 3 and 3 from each class. [Actually it is 3, 2, 2
on the graph.] … not a big difference. … R: So how many? Bob: 10 from 120… so… Margaret: 1 out of 12 is playing with scissors. Grades B and C are having the
same number… It is interesting here how Bob is using the different graphical representations of data
provided by TinkerPlots. He finds it easier to compare grades in a rectangular representation than in a pie-chart, and he makes the argumentation that children in Grade A play more with scissors than children in other grades. When asked by the researcher to generalize their findings to all Cypriot children, the children attempt to make numerical arguments about the population of children in Cyprus. Again, an intuition based on ‘part-whole’ relationships is seen by the students in the graphs. Margaret uses the phrase ‘1 out of 12’ to indicate the proportion of the children who are playing with scissors. The particular phrase has a direct relationship to the part-whole concept that is a feature of many topics in the mathematics curriculum.
5.3. DATA ARGUMENTATION AND CHANCE
Data argumentation and Chance refers to children’s conclusions about the data and
using the data to draw inferences about an unknown population by engaging the idea of chance. The next group of children analyze responses to the question “How many times do you brush your teeth every day?”
R: What can we say about teeth brushing in different grades?
Students draw the graphs displayed in Figure 7.
Natalie: Only a few children do not brush their teeth. Demis: They do not brush their teeth every day. Natalie: Most of them are in Grade B. R: How do you know that? Natalie: From the numbers. Niki: … and the colours …

98
>1
>1
Collection 1
KAM
IA1
PER
APO
1
0 10 20 30 40 50 60 70
8
34
78
DO
NTI
A
count, ordered by TAXI
TAXIAB
C
Fuse Rectangular
Collection 1
KAMIA 1 PER APO 1
A
B
C
TAXI
, ord
ered
by
TAXI
DONTIA, ordered by FYLO
TAXIAB
C
Fuse Rectangular
Figure 7. How often children brush their teeth (‘DONTIA’: “KAMIA”=None, “PER APO 1”=more than once) in different grades (‘TAXI’)
Demis: Most of the children brush their teeth … and in Grade B children do not
brush them. Natalie: In Grade C, there are a lot of children who brush their teeth only once a
day. R: What else? Demis: Most of the children brush their teeth more than one time … R: What else? Natalie: The gender of the children … [She draws the graph in Figure 8.]
Collection 1
KAM
IA1
PER
APO
1
0 10 20 30 40 50 60 70
8
34
78
DO
NTI
A
count, ordered by FYLO
FYLOAK
Fuse Rectangular
Collection 1
KAMIA 1 PER APO 1
A
B
C
TAXI
, ord
ered
by
FYLO
DONTIA, ordered by FYLO
FYLOAK
Fuse Rectangular
Figure 8. How often children brush their teeth based on gender (“FYLO”=GENDER: “A”=BOY, “K”=GIRL)
Natalie: Girls are brushing their teeth more than once. Boys are not brushing
their teeth at all.
0
Boy Girl
0
>1
>1

99
>2
R: So, if you see a boy at break time, will you say that it is more likely that he brushes his teeth more than once or that he does not brush them at all?
Natalie: More than once. R: Why? (There is silence.) R: If I tell you that I saw a child at break time that does not brush his/her
teeth. Will you guess that is a boy or a girl? Demis: A boy… R: Why? Natalie: We see it on the graph. Demis: It might be a girl as well … Natalie: But, most of the boys do not brush their teeth. Demis: Yes. But, it might be a girl as well. R: Is it more possible to be a girl or a boy? Demis: More possible to be a boy!
Children in the above group describe the results for this question by looking at
graphical representations of the data, but also try to connect their graphs with chance with prompting from the researcher. It is interesting that Natalie reads from the graph that a better guess for a child that does not brush his/her teeth is for it to be a boy. It is conjectured here that children in this group go beyond the data they have at hand, an important element for informal statistical inference. On the other hand, statements such as “But, most of the boys do not brush their teeth” lead to over-generalizations that make it difficult to draw any consistent conclusions.
The following group of children also tries to go beyond their data. They analyze students’ responses to the survey question “How many sweets do you eat every day?” (see Figure 9).
Collection 1
KAN
ENA
1-2
PER
APO
2
0 10 20 30 40 50 60 70 80
26
82
12
GLY
KA
count, ordered by FYLO
FYLOAK
Fuse Rectangular
Figure 9. The number of sweets (‘GLYKA’:‘KANENA’=None, ‘PER APO 2’=More than 2) boys and girls eat (‘A’= Boy, ‘K’=Girl)
R: Can you make a graph and tell us your conclusions? Stalo: For sweets … Girls are eating more sweets.
0
>1

100
Stalo is making a general statement about the results. … R: If I find a child and I tell you that he/she eats more than two sweets,
would you say it is a boy or a girl? Stalo: A girl … Because this graph shows that the girls who eat more than two
sweets are more than the boys. R: If the child doesn’t eat any sweets? Andreas: I think it is more likely for the child to be a boy, because fewer boys
than girls eat more than two sweets, and it is more likely for boys not to eat any sweets.
R: Why? Andreas: Because girls eat more than two. It is more likely for the child that does
not eat any sweets to be a boy. Stalo: I also say that the child is a boy; because boys do not eat many sweets
… we eat more sweets. In this group of students, a mixture of personal experience and observation of real
data is seen. Again, there is a relation between data and chance and it can again be concluded that this group of children also go beyond their data.
6. DISCUSSION
Reflecting the recent shift in statistics education research from a focus on specific
skills and procedures towards a greater focus on statistical reasoning and thinking embedded in the process of a statistical investigation (Makar & Rubin, 2007; GAISE Report, 2005), the current study was designed to investigate ways in which the foundations of inferential reasoning can be laid at a very young age. More specifically, the following two research questions regarding young learners’ development of informal notions of inference were explored. How do young learners begin to reason about informal inference in a learning environment that adopts a hands-on, project-based approach to statistics? How can the opportunities provided by a dynamic learning environment for formulating and justifying data-based inferences be utilized in the early years of schooling to scaffold and extend students’ informal statistical reasoning?
The study findings do support the view that statistics instruction can promote the development of learners’ inferential reasoning at an early age, through an informal data-based approach, rooted in the statistical investigation cycle (Wild & Pfannkuch, 1999). The design of the study, guided by the GAISE Report (2005), proved helpful in building children’s informal inferential reasoning. The 8-year-old students in the study experienced statistics as an investigative process. They formulated questions of interest to them, collected data to answer to these questions, analyzed and interpreted the data, linking their data-based conclusions and inferences back to the questions under investigation.
The young children in our study expressed statistical informal inference in three distinct ways: (a) data-based argumentation, (b) data-based argumentation and generalization, and (c) data argumentation and chance. Children drew their conclusions based on the data they had collected, using the data to draw inferences about a larger population without engaging the idea of chance, and using the data to draw inferences about an unknown population by articulating uncertainty (e.g., using expressions such as ‘more likely’, ‘might be’, ‘more possible to’). It seems that informal inference provides new opportunities to introduce powerful statistical concepts early in the school curriculum. This study shows that statistics can be used as a tool for gaining insights into

101
understanding problems, rather than only as a collection of graphs, calculations, and procedures (Sorto, 2006).
Findings from this study show that young learners begin to reason about informal inference when their interest in the task is high. The children in this study were very much involved with their school project and the conclusions drawn from the data were important for them in order to understand what was happening at their school. At this age, personal experience and interest play a key role in children’s interactions with data. Personal interest is important for children’s involvement in reasoning about informal inference. Moreover, the study is an example of an approach to improving students’ use of statistical reasoning and thinking by embedding statistical concepts within a purposeful statistical investigation that brings the context to the forefront. It is not just making a conclusion about data that provides the conceptual muscle to draw inferences, but a conclusion about the situation that the data are meant to represent or signify (Makar & Rubin, 2007). The focus is on understanding the situation (Makar & Confrey, 2007), rather than examining decontextualized data. Perhaps a focus on an interesting problem and engaging context may influence students’ inclination to look beyond the data they have. Making a conclusion about the situation suggests that students need a particular level of complexity to engage with in order to consider possible avenues to connect the data with the context.
Moreover, the researchers in the study moved between referring to the data children had in hand and a larger population beyond the data. With prompting from the researchers, the children tried to draw conclusions “beyond the data,” although sometimes they tended to over-generalize (for example, statements like “most of the boys do not brush their teeth”). Several times, when children tended to over-generalize the data, they tried to justify their ‘scenario’ by interpreting with the software. A result of that was to interpret with their data, make different graphical representations, and draw conclusions beyond the data (e.g., Bob’s case). The students in our study used the dynamic statistics software TinkerPlots as an investigation tool. The presence of the dynamic software facilitated students’ interest in the statistical investigation; it gave them the opportunity to explore data and draw data-based arguments and inferences in ways that would not have been possible for them without the software (Hammerman & Rubin, 2003).
Attributes of TinkerPlots like the ability to operate quickly and accurately, to dynamically link multiple representations, to provide immediate feedback, and to transform an entire representation into a manipulable object enhanced students’ flexibility in using representations and provided the means for them to focus on statistical conceptual understanding. The visualization of the data helped children to express intuitive ideas about proportional reasoning, a fundamental topic in the school mathematics curriculum. The genuine endeavors of the young learners with multivariate data using TinkerPlots as an investigation tool helped them begin to develop their informal inferential reasoning. Furthermore, the software’s design allows even young students to use what they already know to search for and detect group differences and trends. By using features such as differences in icon size, colour (e.g., the user can highlight information by the value of an attribute), students can detect subtle relationships in multivariate data in powerful and intuitive ways (Bakker, 2002). Although that the children in the study were young, most of the time they tried to find relationships between two variables in the data in order to draw their conclusions. For example, in Figure 5 they tried to find the relationship between exercising and playing with scissors.
The qualitative methodology employed in this case study, the small scale of the study, and its limited geographical nature, mean that generalizations to cases that are not very similar should be done cautiously. However, the study findings do suggest that the
102
adoption of a hands-on, project-based approach to statistics does have the potential to enhance statistics instruction by making inferential reasoning accessible to young learners. Moreover, there are strong indications in the study to support our belief that utilization of the affordances provided by a dynamic statistics software such as TinkerPlots, can indeed scaffold and extend children’s informal statistical reasoning (Ben-Zvi, 2006) by encouraging them to build, refine, and reorganize their intuitive understandings about statistics.
7. INSTRUCTIONAL AND RESEARCH IMPLICATONS
The expanding use of data for prediction and decision-making in almost all domains
of life makes it a priority for mathematics instruction to help all students develop their inferential statistical reasoning. As the current study and several other studies have illustrated (e.g., Ben-Zvi, 2006; Makar & Rubin, 2007), when given the chance to participate in appropriate instructional settings that support the development of informal inferential reasoning, even very young children can develop intuitions about fundamental statistical concepts related to statistical inference.
In order to promote the development of early inferential reasoning, statistics instruction should adopt an informal, data-driven approach. It should encourage statistical inquiry rather than teaching methods and procedures in isolation. The emphasis should be on the statistical investigation process. The teaching of the different statistical tools should be achieved through putting students in a variety of authentic, purposeful contexts where they need these tools to make sense of the situation. Instruction should focus on helping learners understand how one could use these tools in making comparisons, predictions, and generalizations (Rubin, 2005). Through exploration and experimentation with authentic data, children can begin to develop the ability to provide persuasive data-based arguments, as well as generalizations which extend beyond their collected data.
Technology has an important role to play in promoting the development of informal inferential reasoning in the early grades. Innovative educational software such as TinkerPlots allows children to explore informal inferential ideas in contexts that are both rich and meaningful to them. They provide young learners with tools they can use to construct their own conceptual understanding of statistical concepts. Use of such software, in combination with appropriate curricula and instructional settings, can help students develop a strong conceptual base on which to build a more formal study of inferential statistics later.
More research is needed on designing instruction and on building teachers’ and students’ concepts and reasoning about informal inference. The challenge for future research should be to develop teachers’ and students’ sampling conceptions in terms of learning to reason about populations from samples using informal inference. The focus should shift from examining how students learn and use the different statistical tools and procedures, to how they understand the statistical investigation cycle as a process of making data-based inferences (Makar & Rubin, 2007). The study shows that students should come to appreciate the real reasons for which statistical tools and procedures have been developed—to help humans understand underlying phenomena and make informed decisions.
ACKNOWLEDGEMENTS The authors wish to thank all the children that participated in this research. They
would also like to thank all the participants of SRTL-5 conference for their very generous

103
and constructive comments on this work. Moreover, they would like to thank Jane Watson for her valuable feedback on the manuscript and the reviewers of SERJ for their very detailed reviews.
REFERENCES
Bakker, A. (2002). Route-type and landscape-type software for learning statistical data
analysis. In B. Phillips (Ed.), Developing a statistically literate society: Proceedings of the Sixth International Conference on Teaching Statistics, Cape Town, South Africa. [CD-ROM]. Voorburg, The Netherlands: International Statistical Institute. [Online: http://www.stat.auckland.ac.nz/~iase/publications/1/7f1_bakk.pdf]
Bakker, A. (2004). Reasoning about shape as a pattern in variability. Statistics Education Research Journal, 3(2), 64-83. [Online: http://www.stat.auckland.ac.nz/~iase/serj/SERJ3(2)_Bakker.pdf]
Ben-Zvi, D. (2000). Toward understanding the role of technological tools in statistical learning. Mathematical Thinking and Learning, 2, 127-155.
Ben-Zvi, D. (2006). Scaffolding students’ informal inference and argumentation. In A. Rossman & B. Chance (Eds.), Working cooperatively in statistics education: Proceedings of the Seventh International Conference on Teaching Statistics, Salvador, Brazil. [CDROM]. Voorburg, The Netherlands: International Statistical Institute. [Online: http://www.stat.auckland.ac.nz/~iase/publications/17/2D1_BENZ.pdf]
Ben-Zvi, D., & Arcavi, A. (2001). Junior high school students’ construction of global views of data and data representations. Educational Studies in Mathematics, 45(1), 35-65.
Burgess, R. (1984). In the Field. New York: Routledge. GAISE Report (2005). Guidelines for assessment and instruction in statistics education:
A Pre-K-12 Curriculum Framework. Alexandria, VA: The American Statistical Association. [Online: http://www.amstat.org/education/gaise]
Garfield, J., & Ahlgren, A. (1998). Difficulties in learning basic concepts in probability and statistics: Implications for research. Journal for Research in Mathematics Education, 19, 44-63.
Gordon, F. S., & Gordon, S. P. (1992). Sampling + Simulation = Statistical Understanding. In F. S. Gordon (Ed.), Statistics for the twenty-first century (pp. 207-216). Washington, DC: The Mathematical Association of America.
Green, D. G. (1982). A survey of probability concepts in 3000 students aged 11-16. In D. V. Grey (Ed.), Proceedings of the First International Conference on Teaching Statistics (pp. 766-783). London: Statistics Teaching Trust.
Hammerman, J., & Rubin, A. (2003). Reasoning in the presence of variability. In C. Lee (Ed.), Reasoning about Variability: A Collection of Current Research Studies [CD-ROM]. Dordrecht, The Netherlands: Kluwer Academic Publisher.
Johnston-Wilder, P., Ainley, J., & Pratt, D. (2007, August). Thinking-in-change about informal inference. Paper presented at the Fifth International Research Forum on Statistical Reasoning, Thinking, and Literacy (SRTL-5), University of Warwick, UK.
Konold, C., & Higgins, T. (2002). Highlights of related research. In S. J. Russell, D. Schifter, & V. Bastable (Eds.), Developing mathematical ideas: Working with data (pp. 165-201). Parsippany, NJ: Seymour.
Konold, C., & Miller, C. D. (2005). TinkerPlots: Dynamic Data Explorations. Emeryville, CA: Key Curriculum Press.

104
Makar, K., & Confrey, J. (2007). Moving the context of modeling to the forefront. In W. Blum, P. Galbraith, H-W. Henn, & M. Niss (Eds.), Modelling and applications in mathematics education. New York: Springer.
Makar, K., & Rubin, A. (2007, August). Beyond the bar graph: Teaching informal statistical inference in primary school. Paper presented at the Fifth International Research Forum on Statistical Reasoning, Thinking, and Literacy (SRTL-5), University of Warwick, UK.
Meletiou-Mavrotheris, M. (2003). Technological tools in the introductory statistics classroom: effects on student understanding of inferential statistics. International Journal of Computers for Mathematical Learning, 8(3), 265-297.
National Council of Teachers of Mathematics (NCTM). (2000). Principles and Standards for School Mathematics. Reston, VA: Author.
Paparistodemou, E. (2004). Children’s Expressions of Randomness: Constructing Probabilistic Ideas in an Open Computer Game. Unpublished doctoral dissertation, Institute of Education, University of London.
Paparistodemou, E., & Meletiou, M. (2007, August). Enhancing reasoning about statistical inference in 8-year-old students. Paper presented at the Fifth International Research Forum on Statistical Reasoning, Thinking, and Literacy (SRTL-5), University of Warwick, UK.
Paparistodemou, E., Noss, R., & Pratt, D. (2008). The Interplay Between Fairness and Randomness in a Spatial Computer Game. International Journal of Computers for Mathematical Learning, 13(2), 89-110.
Pfannkuch, M. (2006). Informal inferential reasoning. In A. Rossman & B. Chance (Eds.), Working cooperatively in statistics education: Proceedings of the Seventh International Conference on Teaching Statistics, Salvador, Brazil. [CDROM]. Voorburg, The Netherlands: International Statistical Institute. [Online: http://www.stat.auckland.ac.nz/~iase/publications/17/6A2_PFAN.pdf]
Pratt, D. (1998). The Construction of Meanings In and For a Stochastic Domain of Abstraction. Unpublished doctoral dissertation, Institute of Education, University of London.
Pratt, D. (2000). Making sense of the total of two dice. Journal of Research in Mathematics Education, 31, 602-625.
Rubin, A., Bruce, B., & Tenney, Y. (1990, April). Learning about sampling: Trouble at the core of statistics. Paper Presented at the Annual Meeting of the American Educational Research Association, Boston.
Rubin, A. (2005). Math that matters. In K. Mayer (Ed.), Threshold (pp. 22-31). Cambridge: TERC.
Rubin, A., Hammerman, J., & Konold, C. (2006). Exploring informal inference with interactive visualization software. In A. Rossman & B. Chance (Eds.), Working cooperatively in statistics education: Proceedings of the Seventh International Conference on Teaching Statistics, Salvador, Brazil. [CDROM]. Voorburg, The Netherlands: International Statistical Institute. [Online: http://www.stat.auckland.ac.nz/~iase/publications/17/2D3_RUBI.pdf]
Watson, J. M. (2006). Statistical literacy at school New Jersey: LEA. Watson, J. (2007, August). Facilitating beginning inference with TinkerPlots for novice
grade 7 students. Paper presented at the Fifth International Research Forum on Statistical Reasoning, Thinking, and Literacy (SRTL-5), University of Warwick, UK.
Wegerif, R., & Mercer, N. (1997). Using computer-based text analysis to integrate qualitative and quantitative methods in research on collaborative learning. Language and Education, 11(4), 271–86.

105
Wild, C. J., & Pfannkuch, M. (1999). Statistical thinking in empirical enquiry (with discussion). International Statistical Review, 67(3), 223-265.
Shaughnessy J. M., Ciancetta M., Best K., & Canada D. (2004, April). Students’ attention to variability when comparing distributions. Paper presented at the 82nd Annual Meeting of the National Council of Teachers of Mathematics, Philadelphia, PA.
Sorto, M. A. (2006). Identifying content knowledge for teaching statistics. In A. Rossman & B. Chance (Eds.), Working cooperatively in statistics education: Proceedings of the Seventh International Conference on Teaching Statistics, Salvador, Brazil. [CDROM]. Voorburg, The Netherlands: International Statistical Institute. [Online: http://www.stat.auckland.ac.nz/~iase/publications/17/C130.pdf]
Stohl, H., & Tarr, J. E. (2002). Using multi-representational computer tools to make sense of inference. In D. Mewborn (Ed.), Proceedings of the Twenty-fourth Annual Meeting of the North American Chapter of the International Group for the Psychology of Mathematics Education. Athens, GA: Columbus, OH: ERIC Clearinghouse for Science Mathematics and Environmental Education.
Zieffler, A., delMas, R., Garfield, J., & Gould, R. (2007, August). Studying the development of college students’ informal reasoning about statistical inference. Paper presented at the Fifth International Research Forum on Statistical Reasoning, Thinking, and Literacy (SRTL-5), University of Warwick, UK.
EFI PAPARISTODEMOU 5 Ellados Street
2003 Nicosia Cyprus

106
APPENDIX: THE QUESTIONNAIRE We are the children of C2 class and we are doing a study that concerns nutrition, health and safety of the children in our school. We would like to ask you to complete the following questionnaire. Do not write your name anywhere. Thank you!
1. Gender: Boy Girl 2. Grade: Α Β C 3. Nutrition: 3.1. What did you eat yesterday? Breakfast: .............................................................................................................................. Lunch: ................................................................................................................................... Dinner: .................................................................................................................................. Snacks: ................................................................................................................................. 3.2. Which food do you eat most often? …………………………… 3.3. How many sweets do you eat every day? None 1-2 more than 2 3.4. How many fruits do you eat every day? None 1-2 3-4 more than 4 4. Health: 4.1. Do you play any sports? Yes No 4.2. What time do you go to bed at night? Before 9pm 9pm After 9pm 4.3. How many times do you brush your teeth every day? None 1 More than 1 5. Safety at school: 5.1. Do you always use zebra crossing? Yes No 5.2. Do you run on the school stairs? Yes No 5.3. Do you swing on your chair in the classroom? Yes No 5.4. Do you play with scissors in the classroom? Yes No


![Elementary Preservice Teachers’ Reasoning about …iase-web.org/documents/SERJ/SERJ16(2)_Biehler.pdf · 246 […] is a significant shift in perspective from the activity of exploring](https://img.dokumen.tips/doc/110x75/5af5c27f7f8b9a9e598e7917/elementary-preservice-teachers-reasoning-about-iase-weborgdocumentsserjserj162.jpg)