Embed Size (px)
Citation preview
DEVELOPING A MEASUREMENT MATRIX FOR LEAN PRODUCT DESIGN
A THESIS
SUBMITTED TO THE FACULTY OF
UNIVERSITY OF MINNESOTA
BY
Amin Sabzivand
IN PARTIAL FULFILLMENT OF THE REQUIREMENTS
FOR THE DEGREE OF MASTER OF SCIENCE IN ENGINEERING MANAGEMENT
Adviser: Dr. Hongyi Chen
June 2015

© Amin Sabzivand 2015
i
Acknowledgements
I would like to express my sincere gratitude to the people who have helped and
supported me throughout the completion of my thesis.
First, my sincere thanks go to my adviser, Dr. Hongyi Chen for her motivation,
enthusiasm, and continuous support. She patiently guided me through the every of step of
my study and helped me a lot to achieve my educational goal.
Besides my advisor, I would like to thank the rest of my examining committee
members: Dr. Xin Liang and Dr. Ryan Rosandich for the time they put in reviewing this
thesis and their insightful and useful recommendations.
Also, I would like to thank my parents and my brother for their great support, and
all my friends who have supported me during my Master’s study.
Finally, I would like to thank University of Minnesota for financial support from
the “Grant in Aid” fund.
ii
Abstract
Today, many companies are familiar with the concepts of lean enterprise
management and have applied the lean philosophy to their product design process. To
study the impact of such practices, measurements need to be developed to evaluate the
leanness of a company's product design. Overwhelming amount of literature on lean
management and its application to new product development exist. However, most of
them focus on the overall strategies and no consensus definition of lean product design
exists, not to mention a measurement matrix for lean product design practices. In this
thesis, a lean product design measurement matrix is developed based on a comprehensive
review of literature in lean product designs. Factors that can be used to assess a
company's lean product design practices are identified. The lean product design matrix
developed in this study will help companies to measure and evaluate their lean product
design process and therefore, focus on key elements needing improvement. It will also
facilitate researches that study the impact of lean product design practices on a company's
performance overall and in specific areas.
iii
Table of Contents
List of Tables ................................................................................................................................... v
List of Figures ................................................................................................................................. vi
CHAPTER 1: INTRODUCTION .................................................................................................... 1
CHAPTER 2: LITERATURE REVIEW ......................................................................................... 5
2.1 New Product Development .................................................................................................. 5
2.1.1 Feasibility Study .......................................................................................................... 5
2.1.2 Planning ....................................................................................................................... 7
2.1.3 Design .......................................................................................................................... 8
2.1.3.1 Design Brief ............................................................................................................. 9
2.1.3.2 Design Specification ................................................................................................ 9
2.1.3.3 Concept Design ...................................................................................................... 10
2.1.3.4 Testing.................................................................................................................... 11
2.1.3.5 Detail Design ......................................................................................................... 11
2.1.4 Approval .................................................................................................................... 12
2.1.5 Delivery...................................................................................................................... 12
2.2 Lean New Product Development ....................................................................................... 13
2.2.1 Basic Concepts in Lean Management ........................................................................ 13
2.2.1.1 Value ...................................................................................................................... 13
2.2.1.2 Waste...................................................................................................................... 16
2.2.2 Lean Product Development Process .......................................................................... 18
2.2.2.1 Lean Feasibility study ................................................................................................ 20
2.2.2.2 Lean planning ............................................................................................................. 21
2.2.2.3 Design ........................................................................................................................ 23
2.2.2.3.1 Design specification ........................................................................................... 24
2.2.2.3.2 Design concept ................................................................................................... 25
2.2.2.3.3 Standardization .................................................................................................. 26
2.3 Lean Product Design .......................................................................................................... 27
CHAPTER 3: RESEARCH QUESTION AND RESEARCH METHOD ..................................... 29
3.1 Research Question ............................................................................................................. 29
3.2 Research Method ............................................................................................................... 30
CHAPTER 4: DEVELOPING MEASUREMENT FACTORS FOR LEAN PRODUCT DESIGN .......... 33
iv
4.1 Customer Satisfaction ........................................................................................................ 33
4.1.1 Information about Customers’ Requirements ............................................................ 34
4.1.2 Appropriate Source to Gather Information about Users ............................................ 35
4.1.3 Quality of Communication between Marketing and Design Team ............................ 39
4.2 Cost and Time .................................................................................................................... 40
4.2.1 Variability of Outcomes ............................................................................................. 43
4.2.1.1 Reducing Unnecessary Complexity during the Design Process ............................ 44
4.2.2 Defects ....................................................................................................................... 44
4.2.2.1 Selecting the Right Technology ............................................................................. 46
4.2.3 The Percentage of Design Re-uses ............................................................................. 46
4.2.4 Design Change after Release to Manufacture ............................................................ 49
4.2.5 Effective Communication .......................................................................................... 51
4.2.5.1 Horizontal Communication among Departments................................................... 52
4.2.5.2 Communication within the Design Teams ............................................................. 53
4.2.6.1 Design for manufacturability (DFM) ............................................................................. 53
4.2.6.2 Value analysis ............................................................................................................ 54
4.3 Lean Design Measurement matrix ................................................................................. 56
4.3.1 Measurement Corresponding to the Variables of Customers’ Information ............... 56
4.3.2 Measurements Corresponding to the Variables of Cost and Time............................. 60
CHAPTER 5: CONCLUSION ...................................................................................................... 66
REFERENCES .............................................................................................................................. 67
Appendix A: ................................................................................................................................... 75
v
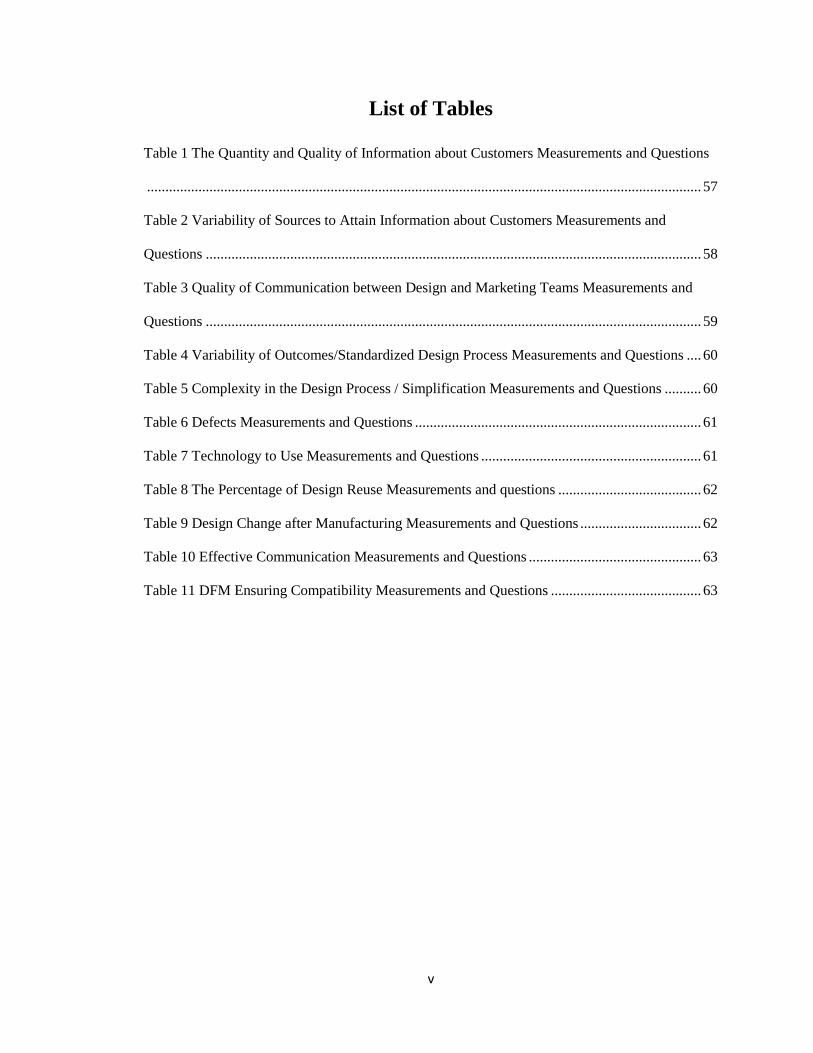
List of Tables
Table 1 The Quantity and Quality of Information about Customers Measurements and Questions
....................................................................................................................................................... 57
Table 2 Variability of Sources to Attain Information about Customers Measurements and
Questions ....................................................................................................................................... 58
Table 3 Quality of Communication between Design and Marketing Teams Measurements and
Questions ....................................................................................................................................... 59
Table 4 Variability of Outcomes/Standardized Design Process Measurements and Questions .... 60
Table 5 Complexity in the Design Process / Simplification Measurements and Questions .......... 60
Table 6 Defects Measurements and Questions .............................................................................. 61
Table 7 Technology to Use Measurements and Questions ............................................................ 61
Table 8 The Percentage of Design Reuse Measurements and questions ....................................... 62
Table 9 Design Change after Manufacturing Measurements and Questions ................................. 62
Table 10 Effective Communication Measurements and Questions ............................................... 63
Table 11 DFM Ensuring Compatibility Measurements and Questions ......................................... 63
vi
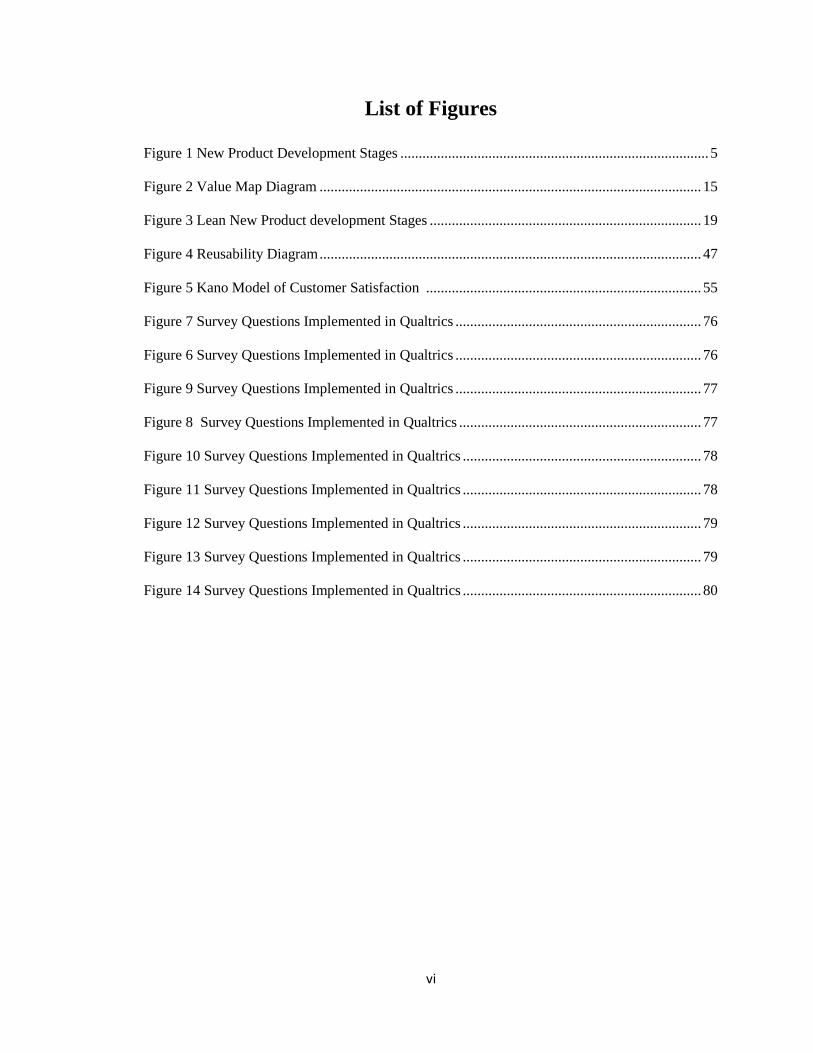
List of Figures
Figure 1 New Product Development Stages .................................................................................... 5
Figure 2 Value Map Diagram ........................................................................................................ 15
Figure 3 Lean New Product development Stages .......................................................................... 19
Figure 4 Reusability Diagram ........................................................................................................ 47
Figure 5 Kano Model of Customer Satisfaction ........................................................................... 55
Figure 7 Survey Questions Implemented in Qualtrics ................................................................... 76
Figure 6 Survey Questions Implemented in Qualtrics ................................................................... 76
Figure 9 Survey Questions Implemented in Qualtrics ................................................................... 77
Figure 8 Survey Questions Implemented in Qualtrics .................................................................. 77
Figure 10 Survey Questions Implemented in Qualtrics ................................................................. 78
Figure 11 Survey Questions Implemented in Qualtrics ................................................................. 78
Figure 12 Survey Questions Implemented in Qualtrics ................................................................. 79
Figure 13 Survey Questions Implemented in Qualtrics ................................................................. 79
Figure 14 Survey Questions Implemented in Qualtrics ................................................................. 80
1
CHAPTER 1
INTRODUCTION
Throughout the history and in today’s world, successful stories about the
implementation of lean management have led to the popularity of the lean enterprise
management and its application in many areas beyond the manufacturing where it was
originated. The first entrepreneur in the industrial world who practically applied the
“lean” mindset was Henry Ford [1]. He used lean practices to eliminate the waste from
the automobile manufacturing and assembly line. The result was a great increase in
efficiency of production in terms of reducing the production time and cost while
maintaining the quality. Ford’s success in implementing lean principles inspired other
businesses to follow his strategy to improve their production performance[2].
Toyota company developed its own lean framework called Toyota Production
System (TPS) after observing U.S. automotive industry and learning from Ford
company[3]. In Toyota Production System, the lean concepts previously applied by Ford
were more classified. For instance, wastes were categorized into seven different classes
that facilitate the process of identifying and eliminating them[4]. In addition, in TPS the
value of the system was clearly defined as delivering customers’ requirements. Toyota
became one of the most successful and growing companies as a result of its lean
strategies. Toyota Production System’s success made a revolution in manufacturing lines
which motivated the competitors in automobile industry and even other industries to learn
and implement TPS strategies to their benefit.
2
There are several companies in the current market that have applied lean practices
into their design process which enabled them to make a huge improvement in their
business and helped them to become a leading company in their field. For instance,
Spanish apparel retailer ZARA used lean production strategies to apply new designs into
its stores in 14 days while keeping the costs low. As a result, by applying lean practices,
it is closing to the title of world’s biggest clothing retailer that almost quadrupled its
sales, profits, and locations since 2000 [5]. Another example is Lista International
Corporation. The main purpose of implementing lean practices at Lista International
Corporation was to provide customers a broad offering of high quality custom storage
products in the shortest possible time. Lista has decreased its inventory by 35% and
eliminated the need for a 17,000 square feet finished goods inventory warehouse after
implementing lean thinking strategies in its procedure [5].
In the tourism industry, Marriott Corporation was one of the first companies that
decided to apply lean design strategies into its system. As a result, the service score for
Marriott Towne Place Suites was increased by 10 points to 87 which resulted in its
ranking to be in the top 10% of its competitors. The improvement positively impacted the
hotel's performance through revisiting customers [5].
Today, many companies are familiar with the concepts of lean enterprise
management and have applied the lean philosophy to manage the various endeavors they
may have. One of the areas where the lean management philosophy and practices can be
applied to improve a company’s overall success is the product design phase. An
overwhelming amount of literature on lean management and its application on new
product development exists. The lean design related articles usually present an overall
3
definition of lean as increasing the value adding activities and eliminating the wastes, and
then focus the discussion on a certain piece of product design process such as customer
information. While adding customer value and removing wastes from the design process
are two essential elements that construct the soul of lean management, other specific
factors that are required to make a process lean should be also identified and summarized
in a systematic way. Without a consensus definition on “lean product design” process and
a list of critical factors, it is hard for an organization to prioritize its product design
activities for being lean. For companies that are practicing lean design for years with or
without recognizing it, a measurement matrix can be very helpful to evaluate their
product design process. As it is widely acknowledged, especially in the lean environment,
continuous improvement built on benchmarking is critical to the organization’s success.
Without a measurement matrix, it is impossible for a company to assess, benchmark, and
continuously improve its lean design practices.
In this study, through extensive literature review, I try to develop a measurement
matrix for new product design that enables organizations to evaluate themselves in terms
of being lean. These measurement factors enable companies to convert the qualitative
concept of lean product design into a more sensible and quantitative concept.
This thesis is organized into five chapters. The topics of each chapter are as
follows:
In Chapter 2, the different stages of traditional new product development and lean
new product development are discussed.
In Chapter 3, the research question, research method, and the main purpose of this
study are explained.
4
In Chapter 4, the developed lean product design measurement matrix is presented.
Chapter 5 includes the concluding remarks, limitations and future work of this
thesis.
5
CHAPTER 2
LITERATURE REVIEW
2.1 New Product Development
New product development (NPD) can be defined as offering a product with new
attributes that will provide new or additional benefits for the final users. Product
development might include improving an existing product or creation of entirely new
product from ground zero. New product development might seem simple in definition but
it is a creative and interdisciplinary activity that is essential for economic success of
organizations [6, 7]. Companies that do not pay much attention to development or cannot
complete their product development process properly will lose their market share to their
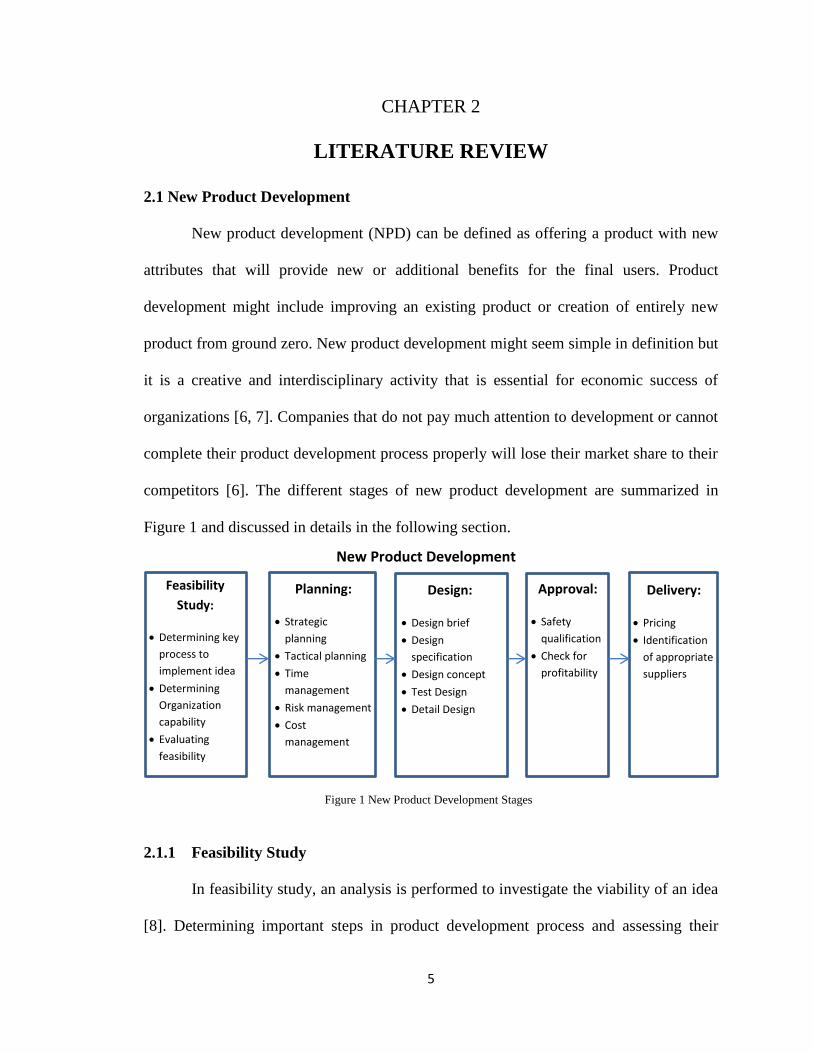
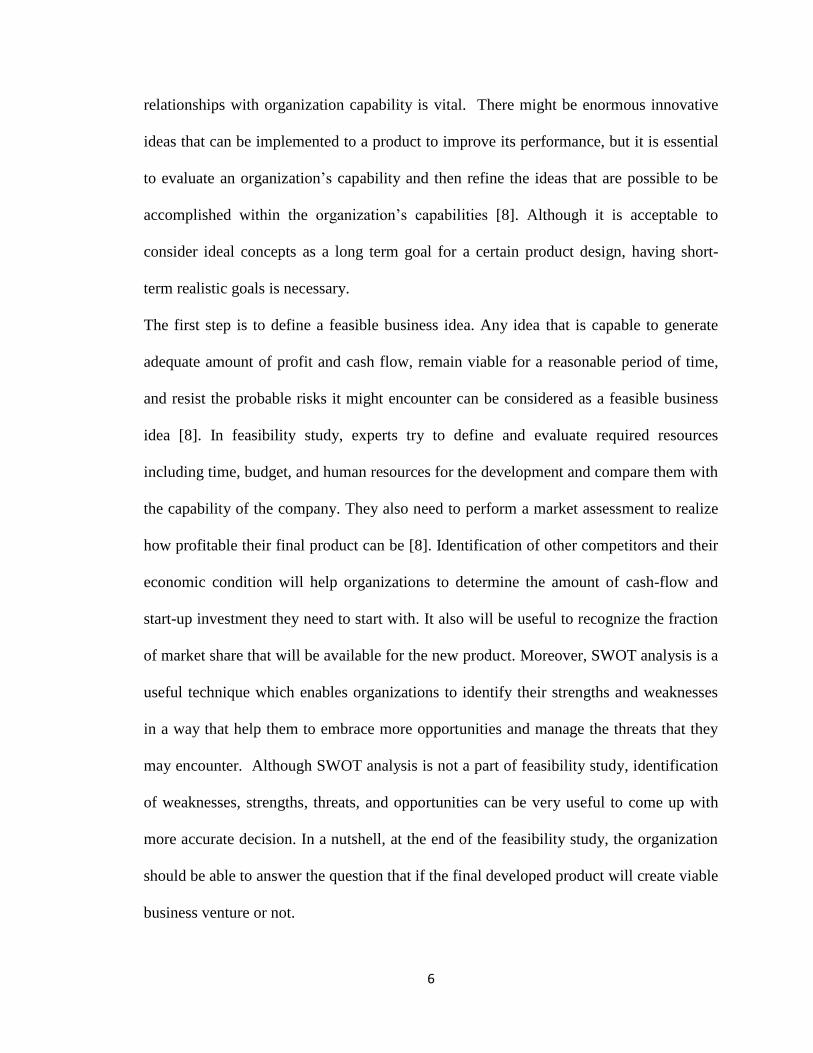
competitors [6]. The different stages of new product development are summarized in
Figure 1 and discussed in details in the following section.
2.1.1 Feasibility Study
In feasibility study, an analysis is performed to investigate the viability of an idea
[8]. Determining important steps in product development process and assessing their
Feasibility
Study:
Determining key
process to
implement idea
Determining
Organization
capability
Evaluating
feasibility
Planning:
Strategic
planning
Tactical planning
Time
management
Risk management
Cost
management
Design:
Design brief
Design
specification
Design concept
Test Design
Detail Design
Approval:
Safety
qualification
Check for
profitability
Delivery:
Pricing
Identification
of appropriate
suppliers
New Product Development
Stages
Figure 1 New Product Development Stages
6
relationships with organization capability is vital. There might be enormous innovative
ideas that can be implemented to a product to improve its performance, but it is essential
to evaluate an organization’s capability and then refine the ideas that are possible to be
accomplished within the organization’s capabilities [8]. Although it is acceptable to
consider ideal concepts as a long term goal for a certain product design, having short-
term realistic goals is necessary.
The first step is to define a feasible business idea. Any idea that is capable to generate
adequate amount of profit and cash flow, remain viable for a reasonable period of time,
and resist the probable risks it might encounter can be considered as a feasible business
idea [8]. In feasibility study, experts try to define and evaluate required resources
including time, budget, and human resources for the development and compare them with
the capability of the company. They also need to perform a market assessment to realize
how profitable their final product can be [8]. Identification of other competitors and their
economic condition will help organizations to determine the amount of cash-flow and
start-up investment they need to start with. It also will be useful to recognize the fraction
of market share that will be available for the new product. Moreover, SWOT analysis is a
useful technique which enables organizations to identify their strengths and weaknesses
in a way that help them to embrace more opportunities and manage the threats that they
may encounter. Although SWOT analysis is not a part of feasibility study, identification
of weaknesses, strengths, threats, and opportunities can be very useful to come up with
more accurate decision. In a nutshell, at the end of the feasibility study, the organization
should be able to answer the question that if the final developed product will create viable
business venture or not.
7
2.1.2 Planning
Although future is unknown and any information about future is related to
uncertainty and risk, appropriate planning will help organizations to decrease the
probability of failure. At the first step, it is necessary to outline a big picture of the
product and ensure that all the development team members understand the defined
vision[9]. After identification of the current situation and the goal, the required tasks,
process, and resources need to be defined [10]. In other words, organizations should
define a long-term strategy that facilitates the new product development cycle. Then, it is
necessary to define short-term achievement. These short-term goals will act as
checkpoints and help organizations to track their progress. Besides the strategic planning
that directs organizations to the final goal and helps them to identify any deviation from
main mission, organizations need to have a tactical plan that helps to recognize how
organization’s resources should be used in each sub-process to achieve the goal [10].
Organizations should be open to any change in planning. Some changes are inevitable,
but should be minimized to avoid reworking. It should be remembered that the goal is to
develop a product successfully and not to prove the validity of the plan[10].
One of the important activities in planning is time management. The competition
in the market forces organizations to launch new generations of their products
periodically. In some cases, the products may have a short life-span while the product
development is not fast enough to cope with it and cause problems for the company. The
companies in this case may lose the market share they have to competitors[9-11].
Consequently, shrinking the development time as much as possible is crucial. The
required time for accomplishment of each task should be allocated. In addition, the
8
relationships of the tasks need to be identified: Some tasks can be done in parallel while
some others need to be done in a sequential manner[11].
Usually, the money that is spent on a development process and the time it needs to
complete it are reversely related. Reducing and controlling the costs may cause
companies to finish the process after the due date, which means delay in delivering the
product. Time overrun will significantly increase the payback period time and it will
reduce the economic performance of the company[10]. Consequently, time overdue is
much more important than budget overrun. For instance, in a specific case, controlling
the costs helped the company to save about 3 percent of the total investment; however it
made the payback time 2 times greater than what it originally was supposed to be [10].
Also, for each day of delay in the development process, organizations should pay for their
resources, so being on the schedule should be considered when trying to control the
costs[11].
Risk management is one other step of planning. The product development team
need to create a risk profile for each tasks. In this profile, the identified probable risks and
uncertainties relating to each task are provided. Also, appropriate alternative solutions for
each of the cases are determined that will facilitate the process of managing the risks and
uncertainties [10].
2.1.3 Design
In this stage design teams will review and refine the ideas that they have listed.
This refinement process is based on the results of feasibility study for each of the ideas.
Then, they will try to specify the appropriate methods to accomplish the selected features.
They will integrate different features to see the final result and also be able to test the
9
whole concept to see if it satisfies the required conditions or not[12]. The design stage
includes different steps that are described in the following sections.
2.1.3.1 Design Brief
“Design brief” is a written document that will be prepared by design team
members. They will explain the needs for the design as a well as the desired result that
they expect. In this step, designers will describe the whole concept of product that they
are going to design [13]. It can be the same as the vision they defined in the planning
stage. The users of the products or services will also be introduced in the design brief
document and the target customer will be identified [13]. A clear target customer is really
essential since if the organization does not have any customer focus, it means the product
will be created to satisfy all different types of customers which is impossible. People
have different expectations and an individual product cannot satisfy all those needs. Also,
in design brief they will explain that if their final product is an entirely new product or an
improved version of an existing product [10].
2.1.3.2 Design Specification
In this step, designers will describe the features that they are going to add to the
product, and also methods they are going to use to implement those features[14]. It is
important to help the entire team to understand features and methods to prevent from any
misunderstanding and confusion during the design process. Based on their recognition
about customers’ requirements, the approximate amount of profit that each specification
can generate, the unity of features among competitors, necessity, and the time required to
be spent to implement each feature, the design team will rank the specifications and they
will try to accomplish the development process by implementing as much as they
10
can[12]. A design specification must include all necessary drawings, dimensions,
environmental factors, ergonomic factors, aesthetic factors, costs, required maintenance,
quality, safety, documentation and description[12].
2.1.3.3 Concept Design
Concept design is one of the most complex steps in new product development
process. As mentioned, in the design specification step, design team ranks the features.
Obviously, those features are defined as a response to requirements or problems. In this
stage, team members try to understand the root problem addressed by requirements and to
identify why those needs are qualified as a requirement. Then they will try to suggest
some alternative solutions for that problem and to check if the listed features enable the
final product to cover the requirements or not. Finally, they will decide about the best
solution that will satisfy requirements as well as business goal and companies’
capabilities[9, 10, 12]. Even if the organization decided to design different parts of
product separately, for this stage it is necessary to see the product as a whole to ensure
that all the considered features are helpful to achieve organization’s goal and vision. The
goal of the concept design phase is to identify and select the general type of solution
required and not to focus on design and implementation details. The result is a
documented design approach to successfully solve the root problem in a manner
consistent with the requirements [10].
The creative and investigative aspect of the concept design process is the most
significant opportunity for innovation during the entire new product development
process[15]. Understanding the root problem independent of any specific technology and
11
then applying creative thinking to alternative solutions facilitates innovative designs.
Concept design can identify areas where innovation is required.
2.1.3.4 Testing
During the design test stage, design team members will build and test a couple of
prototypes. Although these prototypes are not made from production components, they
represent the product as closely as possible to the actual final product. These prototypes
enable designers to determine whether the performance of the product matches the
defined specifications or not. It will also help them to identify any probable issues with
the design and provide them with an opportunity to gain field experience with the
product. Then, more accurate prototypes will be built from the first production
components received from suppliers to experience the actual design[12].
2.1.3.5 Detail Design
Detail design or design for manufacture, is the stage that refers to the recognition
of the interaction between the product design and the manufacturing section [16]. During
this phase, according to the results of the prior steps, design team will identify and
engineer the required parts. Tolerance, materials, and finishes are defined, and the design
is documented with drawings or computer files [12]. In this step, any kind of information
that is needed for the manufacturer will be provided by design teams and even some
samples will be built to check any incompatibility between design and manufacturing
process. Some ideas might seem attractive, beneficial, and applicable at the time of the
design, while during the real manufacturing process and after reviewing the actual final
product, design team might found them impractical or crude to be implemented. In this
case, design team will review the whole design concept for alternative solutions and
12
features [10]. Consequently, this step help organizations to prevent from wasting time,
money, and resources by reworking and helping them to recognize the problems before
generating the final product at the industrial scale and in huge amount for market
demand.
2.1.4 Approval
After accomplishing the design steps, and before new product delivery stage, an
important stage is, attaining the approval. According to the product and type of
organization, this approval process can be done by suppliers, investors, financial
department, etc. The purpose of any production approval process is [9, 12]:
To ensure that the designed part can meet the manufacturability requirements and
quality requirements that are expected by suppliers.
To provide evidence that the customer requirements and specification
requirements are clearly covered with designed part
To demonstrate that the design product has the potential to generate adequate
amount of profit and it will help organization to achieve its business goal.
To ensure the new product will satisfy all the safety requirements.
2.1.5 Delivery
In this stage the company will release the final new developed product after
months of effort. The delivery stage includes the identification of appropriate suppliers
based on the area that new product is generated in and the new product pricing process.
In this step, according to the time and cost that were spent for developing the new
product, the potential market, competitors’ condition, expected return on investment
(ROI), and value analysis, marketing specialists will offer a reasonable price for the new
13
product [12]. They will also forecast and suggest an appropriate alternative price in the
cases that the customers’ demand fluctuates due to either an increase or reduction in the
market demand.
2.2 Lean New Product Development
2.2.1 Basic Concepts in Lean Management
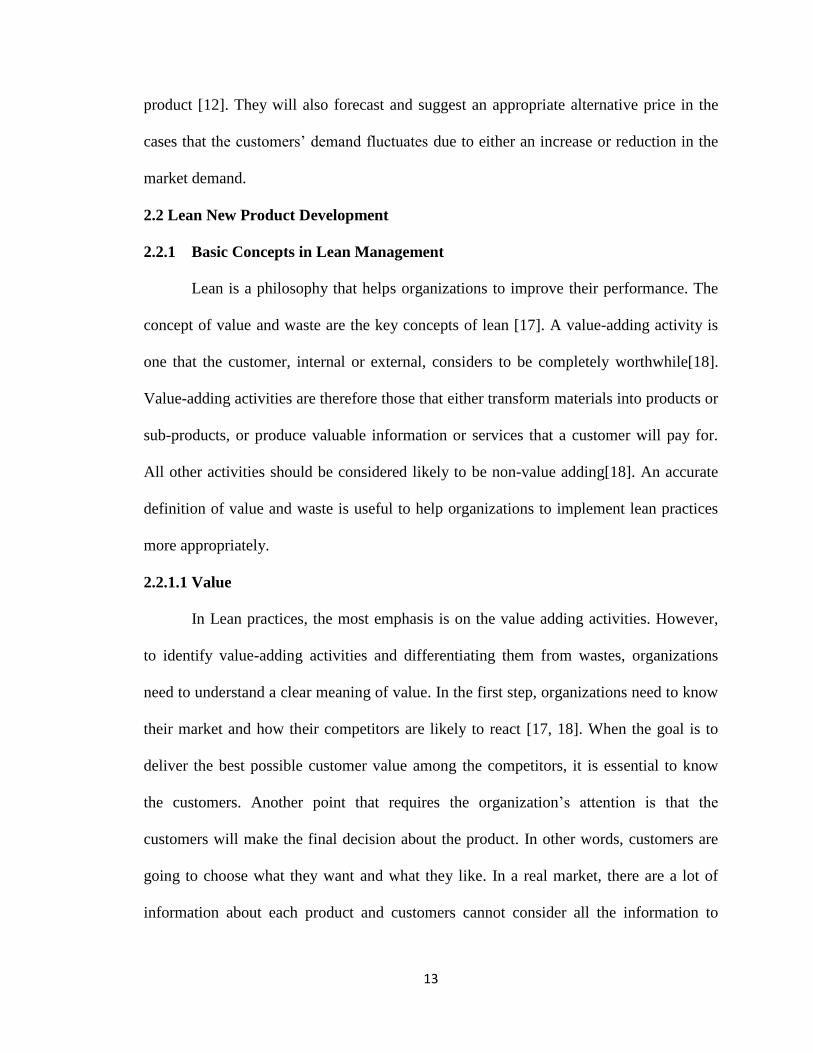
Lean is a philosophy that helps organizations to improve their performance. The
concept of value and waste are the key concepts of lean [17]. A value-adding activity is
one that the customer, internal or external, considers to be completely worthwhile[18].
Value-adding activities are therefore those that either transform materials into products or
sub-products, or produce valuable information or services that a customer will pay for.
All other activities should be considered likely to be non-value adding[18]. An accurate
definition of value and waste is useful to help organizations to implement lean practices
more appropriately.
2.2.1.1 Value
In Lean practices, the most emphasis is on the value adding activities. However,
to identify value-adding activities and differentiating them from wastes, organizations
need to understand a clear meaning of value. In the first step, organizations need to know
their market and how their competitors are likely to react [17, 18]. When the goal is to
deliver the best possible customer value among the competitors, it is essential to know
the customers. Another point that requires the organization’s attention is that the
customers will make the final decision about the product. In other words, customers are
going to choose what they want and what they like. In a real market, there are a lot of
information about each product and customers cannot consider all the information to
14
evaluate the products to make their decision. Consequently, customers will put a bunch of
information together and will classify all the information into three different bundles. The
first bundle corresponds to all sorts of operation factors including reliability, service,
price, and delivery. The second bundle is more related to product features or designs
including innovation, styles, attributes, and technology. The third bundle is whether the
product satisfies their requirements and expectations or not[19]. Customers will score
each of these bundles in their mind for each product and they will pick the product that
has the best score in one bundle and it is good enough in the other two bundles.
Consequently, to be successful, organizations should not be perfect in all of the
bundles[19]. Customers will not pick a product that is perfect in all dimensions. For
instance, a customer who cares about the price and looks for cheap product will not
choose a product that has kind of a good price. They will choose a product which has the
least price while it is good enough in other bundles. The same applies for those care
about the designs; they will choose a product which has the best available design and it is
good enough in other bundles[19]. Following this strategy helps organization to
guarantee customer satisfaction.
To understand how to define a “good enough” attribute that a product need to
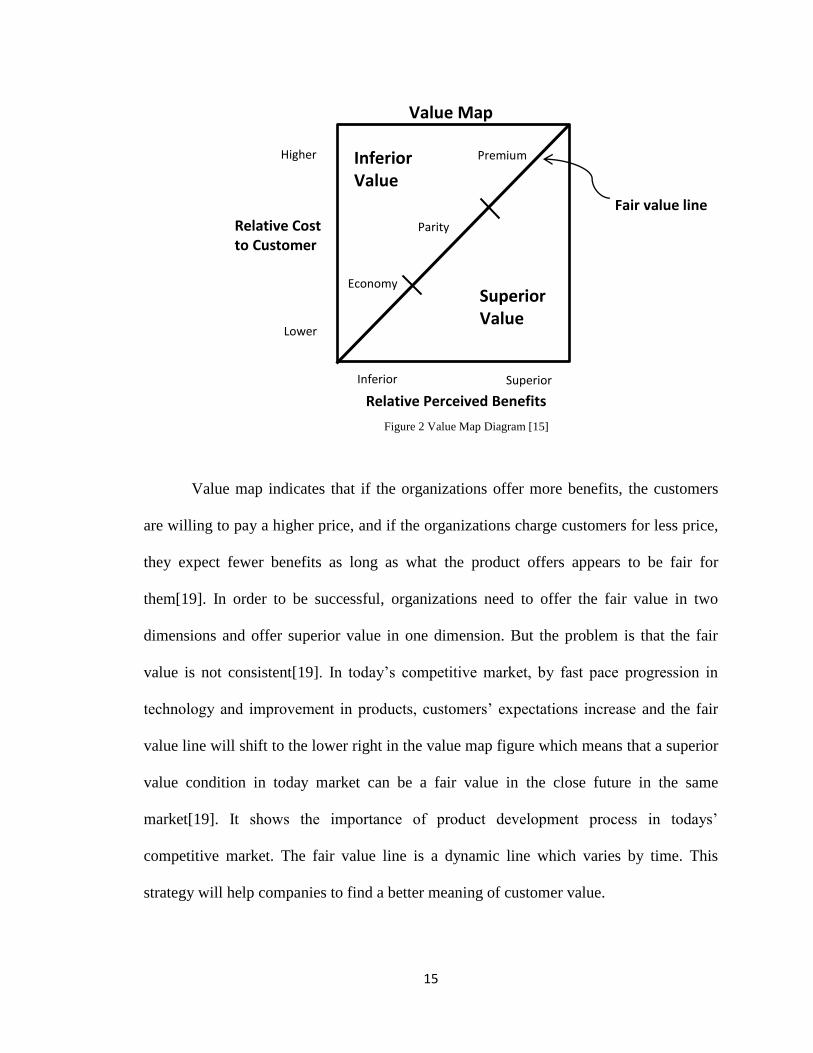
have for two of the bundles, the term “fair value” should be defined[19]. Figure 2 shows
a value map diagram that help designers to become more familiar with the concept of fair
value.
15
Value map indicates that if the organizations offer more benefits, the customers
are willing to pay a higher price, and if the organizations charge customers for less price,
they expect fewer benefits as long as what the product offers appears to be fair for
them[19]. In order to be successful, organizations need to offer the fair value in two
dimensions and offer superior value in one dimension. But the problem is that the fair
value is not consistent[19]. In today’s competitive market, by fast pace progression in
technology and improvement in products, customers’ expectations increase and the fair
value line will shift to the lower right in the value map figure which means that a superior
value condition in today market can be a fair value in the close future in the same
market[19]. It shows the importance of product development process in todays’
competitive market. The fair value line is a dynamic line which varies by time. This
strategy will help companies to find a better meaning of customer value.
Premium Higher
Relative Cost to Customer
Relative Perceived Benefits
Lower
Parity
Economy
Inferior Value
Inferior Superior
Superior Value
Fair value line
Value Map
Figure 2 Value Map Diagram [15]
16
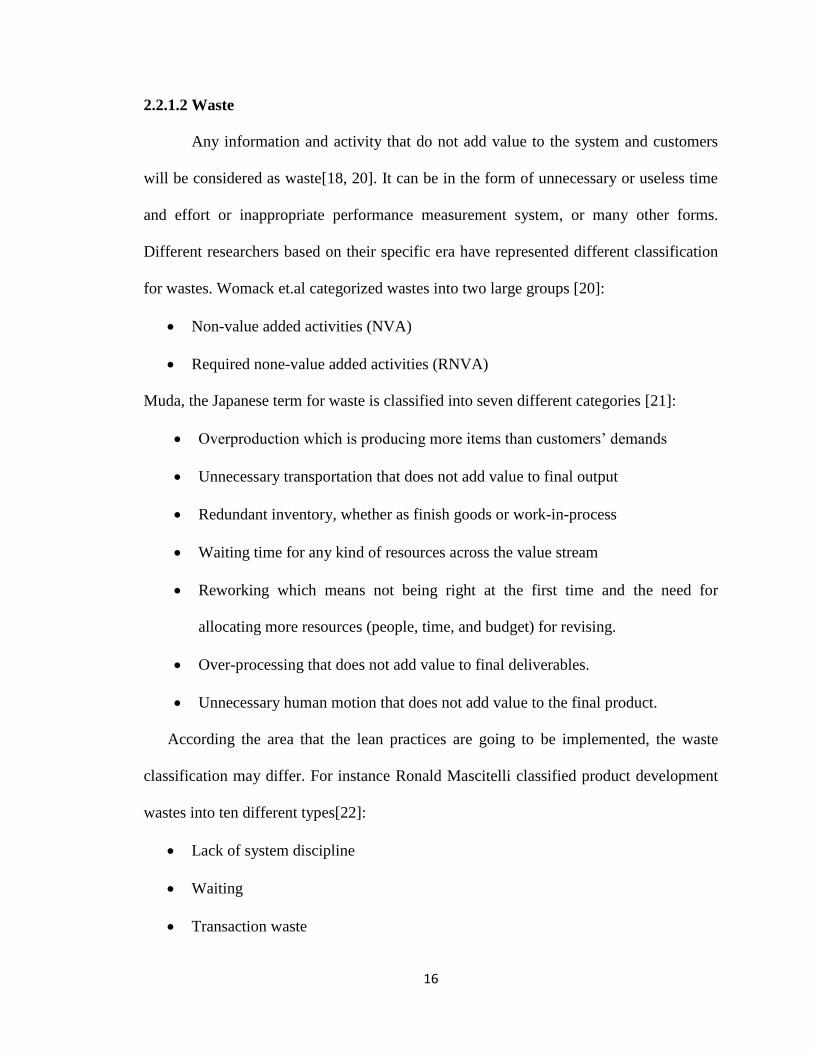
2.2.1.2 Waste
Any information and activity that do not add value to the system and customers
will be considered as waste[18, 20]. It can be in the form of unnecessary or useless time
and effort or inappropriate performance measurement system, or many other forms.
Different researchers based on their specific era have represented different classification
for wastes. Womack et.al categorized wastes into two large groups [20]:
Non-value added activities (NVA)
Required none-value added activities (RNVA)
Muda, the Japanese term for waste is classified into seven different categories [21]:
Overproduction which is producing more items than customers’ demands
Unnecessary transportation that does not add value to final output
Redundant inventory, whether as finish goods or work-in-process
Waiting time for any kind of resources across the value stream
Reworking which means not being right at the first time and the need for
allocating more resources (people, time, and budget) for revising.
Over-processing that does not add value to final deliverables.
Unnecessary human motion that does not add value to the final product.
According the area that the lean practices are going to be implemented, the waste
classification may differ. For instance Ronald Mascitelli classified product development
wastes into ten different types[22]:
Lack of system discipline
Waiting
Transaction waste
17
Hands of or transfer of process between people
Re-invention waste
External quality enforcement
Over-process and over design
Lack of effective communication
Too many meetings
Concurrent process that are unsynchronized
The more the information about the area that lean practices are going to be
applied, the more specified and detailed waste classification can be. After identifying
values and wastes, an appropriate practical strategy need to be developed. Implementing
the developed strategy will enhance the organization performance through making it
leaner. In general it can be interpreted from above classification that wastes are any item
that uses available resources but does not add value to the system in a way to satisfy the
customer value.
As mentioned, lean thinking is based on some prior idea like Kaizen, Just in Time
(JIT), and Total Quality Management (TQM). One of the key elements of lean that has
been introduced by TQM is producing high quality products at relatively low cost[18].
Quality can be defined as providing the exact product or service that can satisfy
customers’ requirements, no more, no less. However, these requirements need to be
provided at the right time and the right price. Quality measurement is an aspect of TQM
that is essential for lean environment. Quality management approaches across with
process capability techniques will reduce the variability of the outcomes and increase
their quality[18].
18
It is necessary to consider some process control methods to measure the quality of
a system. For instance, a controller system can periodically check the correctness of
information about customer requirement and apply any required revision and update. It
can also make an environment within the organization that enables the employees to
ensure that each process step supplies free-defect outcomes to the next step[23]. TQM
also emphasize on the importance of continuous improvement or Kaizen which is
essential in lean organization. Organizations need to map their value stream and analyze
each step to identify and remove wastes. This process needs to be repeated incrementally,
which means in each analysis step, the current wastes and bottlenecks of the system need
to be identified and eliminated and then the system need to be analyzed again to find the
new bottlenecks[18]. This incremental evaluation and waste elimination process will
cause continuous improvement which results in high quality deliverables.
2.2.2 Lean Product Development Process
As mentioned, product development process results in a final product with new
additional features and attributes. However, to complete a product development
successfully, it is important to identify needs and requirements. In traditional product
development, organizations try to develop their product for the sake of development. To
be successful, organizations need to keep continuous improvement in the soul of their
strategies; but at the same time, it is necessary for them to generate and improve products
that correspond to users’ requirements [24]. In traditional approach of new product
development, companies designed products with additional features and then look for any
potential customer for their new products or services. While it is obvious people do not
pay for additional features, they tend to pay for something that will provide them some
19
benefits. Organizations need to understand the fact that customers differentiate between
extra features and beneficial features[6]. Consequently, new product development can be
described as the transformation of customers’ requirements into a product or service that
satisfy those needs. Companies and organizations need to investigate potential problems
in their existing product or their customer requirements and then find solutions and
alternatives for them. Their new product must be a response to a demand not just for the
sake of designing something new.
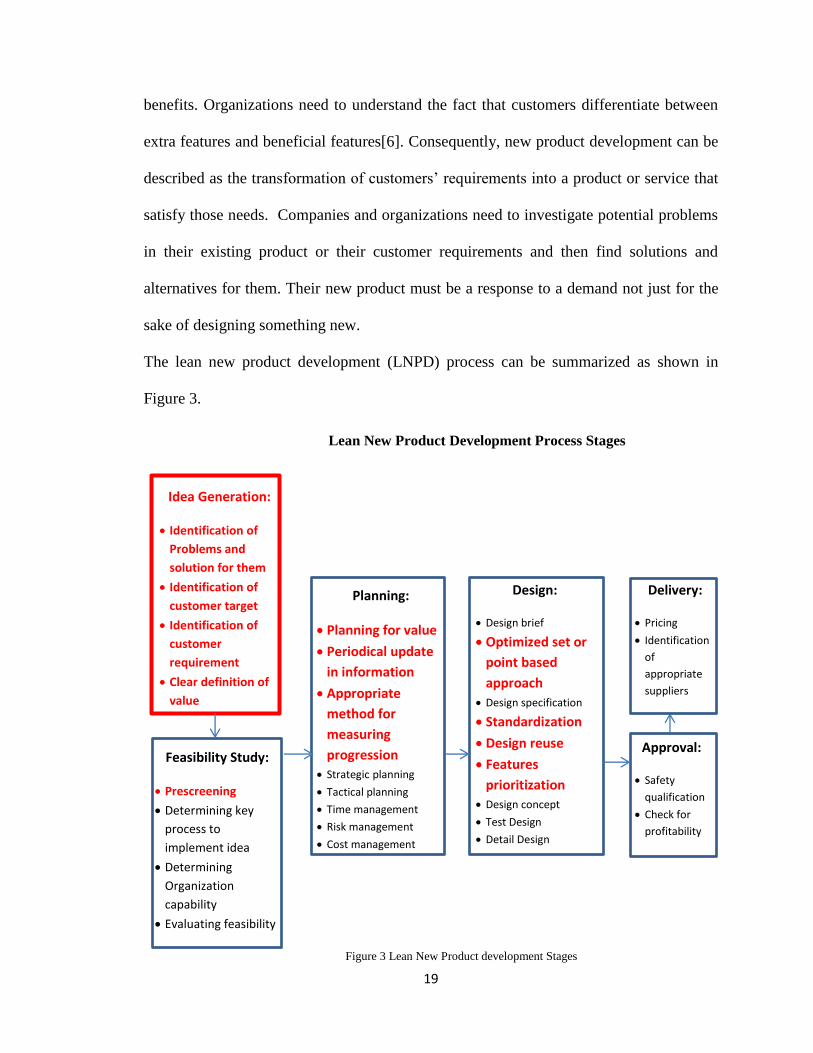
The lean new product development (LNPD) process can be summarized as shown in
Figure 3.
Feasibility Study:
Prescreening
Determining key
process to
implement idea
Determining
Organization
capability
Evaluating feasibility
Planning:
Planning for value
Periodical update
in information
Appropriate
method for
measuring
progression
Strategic planning
Tactical planning
Time management
Risk management
Cost management
Design:
Design brief
Optimized set or
point based
approach
Design specification
Standardization
Design reuse
Features
prioritization
Design concept
Test Design
Detail Design
Lean New Product Development Process Stages
Approval:
Safety
qualification
Check for
profitability
Delivery:
Pricing
Identification
of
appropriate
suppliers
Idea Generation:
Identification of
Problems and
solution for them
Identification of
customer target
Identification of
customer
requirement
Clear definition of
value
Figure 3 Lean New Product development Stages
20
In comparing traditional and lean new product development processes we can see
some significant differences. Lean new product development has the additional step of
idea generation including identification of problems, customer target, customers’
requirements and clear definition of value. In feasibility study of the lean product
development, instead of beginning the study from the scratch, organizations should start
with a prescreening of other competitors. Planning for the value, periodical updates
during the development process, and definition of proper methods to measure progression
are three main differences of lean and traditional development process in planning stage.
In the design stage in LNPD there are some additional steps including standardization,
design reuse, and features prioritization. Approval and delivery stages are almost the
same in traditional and lean new product development processes.
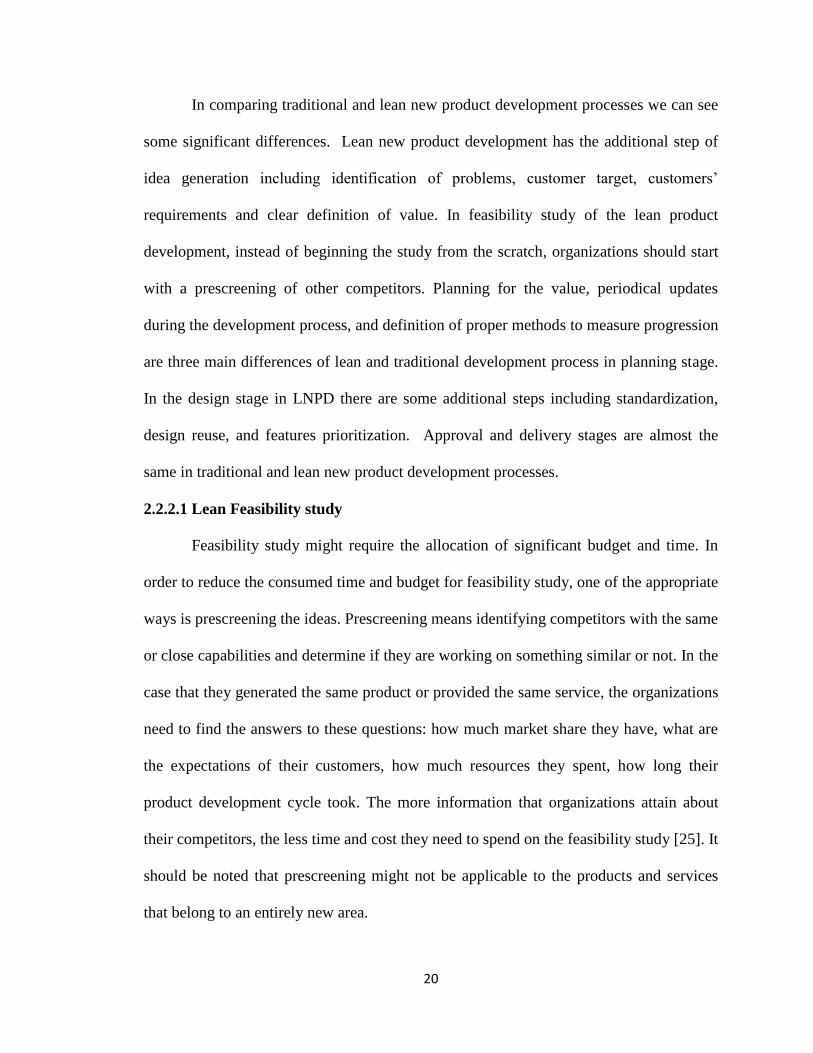
2.2.2.1 Lean Feasibility study
Feasibility study might require the allocation of significant budget and time. In
order to reduce the consumed time and budget for feasibility study, one of the appropriate
ways is prescreening the ideas. Prescreening means identifying competitors with the same
or close capabilities and determine if they are working on something similar or not. In the
case that they generated the same product or provided the same service, the organizations
need to find the answers to these questions: how much market share they have, what are
the expectations of their customers, how much resources they spent, how long their
product development cycle took. The more information that organizations attain about
their competitors, the less time and cost they need to spend on the feasibility study [25]. It
should be noted that prescreening might not be applicable to the products and services
that belong to an entirely new area.
21
2.2.2.2 Lean planning
At the start point, organizations planned based on their current knowledge.
However, during the implementation of the development, some information might
change. In traditional approach of NPD most organizations do a poor job of capturing and
disseminating new knowledge and information. The lack of knowledge or using poor or
inadequate information will increase the probability of mistakes and waste of time,
money, and resources [26, 27]. While in LNPD organizations need to update their
information about the process in short periods of time.
The other important issue about NPD is that in this approach, organizations plan
their strategies based on the world view that they have. They planed tasks and process to
achieve what they want. While in LNPD, organizations need to plan based on their
customers’ view and they need to define tasks that help them to achieve their customers’
requirements[18].
In the traditional way of progress reporting that is used in the traditional approach
of NPD, the progress is measured according to the amount of work or investments that is
already done, relative to the amount they still need to do. This approach encourages
design teams to start tasks at their earliest time to show that the progression percentage is
well. In the other words they will start the development process without sufficient focus.
In this approach design team members do not consider the importance of the tasks and
appropriate time to start them which is good for the whole procedure [28, 29]. In
addition, measurements should direct managers to the tasks that need their attention. The
traditional approach of process progress report encourages them to ignore the tasks that
have problems and move on with the tasks that they can easily perform to show
22
progression, but all these tasks will merge together at the end of process. Therefore,
design teams need to stop and accomplish those tasks that had difficulties. This will
decrease the probability of failure of the new product development process. In LNPD the
progression of the process will be determined by comparing the results with short term
goal that were defined at the beginning of the planning to help the development team to
understand the situation compare to those goals [27].
In traditional approach of NPD, development team maps the process and analyzes
each step for improvement. This improvement can be in form of adding new features or
enhancing the performance of existing features. However, continuous improvement is
essential for organizations success and it is important to start it from bottlenecks. In
LNPD, the bottleneck needs to be identified for improvement. Any improvement in other
tasks rather than the bottleneck will not have any effect on performance of the whole
process. After improving the bottleneck task, that task will not be considered as
bottleneck any more, and the bottleneck will change to another task which requires
resolution and in this manner, the procedure of continuous improvement will be
accomplished [29]. This will help organization to spend less time, budget, and resources
since they need to only spend them, where they are required and specifically for the
bottleneck task and not for all of the tasks within the process.
In summary, In LNPD, organization will focus more in execution and delivering
value instead of defining a certain firm plan and controlling that plan. It does not mean
that planning and controlling was not important for them, it was less important than
execution and they spent most of their time on executing compare to planning. There was
not any certain schedule or planning for their activities. They crafted the vision of what
23
they wanted to design and then managed their activities according to the fact that they
need to be value added [30]. They spend most of their time to communicate information,
designing and testing product according to the vision and less on the firm scheduling.
2.2.2.3 Design
There are two different approaches for the design stage in new product
development: Point based approach and set based approach [31]. In the point based
approach, the design team will design the whole product at the same time. All the design
steps that were described in the previous sections will be done at the same time [31]. The
design team members all together will define the design description and specifications.
Then they will do the concept design and testing, and finally the detailed designs. This
kind of approach seems to be inefficient. There are a lot of time wasting and additional
costs because of the longer design process and inappropriate usage of human resources.
In this approach there is not any concurrent engineering which means doing some steps in
parallel. In set based approach, the whole system will be divided into some subsystems.
Also, the design team will be classified into some different category in which they are
knowledgeable [31]. Then each team will individually design the subsystem that was
assigned to them. Each team will have its own vision, specification, prototype, testing
process, etc.
Some authors like Endris et al. claim that the set based approach is more lean and
efficient. They believe, in this approach, the different parts of the product will be
designed at the same time and in parallel to other parts and it will help organization to
save a significant amount of time during the development process. However, there is
another important point that organizations need to consider. When each of the teams are
24
done with their designs an integration process is needed. Since the teams accomplished
their designs individually during the development process there might be some
contradictions in different teams’ designs or at least some problems in synchronization
process which will waste a significant fraction of the time that had been saved due to
concurrent engineering. To prevent this problem it is important to assume some
intermediates between design teams and set more frequent meetings to update teams’
information about other parts’ designs. Besides requiring some budget, increasing the
number of intermediates might increase the probability of mistakes and wastes, since the
probability of sending information or documents to wrong teams will increase [25].
Consequently, it seems that an optimized approach between the set and point based will
be needed depending on the case. Design teams need to be more agile, they need to
decide between these two approaches or some combination of them based on the product
they are going to develop.
2.2.2.3.1 Design specification
In LNPD, researchers of design teams will identify customer needs. They will
identify needs through conducting surveys, asking for feedbacks, face to face interviews
with existing and potential purchasers, focused groups, and tracking similar products of
competitors. They will provide a list of needs that will include latent need that are needs
that customers may not be aware of them or problems they simply accept without any
question, as well as explicit needs that are needs that will most likely be reported by
existing customers [6]. Researchers develop the necessary information on which the
performance, size, weight, service life, and other specifications of the product will be
based. Customer needs and product specifications are organized into a hierarchical list
25
with a comparative rating value given to each need and specification. Based on the rating
that each of the specification will get the design team will rank the features for
implementation [24]. In LNPD this prioritization and rating will be based on the customer
viewpoints and not based on organization’s viewpoint.
A wrong stigma in traditional product development approach is the more, the
better while with today’s highly competitive markets and fast pace of improvement in
competitors’ products, organization should optimize their costs and also reduce the
development lifecycle. The more might be the better, but the longer development time
will cause to lose the market share. It will also cause more investment, therefore to
increase the profit, the price of final product will be relatively high that will have
negative impact on customers’ willingness to choose this product or service [30]. In
addition, in LNPD approach, organizations need to review their prior designs; they need
to maximize the design reuse fraction while in traditional NPD approach there was no
emphasis on this important point. Using prior designs and features that the company had
spent resources, time, and money on will help the company to reduce the cost and elapsed
time.
2.2.2.3.2 Design concept
In LNPD, while in some cases producing some actual samples of the final product
is inevitable, LNPD suggests that the organizations should minimize the needs for
generating actual product samples; instead manufacturers and developers can use three
dimensional solid modeling using programs such as “Pro-Engineer” or “Solidworks”.
Once the database has been developed, prototype components can be rapidly built on
computerized machines such as “CNC”, fused deposition modeling devices, or stereo
26
lithography systems [28, 29]. Using software and simulators in design process is highly
recommended in LNPD. In the detail design step in LNPD the intention is to transfer all
the required information for manufacturing, as well as transferring the information
necessary to minimize the costs and resources that are used for manufacturing a new
product. In other words the optimization of manufacturing process need to be done in
design process since most of the wastes in manufacturing steps are rooted in the design
procedure. Simplification of product design, minimizing parts count, and also trying to
design product for existing manufacturing line are some common ways that can help to
have more efficient manufacturing process [24].
2.2.2.3.3 Standardization
Standardization step in LNPD is as crucial as all the other steps in design stage.
Standardization helps to identify how the process should be completed by sequencing all
the tasks and eliminating non-value added activities. The standardization approach can be
applied to the parts used in the product design or the tasks in the design processes.
Simplifying the processes is a great way to reduce the probability of variability during the
procedure. The less variability a system has the less probability of mistakes and wastes it
will have [27]. Changes during the design process means that, a significant amount of
time, money, and resources that have been used until then were useless and an update in
information is essential. A formalized system with defined structure is less prone to
variability; however it is necessary to be aware of the latent problem that might occur
because of a firm structure [31].
27
2.3 Lean Product Design
As mentioned, product design is one of the most important stages of product
development process. Lean product design means to apply lean practices into product
design stage. Stephan Emmitt described lean product design as improving the quality of
services and products that are delivered to customers [32, 33]. Javier Freire and Luis
Alarcon described the four stages necessary to produce improvements and changes as:
Diagnosis/evaluation, changes implementation, control, and standardization and stated
that an integration of lean thinking practices with these steps can be considered as a lean
product design process [34]. Ballard and Koskela emphasized on the importance of
uncertainties [32]. A design process which was less prone to uncertainties and is able to
keep its pace without relentless pressure to reduce cost and time can be defined as a lean
product design process [32]. Formoso et al. believed effective communication, adequate
documentation, efficient input information, balanced resource allocation, and proper
decision making are important keys that can enable organizations to lean their design
process [34]. Bagley and Lewis described lean product design process as a process that
generates value for customers and removing the wastes [35]. Martinez and Farris
emphasized on a steady need for a fast and less costly product design (PD) process which
will provide a high quality outcome [36]. Karlsson and Ahlstrom focused on the
importance of fewer errors during the PD process [36]. Chen and Taylor identified
standardization, design for manufacturing, and value analysis as key components that
help companies to enhance their design performance [37]. There were a lot of description
and definition that was explained by numerous authors and researchers. Based on the
literature review performed for this work, although most of those studies referred to
28
proper points and in general they talked about the same concepts, but lack of a consensus
definition of lean product design was obvious.
In addition, there was not any measurement tool that enables organizations to
evaluate their design process. Each of the studies offered some useful factors to make
product design process leaner, but there was not any comprehensive list of factors that
organizations can use to measure their design process performance. Consequently, a gap
was found in the appropriate and precise definition of lean product design and a lean
product design measurement matrix. In this research I tried to identify a comprehensive
list of measurement factors to facilitate the PD evaluation process.
29
CHAPTER 3
RESEARCH QUESTION AND RESEARCH METHOD
3.1 Research Question
A successful new product development process can lead to a successful business.
The new product development is integrated to the ability of a business to remain
competitive in today’s market with rapid pace of changes in technologies and customer
requirements. In today’s market the development process time is just as important as the
existence of development process. In other words, a delayed or slow new product
development process will have the same result as the absence of new product
development. Another aspect of new product development can be seen in the fact that
users are looking for more innovative products and organizations that offer their
customers more inventive products and services could be the leader in their industries.
The most difficult challenge for different companies is to find an appropriate balance
between their product life cycle and their new product development time. If their product
life span becomes shorter than their new product development time, that company will
encounter serious problems in the future and they will lose their market share to the
competitors. Consequently, it is essential for all the companies to make their NPD
process leaner. The first step in this procedure is to understand different factors that have
impact on the NPD performance of an organization.
As discussed in chapter 2, there is a lack of consensus in definition of lean
product design; and also there is not any in detailed list of important factors in this
process. Consequently, based on the information that I obtained through an immersive
30
literature review, in this thesis I will identify those important factors while determining
certain measurements corresponding to each of them to enable companies to evaluate
their performance.
3.2 Research Method
My review of the lean new product development and lean product design
literature will start with a “read through” of books on LNPD and LPD, e.g., [5] and [54],
and frequently quoted articles on LNPD and LPD, e.g., [3] and [51]. This will allow me
to establish the most relevant keywords, which were employed in the subsequent formal
search for related literature. I will search for articles based on the following keywords:
“Lean Management,” “Lean Concept,” “Lean Product Design,” “Lean Design,” and
“Lean Product Development” or “Lean” in combination with “development” or
“designing”. The literature search will be accomplished through databases including:
Academic OneFile, Academic Search Premier, Business Source Premier, IEEE Xplore,
Sage, Compendex, Science Direct, Springer, and Wiley. Together, these databases contain
all major journals publishing articles on LNPD and LPD.
Initially, the articles found will be broad, and therefore, I will skim through the
abstract and conclusion of articles to determine whether to include a certain one for
review. This will generate a first tentative list of literature. In this round several articles
will be excluded from the list since they might only discuss the lean concept or lean
manufacturing and not necessarily LNPD and LPD. Next, I will go through all the
remaining articles for a second round of filtration. Some of the articles might only cover
the general steps and principles of LNPD and LPD, which means there will not be any
clear definition of lean design or a list of factors that have impact on leanity of new
31
product development or product design process of companies. Consequently, I will
exclude those types of articles from my list. After creating a list from appropriate articles,
I will begin reviewing all the remaining articles in detail to extract all of the effective
factors that may have an impact on the lean design process. Finally, I will develop
specific measurements corresponding to each of the founded factors in order to make the
qualitative factors of the lean design process more quantitative; and as a result, more
sensible.
After developing the measurement matrix I will design the online survey
questions. Depending on the amount of required information, I will design one or a
couple of questions corresponding to each of the developed measurements. In order to
have a survey which will provide me reliable, accurate, and applicable results there are
several points that I need to consider during designing the survey questions.
The first point is to avoid asking about more than one subject in one question or
statement. For instance, I need to ask respondents about the quality and quantity of their
information about their customers. Each of the subjects, “quantity of information” and
“quality of information”, should be asked in a separate question. Another common
mistake in designing survey questions is to use leading questions. A leading question is
one which attempts to guide the respondents’ answers. All the statements and questions
need to be designed in a way to ask the point of the statement indirectly and both the
respondents and designers should not feel any advantages in choosing a specific choice or
option. The next frequent mistake in designing surveys is to use words that have vague
meanings that can be interpreted differently by different respondents. Using words with
32
relative meanings such as frequent, good, high, cheaper, etc. can be an example of this
type of mistake.
Another important aspect of designing survey questions is to use a combination of
different types of questions based on the information to be collected. There are several
types of questions including open-ended, close-ended, yes/no questions, likert system,
multiple choice, fill in the blank, etc. Open-ended questions are the least preferred type of
question since they take more time from respondents and they only should be used when
they are required. While people prefer “yes/no questions”, in most cases it will not
provide researchers with accurate and reliable results and it would be better to use the
likert system to be aware of the level of agreement or disagreement of respondents with a
certain statement. To increase the response rate, I also need to minimize the number of
questions.
33
CHAPTER 4
DEVELOPING MEASUREMENT FACTORS FOR LEAN
PRODUCT DESIGN
In this section, the presented measurement factors need to be investigated to
evaluate the leanity of the design and development process of an organization.
4.1 Customer Satisfaction
As noted before, lean management focuses on customer values. The quality of a
product is the most important element to achieve customer satisfaction [38, 39]. Products
with a high degree of design that meets customers’ needs is not guaranteed to be
successful; however a product with low degree of design meets customers’ needs will
absolutely result in an unsuccessful market. Consequently, it is essential to ensure that the
developed product or service satisfies customers’ needs. After addressing problems with
the current design of a product, new features that customers are willing to pay for can be
added. The features considered for development need to be based on customers’ demands
and expectations and not for the sake of development [40]. The customers’ requirements
need to be identified, and correspondent features and attributes that can satisfy those
expectations need to be added to the product.
Customers’ needs include the expected features, a fair price, and proper release
data [41]. A high quality product can be defined as a product with the maximum number
of expected features, offered at a fair price and introduced at the right time. To satisfy all
34
the needs, organizations need to gather adequate amounts of information from proper
sources [38, 39].
4.1.1 Information about Customers’ Requirements
While various methods and tools were developed to increase quality, they mostly
focus on cost and throughput time. It is important to acquire information about customers
including: Who are the customers, what they do, why they need the product or service,
how they will use the product, when they need it, how much money they are willing to
pay for it, what aspect of the product make them feel good about, what their expectations
are, how they think about competitors’ products, etc. [42].
The more specified who the target customers are, the more detailed and accurate
definition of value based on customers’ expectations and requirements can be acquired.
Adequate information about the ways that the product can be used by customers will help
the company to see different aspects of product’s usage to ensure that it will meet all the
expectation and to resolve any probable problems with the product. Information about the
time that users need product will help to release the developed product at the right time.
Besides expected features and proper delivery time, customers are looking for a fair
price. Companies need to identify the fair price of a product according to the customers’
viewpoint. Information about the opinions of customers about competitors’ products can
help a company to identify its potential market. As well, they can focus on products of
popular competitors to add advantages of competitors’ products to their product [42].
These information help companies to have a clear understanding of users’ requirements
to design products that will satisfy their needs. Consequently, it will be easier for
35
organizations to prioritize the features that need to be considered for the final developed
product.
The information about users’ needs also help companies to define value and waste
more appropriately. Any characteristic of product or any step in the design phase that is
important for users and might increase their satisfaction will be considered as value [42].
In the same way any activity or attribute which will not result to customer satisfaction
will be considered as waste. For example more information help companies to define
more clear objectives and goals for their design teams which decrease the probability of
deviation or change during the design phase since they are aware of the point that they
want to achieve [42]. In this case, more information about users helped organization to
prevent from wastes. These information also facilitate the process of planning based on
the customers’ view point which means a more accurate definition of value. Improving
information about customers’ needs cause quality improvement and lead to more
customer satisfaction.
The information transformation from marketing team should not be limited only
into the design steps. A continual flow of information through customers’ feedback
during the whole development and delivery process help design teams to improve
features regard to users’ values [42]. Different approaches that help organizations to
acquire information about customers will be discussed in next section.
4.1.2 Appropriate Source to Gather Information about Users
Inappropriate source of information about customers’ requirement will cause
problem in the design process and may lead the companies in a completely wrong
36
direction [40, 41]. Consequently, gathering information from appropriate sources is
critical.
Every new product has a life cycle that describes various stages of the market of
that product over its lifetime. Each stage has different customers with different
requirements and expectations. Different customers of a new developed product during it
lifetime can be classified into: innovators, early adaptors, early majority, late majority,
and laggards. By understanding the market segment and target customer correspond to it,
organization’s information becomes broader about customers’ requirements. In the next
step, for having more detailed information about customers’ needs each organization
should listen to customers’ concerns and complaints in order to understand their desires
and find out what are the features that they expect. As an example customers that are
classified in early majority segment care more about quality, while laggards care more
about the price, and innovators focus on features and applications. Consequently, a
specific product cannot satisfy all different types of customers and it is essential to
consider effective strategies to acquire accurate information about customers to identify
the target customers and their needs. Different approaches that help organizations to
acquire information about customers are listed below:
Developing Long-term Relationship with Customers: Companies having long-
term relationships with their customers are ahead in the competition. Giving
benefits for existing customers would help companies develop a better relation
with them. For instance, some companies offer a free product after a certain
number of repurchases of a specific product. This can help establish a good
relationship with the customers and allow companies to hear their customers more
37
clearly. This will also help companies attain useful information about the features
that their customers expect from future product [9].
Making Customers a Part of the Design Process: By asking customers for their
feedback and suggestions in certain periods of time, companies can improve their
information about customers’ requirements. Companies can consider some of
their current customers as developers by asking qualified customers to participate
in the design process and help improve the products. Those customers can
experience the developed product before the actual release date. As a result,
useful feedback about the product can be provided to help the company resolve
problems before product launching [9].
Ethnography Research or Camping Out: This is another useful way to get
information about customer needs. It includes camping out with customers or
observing customers for extended periods, watching and probing how they use or
misuse the products. According to an ideation survey that was conducted by
Product Development Inc. among 160 US firms, ethnography provides the
greatest insights into users’ unmet and unarticulated needs, applications and
problems. The depth and quality of knowledge and information it will provide is
the main advantages of this method. The main disadvantage is the time and cost it
takes to conduct such studies. By shortening the length of visit per customer and
using advanced technologies like on-site video cameras, the time and cost of this
process may be reduced [43].
Customer Visit Teams: Customer visit team can also help companies to improve
their information about their products’ users. In this method cross-functional
38
teams visit customers and employ in-depth interviews to recognize user problems,
needs and desires for new products. The major advantage of in-depth customer
visits is the ability to identify customer problems and unspoken and latent needs.
Since the interview questions are open-ended, they allow the opportunity for
acquiring information that might not be gained by quantitative research. Finally,
using cross-functional interview teams promotes a shared vision of what
customers need and expect. The main challenges are getting customers to
cooperate, finding the time to perform this study, training the interviewers and
designing a robust interview guide [43].
Living the Customers’ Experiences: The design team members should put
themselves in the shoes of the customers and realistically experience the products
to find out about weaknesses and strengths of their products and services. This
will help the team analyze and evaluate their products’ performance based on the
customers’ viewpoint rather than designers’ viewpoint and enable them to find
out information that were blind to them [38, 44].
Customer Focus Group: Customer focus group is a helpful method to detect
problems that customers had experienced with products. In this method, focus
groups are run with customers or users to identify needs, wants, problems and
suggestions for new products. The focus group moderator skillfully focuses the
discussion on problems or wants, and helps users walk through their problems.
Challenges include getting the right customers to agree to participate, as well as
the cost associated and possibly in finding the right moderator with focus group
skills and product knowledge. Further, since the sample size of group attendees is
39
quite limited, potential biases may occur in the discussion due to one dominant
person [43].
Lead-user Analysis: The theory is that if one works with innovative customers,
innovative product ideas are the result. The technique entails assembling a group
of particularly innovative customers or users to recognize problems and potential
solutions. The major challenges are identifying who the innovative or lead users
are, getting them to participate in an off-site workshop, and then structuring and
running the workshop session properly. This method is definitely recommended
[43].
4.1.3 Quality of Communication between Marketing and Design Team
In most organizations the marketing department is responsible for gathering
information about customers, and design team in engineering department is responsible
for implementing features that satisfy customers’ expectations. Consequently, the quality
of flow of information between marketing and design teams has a great impact on the
design [45]. The more smoothly information flows between the two teams, the more
accurate information the design team will have about the customers which further leads
to reduced mistakes, changes, and other type of wastes during the design process [46]. In
some development projects the goal of marketing and design teams might be different or
do not match perfectly. The first step to facilitate the communication between teams is to
ensure that both teams share the same goal. Both teams need to participate in a meeting at
the beginning of the project to check the long and short-term goals and plan for execution
[45]. At the beginning of the design process, marketing team will provide adequate and
accurate information about customers’ expectations to help design team to prioritize
40
features that need to be added to the product. This communication needs to be continued
and gradual update of information by marketing team during the design process is
essential. To transfer new information between teams some frequent meetings need to
happen throughout the development process.
Having information as quantitative as possible will make it easier to communicate
accurately. For example, quality function deployment (QFD) is a structured approach to
define customers’ requirements and transform the qualitative demands into quantitative
parameters for implementation in the design phase [47]. Besides, all reports between the
design and marketing teams need to be comprehensive yet concise. They should
concisely cover all aspects of the project. Any missing points can cause a change in
design after manufacturing which is highly undesirable in a lean environment as more
time and money will be wasted. In general, the more effective communication between
design and marketing teams, the leaner the design process can be.
4.2 Cost and Time
Differentiating between value adding and non-value adding activities and
identifying different sources of costs are two important steps to achieve lean product
design [48]. Supporting and designing costs are two main sources of cost in the product
development process. Usually, companies need to allocate an appropriate portion of their
human resource, time, and money to identify their weaknesses and problems and then
find proper strategies to improve them [44]. Resources spent this way are considered to
have supporting costs. Besides, the money that companies need to spend to attain
appropriate location, services, and software for their design team before the beginning of
design activities are considered as supporting cost [49]. Some portion of the supporting
41
costs, like the ones spent to provide location, services, and tools are inevitable while the
others spent on fixing defects or product redesigns should be avoided [49]. For the
design cost, it includes money and any kind of resources that are consumed during the
design phase that are convertible to money. Required information and human resources
are two examples of inputs that companies usually spend money on during the design
phase [48-51]. Technically, the less the design and supporting costs are while retaining
features that satisfying the customers’ expectation, the leaner the design process is.
However, it is essential to differentiate costs that do not add value to the final product
from costs that are necessary and value adding, though companies tend to focus on cost
minimization to become lean [52].
Time is an important factor for business success, as it is a limited resource not
possible to restore [44, 53]. Consequently, besides efficient usage of material, human
resources, and information, organizations need to manage their time appropriately. Late
delivery of products and services can be the result of inefficient usage of time that could
cause problems like losing markets, gaining a bad reputation, and being over budget [49,
53-55]. To avoid delivering the product late, organizations need to shrink their product
development life cycle. A significant fraction of product development time is consumed
by design process and shrinking the design process time helps to reduce the overall
product development time. Mapping the value stream in the design process and
eliminating the non-value adding activities are helpful ways to reduce the design process
time [41, 51, 54, 56].
There are different reasons for wasting time during the design phase, and they
include: improper or unclear definition of the goal, postponing the problems, unrealistic
42
planning and estimation, ineffective communication and negative iteration [39, 52, 57].
If no clear goal is set at the beginning of design phase or when design issues are not
resolved in a timely manner, unnecessary changes will need to happen during the design
that waste time and money [57]. Although certain iterations are necessary for value
generating during the design process, unnecessary iterations are considered as negative
and should be eliminated. Correcting design errors is an example of negative iteration
[41, 58].
Accelerating the design process will help a company to deliver its products within
short time frame and ahead of its competitors. This further gives the company a chance to
introduce its products and services to the early adaptors in the market and possibly get
feedback [55, 59] to rectify any problems that need to be solved. Accelerating the design
process also helps companies to respond to customers’ orders faster and increase the
overall flexibility [51, 54, 58]. According to the rapid pace of market changes, the
prototype development time should be as short as possible since customer requirements
might change during the periods of time.
Managing information inventory is a helpful strategy that helps organizations to
avoid wasting time [57]. For this purpose, the non-value adding information should be
identified and then be eliminated. Besides, information about prior and current design
projects can be classified into clear subjects that help different design team members to
find required information faster and more accurately. This process will facilitate the flow
of information from one entity to the other and as a result facilitate the process of reusing
prior information. Some other ways that help to decrease the design process time include
[53]:
43
Evaluating and employing technological methods like simulation software and
automated instruments in design process at the right step.
Identifying and removing unnecessary mediations ,whether they are people or
systems
Disseminating essential information and knowledge
Identifying and eliminating parallel tasks during the design process
In general, the less time spent in development and design process, the more lean
the organization NPD is. Next we discuss a few specific factors that influence the time
and cost associated with the product design phase.
4.2.1 Variability of Outcomes
Reducing variability of outcomes in the design phase will help reduce the
probability of wastes in the form of defect, overdesign, and over-specification [38, 58, 60,
61]. Reducing the variability of outcomes can be achieved thorough standardization.
Standardization is a key component of lean product design and production that defines
how the process is to be completed by sequencing all the value adding tasks while
removing non-value adding activities [60, 62]. Defining clearer structure and establishing
certain standards as well as employing part integration and simplification are all useful
techniques to decrease variation during the design process [51, 60, 62, 63]. By
simplifying and formalizing the design steps, the entire design and manufacturing process
is less prone to variability. Using part integration can be useful to help team members
reduce the complexity of design process [62]. Most of the problems in the manufacturing
process are rooted in the design steps, and reduction of variation in the design process
will significantly decrease the variation in the manufacturing process, and thus make both
44
the design and manufacturing processes lean [38]. In general, the less variability in the
design process and the design outcomes, the leaner the process is.
4.2.1.1 Reducing Unnecessary Complexity during the Design Process
In product design, the power of managing complexity is very important.
Complexity of design process causes hidden costs that are not easy to identify. Pessoa, et
al. introduced a helpful way to identify unnecessary complexity called the “Zero Base”
approach [55, 63].In this approach company is suggested to begin the design process
from scratch and analyze that of each product separately to identify the unnecessary and
redundant steps in the process. Since “hands off” or intermediate steps, usually cause
higher probability of complexity, failure, and cost, they need to be identified and
removed [64]. Possible impacts from removing those steps then need to be re-evaluated
by engineers. Besides redundant steps, using or storing unnecessary details is considered
as a source of unnecessary complexity too. A periodical review of detailed information is
also helpful to decrease or eliminate over-documentation to make the design process
simpler and leaner [56].
4.2.2 Defects
Defects in manufacturing and designing represent any activity or result that
prevents the process from being desirable, safe, and complete or in other words, prevents
process outputs from being what customers expect [61]. Defects are a main type of waste
in the lean concepts. Most of the time the defects that occur in the design process can be
easily removed and this type of waste have much priority to be rectified.
While companies should try to minimize the mistakes and defects, it might be
hard to eliminate them completely. The information about the future is restricted and
45
makes the project domain uncertain. This uncertain domain usually leads to unavoidable
defects. Reasons that may increase the defects include [61]:
Poorly managed fast design process: A fast design process may increase the
probability of defects, but if managed appropriately it can also help correct
mistakes occurred in the design process in a faster manner.
Lack of discipline: The absence of a certain structure within the design teams and
lack of clear understanding of roles and responsibilities will increase the
probability of defects.
Poor goal-setting: The lack of clear definition of goal to achieve will cause
confusion for design team members that increase the probability of defect.
Inappropriate amount of information: insufficient amount of information may
lead design team to an incorrect feasibility study and/or profitability study that
further result in defects in design.
Inappropriate definition of value: A vague or inappropriate definition of value
may cause team members to misunderstand value brought by individual tasks in
the process and create defects that are not valued by customers.
The best way to eliminate defects is to believe in and apply the “Zero Defect”
theory [58]. This theory is a kind of thinking procedure stating that any amount of defects
is not acceptable and everyone should do things correctly at the first time to prevent
spending time for more reviewing and correcting errors [58]. It emphasizes that all tasks
should be done correctly without repeat and rework. Another name for it is “Right First
Time.”
46
Using more organized systems will help to decrease the defect rate too. Using
open book management system that lets managers give proper information about
strategies and tactical plans of the organization to the employees could help. Less manual
data transfer and fewer interfaces decrease the probability of defects [54, 55]. Current and
future state mapping can help identify some of the probable reasons of defects and thus
avoid them.
4.2.2.1 Selecting the Right Technology
Certain technological instruments and software can help the design phase be more
accurate and reduce mistakes. Selecting and adopting the right technology to use during
the design phase will help to decrease defects as well. To select the right technology,
incorporation of experienced employees and young and talented employees who are
familiar with new technologies and software is essential [40].
Overall, the fewer defects a design process produces, the less resources will be
wasted, and thus the leaner the process is.
4.2.3 The Percentage of Design Re-uses
Some of the forces that drive NPD process are limited time, fast changes in
technology and customer demands, and intensive competition. All of these factors make
the efficient use of resources a necessity. Design reuse is one of the approaches that can
help companies utilize their resources more efficiently. It is the process of reusing
previously developed designs to make or improve new products and services [50, 56]. It
helps to design and build new products with less effort, cost, and time. Design reuse will
reduce cycle time, design errors, changing specifications, and poor compliance with
research and development process. Designers and developers could use a design method
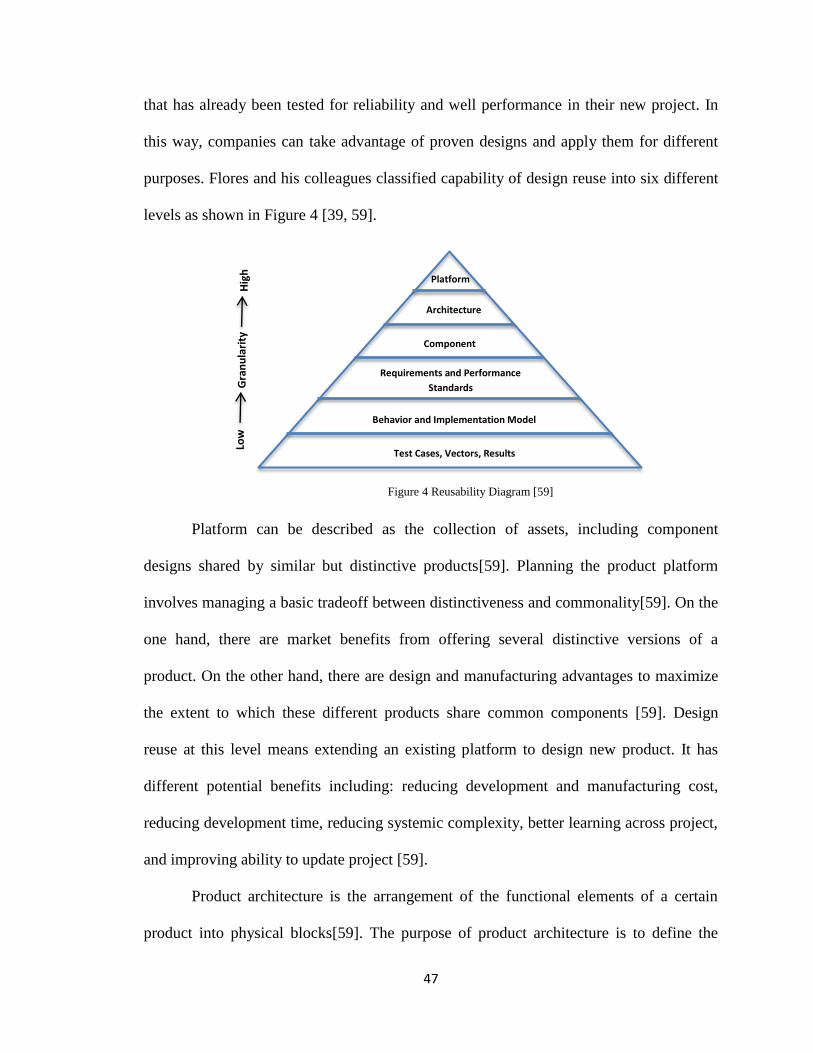
47
that has already been tested for reliability and well performance in their new project. In
this way, companies can take advantage of proven designs and apply them for different
purposes. Flores and his colleagues classified capability of design reuse into six different
levels as shown in Figure 4 [39, 59].
Platform can be described as the collection of assets, including component
designs shared by similar but distinctive products[59]. Planning the product platform
involves managing a basic tradeoff between distinctiveness and commonality[59]. On the
one hand, there are market benefits from offering several distinctive versions of a
product. On the other hand, there are design and manufacturing advantages to maximize
the extent to which these different products share common components [59]. Design
reuse at this level means extending an existing platform to design new product. It has
different potential benefits including: reducing development and manufacturing cost,
reducing development time, reducing systemic complexity, better learning across project,
and improving ability to update project [59].
Product architecture is the arrangement of the functional elements of a certain
product into physical blocks[59]. The purpose of product architecture is to define the
Platform
Architecture
Component
Requirements and Performance
Standards
Behavior and Implementation Model
Test Cases, Vectors, Results
Hig
h
Gra
nu
lari
ty
Low
Figure 4 Reusability Diagram [59]
48
basic physical building blocks of the product in terms of both what they do and what their
interfaces are with other parts. Product architecture can be categorized as “Modular” and
“Integral”. The architecture demonstrates which modules will be part of the system and
what their functions will be [59]. Modules may be common across different products, but
they may also be specific to any one product. Design reuse at this level means using
modules from prior design to design a new product. Modularity provides some
advantages including [59]:
It allows the designer to control the degree that changes in processes or
requirements might affect the final product
By facilitating and promoting interchangeability, modularity gives designers more
flexibility to meet changing processes
Reduce in the life cycle costs by reducing the number of processes and reducing
repetitive processes.
Reusing a component from prior designs in new ones is increasingly viewed by
companies as a way to offer high variety in the market while retaining low variety in
operations. The design reuse rate at the component level can be calculated as Eq.1 [53,
59].
Design Reuse=
Eq.1
Requirements reuse is commonly defined as the process of analyzing, eliciting
and managing requirements at a suitable abstraction level so that they can be reused in
new systems [59]. Behavior and implementation models are next stage in the
development process to capture users’ requirements and implementation details. The
49
reuse of these models offers great value if modular models are designed based on
singularized requirements and parameterized to absorb product specific variability [59].
Even in a system with large number of functions that all perform flawlessly; only
one mistake can be catastrophic in a procedure. In order to carry out thorough testing for
increasingly complex systems, huge amount of resources will be needed to test each
system’s iterations during the development process. To decrease the time and resources
consumed for testing, alternate ways such as testing automation and testing reuse are
developed [59]. Design reuse at the testing level means capturing and reusing common
test patterns or using tests that were performed in prior designs to test current designs.
Design reuse is considered primarily in three dimensions. The first dimension is
along the process chain and goes deeply into the design. The second dimension is along
the time, between different versions, to revalidate a new version with playback of
prerecorded test cases and comparison of results against expected test results. The third
dimension is in the form of test cases, test results, test vectors, and across different
production lines[59]. Based on the level of common functionality of product lines, a large
number of test cases, test scripts and accepted output can be reused to help companies
save time [59].
In general, increasing the percentage of design reuse increases the leanness of a
new product design process.
4.2.4 Design Change after Release to Manufacture
Design change after manufacturing can be considered as a type of waste.
Increasing the number of design changes before manufacturing and during the design
process may be an indication of innovation and improvement based on updated
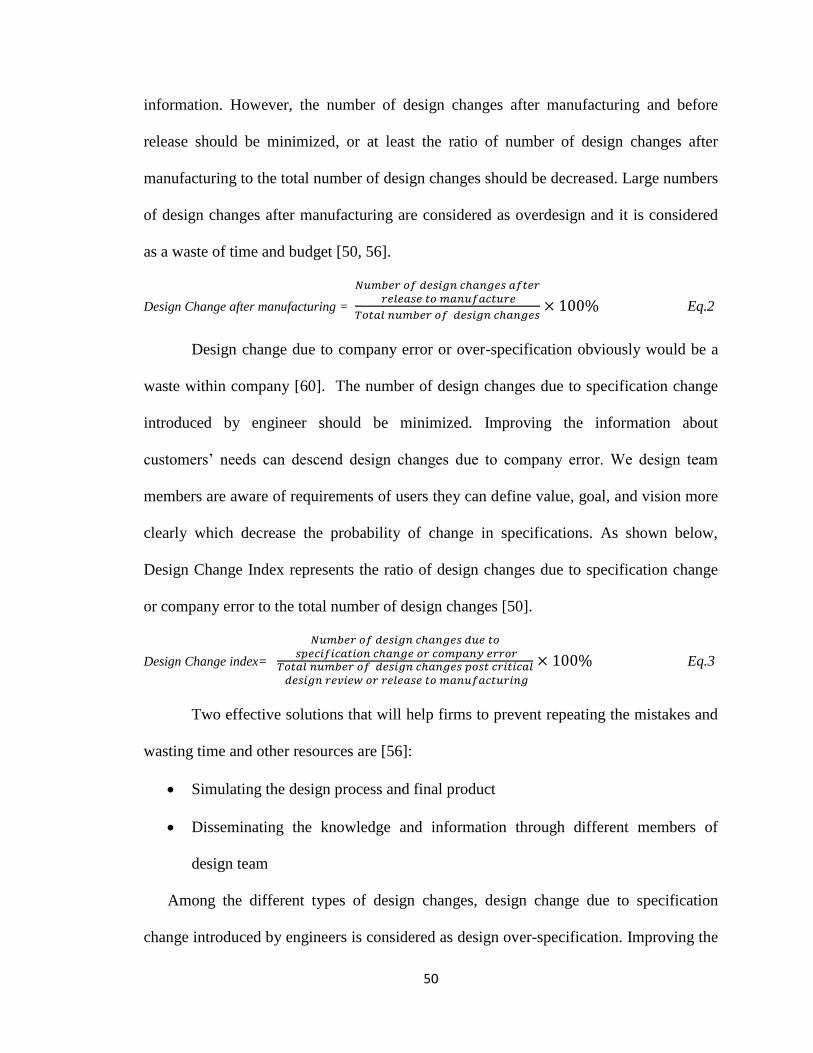
50
information. However, the number of design changes after manufacturing and before
release should be minimized, or at least the ratio of number of design changes after
manufacturing to the total number of design changes should be decreased. Large numbers
of design changes after manufacturing are considered as overdesign and it is considered
as a waste of time and budget [50, 56].
Design Change after manufacturing =
Eq.2
Design change due to company error or over-specification obviously would be a
waste within company [60]. The number of design changes due to specification change
introduced by engineer should be minimized. Improving the information about
customers’ needs can descend design changes due to company error. We design team
members are aware of requirements of users they can define value, goal, and vision more
clearly which decrease the probability of change in specifications. As shown below,
Design Change Index represents the ratio of design changes due to specification change
or company error to the total number of design changes [50].
Design Change index=
Eq.3
Two effective solutions that will help firms to prevent repeating the mistakes and
wasting time and other resources are [56]:
Simulating the design process and final product
Disseminating the knowledge and information through different members of
design team
Among the different types of design changes, design change due to specification
change introduced by engineers is considered as design over-specification. Improving the
51
quality of information about customers’ needs can help prevent design changes due to
this reason.
In summary, to be lean in the product design process, the number of design
changes after manufacturing and before product release need to be minimized.
4.2.5 Effective Communication
Communication is an essential part of daily work a product designer has in a
company. Effective communication across organization is essential to the success of
everyone’s job and helps avoid deviations from the organizational goals [65]. The first
step to have effective communication within the organization is to understand the
organization’s culture, plans, and objectives clearly. For the product design team, besides
understanding the organization’s overall vision and mission, team members need to
understand everyone’s responsibilities within the team to avoid poor system connectivity
[53, 60]. Poor system connectivity means involving too many sources, systems, and data
when it is not necessary for project accomplishment or excluding sources, systems, and
data that were required to be involved [56, 58]. When too many systems are involved,
extraneous manual intervention may happen and the probability of sending information to
the wrong place may increase. When essential systems are excluded, problems in
disseminating required information and useful knowledge among employees will occur
and lead to inappropriate decisions.
To facilitate effective communication, certain technologies can be adopted. For
example, electronic grapevines, which represent the usage of online media in businesses,
are tools that facilitate electronic communication [56, 58]. The use of public or private
forums can create environment more comfortable for employees to give feedback and
52
possibly share bad news about the design process. Electronic grapevine tools can be used
internally or externally in an organization [56]. Some of the examples of internal uses
are: cloud, email archiving and continuity, virtualization, etc. Overall purpose is to share,
transfer, store, archive, backup and protect information within an organization.
4.2.5.1 Horizontal Communication among Departments
Cooperative effort of more than one department is required for being successful in
business organizations. This will show the importance of effective communication
between people who work for different teams and departments like design and
manufacturing teams. When a message is being transferred via multiple parties, it can
easily get distorted [40, 41]. As a result, eliminating the intermediate, or middlemen, in
transferring information can help decrease the chances of misinterpretation. Direct
communication between teams should be encouraged. Also, strategies that facilitate
communication among different departments can be employed, and they include [65]:
Filter information that should be send to other team and be concise
Avoid using jargon and special languages
Ensure that both teams in conversation have same goal
Do not ignore other team’s efforts and goals
Consider certain rules and channels for communication like monthly meetings or
weekly online meetings
Using advanced technology and software to facilitate information flow
Resolve any probable conflict as soon as possible
Listen carefully to others and give them nonverbal signals
53
4.2.5.2 Communication within the Design Teams
The overall performance of design teams highly depends on how well the team
members communicate with each other. Frequent meetings to share information and
make decisions can help build a positive environment within the design team [66]. Point
based and set base are two approaches for product design. In point based approach all the
members work on a same process and continue it step by step. In set based approach, the
design team members will be divided into sub-teams and each sub-team will work on a
specific design. When the sub-teams are done with their design, parts will be integrated
together to be the final design. Effective communication is vital for success in the set
based approach and obviously problems in communication or lack of communication
may result in designs not aligning with each other and thus lead to failure.
4.2.6.1 Design for manufacturability (DFM)
As mentioned earlier, one of the key elements of lean is to reduce the variation in
order to increase the quality of products and services. A large fraction of variations in
manufacturing can actually traced back to the design phase. As a result, it is important to
recognize the close interaction between product design and manufacturing within a
company [67]. Design for manufacturability (DFM) is an element of lean design that
helps simplify product designs, minimize the required resources and costs, reduce the
number of parts, and most importantly, ensure the compatibility of new designs with
existing manufacturing processes [37].
Assembling different parts of a product is one of the most challenging procedures
in product development and manufacturing. Incompatible and unsynchronized parts that
are usually designed by different design teams increase the amount of wasted resources.
54
Consequently, it will be useful to decrease the number of parts through part integration.
Part integration reduces the need for unnecessary assembly and also promotes the design
of parts with multifunctional features that enable engineers to use them in different
products to increase design reuse [68]. Part integration along with simplification helps
improve the efficiency and quality while reducing the variability in design. In addition,
the use of standardized materials and parts also help ensure the compatibility of design
with existing manufacturing facility, simplify the design process, and reduce outcome
variability.
4.2.6.2 Value analysis
Value is embedded in the attributes and features of products that customers are
willing to pay. Companies can evaluate their customers’ perspective to identify what
features they expect a product to have. Kano model analysis is a useful technique that
helps the design team to prioritize product features [69]. The model classifies features of
a product or service into three different categories—threshold, performance, and
excitement [69]. Threshold category includes the features that customers expect to be
present in a product or service; Performance category includes the features that are not
absolutely essential, but are aware by the customers and can enhance customers’
enjoyment of the product or service; Excitement category includes features that
customers are not familiar with and do not know if they want them, but can make the
customers pleasant once they identify them [69].
It should be noted that the relationship between customer satisfaction and product
features is not linear in all the categories. As depicted by Figure 5, a change in product
function from level A to level B has higher impact on the change of customer satisfaction
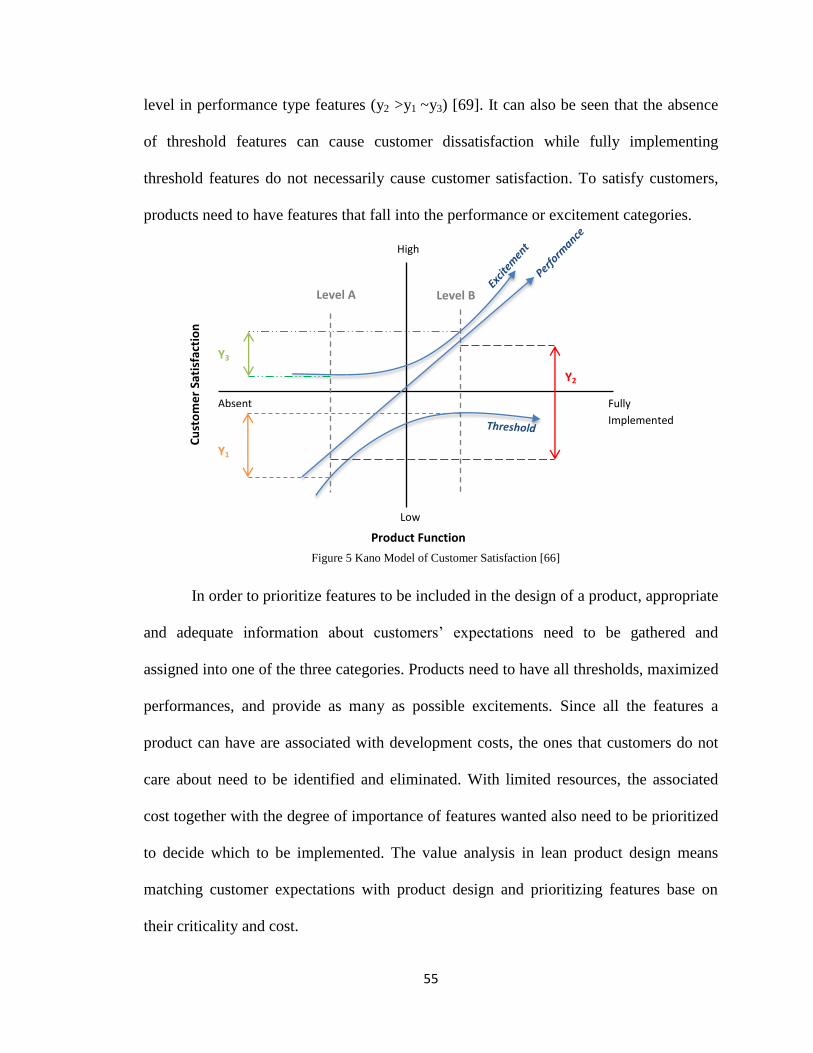
55
level in performance type features (y2 >y1 ~y3) [69]. It can also be seen that the absence
of threshold features can cause customer dissatisfaction while fully implementing
threshold features do not necessarily cause customer satisfaction. To satisfy customers,
products need to have features that fall into the performance or excitement categories.
In order to prioritize features to be included in the design of a product, appropriate
and adequate information about customers’ expectations need to be gathered and
assigned into one of the three categories. Products need to have all thresholds, maximized
performances, and provide as many as possible excitements. Since all the features a
product can have are associated with development costs, the ones that customers do not
care about need to be identified and eliminated. With limited resources, the associated
cost together with the degree of importance of features wanted also need to be prioritized
to decide which to be implemented. The value analysis in lean product design means
matching customer expectations with product design and prioritizing features base on
their criticality and cost.
Figure 5 Kano Model of Customer Satisfaction [66]
Level A Level B
Absent Fully
Implemented
High
Low
Y3
Y1
Y2
Product Function
Cu
sto
me
r Sa
tisf
acti
on
56
4.3 Lean Design Measurement matrix
To test the results that were extracted through a comprehensive literature review,
key measurements for lean product design were developed. According to the developed
measurements online survey questionnaire were constructed. Each of the survey
questions were designed based on the supportive information that were attained from
literature for each of the key measurements. By interpreting the results of the survey for
each company, their new product design process could be evaluated regarding lean. All
of the lean measurements and corresponding survey questions are explained in the
following section.
4.3.1 Measurement Corresponding to the Variables of Customers’ Information
To investigate the impact of customers’ information on leanness of the design
process of a company, measurements for variables related to customers’ information are
developed. The main variables of customers’ information for lean product design include
the quality and quantity of information about customers, variety of sources to attain
information about customers, and quality of communication between the design and
marketing teams.
For the first variable, an adequate amount of high quality information about
customers helps companies to identify their customers’ needs and expectations and
consequently a more accurate definition of value and waste. It will facilitate the
prioritization process for companies to identify areas that need designers’ attention. The
second variable, variety of sources to attain information about customers, helps
companies to avoid biased information and enable them to gather more accurate and
reliable information. For the third variable, quality of communication between the design
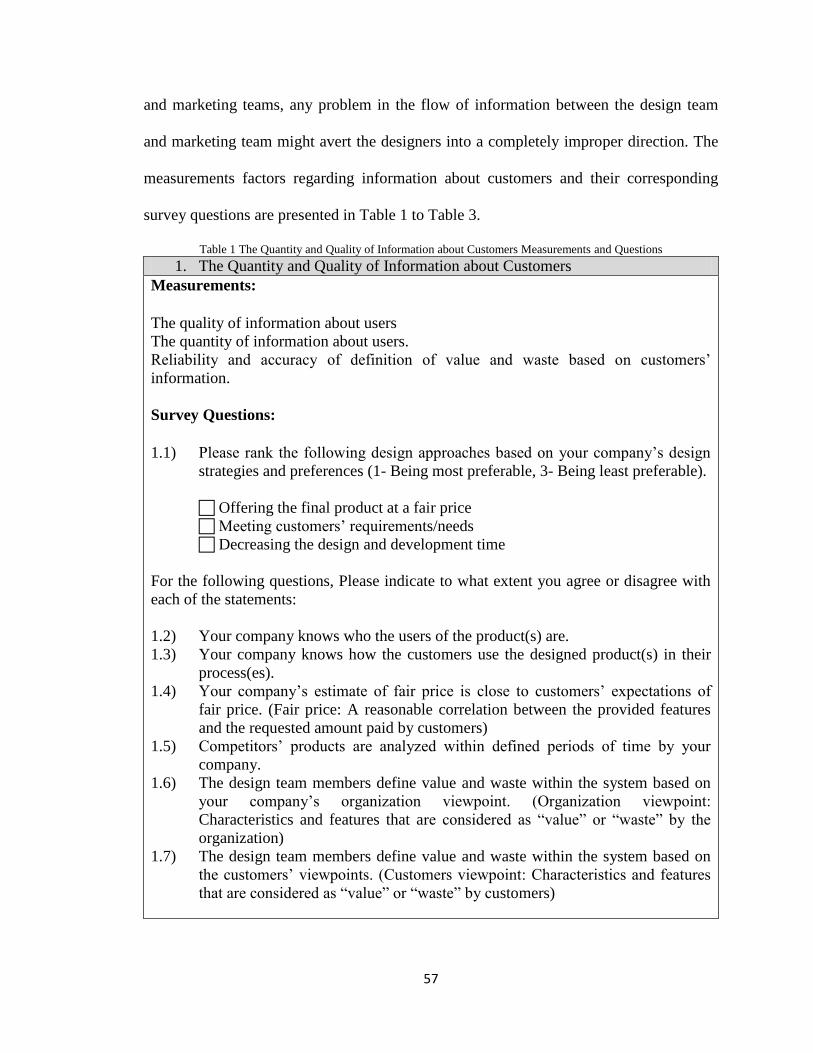
57
and marketing teams, any problem in the flow of information between the design team
and marketing team might avert the designers into a completely improper direction. The
measurements factors regarding information about customers and their corresponding
survey questions are presented in Table 1 to Table 3.
Table 1 The Quantity and Quality of Information about Customers Measurements and Questions
1. The Quantity and Quality of Information about Customers
Measurements:
The quality of information about users
The quantity of information about users.
Reliability and accuracy of definition of value and waste based on customers’
information.
Survey Questions:
1.1) Please rank the following design approaches based on your company’s design
strategies and preferences (1- Being most preferable, 3- Being least preferable).
Offering the final product at a fair price
Meeting customers’ requirements/needs
Decreasing the design and development time
For the following questions, Please indicate to what extent you agree or disagree with
each of the statements:
1.2) Your company knows who the users of the product(s) are.
1.3) Your company knows how the customers use the designed product(s) in their
process(es).
1.4) Your company’s estimate of fair price is close to customers’ expectations of
fair price. (Fair price: A reasonable correlation between the provided features
and the requested amount paid by customers)
1.5) Competitors’ products are analyzed within defined periods of time by your
company.
1.6) The design team members define value and waste within the system based on
your company’s organization viewpoint. (Organization viewpoint:
Characteristics and features that are considered as “value” or “waste” by the
organization)
1.7) The design team members define value and waste within the system based on
the customers’ viewpoints. (Customers viewpoint: Characteristics and features
that are considered as “value” or “waste” by customers)
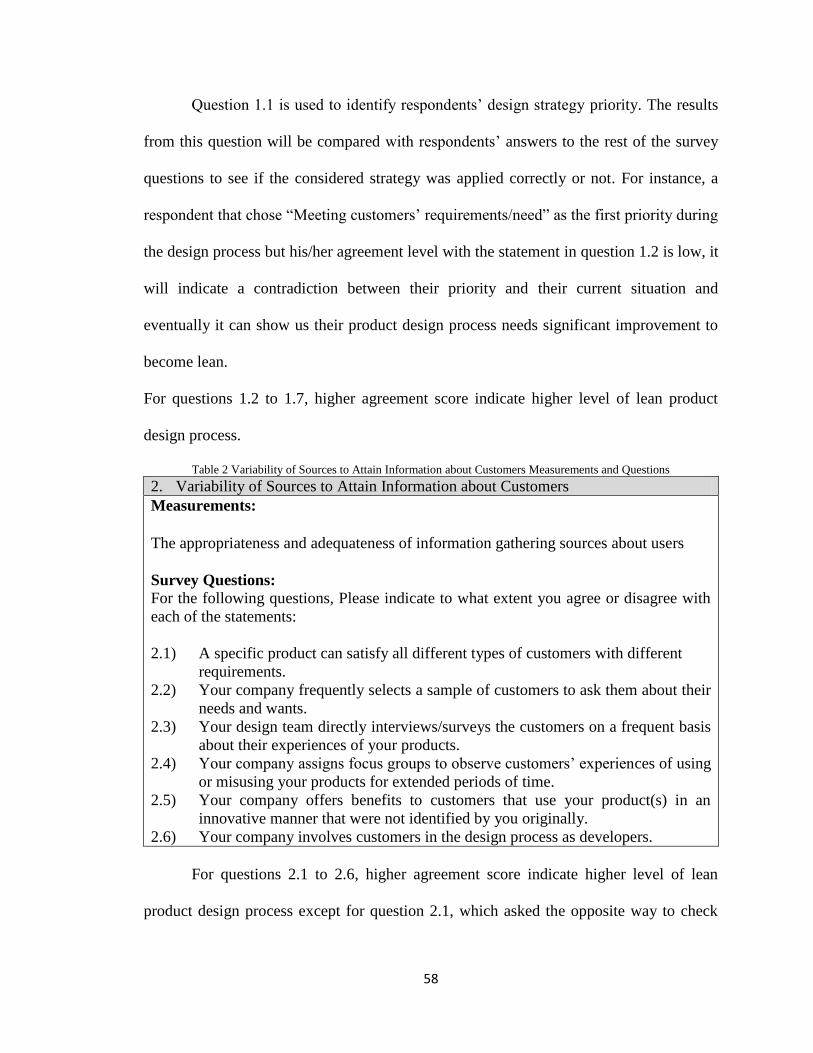
58
Question 1.1 is used to identify respondents’ design strategy priority. The results
from this question will be compared with respondents’ answers to the rest of the survey
questions to see if the considered strategy was applied correctly or not. For instance, a
respondent that chose “Meeting customers’ requirements/need” as the first priority during
the design process but his/her agreement level with the statement in question 1.2 is low, it
will indicate a contradiction between their priority and their current situation and
eventually it can show us their product design process needs significant improvement to
become lean.
For questions 1.2 to 1.7, higher agreement score indicate higher level of lean product
design process.
Table 2 Variability of Sources to Attain Information about Customers Measurements and Questions
2. Variability of Sources to Attain Information about Customers
Measurements:
The appropriateness and adequateness of information gathering sources about users
Survey Questions:
For the following questions, Please indicate to what extent you agree or disagree with
each of the statements:
2.1) A specific product can satisfy all different types of customers with different
requirements.
2.2) Your company frequently selects a sample of customers to ask them about their
needs and wants.
2.3) Your design team directly interviews/surveys the customers on a frequent basis
about their experiences of your products.
2.4) Your company assigns focus groups to observe customers’ experiences of using
or misusing your products for extended periods of time.
2.5) Your company offers benefits to customers that use your product(s) in an
innovative manner that were not identified by you originally.
2.6) Your company involves customers in the design process as developers.
For questions 2.1 to 2.6, higher agreement score indicate higher level of lean
product design process except for question 2.1, which asked the opposite way to check
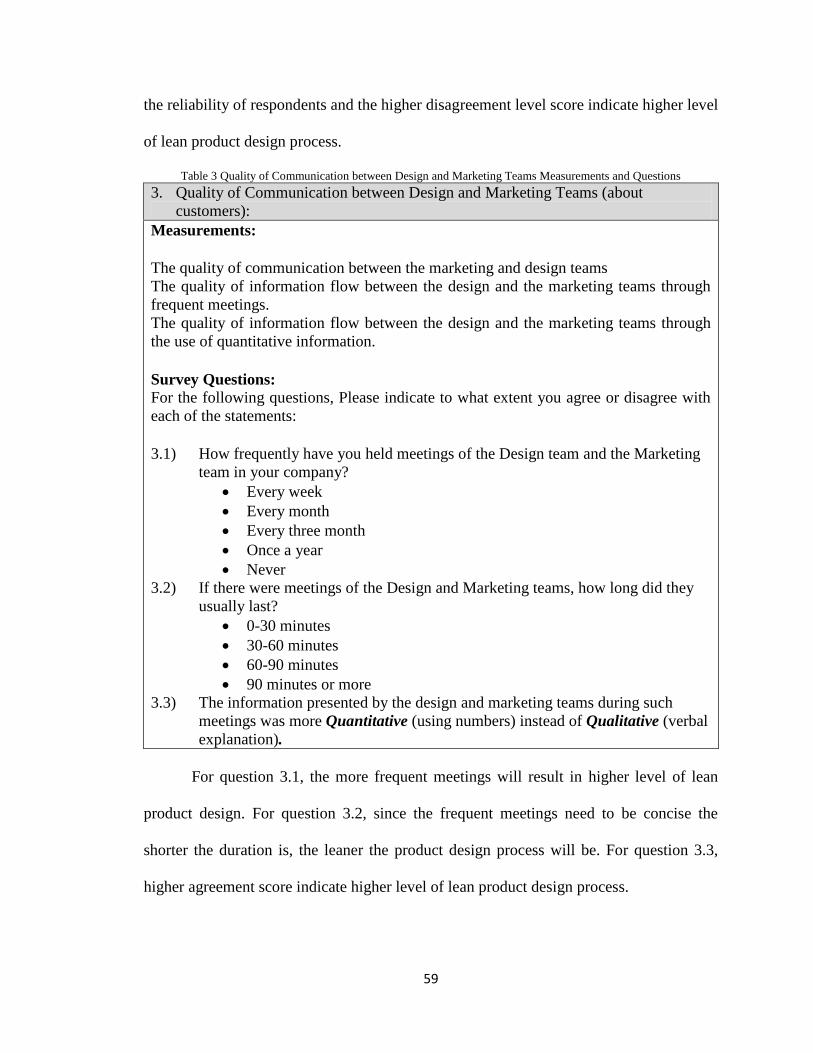
59
the reliability of respondents and the higher disagreement level score indicate higher level
of lean product design process.
Table 3 Quality of Communication between Design and Marketing Teams Measurements and Questions
3. Quality of Communication between Design and Marketing Teams (about
customers):
Measurements:
The quality of communication between the marketing and design teams
The quality of information flow between the design and the marketing teams through
frequent meetings.
The quality of information flow between the design and the marketing teams through
the use of quantitative information. Survey Questions:
For the following questions, Please indicate to what extent you agree or disagree with
each of the statements:
3.1) How frequently have you held meetings of the Design team and the Marketing
team in your company?
Every week
Every month
Every three month
Once a year
Never
3.2) If there were meetings of the Design and Marketing teams, how long did they
usually last?
0-30 minutes
30-60 minutes
60-90 minutes
90 minutes or more
3.3) The information presented by the design and marketing teams during such
meetings was more Quantitative (using numbers) instead of Qualitative (verbal
explanation).
For question 3.1, the more frequent meetings will result in higher level of lean
product design. For question 3.2, since the frequent meetings need to be concise the
shorter the duration is, the leaner the product design process will be. For question 3.3,
higher agreement score indicate higher level of lean product design process.
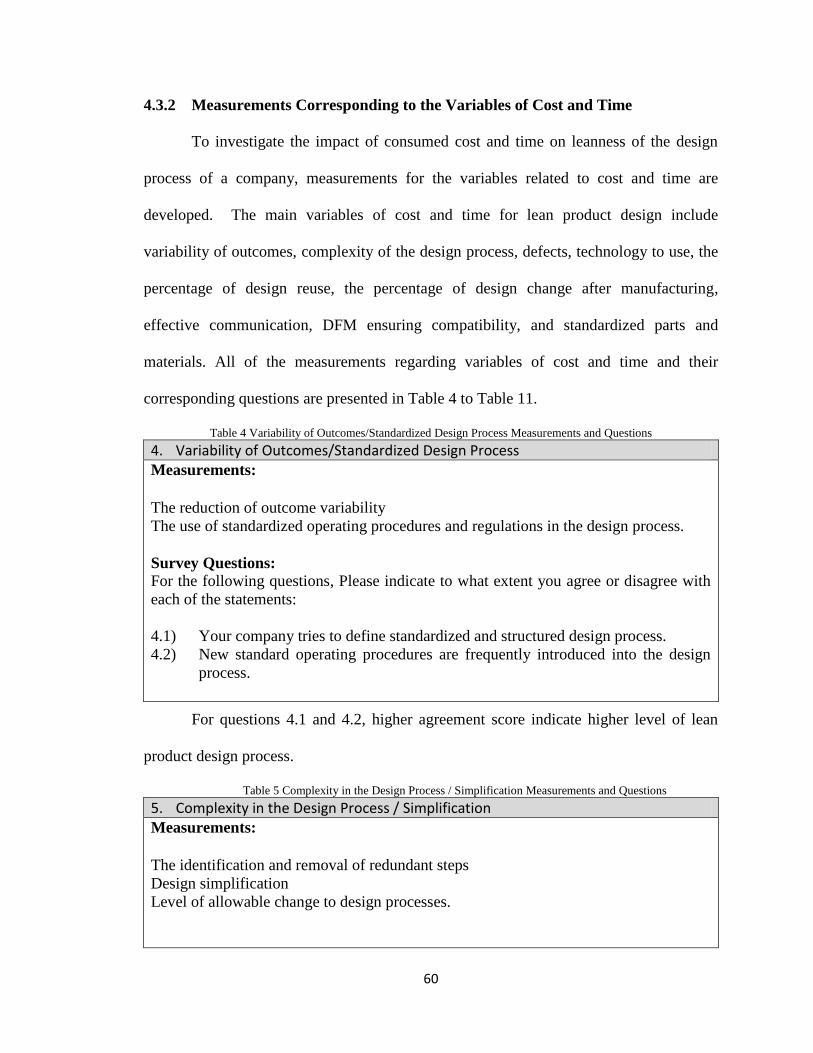
60
4.3.2 Measurements Corresponding to the Variables of Cost and Time
To investigate the impact of consumed cost and time on leanness of the design
process of a company, measurements for the variables related to cost and time are
developed. The main variables of cost and time for lean product design include
variability of outcomes, complexity of the design process, defects, technology to use, the
percentage of design reuse, the percentage of design change after manufacturing,
effective communication, DFM ensuring compatibility, and standardized parts and
materials. All of the measurements regarding variables of cost and time and their
corresponding questions are presented in Table 4 to Table 11.
Table 4 Variability of Outcomes/Standardized Design Process Measurements and Questions
4. Variability of Outcomes/Standardized Design Process Measurements:
The reduction of outcome variability
The use of standardized operating procedures and regulations in the design process.
Survey Questions:
For the following questions, Please indicate to what extent you agree or disagree with
each of the statements:
4.1) Your company tries to define standardized and structured design process.
4.2) New standard operating procedures are frequently introduced into the design
process.
For questions 4.1 and 4.2, higher agreement score indicate higher level of lean
product design process.
Table 5 Complexity in the Design Process / Simplification Measurements and Questions
5. Complexity in the Design Process / Simplification Measurements:
The identification and removal of redundant steps
Design simplification Level of allowable change to design processes.
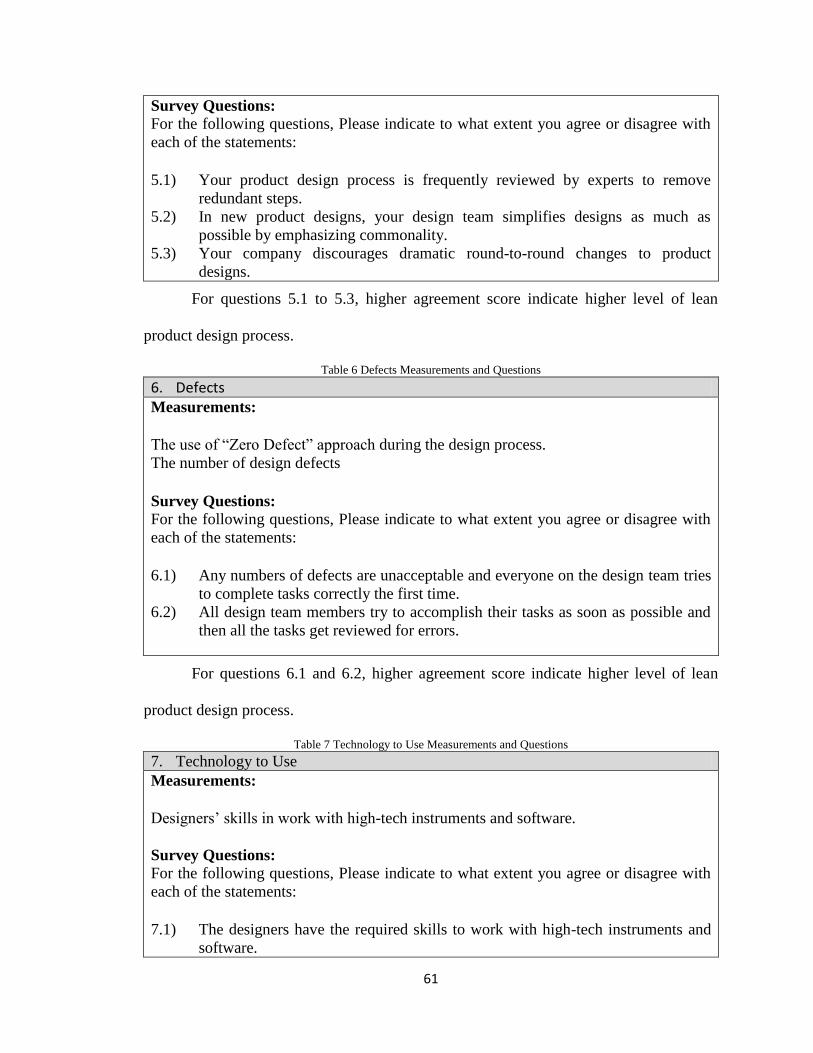
61
Survey Questions:
For the following questions, Please indicate to what extent you agree or disagree with
each of the statements:
5.1) Your product design process is frequently reviewed by experts to remove
redundant steps.
5.2) In new product designs, your design team simplifies designs as much as
possible by emphasizing commonality.
5.3) Your company discourages dramatic round-to-round changes to product
designs.
For questions 5.1 to 5.3, higher agreement score indicate higher level of lean
product design process.
Table 6 Defects Measurements and Questions
6. Defects Measurements:
The use of “Zero Defect” approach during the design process.
The number of design defects Survey Questions:
For the following questions, Please indicate to what extent you agree or disagree with
each of the statements:
6.1) Any numbers of defects are unacceptable and everyone on the design team tries
to complete tasks correctly the first time. 6.2) All design team members try to accomplish their tasks as soon as possible and
then all the tasks get reviewed for errors.
For questions 6.1 and 6.2, higher agreement score indicate higher level of lean
product design process.
Table 7 Technology to Use Measurements and Questions
7. Technology to Use
Measurements:
Designers’ skills in work with high-tech instruments and software.
Survey Questions:
For the following questions, Please indicate to what extent you agree or disagree with
each of the statements:
7.1) The designers have the required skills to work with high-tech instruments and
software.
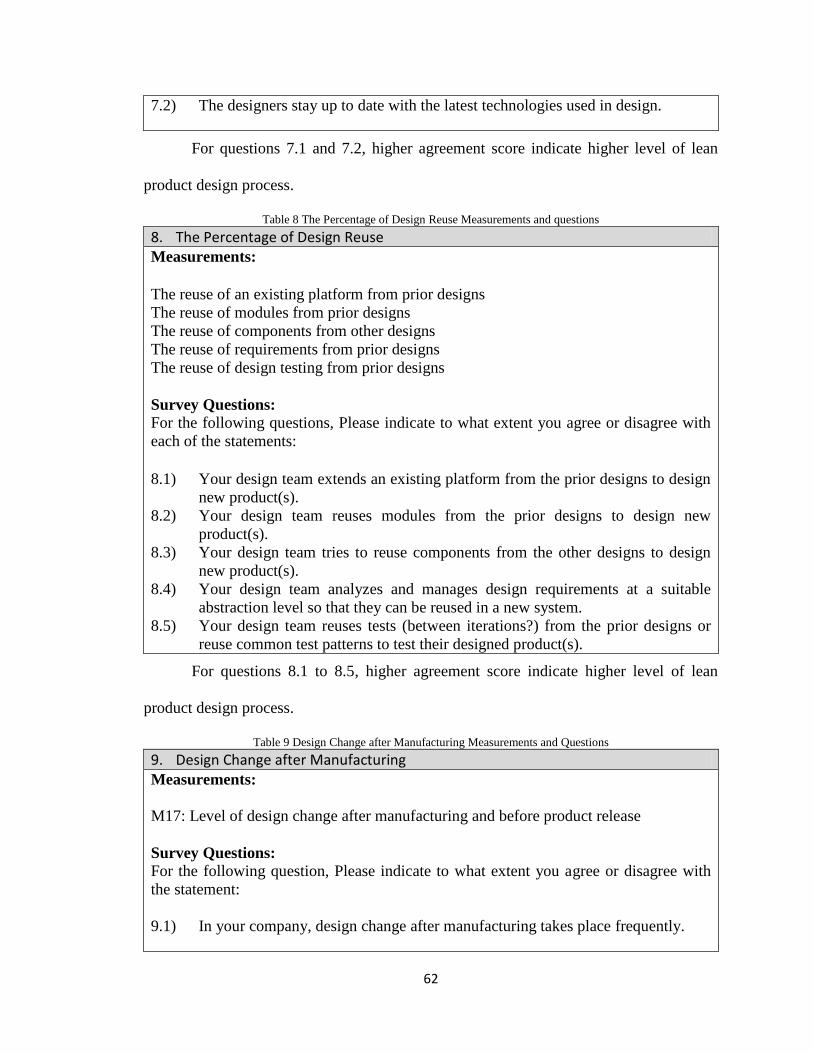
62
7.2) The designers stay up to date with the latest technologies used in design.
For questions 7.1 and 7.2, higher agreement score indicate higher level of lean
product design process.
Table 8 The Percentage of Design Reuse Measurements and questions
8. The Percentage of Design Reuse Measurements:
The reuse of an existing platform from prior designs
The reuse of modules from prior designs
The reuse of components from other designs
The reuse of requirements from prior designs
The reuse of design testing from prior designs
Survey Questions:
For the following questions, Please indicate to what extent you agree or disagree with
each of the statements:
8.1) Your design team extends an existing platform from the prior designs to design
new product(s).
8.2) Your design team reuses modules from the prior designs to design new
product(s).
8.3) Your design team tries to reuse components from the other designs to design
new product(s).
8.4) Your design team analyzes and manages design requirements at a suitable
abstraction level so that they can be reused in a new system.
8.5) Your design team reuses tests (between iterations?) from the prior designs or
reuse common test patterns to test their designed product(s).
For questions 8.1 to 8.5, higher agreement score indicate higher level of lean
product design process.
Table 9 Design Change after Manufacturing Measurements and Questions
9. Design Change after Manufacturing Measurements:
M17: Level of design change after manufacturing and before product release
Survey Questions:
For the following question, Please indicate to what extent you agree or disagree with
the statement:
9.1) In your company, design change after manufacturing takes place frequently.
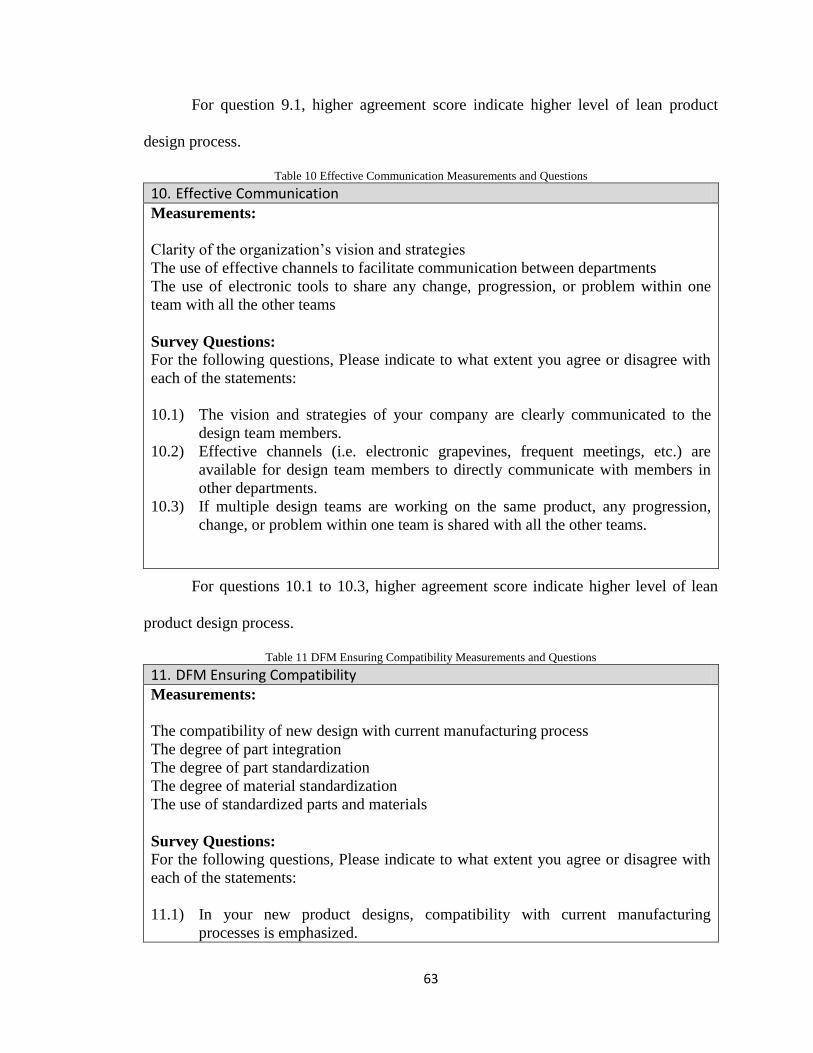
63
For question 9.1, higher agreement score indicate higher level of lean product
design process.
Table 10 Effective Communication Measurements and Questions
10. Effective Communication Measurements:
Clarity of the organization’s vision and strategies
The use of effective channels to facilitate communication between departments
The use of electronic tools to share any change, progression, or problem within one
team with all the other teams
Survey Questions:
For the following questions, Please indicate to what extent you agree or disagree with
each of the statements:
10.1) The vision and strategies of your company are clearly communicated to the
design team members.
10.2) Effective channels (i.e. electronic grapevines, frequent meetings, etc.) are
available for design team members to directly communicate with members in
other departments.
10.3) If multiple design teams are working on the same product, any progression,
change, or problem within one team is shared with all the other teams.
For questions 10.1 to 10.3, higher agreement score indicate higher level of lean
product design process.
Table 11 DFM Ensuring Compatibility Measurements and Questions
11. DFM Ensuring Compatibility Measurements:
The compatibility of new design with current manufacturing process
The degree of part integration
The degree of part standardization
The degree of material standardization
The use of standardized parts and materials
Survey Questions:
For the following questions, Please indicate to what extent you agree or disagree with
each of the statements:
11.1) In your new product designs, compatibility with current manufacturing
processes is emphasized.
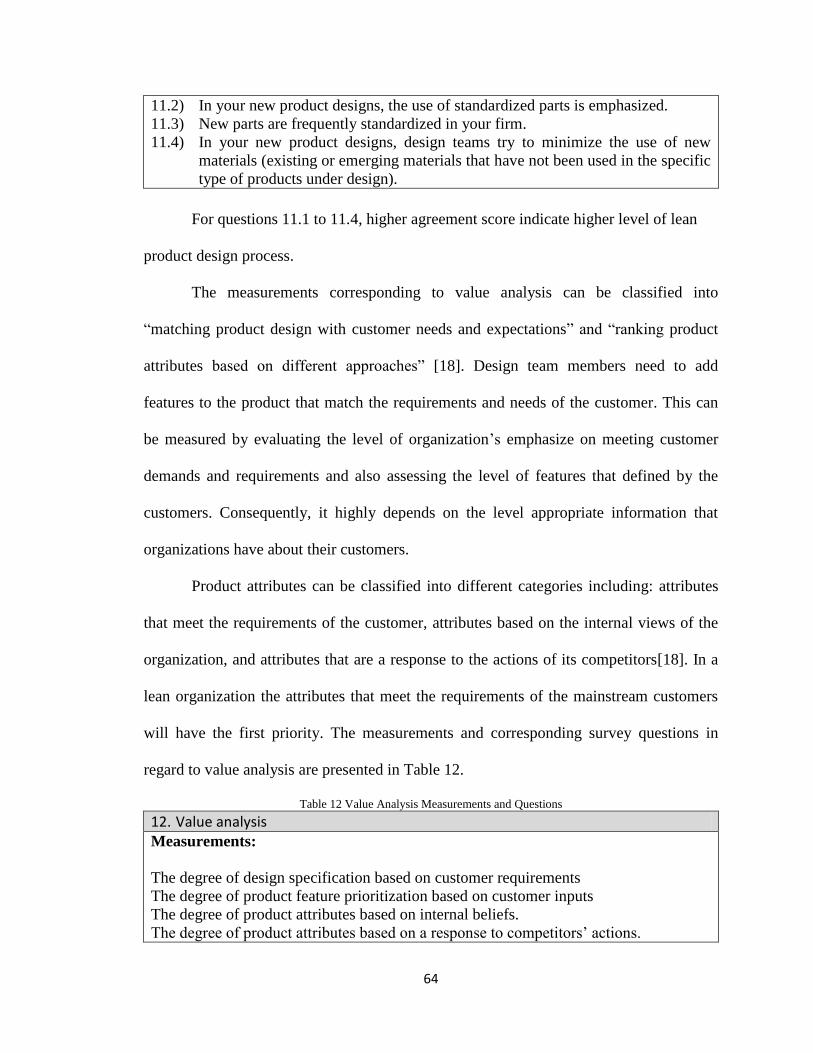
64
11.2) In your new product designs, the use of standardized parts is emphasized.
11.3) New parts are frequently standardized in your firm.
11.4) In your new product designs, design teams try to minimize the use of new
materials (existing or emerging materials that have not been used in the specific
type of products under design).
For questions 11.1 to 11.4, higher agreement score indicate higher level of lean
product design process.
The measurements corresponding to value analysis can be classified into
“matching product design with customer needs and expectations” and “ranking product
attributes based on different approaches” [18]. Design team members need to add
features to the product that match the requirements and needs of the customer. This can
be measured by evaluating the level of organization’s emphasize on meeting customer
demands and requirements and also assessing the level of features that defined by the
customers. Consequently, it highly depends on the level appropriate information that
organizations have about their customers.
Product attributes can be classified into different categories including: attributes
that meet the requirements of the customer, attributes based on the internal views of the
organization, and attributes that are a response to the actions of its competitors[18]. In a
lean organization the attributes that meet the requirements of the mainstream customers
will have the first priority. The measurements and corresponding survey questions in
regard to value analysis are presented in Table 12.
Table 12 Value Analysis Measurements and Questions
12. Value analysis Measurements:
The degree of design specification based on customer requirements
The degree of product feature prioritization based on customer inputs
The degree of product attributes based on internal beliefs.
The degree of product attributes based on a response to competitors’ actions.
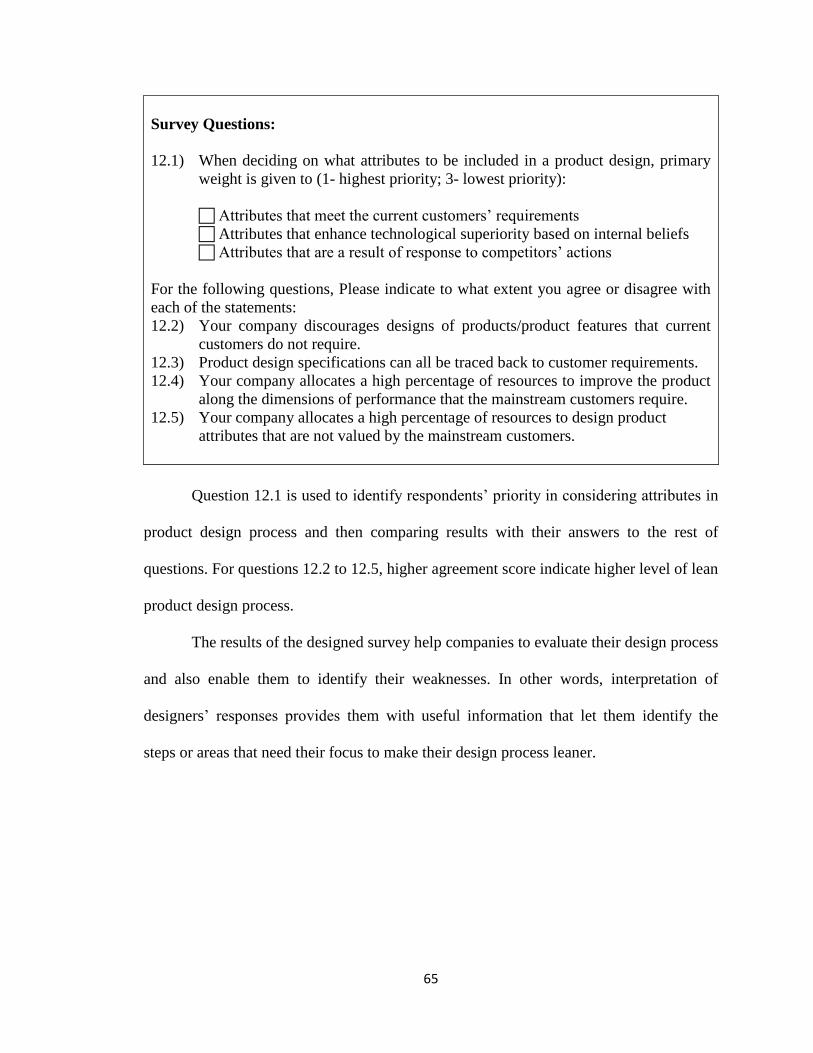
65
Survey Questions:
12.1) When deciding on what attributes to be included in a product design, primary
weight is given to (1- highest priority; 3- lowest priority):
Attributes that meet the current customers’ requirements
Attributes that enhance technological superiority based on internal beliefs
Attributes that are a result of response to competitors’ actions
For the following questions, Please indicate to what extent you agree or disagree with
each of the statements:
12.2) Your company discourages designs of products/product features that current
customers do not require.
12.3) Product design specifications can all be traced back to customer requirements.
12.4) Your company allocates a high percentage of resources to improve the product
along the dimensions of performance that the mainstream customers require.
12.5) Your company allocates a high percentage of resources to design product
attributes that are not valued by the mainstream customers.
Question 12.1 is used to identify respondents’ priority in considering attributes in
product design process and then comparing results with their answers to the rest of
questions. For questions 12.2 to 12.5, higher agreement score indicate higher level of lean
product design process.
The results of the designed survey help companies to evaluate their design process
and also enable them to identify their weaknesses. In other words, interpretation of
designers’ responses provides them with useful information that let them identify the
steps or areas that need their focus to make their design process leaner.
66
CHAPTER 5
CONCLUSION
In this thesis, a lean product design measurement matrix is developed based on a
comprehensive review of literature in lean product design. Different measurable factors
that provide organizations a consensus, comprehensive, and more detailed definition of
lean product design and also enable organizations to evaluate their product design process
performance were identified and discussed. Also, the importance of attaining enough
information from reliable sources was discussed. Even though all the lean thinking
practices have the same core concept, there are widespread differences in the execution of
each of them. Consequently, I tried to identify the different steps and tasks in a new
product development process, specifically the design process. Then with sufficient
knowledge about the process, a lean product design measurement matrix was presented.
One of the limitations of this study is that the developed measurement matrix has
not been tested by practicing design engineers and lean management teams. Future study
includes in-depth investigations to test the validity and accuracy of the developed matrix
in this study. The effectiveness of the suggested matrix will be examined in different
industries. A nationwide survey can be conducted to ask design engineers if the suggested
solutions are useful or not. Based on the new information, supplementary suggestions to
make the current results more effective and applicable can be developed.
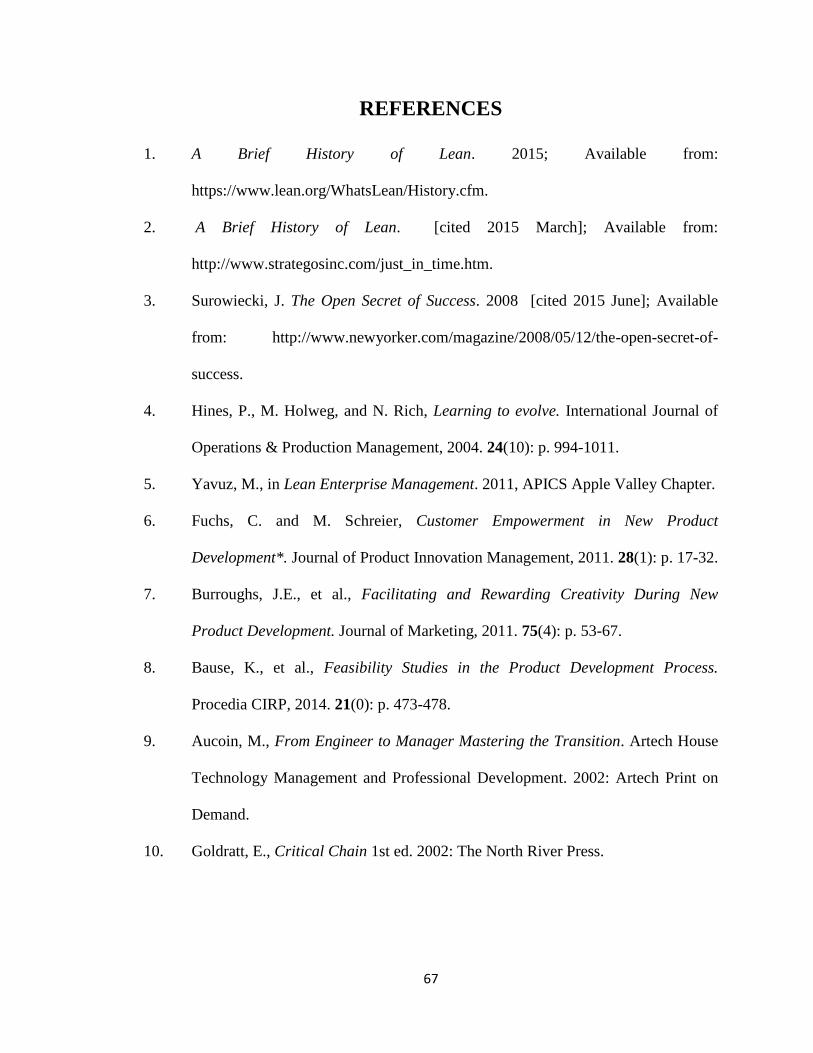
67
REFERENCES
1. A Brief History of Lean. 2015; Available from:
https://www.lean.org/WhatsLean/History.cfm.
2. A Brief History of Lean. [cited 2015 March]; Available from:
http://www.strategosinc.com/just_in_time.htm.
3. Surowiecki, J. The Open Secret of Success. 2008 [cited 2015 June]; Available
from: http://www.newyorker.com/magazine/2008/05/12/the-open-secret-of-
success.
4. Hines, P., M. Holweg, and N. Rich, Learning to evolve. International Journal of
Operations & Production Management, 2004. 24(10): p. 994-1011.
5. Yavuz, M., in Lean Enterprise Management. 2011, APICS Apple Valley Chapter.
6. Fuchs, C. and M. Schreier, Customer Empowerment in New Product
Development*. Journal of Product Innovation Management, 2011. 28(1): p. 17-32.
7. Burroughs, J.E., et al., Facilitating and Rewarding Creativity During New
Product Development. Journal of Marketing, 2011. 75(4): p. 53-67.
8. Bause, K., et al., Feasibility Studies in the Product Development Process.
Procedia CIRP, 2014. 21(0): p. 473-478.
9. Aucoin, M., From Engineer to Manager Mastering the Transition. Artech House
Technology Management and Professional Development. 2002: Artech Print on
Demand.
10. Goldratt, E., Critical Chain 1st ed. 2002: The North River Press.
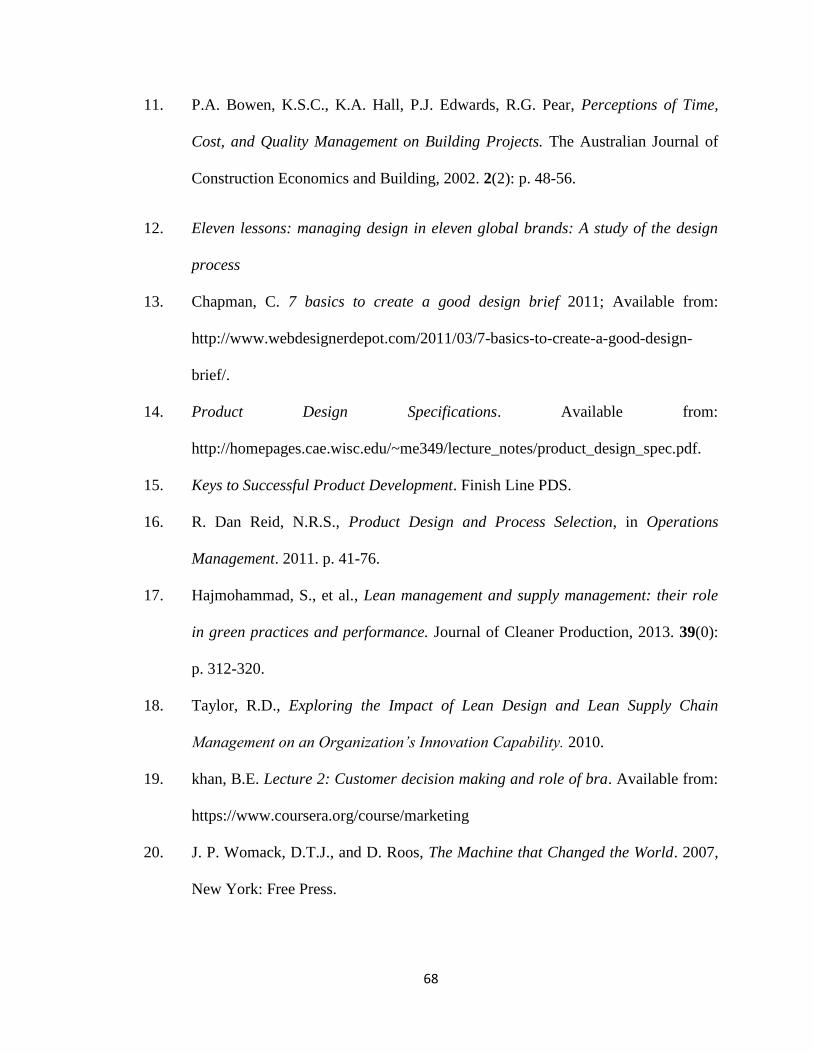
68
11. P.A. Bowen, K.S.C., K.A. Hall, P.J. Edwards, R.G. Pear, Perceptions of Time,
Cost, and Quality Management on Building Projects. The Australian Journal of
Construction Economics and Building, 2002. 2(2): p. 48-56.
12. Eleven lessons: managing design in eleven global brands: A study of the design
process
13. Chapman, C. 7 basics to create a good design brief 2011; Available from:
http://www.webdesignerdepot.com/2011/03/7-basics-to-create-a-good-design-
brief/.
14. Product Design Specifications. Available from:
http://homepages.cae.wisc.edu/~me349/lecture_notes/product_design_spec.pdf.
15. Keys to Successful Product Development. Finish Line PDS.
16. R. Dan Reid, N.R.S., Product Design and Process Selection, in Operations
Management. 2011. p. 41-76.
17. Hajmohammad, S., et al., Lean management and supply management: their role
in green practices and performance. Journal of Cleaner Production, 2013. 39(0):
p. 312-320.
18. Taylor, R.D., Exploring the Impact of Lean Design and Lean Supply Chain
Management on an Organization’s Innovation Capability. 2010.
19. khan, B.E. Lecture 2: Customer decision making and role of bra. Available from:
https://www.coursera.org/course/marketing
20. J. P. Womack, D.T.J., and D. Roos, The Machine that Changed the World. 2007,
New York: Free Press.
69
21. Domingo, R.T., Identifying and Eliminating The Seven Wastes or Muda. Asian
Institute of management.
22. Mascitelli, R., The Lean Product Development Guidebook: Everything Your
Design Team Needs to Improve Efficiency and Slash Time to Market. 1st ed.
2007: Technology Perspectives.
23. Montgomery, D.C., Introduction to Statistical Quality Control. 2005, Hoboken:
John Wiley & Sons, Inc.
24. Brands, R., Robert's Rules of Innovation: A 10-Step Program for Corporate
Survival. 1st ed. 2010: Wiley.
25. Meybodi, M.Z., The links between lean manufacturing practices and concurrent
engineering method of new product development. Benchmarking: An
International Journal, 2013. 20(3): p. 362-376.
26. Artmann, C.P., The value of information updating in new product development.
2009, Originally presented as the author's Thesis (Ph. D.)--WHU, Otto-Beisheim
School of Management, Vallendar, Germany.
27. Kusar, J.D., J ; Grum, J ; Starbek, M, How to reduce new product development
time. Robotics And Computer-integrated Manufacturing, 2004. 20(1): p. 1-15.
28. Barczak, G. and K.B. Kahn, Identifying new product development best practice.
Business Horizons, 2012. 55(3): p. 293-305.
29. Thomke, S.R., Donald, Six myths of product development: the fallacies that cause
delays, undermine quality, and raise costs. Harvard Business Review, 2012.
90(5).
70
30. R. Calantone, D.B., The role of lean launch execution and launch timing on new
product performance. Journal of the Academy of Marketing Science, 2012. 40(4):
p. 526-538.
31. Endris, K., M.S. Khan, and A.B. Arias. Advanced process planning in lean
product and process development. in Engineering, Technology and Innovation
(ICE), 2012 18th International ICE Conference on. 2012.
32. M. H. El. Reifi, S.E., Perceptions of lean design management. Architectural
Engineering and Design Management, 2013. 9(3): p. 195-208.
33. Emmitt, S., Lean Design Management. Architectueral Engineering and Design
Management, 2011. 7: p. 67-69.
34. Javier Freire, L.F.A.n., Achieving Lean Design Process: Improvement
Methodology. Journal of Construction Engineering and Management, 2002.
128(3).
35. A. Bagley, E.L., G. Ballard, Why aren't we all lean? Public Money and
Management. Lean Construction Journal, 2000. 28: p. 10-11.
36. H. C. Martínez León, J.A.F., Lean Product Development Research: Current State
and Future Directions. Engineering Management Journal, 2011. 23(1).
37. Hongyi, C. and R.D. Taylor. The impact of lean design practices on an
organization's radical innovation capability: An empirical study. in Technology
Management for Emerging Technologies (PICMET), 2012 Proceedings of
PICMET '12:. 2012.
71
38. Deshpande, A., et al., Lean Techniques in the Management of the Design of an
Industrial Project. Journal of management in engineering, 2012. 28(2): p. 221-
223.
39. Flores, M., et al., Identifying Lean Thinking Measurement Needs and Trends in
Product Development: Evidence from the Life Sciences Sector in Switzerland, in
New world situation: new directions in concurrent engineering, J. Pokojski, S.
Fukuda, and J. Salwiński, Editors. 2010, Springer London. p. 357-365.
40. Hugh McManus, A.H., earll murman, Lean Engineering: Doing the Right Thing
Right, in 1st International Conference on Innovation and Integration in
Aerospace Sciences. 2005, CEIAT: Queen's university Belfast. p. 10.
41. JamesEoin, R. and R. MichaelPhilipp, Applying the Core Elements of a Lean
Enterprise to Product Development, in New world situation: new directions in
concurrent engineering, J. Pokojski, S. Fukuda, and J. Salwiński, Editors. 2010,
Springer London. p. 367-375.
42. H. Bayer, K.H., Making customer-centered design work for teams.
Communications of ACM, 1993. 36(10).
43. Cooper, R.G., Voice-of-customer methods. Marketing management, 2010. 19(4):
p. 38-43.
44. Haque, B. and M.J. Moore, Measures of performance for lean product
introduction in the aerospace industry. Proceedings of the Institution of
Mechanical Engineers, Part B: Journal of Engineering Manufacture, 2004.
218(10): p. 1387-1398.
72
45. Chrysi Rapanta, e.a., Team design communication patterns in e-learning design
and development Educational technology research and development 2013. 61(4).
46. C. Van Den Bulte, R.K.M., The effects of R&D teams co-location on
communication pattern among R&D, Marketing, and manufacturing management
science, 1998. 44(11).
47. Lai-Kow Chan, M.-L.W., Quality function deployment: A literature review.
European Journal of Operational Research, 2002. 143(3): p. 463-497.
48. N. Gautam, N.S., Lean Product Development: Maximizing the Customer
Perceived Value Through Design Change. International journal of production
economics, 2008. 114(1): p. 313-332.
49. Oppenheim, B.W., Lean Product Development Flow. Systems engineering, 2004.
7(4): p. no-no.
50. Haque, B. and M.J. Moore, Characteristics of lean product introduction.
International Journal of Automotive Technology and Management, 2002. 2(3): p.
378-401.
51. Machado, V.H. and A. Pereira. Modelling Lean Performance. in Management of
innovation and technology, 2008. ICMIT 2008. 4th IEEE international conference
on. 2008.
52. Kennedy, M.N. and L. Kren, The Toyota product development system. Machine
Design, 2004. 76(9): p. 152-152.
53. Dombrowski, U. and T. Zahn. Design of a Lean Development Framework. in
Industrial engineering and engineering management (IEEM), 2011 IEEE
international conference on. 2011.
73
54. Chase, J., Measuring Value in Product Development. 2000-2003, Massachusetts
Institute of Technology: Boston, MA.
55. Ebert, C., P. Abrahamsson, and N. Oza, Lean Software Development. Software,
IEEE, 2012. 29(5): p. 22-25.
56. Haque, B. and M. James-moore, Applying lean thinking to new product
introduction. Journal of Engineering Design, 2004. 15(1): p. 1-31.
57. Rossi, M., M. Taisch, and S. Terzi. Lean Product Development: A Five-steps
Methodology for Continuous Improvement. in Engineering, technology and
innovation (ICE), 2012 18th international ICE conference on. 2012.
58. Mehri, D., The Darker Side of Lean: An Insider's Perspective on the Realities of
the Toyota Production System. The Academy of Management Perspectives, 2006.
20(2): p. 21-42.
59. N. Gautam, e.a., Design reuse framework: a perspective for lean development.
International Journal of Product Development, 2007. 4(5): p. 485-507.
60. Ballard, G., Psitive vs Negative Iteration in Design. Lean Construction Institute:
Oaklan, CA. p. 8.
61. Pessôa, M., G. Loureiro, and J. Alves, An Approach to Lean Product
Development Planning, in Complex systems concurrent engineering, G. Loureiro
and R. Curran, Editors. 2007, Springer London. p. 229-237.
62. Gudem, M. and T. Welo, From Lean Product Development to Lean Innovation:
Finding Better Ways of Satisfying Customer Value, in New world situation: new
directions in concurrent engineering, J. Pokojski, S. Fukuda, and J. Salwiński,
Editors. 2010, Springer London. p. 347-355.
74
63. Baines, T., et al., State-of-the-art in lean design engineering: A literature review
on white collar lean. Proceedings of the Institution of Mechanical Engineers, Part
B: Journal of Engineering Manufacture, 2006. 220(9): p. 1539-1547.
64. Lind, M., The Pursuit of Lean in Design. Engineering designer, 2006. 32(7): p.
22-5.
65. Whitlock, J., The value of active followership. . Art & Science, 2013. 20(2): p. 20-
23.
66. J. Stempfle, e.a., Thinking in design teams - an analysis of team communication.
Design Studies, 2002. 23(5): p. 473-496.
67. Youssef, M.A., Design for manufacturability and time-to-market. International
Journal of Operations & Production Management, 1994. 14: p. 6-21.
68. S. Mazumdar, Composite Manufacturing: Materials, Product, and Process
Engineering. . 2000, Boca Raton: CRC Press LLC.
69. C. Chen, M.C., Integrating the Kano model into a robust design approach to
enhance customer satisfaction with product design. International Journal of
Production Economics, 2008. 114(2): p. 667-681.
75
Appendix A:
DESIGNED SURVEY QUESTIONS CORRESPONDING TO
MEASURMENT FACTORS
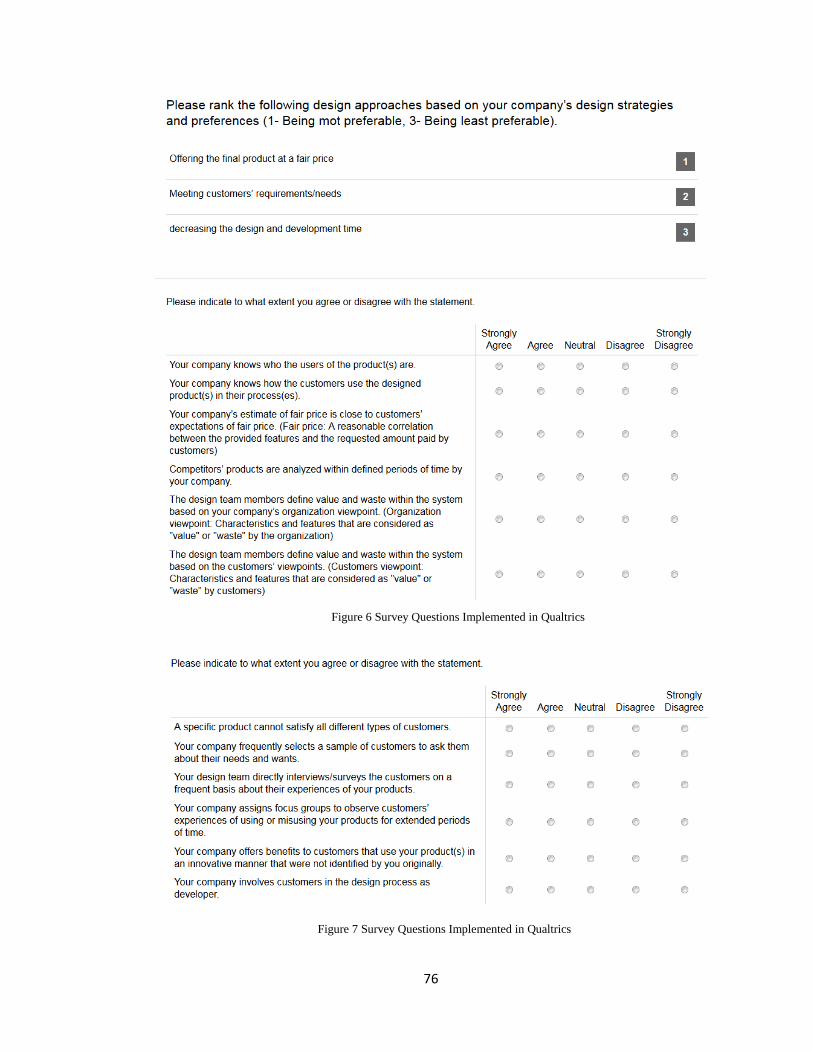
76
Figure 6 Survey Questions Implemented in Qualtrics
Figure 7 Survey Questions Implemented in Qualtrics
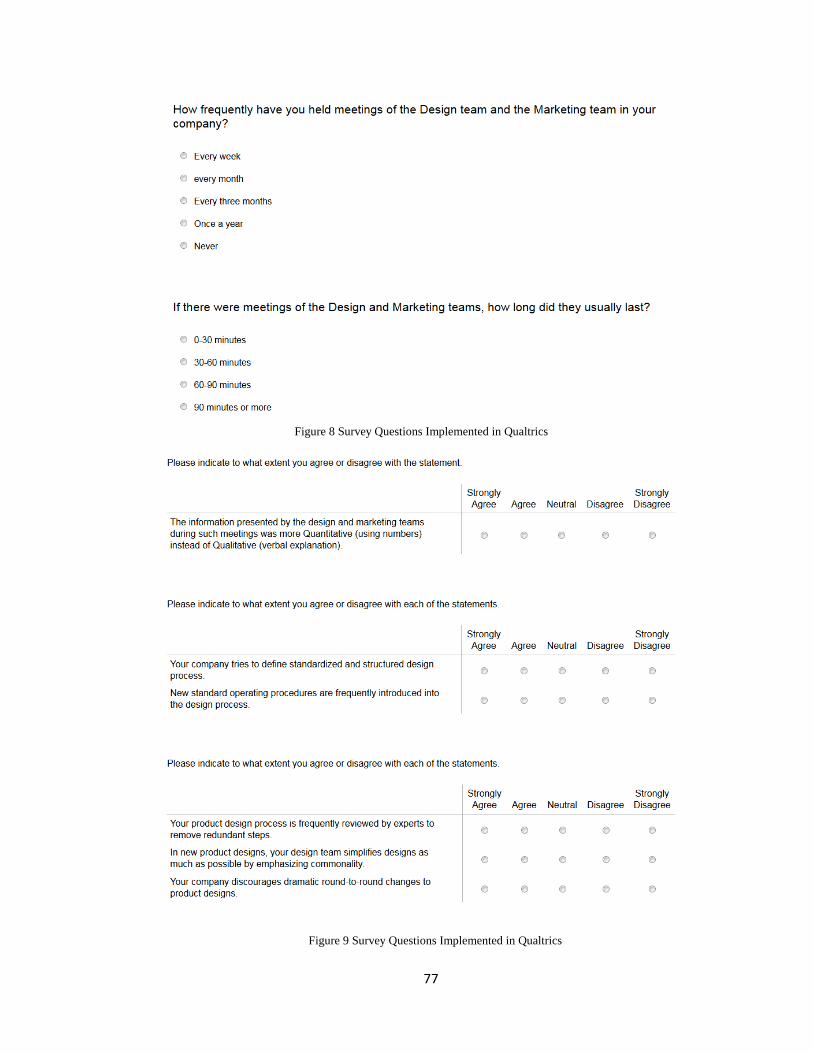
77
Figure 8 Survey Questions Implemented in Qualtrics
Figure 9 Survey Questions Implemented in Qualtrics
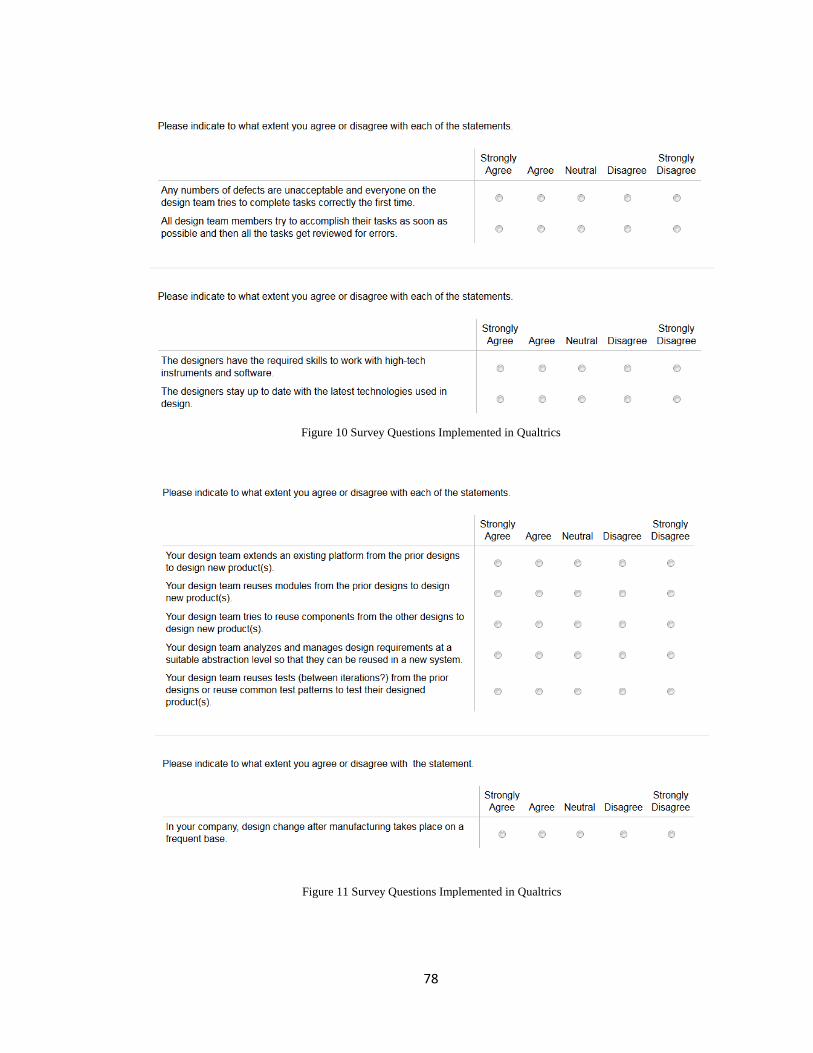
78
Figure 10 Survey Questions Implemented in Qualtrics
Figure 11 Survey Questions Implemented in Qualtrics
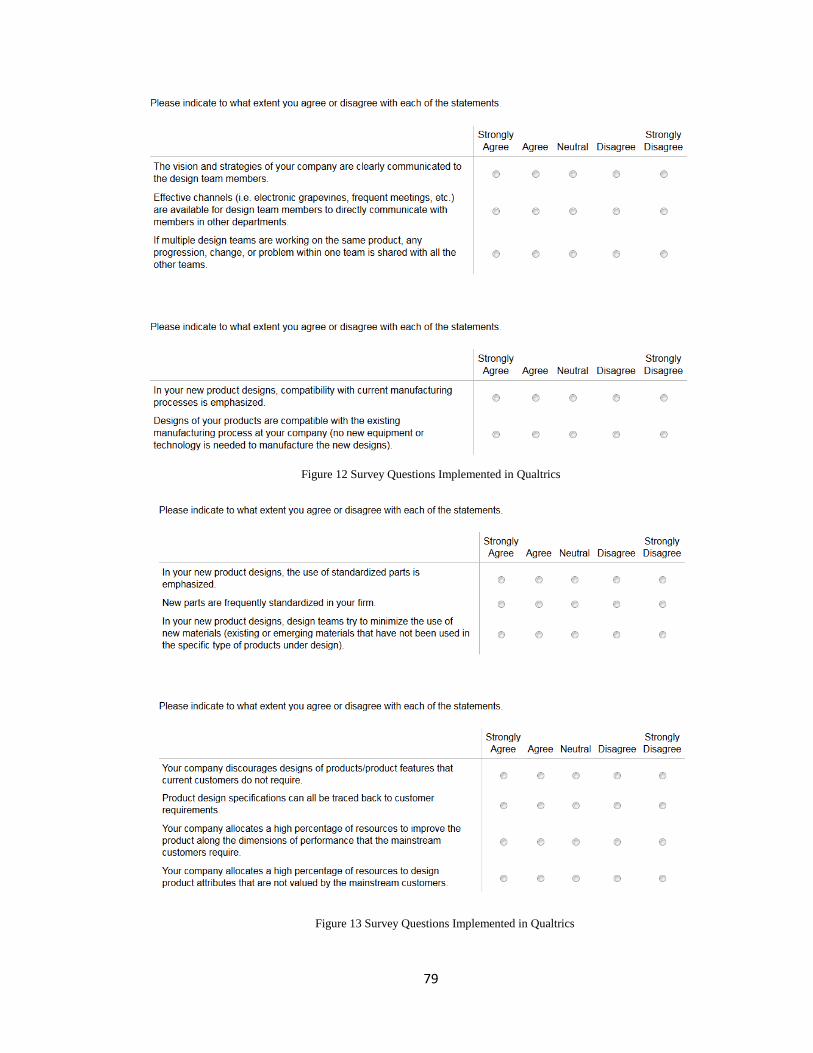
79
Figure 13 Survey Questions Implemented in Qualtrics
Figure 12 Survey Questions Implemented in Qualtrics
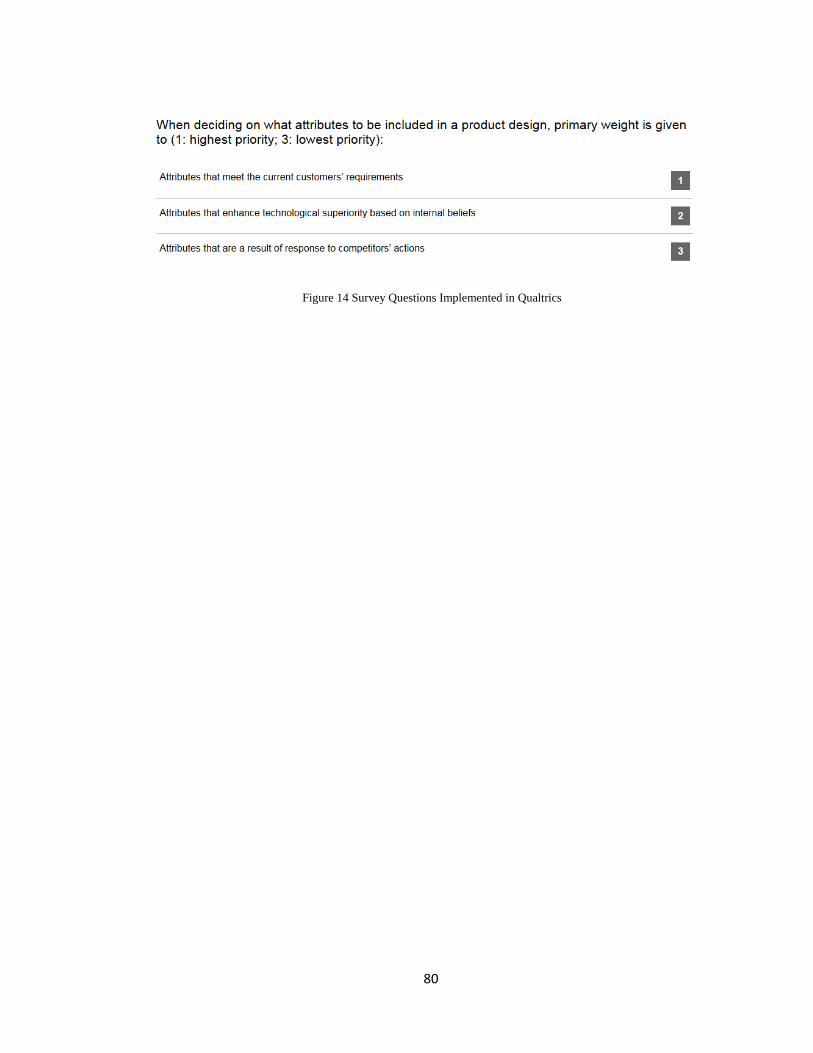
80
Figure 14 Survey Questions Implemented in Qualtrics