Embed Size (px)
Citation preview

Development of a designperformance measurement
matrix for improvingcollaborative design during a
design processYuanyuan Yin
Winchester School of Art, University of Southampton, UK, and
Shengfeng Qin and Ray HollandSchool of Engineering and Design, Brunel University, UK
Abstract
Purpose – The purpose of this paper is to investigate how to measure collaborative designperformance and, in turn, improve the final design output during a design process, with a clearobjective to develop a design performance measurement (DPM) matrix to measure design project teammembers’ design collaboration performances.
Design/methodology/approach – The methodology adopted in this research uses criticalliterature reviews, in-depth focus group interviews and a questionnaire survey.
Findings – The main finding of this study is a DPM matrix that addresses five DPM indicators:efficiency, effectiveness, collaboration, management skill, and innovation, and 25 detailed DPMcriteria. It was found that decision-making efficiency is the most important DPM criterion forcollaborative design efficiency; plus delivering to the brief for effectiveness; clear team goal/objectivesfor collaboration; decision-making ability for management skill; and competitive advantage forinnovation.
Research limitations/implications – As the present study was focused on exploring DPM duringa design process, some key DPM criteria which are not measurable during a design developmentprocess were not included in this study. The proposed multi-feedback approach for DPM matriximplementation needs to be validated in future research.
Practical implications – The DPM matrix can be applied to support a design manager inmeasuring and improving collaborative design performance during a design process, by reviewingand modifying collaborative design development, identifying the design team strengths andweaknesses, improving team communication, and suggesting suitable responsive actions.
Originality/value – The major contribution of this study is the investigation and development of aDPM matrix to measure collaborative design performance during a design process.
Keywords Design, Performance measures, Design management
Paper type Research paper
1. IntroductionDesign has been recognized as one of the critical factors for business success. Itcontributes to promoting a business by improving customer interface with the product,enhancing product functionality, and increasing product quality (Hertenstein et al.,2005). Design is a complex process which always involves many participants from
The current issue and full text archive of this journal is available at
www.emeraldinsight.com/1741-0401.htm
IJPPM60,2
152
Received September 2009Revised January 2010,March 2010Accepted March 2010
International Journal of Productivityand Performance ManagementVol. 60 No. 2, 2011pp. 152-184q Emerald Group Publishing Limited1741-0401DOI 10.1108/17410401111101485

different disciplines to work together during the design process (Girard and Robin,2006). Therefore, design collaboration becomes a crucial element in the design processand has a great effect on the final design performance. Consequently, a great deal ofresearch has paid attention to improving collaborative design performance (Bstieler,2006; Lahti et al., 2004; Qin et al., 2003). However, only a small amount of research hasconcentrated on increasing collaborative design performance by operatingperformance measurement, although it can improve design effectivenesssignificantly (Busseri and Palmer, 2000). Implementing an appropriate performancemeasurement has many advantages, such as motivating people, supportingdecision-making, fostering organisational learning and continuous improvement(Chiesa et al., 2009).
Additionally, performance measurement can be operated to influence project staff’sbehaviour to achieve a positive business outcome (Neely et al., 2005). Thus, manycompanies have spent considerable time and resources redesigning and implementingperformance measurement to reflect their current environment and strategiespositively (Kennerley and Neely, 2003). Such a positive influence will be especiallyuseful in the collaborative design process.
In relevant design performance measurement (DPM) research fields, many studiesfocused on exploring key factors of success and failure of new product development(NPD), such as market share, investment return rate, and customer feedback (Hart et al.,2003; Loch et al., 1996; Hultink and Robben, 1995). However, little research hasspecifically concentrated on collaborative design, especially from a design processperspective. As design process is a wide ranging research field, covering marketing,design specification, conceptual and detailed design, manufacturing, sales and aftersale services and disposal, etc., the existing DPM indicators are developed based oninformation crossing a product development lifecycle. However, when we focus on adesign process at either the conceptual or detailed design stage, the available DPMinformation is limited. Therefore, existing DPM indicators are not suitable formeasuring collaborative design during a design process. For example, some existingDPM criteria are difficult to apply during a design process because they are highlydependant on products’ after-launch information, such as market share, investmentretune rate, and customers’ feedback. Thus, it is still a challenge to measure andimprove collaborative design during a design process based only on informationtypically available at design stages (TSB, 2009).
Therefore, our research aims to investigate how to measure collaborative designperformance and in turn to improve the final design output during a design process,with a clear objective to develop a DPM matrix to measure design project teammembers’ design performance. A design matrix has been selected as the format of thefinal research result due mainly to two reasons. First, different tools have beendeveloped from existing DPM research such as New product development (NPD)success factors (Kusar et al., 2004; Salter and Torbett, 2003; Montoya-Weiss andCalantone, 1994), guidelines for performance measurement system design (Folan andBrowne, 2005; Neely et al., 1997) and modelling of design development performance(O’Donnell and Duffy, 2002). Compared with these types of research results, a DPMmatrix can provide a compact representation of collaborative design indicators,showing detailed DPM criteria for measuring collaborative design performance andassociated value among the criteria tabulated in a row-column format (Sharif and
Designperformance
measurement
153
Kayis, 2007). Furthermore, NPD success factors, guidelines or frameworks approachesgenerally focus on providing practical recommendations for a certain phenomenon in asingle dimension. However, because of the dynamic features of collaborative design, aperformance measure tool is required that can be applied in various situations during adesign process (Feltham and Xie, 1994). Further, the typical format of a matrix is astructured analysis within two or more dimensions which can produce more decisionsupports to users for diverse circumstances, increase efficiency of DPM operation, andprovide better maintenance of the DPM during a design process (Chen et al., 2002).Therefore, a DPM matrix has been selected as the format of the final research results.
There are two research questions in this study:
(1) What are key DPM indicators which can be used to demonstrate and measurecollaborative design performance?
(2) What detailed criteria can be used for measuring each of the collaborativedesign indicators during a design process?
To answer these two research questions, literature review, focus group studies andquestionnaire studies have been conducted to identify key DPM indicators and detailedDPM criteria for measuring collaborative design performance during a design process.As a result, a DPM matrix has been developed with 25 detailed DPM criteria whichaddress five key DPM indicators: efficiency, effectiveness, collaboration, managementskill, and innovation. On the one hand, the matrix can support design managers toimprove collaborative design performance by evaluating design collaboration, learningfrom DPM results, and encouraging design team members to improve themselvesduring the design process. On the other hand, the matrix can also support designers tobetter explore their strength and weakness, and, in turn, improve design collaborationby conducting self-development. It is thus offered as a measurement and motivatingtool to support collaborative design at a design stage.
This paper is structured as follows. Section 2 presents related work of collaborativedesign and design performance measurement research. Section 3 illustrates the overallresearch methodology. In sections 4 and 5, the development process and results of theDPM matrix are described. Finally, the conclusion is drawn.
2. Related workDesign has been regarded essentially as an application of human creativity to apurpose of creating products, services, buildings, organisations and environmentswhich meet people’s needs (Moultrie et al., 2006a; Bruce and Bessant, 2002). Thecomplex process of integrated product design and development involves manyparticipants from different disciplines and requires team members with variousaspects of knowledge and experience to work together (adapted from Girard andRobin, 2006). Due to the complexity feature, collaborative design has been regarded asa key factor for the success of NPD and business performance (Chu et al., 2006).Collaborative design is considered as a process in which design team members activelycommunicate and work together in order to jointly establish design goals, searchthrough design problem spaces, determine design constraints, and construct a designsolution (Zha and Du, 2006). Numerous studies have paid attention to improvingcollaborative design from different perspectives in the past two decades. These studiescan be divided into two categories. One is technical-based collaborative design
IJPPM60,2
154
research, which focuses on collaborative design supporting tools, while the other ismanagement-based, which addresses team management and project managementissues (Bstieler, 2006; Zhang et al., 2004; Tay and Roy, 2003; Chen et al., 2002).According to Busseri and Palmer (2000), collaborative design can be improved byconducting performance measurements regularly for the team functions. Theyconcluded that conducting performance measurements through a design process canlead to higher levels of self-rated and observer-rated group effectiveness; higher levelsof self-rated group satisfaction and double the number of positive comments (comparedto negative comments) from team members. In other words, performance measurementactions do help in improving the design team collaboration performance.
With the rapid growth in awareness of design, DPM has attracted more attentionfrom academia since 1990. Most of the DPM research has concentrated on exploringessential indicators for measuring the success of product design, and discoveringdetailed criteria for measuring these indicators, such as actual against planned time fordesign efficiency, delivering to the brief for design effectiveness, sharing informationfor design collaboration, and technology novelty for design innovation (Bart andPujari, 2007; Hull, 2004; O’Donnell and Duffy, 2002; Chiu, 2002; Tatikonda andMontoya-Weisis, 2001; Pawar and Driva, 1999). For instance, design efficiency hasbeen regarded as an important factor of design due to the fact that it can supportcompanies to deliver high quality products and services on time and at a lower costthan that of their competitors (Naveh, 2005). Salomo et al. (2007) highlighted thatinnovation plays a critical role in building competitive advantages and can contributesignificantly to a firm’s growth and profitability. Regarding the detailed DPM criteria,role-taking ability, openness, communication skills, and leadership have beenhighlighted as key criteria for measuring effectiveness in design collaboration(Bstieler, 2006; Bond et al., 2004).
Furthermore, the existing DPM research can be classified into two categories:product-focused and process-focused (Bruce and Bessant, 2002). The formerconcentrates on measuring design performance based on the final product, withmeasurement factors such as aesthetics, novelty, function, integrity, reliability, andlongevity. The latter focuses on measuring design performance derived from thedesign development process with measurement factors, such as time, cost,effectiveness, communication, and fitness for the design purpose. For example,Moultrie et al. (2006b) developed a product-focused design audit tool, which provideddesign checklists regarding novelty, desirability, usability, and producibility, to assessperceptions towards product characteristics, while the others (Maier et al., 2006)developed a process-focused grid-inspired assessment approach to improvecollaborative design communication. More specifically, ten key factors have beenhighlighted and grouped into five categories: organisation, team, product, informationand communication, to build up a communication grid for an assessment of designcommunication (Maier et al., 2008).
Although many DPM indicators and criteria have been established in the NPDcontext, little research has focused on improving collaborative design at a design stage.According to the study from MacBryde and Mendibil (2003), while the existing DPMframeworks enable companies to measure the design performance from both productand process viewpoints, at the grass roots level, they were struggling to find a way ofmanaging their design team collaboration. Therefore, our research on measuring
Designperformance
measurement
155

collaborative design performance during a design process contributes to theimprovement of the design team collaboration.
3. Research methodologyAccording to the aforementioned two research questions, there are two phases in thisstudy:
(1) investigation of collaborative design performance indicators; and
(2) exploration of detailed DPM criteria for measuring these indicators during adesign process.
The following research methods: literature review, focus group and questionnaire,have been carefully selected for this study (Table I).
In phase one, the literature review and focus group have been conducted in asequential process to investigate key indicators of collaborative design performance.Specifically, a literature review was applied to collect possible DPM indicators fromprevious studies. Afterwards, a focus group was implemented to identify the mostcrucial indicators for collaborative design based on results of the literature review. Theliterature review was chosen as a research method due to the fact that it can bettersupport researchers to establish subject background, learn from other research,formulate research problems, synthesise the work of others, and compare with otherresearch strategies (Ridley, 2008). Moreover, the focus group was selected because it isa quick means to obtain rich data from participants’ opinions and deeper insights(Krueger, 2000). In addition, the participants in a focus group are able to build on oneanother’s responses and generate new ideas (Morgan, 1997). Thus, it can provide moreinformation to support the discussion and analysis of collaborative designperformance measurement, and, in turn, identify the most important DPM indicatorsfor it.
Researchprocess Research questions
Researchmethods Objectives
Phase one What indicators can be used torepresent collaborative designperformance?
LiteraturereviewFocus group
To explore possible DPMindicatorsTo discuss and identify theimportant indicators forcollaborative design from thepossible DPM indicators
Phase two What criteria can be used tomeasure each of the identifiedindicators during a design process?
LiteraturereviewFocus group
Questionnaire
To explore possible criteria foreach collaborative design indicatorTo discuss and classify suitablecriteria for each collaborativedesign indicator from the potentialcriteriaTo investigate the most importantcriteria for each collaborativedesign indictor, and to find out howmany criteria should be involved inan effective DPM matrix
Table I.Research methodology
IJPPM60,2
156
In phase two, the literature review and focus group were conducted to explore andclassify detailed criteria for each of the collaborative design indicators resulting fromphase one. Subsequently, a questionnaire study was applied to explore what are themost important DPM criteria for each indicator and how many detailed criteria shouldbe involved to establish an effective DPM matrix. The questionnaire has been selectedas a research instrument because it offers a very flexible way of collecting largevolumes of data from large participant samples (Stanton et al., 2005). Furthermore, ithas been widely used for large-scale investigations and has the potential to collectcognitive and affective data quickly and easily (Easterby-Smith et al., 2002; Kinshuk,1996). In addition, many researchers have indicated that the questionnaire is cheaper toadminister than other methods, and data collection is less time consuming (Stone andCollin, 1984). Due to these advantages, the questionnaire is an appropriate method toexplore participants’ opinions about what are the most important DPM criteria for eachDPM indicator, and the appropriate number of DPM criteria for an effective DPMmatrix. The following sections will describe the research process and results in detail.
4. Investigation of collaborative design performance indicatorsIn phase one, we wanted to discover the collaborative design performance indicators.Two steps were designed in this phase:
(1) exploration of the possible collaborative design indicators; and
(2) identification of the most important indicators for collaborative designperformance measurement.
4.1 Exploration of relevant collaborative design indicatorsIn order to discover what indicators can be used to represent collaborative designperformance, a literature review has been conducted. According to the research aim, wereviewed literature in the new product development (NPD), design performancemeasurement (DPM), and design management (DM) research fields. E-journaldatabases, namely, Emerald and Science-Direct, are used as the major sources for theliterature review.
After conducting a comprehensive review of 82 studies in the relevant researchareas, 13 possible collaborative design indicators were identified from previousresearch as they were strongly highlighted as key factors for NPD, such ascollaboration, cross-functional integration, customer-based indicators, designefficiency, management skill, innovation, and product-level indicators (Table II). Forinstance, some research has demonstrated that better management skills can producepositive influences on NPD outcomes, such as reducing NPD risks and improving teamcollaboration (Cooper and Kleinschmidt, 1995; Bobrow, 1991). Innovation should beregarded an important indicator because it determines whether the product design hasdistinctiveness when compared with other products, whether the product design cansatisfy customers’ requirements and whether the product design can create sustainablecompetitive advantages for the company (Calantone et al., 1995).
These 13 indicators have been highlighted as key elements for successful NPD,concerning the whole product development process: from product specification,marketing research, design, manufacturing, sales, and service. Because our researchfocuses on measuring collaborative design during the design stages, which is part ofthe whole product development process, it is necessary to identify the key indicators
Designperformance
measurement
157

13re
lev
ant
ind
icat
ors
Sou
rces
Ex
amp
les
ofd
etai
led
fact
ors
Col
lab
orat
ion
For
meetal.
(200
7);B
stie
ler
(200
6);G
irar
dan
dR
obin
(200
6);
Bon
det
al.
(200
4);
Ch
iu(2
002)
;B
uss
eri
and
Pal
mer
(200
0)
Ab
ilit
yto
mak
eco
mp
rom
ises
;co
mm
un
icat
ion
qu
alit
y;
info
rmat
ion
shar
ing
Cro
ss-f
un
ctio
nal
inte
gra
tion
Sol
tan
ietal.
(200
6);
Nav
eh(2
005)
;B
ondetal.
(200
4);
Loc
het
al.
(199
6);
Coo
per
and
Kle
insc
hm
idt
(199
5)E
stab
lish
ing
com
mon
lan
gu
age;
fun
ctio
nal
open
nes
s;h
elp
ing
and
coop
erat
ing
wit
hot
her
sC
ult
ure
and
clim
ate
Sm
ith
er(1
998)
;C
oop
eran
dK
lein
sch
mid
t(1
995)
Ab
ilit
yto
trac
km
ark
ettr
end
;aw
aren
ess
ofm
ark
etcl
imat
ech
ang
e;g
ood
un
der
stan
din
gof
bu
sin
ess
cult
ure
Cu
stom
er-b
ased
ind
icat
ors
For
meetal.
(200
7);B
art
and
Pu
jari
(200
7);G
irar
dan
dR
obin
(200
6);
Sol
tan
iet
al.
(200
6);
Nav
eh(2
005)
;B
itit
ci(2
002)
;N
ello
rean
dB
alac
han
dra
(200
1);
Ben
edet
to(1
999)
;L
ochet
al.
(199
6);
Gri
ffin
and
Hau
ser
(199
6)
Cu
stom
erac
cep
tan
ce;
cust
omer
sati
sfac
tion
;p
urc
has
ere
pea
tra
te;
nu
mb
ers
ofcu
stom
ers
Des
ign
dev
elop
men
tp
roce
ssin
dic
ator
sC
oop
er(2
003)
;N
ello
rean
dB
alac
han
dra
(200
1);
Paw
aran
dD
riv
a(1
999)
;Loc
hetal.
(199
6);M
onto
ya-
Wei
ssan
dC
alan
ton
e(1
994)
;G
riffi
nan
dH
ause
r(1
996)
Av
aila
bil
ity
ofra
wm
ater
ials
;d
esig
np
roce
ssp
lan
;d
esig
nm
eth
ods;
env
iron
men
tall
y-
frie
nd
ly
Des
ign
effe
ctiv
enes
sO
’Don
nel
lan
dD
uff
y(2
002)
;Lee
nd
ers
and
Wie
ren
ga
(200
2);H
erte
nst
einetal.
(200
1);S
chm
idtetal.
(200
1);
Nel
lore
and
Bal
ach
and
ra(2
001)
;P
awar
and
Dri
va
(199
9);
Gri
ffin
and
Pag
e(1
993)
;C
amp
ion
and
Med
sker
(199
3);
Wer
ner
and
Sou
der
(199
2)
Ach
iev
ing
des
ign
bri
ef;
mee
td
esig
nq
ual
ity
gu
idel
ines
;n
um
ber
ofd
esig
nre
vie
ws;
un
der
stan
dd
esig
nra
tion
ale
Des
ign
effi
cien
cyH
ull
(200
4);
Ku
saret
al.
(200
4);
Nac
hu
m(1
999)
;B
ened
etto
(199
9);H
ult
ink
and
Rob
ben
(199
5);G
riffi
nan
dH
ause
r(1
996)
Ap
pli
cati
onof
com
pu
ter-
aid
edd
esig
n;
des
ign
dev
elop
men
tti
me;
R&
Def
fici
ency
Fin
anci
alin
dic
ator
sB
art
and
Pu
jari
(200
7);
Bst
iele
r(2
006)
;H
uan
get
al.
(200
3);
Ku
saret
al.
(200
4);
Bry
antet
al.
(200
4);
Her
ten
stei
net
al.
(200
1);
Gri
ffin
and
Hau
ser
(199
6);
Hu
ltin
kan
dR
obb
en(1
995)
;M
onto
ya-
Wei
ssan
dC
alan
ton
e(1
994)
;G
riffi
nan
dP
age
(199
3);
Wer
ner
and
Sou
der
(199
2)
Att
ain
pro
fita
bil
ity
goa
ls;
bre
ak-e
ven
tim
e;in
ves
tmen
tre
turn
rate
;m
eet
mar
ket
shar
eg
oals
(continued
)
Table II.Summary of relevantdesign success indicators
IJPPM60,2
158

13re
lev
ant
ind
icat
ors
Sou
rces
Ex
amp
les
ofd
etai
led
fact
ors
Inn
ovat
ion
Bar
tan
dP
uja
ri(2
007)
;A
leg
reet
al.
(200
6);
Nav
eh(2
005)
;F
ellet
al.
(200
3);
Sal
ter
and
Tor
bet
t(2
003)
;T
atik
ond
aan
dM
onto
ya-
Wei
sis
(200
1);D
ann
eels
and
Kle
insc
hm
idt
(200
1);
Bal
ach
and
raan
dF
riar
(199
7)
New
nes
sto
cust
omer
s,n
ewn
ess
ofte
chn
olog
y;
pro
vid
esa
sust
ain
able
com
pet
itiv
ead
van
tag
e
Man
agem
ent
skil
lS
olta
niet
al.
(200
6);
Mac
Bry
de
and
Men
dib
il(2
003)
;C
oop
er(2
003)
;Loc
han
dT
app
er(2
002)
;Mu
llin
setal.
(199
9)
Bu
ild
ing
hig
hm
oral
ew
ith
inte
am;
con
flic
tm
anag
emen
t;d
ecis
ion
mak
ing
;in
ves
tig
atin
gre
sou
rce
pla
nn
ing
Mar
ket
env
iron
men
tH
ull
(200
4);
Fel
let
al.
(200
3);
Har
tet
al.
(200
3);
Lee
nd
ers
and
Wie
ren
ga
(200
2);
Tat
ikon
da
and
Mon
toy
a-W
eisi
s(2
001)
;H
erte
nst
einet
al.
(200
1);
Dan
nee
lsan
dK
lein
sch
mid
t(2
001)
;N
ello
rean
dB
alac
han
dra
(200
1);
Paw
aran
dD
riv
a(1
999)
;G
riffi
nan
dH
ause
r(1
996)
Lea
din
gto
futu
reop
por
tun
itie
s;m
ark
etfa
mil
iari
ty;
mar
ket
pot
enti
al;
mar
ket
chan
ce
Org
aniz
atio
nal
fact
ors
Nav
eh(2
005)
;Fel
letal.
(200
3);C
hiu
(200
2);L
een
der
san
dW
iere
ng
a(2
002)
;T
atik
ond
aan
dM
onto
ya-
Wei
sis
(200
1);
Mu
llin
set
al.
(199
9);
Mon
toy
a-W
eiss
and
Cal
anto
ne
(199
4);
Gri
ffin
and
Hau
ser
(199
6)
Inte
rnal
des
ign
pol
icy
;in
tern
al/e
xte
rnal
rela
tion
s;or
gan
izat
ion
stru
ctu
re
Pro
du
ct-l
evel
ind
icat
ors
Gir
ard
and
Rob
in(2
006)
;A
leg
reet
al.
(200
6);
Hu
ang
etal.
(200
3);
Har
tet
al.
(200
3);
O’D
onn
ell
and
Du
ffy
(200
2);
Dan
nee
lsan
dK
lein
sch
mid
t(2
001)
;B
alac
han
dra
and
Fri
ar(1
997)
;G
riffi
nan
dP
age
(199
3,19
96);
Loc
het
al.
(199
6);
Mon
toy
a-W
eiss
and
Cal
anto
ne
(199
4)
Per
ceiv
edv
alu
e,p
rod
uct
adap
tab
ilit
y,
pro
du
ctex
ten
sion
,p
rod
uct
flex
ibil
ity
;p
aten
tab
ilit
y;
un
iqu
enes
s
Table II.
Designperformance
measurement
159

which are useful and measurable for collaborative design performance measurementbased only on information available during the design process. Consequently, a focusgroup study has been delivered to discuss and identify the key indicators forcollaborative design. These key indicators are a subset of the 13 key elements shown inTable II.
4.2 Identification of the most important collaborative design performance indicatorsIn order to explore whether the identified indicators are suitable for measuringcollaborative design performance during a design process, a focus group was conductedin July 2007. Collaborative design industrialists and collaborative design researcherswere selected as the target population, mainly because they have rich theoretical andpractical experience of collaborative design, including activities, process, results, andchallenges. Their various experiences in design research and practice enable them to beable to identify key indicators of collaborative design. Thirty focus group invitationswere sent to the target population, whose contact information was collected from theBrunel Design Alumni, by e-mail, with an introductory cover letter. Ten design expertsattended the focus group discussion. In order to clarify the participants’ background andexperiences, they were required to answer a list of questions at the beginning of the focusgroup study. Based on the response, 60 per cent of respondents were collaborativedesigners working in product design companies and four participants were designresearchers working in universities and research organisations. More specifically, 70 percent of the respondents focused on product design, 20 per cent (N ¼ 10) on designmanagement, and 10 per cent (N ¼ 10) on engineering design.
During the three hours focus group study, five key questions were discussed: whatis the core meaning of each of the 13 indicators, whether an indicator is closely relatedwith collaborative design performance, whether an indicator has potential to bemeasured during a design process, whether an indicator has close relationship withother indicators (i.e. high correlated), and whether some other indicators, which are notincluded in the identified list, should be regarded as important collaborative designindicators.
During the focus group discussion, the 13 potential DPM indicators were deeplydiscussed and analysed based on participants’ experiences from both research andindustrial perspectives. As a result, some indicators were considered to be lessimportant indicators for measuring collaborative design performance during a designprocess compared with others, such as financial and market environment indicators;and some indicators were combined into one because they are highly co-related, suchas collaboration and cross-functional integration. In addition, three new indicatorshave been suggested and discussed: strategic design, design resources management,and customer relationship management. Finally, five indicators were considered as themost important measures for collaborative design performance measurement. Theyare:
(1) efficiency;
(2) effectiveness;
(3) collaboration;
(4) management skill; and
(5) innovation.
IJPPM60,2
160
These results are consistent with pervious research findings. For example, manyresearchers have highlighted that efficiency should be regarded as one of the mostimportant performance measurement factors in collaborative design success (Naveh,2005). In Bond et al. (2004) and Hull (2004), effectiveness has received more attentionthan other criteria in collaborative design research. With the five DPM indicatorsidentified, there is a need to explore what detailed criteria can be used to measure thefive collaborative design indicators, and, in turn, conduct DPM in practice.
5. Investigation of collaborative design performance measurement criteriaIn order to explore detailed criteria for collaborative design performance measurement,a literature review, focus group study and questionnaire were conducted in phase two.The study in phase two includes three steps:
(1) investigation of potential DPM criteria for each collaborative design indicator;
(2) exploration of suitable DPM criteria for each collaborative design indicator; and
(3) identification of the most important DPM criteria for each collaborative designindicator.
The following sections will describe these three steps in greater detail.
5.1 Investigation of potential DPM criteriaBased on the five DPM indicators, a second literature review was operated to discoverdetailed criteria for each of the five in the NPD, design management, performancemeasurement, and design performance measurement research areas. The five DPMindicators were utilized as key words to conduct searching in the related researchareas. Subsequently, detailed potential DPM criteria, which have been indicated as keyfactors for the five DPM indicators, were collected from previous research. As a result,261 detailed criteria were identified as potential DPM criteria for measuringcollaborative design during a design process.
5.2 Exploration of suitable DPM criteriaIn order to discover whether all of the 261 detailed potential DPM criteria are suitablefor measuring the five collaborative design performance indicators during a designprocess, a further focus group study was conducted in January 2008. The focus groupinvitation process was similar to phase one. Thirty focus group invitations were sent tothe target population, and, ultimately, 13 design experts attended the focus groupdiscussion. Among the 13 participants, 61.54 per cent (N ¼ 13) were collaborativedesigners and 38.46 per cent (N ¼ 13) were collaborative design researchers. Of therespondents, 76.92 per cent (N ¼ 13) focused on collaborative product design, 15.38 percent (N ¼ 13) on collaborative design management and 15.38 per cent (N ¼ 10) oncollaborative engineering design. During the focus group study, five questions werediscussed in order to investigate suitable DPM criteria for the five indicators, in termsof what are core meanings of every detailed potential DPM criteria, whether a criterioncan be used to measure the DPM indicators, whether a criterion is measurable during adesign process, whether a criterion has close co-relation with others, and whether someother relevant criteria, which is not included in the classified lists, should be added.During the discussion, six new criteria, which are design trust, ability to build brandreputation, ability to encourage employees to believe in value of product, ability to sell
Designperformance
measurement
161

their design, ability to communicate well by persuasion, and ability to communicatewell confidence, were recruited and discussed. Consequently, they identified andclassified suitable detailed DPM criteria for each of the five DPM indicators. As a resultof the focus group study, 158 detailed DPM criteria were identified as suitable criteriafor measuring collaborative design performance during a design process and classifiedinto the five DPM measures based on their core meanings. More specifically, they areclassified as follows: 33 into efficiency, 39 into effectiveness, 25 into collaboration, 26into management skill, and 35 into innovation (Appendix 1 – Table AI).
According to those of Brown and Eisenhardt (1995) and Maskell (1989), themeasures should be simple and easy to implement, and under the control of anorganizational unit (Globerson, 1985). Therefore, 158 DPM criteria are too many to beoperated as an efficient DPM matrix in a design process. Thus, in order to reduce thenumber of DPM criteria, there is a need to identify the most important ones based ontheir relative priorities. Meanwhile, the number of detailed DPM criteria that should beincluded in a DPM matrix needs to be determined so that the remainder can be ignored.
5.3 Identification of the most important DPM criteriaA questionnaire survey was designed with close-ended, open-ended, and rankingquestions to gauge the participants’ profile, to identify the most important DPMcriteria from the 158 criteria, and to investigate how many criteria should be includedin a DPM matrix.
With the intention of creating a valuable DPM matrix, design industrialists wereselected as the target population for this study. More specifically, the target populationcomprised top design managers (including design managers, design project managers,etc.), middle design managers (including design directors, middle design managers,and heads of design teams), and designers (including product designer, graphicdesigners, engineering designer). These groups of people were selected mainly becausethey had rich practical experience of DPM implementation including activities,processes, results, problems, and challenges. Such abundant experience can providevaluable information and suggestions for this study.
The questionnaire survey was conducted based on a web-based questionnairesurvey system (www.freeonlinesurvey.com) from April to September 2008. The surveysystem allows multi-types of questions to be set up in a questionnaire, such asopen-ended questions, closed-ended questions, multi options questions, and rankingquestions. Web-based questionnaires were sent to the target participants by e-mail,with an attached cover letter briefly explaining the purpose of the questionnairesurvey. Participants could answer questionnaires online, with the data automaticallysaved in an online database. The biggest advantage of the web-based questionnairesurvey system is that the questionnaire can be easily created and distributed. Inaddition, all the collected data can be exported as an Excel document, which can beused straightforwardly for statistical analysis. The disadvantage of the web-basedquestionnaire survey system is that it is difficult to reach some participants who do notuse the internet.
The participants were selected from 127 product design companies based on theDesign Business Association Design Directory, including design managers, projectmanagers, and designers. 200 invitation e-mails were sent out, and 48 valid feedbackswere received. The questionnaire return rate was 24 per cent (N¼200). The 48 returned
IJPPM60,2
162

questionnaires were received from 18 designers, 17 design directors, and 13 designmanagers. Among the 48 respondents, the job responsibilities ranged from designstrategy, design management, design research, industrial design, to engineeringdesign. Specifically, 36 per cent (N ¼ 48) of respondents focused on industrial design,27 per cent (N ¼ 48) on design management, 21 per cent (N ¼ 48) on design strategy, 8per cent (N ¼ 48) on design research, and the other 8 per cent (N ¼ 48) on engineeringdesign.
In the questionnaire survey, after the personal information section, the participantswere asked to select and rank five essential criteria for each of the five collaborativedesign indicators from the classified items. The rank value ranges from 1 to 5, where 5is the most important and 1 is the least important. The reason for choosing five criteriais based on the suggestion that it is normally advisable to restrict the number of itemsto a maximum of six for ranking questions (Stanton et al., 2005).
Based on the questionnaire results, two measures of frequency and average rankingwere formulated for picking up the most important criteria for each indicator. Thefrequency was calculated by the ratio of the number of selections and the total numberof participants. It was calculated by the formula F¼S/N. Here, F represents frequencyfor each DPM criteria, S corresponds to the sum of selection times for each criterion,and N is the total number of participants. The average ranking was analysedaccording to the total of ranking scores received for each criterion and the total number
of participants. The calculation formula is A ¼ R=N ¼XS
i¼1
ri=N . Here, A represents
average ranking for each criterion, R corresponds to the sum of ranking scores receivedfor each criterion from the participants, and ri is the individual ranking value.
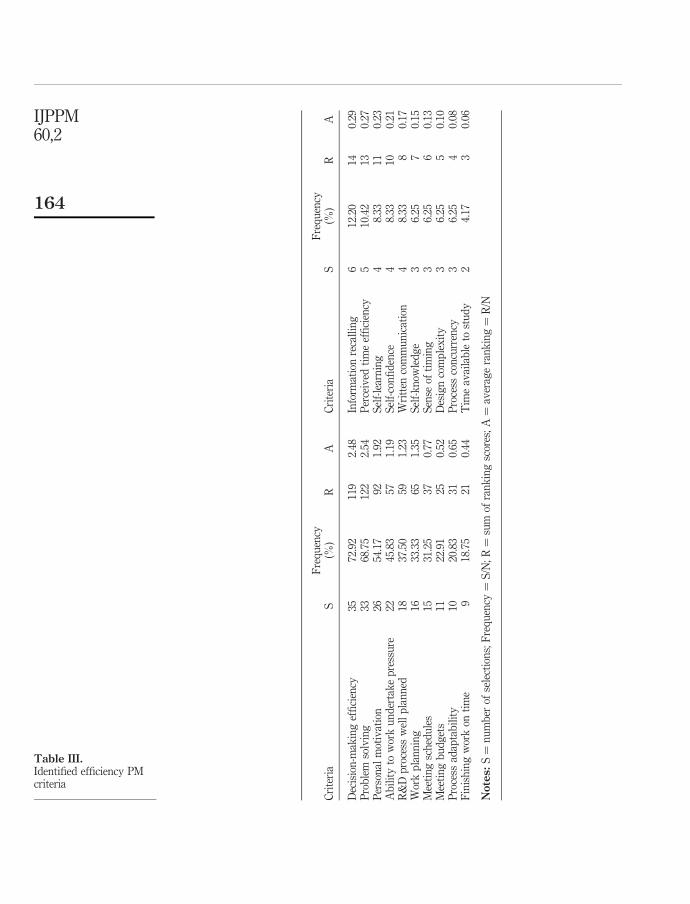
We use these two measures as critical parameters because the former indicates howmany of participants regard a criterion as an important one and the latter representsrelative importance comparisons among them. Therefore, the frequency measureindicates whether a criterion is an important factor or not. Thus, we used this measureto identify the list of most important criteria. Subsequently, we used the averageranking to rank the items in the list. This means that if items had the same or similarfrequency, the different average ranks can distinguish their positions in the list. Thisenabled the researchers to address how many detailed DPM criteria should be involvedin a design matrix. According to the results, 68 per cent (N¼48) of the participantsbelieved that 25 is an appropriate number of criteria for a DPM matrix. Tables III-VIIpresent the top 20 criteria in each of the efficiency, effectiveness, collaboration,management skills, and innovation areas in descending order of frequency. The topfive criteria are selected from each of the five tables to generate the 25 criteria forincorporation into a DPM matrix for collaborative design.
5.3.1 Key criteria for collaborative design efficiency. As shown in Table III,decision-making efficiency, problem solving, personal motivation, ability to workunder pressure, and R&D process well planned were selected as the most importantDPM criteria for design efficiency. Among these five items, 72.74 per cent of the 48participants believed that the decision-making efficiency was the most essentialcriterion for measuring design efficiency. A possible explanation for this finding isthat, due to the competitive pressures, limited resources and accelerating costs, it isdifficult to make the right decision efficiently (Cooper and Kleinschmidt, 1986).Therefore, whether or not design team members have the ability to make a decision
Designperformance
measurement
163
Cri
teri
aS
Fre
qu
ency
(%)
RA
Cri
teri
aS
Fre
qu
ency
(%)
RA
Dec
isio
n-m
akin
gef
fici
ency
3572
.92
119
2.48
Info
rmat
ion
reca
llin
g6
12.2
014
0.29
Pro
ble
mso
lvin
g33
68.7
512
22.
54P
erce
ived
tim
eef
fici
ency
510
.42
130.
27P
erso
nal
mot
ivat
ion
2654
.17
921.
92S
elf-
lear
nin
g4
8.33
110.
23A
bil
ity
tow
ork
un
der
tak
ep
ress
ure
2245
.83
571.
19S
elf-
con
fid
ence
48.
3310
0.21
R&
Dp
roce
ssw
ell
pla
nn
ed18
37.5
059
1.23
Wri
tten
com
mu
nic
atio
n4
8.33
80.
17W
ork
pla
nn
ing
1633
.33
651.
35S
elf-
kn
owle
dg
e3
6.25
70.
15M
eeti
ng
sch
edu
les
1531
.25
370.
77S
ense
ofti
min
g3
6.25
60.
13M
eeti
ng
bu
dg
ets
1122
.91
250.
52D
esig
nco
mp
lex
ity
36.
255
0.10
Pro
cess
adap
tab
ilit
y10
20.8
331
0.65
Pro
cess
con
curr
ency
36.
254
0.08
Fin
ish
ing
wor
kon
tim
e9
18.7
521
0.44
Tim
eav
aila
ble
tost
ud
y2
4.17
30.
06
Notes:
S¼
nu
mb
erof
sele
ctio
ns;
Fre
qu
ency
¼S
/N;
R¼
sum
ofra
nk
ing
scor
es;
A¼
aver
age
ran
kin
g¼
R/N
Table III.Identified efficiency PMcriteria
IJPPM60,2
164

Cri
teri
aS
Fre
qu
ency
(%)
RA
Cri
teri
aS
Fre
qu
ency
(%)
RA
Del
iver
ing
toth
eb
rief
3164
.58
136
2.83
Dev
elop
men
tco
stre
du
ctio
n7
14.5
819
0.40
Per
son
ally
resp
onsi
ble
/wor
kow
ner
ship
2960
.42
851.
77S
hor
tin
gti
me
from
idea
toco
mm
erci
aliz
atio
n6
12.5
017
0.35
Un
der
stan
dd
esig
nra
tion
ale
2858
.33
108
2.25
Ris
kad
just
men
t5
10.4
211
0.23
Fas
tan
dd
etai
led
feed
bac
k26
54.1
768
1.42
Nu
mb
er.
ofd
esig
nre
vie
ws
36.
257
0.15
Man
agin
gm
ista
kes
2450
.00
591.
23S
ocia
lin
flu
ence
36.
255
0.10
Tec
hn
ical
per
form
ance
atta
ined
rela
tiv
eto
obje
ctiv
es17
35.4
255
1.15
Soc
ial
val
idat
ion
36.
255
0.10
Cla
rify
ing
lead
ersh
ipan
dth
ero
leof
clie
nt
1122
.92
420.
88N
um
ber
ofm
iles
ton
es3
6.25
40.
08Id
enti
fyim
pro
vem
ent
acti
ons
for
futu
rep
roje
ct10
20.8
322
0.46
Nor
mat
ive
infl
uen
ce2
4.17
40.
08S
elf-
just
ifica
tion
918
.75
200.
42S
elf-
pre
fere
nce
s2
4.17
40.
08T
esti
ng
con
cep
tte
chn
ical
feas
ibil
ity
714
.58
230.
48B
usi
nes
san
aly
sis
24.
175
0.10
Notes:
S¼
nu
mb
erof
sele
ctio
ns;
Fre
qu
ency
¼S
/N;
R¼
sum
ofra
nk
ing
scor
es;
A¼
aver
age
ran
kin
g¼
R/N
Table IV.Identified design
effectiveness PM criteria
Designperformance
measurement
165

Cri
teri
aS
Fre
qu
ency
(%)
RA
Cri
teri
aS
Fre
qu
ency
(%)
RA
Cle
arte
amg
oal/
obje
ctiv
es37
77.0
816
23.
38H
elp
ing
and
coop
erat
ing
wit
hot
her
s9
18.7
515
0.31
Info
rmat
ion
shar
ing
2960
.42
107
2.23
Com
mu
nic
atio
nn
etw
ork
714
.58
130.
27C
omm
un
icat
ion
qu
alit
y25
52.0
885
1.77
Dis
sem
inat
ion
ofle
arn
ing
612
.50
110.
23C
ross
-fu
nct
ion
alco
llab
orat
ion
2347
.92
611.
27F
un
ctio
nal
open
nes
s4
8.33
90.
19S
har
edp
rob
lem
-sol
vin
g21
43.7
557
1.19
Men
tal
hea
lth
48.
337
0.15
Com
mu
nic
atio
nen
vir
onm
ent
1531
.25
420.
88S
tres
sm
anag
emen
t3
6.25
70.
15A
bil
ity
tom
ake
com
pro
mis
es13
27.0
833
0.69
Info
rmat
ion
pro
cess
ing
36.
257
0.15
Tea
msa
tisf
acti
on12
25.0
041
0.85
Tea
m-j
ust
ifica
tion
36.
255
0.10
Com
mu
nic
atio
nst
yle
1122
.92
270.
56S
elf-
pre
sen
tati
on2
4.17
30.
06T
ask
inte
rdep
end
ence
1020
.83
250.
52T
ime
avai
lab
leto
hel
pot
her
staf
f2
4.17
20.
04
Notes:
S¼
nu
mb
erof
sele
ctio
ns;
Fre
qu
ency
¼S
/N;
R¼
sum
ofra
nk
ing
scor
es;
A¼
aver
age
ran
kin
g¼
R/N
Table V.Identified collaborationPM criteria
IJPPM60,2
166

Cri
teri
aS
Fre
qu
ency
(%)
RA
Cri
teri
aS
Fre
qu
ency
(%)
RA
Dec
isio
nm
akin
g32
66.6
711
82.
46R
ole-
tak
ing
abil
ity
918
.75
240.
50D
efin
e/fu
lly
un
der
stan
dro
le/s
and
resp
onsi
bil
itie
s27
56.2
598
2.04
Inte
rper
son
alco
ntr
ol9
18.7
531
0.65
Bu
ild
hig
hm
oral
ew
ith
inte
am25
52.0
889
1.85
Op
enn
ess
816
.67
90.
19C
onfl
ict
man
agem
ent
2041
.67
511.
06M
anag
ers’
rep
uta
tion
714
.58
220.
46M
onit
or/e
val
uat
ete
amp
erfo
rman
ce17
35.4
249
1.02
Sel
f-m
anag
emen
t6
12.5
09
0.19
En
cou
rag
eth
eem
plo
yee
sub
mis
sion
ofn
ewp
rod
uct
idea
s14
29.1
740
0.83
Dev
elop
and
men
tor
you
rsel
f/y
our
staf
f5
10.4
211
0.23
Pas
sion
1327
.08
470.
98M
easu
reof
fail
ure
48.
335
0.10
Mot
ivat
ion
1225
.00
440.
92In
form
aln
etw
ork
pos
itio
n4
8.33
30.
06C
reat
ean
inn
ovat
ive
com
mu
nic
atio
n11
22.9
233
0.69
Man
ager
’ssu
bje
ctiv
eas
sess
men
tof
succ
ess
36.
256
0.13
Inv
esti
gat
ere
sou
rce/
reso
urc
ep
lan
nin
g10
20.8
324
0.50
Pro
ject
lead
erch
amp
ion
24.
174
0.08
Notes:
S¼
nu
mb
erof
sele
ctio
ns;
Fre
qu
ency
¼S
/N;
R¼
sum
ofra
nk
ing
scor
es,
A¼
aver
age
ran
kin
g¼
R/N
Table VI.Identified design
management skill PMcriteria
Designperformance
measurement
167

Cri
teri
aS
Fre
qu
ency
(%)
RA
Cri
teri
aS
Fre
qu
ency
(%)
RA
Com
pet
itiv
ead
van
tag
e34
70.8
312
12.
52S
pee
dto
mar
ket
714
.58
150.
31S
elec
tth
eri
gh
tcr
eati
vit
yco
nce
pt
toim
ple
men
tati
on27
56.2
510
12.
01T
ime
tom
ark
et6
12.5
015
0.31
Pro
du
cts
lead
tofu
ture
opp
ortu
nit
ies
2347
.92
771.
60M
etq
ual
ity
gu
idel
ines
510
.42
130.
27H
igh
qu
alit
yp
rod
uct
des
ign
2143
.75
761.
58P
rofi
tab
ilit
yof
afi
rm5
10.4
27
0.15
Per
ceiv
edv
alu
e19
39.5
863
1.31
Tec
hn
olog
yn
ovel
ty4
8.33
110.
23C
once
pt
tom
ark
et15
31.2
544
0.92
Com
pet
itiv
ere
acti
on4
8.33
70.
15E
nh
ance
cust
omer
acce
pta
nce
crea
tiv
ely
1429
.17
501.
04R
elat
edp
oten
tial
mar
ket
48.
336
0.13
Pro
du
ctu
niq
uen
ess
1429
.17
400.
83U
nit
sale
sg
oals
36.
255
0.10
Mar
ket
new
nes
s13
27.0
833
0.69
Tim
e-b
ased
com
pet
itio
n3
6.25
40.
08P
lan
nin
gR
&D
bu
dg
et9
18.7
516
0.33
Un
itco
st2
4.17
30.
06
Notes:
S¼
nu
mb
erof
sele
ctio
ns;
Fre
qu
ency
¼S
/N;
R¼
sum
ofra
nk
ing
scor
es,
A¼
aver
age
ran
kin
g¼
R/N
Table VII.Identified innovation PMcriteria
IJPPM60,2
168

efficiently becomes a vital element. This finding is also consistent with those of Busseriand Palmer (2000) and Schmidt et al. (2001), which indicated that efficientdecision-making was crucial for final project outcomes as it has very positiveinfluences on maintaining project control and the NPD team collaboration. On the otherhand, from the average ranking perspective, problem solving was chosen as the mostimportant criterion to measure design efficiency. This result echoes those of Smither(1998) and Loch and Tapper (2002), which indicated that efficient problem solvingskills can increase learning and improvement ability of project staff and theirbehaviour. In addition, as the design process always involves multi-background staffand new buyer-supplier relationships (Wognum et al., 2002), the complex collaborationmight produce more problems when compared with other projects. Therefore, problemsolving skill was highlighted as one of the most important DPM criteria.
5.3.2 Key criteria for collaborative design effectiveness. The questionnaire resultspresented in Table IV shows that delivering to the brief, personally responsible/workownership, understand design rationale, fast and detailed feedback, and managingmistakes have been regarded as the most important design effectiveness PM criteria.Among these five, the ability of delivering brief was selected by 63.66 per cent (N¼48)of the participants as the most critical element of design effectiveness performancemeasurement from both frequency and average ranking aspects. This result echoesthose of the Hart et al. (2003), Fell et al. (2003), and Naveh (2005), which indicateddelivering to brief is an important element for NPD effectiveness. It is probablybecause the global competitive environment has impelled design companies to deliverhigh-quality design during the design process in order to satisfy customers’requirements, launch a new product into the market on time, and, in turn survive, andwin the market.
5.3.3 Key criteria for collaborative design collaboration. Table V highlights that thefive most important criteria which influence design collaboration PM are clear teamgoal/objectives, information sharing, communication quality, cross-functionalcollaboration, and shared problem-solving. Among these top five criteria, 81.84 percent (N¼48) of the participants believed clear team goal/objectives was the mostimportant criteria by which to measure design collaboration performance. This resultis consistent with that of Belbin (1993), which indicated that fully understanding thegoal/objectives of the project team can reduce misunderstanding and increase teamcollaboration. In addition, 63.63 per cent (N¼48) of the participants considered thatinformation sharing was the most important factor for design collaboration. This isprobably because team individuals are limited in their ability to search for enoughinformation, to recall information from memory, and to make selections from multiplecriteria (Staw, 1981). Therefore, members can support each other by sharinginformation with colleagues with different knowledge and skills (Steiner, 1972;McGrath and Romeri, 1994). Such information sharing can increase teams’collaboration performance.
5.3.4 Key criteria for collaborative design management. Results shown in Table VIindicate that design making, define/fully understand roles and responsibilities, buildhigh morale within team, conflict management, and monitor/evaluate teamperformance are the five most important criteria for design management skillperformance measurement. 68.23 per cent (N¼48) of the participants regarded decisionmaking as the most important criterion for measuring design management skill. This
Designperformance
measurement
169

is probably because the decision making in a design process always requires a degreeof management ability to deal with a large amount of information (Twigg, 1998), adynamic and fast changing market, and multiple alternatives and criteria in anuncertain environment (Feltham and Xie, 1994). Therefore, a good decision maker candrive a design project team to achieve the ultimate project goal more efficiently andeffectively.
5.3.5 Key criteria for collaborative design innovation. Table VII presents the resultsof the importance of design innovation performance criteria ranking. Of theparticipants, 72.77 per cent (N¼48) considered competitive advantage as the mostrelevant and important criterion for design innovation performance measurement. Inother words, high design innovation performance depends on whether the productdesign can provide competitive advantages. This finding is consistent with those ofGriffin and Page (1993, 1996) and Fell et al. (2003), which indicated that the ability ofproviding a sustainable competitive advantage was a key factor of NPD success andcrucial element to win the global market. 63.68 per cent (N¼48) of the participantsbelieved that the capacity to select the right creativity concept was an important factorin design innovation performance. This may be due to the fact that the capacity toselect the right creativity concept can support the future market trend and the futurecustomer requirements. The right selection of the creativity concept requires a goodunderstanding of the new product and the market. This good understanding canreduce risks of the selected creativity concept, to win the future market (Gaynor, 1990).Therefore, the capacity to select the right creativity concept is an essential factor fordesign innovation performance measurement.
According to the questionnaire results, a design performance matrix wasestablished, based on the top 25 criteria and the five DPM indicators (Table VIII).
5.4 Discussion5.4.1 DPM matrix implementation. The DPM matrix can be implemented to supportdesign managers and designers in measuring design performance based only oninformation typically available during a design process, and, in turn, improvecollaborative design. More specifically, due to the fact that collaborative designprojects always involve a team of participants with diverse knowledge and experience,it is more difficult for them to work together effectively (Ali et al., 2008; Girard andRobin, 2006). The proposed DPM matrix can be applied to support collaborative designproject team members in better understanding each other by providing multiple teamcollaboration feedback. Based on the DPM matrix, the design project team members’daily collaborative design performance can be measured in terms of the efficiency,effectiveness, collaboration, management skill, and innovation aspects by designmanagers and their design team colleagues. Subsequently, DPM results can beanalysed to provide team feedback and information about the strengths andweaknesses of the design team members’ collaborative design performance. Theinformation can support design managers in better supervising and improving theproject development process, providing an appropriate training plan for each singleteam member, and making decisions more efficiently and effectively. In addition,because a collaborative design process is extremely dynamic (Shen et al., 2008; Chuaet al., 2003), the DPM results can help designers better recognize the current situation oftheir collaborative design performance for a certain stage during a design process. In
IJPPM60,2
170

Mos
tim
por
tan
t!
Les
sim
por
tan
t
Effi
cien
cyD
ecis
ion
-mak
ing
effi
cien
cyP
rob
lem
solv
ing
Per
son
alm
otiv
atio
nA
bil
ity
tow
ork
un
der
tak
ep
ress
ure
R&
Dp
roce
ssw
ell
pla
nn
edE
ffec
tiv
enes
sD
eliv
erin
gto
the
bri
efP
erso
nal
lyre
spon
sib
le/w
ork
own
ersh
ipU
nd
erst
and
des
ign
rati
onal
eF
ast
and
det
aile
dfe
edb
ack
Man
agin
gm
ista
kes
Col
lab
orat
ion
Cle
arte
amg
oal/
obje
ctiv
esIn
form
atio
nsh
arin
gC
omm
un
icat
ion
qu
alit
yC
ross
-fu
nct
ion
alco
llab
orat
ion
Sh
ared
pro
ble
m-s
olv
ing
Man
agem
ent
skil
lD
ecis
ion
mak
ing
Defi
ne/
full
yu
nd
erst
and
role
/san
dre
spon
sib
ilit
ies
Bu
ild
hig
hm
oral
ew
ith
inte
amC
onfl
ict
man
agem
ent
Mon
itor
/ev
alu
ate
team
per
form
ance
Inn
ovat
ion
Com
pet
itiv
ead
van
tag
eS
elec
tth
eri
gh
tcr
eati
vit
yco
nce
pt
toim
ple
men
tati
onP
rod
uct
sle
adto
futu
reop
por
tun
itie
sH
igh
qu
alit
yp
rod
uct
des
ign
Per
ceiv
edv
alu
e
Table VIII.DPM matrix
Designperformance
measurement
171

turn, they can improve themselves according to the indicated weaknesses on thespecific design stage.
For successful operation of the DPM matrix, both factual and experience-basedinformation within the collaborative design development process are required. Theformer means accurate information about collaborative design processes, such as time,cost, number of design outcomes and statistical data. The latter represents designdevelopment information based on a design team member’s experience during thedesign process, such as design activities, communication quality, and team interaction.During a collaborative design process, available factual information is varied along adevelopment process due to the fact that design effect levels are not directlyobservable, while the consequences of design actions are not directly observable, andthere is high level of uncertainty in the whole design process (Shen et al., 2008; Chuaet al., 2003; Feltham and Xie, 1994; Craig and Hart, 1993). For example, manyresearchers have suggested that a product’s competitive advantages can be measuredbased on market share, investment return rate, and customers’ feedback. However, asthis data is not normally available during a design process, it is difficult to assess theproduct’s competitive advantage before the product launch. Therefore, there is a needto integrate factual and experience-based information together in order to maintainDPM implementations to provide substantial and constant information concerningcollaborative design during a design process. Some researchers have highlighted thatcompetitive advantages can be measured during a design process according toexperience information, such as an understanding of competitors, good workingknowledge and comparing numbers on brochures (Moultrie, 2004). Therefore, theproposed matrix provides strategies to conduct a comprehensive and constant DPMduring a design process by integrating both factual and experience-relatedcollaborative design performance information.
During a collaborative design project development process, factual information forDPM can be collected from the collaborative design project operation data recordsduring the design process, such as date of starting and ending point of each designtask, e-mail exchange, meeting minutes, project brief and plan, budget plan, results ofeach design task (e.g. concept design draft, prototype modelling, and detailed designgraphics), and DPM results. This data can be utilized as factual evidence to measure ateam member’s collaborative design performance, such as whether a member meets adesign brief on time and within a budget plan, whether the member provides fast anddetailed feedback via e-mails and meetings, whether the member has ability to workunder pressure, and whether the member supplies rich information sharing. On theother hand, experience-related information for DPM matrix operation can be gatheredthrough a DPM questionnaire, which requires the collaborative design team membersto judge their colleagues’ performances based on daily team collaboration, addressingefficiency, effectiveness, collaboration, management skill, and innovation against the25 DPM criteria. In addition, team members’ judgements and feedbacks should dependon the current design environment and project context. With the intention to decreasenegative influences of staff’s subjective attitudes to the DPM questionnaire results, amulti-feedback performance measurement approach can be applied to minimize thechance of any one person’s bias unduly influencing a DPM decision (Smither, 1998).Therefore, in order to operate DPM in a comprehensive and balanced way with all thedesign team members, a team member’s collaborative design performance should not
IJPPM60,2
172

only be evaluated by his/her manager, but also by the same level colleagues, lowerlevel design staff and him/herself through the DPM questionnaire. By doing so, everyteam member’s performance can be collectively evaluated by the design project teammembers.
During a collaborative design process, the DPM matrix could be implemented tomeasure design performance by following the process below:
(1) Identify design project team members as the top design manager, middlemanagers, and individual designers based on their job roles in order to clarify“manager”, “the same level colleagues” and “the lower level design staff”.
(2) Based on the DPM matrix, the project team members’ daily collaborative designperformance could be measured from efficiency, effectiveness, collaboration,management skill, and innovation aspects by their “manager”, “the same levelcolleagues”, “the lower level design staff” and themselves via the DPMquestionnaire. Subsequently, DPM data should be collected by themselves, theirdesign manager, their same level colleagues, and their sub level designers.
(3) Next, the DPM data should be calculated to produce DPM scores for each designteam member.
(4) Subsequently, DPM results should be analysed to provide information aboutthe strengths and weaknesses of the design team members.
(5) The information should be able to support design managers to better superviseand improve the design project development process, provide an appropriatetraining plan for each single team member, and make decisions more efficientlyand effectively. In addition, the information should also be able to help the otherdesign staff to better understand the current situation of their designperformance. Consequently, they can improve themselves according to theindicated weaknesses.
(6) By comparing previous and current DPM results it will be possible to seewhether the design team members’ response actions have made positiveimprovements to the design development.
(7) The number of DPM operation times during a design process can be determinedby the project features, such as size, number of team members, and time plan.
Because availabilities of collaborative design performance information are variedduring a design process, the collaborative design performance will be measured basedon a variety of factual and experience information at different design stages, accordingto the DPM criteria. In addition, what information should be utilized to conduct DPMfor different design stages is also varied with different design projects based on theirstrategies. Thus, it is difficult to develop a universal DPM information map to supportDPM implementation. Therefore, the proposed DPM matrix should be used asguidelines to lead the DPM operation in different collaborative design projects basedon available factual and experience information only. The detailed collaborative designperformance information for each of the criteria at different design stages should beidentified by design managers according to the specific features of the project. Forinstance, the specific DPM criterion “delivering to the brief” may be demonstrated byinformation concerning “achieving all detailed objectives in a design task with high
Designperformance
measurement
173
quality” and “presentation of core brief value in design outcomes” (Appendix 2 –Table AII).
5.4.2 Limitation of the present study. The present study was focused on exploringand developing a DPM matrix for measuring collaborative design performance duringa design process. Therefore, some key DPM criteria, which are not measurable during adesign development process, were not included in this study, such as investment returnrate, market share, and customer satisfaction. However, the proposed DPM matrix haspotential to be extended so as to examine collaborative design performance byfollowing an entire product life process in future research. In addition, the proposedmulti-feedback approach for DPM matrix implementation needs to be validated byindustrial case studies.
6. ConclusionsPerformance measurement has been increasingly developed and operated to improveproject and business performance, especially for some complex and large-scale projects(Vaneman and Triantis, 2007). Because of the great complexity and uncertain featuresof the product collaborative design process (Twigg, 1998), there is a necessity forimplementing performance measurement to control the project development, minimizecollaboration conflicts, and reduce management risk during the design process, and, inturn, improve the final performance of the project.
The major contribution of this study is the investigation and development of a DPMmatrix to measure collaborative design performance during a design process.Specifically, 25 DPM criteria, which address five DPM indicators: efficiency,effectiveness, collaboration, management skill, and innovation, have been highlightedas the most critical factors for collaborative design performance measurement. Theresults indicate that decision-making efficiency is the most important DPM criteria forcollaborative design efficiency; delivering to the brief for effectiveness; clear teamgoal/objectives for collaboration; decision-making ability for management skill; andcompetitive advantage for innovation. These results can be used to conduct a DPM toolbased only on information available at design stages in order to measure collaborativedesign performance during a design process. Owing to the limitations of the workpresented in this paper, further research is focused on the extended DPM matrixdevelopment and the implementation of the DPM matrix.
References
Alegre, J., Lapiedra, R. and Chiva, R. (2006), “A measurement scale for product innovationperformance”, European Journal of Innovation Management, Vol. 9 No. 4, pp. 333-46.
Ali, A.S., Rahmat, I. and Hassan, H. (2008), “Involvement of key design participants inrefurbishment design process”, Facilities, Vol. 26 Nos 9/10, pp. 389-400.
Balachandra, R. and Friar, J.H. (1997), “Factors for success in R&D projects and new productinnovation: a contextual framework”, IEEE Transactions on Engineering Management,Vol. 44 No. 3, pp. 276-87.
Bart, C. and Pujari, A. (2007), “The performance impact of content and process in productinnovation charters”, Journal of Product Innovation Management, Vol. 24 No. 1, pp. 3-19.
Belbin, R.M. (1993), Team Roles at Work, Butterworth- Heinemann, Oxford.
Benedetto, C. (1999), “Identifying the key success factors in new product launch”, Journal ofProduct Innovation Management, Vol. 16, pp. 530-44.
IJPPM60,2
174

Bititci, U. (2002), “Integrated performance measurement system: an audit approach. Parts 1 and2”, Control, February/March.
Bobrow, E.E. (1991), “Successful new products are product of process”, Marketing News, 15 April,p. 27.
Bond, E.U., Walker, B.A., Hutt, M.D. and Reingen, P.H. (2004), “Reputational effectiveness incross-functional working relationships”, Journal of Product Innovation Management,Vol. 21, pp. 44-60.
Brown, S.L. and Eisenhardt, L.M. (1995), “Product development: past research, present findings,and future directions”, Academy of Management Review, Vol. 20 No. 2, pp. 343-78.
Bruce, M. and Bessant, J. (2002), Design in Business: Strategic Innovation through Design,Financial Times Management, London.
Bryant, L., Jones, D.A. and Widener, S.K. (2004), “Managing value creation within the firm:an examination of multiple performance measures”, Journal of Management AccountingResearch, Vol. 16, pp. 107-31.
Bstieler, L. (2006), “Trust formation in collaborative new product development”, ProductInnovation Management, Vol. 23, pp. 56-72.
Busseri, M.A. and Palmer, J.M. (2000), “Improving teamwork: the effect of self-assessment onconstruction design teams”, Design Studies, Vol. 21, pp. 223-38.
Calantone, R.J., DiBenedetto, C.A. and Haggblom, T. (1995), “Principles of new productmanagement: exploring the beliefs of product practitioners”, Journal of Product InnovationManagement, Vol. 12, pp. 235-46.
Campion, M.A. and Medsker, G.J. (1993), “Relations between work group characteristics andeffectiveness: implications for designing effective work groups”, Journal of PersonalPsychology, Vol. 46 No. 4, pp. 823-43.
Chen, C., Ling, S.F. and Chen, W. (2002), “Project scheduling for collaborative productdevelopment using DSM”, International Journal of Project Management, Vol. 21, pp. 291-9.
Chiesa, V., Frattini, F., Lazzarotti, V. and Manzini, R. (2009), “Performance measurement ofresearch and development activities”, European Journal of Innovation Management,Vol. 12 No. 1, pp. 25-61.
Chiu, M.L. (2002), “An organizational view of design communication in design collaboration”,Design Studies, Vol. 23, pp. 187-210.
Chu, C., Cheng, C. and Wu, C. (2006), “Applications of the web-based collaborative visualizationin distributed product development”, Computers in Industry, Vol. 57, pp. 272-82.
Chua, D.K.H., Tyagi, A., Ling, S. and Bok, S.H. (2003), “Process parameter-interface model fordesign management”, Journal of Construction Engineering and Management, Vol. 129No. 6, pp. 653-63.
Cooper, L.P. (2003), “A research agenda to reduce risk in new product development throughknowledge management: a practitioner perspective”, Journal of Engineering andTechnology Management, Vol. 20, pp. 117-40.
Cooper, R.G. and Kleinschmidt, E.J. (1986), “An investigation into the new product process: steps,deficiencies, and impact”, Journal of Product Innovation Management, Vol. 3, pp. 71-85.
Cooper, R.G. and Kleinschmidt, E.J. (1995), “Benchmarking the firm’s critical success factors innew product development”, Journal of Product Innovation Management, Vol. 12,pp. 374-91.
Craig, A. and Hart, S. (1993), “Dimensions of success in new product development”, Perspectiveson Marketing Management, Vol. 3, Chapter 10, pp. 207-43.
Designperformance
measurement
175
Danneels, E. and Kleinschmidt, E.J. (2001), “Product innovativeness from the firm’s perspective:its dimensions and their relation with project selection and performance”, Journal ofProduct Innovation Management, Vol. 18, pp. 357-73.
Easterby-Smith, M.P.V., Thorpe, R. and Lowe, A. (2002), Management Research: An Introduction,2nd ed, Sage, London.
Fell, D.R., Hansen, E.N. and Becker, B.W. (2003), “Measuring innovativeness for the adoption ofindustrial products”, Journal of Industrial Marketing Management, Vol. 32, pp. 347-53.
Feltham, G.A. and Xie, J. (1994), “Performance measure congruity and diversity in multi-taskprincipal-agent relations”, The Accounting Review, Vol. 69 No. 3, pp. 429-53.
Folan, P. and Browne, J. (2005), “A review of performance measurement: towards performancemanagement”, Computers in Industry, Vol. 56, pp. 663-80.
Forme, F.G.L., Genoulaz, V.B. and Campagne, J. (2007), “A framework to analyse collaborativeperformance”, Computers in Industry, Vol. 58, pp. 687-97.
Gaynor, G.H. (1990), “Selecting projects”, Research-technology Management, Vol. 33 No. 4,July-August, pp. 43-5.
Girard, P. and Robin, V. (2006), “Analysis of collaboration for project design management”,Computers in Industry, Vol. 57, pp. 817-26.
Globerson, S. (1985), “Issues in developing a performance criteria system for an organisation”,International Journal of Production Research, Vol. 23, pp. 639-46.
Griffin, A. and Hauser, J.R. (1996), “Integrating R&D and marketing: a review and synthesis ofthe literature”, Journal of Product Innovation Management, pp. 191-216.
Griffin, A. and Page, L. (1993), “An interim report on measuring product development successand failure”, Journal of Product Innovation Management, Vol. 10, pp. 291-308.
Griffin, A. and Page, L. (1996), “PDMA Success measurement project: recommended measuresfor product development success and failure”, Journal of Product Innovation Management,Vol. 13, pp. 478-96.
Hart, S., Hultink, E.J., Tzokas, N. and Commandeur, H.R. (2003), “Industrial companies’evaluation criteria in new product development gates”, Journal of Product InnovationManagement, Vol. 20, pp. 22-36.
Hertenstein, J., Platt, M.B. and Brown, D. (2001), “Valuing design: enhancing corporateperformance through design effectiveness”, Design Management Journal, Vol. 12 No. 3,pp. 10-19.
Hertenstein, J., Platt, M.B. and Veryzer, R.W. (2005), “The impact of industrial designeffectiveness on corporate financial performance”, Product Innovation Management,Vol. 22, pp. 3-21.
Huang, X., Soutar, G.N. and Brown, A. (2003), “Measuring new product success: an empiricalinvestigation of Australian SMEs”, Journal of Industrial Marketing Management, Vol. 33,pp. 117-23.
Hull, F.M. (2004), “A composite model of product development effectiveness: application toservices”, IEEE Transactions on Engineering Management, Vol. 51, pp. 162-72.
Hultink, E.J. and Robben, H.S.J. (1995), “Measuring new product success: the difference that timeperspective makes”, Journal of Product Innovation Management, Vol. 12, pp. 392-405.
Kennerley, M. and Neely, A. (2003), “Measuring performance in a changing businessenvironment”, International Journal of Operations & Production Management, Vol. 23,pp. 213-29.
IJPPM60,2
176

Kinshuk (1996), “Computer-aided learning for entry-level accountancy students”, PhD thesis,DeMontfort University, Leicester.
Krueger, R.A. (2000), Focus Groups: A Practical Guide for Applied Research, 3rd ed., Sage,Newbury Park, CA.
Kusar, J., Dunovnik, J., Grum, J. and Starbek, M. (2004), “How to reduce new product developmenttime”, Journal of Robotics and Computer-integrated Manufacturing, Vol. 20, pp. 1-15.
Lahti, H., Seitamaa-Hakkarained, P. and Hakkarainen, K. (2004), “Collaboration patterns incomputer supported collaborative designing”, Design Studies, Vol. 25, pp. 351-71.
Leenders, M. and Wierenga, B. (2002), “The effectiveness of different mechanisms for integratingmarketing and R&D”, Journal of Product Innovation Management, Vol. 19, pp. 305-17.
Loch, C., Stein, L. and Terwiesch, C. (1996), “Measuring development performance in theelectronics industry”, Journal of Product Innovation Management, Vol. 13, pp. 3-20.
Loch, C.H. and Tapper, U.A.S. (2002), “Implementing a strategy-driven performancemeasurement system for an applied research group”, Journal of Product InnovationManagement, Vol. 19, pp. 185-98.
McGrath, M.E. and Romeri, M.N. (1994), “From experience the R&D effectiveness index: a metricfor product development performance”, Journal of Product Innovation Management,Vol. 11, pp. 213-20.
MacBryde, J. and Mendibil, K. (2003), “Designing performance measurement systems for teams:theory and practice”, Management Decision, Vol. 41 No. 8, pp. 722-33.
Maier, A.M., Echert, C.M. and Clarkson, P.J. (2006), “Identifying requirements for communicationsupport: a maturity grid-inspired approach”, Expert Systems with Applications, Vol. 31No. 4, pp. 663-72.
Maier, A.M., Kreimeyer, M., Hepperle, C., Eckert, C.M., Lindemann, U. and Clarkson, P.J. (2008),“Exploration of correlations between factors influencing communication in complexproduct development”, Concurrent Engineering: Research and Applications, Vol. 16 No. 1,pp. 37-59.
Maskell, B. (1989), “Performance measures of world class manufacturing”, ManagementAccounting, May, pp. 32-3.
Montoya-Weiss, M.M. and Calantone, R. (1994), “Determinants of new product performance:a review and meta-analysis”, Journal of Product Innovation Management, Vol. 11,pp. 397-417.
Morgan, D.L. (1997), Focus Groups as Qualitative Research, 2nd ed., Qualitative ResearchMethods Series 16, Sage, Newbury Park, CA.
Moultrie, J. (2004), “Development of a design audit tool to assess product design capability”,PhD thesis, University of Cambridge, Cambridge.
Moultrie, J., Clarkson, P.J. and Probert, D.R. (2006a), “A tool to evaluate design performance inSMEs”, International Journal of Productivity and Performance Measurement, Vol. 55 No. 3,p. 4.
Moultrie, J., Clarkson, P.J. and Probert, D.R (2006b), “Development of product audit tool”,Proceedings of the Institution of Mechanical Engineers (Part B), Engineering Manufacture,Vol. 220 No. 7, pp. 1157-74.
Mullins, J.W., Forlani, D. and Walker, O.C. Jr (1999), “Effects of organisational anddecision-maker factors on new product risk taking”, Journal of Product InnovationManagement, Vol. 16, pp. 282-94.
Designperformance
measurement
177
Nachum, L. (1999), “Measurement of productivity of professional services an illustration onSwedish management consulting firms”, International Journal of Operations & ProductionManagement, Vol. 19 No. 9, pp. 922-49.
Naveh, E. (2005), “The effect of intergraded product development on efficiency and innovation”,International Journal of Production Research, Vol. 43 No. 13, pp. 2789-801.
Neely, A., Gregory, M. and Platts, K. (2005), “Performance measurement system design:a literature review and research agenda”, International Journal of Operations & ProductionManagement, Vol. 25, pp. 1228-63.
Neely, A., Richards, H., Mills, J., Platts, K. and Bourne, M. (1997), “Designing performancemeasures: a structured approach”, International Journal of Operations & ProductionManagement, Vol. 17 No. 11, pp. 1131-52.
Nellore, R. and Balachandra, R. (2001), “Factors influencing success in integrated productdevelopment projects”, IEEE Transactions on Engineering Management, Vol. 48 No. 2,pp. 164-74.
O’Donnell, F.J. and Duffy, A.H.B. (2002), “Modelling design development performance”,International Journal of Operations & Production Management, Vol. 22 No. 11,pp. 1198-221.
Pawar, K.S. and Driva, H. (1999), “Performance measurement for product design anddevelopment in a manufacturing environment”, International Journal of ProductionEconomics, Vol. 60-61, pp. 61-8.
Qin, S.F., Harrison, R., West, A.A., Jordanov, I.N. and Wright, D.K. (2003), “A framework ofweb-based conceptual design”, Computers in Industry, Vol. 50, pp. 153-64.
Ridley, D. (2008), The Literature Review: a Step-by-step Guide for Students, Sage, London.
Salomo, S., Weise, J. and Gemunden, H.G. (2007), “NPD planning activities and innovationperformance: the mediating role of process management and the moderating effect ofproduct innovativeness”, Product Innovation Management, Vol. 24, pp. 285-302.
Salter, A. and Torbett, R. (2003), “Innovation and performance in engineering design”, Journal ofConstruction Management and Economics, Vol. 21, pp. 573-80.
Schmidt, J.B., Montoya-Weiss, M.M. and Massey, A.P. (2001), “New product developmentdecision-making effectiveness: comparing individuals, face-to-face teams, and virtualteams”, Journal of Decision Sciences, Vol. 32 No. 4, pp. 575-600.
Sharif, S.A. and Kayis, B. (2007), “DSM as a knowledge capture tool in CODE environment”,Journal of Intelligent Manufacturing, Vol. 18, pp. 497-504.
Shen, W., Hao, Q. and Li, W. (2008), “Computer supported collaborative design: retrospective andperspective”, Computers in Industry, Vol. 59, pp. 855-62.
Smither, J.W. (1998), Performance Appraisal: State of the Art in Practice, Jossey-Bass, London.
Soltani, E., Meer, R.V.D., Williams, T.M. and Lai, P. (2006), “The compatibility of performanceappraisal system with TQM principles – evidence from current practice”, InternationalJournal of Operations & Production Management, Vol. 26 No. 1, pp. 92-112.
Stanton, N.A., Salmon, P.M., Walker, G.H., Baber, C. and Jenkins, D.P. (2005), Human FactorsMethods: A Practical Guide for Engineering and Design, Ashgate, Aldershot.
Staw, B.M. (1981), “The escalation of commitment to a course of action”, Academy ofManagement Review, Vol. 6, pp. 577-87.
Steiner, I.D. (1972), Group Process and Productivity, Academic Press, New York, NY.
Stone, S. and Collin, H. (1984), CRUS Guide, Designing a User Study: General Research Design,Centre for Research on User Studies, University of Sheffield, Sheffield.
IJPPM60,2
178

Tatikonda, M.V. and Montoya-Weisis, M.M. (2001), “Integrating operations and marketingperspectives of product innovation: the influence of organizational process factors andcapabilities on development performance”, Journal of Management Science, Vol. 47 No. 1,pp. 151-72.
Tay, F.E.H. and Roy, A. (2003), “CyberCAD: a collaborative approach in 3D-CAD technology in amultimedia-supported environment”, Computers in Industry, Vol. 52, pp. 127-45.
TSB (2009), “Design and decision tools for low impact building report”, Technology StrategyBoard, available at: www.innovateuk.org
Twigg, D. (1998), “Managing product development within a design chain”, International Journalof Operations & Production Management, Vol. 18, pp. 508-24.
Vaneman, W.K. and Triantis, K. (2007), “Evaluating the productive efficiency of dynamicalsystems”, IEEE Transactions on Engineering Management, Vol. 54, pp. 600-12.
Werner, B.M. and Souder, W.E. (1992), “Measuring R&D performance – state of the art”,Research Technology Management, Vol. 40 No. 2, pp. 34-42.
Wognum, P.M., Fisscher, O.A.M. and Weenink, S.A.J. (2002), “Balanced relationships:management of client-supplier relationships in product development”, Technovation,Vol. 22, pp. 341-51.
Zha, X.F. and Du, H. (2006), “Knowledge-intensive collaborative design modelling and supportPart I: review, distributed models and framework”, Computers in Industry, Vol. 57,pp. 39-55.
Zhang, S., Shen, W. and Ghenniwa, H. (2004), “A review of internet-based product informationsharing and visualization”, Computers in Industry, Vol. 54, pp. 1-15.
Further reading
Cross, N. and Cross, A.C. (1995), “Observations of teamwork and social processes in design”,Design Studies, Vol. 16 No. 2, pp. 143-70.
Designperformance
measurement
179

Appendix 1
Nu
mb
erIt
ems
Effi
cien
cy33
Ab
ilit
yto
wor
ku
nd
erta
ke
pre
ssu
re.
Act
ual
tim
efo
rsu
b-t
ask
sag
ain
stp
lan
.D
ecis
ion
-mak
ing
effi
cien
cy.
Des
ign
com
ple
xit
y.
Ex
plo
rin
gan
dsk
ill
acq
uir
ing
.F
inis
hin
gw
ork
onti
me.
Iden
tify
ing
dev
iati
ons
from
pla
n.
Info
rmat
ion
reca
llin
g.
Lea
rnin
gsk
ill.
Mee
tin
gb
ud
get
s.M
eeti
ng
sch
edu
les.
Nu
mb
erof
par
alle
lp
roje
cts.
Per
ceiv
edti
me
effi
cien
cy.
Per
son
alm
otiv
atio
n.
Ph
ase
des
ign
rev
iew
pro
cess
.P
rob
lem
solv
ing
.P
roce
ssad
apta
bil
ity
.P
roce
ssco
ncu
rren
cy.
Pro
cess
form
alit
y.
Pro
cess
kn
owle
dg
e.P
roce
ssk
now
led
ge.
Pro
du
ctco
stes
tim
ates
tota
rget
s.P
roje
ctd
ura
tion
.Qu
alit
yfu
nct
ion
dep
loy
men
t.R
&D
pro
cess
wel
lp
lan
ned
.S
elf-
con
fid
ence
.S
elf-
kn
owle
dg
e.S
elf-
lear
nin
g.
Sen
seof
tim
ing
.S
tag
eg
ate
pro
cess
.T
ime
avai
lab
leto
stu
dy
.T
imel
ines
s(f
ast
feed
bac
k).
Wor
kp
lan
nin
g.
Wri
tten
com
mu
nic
atio
nE
ffec
tiv
enes
s39
Bu
sin
ess
anal
ysi
s.C
lari
fyin
gle
ader
ship
and
the
role
ofcl
ien
t.C
omp
ute
r-ai
ded
des
ign
.C
omp
ute
r-ai
ded
eng
inee
rin
g.C
omp
ute
r-in
teg
rate
dm
anu
fact
uri
ng
.Con
curr
ency
ofp
roje
ctp
has
es.C
oop
erat
ion
wit
hb
asic
rese
arch
.D
eliv
erin
gto
the
bri
ef.
Des
ign
qu
alit
yg
uid
elin
esm
et.
Dev
elop
men
tco
stre
du
ctio
n.
Ear
lym
ark
etin
gin
vol
vem
ent.
Ear
lyp
urc
has
ing
inv
olv
emen
t.E
arly
sup
pli
erin
vol
vem
ent.
Ear
lyu
seof
pro
toty
pes
.E
stab
lish
ing
com
mon
dat
ab
ase.
Ex
tern
also
urc
esof
idea
s.F
ast
and
det
aile
dfe
edb
ack
.L
ink
ing
auth
orit
yan
dre
spon
sib
ilit
y.
Hig
hq
ual
ity
ofjo
int
sup
pli
erd
esig
n.
Iden
tify
ing
imp
rov
emen
tac
tion
sfo
rfu
ture
pro
ject
.Im
pro
vin
gca
usa
lp
roce
ssm
odel
s.M
anag
ing
mis
tak
es.
Man
ufa
ctu
rab
ilit
yd
esig
n.
Nu
mb
erof
des
ign
rev
iew
s.N
um
ber
ofm
ark
etre
sear
chst
ud
ies.
Nu
mb
erof
mil
esto
nes
.N
orm
ativ
ein
flu
ence
.O
ver
all
pro
gra
msu
cces
s.P
erfo
rmro
otca
use
anal
ysi
s.P
erso
nal
lyre
spon
sib
le/w
ork
own
ersh
ip.
Ris
kad
just
men
t.S
elf-
just
ifica
tion
.S
elf-
pre
fere
nce
s.S
hor
tti
me
from
idea
toco
mm
erci
aliz
atio
n.
Soc
ial
infl
uen
ce.
Soc
ial
val
idat
ion
.T
esti
ng
con
cep
tte
chn
ical
feas
ibil
ity
.U
nd
erst
and
des
ign
rati
onal
e.W
ork
ing
wit
hen
thu
sias
mC
olla
bor
atio
n25
Ab
ilit
yto
mak
eco
mp
rom
ises
.A
bse
nce
of“n
oise
”ca
usa
lli
nk
.C
lear
team
goa
l/ob
ject
ives
.C
omm
un
icat
ion
env
iron
men
t.C
omm
un
icat
ion
net
wor
k.
Com
mu
nic
atio
nq
ual
ity
.C
omm
un
icat
ion
sty
le.
Cro
ss-f
un
ctio
nal
coll
abor
atio
n.
Dis
sem
inat
ion
ofle
arn
ing
.E
stab
lish
ing
com
mon
lan
gu
age.
Est
abli
shin
gp
rob
lem
solv
ing
met
hod
s.F
un
ctio
nal
open
nes
s.H
elp
ing
and
coop
erat
ing
wit
hot
her
s.In
form
atio
nsh
arin
g.
Info
rmat
ion
pro
cess
ing
.M
ark
etin
gsy
ner
gy
.M
easu
rin
gto
com
mu
nic
ate
the
org
aniz
atio
n’s
aim
.M
enta
lh
ealt
h.
Sel
f-p
rese
nta
tion
.S
har
edp
rob
lem
-sol
vin
g.
Str
ess
man
agem
ent.
Tas
kin
terd
epen
den
ce.
Tea
msa
tisf
acti
on.
Tea
m-j
ust
ifica
tion
.Tim
eav
aila
ble
toh
elp
oth
erst
aff
(continued
)
Table AI.Classified 158 detailedDPM criteria for the fiveDPM indicators
IJPPM60,2
180

Nu
mb
erIt
ems
Man
agem
ent
skil
l26
Bu
ild
ing
hig
hm
oral
ew
ith
inte
am.
Co-
loca
tion
ofte
amm
emb
ers.
Con
flic
tm
anag
emen
t.C
ross
-fu
nct
ion
alte
ams.
Cre
atin
gan
inn
ovat
ive
com
mu
nic
atio
n.
Dec
isio
nm
akin
g.
Defi
nin
g/f
ull
yu
nd
erst
and
role
/san
dre
spon
sib
ilit
ies.
Dev
elop
ing
and
men
tor
team
.E
nco
ura
gin
gth
eem
plo
yee
sub
mis
sion
ofn
ewp
rod
uct
idea
s.In
form
aln
etw
ork
pos
itio
n.
Inte
rper
son
alco
ntr
ol.
Inv
esti
gat
ing
reso
urc
e/re
sou
rce
pla
nn
ing
.Man
agem
ent’
ssu
bje
ctiv
eas
sess
men
tof
succ
ess.
Man
ager
s’re
pu
tati
on.
Mea
sure
offa
ilu
re.
Mid
dle
man
ager
skil
ls.
Mon
itor
ing
/ev
alu
atin
gte
amp
erfo
rman
ce.
Mot
ivat
ion
.O
pen
nes
s.P
assi
on.P
roje
ctle
ader
cham
pio
n.R
ole-
tak
ing
abil
ity
.Sel
f-m
anag
emen
t.T
eam
size
.Top
man
agem
ent
sup
por
t.U
nd
erst
and
ing
org
aniz
atio
nal
stru
ctu
reIn
nov
atio
n35
Ach
iev
ing
pro
du
ctp
erfo
rman
ceg
oal.
Ad
opti
onri
sk.C
omp
etit
ive
adv
anta
ge.
Com
pet
itiv
ere
acti
on.
Con
cep
tto
mar
ket
.E
nh
anci
ng
cust
omer
acce
pta
nce
crea
tiv
ely
.D
eliv
erin
gcu
stom
ern
eed
s.H
igh
qu
alit
yp
rod
uct
des
ign
,In
nov
ativ
enes
s.L
ead
ing
tofu
ture
opp
ortu
nit
ies.
Mar
ket
chan
ce.
Mar
ket
new
nes
s.M
ark
etfa
mil
iari
ty.
Mar
ket
pot
enti
al.
Mee
tin
gq
ual
ity
gu
idel
ines
.N
ewn
ess
tocu
stom
ers.
New
nes
sof
tech
nol
ogy
inco
rpor
ated
inp
rod
uct
.P
erce
ived
val
ue.
Pro
cess
tech
nol
ogy
nov
elty
.P
rod
uct
adv
anta
ge.
Pro
du
ctp
erfo
rman
cele
vel
.P
rod
uct
qu
alit
y.
Pro
du
ctte
chn
olog
yn
ovel
ty.
Pro
du
ctu
niq
uen
ess.
Pro
du
cts
lead
tofu
ture
opp
ortu
nit
ies.
Rel
ated
pot
enti
alm
ark
et.
Sel
ecti
ng
the
rig
ht
crea
tiv
ity
con
cep
tto
imp
lem
enta
tion
.S
pee
dto
mar
ket
.T
ech
nic
alob
ject
ives
.T
ech
nic
alsu
cces
s.T
ech
nic
alfe
asib
ilit
y.
Tec
hn
olog
ical
inn
ovat
iven
ess.
Tec
hn
olog
yn
ovel
ty.
Tim
e-b
ased
com
pet
itio
n.
Wh
eth
erq
ual
ity
gu
idel
ines
wer
em
et
Table AI.
Designperformance
measurement
181
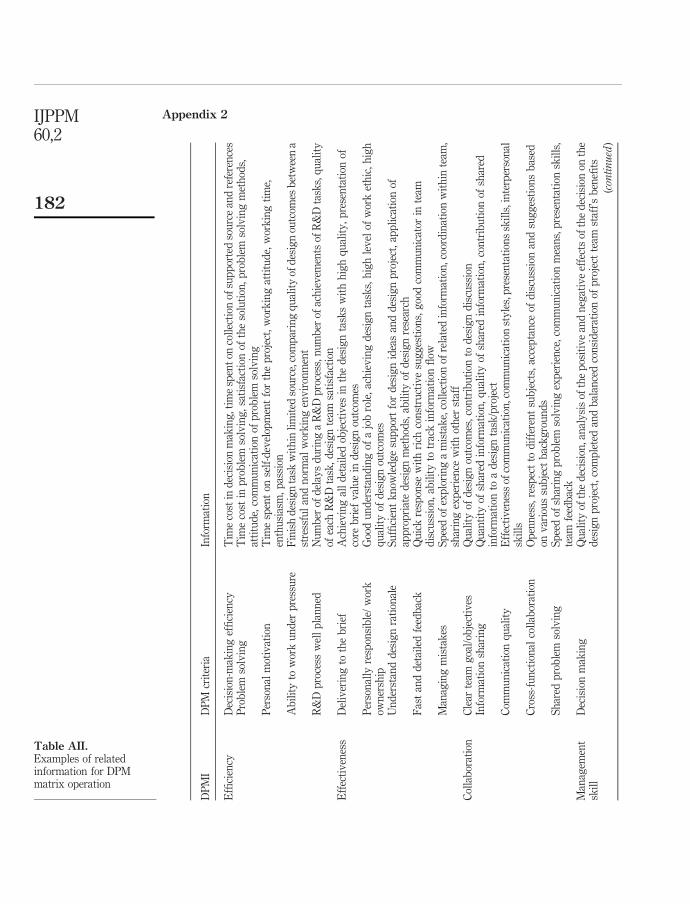
Appendix 2
DP
MI
DP
Mcr
iter
iaIn
form
atio
n
Effi
cien
cyD
ecis
ion
-mak
ing
effi
cien
cyT
ime
cost
ind
ecis
ion
mak
ing
,tim
esp
ent
onco
llec
tion
ofsu
pp
orte
dso
urc
ean
dre
fere
nce
sP
rob
lem
solv
ing
Tim
eco
stin
pro
ble
mso
lvin
g,
sati
sfac
tion
ofth
eso
luti
on,
pro
ble
mso
lvin
gm
eth
ods,
atti
tud
e,co
mm
un
icat
ion
ofp
rob
lem
solv
ing
Per
son
alm
otiv
atio
nT
ime
spen
ton
self
-dev
elop
men
tfo
rth
ep
roje
ct,
wor
kin
gat
titu
de,
wor
kin
gti
me,
enth
usi
asm
,p
assi
onA
bil
ity
tow
ork
un
der
pre
ssu
reF
inis
hd
esig
nta
skw
ith
inli
mit
edso
urc
e,co
mp
arin
gq
ual
ity
ofd
esig
nou
tcom
esb
etw
een
ast
ress
ful
and
nor
mal
wor
kin
gen
vir
onm
ent
R&
Dp
roce
ssw
ell
pla
nn
edN
um
ber
ofd
elay
sd
uri
ng
aR
&D
pro
cess
,nu
mb
erof
ach
iev
emen
tsof
R&
Dta
sks,
qu
alit
yof
each
R&
Dta
sk,
des
ign
team
sati
sfac
tion
Eff
ecti
ven
ess
Del
iver
ing
toth
eb
rief
Ach
iev
ing
all
det
aile
dob
ject
ives
inth
ed
esig
nta
sks
wit
hh
igh
qu
alit
y,
pre
sen
tati
onof
core
bri
efv
alu
ein
des
ign
outc
omes
Per
son
ally
resp
onsi
ble
/w
ork
own
ersh
ipG
ood
un
der
stan
din
gof
ajo
bro
le,
ach
iev
ing
des
ign
task
s,h
igh
lev
elof
wor
ket
hic
,h
igh
qu
alit
yof
des
ign
outc
omes
Un
der
stan
dd
esig
nra
tion
ale
Su
ffici
ent
kn
owle
dg
esu
pp
ort
for
des
ign
idea
san
dd
esig
np
roje
ct,
app
lica
tion
ofap
pro
pri
ate
des
ign
met
hod
s,ab
ilit
yof
des
ign
rese
arch
Fas
tan
dd
etai
led
feed
bac
kQ
uic
kre
spon
sew
ith
rich
con
stru
ctiv
esu
gg
esti
ons,
goo
dco
mm
un
icat
orin
team
dis
cuss
ion
,ab
ilit
yto
trac
kin
form
atio
nfl
owM
anag
ing
mis
tak
esS
pee
dof
exp
lori
ng
am
ista
ke,
coll
ecti
onof
rela
ted
info
rmat
ion
,coo
rdin
atio
nw
ith
inte
am,
shar
ing
exp
erie
nce
wit
hot
her
staf
fC
olla
bor
atio
nC
lear
team
goa
l/ob
ject
ives
Qu
alit
yof
des
ign
outc
omes
,co
ntr
ibu
tion
tod
esig
nd
iscu
ssio
nIn
form
atio
nsh
arin
gQ
uan
tity
ofsh
ared
info
rmat
ion
,q
ual
ity
ofsh
ared
info
rmat
ion
,co
ntr
ibu
tion
ofsh
ared
info
rmat
ion
toa
des
ign
task
/pro
ject
Com
mu
nic
atio
nq
ual
ity
Eff
ecti
ven
ess
ofco
mm
un
icat
ion
,com
mu
nic
atio
nst
yle
s,p
rese
nta
tion
ssk
ills
,in
terp
erso
nal
skil
lsC
ross
-fu
nct
ion
alco
llab
orat
ion
Op
enn
ess,
resp
ect
tod
iffe
ren
tsu
bje
cts,
acce
pta
nce
ofd
iscu
ssio
nan
dsu
gg
esti
ons
bas
edon
var
iou
ssu
bje
ctb
ack
gro
un
ds
Sh
ared
pro
ble
mso
lvin
gS
pee
dof
shar
ing
pro
ble
mso
lvin
gex
per
ien
ce,
com
mu
nic
atio
nm
ean
s,p
rese
nta
tion
skil
ls,
team
feed
bac
kM
anag
emen
tsk
ill
Dec
isio
nm
akin
gQ
ual
ity
ofth
ed
ecis
ion
,an
aly
sis
ofth
ep
osit
ive
and
neg
ativ
eef
fect
sof
the
dec
isio
non
the
des
ign
pro
ject
,co
mp
lete
dan
db
alan
ced
con
sid
erat
ion
ofp
roje
ctte
amst
aff’
sb
enefi
ts
(continued
)
Table AII.Examples of relatedinformation for DPMmatrix operation
IJPPM60,2
182

DP
MI
DP
Mcr
iter
iaIn
form
atio
n
Defi
ne/
full
yu
nd
erst
and
role
/san
dre
spon
sib
ilit
ies
Ab
ilit
yto
sele
ctth
eri
gh
tp
erso
nfo
rth
eri
gh
tro
le,
team
sati
sfac
tion
Bu
ild
hig
hm
oral
ew
ith
inte
amB
uil
din
gu
ple
ader
ship
ina
des
ign
team
,te
amm
otiv
atio
n,
team
hap
pin
ess
Con
flic
tm
anag
emen
tA
bil
ity
tofi
nd
pot
enti
alp
rob
lem
sin
team
man
agem
ent
and
solv
ing
itb
efor
eit
occu
rsM
onit
or/e
val
uat
ete
amp
erfo
rman
ceF
req
uen
cyof
team
eval
uat
ion
,im
pro
vem
ent
ofte
amp
erfo
rman
ceb
ased
onth
eev
alu
atio
n,
trai
nin
gd
esig
nfo
rd
esig
nst
aff
Inn
ovat
ion
Com
pet
itiv
ead
van
tag
eU
nd
erst
and
ing
ofco
mp
etit
ors,
goo
dw
ork
ing
kn
owle
dg
ean
dco
mp
arin
gn
um
ber
son
bro
chu
res
Sel
ect
the
rig
ht
crea
tiv
ity
con
cep
tto
imp
lem
enta
tion
Un
der
stan
din
gof
mar
ket
nee
ds
and
tren
d,u
nd
erst
and
ing
ofu
sers
req
uir
emen
t,fe
asib
ilit
yan
aly
sis
ofco
nce
pt
des
ign
sP
rod
uct
sle
adto
futu
reop
por
tun
itie
sN
ewn
ess
ofp
rod
uct
fun
ctio
nal
itie
s,u
niq
uen
ess
ofa
pro
du
ct
Hig
hq
ual
ity
pro
du
ctd
esig
nC
ore
val
ue
ofa
pro
du
ctd
esig
n,
shap
ed
esig
n,
fun
ctio
nal
ity
,u
ser
inte
rfac
ed
esig
n,
use
rst
ud
ies
Per
ceiv
edv
alu
eN
ewn
ess
ofa
pro
du
ctto
mar
ket
,d
iffe
ren
tiat
ion
sco
mp
arin
gw
ith
exis
ted
pro
du
cts,
pro
du
ctn
ovel
ty
Table AII.
Designperformance
measurement
183

About the authorsYuanyuan Yin is a Lecturer in Brand Management in the Winchester School of Art, University ofSouthampton. She obtained her BEng degree in industrial design in China, her MA degree indesign strategy & innovation and PhD degree in design research from Brunel University, UK.Her research has been concentrated on promoting business performance through developingbrand strategies, understanding customers and users, supporting design collaboration,improving product design, integrating design and market trends. She also has in-depthexperience working with design industries. Dr Yin is a member of the Design Research Society.Yuanyuan Yin is the corresponding author and can be contacted at: [email protected]
Sheng feng Qin is a Senior Lecturer in the School of Engineering and Design, BrunelUniversity, UK. He obtained his BSc and MSc degrees in China and his PhD degree in CAD fromthe University of Wales, UK. He was an academic visiting scholar in 1996-1997 at the Universityof Birmingham. Following this, he took a Research Assistant post in 1998 at the University ofWales Institute Cardiff and subsequently joined Loughborough University as a PostDocResearch Associate in 2000. His research interests include CAD, conceptual design, designmanagement, sketch and visual computing, interaction and interface design. Dr Qin is a memberof IEEE and Eurographics.
Ray Holland directs the Masters Design Strategy programmes at Brunel University UK;multi-disciplinary design management courses attracting students from all over the world.Personal research reflects his conviction that design can find its direction through systemsthinking and human/cultural issues. He was one of the pioneers of design management educationand assists many overseas universities to develop Masters and PhD programmes in design andbranding. He spent his early career as a company lawyer and accountant until he found his homein design. As consultant, Ray has helped to implement large computer-based informationsystems and design-led change management programmes.
IJPPM60,2
184
To purchase reprints of this article please e-mail: [email protected] visit our web site for further details: www.emeraldinsight.com/reprints