Embed Size (px)
Citation preview

ORNL/TM-2019/1454
Determination Of Stress-Free Lattice Spacing (D0) For Residual Stress Relaxation Measurement In Ni-Based Superalloys By Neutron Diffraction
Yan Chen Ke An Alexandru D. Stoica
May 11th, 2020
Approved for public release.Distribution is unlimited.

DOCUMENT AVAILABILITY
Reports produced after January 1, 1996, are generally available free via US Department of Energy (DOE) SciTech Connect. Website www.osti.gov Reports produced before January 1, 1996, may be purchased by members of the public from the following source: National Technical Information Service 5285 Port Royal Road Springfield, VA 22161 Telephone 703-605-6000 (1-800-553-6847) TDD 703-487-4639 Fax 703-605-6900 E-mail [email protected] Website http://classic.ntis.gov/ Reports are available to DOE employees, DOE contractors, Energy Technology Data Exchange representatives, and International Nuclear Information System representatives from the following source: Office of Scientific and Technical Information PO Box 62 Oak Ridge, TN 37831 Telephone 865-576-8401 Fax 865-576-5728 E-mail [email protected] Website http://www.osti.gov/contact.html
This report was prepared as an account of work sponsored by an agency of the United States Government. Neither the United States Government nor any agency thereof, nor any of their employees, makes any warranty, express or implied, or assumes any legal liability or responsibility for the accuracy, completeness, or usefulness of any information, apparatus, product, or process disclosed, or represents that its use would not infringe privately owned rights. Reference herein to any specific commercial product, process, or service by trade name, trademark, manufacturer, or otherwise, does not necessarily constitute or imply its endorsement, recommendation, or favoring by the United States Government or any agency thereof. The views and opinions of authors expressed herein do not necessarily state or reflect those of the United States Government or any agency thereof.

ORNL/TM-2019/1454
Neutron Scattering Division
DETERMINATION OF STRESS-FREE LATTICE SPACING (D0) FOR RESIDUAL
STRESS RELAXATION MEASUREMENT IN NI-BASED SUPERALLOYS BY
NEUTRON DIFFRACTION
Yan Chen, Ke An, Alexandru D. Stoica
May 11th, 2020
Prepared by
OAK RIDGE NATIONAL LABORATORY
Oak Ridge, TN 37831-6283
managed by
UT-BATTELLE, LLC
for the
US DEPARTMENT OF ENERGY
under contract DE-AC05-00OR22725


iii
CONTENTS
LIST OF FIGURES ...................................................................................................................................... v LIST OF TABLES ...................................................................................................................................... vii ACRONYMS ............................................................................................................................................... ix PREFACE .................................................................................................................................................... xi ACKNOWLEDGMENTS ......................................................................................................................... xiii 1. INTRODUCTION ................................................................................................................................ 1
1.1 LATTICE STRAIN MEASUREMENTS BY TIME-OF-FLIGHT NEUTRON
DIFFRACTION .......................................................................................................................... 1 1.2 STRESS CALCULATION FROM THE MEASURED LATTICE STRAINS .......................... 2 1.3 STRESS-FREE LATTICE SPACING D0,HKL FOR RESIDUAL STRESS
CALCULATION ........................................................................................................................ 2 2. EXPERIMENTS ................................................................................................................................... 3
2.1 EXPERIMENTAL BASICS ON VULCAN ............................................................................... 3 2.2 SAMPLES................................................................................................................................... 4 2.3 MEASUREMENT OF STRESS-FREE LATTICE SPACING D0 ............................................. 4 2.4 THE IN-SITU SETUP FOR RESIDUAL STRESS RELAXATION MEASUREMENTS ........ 5
3. RESULTS ............................................................................................................................................. 7 3.1 SELECTION OF D0,311 FOR RESIDUAL STRESS MAPPING AT ROOM
TEMPERATURE ....................................................................................................................... 7 3.2 DETERMINATION OF DYNAMIC D0,311 VALUES FOR IN-SITU STRAIN
CALCULATION DURING THE RESIDUAL STRESS RELAXATION AT HIGH
TEMPERATURE ....................................................................................................................... 8 3.3 THE EFFECT OF D0 ON IN-SITU RESIDUAL STRAIN CALCULATION ......................... 11
4. SUMMARY ........................................................................................................................................ 15 5. REFERENCES ................................................................................................................................... 17

v
LIST OF FIGURES
Figure 1. Schematic illustration of the bead-on-plate experimental set-up on VULCAN (top view,
not to scale). ..................................................................................................................................... 3 Figure 2. Schematic view of measurement locations of residual stress and d0. ............................................ 4 Figure 3. Locations of the d0 measurement. .................................................................................................. 5 Figure 4. The in-situ residual stress relaxation setup on VULCAN. ............................................................ 6 Figure 5. The measured d0 values of (311) peak at different locations at the specimens. ............................ 8 Figure 6. Temperature readings of the two thermocouples (TC) at the 1H sample front surface and
bottom surface, respectively, during the in-situ residual stress relaxation....................................... 9 Figure 7. The lattice thermal strains by (311) peak during cooling down from 719.5°C to room
temperature in selected samples ..................................................................................................... 10 Figure 8. Dynamic stress-free lattice spacing in Alloy 718 at high temperature. ....................................... 11 Figure 9. Comparison of the calculated lattice strains using constant d0 and dynamic d0 during in-
situ residual stress relaxation in the four cut samples. ................................................................... 12


vii
LIST OF TABLES
Table 1. Sample list of the Ni-based Alloy 718 supper alloy investigated by neutron diffraction. .............. 4 Table 2. Thermal expansion of specimens from room temperature (RT) to 719.5°C ................................. 10


ix
ACRONYMS
LD Longitudinal direction
ND Normal direction
ORNL Oak Ridge National Laboratory
RT Room temperature
SNS Spallation Neutron Source
TC Thermocouple
TD Transverse direction
TOF Time-of-flight


xi
PREFACE
The residual stress and its relaxation in critical engineering components are key to structural materials
reliability. The determination of residual stress in bulk engineering structures like Ni-based superalloys
can be conducted by measuring the lattice strain with penetrating neutron diffraction. The state-of-the-art
engineering diffraction beamline VULCAN at the Oak Ridge National Laboratory (ORNL) Spallation
Neutron Source (SNS) provides the critical capability to evaluate the residual strain/stress relaxation in
engineering component thanks to the high flux and event data features. By the means of residual
stress/strain calculation, it is critical to accurately determine the stress-free lattice spacing d0, which can
be altered by the change of chemistry, unrelieved stress, and measurement scheme. Here we reported d0
determination for determining residual stress relaxation and distribution in Alloy 718 superalloys after
different quenching treatments. Selection of locations for d0 measurement was discussed by considering
the neutron path, attenuation and sample alignment. A dynamic d0 that resulted from atom diffusion and
chemistry change was estimated as function of time for the in-situ relaxation characterization. It
demonstrated how the dynamic d0 values may influence on the strain calculation in different thermally
treated samples. The results highlight the importance of dynamic d0 for in-situ relaxation involving
chemical changes and provide guidance to the dynamic d0 measurement and simulation.


xiii
ACKNOWLEDGMENTS
This research used the Spallation Neutron Source at the Oak Ridge National Laboratory, which is a DOE
Office of Science User Facility. We thank Harley Skorpenske and Matt Frost for their technical support of
neutron experiment.

1
1. INTRODUCTION
1.1 LATTICE STRAIN MEASUREMENTS BY TIME-OF-FLIGHT NEUTRON
DIFFRACTION
Lattice strain due to residual applied stress can be measured by diffraction technique. The benefit of
neutron’s deep penetration into materials allows lattice strain measurement inside an engineering structure
while it either contains residual stress or under applied stress. Below are fundamentals of the technique by
using time of flight neutron source such as the Spallation Neutron Source at Oak Ridge National
Laboratory. Further details can be found in the book by M.T. Hutchings et al [1].
The principle of strain measurements by neutron diffraction is based on Bragg’s law,
𝜆 = 2𝑑ℎ𝑘𝑙 𝑠𝑖𝑛 𝜃𝐵 (1)
where λ is the neutron wavelength, 𝑑ℎ𝑘𝑙 the interplanar spacing of the (hkl) family of lattice planes, and
2𝜃𝐵 the angle between the incident and diffracted neutron beams. For time-of-flight (TOF) neutrons with
a wide energy range, according to de Brogile’s law, the detected neutron wavelength is determined from
its TOF (t),
𝜆 =ℎ
𝑚𝑣=
ℎ
𝑚𝐿𝑡 (2)
where h is Planck’s constant, m the neutron mass, v the neutron velocity and L the flight path from the
moderator to the detector. Thus, in a TOF spectrum of a material, the d-spacing is obtained from the
position thkl of the Bragg peak,
𝑑ℎ𝑘𝑙 =ℎ
2𝑚𝐿𝑠𝑖𝑛 𝜃𝐵𝑡ℎ𝑘𝑙 (3)
When the material is subjected to an applied stress, the diffraction peak will shift to a different time, and
hence d-spacing (dhkl). From the change in peak position, the (hkl)-specific lattice strain can be
determined as
𝜀ℎ𝑘𝑙 =𝑑ℎ𝑘𝑙−𝑑0,ℎ𝑘𝑙
𝑑0,ℎ𝑘𝑙 (4)
where d0,hkl is the stress-free lattice spacing. Thus, the interplanar spacing (dhkl) constitutes an intrinsic
strain gauge for the material.
The measured lattice strain represents the component of the strain tensor along the direction of the
momentum transfer Q, which bisects the incident and diffracted beams. A complete definition of the
strain tensor requires measuring at least six non-coplanar directions. In the simplified case with a given
orthogonal coordinate system (not necessary to correspond to the principal axes), measuring the three
normal lattice strains is sufficient to determine the three normal stress components, regardless of the
measurement of the shear components.

2
1.2 STRESS CALCULATION FROM THE MEASURED LATTICE STRAINS
As an analog of Hooke’s law, the stress tensor (σij) (normal stresses) can be calculated from the strain
tensor (εij),
𝜎𝑖𝑗 =𝐸ℎ𝑘𝑙
(1+𝜈ℎ𝑘𝑙){𝜀𝑖𝑗
ℎ𝑘𝑙 +𝜈ℎ𝑘𝑙
(1−2𝜈ℎ𝑘𝑙)(𝜀11
ℎ𝑘𝑙 + 𝜀22ℎ𝑘𝑙 + 𝜀33
ℎ𝑘𝑙)} (5)
where i,j=1,2,3 indicate the components relative to three orthogonal axes. Eq. (5) indicates that any three
orthogonal stress components can be determined from the corresponding orthogonal strain components.
𝐸ℎ𝑘𝑙 and 𝜈ℎ𝑘𝑙 are “diffraction elastic constants”. They are linear calibration constants which relate the
macroscopic stress in the sample to the lattice strains for a given crystallographic [hkl] direction. The
diffraction elastic constants can be measured from calibration experiments in which a polycrystalline
sample is subjected to known uniaxial loading. Eq. (5) can be simplified with a known symmetry of
residual stress/strain state, which is used for the experiment summarized here during in-situ residual stress
relaxation.
1.3 STRESS-FREE LATTICE SPACING D0,HKL FOR RESIDUAL STRESS CALCULATION
A correct choice of stress-free lattice spacing d0,hkl is of importance to accurately determine the lattice
strain (Eq. (4)) and thus the residual stress. In stable and homogeneous samples, a constant d0,hkl is used,
and its measurement is straightforward. There are some approaches that are widely used to prepare the
stress-free sample. One concept is to reduce sample dimensions so that the macro stress cannot be built
up. For examples, grinding the sample into fine powders; cutting out a small volume from the sample,
which usually matches the neutron gauge volume; and, comb-cutting the sample to have small portions
with at least two dimensions reduced. In addition, if sample destruction is avoided, the location near the
sample corner can be considered as a stress-free sample. Another concept is to relieve the residual stress
in the original sample, and a full annealing is typically used. It is still worth noting that the stress
mentioned is in macro scale, which is usually considered in engineering applications. The stress and strain
in micro scale may not be fully eliminated in those stress-free samples, for example, local stress/strain
near a dislocation within a crystallite. The micro stress is usually out of the scope of residual stress
measurement for engineering applications, and it is also hard to quantify via the diffraction approach.
In chemically inhomogeneous samples, such as weldment, nearly all aluminum alloys and additive-
manufactured samples, the lattice spacing at stress-free states could be location-specific. A chemistry- and
geometry-identical sample that has stress relieved (d0 sample) is recommended to measure d0,hkl at the
desired locations. The d0 sample can be comb-cut to relieve the residual stress. An appropriate annealing
may be chosen only if the chemistry does not change during the high temperature treatment. In some
special case, the measurement of d0 can be waived if an additional constraint of stress or strain is applied
to Eq. (5), and therefore, the preparation of stress-free sample is not required. Taking a thin-wall sample
as an example, the plane-stress approximation can be applied, so that the stress at normal direction (along
the thickness) is zero, i.e. σyy = 0. Applying this constraint, one will calculate the other normal stress
components in Eq. (5) without an input of d0 value [2].
For the in-situ residual stress/strain relaxation measurement in this study, the chemistry of the sample is
changing over annealing time during the isothermal dwell at the high temperature. As the stress-free
lattice spacing is also expected to evolve with the chemistry, a static d0,hkl will not be applicable for in-situ
measurement. The dynamic d0,hkl values thus need to be determined, however, attentions were seldom
paid to this correction [3]. In this study, we will demonstrate a simple model to estimate the dynamic d0,hkl
in Ni-base superalloy due to atom diffusion and chemical changes at high temperature, and indicated the
d0 effects on the lattice strain calculation during the relaxation.

3
2. EXPERIMENTS
2.1 EXPERIMENTAL BASICS ON VULCAN
The lattice strain measurement was done at the VULCAN engineering materials diffractometer at the
Spallation Neutron Source, the Oak Ridge National Lab [4,5]. The schematic of the instrument layout and
residual stress setup is shown in Figure 1, where a small volume in red is determined by the incident slit
and the receiving collimators. Two lattice d-spacings are measured (in Q1 and Q2) into the ±90° banks.
The third direction Q3 (normal to the paper) is measured after rotating the sample 90° along the Q2
direction. Three strain components in Q1, Q2 and Q3 direction are needed for residual stress calculations.
The incident silts and receiving collimators are used to define the neutron gauge volume. With
consideration of significant attenuation in the large bulk sample, a large gauge volume was used to
improve the statistics in the in-situ relaxation measurement, i.e. 5×5 mm2 incident slits opening along
with 5 mm receiving collimators. In the static measurement of d0 and residual stress map, the vertical
opening of incident slit was slightly reduced to 4 mm (5×5×4 mm3 gauge volume) in order to improve the
spatial resolution along Z direction and increase the number of data points in the map. The Ni (311) peak
which is the least affected by intergranular stress is used to determine the strain in the bulk. The chopper
setting of 60 Hz with a band center 0.19 nm was used, and the counting time for each measurement was
determined based on the collected intensity. For in-situ measurement, neutrons were collected
continuously and then sliced based on good statistics to yield a small fitting statistics error. The data is
analyzed by single peak fit using the VDRIVE software [6].
Figure 1. Schematic illustration of the bead-on-plate experimental set-up on VULCAN (top view, not to
scale). The -90° and +90° detector banks record diffraction peaks of the (hkl) lattice planes whose normals are
parallel to Q1 and Q2, respectively. Strain components along these two directions are measured simultaneously. The
bead-on-plate sample is positioned on top of the sample stage and aligned at 45° from the incident beam. (cited from
[7]).

4
2.2 SAMPLES
Commercial Alloy 718 samples are prepared in this study, and the list of samples selected for the
investigation is shown in Table 1. All the samples (76×27×27 mm3) were quenched from solid solution
treatment above δ phase solvus temperature by either dropping to water or oil. After quenching, a typical
double precipitation ageing treatment was carried out as 8 hours isothermal dwell at 718°C, then furnace
cool to 621°C for another 8 hours dwell, and finally air cool to room temperature. Sample 1H and 2HOQ
are a pair which were quenched by water and oil, respectively. Sample 1HWQAGE and 1HOQAGE are a
pair which were double aged after quenched by water and oil, respectively. All samples were cut from 76
mm long bars for contour residual stress measurements by the other vendor. The longer part (44×27×27
mm3) of each sample was selected for the in-situ residual strain relaxation measurements by annealing,
and the residual strains before and after residual stress relaxation were investigated as well. The
calculation of residual stress relaxation and mapping will be reported elsewhere.
Table 1. Sample list of the Ni-based Alloy 718 supper alloy investigated by neutron diffraction.
Sample Quench Age
1H Water No
2HOQ Oil No
1HWQAGE Water Yes
1HOQAGE Oil Yes
2.3 MEASUREMENT OF STRESS-FREE LATTICE SPACING D0
To perform the in-situ residual stress relaxation, the location of peak residual stress inside the samples
was selected. The location is determined by initial residual stress distributions measurement along
selected lines (the details of the result will be reported elsewhere). The locations of residual stress before
and after residual stress relaxation in the provided samples are shown in Figure 2. Considering the
symmetry of the residual stress distribution, it is rational to assume the stress/strain components along X
(normal direction or ND) and Z (transverse direction or TD) directions are same at the center lines along Y
(longitudinal direction or LD) direction, and the distributions of residual stress along ND and TD are
same.
Figure 2. Schematic view of measurement locations of residual stress and d0. The green cube indicates the
neutron gauge (5×5×4 mm3) volume at d0 measurement.

5
To determine the d0 values of each sample at room temperature, the lattice spacing at selected locations
were measured and compared. During the quenching, the residual stress built up due to the uneven
cooling rate through the bulk (e.g. fast near outside). At the location near a corner of the sample bar, the
stresses near surface are close to 0 because no constraints in the three directions and the cooling rate is
relative uniform thanks to the relatively small volume at the corners. We took that kind of locations as a
stress-free sample for each measured bar. The choice of the four corners is shown in Figure 3. The center
of the gauge volume was about 4 mm in from the sample surfaces nearby. Due to the sample geometry,
the neutron paths were different from one to other. Therefore, the neutron attenuation occurred when the
diffracted beam went through the sample (dashed arrow in Figure 3). The diffracted beams at Location A
and B are free of attenuation, while there is attenuation at the LD direction for Location C and D by using
the detector Bank 1. Additionally, since the samples were layered on the others at the d0 measurement, the
neutron paths and attenuations were slightly different in the top and the bottom samples at the out-of-
plane directions due to using the wide-area detectors. In addition to utilizing the sample corners, a 3×3×3
mm3 cube was cut out from the center of the cutting surface of selected samples, shown as Location E in
Figure 3 (Right). The measured d0 values via different locations were compared.
Figure 3. Locations of the d0 measurement. The red arrows show the examples of the neutron paths, and the
dashed line shows the occurrence of neutron beam attenuation.
Special cautions are taken for calculating the stress-free d0 at the elevated temperature. At the elevated
temperature, the d0 is calculated by compensating the change of lattice parameter due to thermal
expansion. Considering the possible temperature difference at center and corner (corner temperature
could be slightly lower due to heat loss), the uniform change of lattice parameter due to heating from
room to the elevated temperature is measured at the measurement location (Point M in Figure 2 (Right))
during in-situ residual stress relaxation. The measurement was carried out on 2HOQ, 1HOQAGE and
1HWQAGE samples. The d0 calculated above is the value at the end of the isothermal dwell. The
dynamic values during the dwell were estimated by using a simple math model that was validated with
the reported experimental data of d0 evolution.
2.4 THE IN-SITU SETUP FOR RESIDUAL STRESS RELAXATION MEASUREMENTS
The sample bar was held in the VULCAN MTS loadframe with a slight compressive stress of -0.3 MPa
by two alumina grips, and an induction coil was used to rapidly heat up the sample bar. It was difficult to
directly measure the internal temperature at the neutron gauge volume in such a bulk sample. Two
thermocouples were applied to monitor two surface temperatures at the measurement location. The one at
the front surface was used to control its temperature reading at 719.5°C during the in-situ relaxation. The
other one at the bottom surface was for monitoring purpose. The setup is shown in Figure 4. A 5×5×5
mm3 gauge volume was used during the relaxation measurement. The -90° and +90° detector banks
recorded diffraction peaks in real time along the LD and ND directions, respectively. The orthogonal

6
lattice strain components were calculated correspondingly. With the symmetry assumption, the three
orthogonal stress components were calculated and reported elsewhere.
Figure 4. The in-situ residual stress relaxation setup on VULCAN. (TC is abbreviation of thermocouple).

7
3. RESULTS
3.1 SELECTION OF D0,311 FOR RESIDUAL STRESS MAPPING AT ROOM TEMPERATURE
The d0,311 values which were measured at different locations by both detector banks are shown in Figure
5. Some of the values have significant discrepancy between each other, which may be contributed by
multiple reasons. First, the neutron path and attenuation show influence of d0,311 measurement. As shown
in Figure 3, the attenuation of the diffracted beam occurred at LD direction of Location C and D. As one
can see in Figure 5, the measured d0,311 values show larger discrepancies at Location C and D along LD.
In contrast, the values at Location A and B along LD, and at Location A, B, C and D along ND/TD,
which are less affected by neuron attenuation, are more consistent. Therefore, the discrepancy exhibits
correlations to the neutron path. Theoretically, the attenuation would not shift the d-spacing, but it may
influence the measurement indirectly. For examples, low statistics increasing the fitting error, and severe
shadowing on the wide detector bank altering the detector alignment. A comprehensive study on the
attenuation is out of the scope of this document. It is rational to exclude the measurement points where
the neutron paths are significantly different (Location C and D of all samples, and the Location A or B of
a sample which was layered at the top or bottom during the measurement), in order to minimize the
influence. Second, unexpected inhomogeneous chemistry and composition in the sample can shift the
lattice d-spacing. It may be one of the reasons for the small fluctuation of d0,311 values at various
locations. However, it is costly and not worthwhile to figure out the spatial dependence of d0,311 since the
fluctuation is not significant and not intentionally designed. Doing average of those selected is an
appropriate approach. Third, differences are observed between the values along LD (using detector bank
1) and along ND/TD (using detector bank 2). It can be caused by the slight misalignment between those
two banks. It can also be resulted from the fact that the stresses were not fully relieved at those locations
near the corner. In particular, the complex phase compositions in Alloy 718 superalloy may hold
complementary interphase stresses while showing a balance at the macro scale. Nevertheless, those
measured d-spacing values are the best approximation of those at the stress-free state. Using the bank-
specific (direction-specific as well) d0 value for the subsequent calculation will thus not to add up the
error due to the bank (and directional) discrepancy. The absolute strain/stress values that are calculated by
using them may show slight shift from the true values, but it will reflect the same trend in the mapping
and in-situ relaxation.
Therefore, to minimize the influence discussed as above at the determination of d0,311, the data points
marked with “∇” in Figure 5were used and averaged for d0,311 of each specimen. The d0,311 values
measured at Location E that was a small cube cut from the specimens are also compared in Figure 5. The
observed inconsistency may be attributed to the chemistry/composition discrepancy and/or the sample
alignment. Because the 3×3×3 mm3 cube dimension is small, a rocking curve was scanned and fitted with
Gaussian function to determine the sample position, which was different from the visual alignment the
sample corners via the camera. The TOF neutron diffraction is sensitive to the sample position, and thus
even small displacement from the beam center may affect the measured d0 value. With considerations
above and the comparison in Figure 5, the value measured at Location E was not used to calculate d0,311.
In Figure 5 the d0,311 values of different samples are compared. The values of 1H and 2HOQ specimens
before relaxation are significantly larger than those of aged specimens and the values of relaxed
specimens, which indicates the change of chemical composition or phase composition in response to the
thermal treatment history and the relaxation in this work. In addition, the measured d0,311 values along LD
and ND/TD are consistent in all the specimens except in 1HOQAGE and 1HWQAGE after relaxation. In
those two specimens, d0,311 is measured to be larger at LD than at ND/TD.

8
Figure 5. The measured d0 values of (311) peak at different locations at the specimens. The solid bars show the
measurement at LD while the strip bars show the measurement at ND/TD. The colors show indicate the locations of
measurement, and the location symbols coresspond to those in Figure 3. The values with ∇ mark are used to
determine d0,311.
3.2 DETERMINATION OF DYNAMIC D0,311 VALUES FOR IN-SITU STRAIN
CALCULATION DURING THE RESIDUAL STRESS RELAXATION AT HIGH
TEMPERATURE
The induction heating coil was used for in-situ relaxation, as shown in Figure 4. Under the
electromagnetic field, the top and the bottom surfaces of the sample acted as the heat source. There was
not a heat sink in the internal bulk. The heat mainly transported to the air through the other sample
surfaces while some was dissipated via radiation. As the alloy is a good thermal conductor, the neutron
gauge volume inside the bulk is expected to quickly reach the steady state. Therefore, in the XZ-cross-
section including M point, the center of bottom (or top) surface and the center of front (or back) surface
are the two extremes of the temperature distribution near the neutron gauge volume, which are measured
by the two thermocouples, respectively. In Figure 6, the temperature readings of the two thermocouples
during relaxation are shown, taking 1H sample as an example. The reading at the front surface was close
to the set point 719.5°C during the relaxation. The reading at the bottom surface was about 723.5°C at the
beginning. Then it decreased to about 722°C within 2 hours and maintained at this temperature as a
steady state. The max difference between the two readings were smaller than 4°C. Assuming the
coefficient of thermal expansion of Ni superalloy is typically about 15×10-6 °C-1, the temperature
fluctuation would bring a thermal strain variation about 60×10-6. It is negligible compared to the lattice
strain change due to the relaxation, as what will be discussed in the following. Therefore, the temperature
reading 719.5°C at the front surface will be used as the nominal temperature.
The stress-free lattice spacing at high temperature was calculated using the value at room temperature
measured as above and considering the lattice thermal expansion. The thermal expansion was measured
from the cooling curves of lattice spacing at the measurement point (Point M in Figure 2) after the in-situ
relaxation. After the longtime of annealing, the material trended to the equilibrium, and further chemical
change that may alter the lattice spacing unlikely occurred at cooling. Therefore, the lattice spacing
changes before and after cooling are caused by the real thermal expansion. Figure 7 shows the evolution
of thermal strains (calculated using (311) lattice spacing) at 2HOQ, 1HOQAGE and 1HWQAGE samples

9
during cooling. The curves exhibit highly similar trend in all sample along both of LD and ND (by
detector Bank 1 and detector Bank 2, respectively). When the data of the three samples are plotted in the
same figure (taking LD data as the example), the thermal expansions are highly overlapped. Therefore,
the pre-treatments did not significantly alter the thermal expansion behavior of the superalloy samples. A
single thermal expansion value will be calculated and applied to all samples. The results were calculated
as listed in Table 2. Quantitatively, those values are highly consistent for all the measured samples. The
average thermal expansion of 1.158% is used to calculate d0,311 at 719.5°C from the d0,311 measured at RT
for all samples along both LD and ND. Apparently, this stress-free d0,311 values are applicable to the end
of the annealing (denoted as 𝑑0,311𝑒 ), and their dynamic changes during annealing will subsequently be
estimated in the following.
Figure 6. Temperature readings of the two thermocouples (TC) at the 1H sample front surface and bottom
surface, respectively, during the in-situ residual stress relaxation.
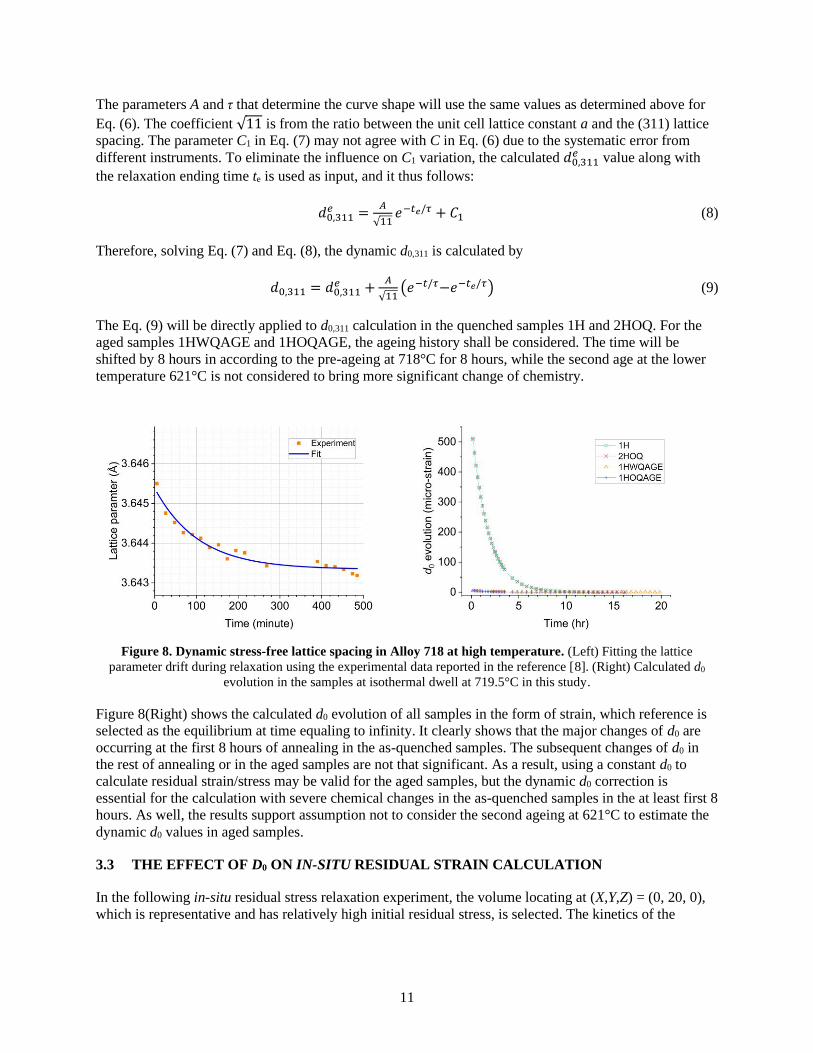
The lattice parameter drift due to the chemistry changes during the isothermal dwell at 719.5°C is
determined phenomenologically. The time dependence is assumed to obey the function as the following.
𝑑0 = 𝐴𝑒−𝑡/𝜏 + 𝐶 (6)
where d0 is the stress-free d-spacing in Å, t is the time of dwell in minute, and A, τ and C are the
coefficients to be determined.
In the reference [8], it is reported that the lattice parameter of Alloy 718 superalloy evolves during stress-
free ageing at 720°C. The experimental data are well fit with the Eq. (6), shown in Figure 8(Left), and the
coefficients are determined as A = 0.00204 Å, τ = 104.802 min and C = 3.64334 Å for the lattice
constant. The sample and the isothermal dwell condition in this study is highly similar with those in the

10
reference [8], and therefore, the above determined parameters will be used to estimate the d0 drift of (311)
peak during the in-situ relaxation. The time dependence is
𝑑0,311 =𝐴
√11𝑒−𝑡/𝜏 + 𝐶1 (7)
Figure 7. The lattice thermal strains by (311) peak during cooling down from 719.5°C to room temperature in
selected samples
Table 2. Thermal expansion of specimens from room temperature (RT) to 719.5°C
Specimen
𝒅𝟎,𝟑𝟏𝟏(𝟕𝟏𝟗. 𝟓°𝑪) − 𝒅𝟎,𝟑𝟏𝟏(𝑹𝑻)
𝒅𝟎,𝟑𝟏𝟏(𝑹𝑻)
Detector Bank 1 Detector Bank 2
2HOQ 0.01171 0.01159
1HWQAGE 0.01168 0.01146
1HOQAGE 0.01162 0.01140
Average 0.01158
11
The parameters A and τ that determine the curve shape will use the same values as determined above for
Eq. (6). The coefficient √11 is from the ratio between the unit cell lattice constant a and the (311) lattice
spacing. The parameter C1 in Eq. (7) may not agree with C in Eq. (6) due to the systematic error from
different instruments. To eliminate the influence on C1 variation, the calculated 𝑑0,311𝑒 value along with
the relaxation ending time te is used as input, and it thus follows:
𝑑0,311𝑒 =
𝐴
√11𝑒−𝑡𝑒/𝜏 + 𝐶1 (8)
Therefore, solving Eq. (7) and Eq. (8), the dynamic d0,311 is calculated by
𝑑0,311 = 𝑑0,311𝑒 +
𝐴
√11(𝑒−𝑡/𝜏−𝑒−𝑡𝑒/𝜏) (9)
The Eq. (9) will be directly applied to d0,311 calculation in the quenched samples 1H and 2HOQ. For the
aged samples 1HWQAGE and 1HOQAGE, the ageing history shall be considered. The time will be
shifted by 8 hours in according to the pre-ageing at 718°C for 8 hours, while the second age at the lower
temperature 621°C is not considered to bring more significant change of chemistry.
Figure 8. Dynamic stress-free lattice spacing in Alloy 718 at high temperature. (Left) Fitting the lattice
parameter drift during relaxation using the experimental data reported in the reference [8]. (Right) Calculated d0
evolution in the samples at isothermal dwell at 719.5°C in this study.
Figure 8(Right) shows the calculated d0 evolution of all samples in the form of strain, which reference is
selected as the equilibrium at time equaling to infinity. It clearly shows that the major changes of d0 are
occurring at the first 8 hours of annealing in the as-quenched samples. The subsequent changes of d0 in
the rest of annealing or in the aged samples are not that significant. As a result, using a constant d0 to
calculate residual strain/stress may be valid for the aged samples, but the dynamic d0 correction is
essential for the calculation with severe chemical changes in the as-quenched samples in the at least first 8
hours. As well, the results support assumption not to consider the second ageing at 621°C to estimate the
dynamic d0 values in aged samples.
3.3 THE EFFECT OF D0 ON IN-SITU RESIDUAL STRAIN CALCULATION
In the following in-situ residual stress relaxation experiment, the volume locating at (X,Y,Z) = (0, 20, 0),
which is representative and has relatively high initial residual stress, is selected. The kinetics of the

12
residual strain relaxation along LD and ND at 719.5°C were plot in Figure 9. The strains calculated using
constant 𝑑0,311𝑒 and dynamic d0,311 are plotted in the same figure for comparison.
Figure 9. Comparison of the calculated lattice strains using constant d0 and dynamic d0 during in-situ residual
stress relaxation in the four cut samples.
As what are visualized in Figure 9, the effect on dynamic d0,311 agrees with the prediction from Figure 8
(Right). With the correction of dynamic d0,311, the calculated strains along both LD and ND are
significantly reduced at the first 8 hours of annealing in as-quenched samples 1H and 2HOQ, in
comparison to the results with static d0,311. Particularly, the reduction is severe at the first 3 hours. It is
interesting that the strains along ND show a similar trend with those along LD while with lower
magnitude if calculated with constant 𝑑0,311𝑒 ; in contrast, with dynamic d0,311 correction, the change of ND
strains is compensated, and they show nearly no change, close to zero. After 8 hours, the difference of
strains with static and dynamic d0,311 becomes subtle. In the aged samples 1HWQAGE and 1HOQAGE,
there is almost no difference in either LD strain or ND strain with dynamic d0,311 correction, except slight
decreases at the beginning of annealing.
Based on the results with dynamic d0 in Figure 9, in the 1H and 2HOQ samples, which are without
ageing, the residual strains along LD rapidly decrease in the first 2 hours, and a large magnitude of
residual strains are released in this period. In the subsequent 10+ hours, although the relaxation continues,
the rate becomes much lower. After the 14-16 hours relaxation, the system still did not reach the
equilibrium, but the changes were slowed down significantly. In contrast, the ageing process changes the

13
relaxation behaviors. In 1HWQAGE and 1HOQAGE samples, the residual strains do not quickly reduce.
Especially in 1HOQAGE, which is oil-quenched and aged, the residual strains changed little at the
beginning, and the significant relaxation seems to start after 2 hours dwell at 719.5°C.
As for result of the relaxation at 719.5°C for 14-20 h, the residual strains have been significantly relieved
along LD. The quenched samples 1H and 2HOQ kept nearly zero strain along ND throughout the
relaxation process. The aged samples 1HWQAGE and 1HOQAGE have slightly higher strains along ND
at the beginning and gradually reduced towards zero at the annealing. The residual stresses of all samples
would exhibit similar trends, and the calculated results will be reported elsewhere.


15
4. SUMMARY
Using the engineering diffractometer at the high flux spallation neutron source as a great tool for
characterizing the residual stress/strain relaxation in structural material, we demonstrated that the
determination of dynamic d0 at high temperature implemented in this practice is proved feasible. The
neutron path, attenuation and sample alignment need to be considered for choosing location for the d0
measurement of bulk sample at room temperature. The stress-free lattice spacing d0 at high temperature
can be reasonably calculated from the room temperature measurement by compensating the thermal
expansion that was characterized via in-situ neutron diffraction. The d0 evolution during annealing at high
temperature due to interphase atom diffusion and chemistry change was found to impact the residual
strain calculation significantly. The dynamic d0 values as a function of time were estimated via a simple
empirical model and fitting to experimental data. The influence deviated with different previous thermal
treatments. The results provide important guideline of consideration for the stress relaxation
characteristics of the superalloy samples, which provides essential benchmark for finite element modeling
of the process.


17
5. REFERENCES
1. M.T. Hutchings, Introduction to the Characterization of Residual Stress by Neutron Diffraction,
Taylor & Francis Group, 2005.
2. K. An, L. Yuan, L. Dial, I. Spinelli, A.D. Stoica and Y.F. Gao, Neutron Residual Stress Measurement
and Numerical Modeling in A Curved Thin-Walled Structure by Laser Powder Bed Fusion Additive
Manufacturing, Materials and Design, 135, 122–132, 2017.
3. P.E. Aba-Perea, T. Pirling and M. Preuss, In-situ Residual Stress Analysis during Annealing
Treatments Using Neutron Diffraction in Combination with A Novel Furnace Design, Materials and
Design, 110, 925–931, 2016.
4. K. An, H.D. Skorpenske, A.D. Stoica, D. Ma, X.L. Wang and E. Cakmak, First in situ Lattice Strains
Measurements under Load at VULCAN, Metallurgical and Materials Transactions A, 42, 1, 95–99,
2011.
5. K An, Y. Chen and A.D. Stoica, VULCAN: A “Hammer” for High-Temperature Materials Research,
MRS Bulletin, 44, 11, 878–885, 2019.
6. K. An, VDRIVE – Data Reduction and Interactive Visualization Software for Event Mode Neutron
Diffraction, ORNL Report, ORNL-TM-2012-621, Oak Ridge National Laboratory, 2012.
7. K. An, D.A. McClintock and M. J. Frost, Residual Stress Measurements of Front Window Welds in
A Prototypical Spallation Neutron Source Target Module, ORNL Report, ORNL-TM-2018-837, Oak
Ridge National Laboratory, 2018.
8. H. Qin, Z. Bi, D. Li, R. Zhang, T.L. Lee, G. Feng, H. Dong, J. Du and J. Zhang, Study of
Precipitation-Assisted Stress Relaxation and Creep Behavior during the Ageing of A Nickel-Iron
Superalloy”, Materials Science and Engineering A, 742, 493–500, 2019.


![The Lattice Spacing Variability of Intrinsic Float-Zone Silicon · Measurement Laboratory [MML]). From 1998 to 2011, the NIST lattice comparator played an important role in the International](https://img.dokumen.tips/doc/110x75/5ac77d887f8b9a40728bedce/the-lattice-spacing-variability-of-intrinsic-float-zone-silicon-laboratory-mml.jpg)