Embed Size (px)
Citation preview
Sains Malaysiana 40(10)(2011): 1153–1163
Determination of Lead(II), Cadmium(II) and Copper(II) in Waste-Water and Soil Extracts on Mercury Film Screen-Printed Carbon Electrodes Sensor
(Penentuan Plumbum(II), Kadmium(II) dan Kuprum(II) dalam Air-buangan dan Ekstrak Tanah dengan Sensor Skrin Bercetak Terubah Suai Karbon Filem Raksa)
MOHD FAIRULNIZAL MD NOH* & IBTISAM E. TOTHILL
ABSTRACT
A sensor incorporating a three electrodes configuration have been fabricated using low cost screen-printing technology. These electrodes couples with Square Wave Stripping Voltammetry (SWSV) has provided a convenient screening tool for on-site detection of trace levels of Pb(II), Cd(II) and Cu(II). Modification of the graphite carbon surface based on in situ deposition of mercury film has been carried out. By appropriate choice of supporting medium and optimized parameters setting such as amount of mercury used the deposition potential, deposition time, frequency and scan rate, well resolved and reproducible response for Pb(II), Cd(II) and Cu(II) were obtained. The performance characteristics of the developed mercury film screen printed carbon electrode (MFSPCE) for 120 s deposition time showed that the linear range for Cd(II), Pb(II) and Cu(II) were 10 to 200 µg L-1. The detection limit recorded for Cd(II), Pb(II) and Cu(II) were 2, 1 and 5 µg L-1 with relative standard deviation (RSD) of 6.5%, 6.9% and 7.5%, respectively. Successful applications of the sensing device to waste-water and extracted soil samples were demonstrated.
Keywords: Mercury film screen-printed carbon electrode; soil extract; Square Wave Stripping Voltammetry; waste water
ABSTRAK
Suatu sensor yang terdiri daripada tiga konfigurasi elektrod telah difabrikasi menggunakan teknologi cetakan skrin yang berkos rendah. Elektrod-elektrod ini bersama dengan teknik Voltametri Perlucutan Gelombang Empat Segi (SWSV) merupakan peralatan penyaringan mudah untuk pengesanan aras terendah Pb(II) Cd(II) dan Cu(II). Pengubahsuaian permukaan karbon grafit berasaskan kepada perlekatan semasa (in-situ) filem merkuri telah dijalankan. Melalui pemilihan media pembantu dan parameter-parameter yang sesuai seperti jumlah raksa yang digunakan, keupayaan pengendapan, masa perlekatan, frekuensi dan kadar saringan, keputusan dan kebolehhasilan untuk Pb(II), Cd(II) and Cu(II) telah diperoleh. Ciri-ciri pencapaian elektrod karbon bercetak skrin filem raksa yang direkabentuk dan dibiarkan selama 120 s untuk masa pengendapan, menunjukkan julat linear untuk Pb(II), Cd(II) dan Cu(II) ialah daripada 10 sehingga 200 µg L-1. Had pengesanan yang dicatatkan untuk Cd(II), Pb(II) dan Cu(II) ialah 2, 1 dan 5 µg L-1 dengan sisihan piawai relatif (RSD) 6.5%, 6.9% dan 7.5%, masing-masing. Aplikasi sensor ini kepada sampel air buangan dan sampel tanah yang diekstrak telah ditunjukkan.
Kata kunci: Air buangan; ekstrak tanah; elektrod karbon bercetak skrin filem raksa; Voltametri Perlucutan Gelombang Empat Segi
INTRODUCTION
The high demand for on-site monitoring of heavy metals using self-contained test-strips to replace bulky electrodes has attracted much attention from researchers. Different types of electrodes such as hanging mercury electrodes and mercury plated thin film glassy carbon electrode have been used in field experiments (Williams & D’Silva 1994). However, due to the difficulties in using the electrodes for field analysis (Bond et al. 1997), the development and application of single-use screen-printed electrodes have been widely reported (Desmond et al. 1998; Honeychurch et al. 2000; Masawat et al. 2003; Palchetti et al. 1999; Reeder & Heineman 1998; Wang & Tian 1992; 1993a;
1993b; Wang et al. 1993; Zen et al. 2002). Disposable screen-printed electrodes are designed for one use and therefore have the advantages of not being affected by the problems associated with carryover of contaminants and this minimise the damage often associated with a re-usable sensors (Desmond et al. 1998). The use of screen-printing technology also provides a pathway for a simple and inexpensive mass production of disposable electrodes. Screen-printed electrodes (SPEs) are printed on an inexpensive plastic or ceramic support which consists of planar carbon, gold or silver working electrodes and a silver reference electrode. The strip which the sample droplet is placed on is called electrochemical cell and
1154
can be considered as disposable electrode. The stripping performance of the strips is comparable with traditional electrodes which provide well-defined peaks with reproducible measurements, low background signals and could be used for laboratory and field applications (Wang 1994; Wang & Tian 1992). The presence of oxygen in the solution does not effect the measurement significantly and makes the SPEs even a stronger competitor for standard electrochemical approach (Wang et al. 1993). The electrodes can also be coupled to a compact and user-friendly electrochemical analyser (Wang 1994). Moreover, the SPEs can be electrochemically activated with simple procedures (Wang et al. 1996) and the surface can easily be modified using enzymes, redox compounds (Kroger & Turner 1997) or catalytic particles (Newman et al. 1995) thus increasing the range of compounds detectable. There are also many choices of carbon inks for the working electrode, which results in different electrochemical behaviour. Electroanalytical performance can be applied for specific electroanalytical application using different techniques (Wang et al. 1998). Screen-printed electrodes which provide a highly stable response are very attractive for routine use, low cost and can be designed for single-use decentralised operations and have been applied widely for the stripping analysis of metal ions in recent years (Wang et al. 1992). Lead is the most common studied metal by stripping analysis and produces a well-defined and sharp peaks with very low detection limit in nM concentrations (0.2 μg L-1) when mercury coated SPCE is used (Reeder & Heineman 1998; Wang & Tian 1992; Wang et al. 1993). The most widely used electrode material in electrochemical stripping analysis is mercury. This is due to its many advantageous with respect to stripping applications such as a readily renewable and reproducible surface, a high hydrogen overpotential and the ability to dissolve many metals that aids the preconcentration process (Khoo & Guo 2002). Wei et al. (2010) reported the latest progress on disposable sensor based on mixture of multi-walled carbon nanotubes, chitosan and mercury, which avoids using much mercury and is used for facile, sensitive, and on-site analysis of heavy metal ions. Table 1, summarises some of the published works on the applications of SPCEs as electrochemical metal sensors. In this work, the applicability and suitability of mercury film screen-printed carbon electrode (MFSPCE) to voltammetric stripping analysis of heavy metal ions was tested using inks (graphite and Ag/AgCl) obtained from Ercon (USA). The aim was to establish a simple method for the analysis of waste-water and soil samples using on-board three electrode configuration (carbon working electrode, carbon counter electrode and silver/silver chloride). We also made comparison between the results obtained with screen-printed cysteine modified carbon electrode/gold electrode (SPGE) for waste-water and extracted soil samples analysis as described in Md Noh and Tothill (2006) and Md Noh et al. (2005). The MFSPCE was produced by in situ deposition of mercury (II) with the target analytes
onto the bare SPCE. The mercury film formed on the SPCE strips behaved satisfactorily and allowed the detection of cadmium (II), lead (II) and copper (II) with very close characteristics to what can be expected on mercury drop electrodes. The established method has several advantages to other published methods (Palchetti et al. 2005; Wang et al. 1992, 1993). The method used small amount of solution, 100 μL drops on the SPCE which will minimize the use of mercury as we know that mercury is toxic. Other methods require the electrode to be dipped in solution for preplating and stirring to improve the signal (Palchetti et al. 2005). We also deposited the metals on the electrode at shorter time of 120 s since the signal obtained was sufficient for quantification purposes.
EXPERIMENTAL
APPARATUS AND REAGENTS
A computer-controlled electrochemical Analyser (Autolab PGSTAT10) with general purpose electrochemical software operating system GPES version 4.7 or 4.8 (Eco Chemie B.V., Urecht, The Netherlands) was used for square-wave stripping voltammetric measurements. The screen-printed electrodes were fabricated in-house (Md. Noh et al. 2005; Md. Noh & Tothill 2006) for the electrochemical measurements. A specially adapted electrical edge connector from Maplin (Milton Keynes, UK) was used to connect with electrochemical analyser. All chemicals received were of analytical grade. Hydrochloric acid and potassium chloride were obtained from BDH Ltd. (Poole, England). Ammonium acetate was purchased from Merck (Darmstadt, Germany). Potassium hexacynoferrate (III), atomic spectroscopic standard stock solutions of 1000 mg L-1 in 1 wt % HNO3 of cadmium (II), lead (II), copper (II), mercury (II) were obtained from Aldrich (Gillingham, Dorset, UK).
SOIL/SEDIMENT SAMPLE TREATMENT
The sampling protocols and sample treatments using conventional methods were carried out by Grup de Techniques de Separació (Universitat Autonoma Barcelona, GTS-UAB, Spain) and by Technicas de Protección Ambiental S.A. (TPA, Madrid, Spain). The description of the extraction process applied to soil and sediment samples can be explained in two steps:
STEP 1 A portion (1 g) of soil sample was placed in a 65 mL stoppered extraction tube with 40 mL of 0.11 M acetic acid (pH2.85) added and shaked for 16 hours in a rotary rack shaker. Then the mixture was centrifugated for phase separation and the aqueous phase filtered with filters of 0.22 μm pore size (Millex ®-GS, Millipore Corporation, Bedford MA).
STEP 2 A portion (0.25 g) of the solid sample from step 1 was placed in a microwave vessel and 9 mL of aqua-

1155
TABLE 1. Some of published work on the applications of SPCEs aselectrochemical metal sensors
Detection with mercury film-screen-printed carbon sensorsMetal Sample Method Detection limit ReferenceLead Urine drinking water DPASV
PSA
0.05 μg L-1-Cd0.03 μg L-1 –Pb0.4 μg L-1-Cd0.3 μg L-1 –Pb
Wang & Tian 1992
CadmiumLeadCopper
Drinking water SWASVPSA
0.1 μg L-1-Lead0.3 μg L-1-Lead
Wang et al. 1993
ZincCadmiumLeadCopper
- ASV - Desmond et al. 1996
ZincCadmiumLeadCopper
- ASV 55 μg L-1-zinc71 μg L-1-cadmium64 μg L-1-lead123 μg L-1-copper
Desmond et al. 1998
CadmiumLead Copper
Tap water SWASV 0.6 μg L-1-lead0.4 μg L-1 -cadmium0.8 μg L-1 -copper
Pachetti et al. 1999
Lead Drinking water PSA - Yarnitsky et al. 2000Lead Water SWASV 0.81 μg L-1 Zen et al. 2000
CadmiumLead
Certified Reference MaterialLake water
ASV - Choi et al. 2001
Copper CRM 601 lake sedimentExtracted soil Samples
CCSCP 6 μg L-1 Kadara et al. 2003
CadmiumLeadCopper
Waste waterExtracted soil sample
SWASV 0.3 μg L-1-lead1 μg L-1-cadmium0.5 μg L-1-copper
Palchetti et al. 2005
CadmiumLeadCopper
Waste waterExtracted soil sample
DPASV 1.4 μg L-1-lead9.1 μg L-1-cadmium32.6 μg L-1-copper
Cooper et al. 2007
CadmiumLead
Sea Water SWASV 1.8 μg L-1-lead2.9 μg L-1-cadmium
Guell et al. 2008
CadmiumLeadCopper
River Water SWASV 23 nM - lead12 nM - cadmium20 nM - copper
Wei et al. 2010
CCSCP: Constant current Stripping Chronopotentiometry, SWASV: Square wave anodic stripping voltammetry, PSA: Potentiometric Stripping Analysis, DPASV: Differential pulse anodic stripping voltammetry
regia (6 mL concentrated HCl, 2 mL concentrated HNO3 and 1 mL water) were added and then left closed for 10 hours to predigest before microwave treatment. After that, total digestion proceeded by first ramping to 200°C for 4 minutes and then maintaining for 6 min using pressure between 160 - 180 psi. The vessel was cooled down to room temperature before opening and the remaining solution brought up to 100 mL final volume. The solution was filtered with Millipore filters of 0.22 μm pore size. The extracts from the two steps were kept refrigerated at 4°C prior to the analyses being carried out.
WATER SAMPLE TREATMENT
Aliquots of water samples were filtered with a 0.22 μm pore size filters and used for the analysis.
PROCEDURE
Voltammetric techniques are based on the recording of the current, I, which flows between the working electrode (WE) and an auxiliary electrode (AE), due to the reduction or oxidation of the test element, as function of the potential, E, imposed on the WE and expressed with respect to that of a reference electrode (RE). Electrochemical measurements

1156
were carried out in triplicate by placing a 100 μL sample drop on a new three-electrode strip in non-dearated and unstirred solution. Metal standard solutions were prepared by diluting the standard stock solution of 1000 mg L-1 with deionised water or supporting electrolyte (0.1 M HCl/0.5 M NH4Ac). Other reagents were prepared by dissolving it in deionised water. Square-wave anodic stripping voltammetry (SWASV) measurements were carried out by placing the samples (metal ions of cadmium, lead and copper) on the screen-printed carbon electrode surfaces plated in situ with metallic films of mercury. A deposition potential of -1 V (vs screen-printed Ag/AgCl) reference electrode) was applied to pre-concentrate the metals for 120 s onto the surface of working electrode. After the deposition period, the pre-concentrated metals were stripped from the surface of the working electrode until a limit of 0 V. A SW frequency of 50 Hz, a step potential of 5 mV and square-wave amplitude of 25 mV were used for the measurements. The background signal for the supporting electrolyte was also measured in the same manner. The analytical signal was subtracted from the background signal.
REAL SAMPLE ANALYSIS
The concentrations for cadmium (II), lead (II) and copper (II) in the waste-water samples, acetic acid soil or sediments and soil or sediment aqua regia extracts were quantified by the standard additions method following an initial screening of the target species in the samples. SWASV was conducted by diluting the waste-water samples, soil and sediment extracts in the supporting electrolyte. The diluted samples were then analysed by spiking with appropriate concentrations of standard metal ion solutions for standard addition experiments. The voltammetric measurements of the sample solutions were carried out by placing a 100 uL sample drop on the three-electrode strip. Each electrochemical measurement was carried out in triplicates with a new electrode strip in non-deaerated for the stripping measurements.
DATA ANALYSIS
All experiments carried out in this study were repeated three to five times with different SPEs. The data represent the mean value of three measurements and the error bar represents the standard deviation. SPSS software was used for data analysis. A 0.1 M HCl + 0.5 M NH4Ac (pH4.5) was chosen as the supporting electrolyte to use for separate cadmium (II), lead (II) and copper (II) analysis on the basis of sensitivity as well as the need for chloride ions in the test solution for stabilizing the potential of the on-board screen-printed Ag/AgCl reference electrode (Choi et al. 2001; Desmond et al. 1997, 1998). This pH was used for supporting medium due to the problem of hydrogen evolution at low pH and thus reduces the sensitivity of cadmium (II). Hydrochloric acid (HCl) was used instead of potassium chloride (KCl) because
HCl is normally free from metal ion impurities compared to KCl (Kadara 2003) and ammonium acetate was added to increase the pH to around 4.5. Square-wave anodic stripping voltammetry studies were carried out with 0.1 M HCl + 0.5 M ammonium acetate. The effect of experimental variables such as mercury (II) concentration on the stripping responses of cadmium, lead and copper, the effect of deposition potential, the effect of deposition time and the concentration dependence for each of the metal ions were investigated. In situ plating of the bare SPCE was the chosen mode of forming mercury film on the electrode because it simplified the experimental procedure.
RESULTS AND DISCUSSION
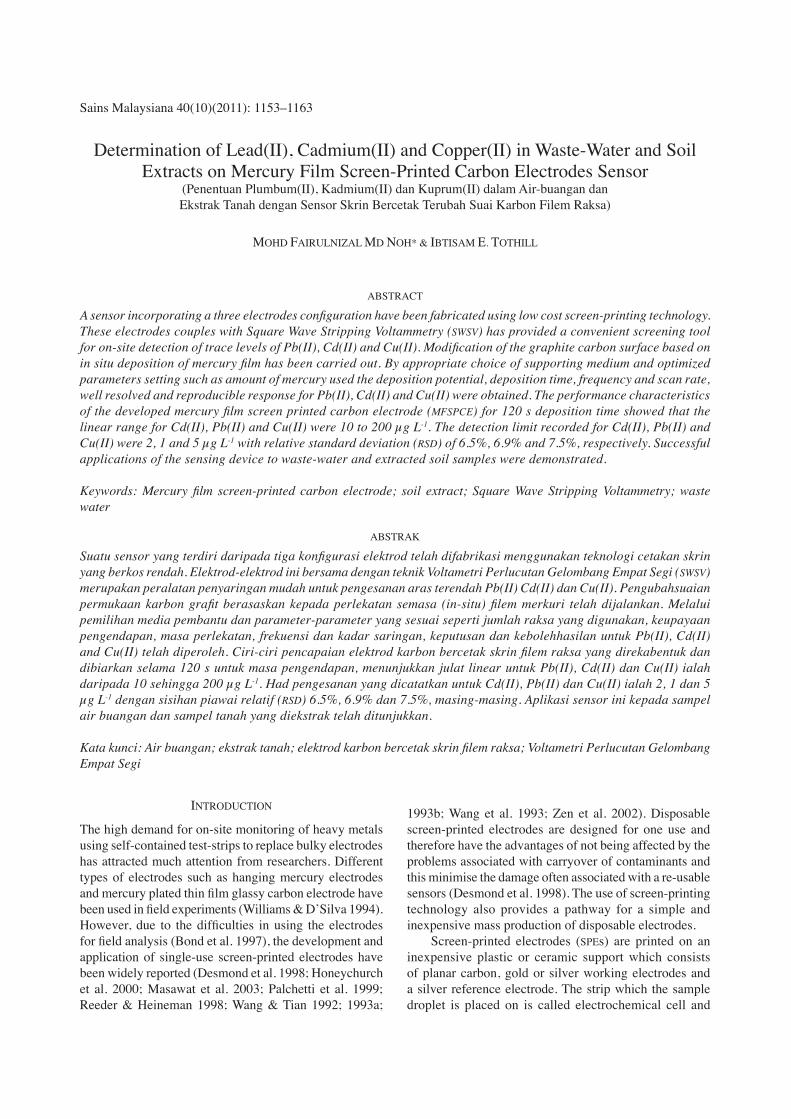
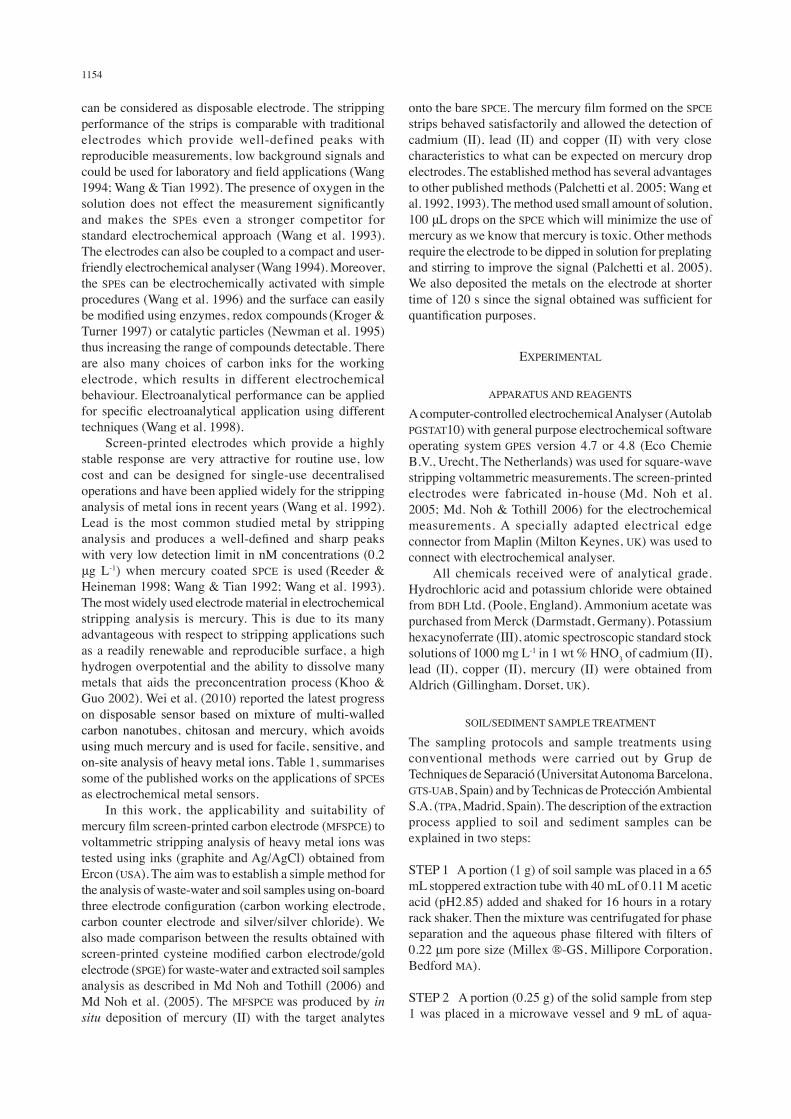
As part of the work carried out, the influence of mercury(II) concentration on the stripping responses of lead(II), cadmium(II) and copper(II), the metals were examined in the mercury ion concentration range of 10 to 100 mg L-1. Figure 1(a), (b) and (c) show the influence of mercury(II) concentration on the square-wave stripping voltammetry response of cadmium(II), lead(II) and copper(II). Cadmium, lead and copper stripping response levelled off above a mercury concentration of about 70, 80 and 100 mg L-1, respectively after increasing rapidly at lower mercury(II) concentrtion. Hence a mercury concentration of 80 mg L-1 was used for subsequent stripping voltammetric work. There is decreased in peak area was observed for Hg(II) concentrations up to 200 mg L-1 for cadmium(II), lead(II) and copper(II). This might be due to the electrode saturation with metal-amalgam. Using SWASV, an optimized mercury(II) ion concentration of 80 mg L-1 was used for co-deposition with cadmium. The effect of deposition time on stripping voltammetric of cadmium(II), lead(II) and copper(II) are shown in Figure 2 (a), (b) and (c). As can be seen, the stripping response of cadmium(II) increased rapidly with deposition time from 30 to 300 s. However, lead(II) and copper(II) stripping voltammetry peak showed that at 250 s and 200 s, respectively, the peak start to level off and these were due to the saturation of the mercury coated SPE surface. A deposition of 120 s was used for subsequent experiments, as this is sufficient to obtained well-defined stripping peaks for cadmium, lead and copper at microgram per liter concentrations. Deposition longer than required can also deplete the metal ions in the bulk solution or lead to the formation of intermetallic complexes, all of which will affect the definition and size of the stripping peaks (Wilson & Dewald 2001). The presence of break-point in the peak area vs. accumlation time plot may be due to the changes in the mechanism of deposition after longer periods (Honeychurch et al. 2002). Such changes in the dynamics of deposition might be a result of changes in the electrode surface during the accumulation period. The effect of deposition potential on the stripping response for cadmium(II), lead(II) and copper(II) were also examined (Figure 3). For the three metals, the SWASV
1157
Hg2+ Concentration (mg L-1)
Peak
hei
ght (
×10-8
A)
Peak
hei
ght (
×10-8
A)
Hg2+ Concentration (mg L-1)
Peak
hei
ght (
×10-8
A)
Peak
hei
ght (
×10-8
A)
(a) (b)
Hg2+ Concentration (mg L-1)
Peak
hei
ght (
×10-8
A)
Peak
hei
ght (
×10-8
A)
(c)
FIGURE 1. Effect of mercury concentration on the stripping voltammetric response of 50 μg L-1 (a) cadmium(II), (b) lead(II) and (c) copper(II) in 0.1 M HCl/0.5 M ammonium acetate solution. Experimental conditions: deposition potential = -1.1 V, final
potential = -0.05 V, deposition time = 120 s, SW frequency = 25 Hz, step potential = 5 mV, SW amplitude = 0.025 V
Deposition time (s) Deposition time (s)
Peak
are
a (×
10-8
A)
Peak
are
a (×
10-8
A)
(a) (b)
Deposition time (s)
Peak
are
a (×
10-8
A)
(c)
FIGURE 2. Effect of deposition time on the stripping voltammetric response of 50 μg L-1 (a) cadmium(II), (b) lead(II) and (c) copper(II). Deposition potential = -1.1 V, SW frequency = 25 Hz, step potential = 5 mV, amplitude = 25 mV, Hg2+ = 80 mg L-1

1158
signal increased when the deposition potential proceeded to more negative potentials. However, at potentials more negative than -1.1 V, the background response started to increase, thus affected the reproducibility of the stripping responses, probably due to the electrohydrolytic evolution of hydrogen (Choi et al. 2001). A potential of -1.1 or -1.0 V were employed for simultaneous detection of cadmium, lead and copper because they provided the best compromise between sensitivity of the main peak and the background response (Figure 3). For the effect of frequency on the stripping response, the SWASV signals for cadmium, lead and copper decreased when the frequency proceeded to higher value (data not shown). As a compromise among the three metals analysed, frequency of 20 Hz was used as it provided the most stable peak shape for the simultaneous analysis. Figure 4 shows the stripping voltammograms obtained for increasing concentration of cadmium(II), lead(II) and copper(II) in the range 10 to 200 μg L-1. The calibration plot obtained for cadmium(II) was found to be bimodal with linear ranges between 10 and 200 μg L-1 (correlation coefficient for Cd, (r2) = 0.9889) (Figure 5(a)). The precision (relative standard deviation) of the measurements determined by performing 6 replicate measurements of 5 μg L-1 cadmium was 6.5%. A detection limit of 2 μg L-1 was
estimated for 120 s deposition using 3 × standard deviation of the blank. The stripping voltammograms obtained for increasing concentration of lead(II) in the range of 0 to 200 μg L-1 is depicted in Figure 4. For the calibration graph presented in Figure 5 (b), a linear concentration was obtained between the stripping response (peak area) and lead(II) concentration in the range 10 to 200 μg L-1 (correlation coefficient, r2 = 0.9726) for 120 s deposition. Above concentration level of 100 μg L-1, there was deviation in the linearity of the calibration plot. The precision measurement (R.S.D.) determined by performing 6 replicate measurements of lead(II) on solutions containing 50 and 100 μg L-1 with the calculated relative standard deviation values of 6.9% and 9.1%, respectively. A detection limit of 1 μg L-1 was estimated using a deposition time of 120 s. The stripping voltammograms and calibration plot obtained for increasing concentration of copper are depicted in Figures 4 and 5(c). There was a linear correlation between the stripping peak area and copper concentration in the range 10 to 200 μg L-1 (r2 = 0.9842) for 120 s deposition time. There was a leveling off of the calibration curve at higher than 200 μg L-1. This was due to the saturation of the in situ plated mercury film SPCE. The precision of the measurements (R.S.D.) determined by
Deposition potential (V)Deposition potential (V)
Peak
are
a (×
10-8
A)
Peak
are
a (×
10-8
A)
(a) (b)
Deposition potential (V)
Peak
are
a (×
10-8
A)
(c)
FIGURE 3. Effect of deposition potential on the stripping voltammetric response of 50 μg L-1 (a) cadmium(II), (b) lead(II) and (c) copper(II). Deposition time = 120 s, SW frequency = 25 Hz, step potential = 5 mV, amplitude = 25 mV, Hg2+ = 80 mg L-1

1159
performing 6 replicate measurements of 10 μg L-1 copper was 7.5%. A detection limit of 5 μg L-1 was estimated for 120 s deposition. The performance characteristics of the developed MFSPCE for 120 s deposition time showed that the linear range for cadmium(II), lead(II) and copper(II) were 10 to 200 μg L-1. The detection limit recorded for cadmium(II), lead(II) and copper(II) were 2, 1 and 5 μg L-1 with relative standard deviation (RSD) of 6.5%, 6.9% and 7.5%, respectively for 120 s deposition time. The performance
of the MFSPCE based on the results obtained was lower in comparison to other results reported for cadmium(II), lead(II) and copper(II) detection at mercury film plated SPCEs considering the conditions applied to this work (Table 1). For instance, Wang and Tian (1992) obtained limits of detection of 0.05 and 0.03 μg L-1 for cadmium(II) and lead(II) using SWASV and longer deposition time of 600s, respectively. Wang et al. (1993) reported detection limits of 0.1 μg L-1 for SWASV for measurements of lead(II) using deposition time of 240s. Employing DPASV with no
(c)Concentration (μg L-1)
Peak
are
a (×
10-8 A
)
(a) (b)Concentration (μg L-1)Concentration (μg L-1)
Peak
are
a (×
10-8 A
)
Peak
are
a (×
10-8 A
)
FIGURE 5. Calibration curve for (a) cadmium(II), (b) lead(II) and (c) copper(II) in 0.1 M HCl + 0.5 M ammonium acetate a) and (b) linear ranges for cadmium (II) at mercury coated SPCE. Hg2+= 80 mgl-1, deposition time = 120 s, deposition potential = -1 V, final
potential = 0.05 V, fequency = 20 Hz, SW amplitude = 25 mV, step potential = 5 mV
E/V
i/A
FIGURE 4. Stripping voltammograms for increasing concentration of cadmium(II), lead(II) and copper(II) in 0.1 M HCl + 0.5 M ammonium acetate along with the blank response. Hg2+= 80 mgL-1, deposition time = 120 s, deposition potential = -1 V, final
potential = 0.05 V, frequency = 20 Hz, SW amplitude = 25 mV, step potential = 5 mV
Cd
PbCu

1160
stirring of solutions involved during the deposition step, Desmond et al. (1998) reported high detection limits of 71 and 64 μg L-1 for cadmium(II) and lead(II), respectively using a longer deposition time of 300s. Palchetti et al. (1999), using a stirring step as part of the measurement protocol, quoted detection limits of 1 and 0.4 μg L-1 using SWASV for cadmium(II) and lead(II). A longer deposition time of 180s was employed with the SWASV measurements. Recently, Guell et al. (2008), reported detection limit of 1.8 and 2.9 μg L-1 for lead(II) and cadmium(II) using carbon working electrode modified sensor for sea water analysis. The higher limit of detection obtained for the analysis of copper(II) may be due to its poor solubility in mercury when compared to cadmium(II) and lead(II) (Honeychurch
et al. 2002), which would therefore result in the formation of less amount of amalgam. The use of screen-printed carbon electrodes without chemical modification has been reported to yield a detection limit of 8.2 μg L-1 for Cu (II) after DPASV analysis of copper(II) (Honeychurch et al. 2002).
SAMPLE EVALUATIONS
The concentrations of metal ions in the waste-water and extracted water samples obtained from Aznalcollar mining area were determined by the extrapolation of the standard addition plot constructed using the standard addition method. Figure 6 shows typical stripping voltammograms
CdPb
Cu
S + 160 µg l-1
S + 120 µg l-1
S + 80 µg l-1
S + 40 µg l-1
Sample (S)
(a)
Concentration (μg L-1)
Peak
are
a (×
10-8 A
)
Concentration (μg L-1)
Peak
are
a (×
10-8 A
)
(c)(b)
Concentration (μg L-1)
Peak
are
a (×
10-8 A
)
(d)
FIGURE 6. (a) Stripping voltammograms and (b), (c), (d) standard addition plot for the determination of cadmium(II), lead(II) and copper(II) on mercury coated SPCE in one of the extracted soil samples. Depending on the real concentrations, standard solutions of cadmium(II), lead(II)
and copper(II) were added in 40, 80 and 120 and 160 μg L-1 increments to the sample. Hg2+= 80 mgL-1, deposition time = 120 s, deposition potential = -1 V, final potential = 0.05 V, fequency = 20 Hz, SW amplitude = 25 mV, step potential = 5 mV
1161
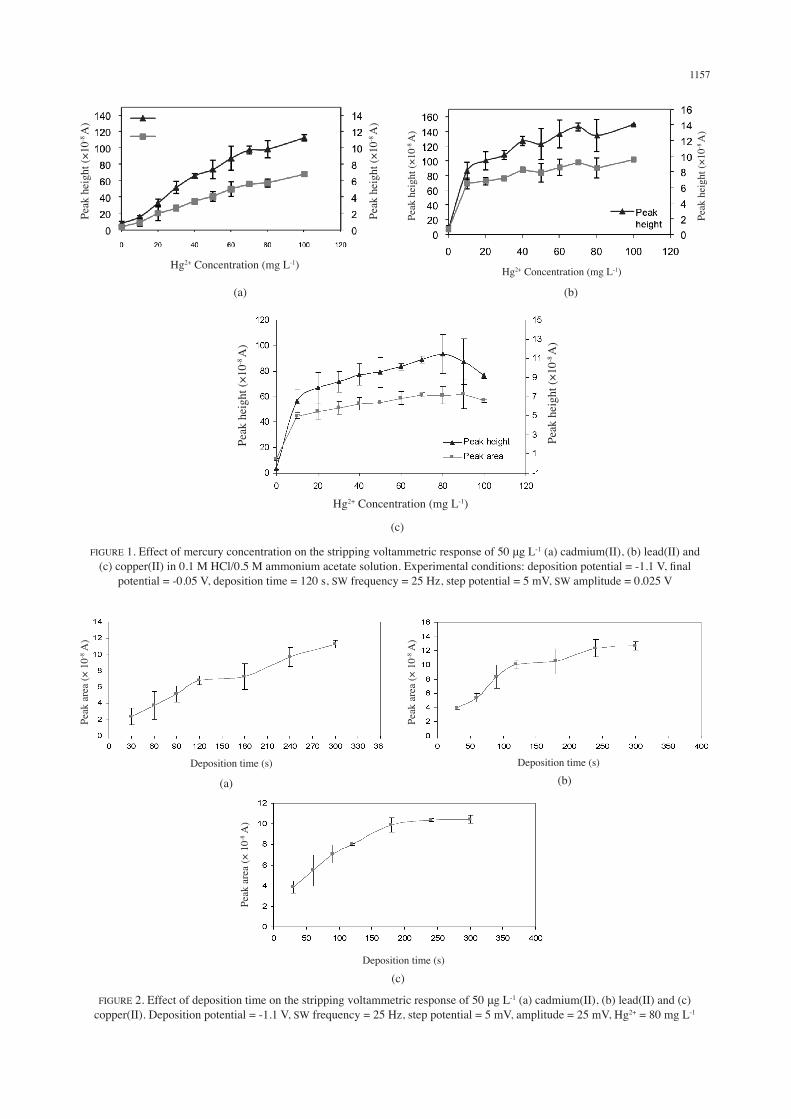
TABLE 2. Comparing results for the determination of metal ions in aqua regia and acetic acid extracted waste-water samples using square-wave anodic stripping voltammetry (SWSASV)
Technique ICP-MS (μg l-1) SWSV (μg l-1) SPMFE
Metals Pb Cd Cu Pb Cd CuS3b 2853 ± 35.4 195 ± 2.10 1882 ± 37.8 2220.36 ± 0.65 216 ± 0.2 2439.4 ± 1.3S4b 1537 ± 27.1 17 ± 2.08 262 ± 40.9 1171.3 ± 0.67 30.7 ± 0.5 357 ± 0.5S5c 664 44 540 636.5 ± 0.5 101.7 ± 0.6 981.7 ± 2S6c 5294 35 1197 5743.8 ± 0.64 80.5 ± 0.8 2233.7 ± 0.9S7c 2423 ± 20.8 12 ± 3.7 1853 ± 3.5 1981.6 ± 0.4 30 ± 0.05 2009 ± 1.5S8c 3046 ± 26.2 < 5 1087 ± 2.8 2284.7 ± 0.1 nq 1153.4 ± 0.2S9c 2799 ± 44 50 ± 34.60 1298 ± 42.2 2765.2 ± 0.7 76.3 ± 0.3 1367 ± 0.8
b – acetic acid extract; c – aqua regia extract; S – sample; nc – not certified; nq – not quantified; aValue is the mean of triplicate determination ± standard deviation.
and standard addition plots obtained for one of the acetic acid extracted sample and subsequent standard additions of different concentrations of cadmium(II), lead(II) and copper(II). The results in Table 2 are for the square-wave stripping voltammetric (SWASV) determination of cadmium, lead and copper in waste-water and soil acetic-acid extracted at MFSPCE. The results of SWASV determination were verified by using the data obtained for ICP-MS. Comparison between concentration data for Pb obtained for different acetic acid and aqua regia extracted soil samples using SWASV coupled to the integrated mercury film screen-printed carbon three-electrode device and ICP-MS (the reference method) is presented in Figure 7. There was no significant difference between data obtained using ICP-MS and SWASV for Pb (p =0.151) using t test which proved good agreement between the results obtained with ICP-MS and SWASV. However, Cd and Cu generally showed larger concentration values using SWASV as compared to ICP-MS and they showed significant difference (p<0.05). These were due to high dilution factor employed during the analysis and it affects the final results. A relatively high correlation coefficient value obtained between the
two methods of determination (r2=0.9442) confirmed the validity of the proposed method (SWASV coupled to MFSPCE) for Pb detection in environmental soil samples using 0.1 M HCl/0.5 M NH4Ac as the supporting medium (Figure 7).
CONCLUSION
This paper presented the results obtained for electrochemical stripping voltammetric analysis of cadmium, lead and copper using in-house fabricated electrodes. The three-electrode configuration system coupled with SWASV has provided a means of a relatively inexpensive on-site detector for trace levels of trace metals. Detection of these metals was carried out on MFSPCE using the optimized procedures developed for measurements in this work. The bare SPCE acted as supports for the in situ plating of mercury film. With the optimized working conditions, the results obtained indicate that the screen-printed electrochemical sensors are sensitive and reproducible enough for the SWASV determination of cadmium, lead and copper in the parts per billion range.
ICP-MS (mg L-1)
MG
SPE
(mg
L-1)
FIGURE 7. Correlation plot between SWASV-MFSPCE and ICP-MSfor the determination of lead in extracted soil samples

1162
Although the linear concentration range obtainable with SWASV was narrow (10 - 200 μg L-1), it can still be used for determining cadmium, lead and copper in synthetic and waste-water and extracted soil samples. The pre-concentration of cadmium, lead and copper metallic phase from aqueous solutions was favoured when co-depositing with mercury onto the bare electrode surface. These approaches allowed the trace metal determination of cadmium, lead and copper with limit of detection below 10 μg L-1. The reproducibility of the measurements was below 15% for MFSPCE. For environmental samples, the usefulness of SWASV coupled to screen-printed electrodes for the determination of cadmium, lead and copper in waste-water and extracted water samples was evaluated. Overall, the results showed that the developed screen-printed electrochemical sensors are capable of measuring cadmium, lead and copper in waste-water and extracted water samples. After comparison to ICP-MS, the data generated with the electrochemical sensors revealed fairly accurate measures of lead, however cadmium and copper were at higher side in waste-water and extracted water samples.
ACKNOWLEDGEMENTS
The authors gratefully acknowledge financial support under the Human Resource Development Programme by The Ministry of Science, Technology & Innovation/Public Service Department, Malaysia. The authors would like to express deepest gratitude to the Director General of Health, for permission to publish this article.
REFERENCES
Bond, A.M., Mahon, P.J., Schiewe, J. & Vicente-Beckett, V. 1997. An inexpensive and renewable pencil electrode for use in field-based stripping voltammetry. Analytica Chimica Acta 345: 67-74.
Choi, J-Y., Seo, K., Cho, S-R., Oh, J-R., Kahng, S-H. & Park, J. 2001. Screen-printed anodic stripping voltammetric sensor containing HgO for heavy metal analysis. Analytica Chimica Acta 443: 241-247.
Cooper, J., Bolbot, J.A. & Saini, S. & Setford, S.J. 2007. Electrochemical method for the rapid on site screening of cadmium and lead in soil and water samples. Water Air Soil Pollut. 179: 183-195
Desmond, D., Lane, B., Alderman, J., Hall, G., Alvarez-Icaza, M., Garde, A., Ryan, J., Barry, L., Svehla, G., Arrigan, D.W.M. & Schniffner, L. 1996. An ASIC-based system for stripping voltammetric determination of trace metals. Sensors and Actuators B 34(1-3): 466-470.
Desmond, D., Lane, B., Alderman, J., Glennon, J.D., Diamond, D. & Arrigan, D.W.M. 1997. Evaluation of miniaturised solid state reference electrodes on a silicon based component. Sensors and Actuators B 44: 389-396.
Desmond, D., Lane, B., Alderman, Arrigan, D.W.M. and Glennon, J.D. 1998. An Environmental Monitoring System for Trace Metals Using Stripping Voltammetry. Sensors and Actuators B 48: 409-414.
Güell,R., Aragaya, G., Fontàsc, C., Anticóc, E. & Merkoc, A. 2008. Sensitive and stable monitoring of lead and cadmium in
seawater using screen-printed electrode and electrochemical stripping analysis. Analytica Chimica Acta 627: 219-224.
Honeychurch, K.C., Hart, J.P. & Cowell, D.C. 2000. Voltammetric behaviour and trace determination of lead at a mercury-free screen-printed carbon electrode. Electroanalysis 12(3): 171-177.
Honeychurch, K.C., Hawkins, D.M., Hart, J.P. & Cowell, D.C. 2002. Voltammetric behaviour and trace determination of copper at a mercury-free screen-printed carbon electrode. Talanta 57: 565-574.
Kadara, R.O. 2003. Development of electrochemical sensors for heavy metal ions detection in environmental samples. PhD thesis, Biotechnology Centre, Cranfield University, U.K.
Khoo, S.O. & Guo, S.X. 2002. Rapidly renewable and reproducible mercury film coated carbon paste electrode for anodic stripping voltammetry. Electroanalysis 14(12): 813-822.
Kröger, S. & Turner, A.P.F. 1997. Solvent-resistant carbon electrodes screen-printed onto plastic for use in biosensors. Anal. Chim. Acta. 347: 9-18.
Masawat, P., Liawruangrath S. & Slater, J.M. 2003. Flow injection measurement of lead using mercury-free disposable gold-sputtered screen-printed carbon electrodes (SPCE). Sensors and Actuators B 91: 52-59.
Mohd F. Md Noh, Rashid O. Kadara & Ibtisam E. Tothill 2005. Development of cysteine-modified screen-printed electrode for the chronopotentiometric stripping analysis of cadmium (II) in wastewater and soil extracts. Analytical and Bioanalytical Chemistry 382: 1169-1174.
Newman, J.D., White, S.F., Tothill, I.E. & Turner, A.P.F. 1995. Catalytic materials, membranes, and fabrication technologies suitable for the construction of amperometric biosensors. Anal. Chem. 67: 4594-4599.
Noh, M.F.M. & Tothill, I.E. 2006. Development and characterisation of disposable gold electrodes, and their use for lead (II) analysis. Analytical and Bioanalytical Chemistry 386: 2095-210.
Palchetti, I., Cagnini, A., Mascini, M. & Turner, A.P.F. 1999. Characterisation of screen-printed electrodes for detection of heavy metals. Mikrochimica Acta 131: 65-73.
Palchetti, I., Laschi, S. & Mascini, M. 2005. Miniaturised stripping-based carbon modified sensor for in field analysis of heavy metals. Analytica Chimica Acta 530(1): 61-67.
Reeder, G.S. & Heineman, W.R. 1998. Electrochemical characterisation of a microfabricated thick-film carbon sensor for trace determination of lead. Sensors and Actuators B 52: 58-64.
Wang, J. & Tian, B. 1992. Screen-printed stripping voltammetric and potentiometric electrodes for decentralised testing of trace lead. Analytical Chemistry 64(15): 1706-1709.
Wang, J. & Tian, B. 1993a. Mercury-free disposable lead sensors based on potentiometry stripping analysis at gold-coated screen-printed electrodes. Analytical Chemistry 65(11): 1529-1532.
Wang, J. & Tian, B. 1993b. Screen-printed electrodes for stripping measurements of trace mercury. Analytical Chimica Acta 274: 1-6.
Wang, J., Lu, J.M. & Yarnitzky, C. 1993. Screen-printed ultramicroelectrode arrays for on-site stripping measurements of trace metals. Journal of Electroanalyical Chemistry 361(1-2): 77-83.
Wang, J. 1994. Decentralised electrochemical monitoring of trace metals: From disposable strips to remote electrodes. Analyst 119: 763-766.
1163
Wang, J., Pedrero, M., Sakslund, H., Hammerich, O. & Pingarron, J. 1996. Electrochemical activation of screen-printed carbon strips. Analyst 121: 345-350.
Wang, J., Tian, B., Nascimento,V.B. & Angnes, L. 1998. Performance of screen-printed carbon electrodes fabricated from different carbon inks. Electrochimica Acta 43(23): 3459-3465.
Wei, S., Lei, Z. & Lei, S., Da-Wei, Li., Yang, Li & Yi-Tao, L. 2010. Simultaneous determination of cadmium(II), lead(II) and copper(II) by using a screen-printed electrode modified with mercury nano-droplets. Microchim Acta. DOI 10.1007/s00604-010-0354-9.
Williams, G. & D’Silva, C. 1994. Hand-held instrumentation for environmental monitoring. Analyst 119: 187-190.
Wilson, M.M. & Dewald, H.D. 2001. Stripping potentiometry of indium in aqueous chloride solutions. Mincrochem, J. 69: 13-19.
Yarnitzky, C., Wang, J. & Tian, B. 2000. Hand-held lead analyser. Talanta 51: 333-338.
Zen, J-M., Chung, H-H. & Kumar, A.S. 2000. Determination of lead (II) on a copper/mercury-plated screen-printed electrode. Analytica Chimica Acta 421: 189-197.
Zen, J-M., Yang, C-C. & Kumar, A.S. 2002. Voltammetric behaviour and trace determination of Pb2+ at a mercury-free screen-printed silver electrode. Analytica Chimica Acta 464: 229-235.
Mohd Fairulnizal Md Noh* Nutrition Unit Cardiovascular Diabetes and Nutrition Research CentreInstitute for Medical ResearchJalan Pahang50588 Kuala LumpurMalaysia
Ibtisam E. TothillCranfield HealthCranfield UniversityCranfield, BedfordshireMK43 0AL, England United Kingdom
*Corresponding author; email: [email protected]
Received: 17 June 2010Accepted: 21 October 2010


![KAYNAK ELEKTROD, TEL VE TOZLARI - askaynak.com.tr · [SMAW] YENİ ÜRÜN. Sayfa AS/02 16 Mayıs 2017 Çap Boy Kutudaki Kolideki Kolideki Paletteki Teslim Ürün Fiyat Elektrod Kutu](https://img.dokumen.tips/doc/110x75/5dd1269dd6be591ccb647701/kaynak-elektrod-tel-ve-tozlari-smaw-yen-oeroen-sayfa-as02-16-mays-2017.jpg)