Embed Size (px)
Citation preview

DETERMINANTS OF FINANCIAL PERFORMANCE OF
PHARMACEUTICAL FIRMS IN KENYA
BY
LYNN NAMBENGERE WAWIRE
UNITED STATES INTERNATIONAL UNIVERSITY-
AFRICA
SUMMER 2019
DETERMINANTS OF FINANCIAL PERFORMANCE OF
PHARMACEUTICAL FIRMS IN KENYA.
BY
LYNN NAMBENGERE WAWIRE
A Research Project Report Submitted to the Chandaria School of
Business in Partial Fulfillment of the Requirements for the Degree of
Masters in Business Administration. (MBA)
UNITED STATES INTERNATIONAL UNIVERSITY-
AFRICA
SUMMER 2019

ii
STUDENT DECLARATION
I, the undersigned, declare that this is my original work and has not been submitted to any
other college, institution or university other than the United States International University
in Nairobi for academic credit.
Signed: __________________________ Date: ________________________
Lynn Nambengere Wawire (ID NO: 657702)
This project has been presented for examination with my approval as the appointed
supervisor.
Signed: __________________________ Date: ___________________________
Dr. Elizabeth Kalunda
Signed: __________________________ Date: ___________________________
Dean, Chandaria School of Business

iii
COPYRIGHT
All rights reserved. No part of this research project report may be photocopied, recorded or
otherwise reproduced, stored in retrieval system or transmitted in any electronic or
mechanical means without prior permission of USIU-A or the author.
Copyright © 2019, Lynn Nambengere Wawire.

iv
ABSTRACT
The purpose of this study was to examine the determinants of financial performance of
pharmaceutical firms in Kenya. Specifically, the study sought to determine the effect of
firm size, leverage and ownership structure on financial performance of pharmaceutical
firms in Kenya.
The study employed longitudinal design to analyze the determinants of financial
performance in pharmaceutical firms in Kenya. The population of the study was all the
thirty-seven (37) licensed pharmaceutical manufacturing companies in Kenya. The study
relied on secondary data. Statistical Package for Social Sciences was used as a tool for data
analysis.
Based on the findings it can be concluded that firm size had significant influence on
financial performance of pharmaceutical firms in Kenya. Additionally, the study
established that leverage had significant influence on financial performance of
pharmaceutical firms in Kenya. Lastly, insider ownership structure had significant
influence on financial performance among the pharmaceutical firms in Kenya.
The study recommends that pharmaceutical firms in Kenya should ensure optimal size of
assets that are required in order to avoid company bankruptcy and improve efficiency and
performance. Additionally, the study recommends that pharmaceutical firms should source
for cost effective sources of finance that do not exhaust the earnings of the firms. Finally,
the study recommends that there is dire need to reasonably diversify shareholding from
insider to outsider as a way of attracting more skills and competencies among the
shareholders that can be tapped to improve firm performance.
Recommendations on future studies is that researchers should focus on other determinants
of financial performance such as asset structure firm age among others. Additionally, other
studies should focus on other industries since the current study mainly focused on the
pharmaceutical firms.

v
ACKNOWLEDGEMENT
First and foremost, I would like to thank the Lord God Almighty through whose grace and
mercy I have found strength and the desire to pursue this degree and for granting me health
and wealth to accomplish this task. I wish to sincerely thank my supervisor Dr. Elizabeth
Kalunda for her continuous guidance and support. Her thoughtful insights, constructive
criticism and timely feedback navigated me professionally towards the successful
completion of this project. I would also like to acknowledge my family members, friends
and colleagues who have contributed immensely towards my academic excellence.

vi
DEDICATION
I dedicate this research project to my beloved family. Thank you for the support during this
challenging time.

vii
TABLE OF CONTENTS
STUDENT DECLARATION ............................................................................................ ii
ABSTRACT ....................................................................................................................... iv
ACKNOWLEDGEMENT ................................................................................................. v
DEDICATION................................................................................................................... vi
TABLE OF CONTENTS ................................................................................................ vii
LIST OF TABLES ............................................................................................................. x
LIST OF FIGURES .......................................................................................................... xi
LIST OF ABBREVIATIONS AND ACRONYMS ....................................................... xii
CHAPTER ONE ................................................................................................................ 1
1.0 INTRODUCTION........................................................................................................ 1
1.1 Background of the Study ............................................................................................... 1
1.2 Statement of the Problem ............................................................................................... 8
1.3 General Objective .......................................................................................................... 9
1.4 Specific Objectives ........................................................................................................ 9
1.5 Significance of the Study ............................................................................................... 9
1.6 Scope of the Study ....................................................................................................... 10
1.7 Definitions of Terms .................................................................................................... 11
1.8 Chapter Summary ........................................................................................................ 11
CHAPTER TWO ............................................................................................................. 12
2.0 LITERATURE REVIEW ......................................................................................... 12
2.1 Introduction .................................................................................................................. 12
2.2 Effect of Firm Size on Financial Performance ............................................................ 12
2.3 Influence of Leverage on Financial Performance ........................................................ 15
2.4 Influence of Ownership Structure on Financial Performance...................................... 20
2.5 Chapter Summary ........................................................................................................ 26
CHAPTER THREE ......................................................................................................... 27
3.0 RESEARCH METHODOLOGY ............................................................................. 27
3.1 Introduction .................................................................................................................. 27
3.2 Research Design........................................................................................................... 27
3.3 Population and Sample Design .................................................................................... 27

viii
3.4 Data Collection Methods ............................................................................................. 28
3.5 Research Procedure ...................................................................................................... 29
3.6 Data Analysis Methods ................................................................................................ 29
3.7 Chapter Summary ........................................................................................................ 30
CHAPTER FOUR ............................................................................................................ 31
4.0 RESULTS AND FINDINGS ..................................................................................... 31
4.1 Introduction .................................................................................................................. 31
4.2 Descriptive Analysis .................................................................................................... 31
4.2.1 Descriptive Analysis of Financial Performance ....................................................... 31
4.2.2 Descriptive Analysis of Firm Size ............................................................................ 33
4.2.3 Descriptive Analysis of Leverage ............................................................................. 34
4.2.4 Ownership structure .................................................................................................. 35
4.3 Correlation Analysis .................................................................................................... 36
4.4 Regression Analysis ..................................................................................................... 37
4.5 Chapter Summary ........................................................................................................ 39
CHAPTER FIVE ............................................................................................................. 40
5.0 DISCUSSION, CONCLUSIONS AND RECOMMENDATIONS ........................ 40
5.1 Introduction .................................................................................................................. 40
5.2 Summary ...................................................................................................................... 40
5.3 Discussion .................................................................................................................... 41
5.4 Conclusions .................................................................................................................. 43
5.5 Recommendation ......................................................................................................... 44
REFERENCES ................................................................................................................. 46
APPENDICES .................................................................................................................. 58
APPENDIX 1: DATA COLLECTION CHECKLIST ................................................. 58
APPENDIX 1I: LICENSED PHARMACEUTICAL MANUFACTURING
COMPANIES ................................................................................................................... 59
APPENDIX III: ROA ...................................................................................................... 61
APPENDIX IV: FIRM SIZE (TOTAL ASSETS) ......................................................... 63
APPENDIX V: LEVERAGE .......................................................................................... 65
APPENDIX VI: OWNERSHIP STRUCTURE............................................................. 67

ix
APPENDIX VII: USIU RESEARCH AUTHORIZATION ......................................... 69
APPENDIX VIII: RESEARCH PERMIT DEAN SCHOOL OF GRADUATE
STUDIES .......................................................................................................................... 70
APPENDIX IX: MINISTRY RESEARCH AUTHORIZATION................................ 71
APPENDIX X: NACOSTI RESEARCH AUTHORIZATION ................................... 72
APPENDIX XI: NACOSTI RESEARCH PERMIT ..................................................... 73

x
LIST OF TABLES
Table 4.1: Descriptive Analysis of Financial Performance ............................................... 32
Table 4.2: Descriptive Analysis of Firm Size .................................................................... 33
Table 4.3: Descriptive Analysis of Leverage ..................................................................... 34
Table 4.5: Pearson Correlation .......................................................................................... 36
Table 4.6: Model Summary ............................................................................................... 37
Table 4.7: ANOVA ............................................................................................................ 37
Table 4.8: Regression Coefficients .................................................................................... 38

xi
LIST OF FIGURES
Figure 4.1: Response Rate ................................................................................................. 31
Figure 4.2: Annual Average ROA ..................................................................................... 32
Figure 4.3: Annual Average Firm Size .............................................................................. 33
Figure 4.4: Annual Average Leverage ............................................................................... 35
Figure 4.5: Ownership structure ........................................................................................ 35

xii
LIST OF ABBREVIATIONS AND ACRONYMS
COMESA Common Market for Eastern and Southern Africa
DER Debt-equity ratio
DR Debt ratio
KSH Kenya shillings
MNEs Multinational enterprises
OTC Over-the counter
ROA Return on Assets
ROE Return on Equity
RONA Rate of return on net assets
SPSS Statistical Package for Social Sciences
U.S United States
1
CHAPTER ONE
1.0 INTRODUCTION
1.1 Background of the Study
Good financial performance of any firm not only plays a role in increasing the market value
of that specific firm but also leads towards the growth of the whole industry which
ultimately leads towards the overall prosperity of the economy (Banafa, Muturi & Ngugi,
2015). Assessing the determinants of financial performance of manufacturing firms have
gained the importance in corporate finance literature because as intermediaries, these
companies not only provide the mechanism of risk transfer but also helps to channelize the
funds appropriated to support the business activities in the economy (Capon, Farley &
Hoenig, 2013).
Financial performance is a subjective measure of the responsibility of a substance for the
consequences of its approaches, operations, and exercises evaluated for a recognized period
in budgetary terms (Maaka, 2013). Measures of budgetary execution incorporate measures
of liquidity, dissolvability, gainfulness, and money related proficiency (Maaka, 2013).
Methods for measuring money related execution incorporate; benefit, income, deal
development, and market book value (Bassey, Edu, & Enang, 2016). By evaluating the
budgetary execution of business permits, chiefs to judge the consequences of business
methodologies and exercises in goal money-related terms. Development is by, and large
observed as an indication of achievement if it brings about changes in budgetary execution
(Adelalaiu, Agbeja & Olufeni, 2015). Three benefit measures that are all around
acknowledged for their esteem to administration are profit for resources, return on value
and working overall revenue (Njoroge, 2015).
Financial performance analysis is the process of measuring the results of a firm's policies
and operations in monetary terms. It is used to measure firm's overall financial health over
a given time. Financial performance analysis can also be used to compare similar firms
across the same industry or to compare industries or sectors in aggregation thus, financial
performance analysis includes analysis and interpretation of financial statements in such a
way that it undertakes full diagnosis of the profitability and financial soundness of the
business (Maaka, 2013).

2
Financial performance measures the efficiency and profitability of investments, the safety
of debtors’ claims against assets, and the likelihood that derivative instruments will protect
investors against a variety of market risks (Seethaiah, 2012). The financial performance of
companies changes over time as profits fluctuate from one year to another and from one
company to another. Some companies obtain increases in profit while others record
decreases and some even losses. These changes are determined by various factors.
Performance factors can be structured in: factors of efficiency, that refer to economic, social
and organizational efficiency; internal environmental factors that refer to ownership,
management, company size, complexity, technical endowment, location, human potential,
informational and intellectual capital, financial position, organizational culture; and
external environmental factors: economical, technological, political, demographical,
cultural, scientific, organizational, legal, social, educational, environmental and others
(Sima, 2015).
Profitability is one of the indicators of financial performance. Profitability of the firm is
defined as the state or condition of yielding a financial profit or gain (Alshatti, 2015).
Profitability is measured by Return on Assets (ROA), Return on Equity (ROE) amongst
others (Kilani, Kaddumi & Ramadan 2011). ROA measures gainfulness for all supporters
of capital; it is the capacity of an association's administration to produce salary by using
organization resources available to them (Omesa, 2015). The ROE measures the rate of
profit for the proprietor's value utilized in the business. It shows the rate of giving back that
the administration has earned on the capital gave by shareholders in the wake of
bookkeeping in installments to all other capital providers (Ehiedu, 2015). It has also been
the primary concern of business practitioners in all types of organizations since financial
performance has implications for organization's health and ultimately its survival (Adams
& Buckle, 2013).
High performance reflects management effectiveness, and efficiency in making use of
company's resources and this, in turn, contributes to the country's economy at large.
Performance is a difficult concept, regarding both definition and measurement. It has been
defined as the result of activity, and the appropriate measure selected to assess corporate
performance and is considered to depend on the type of organization to be evaluated, and
the objectives to be achieved through that evaluation (Kusa & Ongore, 2013).

3
Sayedi (2013) argues that both internal and external factors affect performance of firms.
External environment consists of macroeconomic factors like interest rates which plays a
crucial role in attraction of investors. Without interest rates stability, domestic and foreign
investors will shy away, and resources will be diverted elsewhere. Econometric evidence
of investment behavior indicates that in addition to conventional factors (past growth of
economic activity, real interest rates, and private sector credit), private investment is
significantly and negatively influenced by uncertainty and macroeconomic instability.
Globally, the pharmaceutical industry offers invaluable contribution to strong economic
growth in diverse ways, besides the main aim of production of drugs for clinical purpose
or healthcare. According to Karamehic, (2013), the industry generates high-quality jobs
and increase economic output for economies. According to Jhee, (2014), in the United
States, the pharmaceutical industry is classified among the top three most profitable
industries but in Ghana the picture is in sharp contrast, according to Gyansah-Lutterodt and
Harper, (2015). The efficiency with which financial decisions, with respect to source of
funds and the application of the funds, are made and other production inputs affects
profitability. Theoretically, every management is required to optimize firm available
resources, to maximize shareholders’ wealth, failure of which will result in low returns on
equity (Smith & Wright, 2014).
According to Leslie (2014), the pharmaceutical industry is set to grow at 6.3% per year in
compounded annual growth rate reaching 1.12 trillion dollars by 2022. There are two
dynamics at play that could affect this optimistic outlook. First and foremost, the 249 billion
dollars of sales at risk between 2016 and 2022 signals that the pharmaceutical industry has
just entered a second patent cliff era where top biologic blockbusters will be challenged by
bio similar. Secondly, the United States of America market access landscape is rapidly
transforming, and the criteria set by payers, once losers, are much more stringent. These
complex issues are growing more challenging by the day. Healthcare reform and changes
in technology, government policy, and consumer expectations are revolutionizing
relationships with key stakeholders and impacting operations in unforeseen ways.
Globalization is presenting its own set of challenges that span multiple levels of most
pharmaceutical organizations from marketing to regulatory. Most experts believe that
companies who succeed in the face of such challenges will do so by placing a renewed
emphasis on innovation. Moreover, they will adapt effectively in the face of change and

4
uncertainty and will position themselves as a vital partner in the healthcare delivery chain
(Leslie & Palmisano, 2014). The fundamental goal of manufacturing firm’s corporate and
functional level strategies is the development of sustainable competitive advantage (Hitt,
Hoskisson & Ireland, 2015). To add on that, shifting exploration from conventional way of
thinking to strategic thinking is one of the core elements that enable an organization to
equip well to wave through competition (Matengo, 2014). There has been a realization that
manufacturing is the life-blood of an economy because of the critical role it plays in a
country’s long-term prosperity (Owuoth, 2010).
Some attention has been focused on the financial performance of the pharmaceutical
industry to provide much insight into their annual reports; United States, (Goodman, 2015)
and in India (Nair, 2013) and (Bahar & Kheradmand, 2013), but very little is known about
the financial performance of the industry. The absence of critical financial indicators about
the performance of firms in the sector affect attractiveness of investments and trading
volumes and value of financial assets holdings of investors in the sector (Kusa & Ongore,
2013).
Chakraborty and Sur (2016) in their study, financial performance of Indian Pharmaceutical
Industry indicated that the Indian Pharmaceutical Industry has been playing a very
significant role in increasing the life expectancy and in decreasing the mortality rate of
people. It is the 5th largest in terms of volume and 14th largest in value terms in the world.
The comparative analysis has been made for the financial performance of Indian
pharmaceutical industry for the period 2014 to 2015 by selecting six notable companies of
the industry. The comparison has been made from almost all points of view regarding
financial performance using relevant statistical tools. Indian pharmaceutical industry has
played a key role in promoting and sustaining development in the vital field of medicines.
Financial analysts often assess firm's production and productivity performance,
profitability performance, liquidity performance, leverage performance, asset utilization
performance and growth performance. The financial performance analysis identifies the
financial strengths and weaknesses of the firm by properly establishing relationships
between the items of the balance sheet and profit and loss account (Fu & Heffernan, 2010).
Baba, (2016) noted that the economic entities from the pharmaceutical sector have managed
to overcome the difficult times specific for a period of economic crisis, registering an
upward trend in turnover. The indicator return on equity, recorded fluctuating values with
5
a decreasing tendency in 2012-2015, but with a strong recovery in the coming years. The
carried out diagnostic analysis has shown that the entities from the pharmaceutical sector
have gone through difficult periods, especially between the years 2012-2015. Another
finding of this study refers to the rather sensitive position concerning the degree of
indebtedness. In the case of four out of the twelve analyzed companies, the degree of
indebtedness has recorded quite high values mostly in 2011-2015, which indicates a
relatively low potential for self-financing, meaning that the economic entities finance
themselves from external sources. One possibility for reducing debts would be
compensating claims with debts, and thus eliminating the possible delay penalties.
Mohideen and Parveen (2014) did a study on financial performance of pharmaceutical
companies using five power analyses. Descriptive analysis was used to help the researcher
to describe the relevant aspect of financial performance and quantitative analysis to
measure the degree of association between different variables under consideration and the
researcher used regression analysis to examine the relationship of independent variable
with dependent variable. The sample of the study was Cipla Pharmaceutical Limited. By
using the analysis, it was found that the Debtors Turnover Ratio and Gross Profit Margin
had the highest standard deviation. Debtors Turnover Ratio enabled funds for the
transaction because the Cipla Pharmaceutical Company collects their debts quickly from
their customer. Cipla Pharmaceutical Company had quite satisfactory results because
collection period was very short. Assets turnover ratio had high negative relationship with
profitability. This study concluded that Cipla Pharmaceutical Limited was quite satisfied
in their financial performance.
Karthikeyan and Sheela (2012) studied financial performance of pharmaceutical industry
in India using DuPont analysis. The Du Pont analysis that was done (by calculating ROI
and ROE) for the top three most profitable pharmaceutical companies in India and the
analysis emphasized that absolute measurements are not relevant every time therefore, to
have a common basis of comparison between several companies and to compose ranks, the
relative sizes for measuring efficiency are necessary when calculating the ratio.
The pharmaceutical industry in Kenya consists of local manufacturers, franchise importers
who are involved in distribution, multinational companies, wholesalers and retailers and all
these play a major role in supporting the country’s health sector which is estimated to have
about 4758 health facilities country wide. It is also approximated that about 9,000

6
pharmaceutical products have been registered for sale in Kenya. These are categorized
according to levels of outlets as: free, over the counter sales, pharmacy technologist,
dispensable or pharmacist dispensable (Pharmaceutical society of Kenya, 2018).
The pharmaceutical industry in Kenya is regulated by Pharmacy and Poisons Board (PPB),
a government parastatal that issues licenses to all firms operating in the industry within the
Kenyan market. The licenses are issued with specific level of operation indicated thus,
stipulating if the firm is registered as pharmaceutical manufacturer, pharmaceutical
distributor, pharmaceutical wholesaler or pharmaceutical retailer. The pharmaceutical
industry is going through drastic changes such as shrinking margins to demographic
changes, tackling emerging markets and leveraging on technology. According to a market
report by Morris (2016), there is a niche market for high technology innovative products
and it is very costly to market them. Kenya is leading in technology in the region and the
spending power is higher. These changes have a vast impact on organizational strategies as
well as processes. The pharmaceutical industry in Kenya has been characterized by many
changes sustainability. Further, resources are substances of approach in that gaining
dominance in an aggressive marketplace is dependent on firm capability to recognize, build
up, position and safe guard meticulously resources that differentiate it from its competitors
(Groen, Kraaijenbrink & Spender, 2015).
The pharmaceutical industry in Kenya is involved in compounding and packaging
medicines, repacking formulated drugs and processing bulk drugs into doses using
predominantly imported active ingredients and excipients. The bulk of locally
manufactured preparations are non-sterile, over-the counter (OTC) products. The number
of companies engaged in manufacturing and distribution of pharmaceutical products in
Kenya continue to expand, driven by the government’s efforts to promote local and foreign
investment in the sector (Denis, 2015). This has resulted in Kenya being currently the
largest producer of pharmaceutical products in the Common Market for Eastern and
Southern Africa (COMESA) region, supplying about 50% of the regions’ market. Out of
the region’s estimated fifty recognized pharmaceutical manufacturers approximately thirty
are based in Kenya. These firms collectively employ over 2,000 people with about 65%
working directly in the production sector.
In Kenya, the Ministry of Health and Medical Services has the responsibility of overseeing
the pharmaceutical companies, pharmacies and the trade in pharmaceutical products (Noah

7
& Waithaka, 2013). This is done through the Pharmacy and Poisons Board, as provided for
by Chapters 244 (The Pharmacy and Poisons Act) and 245 (The Dangerous Drugs Act) of
the Laws of Kenya. Product registration is put to effect after a thorough evaluation of
efficacy, safety and quality. According to Muiva (2013), the pharmaceutical industry in
Kenya can be divided into multi-national companies, generic companies and consumers.
Multinational companies are involved in research and developing original brands while
generic companies on the other hand are involved in manufacturing and marketing imitated
brands. Consumers can be categorized as direct or indirect. Direct consumers are individual
patients who buy drugs for their own use, while indirect consumers are either companies
such as hospitals and Health Management Organizations, or individuals who buy
pharmaceutical products for their clients or patients but do not themselves consume the
products. Vinayak (2013) further breaks the industry into manufacturing companies,
multinationals, Kenyan agents and local traders and distributors.
This study focuses on how ownership structure, firm size and leverage influences the
financial performance of Pharmaceutical firms in Kenya. The inter link between ownership
structure and corporate structure has an immediate bearing on the risk-taking introduction
of the firm. Agency problems emerge at whatever point investment thoughts and
inclinations of principals (proprietors) are at fluctuation with those of their operators
(Leech, 2015). In this case, the top managerial staff goes about as the delegate between the
principals and their operators and is accused of four principle duties: authority;
stewardship; checking; and detailing back to the principals. The viability of the board helps
in, among different ways, observing and controlling administrative tact. Comprehensively,
there are two well-springs of impacts on administrative tact. Aside from the inside impacts
(forced by the board) there are outside impacts that relate to the part of markets in checking
and teaching managers (Jensen, 2011).
Every firm size measure has advantages and disadvantages, and no measure can comprise
all the traits of the firm size. Broadly speaking, total assets measure the total resources of
the firm; market capitalization entails opportunities for growth of the firm and equity
market conditions; total sales measure of sales product market competition. In practice, the
measure to use depends on data availability. The choice of firm size measures also depends
on the objective of the research. The reason why the research incorporates firm size is
because of the platform that it provides for growth and expansion of the firm, to name but
a few, access to credit, stability and diversification (Achoki & Kanga, 2016).
8
Dell'Ariccia et al., (2017) defines leverage as that debt proportion in the capital structure of
the firm. A highly geared firm has more debt than equity in its capital composition.
Leverage can be determined by the debt ratio. The capital mix can affect the ultimate value
of the firm either negatively or positively. Generally, as a result of tax field, use of debt in
capital structure pushes up the leverage. The risk perceptions by the investors are not
affected by use of debts in the capital structure hence the cost of debt remains constant.
1.2 Statement of the Problem
Pharmaceutical firms’ financial performance in Kenya is an important subject given the
significant role the pharmaceutical firms play in the economy. With the number of
pharmaceutical firms increasing over the years and competition for customer increase, an
analysis of what factors influence pharmaceutical firms’ financial performance is important
to the firms as this can aid them in ascertaining the determinants of performance and by
extension know the areas to improve to perform better (Kabiru, Kalunda & Nduku, 2016).
Companies’ financial performance is not only important for the investors but also for the
scholars as it is important to understand the factors affecting financial performance of the
firms. Financial performance is the measure of the financial health of the organizations and
shows the performance of the executive leadership of the company. The higher the financial
performance of the company, the more effective and efficient the company in using the
resources and later contributes at the macro level in countries economy (Kraaijenbrink et
al., 2015).
Financial performance focuses more items that affect the financial statements or reports of
a firm directly. The financial performance analysis can deal with items such as dividend
growth, sales turnover, capital employed, asset base among others about the firm (Muturi
& Omondi, 2013). The financial performance is a crucial indicator or measure of some
economic units’ success for example on achievement of set goals and objectives (Wanrapee
& Xu, 2014). Firms stakeholders are mostly interested in the firm’s performance as far as
finance is concerned (Nyamita, 2014).
Study findings on firm size also vary based on the method of analysis used, for example,
Muthu et al., (2016) did a study on analysis of financial performance of pharmaceutical
companies using Z score model. The study concluded that the overall financial health of
pharmaceutical industry is in healthy zone because from the eight selected companies, five
companies (Divis Laboratories Limited., Aurobindo Pharmaceuticals Limited, Cipla

9
Pharmaceutical Limited., Dr. Reddy’s Laboratories Limited. and Cadila Healthcare
Limited are in healthy zone. Only three companies (Piramal Enterprises Limited., Sun
Pharma Industries Limited. and Glenmark Pharmaceuticals Limited are in bankruptcy zone.
Studies such as Achoki and Kanga (2016), Kaur and Kumar (2016) have been carried out
on firm size, liquidity and leverage in relation to financial performance. As shown herein,
some studies have only focused on a single factor while some have been done in different
geographical localities which may make the findings un-applicable to some cases. These
findings show that the influence of factors on financial performance varies markedly from
country to country, from one industry to another and from one-time period to another within
the same economy. The current study extended the debate on the determinants of financial
performance in pharmaceutical firms in Kenya.
1.3 General Objective
The general objective of the study was to examine determinants of financial performance
of pharmaceutical firms in Kenya
1.4 Specific Objectives
1.4.1 To determine the effect of firm size on financial performance of pharmaceutical
firms in Kenya.
1.4.2 To examine the influence of leverage on financial performance of pharmaceutical
firms in Kenya.
1.4.3 To establish the influence of ownership structure on financial performance of
pharmaceutical firms in Kenya.
1.5 Significance of the Study
Examining the determinants of financial performance of pharmaceutical firms is of interest
to all its stakeholders considering their stake and interest position as discussed herein:
1.5.1 Managers
The outcome of this study might help pharmaceutical firms’ financial managers in Kenya
in understanding the factors that affect their financial performance, as such make better
decision on these factors as well as concentrate on them in order to improve financial
performance in the industry and the sector at large.

10
1.5.2 Policy Makers
Policymakers might also be guided on the formulation of rules and regulations proposed to
help this industry perform better and even the sector in general. They might be able to
formulate policies that give pharmaceutical firms in Kenya a conducive atmosphere for
enabling them to craft strategies that might boost their firm financial performance.
1.5.3 Shareholders
The findings of this study may contribute to the understanding of corporate performance
mechanisms among pharmaceutical firms and recommends ways by which pharmaceutical
firms in Kenya can improve performance to align with shareholders’ and stakeholders’
interest.
1.5.4 Researchers and Academicians
Although, literature exists in Kenya on the determinants of financial performance, however,
not with the inclusion of some of these selected variables; ownership structure, firm size
and leverage. The study is significant in the field of research as it adds to existing literatures,
however, more research would be ignited and ventured into by academicians to test the
variable mix of the study in other industries. More so, other likely factors not used in this
study could be considered in conducting several studies. Further research could also be
motivated to help us understand if these performance factors cut across other industries of
the manufacturing sector.
1.6 Scope of the Study
The study covered pharmaceutical firms in Kenya due to the availability of data. The period
of study was five years (2014 - 2018), while the choice for the period was meant to capture
recent years of operations of the pharmaceutical firms in Kenya. Data on ROA, firm size,
leverage, and ownership structure was collected to examine the determinants of financial
performance of pharmaceutical firms in Kenya. The data was collected from published
financial statements of the pharmaceutical firms in Kenya (Kabiru et al., 2012). The
financial reports were obtained from individual licensed pharmaceutical manufacturing
companies.

11
1.7 Definitions of Terms
1.7.1 Firm size
This is the size of a company in a given industry at a given time which results in the lowest
production costs per unit of output. Firm size is commonly measured by total assets
(McWilliams & Siegel, 2010). In this study, firm size was determined by total assets.
1.7.2 Leverage
This is the ratio of the company’s loan (debt) to the value of its common stock (equity). It
involves borrowing of funds to finance the purchase of the company’s assets (Peavler,
2016). This study used debt to equity ratio as a measure of leverage.
1.7.3 Ownership Structure
The ownership structure is defined by the concentration of ownership either insider or
outsider owned (Demsetz & Villalonga, 2016). In this study ownership structure
was measured on whether a firm is insider owned or outsider owned.
1.7.4 Financial Performance
This refers to the measurement of the results of a firm's strategies, policies, and operations
in monetary terms. Financial performance was measured using Return on Assets (ROA)
(McWilliams & Siegel, 2010).
1.8 Chapter Summary
This chapter has provided background information on the research problem, statement of
the problem, and listed the general and specific research objectives. It has also covered the
significance, scope of the study and the definition of terms. Chapter two covered the
reviews available on literature on the determinants of financial performance. Chapter three
covered the research methodology used in the study. It detailed the research design,
population and sample design, data collection methods, research procedures and the
methods used for data analysis. Chapter four covered the results and findings of the study.
Chapter five covered the conclusion, discussion and recommendation for improvement and
for further studies.

12
CHAPTER TWO
2.0 LITERATURE REVIEW
2.1 Introduction
This chapter presents a review of literature on determinants of financial performance,
theories on identified factors and how they influence financial performance. This chapter
analyses literature thematically based on the research objectives.
2.2 Effect of Firm Size on Financial Performance
The size of a firm can be defined as the amount and variety of production capacity and
ability a firm possesses or the amount and variety of services a firm can provide
concurrently to its customers (McWilliams & Siegel, 2010). Firm size is a primary
determining factor in determining the profitability of a firm by using the concept as known
as economies of scale which can be found in the traditional neoclassical view of the firm.
It reveals that in contrary to smaller firms, items can be produced at much lower costs by
bigger firms. By this concept, a significant relationship between firm size and profitability
is expected (Merozwa, 2015). In contrast to this, alternative theories of the firms advise
that larger firms come under the control of managers pursuing their own self-interests goals
and therefore managerial utility maximization function may substitute profit maximization
of the firms’ objective function.
The influence of firm size on financial performance also show mixed findings. For
example, Niresh and Velnampy, (2014) carried out a study in Sri Lanka entitled: “Firm size
and profitability: A study of listed manufacturing firms in Sri Lanka.” The study explored
the effects of firm size on the profitability of quoted manufacturing firms in Sri Lanka. In
this study, data of 15 companies which were active in Colombo Stock Exchange (CSE)
were reviewed, as indicators of firm profitability, return on assets and net profit were used
whereas total assets and total sales were utilized as indicators of firm size. Correlation and
regression methods were used in the empirical analysis. There was no indicative significant
relationship between firm size and profitability of listed manufacturing firms. Also, the
results showed that firm size has no profound impact on the profitability of the listed
manufacturing firms in Sri Lanka.
Olly (2014) investigated debt financing and its effect on the value of the pharmaceutical
firms in Peru. The time of study was from 2010 to 2013. 258 pharmaceutical firms were

13
considered but only 98 firms were selected for study. The study also utilized the secondary
data which was promptly accessible from the sites of the firms. From the study, he
concluded that the long-term debt was significant determinant of the firm value.
Babalola, (2013) did a study in Nigeria entitled: “The effect of firm size on firms’
profitability in Nigeria. Firm size had been considered as an important determinant of firm
profitability. They used two variables namely total assets and total sales. In this study, the
effect of firm size on the profitability of manufacturing companies listed in the Nigerian
Stock Exchange was analyzed by using a panel data set over the period 2013-2015.
Profitability was measured by using Return on Assets, while both total assets and total sales
were used as the proxies of firm size. According to the results of the study, firm size, both
regarding total assets and regarding total sales had a positive impact on the profitability of
manufacturing companies in Nigeria.
Aggrey, Eseza & Stella, (2014) carried out a study in Uganda entitled: Firm size and rate
of growth of Ugandan Manufacturing Firms. The study used the size and age of the firms
as variables. This paper aimed at investigating whether small and medium manufacturing
firms grow faster than large firms. The dynamics of firm growth is an interesting and
important study topic because the growth of firms is the main ingredient in economic
growth and has an impact on the consequences of industrial concentration. The descriptive
results showed that medium firms grow faster than the small and large firms.
The regression results according to Aggrey et al, (2014) also confirmed that medium firms
significantly grow faster than the small firms and large firms, contradicting the Porters
"stuck in the middle" hypothesis. Regression results also showed no significant difference
between the growth of small and large firms, a finding that is consistent with Gibrat’s law.
To promote the growth of firms in Uganda, there is need to formulate policies that promote
the growth of small firms such as tax holidays that are currently being enjoyed only by
medium and large firms.
Abdukadir, (2016) carried out a study in Kenya entitled: "Effect of Leverage, Liquidity and
firm Size on the financial performance of listed non-financial firms in Kenya." This
research sought to investigate the effect of Leverage, Liquidity and Firm Size of non-
financial firms listed at Nairobi Stock Exchange during the period 2013-2015. The
variables that were used included; debt, the risks associated with indebtedness, interest rates
and debt-equity combination and the management of accounts receivables and accounts

14
payables. The study used panel data over a five-year period (2013 to 2015) to examine the
effect of Leverage, Liquidity, Firm size, Day's accounts receivables and accounts payables
on Returns on Equity and Assets on financial performance of listed non-financial firms.
Regression coefficients were interpreted using the E-views software output.
The study carried out by Abdukadir, (2016) established that Liquidity and firm size
influence the financial performance of listed non-financial firms at Nairobi Securities
Exchange positively. The overall implication is that access to credit lines was crucial in
allowing firms to invest, while effective management of liquidity in the firms is critical
since the financial manager can invest in the available financial opportunities and hence
increasing its assets base making it easy for the firm to access further credit in case of the
need. Expansion of firms’ growth has a high potential for improving financial performance
and hence better returns to the shareholders, therefore, managers should expand their
business and invest more through the opening of new branches to widen their market share
and hence boost the financial performance. Further, the results on leverage have confirmed
that leverage does not affect the financial performance of the firms, hence financial
managers should take advantage of available credit and tax shield advantage to enhance the
firms’ performance.
Ali, (2017) conducted a study in Kenya entitled: Effect of firm size on the relationship
between strategic planning dimensions and performance of manufacturing firms in Kenya.
The aim of the study was to determine if there is a significant relationship between strategic
planning dimensions and firm performance in the manufacturing sector in Kenya. To add
on that, establish the moderating effect of firm size on the relationship between strategic
planning and firm performance in the manufacturing firms in Kenya. The study was
informed by not only the low performance of the manufacturing sector over the past two
decades, but also, by the mixed results and contentious debate on the effect of strategic
planning dimensions of management participation, functional integration, strategic
orientation and strategic control on performance.
According to Ali (2017), the study had adopted the use of multidimensional constructs to
study strategic planning dimensions and performance linkages. The study utilized cross-
sectional survey design, while stratified simple random sampling was used to obtain the
sample comprising 191 firms in twelve subsectors among manufacturing firms in Nairobi
and its surroundings. Data was collected through a structured questionnaire for key

15
managers involved in the strategy formulation and implementation. Out of the 191
questionnaires administered, 111 were returned and found usable questionnaires,
representing 58% which is adequate for this stream of research. SPSS Software was utilized
to analyze data. Inferential data analysis was carried out by use of correlation analysis.
Regression models were fitted using multiple regression analysis, and hypothesis testing
was done using standard F and T-tests (Ali, 2017).
The results according to Ali, (2017) revealed that strategic planning analyzed through the
dimensions of management participation, functional integration, strategic orientation and
strategic control were significant and positively related to firm performance, however, firm
size was not found to moderate the relationship between strategic planning dimensions and
firm performance in the manufacturing firms in Kenya, thus, emphasis on specific strategic
planning dimensions contributes positively to both large firms and small firms despite their
difference in resources and development levels. The study contributes to the strategic
planning performance discourse in the context of developing countries and furthers the
discussion on the factors moderating in the relationship between strategic planning
dimensions and firm performance. The study confirms that, firm size is neither a
prerequisite nor a factor for successful application of strategic planning dimensions in both
small and medium and large firms in the manufacturing sector in Kenya.
2.3 Influence of Leverage on Financial Performance
Financial leverage indicated the use of equity and debt to finance the assets of a firm. The
two main alternatives for a company to finance its investments are debt and equity. The
company, however, may finance its investments using preference capital. The rate of
interest on the debt is fixed regardless of the company's rate of ROA. The leverage adopted
by a company should earn more on the fixed charges funds beyond their costs. An increase
in debt increases financial leverage. The main goal of using leverage is to enhance the ROE
under favorable economic conditions. Financial leverage magnification of ROE is
underpinned on the fact that the fixed charges funds can be obtained at a cost lower than a
company’s rate of ROA. Damouri, (2013) opines that leverage ratios determine the risk of
equity costs. He further states that other measures for the capital structure include market
value-based measures, semi- market value-based measures, and book value-based
measures. Financial leverage influences after tax profits as well as the earnings per share.
16
The combined effects of the two have significant effect on the ordinary shareholders’
earnings (Pandey, 2010).
Akbarian (2013) conducted a study entitled: "Effect of financial leverage and environment
risk on performance of firms of listed companies in Tehran Stock Exchange." The study
analyzed the effect of leverage and environment risk on performance of Tehran Stock
Exchange listed companies. The findings revealed a negative relationship between financial
leverage and cash flow per share. While economic risk with free cash flow per share had a
positive significant relationship. The findings further showed that there is a positive
relationship between market risk, leverage, and economic risk with ROE.
Pandey and Ponni, (2017) did a study on Corporate Leverage and Profitability of
Pharmaceutical Industry in India. The study was based on Secondary Data. 37
pharmaceutical firms listed in National Stock Exchange (NSE) were considered for analysis
during the study period. Three independent variables Financial Leverage (FL), Operating
Leverage (OL), and Combined Leverage (CL) and three dependent variables Return on
Assets (ROA), Return on Equity (ROE) and Earning Per Share (EPS) were used and tested
by using regression and correlation analysis as statistical tools. The findings of the study
indicated that there was a significant impact of CL and OL on Profitability (ROA, ROE
and EPS) as chosen by the researcher in the study of pharmaceutical Industry in India for
the study period.
Kamar (2014) analyzed the financial leverage and its impact on the profitability in Saudi
pharmaceutical firms. 340 pharmaceutical firms were considered however just 152 firms
were chosen as the sample for the investigation. The websites of the firms were the main
data sources. Linear regression model adopted was well organized and efficient. From the
study, he confirmed financial leverage and profitability inverse relationship.
Alkhatib (2012) investigated the determinants of leverage of companies in the industrial
and service sectors listed on the Jordanian Stock Exchange. The results indicated a lack of
a significant relationship between profitability and financial leverage of companies in both
industries. Duca (2012) examined the impact of the usage of debt on the profitability of
Romanian companies listed on the Bucharest Stock Exchange. The findings indicated that
there was a positive relationship between financial leverage and the profitability of the
selected companies. Akhteghan, Fard, Fengju, & Maher (2013) examined the effect of
financial leverage on the profitability of companies listed on the Tehran Stock Exchange.

17
The results indicated a significant relationship between financial leverage and profitability,
though there were significant differences in financial leverage and profitability between
smoothing and non-smoothing firms. Naseem, Rahman, Saleem & Sultana (2013) analyzed
the effect of leverage on the profitability of the oil and gas sector of South Asian
Association for Regional Cooperation countries. Profitability was measured by ROE, ROI
and ROA. They concluded that there was a significant relationship between leverage and
profitability and that the effect of leverage on profitability was positive.
Agu, Enekwe & Eziedo (2014) investigated the effect of financial leverage on financial
performance of quoted pharmaceutical companies in Nigeria. Pearson correlation and
regression analysis were employed and used for this study. The results of the analysis
showed that debt ratio (DR) and debt-equity ratio (DER) had negative relationship with
Return on Assets (ROA) while interest coverage ratio (ICR) had a positive relationship
with Return on Assets (ROA) in Nigeria pharmaceutical industry. The analysis also
revealed that all the independent variables had no significant effect on financial
performance of the sampled companies. The results further suggested that only 16.4% of
the variations on the dependent variable were caused by the independent variables in their
model suggesting that 83.6% of the variations in financial performance were caused by
other factors outside their model. Based on the above findings, the researchers now
recommend that companies’ management should ensure that financial decisions made by
them are in consonance with the shareholders’ wealth maximization objectives which
encompasses the profit maximization objective of the firm. The amount of debt finance in
the financial mix of the firm should be at the optimal level to ensure adequate utilization of
the firms’ assets. The management should also monitor the interest charged on debt
financing to avoid liquidation of the company.
In another study of Nigerian firms, Agu et al. (2014) analyzed the effect of financial
leverage on the financial performance using evidence from quoted pharmaceutical
companies during the period 2012- 2013. The authors’ found that debt ratio and debt-equity
ratio had negative link with ROA, while interest coverage ratio had a positive relationship
with ROA in Nigerian pharmaceutical industry during the period of study. Innocent et al.
(2014) analyzed the effect of financial leverage on the financial performance (measured by
ROA) of Nigerian pharmaceutical companies. Results indicated that debt ratio; debt equity

18
ratio had a negative relationship with ROA, while interest coverage ratio had a positive
relationship with ROA.
Decisions regarding the management of assets should not conflict with the primary
objective of the firm: to maximize shareholder wealth. An essential part of this asset
management is the determination of an optimal level of liquidity; referring to the ability of
a firm to meet its short-term obligations. Liquidity plays a central role in its successful
functioning as a profitable firm, thus, indicators of liquidity and profitability have major
importance to both shareholders and potential investors (Eljelly, 2013).
In theory, liquidity and profitability goals are assumed to be contradictory to each other.
The goal of liquidity management should be to enable a firm to maximize profits of its
operations while meeting both short-term debt and upcoming operational expenses that is
to preserve liquidity (Panigrahi, 2014). This can be achieved through minimizing the risk
of inability to settle the short-term obligations as well as avoiding unnecessary current
assets investments (Eljelly, 2013). Excessive investments in liquidity may lead managers
to make investments towards maximizing their utility, thus to the detriment of profitability.
In such circumstances, another pitfall is managers' tendency to invest in projects with
negative net present values (Sonal, 2015).
Numerous studies have been done on the influence of liquidity on firm performance and
the findings have been inconclusive. Some studies mainly focused on more than one
construct of liquidity management while other studies concentrated only the cash
conversion cycle. Some of the study findings show that liquidity management affect market
performance of the firm, thus, liquidity management bears both negative and positive
effects on the performance of the company, although, few of such studies have reviewed in
the current study. Liquidity management is important for every entity be it large, medium,
or small, and it known as the management of current assets and liabilities (Jiang & Wang,
(2017).
Liquidity management plays a critical role in the firm’s successful management through
ensuring future company growth. Given the present financial uncertainties and the
destabilized world's economy, financial management is receiving serious scholarly and
industry attention over the world. Currently, business owners and managers, globally, are
mainly preoccupied with developing strategies of dealing with their daily operations with

19
the aim of meeting their obligations as and when they fall due. They also endeavor to
increase their firm profitability as well as shareholders’ wealth (Zeng, 2017).
It has been seen in different studies that financial leverage has effect on corporate
performance of quoted pharmaceutical companies in Nigeria. The primary motive of a
company in using financial leverage is to magnify the shareholders’ return under favorable
economic conditions. The role of financial leverage in magnifying the return of the
shareholders’ is based on the assumptions that the fixed charges funds (such as the loan
from financial institutions and other sources or debentures) can be obtained at a cost lower
than the firm’s rate of return on net assets (RONA or ROI). Damouri (2013) states that
leverage ratios contribute in measuring the risk of using equity costs. They add that there
are various measures known for the capital structure among which the most important are
book value- based measures, market value-based measures and semi- market value-based
measures (adjusted market value). Financial leverage affects profit after tax or earnings per
share. The combined effect of two leverages can be quite significant for the earnings
available to ordinary shareholders (Pandey, 2010).
Egbide, Olubukunola, and Uwuigbe (2014) did a study entitled: "Liquidity Management
and Profitability of Manufacturing Companies in Nigeria." The primary aim of the
investigation was to analyze the relationship between liquidity and profitability. The
analysis was based on a sample of 30 manufacturing companies listed on the Nigeria Stock
Exchange for the period 2010- 2016. The results suggested that current ratio and liquid
ratio are positively associated with profitability while cash conversion period is negatively
related to the profitability of manufacturing companies in Nigeria. The association in all
the cases was, however, statistically insignificant, indicating a low degree of influence of
liquidity on the profitability of manufacturing companies, hence, the overall state of
liquidity should be improved by establishing more realistic credit policy which would
engender shorter cash conversion period, hence have a favorable impact on the profitability
of the company.
Agha & Ejike (2018) did a study on the impact of operating liquidity on profitability of
pharmaceutical firms in Nigeria. Correlation research design was used in a sample of 5
Pharmaceutical firms. Secondary data for a period of six years (2011-2015) was used, and
Ordinary Least Squares (OLS) multiple regression was employed in data analysis. The
study found that operating liquidity (account receivables collection, accounts payables

20
management) had a significant impact on the profitability of listed pharmaceutical firms in
Nigeria. It was therefore recommended among others that managers should, collect
receivable as soon as possible because it is better to receive inflows sooner than later, and
delay payment of creditors to invest the money in short-term securities which are profitable.
2.4 Influence of Ownership Structure on Financial Performance
The relationship between the ownership of a firm and its financial performance is a key
issue in corporate governance. Some studies that focus on corporate governance support
the presence of a linear or monotonic relationship between ownership and performance,
while the rest support a non-linear or non-monotonic relationship between the two (Keasey
& Short, 2015).
Both studies assumed a uni-directional relationship based on the assumption that the
ownership was exogenous. This view was later questioned by Demsetz (2015) and Demsetz
and Lehn (2011), where they both argued that the ownership structure was endogenously
related to the firm performance with no direct relationship existing between the two. This
debate has however been broadened by the more recent empirical studies. These studies
have presented evidence that supports either a reverse-way or a bidirectional relationship
between the ownership structure and financial performance by use of simultaneous
equation approach to model endogencity (Bohren and Odegaard, 2013; Desmetz and
Villalonga, 2013; Cho, 2014; Chung and Pruitt, 2014; Loderer and Martin, 2014).
Jiang and Xu (2014) did a study on the empirical study of ownership structure and
performance of listed companies in Indonesia based on pharmaceutical companies. The
study revealed that the ownership structure does not have significant correlation on
corporate performance, for non-competitive industries. The concentration of ownership on
corporate performance has positive effect. There is a U-shaped relationship between the
proportion of state shares and corporate performance.
Most of the research focusing on the relationship between ownership structure and financial
performance has been based on the agency framework. It has been debated that the
separation of ownership from control for a corporate firm creates an agency problem which
results in conflicts between the managers and the shareholders (Shleifer and Vishny, 2014).
Since ownership structure remains the foundation for exercising power and control over
corporate entities under imperfect market conditions and or the nature of incomplete

21
contracts, the issue of agency costs needs to be addressed as per the ownership structure of
the firm to ensure efficient financial performance (Fama & French, 2014).
Tang, Tao and Wang (2014) did a study research on the relationship between ownership
structure and corporate performance of pharmaceutical industry. The study revealed that
that ownership concentration and corporate performance showed a significant positive
correlation, at the same time, equity restriction and corporate performance also has a
positive relationship in a certain degree, which provides a reference for the future
development of the pharmaceutical industry.
Doms and Jensen (2014) established that United States (U.S) firms with foreign capital are
more productive when compared to firms with domestic capital; nonetheless, they were
less productive than U.S multinationals. Girma (2015) determined that immediately after
their acquisition by a non-American investor, U.S firms immediately enjoyed substantial
growth rates, however, in both cases the studies did not consider the foreign investors home
country and whether they came from an emerging or developed economy.
Konings (2013) conducted a study in three countries that is, Bulgaria, Romania and Poland,
whereby, he investigated whether the financial performance of companies with foreign
capital was better than that of firms with domestic capital. The results obtained by Konings
(2013) for Romania and Bulgaria suggest that the financial performance of firms was not
affected by whether a firm had either foreign or domestic capital. This was in contrast for
Poland, where the results showed that foreign capital had a positive and significant effect.
The main reason for this variance was in the delays in carrying out reforms in both Romania
and Bulgaria. He further stated that time is required to start enjoying the positive effects of
foreign capital.
In a comparative study, Barbosa and Lourie (2013) conducted a study in Greece and
Portugal and did not find any significant difference between multinationals and firms which
were owned domestically. They established that the performance of firms in Portugal is not
affected by the presence of foreign capital after discounting control for the firm and its
industry characteristics.
Bjuggren, Eklund and Wiberg, (2015) evaluated the relationship between ownership
structure and performance of Swedish companies over a period from 2014 to 2015. The
study found that the use of dual class shares, which give different voting rights and

22
dividends to public shareholders and founders of the company, resulted in a negative
relationship on the company’s performance. Perrini, Rossi and Rovetta, (2014) conducted
a similar study to determine the relationship between ownership structure and performance
using a sample of firms based in Italy from 2013 to 2015. They concluded that the number
of shares held by the five biggest shareholders of the company had a positive influence on
firm valuation whereas management ownership only benefited firms that have less
concentrated ownership companies. Nor and Sulong, (2014) carried out a study of listed
Malaysian firms to investigate the effect of dividends, ownership structure and board
governance on firm value. They established that concentrated and managerial ownership
have insignificant effect on firm value which was unexpected.
Aitken and Harrison (2015) established using a sample of Venezuelan firms that the
presence of foreign capital is closely linked to productivity improvements, but only for
small firms. On the other hand, Perez-Gonzalez (2013) determined that controlled
subsidiaries of multinational companies generally have improved overall productivity on
their factors of production and for firms that rely on technological innovations which are
transfers by the parent companies.
Petkova (2014), established that Indian firms acquired by foreign investors recorded
significant growth over a period of three years from the date of acquisition. A similar study
was carried out in Indonesia by Arnold and Javorcik (2013). They determined that
Indonesian firms acquired by foreign investors recorded substantial improvements in
productivity in both the year of acquisition and in the latter years. Other studies were
conducted in firms operating in developed economies.
It is widely recognized that the ownership concentration of a firm has the potential to limit
the agency problem and then result in increased corporate performance. This positive effect
due to ownership concentration can be explained by the efficient monitoring hypothesis,
which states that higher concentration of ownership gives large shareholders stronger
incentives and greater power at lower cost to monitor management. According to Grossman
and Hart (2015), they believe that shareholders who have a larger stake in the company
would be more willing to play an active role in corporate decisions since to some extent
they enjoy the benefits that arise from their monitoring efforts. The methods used to
monitor and intervene in such situations range from informal conversations with
management to formal alternative challenges (Shleifer and Vishny, 2014). In an instance
23
where large shareholders cannot monitor management, they are still able to facilitate a
third-party takeover by dividing the gains from their own shares with the bidder.
Shleifer and Vishny (2014), determined that some degree of share ownership concentration
enhances firm performance since many shareholders, with a substantial portion of the gains
from improving the firm’s performance will have a greater incentive in monitoring firm
performance. Additionally, Wruck, (2011) found a strong and positive relationship between
the change in ownership concentration and firm performance. From as early and the late
2014 the potential conflict between the majority and minority investors had become a focus
of interest for academics. Concentrated ownership structure may allow dominant
shareholders to commandeer minority investors. This is also known as the expropriation of
minority shareholder hypothesis. Shareholders who own many shares represent their own
interests, which may not coincide with the interests of other stakeholders in the firm.
Certain features of firm such as the pyramidal control structure, cross shareholding and
super voting rights allow such shareholders to secure control rights which are not
commensurate with the cash flow rights (Claessens, 2013; La Porta, 2015). The separation
between control and cash flow rights induces the prevalent problems of controllers’
takeover (Denis and McConnell, 2015; John, 2013). The term “tunneling” is used by
Johnson, (2013) to refer to the transfer of resources from the firm for the use and benefits
of its controlling shareholders. The fear of small investors that their investment may be
pilfered may induce high cost of capital to firms and because of this cause inefficient
investment.
Cho, (2014), determined that firm performance affects the ownership structure which he
defined as the percentage of shares held by directors and not vice versa. Jurgen (2013)
established that the presence of large shareholders does not necessarily improve
profitability and that the high degree of ownership concentration seems to be a sub-optimal
choice for many of the tightly held German corporations. Their results both imply that
ownership concentration negatively affects the profitability of the firms. Hill and Snell
(2011) observed that ownership concentration could be used to alleviate type 1 agency cost,
although most of the studies were carried out in economic settings where the ownership
was generally dispersed such as in the United States. In such settings it was established that
ownership concentration had a positive effect on the research and development intensity as
well as the corporate performance.

24
Demsetz and Lehn, (2011) suggest that in countries where firm shares are widely held and
where managers are forced to align their interests with those of their shareholders, the
concentration of ownerships should be viewed as endogenous to firm performance in
equilibrium. In support of this Demsetz, Kole, and Lehn (2014) found a reverse causality
between ownership concentration and firm value.
Jiang (2015) argues that a typical feature of ownership structure in modern corporate
governance is the separation of company ownership and management. In order to better the
development of firms, business owners take the companies operating rights to professional
managers to manage and only retain the power of the residual value of the company to
obtain rights. The disagreement between shareholders and management will lead to
manager’s selfish behavior of short term profit harming the interest of owners and
destroying the contractual relationship, therefore, in addition to incentive pay the
shareholdings of managers are also good incentive mechanism as it can help the
management and the shareholders to become united to promote the interest of both so that
the managers will pay attention to the development of long-term interests of the company
besides considering themselves, thus contributing to achievement of the contract objectives
(Matengo, 2014) therefore, shareholding of managers will make them pay more attention
and emphasis on long term development of the firm.
Liouiand et al. (2012) and Qui (2012) argue that firms’ ownership is organized in order to
maximize firm value and suggested that firms’ ownership and capital structure decisions
reflect attempts to mitigate agency problems between various stakeholders to avoid
potential conflicts of interest between a controlling shareholder and minority investors.
According to Butt and Hassan (2015) the relationship between ownership structure and
firm performance is laid on the issue of corporate governance. Srivastava (2011) noted that
since the initiation of economic reforms, various laws and government policies relating to
corporation have changed resulting to several changes in ownership structures, stakeholder
expectations and the corporate environment. The changes are aimed to facilitate effective,
entrepreneurial and prudent management that can deliver the long-term success of the firm.
Berghe and Levrau (2015) note that ownership structure is the primary driving factor both
to investors and creditors because owners of a firm have economic relations with the firm
and influences the types of decisions taken by a firm to decrease the level of financial risk
and improve financial performance. This is because ownership structure has the capacity

25
to put good governance mechanisms structures in place and to boost company’s capacity
to attract outside capital (Chizema & Trien, 2011). Cespedes, Gonzalez and Molina (2010)
evaluated the ownership structure determinants and firms’ performance of Latin American
firms and concluded that ownership structure has a strong impact on firm’s performance as
it influences the allocation of resources and control of the firm. Chapple, Clarkson and
Overell (2011) argue that many foreign scholars have verified that ownership structures
have significant effects on market value and financial performance of listed firms.
Demsetz and Villalonga (2016) argued that there is a direct link between ownership
structure and corporate financial performance because the board of directors elected by the
owners acts as the intermediary between them and their agents, as the board is charged with
four main responsibilities: leadership; stewardship; monitoring; and reporting back to the
owners which has a direct bearing on financial performance. Jensen (2011) and Lins (2015)
argue that the effectiveness of the board helps to mitigate the agency problems whenever
investment ideas and preferences of principals are at variance through controlling and
monitoring the managerial actions. The internal influence imposed by the board reinforces
the external role of the markets in monitoring and disciplining managers (Jensen, 2011).
Brown (2013) argues that the constraints imposed by the board to the management makes
them to be extra vigilant as they exercise their discretion to avoid managerial ineptitude,
which leads to poor financial performance and erodes confidence of potential investors.
Lawrence (2010) and Zhuang (2015) argue that ownership structure is one of the most
important factors in shaping the corporate governance system of any firm. Good ownership
structure makes the manager have appropriate and sufficient authority to carry out their
duties in the company management (Oman, 2013). This is attributed to the fact that
ownership structure is the decision making segment of a firm, which makes and influences
the firm’s decisions. The main objective of a firm is to maximize the wealth of shareholders,
which highly relies on decisions made by the owners. Alipour (2013) and Singh (2014)
argue that corporate ownership structures encourage firms to create value in industry in
terms of advanced innovations, technology, and skilled workforce development in devising
control system that affects the firm’s financial performance. Eisenhardt (2011) and Shah
(2015) argue that the relationship between firm’s performance and how managers view
their discretion is systematically related to ownership structure ability to select an effective
board and the type of corporate governance structure adopted.

26
2.5 Chapter Summary
Leverage allows a greater potential return to the investor than otherwise would have been
available, but the potential loss is also greater: if the investment becomes worthless, the
loan principal and all accrued interest on the loan still need to be repaid. This constitutes
financial risk; the degree of this financial risk is related to the firm's financial structure. The
total combination of common equity, preferred stock and short- and long-term liabilities is
referred to as the financial structure. The literature also allowed us to be able to identify the
gaps that previous studies had not researched on as well as the observations the previous
researchers had made. The next chapter presented the research methodology and the tool
used to analyze the data.
27
CHAPTER THREE
3.0 RESEARCH METHODOLOGY
3.1 Introduction
This chapter discusses the methodological approach for the study, and it comprises of the
following: research design, target population, data collection procedure, research
procedure, data analysis, chapter summary.
3.2 Research Design
The study adopted descriptive and longitudinal research design to determine the factors
influencing financial performance of pharmaceutical firms in Kenya. The design was
suitable for this study as it allowed the analysis of the relationship between the independent
and the dependent variable (financial performance) over five-year period (Lewis, Saunder
& Thornill, 2015). The design is also justified because it was used to sort out the existence
and magnitude of causal effects of one or more independent variables (firm size, leverage,
and ownership structure) upon a dependent variable of interest (that is financial
performance) at a given point in time.
3.3 Population and Sample Design
3.3.1 Population
Population is the total collection of components from which the researcher wants to make
a conclusion while sampling is the process of selecting some components from which the
researcher may draw conclusions about the entire population (Cooper & Schindler, 2011).
A “population” consists of all the subjects in a study (Yount, 2016). In this respect,
therefore, a population comprises of all the possible observable cases (persons, objects,
events) that constitute a known whole study about which research results are to be
generalized, and a sample is the subset of the target population. The entire population was
all the thirty-seven (37) licensed pharmaceutical manufacturing companies in Kenya
(Cooper et. al, 2011).
3.3.2 Sampling Design
Sampling design is a set of rules, procedures or a plan drawn up before any data is collected
to obtain or specify how a sample selection is done from a given population (Cooper et al,
28
2011). For this study, the entire populations of licensed pharmaceutical manufacturers were
used.
3.3.2.1 Sampling Frame
Sampling frame is defined as the list of components from which a sample is drawn (Cooper
& Schindler, 2013). It is simply a list of the study population. In this study, all the elements
in the population were used and constituted the sampling frame. The list of licensed local
pharmaceutical manufacturers as provided in appendix II was the sampling frame in this
study. The Federation of Kenya Pharmaceutical Manufacturers (FKPM) member database
that was used had respective member contacts that were used to contact the respondents.
The database was provided by the Federation of Kenya Pharmaceutical Manufacturers
secretariat upon requisition on email.
3.3.2.2 Sampling Technique
Due to the small size of the population, all the licensed local pharmaceutical manufacturers
in Kenya took part in the study as Bell and Bryman (2015) opine that when the target
population is small, all the elements in the population take part in the study, thus, all the 37
firms took part in the study. In this regard, the study used census sampling technique where
all members of the population take part in the study.
3.3.2.3 Sample size
Data was collected from all the 37 licensed local pharmaceutical manufacturers in Kenya.
All the 37 pharmaceutical firms took part in this study due to the small number of the target
population since there are only 37 licensed local pharmaceutical manufacturers in Kenya.
3.4 Data Collection Methods
This study relied on secondary data that was obtained from the annual audited financial
statements. The data was obtained from the income statement, balance sheets and
statements of cash flow of the listed firms, which would include; total assets of the firm,
cash flow balances, total revenues, net profit and tax paid. The study used data of the most
recent years for five years between 2014 and 2018. In line with the research design, the
study employed a data collection checklist (Appendix I). The data collection checklist was
used in guiding the collection of data from the annual audited financial statements of
pharmaceutical firms in Kenya.

29
3.5 Research Procedure
The research procedure included obtaining financial statements and annual reports form the
company websites of the 37 licensed pharmaceutical manufacturing firms. This was
followed by the extraction of information from the annual financial statements and reports
of the selected firms. I used annual financial statement information from 2014 to 2018.
3.6 Data Analysis Methods
The collected data was then entered into SPSS and analyzed for descriptive statistics on
ROA, firms’ size, liquidity and ownership structure. The descriptive statistical analysis was
used to analyze data based on frequencies and percentages. Simple regression analysis was
used to analyze the determinants of financial performance, ownership structure, firm size
and leverage. The study used correlation analysis to determine effect of ownership
structure, firm size and leverage on the financial performance. The study also used
Pearson’s correlation to establish the determinants of the financial performance of the select
firms. The data was presented in tables. The relationship between the selected factors and
financial performance was expected to follow a regression model of nature at 95%
significance level.
Equation 1: Regression Equation
Y=α0+ α1X1+ α2X2+ α3X3+ ε
Where; Y= ROA
α = Intercept term
X1=Firm Size
X2= Leverage
X3= Ownership Structure
ε= Error term
Financial Performance was determined by ROA. ROA was calculated by net income
divided by average shareholder’s equity. Edem (2017) used ROA as a measure of financial
performance in examining liquidity management and performance of deposit money Banks
in Nigeria. Rajkumar (2014) used ROA as a measure of financial performance in
30
determining the impact of financial leverage on financial performance: special reference to
John Keells Holdings plc in Sri Lanka.
Firm size was measured by total assets. Assets were determined by a summation of
liabilities and shareholders' equity. Other studies have used total assets in determining the
firm size for example; Pervan and Visic (2012) used total assets as a measure of firm size
in determining the influence of firm size on business success. Mungai and Murithi (2017)
also used total assets as a measure of firm size in determining the moderating effect of firm
size on the relationship between capital structure and financial distress of listed
nonfinancial firms in Kenya.
Leverage was measured by debt to equity ratio. Debt to equity ratio was determined by
dividing total liabilities by total equity. Rajkumar (2014) used debt to equity ratio as a
measure of leverage in determining the impact of financial leverage on financial
performance: special reference to John Keells Holdings plc in Sri Lanka. Agu, Enekwe,
and Eziedo (2014) also used debt to equity ratio as a measure of leverage in determining
the effect of financial leverage on financial performance in Pharmaceutical companies in
Nigeria. Ownership structure was measured using insider-outsider ownership. A dummy
variable was used with 1 if insider and 0 if otherwise
3.7 Chapter Summary
This study sought to find out determinants of financial performance of pharmaceutical
firms in Kenya. This chapter discussed the research design, population and sample, target
population and sampling design, data collection procedure, research procedure and data
analysis methods. The next chapter which is chapter four presented the results and findings.

31
CHAPTER FOUR
4.0 RESULTS AND FINDINGS
4.1 Introduction
This chapter presents analysis, results, and findings of the study as set out in the research
methodology. The data was analyzed using IBM SPSS (Statistical Package for Social
Sciences) version 21 software, and the findings were presented in tables as follows:
descriptive statistics, correlation analysis, and regression analysis. The data was collected
from audited financial reports relating to variables namely ROA; firm Size, leverage, and
ownership structure.
4.2 Descriptive Analysis
To analyze the determinants of financial performance among listed pharmaceutical firms
in Kenya, a descriptive analysis was conducted. Thirty-three out of the thirty-seven licensed
pharmaceutical manufacturing companies in Kenya whose data were readily accessible
were analyzed from the year 2014 to 2018. This gave a response rate of 89.1% as presented
in Figure 4.1
Figure 4.1: Response Rate
4.2.1 Descriptive Analysis of Financial Performance
The study sought to determine the ROA of the pharmaceutical firms over the period of 5
years that is from 2014-2018. As shown in Table 4.1.

32
Table 4.1: Descriptive Analysis of Financial Performance
N Minimum Maximum Mean Std. Deviation
2014 33 .000 .336 .07946 .083080
2015 33 .001 .304 .07759 .066984
2016 33 .001 2.828 .13830 .458730
2017 33 .009 4.135 .37922 1.022375
2018 33 .001 2.995 .18578 .486764
The findings as shown in Table 4.1 shows the distribution of Return on Assets values over
a period of five years. The finding shows an irregular pattern in ROA of the pharmaceutical
firms in Kenya over the five-year period with the lowest value for ROA being 0.07759 in
the year 2015 while the highest was 0.37922 in the year 2017. In 2018, the average ROA
of the pharmaceutical firms was 0.18578. An average ROA of 0.13830 was attained in 2016
while 0.07946 ROA was realized in the year 2015. On the other hand, low scores of
standard deviation indicate low variation in financial performance for the various
pharmaceutical firms in Kenya.
Figure 4.2: Annual Average ROA
Based on the study findings, ROA increased from 7.79% in the year 2014 then dropped to
7.76% in the year 2015, then increased to 13.83% in the year 2016, then increased to
37.92% in the year 2017 and decreased to 18.58% in the year 2018.
7.79% 7.76%13.83%
37.92%
18.58%
0.00%
10.00%
20.00%
30.00%
40.00%
2013 2014 2015 2016 2017 2018 2019
RO
A
Year
Annual Average ROA

33
4.2.2 Descriptive Analysis of Firm Size
The study sought to determine the influence of firm size on the performance of
pharmaceutical firms in Kenya. Firm size was determined as the total assets as shown in
Table 4.2 below.
Table 4.2: Descriptive Analysis of Firm Size
N Minimum Maximum Mean (Ksh.
‘000’)
Std. Deviation
2014 33 1552.380 6714289.000 1241780.4543 1467521.8650
2015 33 4508.160 9246982.000 1442262.9232 1813197.9848
2016 33 7943.280 6095369.000 1422875.2940 1484989.8215
2017 33 4477.130 7161434.000 1637988.4710 1783717.9721
2018 33 12119.900 8739770.000 1903739.2270 2099138.1912
The means portray a steady increase in the firm size. The lowest being 1,241,780,454.3 in
the year 2014 then increased to 1,442,262,923.2 in the year 2015, then decreased to
1,422,875,294 in the year 2016 then increased to 1,637,988,471 in the year 2017 and the
highest being 1,903,739,227 in the year 2018.
Figure 4.3: Annual Average Firm Size
1241780.4541442262.923
1422875.294
1637988.471
1903739.227
0
500000
1000000
1500000
2000000
2013 2014 2015 2016 2017 2018 2019
Tota
l A
sset
s
Year
Annual Average Firm Size
Ksh
'000'

34
Figure 4.3 above shows that the total assets of the pharmaceutical firms increased from
1,241,780,454 in 2014 to 1,442,262,923 in 2015 which decreased to 1,422,875,294 in 2016.
In 2017 the total assets increased to 1,637,988,471 and then to 1,903,739,227 in 2018.
4.2.3 Descriptive Analysis of Leverage
The study sought to establish influence of leverage on financial performance among the
pharmaceutical firms in Kenya as Shown in Table 4.3 below.
Table 4.3: Descriptive Analysis of Leverage
N Minimum Maximum Mean Std. Deviation
2014 33 .00 .70 .1974 .24796
2015 33 .00 .71 .1883 .24111
2016 33 .00 .91 .1936 .26279
2017 33 .02 1.04 .2028 .26322
2018 33 .01 1.22 .2008 .27796
The findings indicate that pharmaceutical firms had an average leverage of 0.1974 in 2014
which implies that on average 19.74% debt was used in financing the total assets. In 2015,
the average leverage was 0.1883 which implies that on average 18.83% debt was used in
financing the total assets in 2015. In 2016, the average leverage was 0.1936 which shows
that on average 19.36% debt was used in financing its total assets. In 2017, the average
leverage was 0.2028 which depicts that on average 20.27% debt was used in financing the
total assets. In 2018, the average leverage was 0.2008 which implies that on average
20.08% debt was used in financing the total assets.

35
Figure 4.4: Annual Average Leverage
Figure 4.4 shows that the annual average leverage of pharmaceutical firms decreased from
0.1974 in 2014 to 0.1883 in 2015 which increased to 0.1936 in 2016 and then 0.2028 in
2017. In 2018 annual average leverage of pharmaceutical firms decreased to 0.2008.
4.2.4 Ownership structure
The study sought to determine the ownership structure of Pharmaceutical firms in Kenya
from the year 2014 to year 2018 as shown in Figure 4.5 below.
Figure 4.5: Ownership Structure
The findings indicate that in 2014, 51.4% of pharmaceutical firms had insider ownership,
while 48.6% had an outsider ownership. In 2015, 62.2% of pharmaceutical firms had
0.1974
0.1883
0.1936
0.20280.2008
0.185
0.19
0.195
0.2
0.205
2013.5 2014 2014.5 2015 2015.5 2016 2016.5 2017 2017.5 2018 2018.5
Lev
erage
Years
Annual Average Leverage
51.4%
62.2%
51.4% 54.1% 56.8%
0.0%
10.0%
20.0%
30.0%
40.0%
50.0%
60.0%
70.0%
2014 2015 2016 2017 2018
Per
cen
t
Year
Ownership Structure
Outsider
Insider

36
insider ownership, while 37.8% had an outsider ownership. In 2016, 51.4% of
pharmaceutical firms had insider ownership, while 48.6% had an outsider ownership. In
2017, 54.1% of pharmaceutical firms had insider ownership, while 45.9% had an outsider
ownership. Finally, in 2018, 56.8% of pharmaceutical firms had insider ownership, while
43.2% had an outsider ownership. This is an implication that majority of the pharmaceutical
firms had insider ownership across the years under study.
4.3 Correlation Analysis
Having done the descriptive analysis, the study conducted a correlation analysis to
determine the strength and significance of the relationship between the study variables. The
Pearson correlation matrix is useful for analyzing data that is non-categorical and uses
interval measurement scale (Lewis et al., 2015).
Table 4.4: Pearson Correlation
ROA Firm
size
Leverag
e
Ownership
structure
ROA (Pearson correlation) 1
Sign.
Firm size (Pearson correlation) 0.425 1
Sign. 0.010
Leverage (Pearson correlation) 0.021 0.013 1
Sign. 0.017 0.010
Ownership
structure
(Pearson correlation) 0.518 -0.485 -0.308 1
Sign. 0.010 0.018 0.010
From the Table 4.4, it can clearly be seen that there is moderate significant relationship
between firm size and financial performance of Pharmaceutical firms in Kenya with an R
(Pearson correlation coefficient) = 0.425, P significance value of < 0.05; a weak significant
relationship between leverage and financial performance with an R = 0.021. Ownership
structure significantly exhibited moderate significant relationship with financial
performance as measured by ROA having an R of 0.518, P < 0.05 meaning that the
probability of us getting this R of 0.518 in a sample of 33 observations if there was no
relationship between ROA and ownership structure is very low (close to zero in fact).

37
4.4 Regression Analysis
To fit the data into the conceptualized model in the conceptual framework, regression
analysis was employed. In this section the coefficient of determination (R square) was used
as a measure of the explanatory power, to show how the independent variables explain the
dependent variable. The F statistics (ANOVA) was used as a measure of the model
goodness of fit. The regression coefficient summary was used to explain the nature of the
relationship between the dependent and independent variables.
Table 4.5: Model Summary
Model R R Square Adjusted R Square Std. Error of the
Estimate
1 0.804053 0.646501 0.616543 1.035581
The model summary shows that R2 (coefficient of determination) of 0.646 implies that
64.6% of the financial performance in pharmaceutical firms in Kenya can be explained by
leverage, ownership structure, and firm size. The adjusted R-square of 0.616 shows that
ownership structure; leverage and firm size in exclusion of the constant variable explains
the change in financial performance of Pharmaceutical firms in Kenya by 61.6%. The
remaining percentage can be explained by other factors excluded from the model.
Table 4.6: ANOVA
Sum of
Squares Df
Mean
Square F Sig.
Regression .147 3 .029 3.728 0.01b
Residual .232 29 .008
Total .379 32
a. Dependent Variable: ROA
b. Predictors: (Constant), Leverage, Ownership structure, Firm Size

38
The study sought to determine whether there was a significant influence of firm size,
ownership structure, and leverage on the financial performance of Pharmaceutical firms in
Kenya.
The finding on the ANOVA for regression coefficient (see Table 4.6 shows that (F=3.728,
p value = 0.010). Because p-value is less than 0.05 it depicts that there is a significant
relationship between firm size and financial performance, leverage and financial
performance, ownership structure and financial performance of pharmaceutical firms in
Kenya.
Table 4.7: Regression Coefficients
Model Unstandardized Standardized T Sign.
Coefficients Coefficients
B Std error Beta
1 (Constant) -.391 .524 -.746 .000
Firm size .128 .029 .379 .989 .000
Leverage . 409 .289 .409 .578 .003
Ownership
structure . 387 .005 .387 2.154 .002
Dependent Variable: ROA
The resulting multivariate linear regression model is as follows:
The various coefficients are shown on the first column with an intercept of -0.391 which
shows that if all the three predictors (firm size, leverage, ownership structure,) were to be
equated to zero, then ROA will be -0.391. The firm size beta coefficient is 0.128 which
implies that if the size of the firm was to be increased by 1 unit of the total of assets, then
a corresponding increase of ROA by 0.128 will also be realized. Likewise, an increase in
one unit of leverage will translate to 0.409 increase in ROA. Similarly, if one-unit increase

39
of ownership structure from insider to outsider were to be realized then ROA would be
increased to 0.387.
The results indicate that leverage significantly influence financial performance of
pharmaceutical firms in Kenya. The findings also depict that firm size significantly impacts
on financial performance of the pharmaceutical firms in Kenya. Insider ownership structure
had a significant effect on the financial performance of Pharmaceutical firms in Kenya.
4.5 Chapter Summary
This chapter presented the findings from the study, which was guided by the research
questions in chapter two. The next chapter covered discussion, conclusion and
recommendations.

40
CHAPTER FIVE
5.0 DISCUSSION, CONCLUSIONS AND RECOMMENDATIONS
5.1 Introduction
This section sought to analyze the findings and was done by comparing and contrasting
previous literature on factors affecting firm performance. It was organized based on the
specific research questions which sought to establish the influence of firm size, leverage,
and ownership structure on the financial performance of Pharmaceutical firms in Kenya.
The study chapter is organized into sections namely summary of the findings, discussion,
conclusions, and recommendations.
5.2 Summary
The purpose of this study was to examine the determinants of financial performance of
pharmaceutical firms in Kenya. The study sought to answer the following research
questions: What is the influence of firm size on financial performance of pharmaceutical
firms in Kenya? What is the influence of leverage on financial performance of
pharmaceutical firms in Kenya? What is the influence of ownership structure on financial
performance of pharmaceutical firms in Kenya?
The study employed longitudinal design to analyze the determinants of financial
performance of pharmaceutical firms in Kenya. The target population of the study was
thirty-seven pharmaceutical firms in Kenya. The sample size in this study was thirty-seven
pharmaceutical firms. The study relied mainly on secondary data. Data were obtained from
audited financial reports. Data was analyzed using both descriptive and inferential analyses.
IBM SPSS was used as the tool for data analysis. Data was presented in the form of charts,
graphs, and tables.
The study established that there was a significant influence of firm size on the financial
performance of pharmaceutical firms in Kenya. The analysis showed that an increase in
firm size led to a rise in financial performance of pharmaceutical firms in Kenya.
Regression analysis also revealed that a unit increase in firm size increased financial
performance of pharmaceutical firms by 0.128.
The study also revealed that there was a significant influence of leverage on the financial
performance of pharmaceutical firms in Kenya. The analysis also revealed that an increase

41
in leverage increased financial performance of pharmaceutical firms in Kenya. Regression
analysis further revealed that a unit increase in leverage led to a rise in financial
performance of pharmaceutical firms by 0.409.
Findings further show that there was a significant influence of ownership structure on the
financial performance of pharmaceutical firms in Kenya. The analysis also revealed that
majority of the firms had insider ownership structure and had an increased financial
performance over the years.
5.3 Discussion
5.3.1 Influence of Firm Size on Financial Performance
The study found a significant relationship between firm size and financial performance of
pharmaceutical firms in Kenya. The results of this study contradict that of Niresh and
Velnampy (2014) who carried out a study in Sri Lanka entitled: “Firm size and financial
performance: A study of pharmaceutical firms in Sri Lanka.” To add on that, the results
showed that firm size had no profound impact on financial performance of the
pharmaceutical firms in Sri Lanka.
The results of this study concur with that of Aggrey, Eseza and Stella (2014) who carried
out a study in Uganda entitled: “Firm size and rate of growth of Ugandan Manufacturing
Firms.” From their regression results, it was confirmed that medium firms significantly
grow faster than the small firms and large firms, contradicting the Porters "stuck in the
middle" hypothesis. Regression results also showed a significant influence of firm size on
financial performance, a finding that is consistent with Gibrat’s law.
The findings of this study concur with that of Babalola (2013) who carried out a study in
Nigeria entitled: The Effect of Firm Size on Firms' Profitability in Nigeria.” He found out
that firm size, both concerning total assets and regarding total sales, had a positive
significant impact on the profitability of manufacturing companies in Nigeria.
This study also concurs with that of Abdukadir (2016) who also carried out a study in Kenya
entitled: "Effect of Leverage, Ownership Structure and Firm Size on the Financial
Performance of Listed Non-Financial Firms in Kenya." The study established that
ownership structure and firm size significantly influenced the financial performance of
listed non-financial firms in Kenya positively.
42
5.3.2 Influence of Leverage on Financial Performance
The study found a significant relationship between leverage and financial performance. The
regression analysis indicated that increase in leverage would translate to increase in ROA.
The research findings contradict that of Agu, Enekwe and Eziedo (2014) who investigated,
“The Effect of Financial Leverage on Financial Performance of Quoted Pharmaceutical
Companies in Nigeria.” The results of the analysis showed that debt ratio (DR) and debt-
equity ratio (DER) had insignificant relationship with Return on Assets (ROA) while
interest coverage ratio (ICR) had a significant relationship with Return on Assets (ROA) in
Nigeria pharmaceutical industry.
This study also differs with that of Olly (2014) who did a study on, “Debt Financing and
its Effect on the Value of the Pharmaceutical Firms in Peru.” Debt ratio was the proxy of
debt financing. According to the study, the application of financial leverage leads into two
distinctive outcomes, either a gain or exposure to risks.
This study differs with that of Burakat (2014) who focused on how financial performance
of Saudi pharmaceutical firms was affected by financial leverage. He reasoned that there is
insignificant relationship between financial leverage and financial performance.
This study differs with that of Kamar (2014) who analyzed, “Financial Leverage and its
Impact on the Profitability in Saudi Pharmaceutical Firms.” 340 pharmaceutical firms were
considered for the study however, just 152 firms were chosen as the sample for the
investigation. The websites of the firms were the main data sources. Linear regression
model adopted was well organized and efficient. From the study, he confirmed insignificant
relationship between financial leverage and profitability in Saudi pharmaceutical firms.
The study concurs with that of Pandey and Ponni, (2017) who did a study on, “Corporate
Leverage and Profitability of Pharmaceutical Industry in India.” The study was based on
secondary data. 37 pharmaceutical firms listed in National Stock Exchange (NSE) were
considered for analysis during the study period. Three independent variables Financial
Leverage (FL), Operating Leverage (OL), and Combined Leverage (CL) and three
dependent variables Return on Assets (ROA), Return on Equity (ROE) and Earning Per
Share(EPS) were used and tested by using regression and correlation analysis as statistical
tools. The findings of the study indicated that there is a significant impact of CL and OL
on Profitability. ROA, ROE and EPS had significant impact on the CL on profitability as
chosen by pharmaceutical Industry in India for the study period.

43
5.3.3 Influence of Ownership structure on Financial Performance
The study showed that insider ownership structure significantly exhibited a significant
relationship with financial performance as measured by ROA. Similar to the study findings,
Tang, Tao and Wu (2014) did a study research on “The Relationship between Ownership
Structure and Corporate Performance of Pharmaceutical Industry in Indonesia.” The study
revealed that ownership concentration and corporate performance showed a significant
correlation, at the same time, equity restriction and corporate performance also had a
significant relationship to a certain degree, which provides a reference for the future
development of the pharmaceutical industry.
Contrary to the study findings, Jiang and Xu (2014) did a study on ‘The Empirical Study
of Ownership Structure and Performance of Listed Companies Based on Manufacturing in
Sri-Lanka.’ The study revealed that the ownership structure does not have significant
correlation on corporate performance, for non-competitive industries.
The research findings concur with that of Malik, (2015) who did an investigation of ‘The
Association between Ownership Structure and Financial Performance of Pharmaceutical
Companies in India.” The paper found out that promoters' shareholding is significantly
related to both the financial measures i.e. Return on Equity (ROE) and Return on Assets
(ROA).
This study differs with that of Olly, (2014) who argues that there is insignificant
relationship between foreign institutional shareholding and financial performance
measures. The same insignificant relationship was found between Indian institutional
shareholding and ROE, but ROA is insignificantly affected by the Indian Institutional
shareholding.
To improve the performance and the value of companies accordingly, the percentage of
promoters' ownership should be increased as it has positive linkage with the financial
performance. Further, it will help the investors to pay special attention to the type of
ownership and ownership concentration of companies while making the investments.
5.4 Conclusions
5.4.1 Influence of Firm Size on Financial Performance
The study concludes that firm size had a significant influence on financial performance of
pharmaceutical firms in Kenya. Firm size had a beta coefficient of 0.128 which implies that

44
if the size of the firm was to be increased by 1 unit of the total assets, then a corresponding
increase of ROA by 12.8% will increase as well.
5.4.2 Influence of Leverage on Financial Performance
Based on the findings it can be concluded that leverage had a significant influence on
financial performance of in pharmaceutical firms in Kenya. The regression analysis showed
that increase in one unit of leverage translates to 40.9% increase to the financial
performance of pharmaceutical firms in Kenya.
5.4.2 Influence of Ownership structure on Financial Performance
The study further concludes that ownership structure had a significant influence on
financial performance of in pharmaceutical firms in Kenya. Insider to outsider ownership
structure would lead to an increase in financial performance of pharmaceutical firms in
Kenya.
5.5 Recommendation
5.5.1 Recommendation for Improvement
5.5.1.1 Influence of Firm Size on Financial Performance
Pharmaceutical firms in Kenya should ensure optimal size of assets that are required in
order to avoid company bankruptcy and improve efficiency and performance. Specifically,
the managers of the pharmaceutical firms should focus on growing their firms to ensure
that they enjoy the economies of scale associated with large firms and the profits they bring
thus improve their financial performance.
5.5.1.2 Influence of Leverage on Financial Performance
The study recommends that pharmaceutical firms should source for cost effective sources
of finance that will not lead to exhaustion of the earnings of the firms. Firms should also
negotiate for better and longer credit terms in relation to repayment terms and interest rates.
Particularly, the managers of the pharmaceutical firms in Kenya should employ minimal
debt level or use an optimal debt level which will not affect the firm’s financial
performance.
5.5.1.3 Influence of Ownership structure on Financial Performance
The results of the current study have shown that majority of the pharmaceutical firms in
Kenya have insider ownership which implies that the ownership is concentrated on a few

45
hands. Therefore, this study recommends that there is dire need to reasonably diversify
shareholding as a way of attracting more skills and competencies among the shareholders
that can be tapped to improve firm performance.
5.5.2 Recommendations for Further Studies
This study looked at the determinants of financial performance among pharmaceutical
firms in Kenya. The focus was on three determinants of financial performance namely firm
size, leverage, and ownership structure, thus, other studies should focus on other
determinants of financial performance such as asset structure firm age of the firm among
others. Additionally, other studies should focus on other industries since the current study
mainly focused on the pharmaceutical firms.

46
REFERENCES
Abdukadir, B. S. A. (2016). The Effect of Leverage, Liquidity, and Firm Size on Financial
Performance of Listed Non-Financial Firms in Kenya. Journal on Corporate
Finance, 3(4), 43-45.
Achoki, & Kanga, S. (2016). Liquidity and Financial Performance in Firms Listed in the
Nairobi Securities Exchange in Kenya. International Journal of Business and Social
Science, 7 (7), 57-65.
Adams, M., & Buckle, M. (2013). The Determinants of Corporate Financial Performance
in the Bermuda Stock Exchange. Applied Financial Economics, 13(2), 133-143.
Adelakun, O., Agbeja, O., & Olufemi, F. (2015). Capital Adequacy Ratio and Firms
Profitability in Nigeria. A Linear Approach. International Journal of Novel
Research in Marketing Management and Economics, 2 (3), 91-99.
Aggrey, N., Eseza, K., & Stella, B. (2014). Firm Size and Rate of Growth of Ugandan
Manufacturing Firms. Journal of Applied Economics & Business Research, 4(4),
17- 18.
Agha, N. C., & Ejike, S. I. (2018). Impact of Operating Liquidity on Profitability of
Pharmaceutical Firms in Nigeria. International Journal of Academic Research in
Accounting, Finance and Management Sciences, 8(3), 73-82.
Agu, C. I., Innocent, C. E. & Nnagbogu, E. K. (2014). The Effect of Financial Leverage on
Financial Performance: Evidence of Quoted Pharmaceutical Companies in
Nigeria. Journal of Economics and Finance, 5(3), 17-25.
Aitken, B. J., & Harrison, A. E. (2015). Do Domestic Firms Benefit from Direct Foreign
Investment? Evidence from Venezuela. Venezuelan Economic Review, 89(3), 605-
618.
Akbarian, S. (2013). Investigation on the Effect of Financial Leverage and Environment
Risk on Performance of Firms of Listed in Tehran Stock Exchange. Journal of
Applied Science and Business, 8(3), 249-255.
Akhtegan, N., Fard, R. Y., Fengju, X., Maher, L. G. (2013). The Relationship between
Financial Leverage and Profitability with an Emphasis on Income Smoothing in

47
Iran’s Capital Market. European Online Journal of Natural and Social Sciences,
2(3), 156–164.
Ali, M. (2017). Effect of Firm Size on the Relationship between Strategic Planning
Dimensions and Performance of Manufacturing Firms in Kenya. Journal on
Business and Applied Sciences, 1(2), 20-23.
Alipour, M. (2013). An investigation of the Association between Ownership Structure and
Corporate Performance: Empirical evidence from Tehran Stock Exchange (TSE).
Management Research Review, 36(11), 1137-1166.
Alkhatib, K. (2012). The Determinants of Leverage on Companies in Industrial and Service
Sector Listed in Jordanian Stock Exchange. International Journal of Business and
Social Science, 3(24), 78–83.
Alshatti, A. (2015). Effect of Liquidity Management on the Profitability of Jordanian
Commercial Entities. International Journal of Business and Management, 10(1),
62- 71.
Arnold, J. M., & Javorcik, B. S. (2013). Foreign Direct Investment and Plant Productivity
in Indonesia. Journal of International Economics, 79(1), 42-53.
Baba, M. C. (2016). Evaluating the Financial Performance of Companies in the
Pharmaceutical Industry in the United States of America. Bulletin of the
Transylvania University of Brasov. Economic Sciences. Series V, 9(2), 223.
Babalola, Y. A. (2013). The Effect of Firm Size on Firms’ Profitability in Nigeria. Journal
of Economics and Sustainable Development, 4(5), 90-94.
Bahar, M. N., & Kheradmand, A. (2013). Analysis of Financial Statements: Case Study of
Elder and FDC Pharmaceutical Companies. International Journal of Research
Finance and Market, 3(5), 32- 43.
Banafa, A., Muturi, W., & Ngugi, K. (2015). The Impact of Leverage on Financial
Performance of Listed Non-Financial Firms in Kenya. International Journal of
Finance and Accounting, 4 (7), 1-20.

48
Barbosa, N., & Louri, H. (2013). Corporate Performance: Does Ownership Matter? A
Comparison of Foreign and Domestic Owned Firms in Greece and Portugal. Review
of Industrial Organization, 27(1), 73-102.
Bassey, A., Edu, G., & Enang, R. (2016). Academic Research in Accounting Based on
Companies Listed in Nigerian Stock Exchange. Finance and Management
Sciences, 6 (1), 41–48.
Berghe, V. & Levrau, L. (2015). Corporate Governance and Board Effectiveness in
Belgium. Economics and Business Administration, Ghent University, Belgium,
4(2), 30.
Bjuggren, P. O., Eklund, J. E., & Wiberg, D. (2015). Ownership structure, Control and Firm
Performance of Swedish Manufacturing Companies. The Effects of Vote-
Differentiated Shares. Applied Financial Economics, 17(16), 1323-1334.
Bohren, O., & Odegaard, B. A. (2013). Corporate Governance and Economic Performance
in Norwegian Listed Firms. Research Reports, 11(30), 5-10.
Bell, E., & Bryman, A. (2015). Ethics in Business Research. Business Research
Methods, 7(5), 23-56.
Brown, A. K. (2017). Corporate Governance Practices, Ownership Structure, and
Corporate Performance in the GCC countries. Journal of International Financial
Markets, Institutions and Money, 46, 98-115.
Butt, S., & Hassan, A., (2015). Impact of Ownership Structure and Corporate Governance
on Capital Structure of Pakistani Listed Companies. International Journal of
Business and Management, 4(2), 50-57.
Capon, N., Farley, J., & Hoenig, S. (2013). Determinants of Financial Performance of
Pharmaceutical Firms in India: A Meta-Analysis. Management science, 36(10),
1143-1159.
Cespedes, J., Gonzalez, M., & Molina, C. (2010). Ownership and Capital Structure in Latin
America. America Journal of Business Research, 63(3), 248–254.
Chakraborty, K., & Sur, D. (2016). Financial Performance of Indian Pharmaceutical
Industry: An Inter-Company Analysis. BIT Journal, 10(1), 7-10.

49
Chapple, L., Clarkson, P. M., & Overell, M. B., (2011). Environmental Reporting and its
Relation to Corporate Environmental Performance. Abacus, 47(1), 27-60.
Chizema, A., & Trien L. (2011). State Ownership and Firm Performance: Evidence from
the Chinese Listed Firms. Organization of Marketing of Emerging Economies, 2,
72-90.
Cho, M. H. (2014). Ownership Structure, Investment, and the Corporate Value: An
Empirical Analysis of Manufacturing Companies in Indonesia. Journal of financial
Economics, 47(1), 103-121.
Chung, K. H., & Pruitt, S. W. (2014). A Study of Ownership Structure of Manufacturing
Companies in Rome. Financial management, 3(2), 70-74.
Claessens, S. (2013). Ownership Concentration and Corporate Performance in the Czech
Republic. Journal of Comparative Economics, 27(3), 498-513.
Cooper, D. R., & Schindler, P. S. (2011). Qualitative Research. Business research
methods, 4(1), 160-182.
Cousins, P. D., Giunipero, L., Handfield, R. B., & Eltantawy, R. (2006). Supply
Management Evolution: Key Skill Sets for the Supply Management for the
Future. International Journal of Operations & Production Management, 3(5), 10.
Damouri, D. (2013). The Relationship Between Changes in the Financial Leverage and the
Values of Tehran Listed Firms. International Journal of Academic Research in
Accounting, Finance and Management Sciences, 3(3), 198-210.
Dell'Ariccia, G. (2017). Firm Leverage and Monetary Policy Risk Taking Channel:
Evidence from the United States. The Journal of Finance, 72(2), 613-654.
Demsetz, M., Kole S., & Len, J., (2014). Further Evidence on Firms’ Ownership Structure
and Corporate Value. Corporate Governance, 4(5), 167-207.
Demsetz, M. (2015). The Structure of Ownership and the Theory of the Firm. The Journal
of Law and Economics, 26(2), 375-390.
Demsetz, H., & Lehn, K. (2011). The Structure of Corporate Ownership: Causes and
Consequences. Journal of Political Economy, 93(6), 1155-1177.

50
Demsetz, H., & Villalonga, B. (2016). Ownership Structure and Corporate Performance of
Manufacturing Firms in Uganda. Journal of Corporate Finance, 7(3), 209-233.
Denis, D. K., & McConnell, J. J. (2015). International Corporate Governance. Journal of
Financial and Quantitative Analysis, 38(1), 1-36.
Doms, M. E., & Jensen, J. B. (2014). Comparing Wages, Skills, and Productivity Between
Domestically and Foreign Owned Manufacturing Establishments in the United
States. Geography and Ownership as Bases for Economic Accounting, 2(5), 235-
258.
Duca, F. (2012). Study on the Relationship Between Financial Performance and Leverage:
Empirical Evidence on Bucharest Stock Exchange. Romanian Statistical Review,
6(2016), 45–48.
Edem, D. B. (2017). Liquidity Management and Performance of Deposit Money Banks in
Nigeria (1986–2011): An Investigation. International Journal of Economics,
Finance and Management Sciences, 5(3), 146-161.
Egbide, B., Olubukunola, U., & Uwuigbe, U. (2013). Liquidity Management and
Profitability of Manufacturing Companies in Nigeria. Journal of Business and
Management, 9(1), 13-21.
Ehiedu, V. (2014). The Impact of Liquidity on the Profitability of Selected Companies in
Nigeria. The Financial Statement Analysis (FSA) Approach. The International
Institute of Science and Technology and Education (IISTE), 5(5), 72-80.
Eisenhardt, M. (2011). Agency Theory: An Assessment and Review of Corporate Firms.
Academy of Management Review, 14(1).
Eljelly, A. M. (2013). Internal and External Determinants of Profitability of Manufacturing
Firms in Sudan. Afro-Asian Journal of Finance and Accounting, 3(3), 222-240.
Fama, E. F., & French, M. C. (2014). Separation of Ownership and Control. The journal of
Law and Economics, 26(2), 301-325.
Fu, X. & Hefferman, S. A. (2010). Determinants of Financial Performance in Chinese
Firms. Applied Financial Economics, 20(20), 1585-1600.
51
Girma, S. (2015). The Impact of Merger Activity on Executive Pay in the United
Kingdom. Economics, 73(290), 321-339.
Goodman, M. (2009). Pharmaceutical Industry Financial Performance in the United States.
Journal of Business Administration, 5(2), 50-51.
Groen, A. J., Kraaijenbrink, J., & Spender, J. (2015). The Resource Based View: A Review
and Assessment of Firms’ Critiques. Journal of management, 36(1), 349-372.
Grossman, S. J., & Hart, O. D. (2015). One Share-One Vote and the Market for Corporate
Control. Journal of Financial Economics, 20, 175-202.
Gyansah-Lutterodt, M., & Harper, J. (2015). The Viability of Pharmaceutical
Manufacturing Firms in Ghana to Address Priority Given to Endemic Diseases in
the West Africa Sub-Region. Applied Sciences and Business, 5(3), 5-6.
Hill, C. W., & Snell, S. A. (2011). Effects of Ownership Structure and Control on Corporate
Productivity. Academy of Management journal, 32(1), 25-46.
Hitt, M. A., Hoskisson, R. E., & Ireland, R. D., (2015). Strategic Management: Concepts:
Competitiveness and Globalization: The Internal Organization: Resources,
Capabilities, Core Competencies and Competitive Advantages. South Melbourne:
South-Western Cengage Learning, 3(4), 15-18.
Jensen, M. (2011). Behavior of Agency Costs and Ownership Structure; Journal of
Financial Economics, 3(4), 350-360.
Jhee, R. (2014). The Influence of the Pharmaceutical Industry on Healthcare Practitioners’
Prescribing Habits. The Internet Journal of Academic Physician Assistants, 7(1), 4.
Jiang, H., Li, D., & Wang, A. (2017). Dynamics of Liquidity Management by
Manufacturing Firms in Indonesia. Business and Finance, 2(4), 6-7.
Jiang, N. G. (2015). Empirical Study of Ownership Structure and Performance of
Pharmaceutical Companies in Indonesia. The Journal of Finance, 45(2), 643-654.
Jiang, Y., & Xu, L. (2014). The Empirical Study of Ownership Structure and Performance
of Listed Companies Based on Manufacturing in Sri-Lanka. Journal of Chemical
and Pharmaceutical Research, 6(7), 262-273.
52
John, C. (2013). A Theory of Corporate Scandals: Why the U.S. and Europe differ.
Columbia Law and Economics, 5(3), 274.
Johnson, S. R. (2013). Measuring Managerial Equity Ownership: A Comparison of Sources
of Ownership data. Journal of Corporate Finance, 1(2), 413-435.
Jurgen, W. (2013). Does the Governed Corporation Perform Better? Governance Structures
and Corporate Performance in Germany. Review of Finance, 4(2), 157-195.
Kabiru, J., Kalunda, E. & Nduku, B. (2012). Pharmaceutical Manufacturing Companies in
Kenya and Their Credit Risk Management Practices. Research Journal of Finance
and Accounting, 4(3), 20-25.
Kaddumi, T. A., Kilani, Q. A., & Ramadan, I. Z. (2011). Determinants of Firms
Profitability. Evidence from Jordan. International Journal of Academic
Research, 3(4), 10-15.
Kamar D.K. (2014). Financial Leverage and its Impact on the Profitability of Saudi Arabia
Pharmaceutical Firms, Journal on Business and Finance, 2(2), 8-10.
Karamehic, J., (2013). Financial Aspects and the Future of the Pharmaceutical Industry in
the United States of America. Materia socio-medica, 25(4), 286.
Karthikeyan, K., & Sheela, S. C. (2012). Financial Performance of Pharmaceutical Industry
in India Using DuPont Analysis. European Journal of Business and
Management, 4(14), 84-91.
Kaur, K., & Kumar, N. (2016). Firm Size and Profitability in Indian Pharmaceutical
Industry. Pacific Business Review International, 8 (7), 69-78.
Keasey, K., & Short, H. (2015). Managerial Ownership and the Performance of Firms:
Evidence from the United Kingdom. Journal of Corporate Finance, 5(1), 79-101.
Konings, J. (2013). The Effects of Foreign Direct Investment on Domestic Firms in
Emerging Economies. Economics of Transition, 9(3), 619-633.
Kusa, G. B., Ongore, V.O. (2013). Determinants of Financial Performance of Commercial
Entities in Kenya. International Journal of Economics and Financial Issues, 3(1),
237-252.

53
La Porta, R. (2015). Investor Protection and Corporate Governance. Journal of financial
Economics, 58(1-2), 3-27.
Lawrence, M. Y. (2010). Management Ownership and Corporate Value. Managerial and
decision economics, 14(4), 335-346.
Leech, T. (2015). The Next Frontier for Boards. Oversight of Risk Culture. Journal on Risk
Management, 52(4), 1-16.
Leslie, J. B., & Palmisano, K. (2014). The Leadership Challenge in the Pharmaceutical
Sector. Center for Creative Leadership, 2(1), 9-11.
Lewis, P., Saunders, M., & Thornhill, A. (2015). Research Methods for Business Students
in England. Business and Applied Science, 3(2), 45-50).
Lins, K. V. (2015). Ownership structure, Corporate Governance, and Firm Value: Evidence
from the East Asian Financial Crisis. The journal of finance, 58(4), 1445-1468.
Liouiand, A., Sharma, Z. & Qui M. (2012). Environmental Corporate Social Responsibility
and Financial Performance: Disentangling Direct and Indirect Effects. Ecological
Economics, 78, 100-111.
Loderer, C., & Martin, K. (2014). Executive Stock Ownership and Performance Tracking
of Firms in Peru. Journal of Financial economics, 45(2), 223-255.
Maaka, Z. A. (2013). The Relationship between Liquidity Risk and Financial Performance
of Commercial Entities in Kenya. Journal of Management, 36(1),49-72.
Malik, S. (2015). An Investigation of the Association between Ownership Structure and
Financial Performance of Pharmaceutical Companies in India: A Panel
Study. Pacific Business Review International, 8(5), 1-10.
Matengo, M. (2014). The Relationship between Corporate Governance Practices and
Performance of Firms. Business and Finance, 3(5), 6-19.
McWilliams, J. C., & Siegel, D. A. (2010). Relationship between Firm Size and Financial
Performance of Industries in Romania. Business and Finance, 4(1), 31-48.
Merozwa, G. (2015). Liquidity and Firm Performance. International Journal of Economics
and Business Research, 14(3):453-462.

54
Mohideen, O. H., & Parveen, M. (2014). A Study on Financial Performance of
Pharmaceutical Companies Using Five Power Analyses. International Journal of
Business Management & Research, 1(4), 45-50.
Morris, K. A. (2016). The Causal Effect of Corporate Governance on Corporate Social
Responsibility. Journal of Business Ethics, 106(1), 53-72.
Muigai, G., & Muriithi, J. (2017). The Moderating Effect of Firm Size on the Relationship
Between Capital Structure and Financial Distress of Non-Financial Companies
Listed in Kenya. Journal of Finance and Accounting, 5 (4), 151-158.
Muiva. C. (2013). A survey of the Use of Competitive Intelligence Systems in Kenyan
Pharmaceutical industry. Journal on Applied Sciences, 4(8), 30-32.
Muthu G. M., Sathish A.J, Prakash R.A., & Rama K. U. 2016). Analysis of Financial
Performance of Pharmaceutical Companies Using Z Score Model in Saudi Arabia.
International Journal of Business Management & Research, 2(3), 21-36.
Muturi, W. & Omondi, O. M. (2013). Factors Affecting the Financial Performance of
Listed Companies at the Nairobi Securities Exchange in Kenya. Research Journal
of Finance and Accounting, 4 (15), 99 – 104.
Nair, J. (2013). Performance Analysis and Solvency Prediction of Indian Pharmaceutical
Companies. International Journal of Marketing, Financial Services & Management
Research, 2(5), 34-43.
Naseem, M. A., Saleem, Q., Sultana, N., & Ur, Rahman (2013). Leverage Analysis and its
Impact on Profitability with Reference to Selected Companies of Pakistan.
International Journal of Management Sciences and Business Research, 1(12), 70–
80.
Niresh, A., & Velnampy, T. (2014). Firm Size and Profitability: A Study of Listed
Manufacturing Firms in Sri Lanka. International Journal of Business and
Management, 9 (4), 57-64.
Njoroge, I. (2015). Effect of Liquidity on the Financial Performance of Manufacturing and
Allied Companies Listed at the Nairobi Stock Exchange. Journal of Accounting and
Finance, 8(5), 30-40.

55
Noah, E., & Waithaka, M. (2013). Pharmaceutical industry in Kenya 2013. Export
Processing Zones Authority, Nairobi, 5(4), 6-7.
Nor, F. M., & Sulong, Z. (2014). The Integration Effect of Ownership Structure and Board
Governance on Dividends: Evidence from Malaysian Listed Firms. Capital
Markets Review, 15(1&2), 73-101.
Nyamita, M. O. (2014). Factors Influencing Debt Financing and Its Effects on Financial
Performance of State Corporations in Kenya. Journal of Accounting and Business,
5(4), 20-25.
Olly K. (2014). Debt Financing and its Effect on the Value of the Pharmaceutical Firms in
Peru. Journal on Finance, 6(1), 4-6.
Oman, C. P. (2001). Corporate Governance and National Development. Journal on
Business Management, 3(5), 8-9.
Omesa, J. (2015). Effect of Liquidity on the Financial Performance of Non-Financial
Institutions Listed at the Nairobi Stock Exchange. Journal of Finance, 9(7), 50-55.
Owuoth, R. (2010). Critical Success Factors in the Pharmaceutical Industry: A Survey of
Multi-National Pharmaceutical Companies in Kenya. Journal on Applied Sciences,
2(3), 20-25.
Pandey, N. S., & Ponni, R. (2017). A Study on Corporate Leverage and Profitability of
Pharmaceutical Industry in India: An Empirical Analysis. Pacific Business Review
International, 10(6), 111-124.
Pandey, T. (2010). Capital Structure in Romania Pharmaceutical Firms. The Journal of
Economic Perspectives, 15(2), 81-102.
Panigrahi, T. (2014). Does Size Matter in Firm Performance? Evidence from US Public
Firms. International Journal of the Economics of Business, 16 (2): 189-203.
Peavler, H. (2016). Performance and Size: Empirical Evidence from Portugal SMEs. Small
Business Economics, 31 (2), 195 – 217.
Pérez-González, F. (2013). The Impact of Acquiring Control on Productivity in Mexican
Firms. Business and Finance, 2(3), 5-9.

56
Perrini, F., Rossi, G., & Rovetta, B. (2014). Does Ownership Structure Affect
Performance? Evidence from the Italian Market. Corporate Governance: An
International Review, 16(4), 312-325.
Pervan, M., & Višić, J. (2012). Influence of Firm Size on Business Success. South Asian
Operational Research Review, 3(1), 213-223.
Petkova, N. (2014). Does Foreign Ownership Lead to Higher Firm Productivity in India?
University of Oregon, Department of Finance, 3(4), 10-14.
Qiu, Y. (2012). Empirical Study between CSR Financial Performance of Chinese Listed
Companies. School of Business and Information, 1(2), 1–57.
Rajkumar, P. (2014). Impact of Financial Leverage on Financial Performance of
Pharmaceutical Firms in India. Scientific Research Journal, 2(2), 15-20.
Sayedi, S., (2013). Macroeconomic Determinants of Profitability of Industries in Nigeria.
Journal of Finance, 10(3), 10-15.
Seethaiah, R. O. (2012). Financial Risk, Capital Structure and the Performance of Listed
Companies in Nigeria Stock Exchange. Journal on Business and Finance, 3(4), 10-
15.
Shah, S. (2015). Corporate Governance and Financial Performance: A comparative study
of Developing and Developed Markets in Pakistan. Business and Marketing, 2(4),
35-40.
Shleifer, A., & Vishny, R. W. (2014). A Survey of Corporate Governance. The Journal of
Finance, 52(2), 737-783.
Sima, S. B. (2015). The Corporate Social Performance: Financial Performance
Link. Strategic Management Journal, 18(4), 303-319.
Smith, R. E., & Wright, W. F. (2014). Determinants of Customer Loyalty and Financial
Performance. Journal of Management Accounting Research, 16(1), 183-205.
Sonal, A., (2015). Changing Contours of the Indian Stock Market: Trends, Issues, and the
Way Forward. The Journal of Structured Finance, 22(4), 31-45.
Srivastava, A. (2011). Ownership Structure and Corporate Performance: Evidence from
India. International Journal of Humanities and Social Science, 1(1), 85- 101.

57
Sulong, R. (2014). Effect of Dividends, Ownership Structure and Board Governance on
Firm Value of Listed Firms in Malaysian Stock Exchange. Business and Economics,
3(3), 4-6.
Tang, Y., Tao, V., & Wu, D. (2014). Relationship Between Ownership Structure and
Corporate Performance of Pharmaceutical Industries in Indonesia. Business and
Applied Sciences, 2(4), 5-8.
Villalonga, B. (2016). How does Family Ownership, Control, and Management Affect Firm
Value? Journal of Financial Economics, 80(2), 385-417.
Vinayak R. (2013). Strategic Marketing of Pharmaceutical Products in Kenya. Journal on
Strategic Management, 2(4), 35-37.
Wruck, K. H. (2011). Equity Ownership Concentration and Firm Value: Evidence from
Private Equity Financings. Journal of Financial Economics, 23(1), 3-28.
Wanrapee, B., & Xu, M. (2014). Factors Affecting Financial Performance of Firms Listed
on Shanghai Stock Exchange. Journal of Finance and Business, 5(5), 19-20.
Yount, S. (2016). A Design of Science Research Methodology for Information Systems
Research. Journal of Management Information Systems, 24(3), 45-77.
Zeng, Y. (2017). A Dynamic Theory of how Firms Are Run on Liquidity in Order to Make
Profits. Guidelines in Business Management, 1(3), 36-40.
Zhuang, J. (2015). Some Conceptual Issues of Corporate Governance in Indonesia.
Business and Management, 2(4), 5-7.

58
APPENDICES
APPENDIX 1: DATA COLLECTION CHECKLIST
Source 2014 2015 2016 2017 2018
ROA
Net income/
Average
Shareholders’
Equity
Firm Size Total Assets
Leverage Total
Liabilities/
Total Equity
Ownership
structure
(Measured
Ownership
concentration)
A dummy
variable where
1= insider and
0= outsider

59
APPENDIX 1I: LICENSED PHARMACEUTICAL MANUFACTURING
COMPANIES
NAME OF THE COMPANY
1 Autosterile (E.A) Ltd
2 Aesthetics
3 Beta Healthcare, Int. Ltd
4 Benmed Pharmaceuticals Ltd
5 Biodeal Laboratories Ltd
6 Biopharma Limited
7 Comet Healthcare Ltd
8 Cooper (K) Brands
9 Cosmos Limited
10 Concept Africa Ltd
11 Dawa Limited
12 Elys Chemical Industries ltd
13 Glaxo SmithKline Ltd
14 Hightech Pharmaceuticals ltd
15 Infusion Medicare
16 Ivee Aqua Epz Ltd
17 Kenya Veterinary Vaccine Production
18 Kenya Medical Research Institute
19 Kenya society For the blind
20 Laboratory And Allied Ltd
21 Mac's Pharmaceuticals Ltd

60
22 Manhar Brothers
23 Medivet Products Ltd
24 Nerix Pharma Ltd
25 Norbrook Kenya Ltd
26 Novelty Pharmaceutical
27 Oss Chemie Ltd
28 Pharmaceutical Manufacturing Company
29 PZ Cussons E.A Ltd
30 Reckitt & Colman Ltd
31 Regal Pharmaceuticals
32 Sphinx Pharmaceutical
33 Skylight chemicals
34 Syner Chemie Limited
35 Stedman pharma Manufacturing Ltd
36 Universal Cooperation Ltd
37 Ultravetis East Africa

61
APPENDIX III: ROA
Name of Company 2014 2015 2016 2017 2018
Autosterile (E.A) Ltd 0.038 0.119 0.094 0.034 0.001
Aesthetics 0.106 0.044 0.042 0.116 0.084
Beta Healthcare, Int. Ltd 0.04 0.061 0.012 0.011 0.101
Benmed Pharmaceuticals Ltd 0.318 0.083 0.001 0.021 0.139
Biodeal Laboratories Ltd 0.014 0.01 0.003 0.069 0.078
Biopharma Limited 0.118 0.107 0.087 0.027 0.08
Comet Healthcare Ltd 0.047 0.046 0.034 0.014 0.008
Cooper (K) Brands 0.292 0.214 0.004 0.037 0.107
Cosmos Limited 0.055 0.109 0.023 0.038 0.077
Concept Africa Ltd 0.047 0.037 0.037 0.035 0.03
Dawa Limited 0.021 0.028 0.031 0.024 0.029
Elys Chemical Industries ltd 0.03 0.031 0.027 0.024 0.023
Glaxo SmithKline Ltd 0.05 0.048 0.05 0.04 0.04
Hightech Pharmaceuticals ltd 0.018 0.021 0.016 0.017 0.016
Infusion Medicare 0.028 0.035 0.032 0.037 0.039
Ivee Aqua Epz Ltd 0.033 0.032 0.032 0.03 0.03
Kenya Veterinary Vaccine Production 0.011 0.012 0.007 0.009 0.011
Kenya Medical Research Institute 0.028 0.027 0.028 0.027 0.027
Kenya society For the blind 0.041 0.042 0.047 0.027 0.03
Laboratory And Allied Ltd 0.039 0.039 0.028 0.034 0.029
Mac's Pharmaceuticals Ltd - 0.016 0.075 4.135 0.132

62
Manhar Brothers 0.027 0.112 0.04 0.06 0.094
Medivet Products Ltd 0.039 0.001 2.828 4.007 0.441
Nerix Pharma Ltd 0.031 0.109 0.04 0.254 0.309
Norbrook Kenya Ltd 0.085 0.243 0.219 0.189 0.341
Novelty Pharmaceutical - 0.044 0.165 0.039 0.038
Oss Chemie Ltd 0.336 0.304 0.279 0.244 0.216
Pharmaceutical Manufacturing
Company 0.077 0.07 0.077 0.113 0.113
PZ Cussons E.A Ltd 0.044 0.033 0.013 0.01 0.026
Reckitt & Colman Ltd - 0.114 0.109 3.049 2.995
Regal Pharmaceuticals 0.148 0.098 0.136 0.145 0.139
Sphinx Pharmaceutical 0.061 0.06 0.077 0.091 0.083
Skylight chemicals 0.136 0.099 0.114 0.171 0.16
Syner Chemie Limited 0.109 0.155 0.118 0.119 0.124
Stedman pharma Manufacturing Ltd - 0.098 0.147 0.274 0.201
Universal Cooperation Ltd 0.084 0.139 0.032 0.362 0.388
Ultravetis East Africa 0.019 0.031 0.013 0.098 0.095

63
APPENDIX IV: FIRM SIZE (TOTAL ASSETS)
Name of Company 2014
Ksh.
‘000’
2015
Ksh.
‘000’
2016
Ksh.
‘000’
2017
Ksh.
‘000’
2018
Ksh.
‘000’
Autosterile (E.A) Ltd 57279.6 50003.4 44565.6 61517.6 76032.6
Aesthetics 357272 371535 385478 456036 473696
Beta Healthcare, Int. Ltd 196336 207969 192752 201552 232809
Benmed Pharmaceuticals Ltd 32011.9 34276.7 33884.4 34197.9 35196.5
Biodeal Laboratories Ltd 893305 905732 1492794 1603245 2072526
Biopharma Limited 724436 801678 855066 855066 928966
Comet Healthcare Ltd 570164 690239 814704 899497 1075227
Cooper (K) Brands 56754.4 51522.8 60394.8 55080.7 56819.8
Cosmos Limited 339625 366437 385478 374973 399484
Concept Africa Ltd 18492.6 20653.8 22594.3 24099.0 26637.9
Dawa Limited 1432187 1807174 1811340 2084490 2344228
Elys Chemical Industries ltd 1355189 1663412 2113489 2716439 3392344
Glaxo SmithKline Ltd 2432204 2779713 3443499 4285485 5099176
Hightech Pharmaceuticals ltd 4092607 4742420 6095369 7161434 8739770
Infusion Medicare 1448771 1412537 1766037 1918668 2118361
Ivee Aqua Epz Ltd 3672823 3908409 4897788 5584702 6449113
Kenya Veterinary Vaccine
Production
6714289 9246982 1230268 1253141 1696289
Kenya Medical Research Institute 1083926 1210598 1458814 1659586 1925307
Kenya society For the blind 1954339 2202926 2223310 2338837 2494595

64
Laboratory And Allied Ltd 2013472 2312065 2851018 3427678 4087898
Mac's Pharmaceuticals Ltd 2636.33 10023.0 19319.6 4477.13 12119.9
Manhar Brothers 195433 201552 196336 248885 249459
Medivet Products Ltd 49545 48083.9 47752.9 44157 43351
Nerix Pharma Ltd 1227439 1485935 1819700 1584893 1929745
Norbrook Kenya Ltd 66221.6 68548.8 74816.9 68865.2 73198.1
Novelty Pharmaceutical 1552.38 4508.16 7943.28 11168.6 25263.8
Oss Chemie Ltd 1066596 1145513 1193988 1270574 1344312
Pharmaceutical Manufacturing
Company
349945 413999 410204 435511 471519
PZ Cussons E.A Ltd 1336596 1614359 1592209 1581248 1725838
Reckitt & Colman Ltd 494310 557185 688652 629506 743019
Regal Pharmaceuticals 835603 1273503 1327394 1247384 1572172
Sphinx Pharmaceutical 2697739 2971666 3698282 5188000 6074353
Skylight chemicals 4305266 4305266 4102041 4207266 4106766
Syner Chemie Limited 225943 294442 429536 514043 708761
Stedman pharma Manufacturing
Ltd
625172 683911.6 788860.1 837529.3 940805.8
Universal Cooperation Ltd 1396368 1614359 1570363 2312065 2451884
Ultravetis East Africa 1633051 1887991 2500345 3427677 4241309

65
APPENDIX V: LEVERAGE
Name of Company 2014 2015 2016 2017 2018
Autosterile (E.A) Ltd 0.019 0.024 0.024 0.015 0.013
Aesthetics 0.028 0.028 0.029 0.032 0.033
Beta Healthcare, Int. Ltd 0.073 0.062 0.040 0.039 0.042
Benmed Pharmaceuticals Ltd 0.032 0.032 0.035 0.035 0.036
Biodeal Laboratories Ltd 0.040 0.043 0.024 0.019 0.011
Biopharma Limited - - - 0.030 0.033
Comet Healthcare Ltd 0.170 0.181 0.194 0.137 0.149
Cooper (K) Brands 0.045 0.083 0.116 0.099 0.135
Cosmos Limited 0.046 0.037 0.052 0.051 0.054
Concept Africa Ltd 0.525 0.539 0.489 0.507 0.489
Dawa Limited 0.426 0.457 0.391 0.443 0.426
Elys Chemical Industries ltd 0.627 0.601 0.556 0.609 0.574
Glaxo SmithKline Ltd 0.467 0.439 0.440 0.493 0.480
Hightech Pharmaceuticals ltd 0.697 0.709 0.829 0.575 0.641
Infusion Medicare 0.645 0.496 0.528 0.469 0.410
Ivee Aqua Epz Ltd 0.589 0.517 0.548 0.587 0.567
Kenya Veterinary Vaccine
Production 0.543 0.679 0.907 1.035 1.217
Kenya Medical Research Institute 0.589 0.517 0.548 0.587 0.567
Kenya society For the blind 0.535 0.509 0.447 0.467 0.423
Laboratory And Allied Ltd 0.583 0.532 0.566 0.595 0.586
Mac's Pharmaceuticals Ltd - 0.006 0.002 0.025 0.026

66
Manhar Brothers 0.066 0.047 0.039 0.064 0.051
Medivet Products Ltd 0.062 0.044 0.037 0.060 0.048
Nerix Pharma Ltd 0.058 0.041 0.034 0.056 0.044
Norbrook Kenya Ltd 0.054 0.038 0.032 0.053 0.042
Novelty Pharmaceutical - 0.036 0.030 0.049 0.039
Oss Chemie Ltd 0.048 0.033 0.028 0.046 0.036
Pharmaceutical Manufacturing
Company 0.045 0.031 0.026 0.043 0.034
PZ Cussons E.A Ltd 0.042 0.029 0.025 0.041 0.032
Reckitt & Colman Ltd 0.039 0.027 0.023 0.038 0.030
Regal Pharmaceuticals 0.037 0.026 0.022 0.036 0.028
Sphinx Pharmaceutical 0.034 0.024 0.020 0.033 0.026
Skylight chemicals 0.032 0.023 0.019 0.031 0.025
Syner Chemie Limited 0.030 0.021 0.018 0.029 0.023
Stedman pharma Manufacturing Ltd 0.028 0.020 0.017 0.027 0.022
Universal Cooperation Ltd 0.026 0.018 0.015 0.026 0.020
Ultravetis East Africa 0.025 0.017 0.015 0.024 0.019

67
APPENDIX VI: OWNERSHIP STRUCTURE
Name of Company 2014 2015 2016 2017 2018
Autosterile (E.A) Ltd 0 1 1 1 1
Aesthetics 0 0 1 1 1
Beta Healthcare, Int. Ltd 0 1 1 1 1
Benmed Pharmaceuticals Ltd 0 0 0 1 0
Biodeal Laboratories Ltd 0 0 0 0 1
Biopharma Limited 1 1 1 1 0
Comet Healthcare Ltd 1 0 0 0 1
Cooper (K) Brands 0 0 1 1 0
Cosmos Limited 0 0 0 0 1
Concept Africa Ltd 0 1 0 1 1
Dawa Limited 0 0 1 1 1
Elys Chemical Industries ltd 1 0 0 1 0
Glaxo SmithKline Ltd 1 1 1 0 0
Hightech Pharmaceuticals ltd 1 1 1 1 0
Infusion Medicare 0 0 1 0 0
Ivee Aqua Epz Ltd 1 0 1 1 0
Kenya Veterinary Vaccine
Production
1 1 0 0 1
Kenya Medical Research Institute 0 0 1 1 0
Kenya society For the blind 0 0 0 0 1
Laboratory And Allied Ltd 1 1 0 1 0
Mac's Pharmaceuticals Ltd 0 0 1 0 1
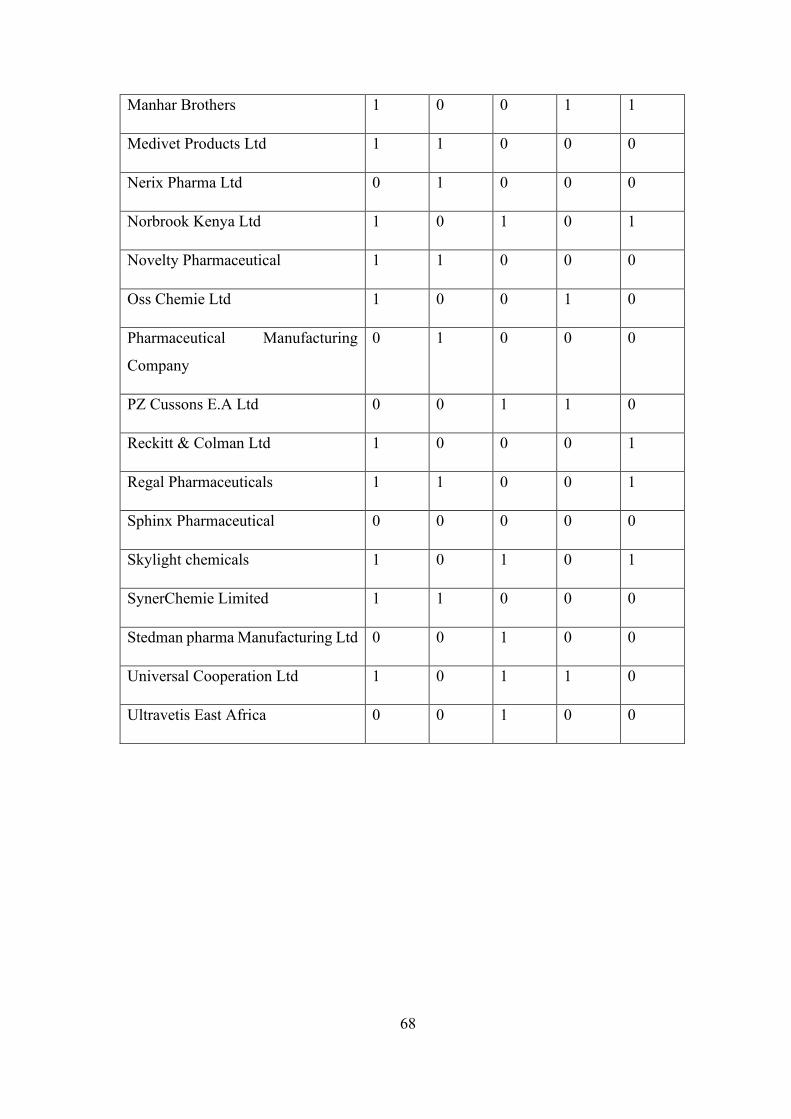
68
Manhar Brothers 1 0 0 1 1
Medivet Products Ltd 1 1 0 0 0
Nerix Pharma Ltd 0 1 0 0 0
Norbrook Kenya Ltd 1 0 1 0 1
Novelty Pharmaceutical 1 1 0 0 0
Oss Chemie Ltd 1 0 0 1 0
Pharmaceutical Manufacturing
Company
0 1 0 0 0
PZ Cussons E.A Ltd 0 0 1 1 0
Reckitt & Colman Ltd 1 0 0 0 1
Regal Pharmaceuticals 1 1 0 0 1
Sphinx Pharmaceutical 0 0 0 0 0
Skylight chemicals 1 0 1 0 1
SynerChemie Limited 1 1 0 0 0
Stedman pharma Manufacturing Ltd 0 0 1 0 0
Universal Cooperation Ltd 1 0 1 1 0
Ultravetis East Africa 0 0 1 0 0

69
APPENDIX VII: USIU RESEARCH AUTHORIZATION

70
APPENDIX VIII: RESEARCH PERMIT DEAN SCHOOL OF GRADUATE
STUDIES

71
APPENDIX IX: MINISTRY RESEARCH AUTHORIZATION

72
APPENDIX X: NACOSTI RESEARCH AUTHORIZATION

73
APPENDIX XI: NACOSTI RESEARCH PERMIT