Embed Size (px)
Citation preview
FINANCIAL PERFORMANCE OF INDIAN PHARMACEUTICAL INDUSTRY
Mr. U. Shaji
Ph.D. Research Scholar,
Department of Commerce, Bharathiar University, Coimbatore-641046.
Email:[email protected]
Dr. G. Ganesan
Professor and Head, School of Commerce, Bharathiar University, Coimbatore-641046
ABSTRACT
With the de-licensing of pharmaceutical industry and complemented by scientific
talent and research capabilities and Intellectual Property Protection Regime, Indian
pharmaceutical industry in all set to take on new challenges in the international market.
Indian pharmaceutical industry has played a key role in promoting and sustaining
development in the vital field of medicines. Financial analysts often assess firm's
production and productivity performance, profitability performance, liquidity
performance, working capital performance, fixed assets performance, fund flow
performance and social performance. The financial performance analysis identifies the
financial strengths and weaknesses of the firm by properly establishing relationships
between the items of the balance sheet and profit and loss account. Thus, the present
paper is of crucial importance to measure the firm’s liquidity, profitability, and other
indicators that the business is conducted in a rational and normal way; ensuring enough
returns to the shareholders to maintain at least its market value. In this context
researcher has undertaken an analysis of financial performance of pharmaceutical
companies to understand how management of finance plays a crucial role in the
growth. The present study covers two public sector drug & pharmaceutical enterprises
listed on BSE. The study has been undertaken for the period of twelve years from
199899 to 200910. In order to analyze financial performance in terms of liquidity,
solvency, profitability and financial efficiency, various accounting ratios have been
used. Statistical measures i.e., linear multiple regression analysis and test of hypothesis –
t test has been used.
Keywords: De-licensing, Pharmaceutical Industry, Scientific Talent, Research,
Capabilities, Intellecutal, Property, Regime, Productivity, Fixed Assets Performace,
Market Value, Liquidity, Solvency, Financial Efficiency,
Namex International Journal of Management Research 68 Vol. 2, Issue No. 1, Jan-June 2012
Financial Performance Of Indian Pharmaceutical Industry
1. Introduction
The Indian pharmaceutical industry is
one of the world’s largest, ranking 4th
in terms of volume and 13th in terms
of value in the global
pharmaceutical market. In 2005,
domestic pharmaceutical sales were
US$4.5 billion, growing at CAGR
of 8.59%. The Indian pharmaceutical
industry is characterized by a multitude
of manufacturers (over 20,000
registered, as of 2003). These are
predominantly small manufacturers,
focusing on either Active
Pharmaceutical Ingredients (APIs) or
formulations. Until the advent of
product patents in January 2005, only
process patents were applicable in
India, which effectively made it a low
cost, generic market. As a result,
manufacturing expertise and
efficiency were the only requirements
to participate in this industry, creating
low barriers of entry.
As a result, the leading Indian
pharmaceutical companies have
become some of the most efficient
manufacturing units in the world. In
fact, India has the highest number of US
FDA (Food and Drug Administration)
certified manufacturing facilities
outside the United States. There are an
increasing number of opportunities with
large Indian manufacturers & contract
manufacturing organizations for the
increasingly costconscious
multinationals.
One of the major factors that have
increased the confidence of foreign
multinationals looking for local
opportunities in India is the adoption of
a new product patent regime in January
2005. This will facilitate concurrent
global phase II and III clinical trials. A
new patent regime has changed the
dynamics of the Indian pharmaceuticals
industry in other respects, too. Several
leading domestic producers have begun
to conduct original research into new
chemical entities (NCEs) and novel
drug delivery systems. However, these
companies are likely to license most of
these drug candidates to Western
pharmaceutical companies, because few
Indian companies can afford the high
costs and failure rates associated with
developing an NCE. In this context,
several Indian firms have already
entered into research partnerships with
multinationals. Some pharmaceutical
MNCs like AstraZeneca have opened
their own captive research centers in
India to take advantage of the low costs
as well as availability of high quality
intellectual work force.
The present study covers two public
sector drug & pharmaceutical
enterprises listed on BSE. The sample
of the companies has been selected on a
convenient basis and the necessary data
have been obtained from CMIE
database and public enterprises survey.
The researcher selects Karnataka
Antibiotics & Pharmaceuticals Ltd.
(KAPL) and Rajasthan Drugs &
Pharmaceuticals Ltd. (RDPL).
2. Statement of the Problem
Financial performance analysis is the
process of determining the operating
and financial characteristics of a firm
from accounting and financial
statements. The ability of an
Namex International Journal of Management Research 69 Vol. 2, Issue No. 1, Jan-June 2012
Financial Performance Of Indian Pharmaceutical Industry
organization to analyze its financial
position is essential for improving its
competitive position in the
marketplace. Through a careful
analysis of its financial performance,
the organization can identify
opportunities to improve performance
of the department, unit or organizational
level. In this context an attempt has
been made an analysis of financial
performance of pharmaceutical
companies to understand how
management of finance plays a crucial
role in the growth.
3. Objectives of the study
The main objectives of the present work
are to make a study on the overall
financial performance of selected public
sector drug & pharmaceutical
enterprises in India.
4. Methodology
The study has been undertaken for the
period of twelve years from 199899 to
200910. In order to analyze financial
performance in terms of liquidity,
solvency, profitability and financial
efficiency, various accounting ratios
have been used. Various statistical
measures have been used i.e., Mean.,
S.D., C.V., linear multiple regression
analysis and test of hypothesis – t test.
In this context an attempt has been
made an analysis of financial
performance of pharmaceutical
companies to understand how
management of finance plays a crucial
role in the growth.
5. Research Hypotheses
Keeping the above objectives in mind,
the following null and alternative
hypotheses have been formulated and
tested during the study period:
Hypotheses of the Study :
1. When return on investment
increases, liquid ratio remains
same.
2. When return on investment
increases, net profit to total asset
ratio remains same.
3. When return on investment
increases, debt to net worth ratio
remains same.
4. When return on investment
increases, debt equity ratio
remains same.
5. When debt equity ratio
increases, interest coverage ratio
remains same.
6. When net profit to total asset
ratio increases, debt equity ratio
remains same.
7. When return on investment ratio
increases, total liability to total
asset ratio remains same.
Namex International Journal of Management Research 70 Vol. 2, Issue No. 1, Jan-June 2012
Financial Performance Of Indian Pharmaceutical Industry
Financial
Performance
Liquidity
Solvency
Efficiency
Financial Stability
Overall
Profitability
Net Profit
Return on
Investment
Profitability Financial Performance
Indicators
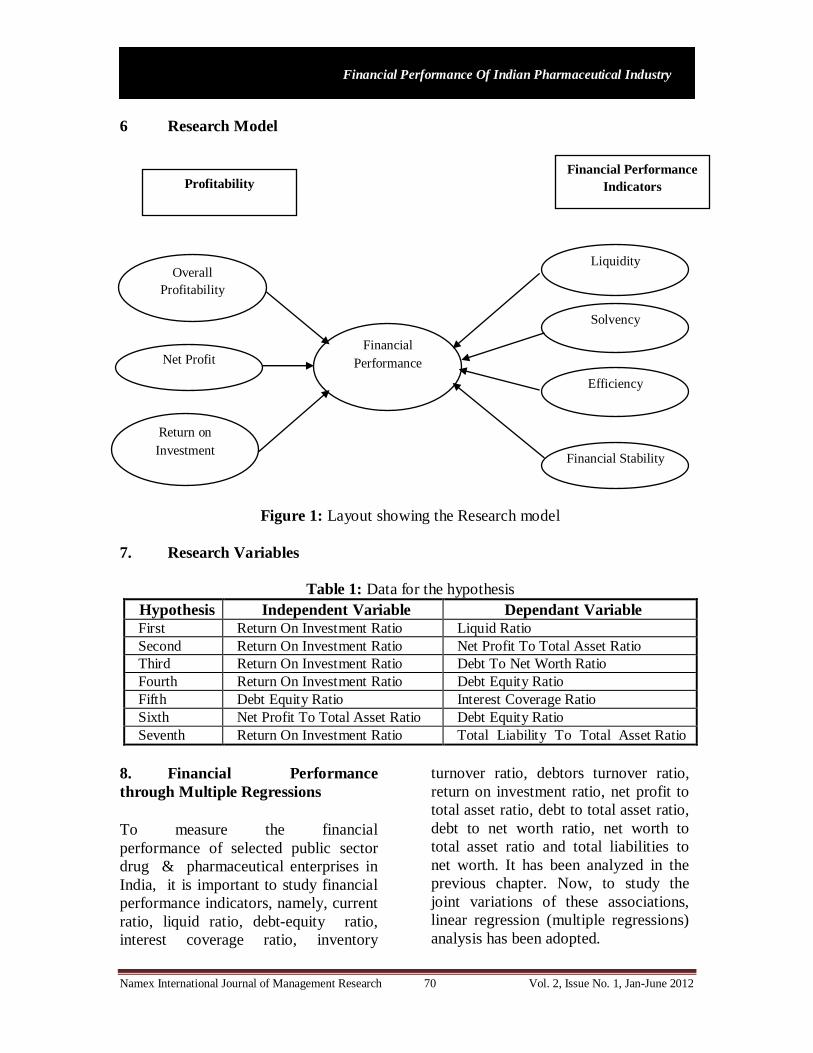
6 Research Model
Figure 1: Layout showing the Research model
7. Research Variables
Table 1: Data for the hypothesis
Hypothesis Independent Variable Dependant Variable First Return On Investment Ratio Liquid Ratio
Second Return On Investment Ratio Net Profit To Total Asset Ratio
Third Return On Investment Ratio Debt To Net Worth Ratio
Fourth Return On Investment Ratio Debt Equity Ratio
Fifth Debt Equity Ratio Interest Coverage Ratio
Sixth Net Profit To Total Asset Ratio Debt Equity Ratio
Seventh Return On Investment Ratio Total Liability To Total Asset Ratio
8. Financial Performance
through Multiple Regressions
To measure the financial
performance of selected public sector
drug & pharmaceutical enterprises in
India, it is important to study financial
performance indicators, namely, current
ratio, liquid ratio, debtequity ratio,
interest coverage ratio, inventory
turnover ratio, debtors turnover ratio,
return on investment ratio, net profit to
total asset ratio, debt to total asset ratio,
debt to net worth ratio, net worth to
total asset ratio and total liabilities to
net worth. It has been analyzed in the
previous chapter. Now, to study the
joint variations of these associations,
linear regression (multiple regressions)
analysis has been adopted.
Namex International Journal of Management Research 71 Vol. 2, Issue No. 1, Jan-June 2012
Financial Performance Of Indian Pharmaceutical Industry
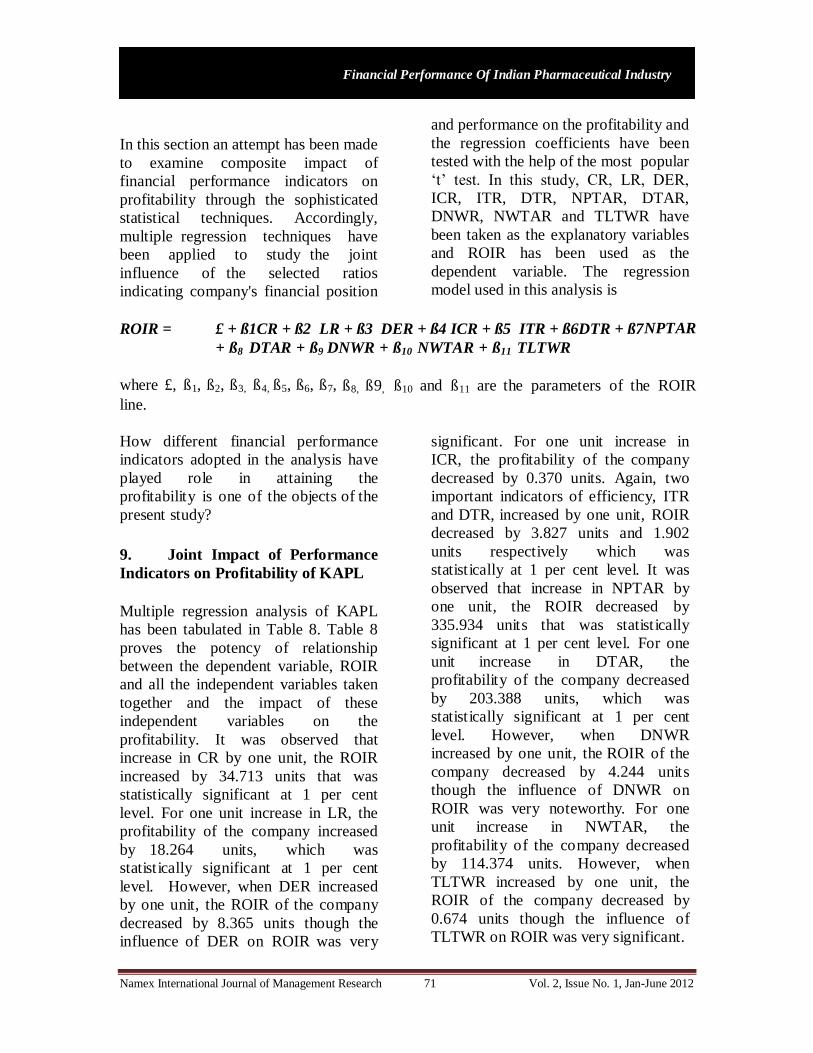
In this section an attempt has been made
to examine composite impact of
financial performance indicators on
profitability through the sophisticated
statistical techniques. Accordingly,
multiple regression techniques have
been applied to study the joint
influence of the selected ratios
indicating company's financial position
and performance on the profitability and
the regression coefficients have been
tested with the help of the most popular
‘t’ test. In this study, CR, LR, DER,
ICR, ITR, DTR, NPTAR, DTAR,
DNWR, NWTAR and TLTWR have
been taken as the explanatory variables
and ROIR has been used as the
dependent variable. The regression
model used in this analysis is
ROIR = £ + ß1CR + ß2 LR + ß3 DER + ß4 ICR + ß5 ITR + ß6DTR + ß7NPTAR
+ ß8 DTAR + ß9 DNWR + ß10 NWTAR + ß11 TLTWR
where £, ß1, ß2, ß3, ß4, ß5, ß6, ß7, ß8, ß9, ß10 and ß11 are the parameters of the ROIR
line.
How different financial performance
indicators adopted in the analysis have
played role in attaining the
profitability is one of the objects of the
present study?
9. Joint Impact of Performance
Indicators on Profitability of KAPL
Multiple regression analysis of KAPL
has been tabulated in Table 8. Table 8
proves the potency of relationship
between the dependent variable, ROIR
and all the independent variables taken
together and the impact of these
independent variables on the
profitability. It was observed that
increase in CR by one unit, the ROIR
increased by 34.713 units that was
statistically significant at 1 per cent
level. For one unit increase in LR, the
profitability of the company increased
by 18.264 units, which was
statistically significant at 1 per cent
level. However, when DER increased
by one unit, the ROIR of the company
decreased by 8.365 units though the
influence of DER on ROIR was very
significant. For one unit increase in
ICR, the profitability of the company
decreased by 0.370 units. Again, two
important indicators of efficiency, ITR
and DTR, increased by one unit, ROIR
decreased by 3.827 units and 1.902
units respectively which was
statistically at 1 per cent level. It was
observed that increase in NPTAR by
one unit, the ROIR decreased by
335.934 units that was statistically
significant at 1 per cent level. For one
unit increase in DTAR, the
profitability of the company decreased
by 203.388 units, which was
statistically significant at 1 per cent
level. However, when DNWR
increased by one unit, the ROIR of the
company decreased by 4.244 units
though the influence of DNWR on
ROIR was very noteworthy. For one
unit increase in NWTAR, the
profitability of the company decreased
by 114.374 units. However, when
TLTWR increased by one unit, the
ROIR of the company decreased by
0.674 units though the influence of
TLTWR on ROIR was very significant.
Namex International Journal of Management Research 72 Vol. 2, Issue No. 1, Jan-June 2012
Financial Performance Of Indian Pharmaceutical Industry
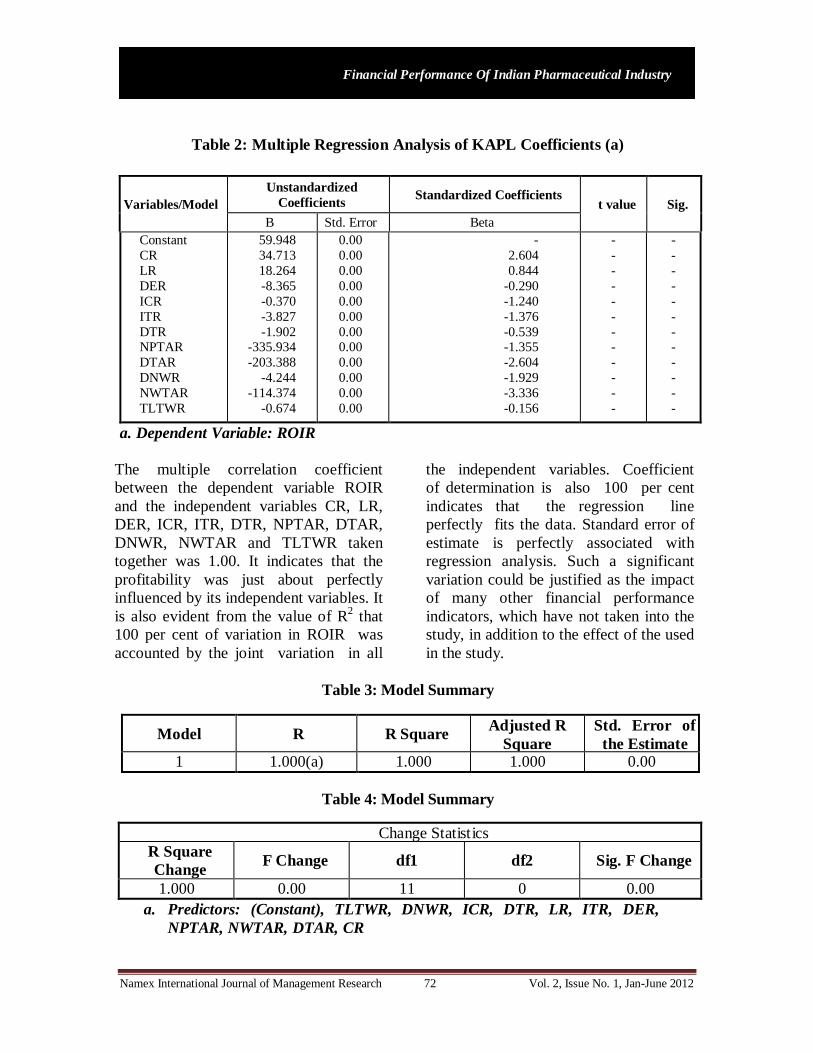
Table 2: Multiple Regression Analysis of KAPL Coefficients (a)
Variables/Model
Unstandardized
Coefficients Standardized Coefficients
t value Sig.
B Std. Error Beta
Constant
CR
LR
DER
ICR
ITR
DTR NPTAR
DTAR
DNWR
NWTAR
TLTWR
59.948
34.713
18.264
8.365
0.370
3.827
1.902 335.934
203.388
4.244
114.374
0.674
0.00
0.00
0.00
0.00
0.00
0.00
0.00 0.00
0.00
0.00
0.00
0.00
2.604
0.844
0.290
1.240
1.376
0.539 1.355
2.604
1.929
3.336
0.156
-
-
-
-
-
-
- -
-
-
-
-
-
-
-
-
-
-
- -
-
-
-
-
a. Dependent Variable: ROIR
The multiple correlation coefficient
between the dependent variable ROIR
and the independent variables CR, LR,
DER, ICR, ITR, DTR, NPTAR, DTAR,
DNWR, NWTAR and TLTWR taken
together was 1.00. It indicates that the
profitability was just about perfectly
influenced by its independent variables. It
is also evident from the value of R2 that
100 per cent of variation in ROIR was
accounted by the joint variation in all
the independent variables. Coefficient
of determination is also 100 per cent
indicates that the regression line
perfectly fits the data. Standard error of
estimate is perfectly associated with
regression analysis. Such a significant
variation could be justified as the impact
of many other financial performance
indicators, which have not taken into the
study, in addition to the effect of the used
in the study.
Table 3: Model Summary
Model R R Square Adjusted R
Square
Std. Error of
the Estimate 1 1.000(a) 1.000 1.000 0.00
Table 4: Model Summary
Change Statistics
R Square
Change F Change df1 df2 Sig. F Change
1.000 0.00 11 0 0.00
a. Predictors: (Constant), TLTWR, DNWR, ICR, DTR, LR, ITR, DER,
NPTAR, NWTAR, DTAR, CR
Namex International Journal of Management Research 73 Vol. 2, Issue No. 1, Jan-June 2012
Financial Performance Of Indian Pharmaceutical Industry
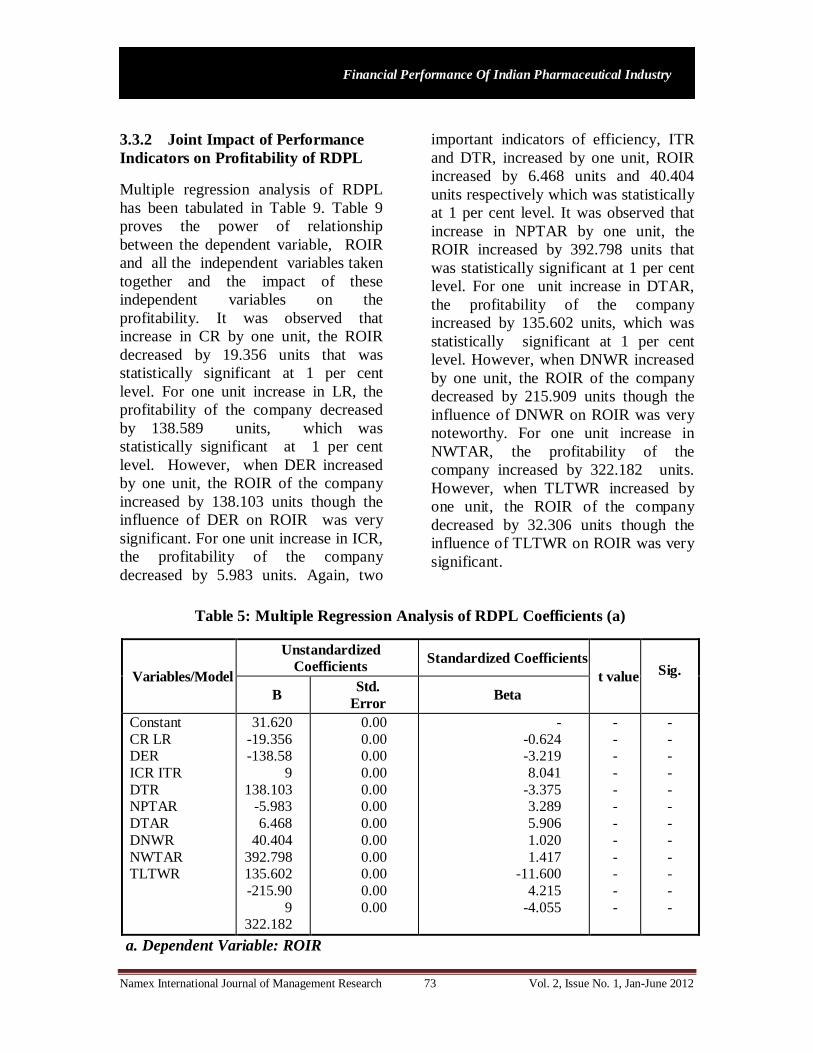
3.3.2 Joint Impact of Performance
Indicators on Profitability of RDPL
Multiple regression analysis of RDPL
has been tabulated in Table 9. Table 9
proves the power of relationship
between the dependent variable, ROIR
and all the independent variables taken
together and the impact of these
independent variables on the
profitability. It was observed that
increase in CR by one unit, the ROIR
decreased by 19.356 units that was
statistically significant at 1 per cent
level. For one unit increase in LR, the
profitability of the company decreased
by 138.589 units, which was
statistically significant at 1 per cent
level. However, when DER increased
by one unit, the ROIR of the company
increased by 138.103 units though the
influence of DER on ROIR was very
significant. For one unit increase in ICR,
the profitability of the company
decreased by 5.983 units. Again, two
important indicators of efficiency, ITR
and DTR, increased by one unit, ROIR
increased by 6.468 units and 40.404
units respectively which was statistically
at 1 per cent level. It was observed that
increase in NPTAR by one unit, the
ROIR increased by 392.798 units that
was statistically significant at 1 per cent
level. For one unit increase in DTAR,
the profitability of the company
increased by 135.602 units, which was
statistically significant at 1 per cent
level. However, when DNWR increased
by one unit, the ROIR of the company
decreased by 215.909 units though the
influence of DNWR on ROIR was very
noteworthy. For one unit increase in
NWTAR, the profitability of the
company increased by 322.182 units.
However, when TLTWR increased by
one unit, the ROIR of the company
decreased by 32.306 units though the
influence of TLTWR on ROIR was very
significant.
Table 5: Multiple Regression Analysis of RDPL Coefficients (a)
Variables/Model
Unstandardized
Coefficients Standardized Coefficients
t value Sig.
B Std.
Error Beta
Constant
CR LR DER
ICR ITR
DTR NPTAR
DTAR
DNWR
NWTAR TLTWR
31.620
19.356 138.58
9
138.103 5.983
6.468
40.404
392.798 135.602
215.90
9 322.182
32.306
0.00
0.00 0.00
0.00
0.00 0.00
0.00
0.00
0.00 0.00
0.00
0.00
0.624 3.219
8.041
3.375 3.289
5.906
1.020
1.417 11.600
4.215
4.055
-
- -
-
- -
-
-
- -
-
-
-
- -
-
- -
-
-
- -
-
-
a. Dependent Variable: ROIR
Namex International Journal of Management Research 74 Vol. 2, Issue No. 1, Jan-June 2012
Financial Performance Of Indian Pharmaceutical Industry
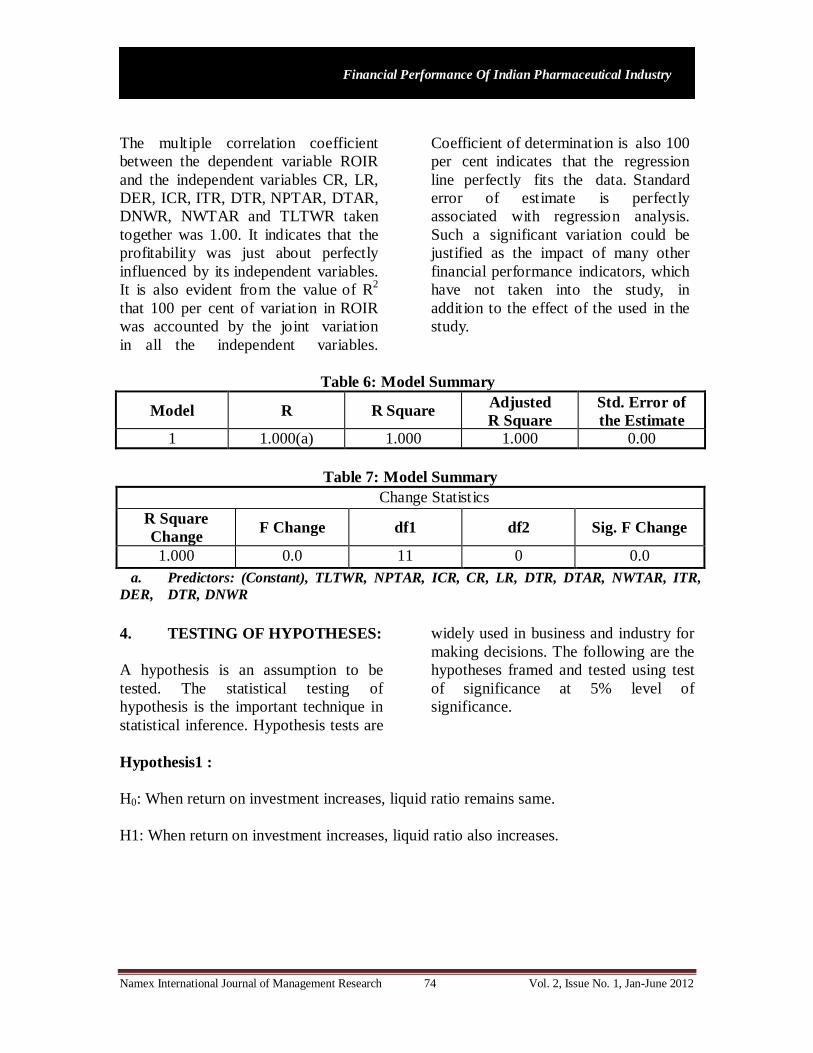
The multiple correlation coefficient
between the dependent variable ROIR
and the independent variables CR, LR,
DER, ICR, ITR, DTR, NPTAR, DTAR,
DNWR, NWTAR and TLTWR taken
together was 1.00. It indicates that the
profitability was just about perfectly
influenced by its independent variables.
It is also evident from the value of R2
that 100 per cent of variation in ROIR
was accounted by the joint variation
in all the independent variables.
Coefficient of determination is also 100
per cent indicates that the regression
line perfectly fits the data. Standard
error of estimate is perfectly
associated with regression analysis.
Such a significant variation could be
justified as the impact of many other
financial performance indicators, which
have not taken into the study, in
addition to the effect of the used in the
study.
Table 6: Model Summary
Model R R Square Adjusted
R Square
Std. Error of
the Estimate
1 1.000(a) 1.000 1.000 0.00
Table 7: Model Summary
Change Statistics
R Square
Change F Change df1 df2 Sig. F Change
1.000 0.0 11 0 0.0
a. Predictors: (Constant), TLTWR, NPTAR, ICR, CR, LR, DTR, DTAR, NWTAR, ITR,
DER, DTR, DNWR
4. TESTING OF HYPOTHESES:
A hypothesis is an assumption to be
tested. The statistical testing of
hypothesis is the important technique in
statistical inference. Hypothesis tests are
widely used in business and industry for
making decisions. The following are the
hypotheses framed and tested using test
of significance at 5% level of
significance.
Hypothesis 1 :
H0: When return on investment increases, liquid ratio remains same.
H1: When return on investment increases, liquid ratio also increases.
Namex International Journal of Management Research 75 Vol. 2, Issue No. 1, Jan-June 2012
Financial Performance Of Indian Pharmaceutical Industry
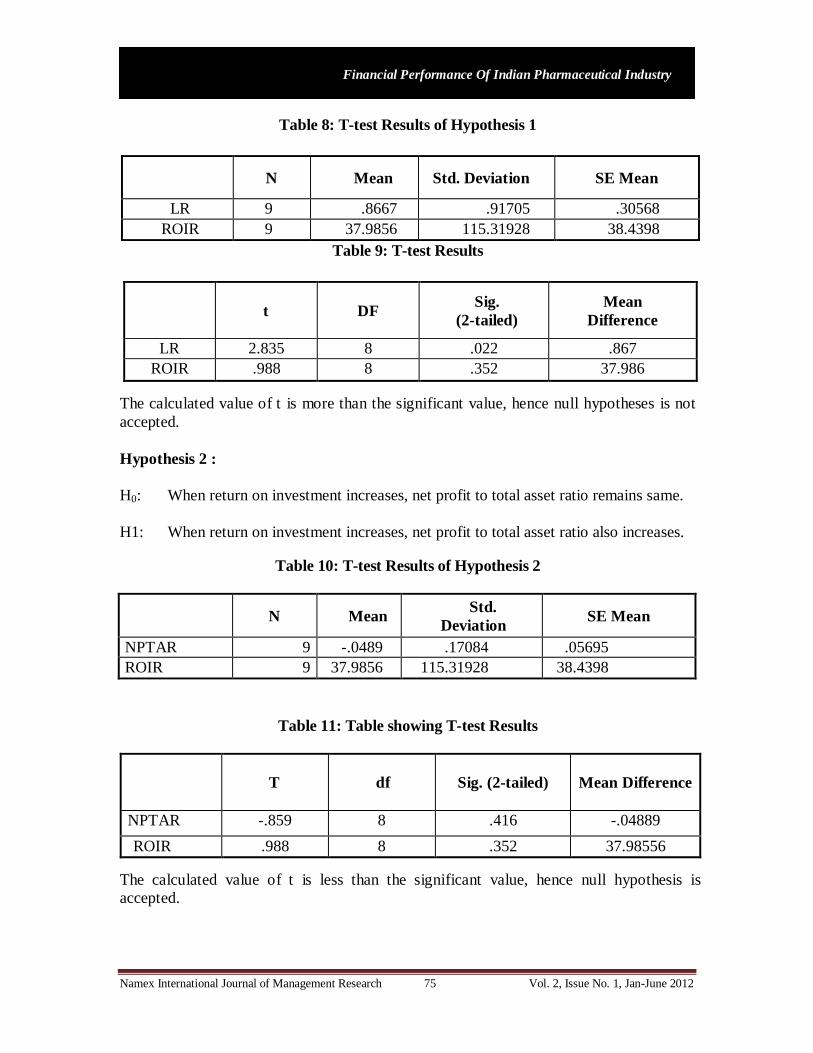
Table 8: Ttest Results of Hypothesis 1
N Mean Std. Deviation SE Mean
LR 9 .8667 .91705 .30568
ROIR 9 37.9856 115.31928 38.4398
Table 9: Ttest Results
t DF Sig.
(2tailed)
Mean
Difference
LR 2.835 8 .022 .867
ROIR .988 8 .352 37.986
The calculated value of t is more than the significant value, hence null hypotheses is not
accepted.
Hypothesis 2 :
H0: When return on investment increases, net profit to total asset ratio remains same.
H1: When return on investment increases, net profit to total asset ratio also increases.
Table 10: Ttest Results of Hypothesis 2
N Mean Std.
Deviation SE Mean
NPTAR 9 .0489 .17084 .05695
ROIR 9 37.9856 115.31928 38.4398
Table 11: Table showing Ttest Results
T df Sig. (2tailed) Mean Difference
NPTAR .859 8 .416 .04889
ROIR .988 8 .352 37.98556
The calculated value of t is less than the significant value, hence null hypothesis is
accepted.
Namex International Journal of Management Research 76 Vol. 2, Issue No. 1, Jan-June 2012
Financial Performance Of Indian Pharmaceutical Industry
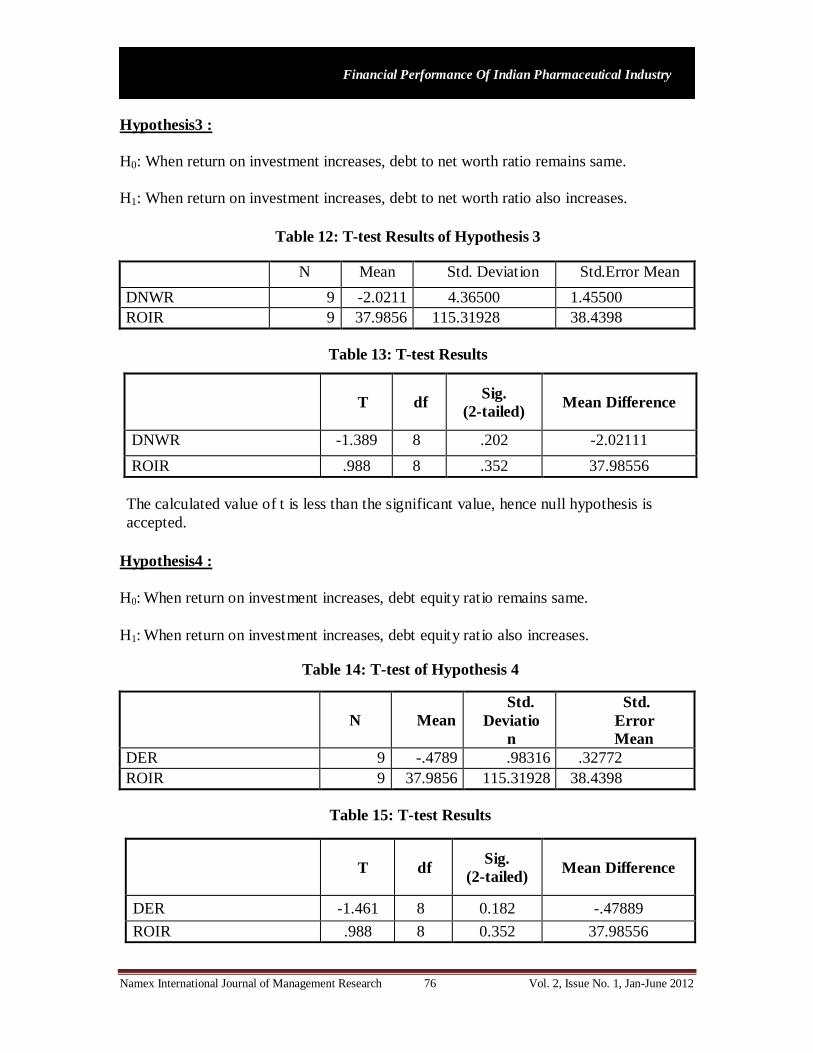
Hypothesis 3 :
H0: When return on investment increases, debt to net worth ratio remains same.
H1: When return on investment increases, debt to net worth ratio also increases.
Table 12: Ttest Results of Hypothesis 3
N Mean Std. Deviation Std.Error Mean
DNWR 9 2.0211 4.36500 1.45500
ROIR 9 37.9856 115.31928 38.4398
Table 13: Ttest Results
T df Sig.
(2tailed) Mean Difference
DNWR 1.389 8 .202 2.02111
ROIR .988 8 .352 37.98556
The calculated value of t is less than the significant value, hence null hypothesis is
accepted.
Hypothesis 4 :
H0: When return on investment increases, debt equity ratio remains same.
H1: When return on investment increases, debt equity ratio also increases.
Table 14: Ttest of Hypothesis 4
N Mean
Std.
Deviatio
n
Std.
Error
Mean
DER 9 .4789 .98316 .32772
ROIR 9 37.9856 115.31928 38.4398
Table 15: Ttest Results
T df Sig.
(2tailed) Mean Difference
DER 1.461 8 0.182 .47889
ROIR .988 8 0.352 37.98556
Namex International Journal of Management Research 77 Vol. 2, Issue No. 1, Jan-June 2012
Financial Performance Of Indian Pharmaceutical Industry
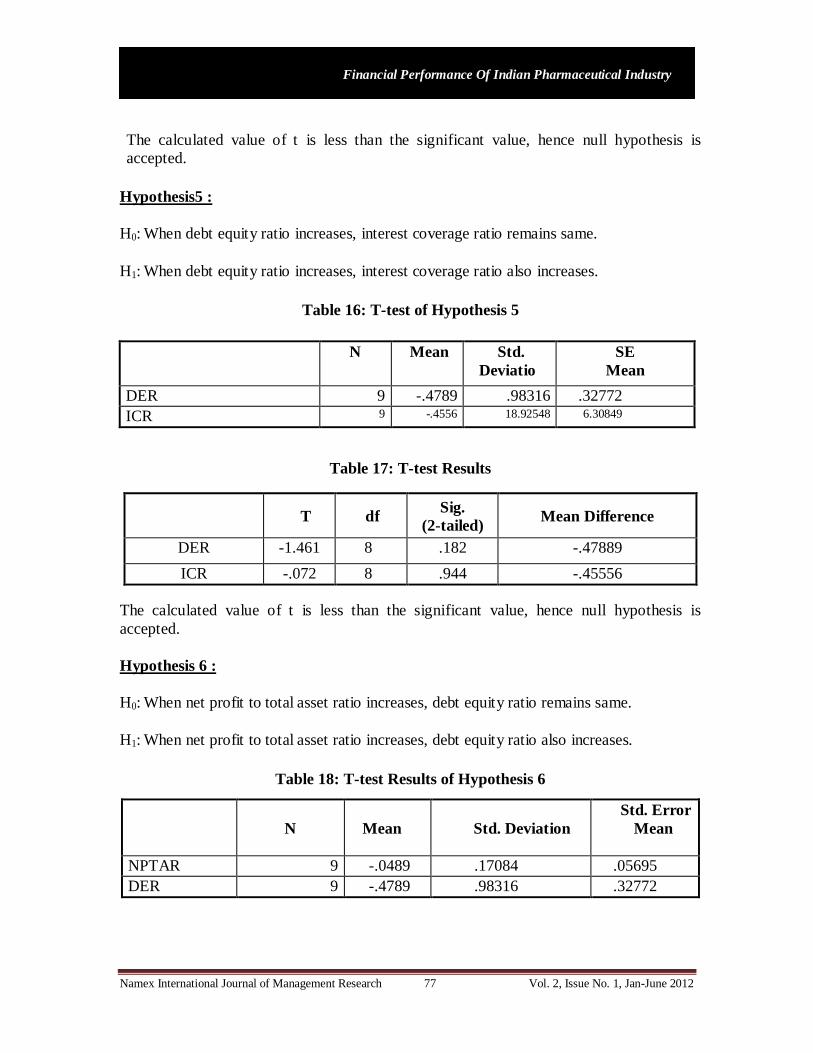
The calculated value of t is less than the significant value, hence null hypothesis is
accepted.
Hypothesis 5 :
H0: When debt equity ratio increases, interest coverage ratio remains same.
H1: When debt equity ratio increases, interest coverage ratio also increases.
Table 16: Ttest of Hypothesis 5
N Mean Std.
Deviatio
n
SE
Mean
DER 9 .4789 .98316 .32772
ICR 9 .4556 18.92548 6.30849
Table 17: Ttest Results
T df Sig.
(2tailed) Mean Difference
DER 1.461 8 .182 .47889
ICR .072 8 .944 .45556
The calculated value of t is less than the significant value, hence null hypothesis is
accepted.
Hypothesis 6 :
H0: When net profit to total asset ratio increases, debt equity ratio remains same.
H1: When net profit to total asset ratio increases, debt equity ratio also increases.
Table 18: Ttest Results of Hypothesis 6
N
Mean
Std. Deviation
Std. Error
Mean
NPTAR 9 .0489 .17084 .05695
DER 9 .4789 .98316 .32772
Namex International Journal of Management Research 78 Vol. 2, Issue No. 1, Jan-June 2012
Financial Performance Of Indian Pharmaceutical Industry
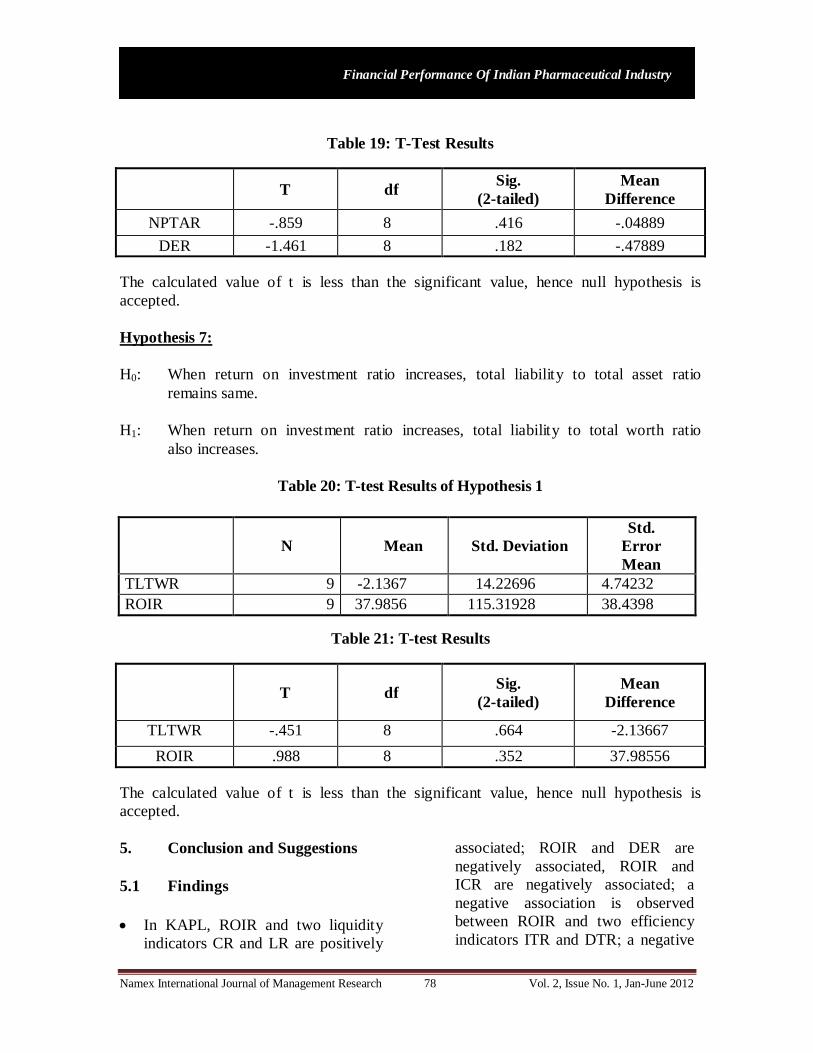
Table 19: TTest Results
T df Sig.
(2tailed)
Mean
Difference
NPTAR .859 8 .416 .04889
DER 1.461 8 .182 .47889
The calculated value of t is less than the significant value, hence null hypothesis is
accepted.
Hypothesis 7:
H0: When return on investment ratio increases, total liability to total asset ratio
remains same.
H1: When return on investment ratio increases, total liability to total worth ratio
also increases.
Table 20: Ttest Results of Hypothesis 1
N Mean Std. Deviation
Std.
Error
Mean
TLTWR 9 2.1367 14.22696 4.74232
ROIR 9 37.9856 115.31928 38.4398
Table 21: Ttest Results
T df Sig.
(2tailed)
Mean
Difference
TLTWR .451 8 .664 2.13667
ROIR .988 8 .352 37.98556
The calculated value of t is less than the significant value, hence null hypothesis is
accepted.
5. Conclusion and Suggestions
5.1 Findings
In KAPL, ROIR and two liquidity
indicators CR and LR are positively
associated; ROIR and DER are
negatively associated, ROIR and
ICR are negatively associated; a
negative association is observed
between ROIR and two efficiency
indicators ITR and DTR; a negative
Namex International Journal of Management Research 79 Vol. 2, Issue No. 1, Jan-June 2012
Financial Performance Of Indian Pharmaceutical Industry
association between ROIR and
NPTAR is seen; a negative
association between DTAR and
DNWR with ROIR is observed;
ROIR is negatively associated with
NWTAR and a negative
association is clearly seen between
ROIR and TWTAR. All the
performance indicators and
profitability are just about
correlated. The coefficient of
determination is almost 100 per cent.
In RDPL, ROIR and two liquidity
indicators CR and LR are negatively
associated; ROIR and DER are
positively associated, ROIR and
ICR are negatively associated; a
positive association is observed
between ROIR and two efficiency
indicators ITR and DTR; a positive
association between ROIR and
NPTAR is seen; a positive and
negative association between
DTAR and DNWR with ROIR is
observed; ROIR is positively
associated with NWTAR and a
negative association is clearly seen
between ROIR and TWTAR. All
the performance indicators and
profitability are just about
correlated. The coefficient of
determination is almost 100 per cent.
5.2 Suggestions
For solving the problems of
debtors’ management in case of
RDPL, an effective professional
coordination between sales,
production and finance departments
is called for. Prompt billing, timely
reminders to defaulting customers
and immediate action should be
ensured. The investment in loans
and advances should be minimized
to the extent possible.
To improve the financial position
of KAPL and RDPL, equity
oriented dependability have to be
reduced properly.
To improve the financial stability of
both the companies under the study,
proper mixture of stake in the
business between the owners and
the creditors have to be made in
which significant pressure on future
cash flows can be avoid.
Higher degree of multiple
correlations implies the presence
of explained variables (liquidity,
solvency, efficiency and financial
stability) that have lead to lower
profitability over and above poor
financial position and performance,
are in action. To remove such
problems, accurate liquidity
management, correct solvency or
leverage management and
appropriate wealth management is
highly needed.
As far as selected enterprises are
concerned, the management of the
companies should contemplate its
efforts in maximizing assets and
minimizing liabilities, so that the
company's financial position could
be improved.
Conclusions of the Study
From the study of the financial
performance of the select
pharmaceutical it can be concluded that
the liquidity position was strong in
Namex International Journal of Management Research 80 Vol. 2, Issue No. 1, Jan-June 2012
Financial Performance Of Indian Pharmaceutical Industry
case of KAPL and RDPL thereby
reflecting the ability of the companies
to pay shortterm obligations on due
dates.Longterm solvency in case of
KAPL and RDPL in all years which
shows that companies relied more on
external funds in terms of longterm
borrowings thereby providing a lower
degree of protection to the
creditors.Debtors’ turnover ratio of
RDPL needs to be improved as the
solvency of the firm depends upon the
sales income generated from the use of
various assets.Financial stability ratios
in the vein of debt to total asset ratio,
debt to net worth ratio, net worth to
total asset ratio and total liabilities to
total worth ratio in case of both the
selected companies have showed a
downward trend and consequently the
financial stability of selected
pharmaceutical companies have been
decreasing at an intense rate.The
Indian pharmaceutical industry will
witness an increase in the market share.
The sector is poised not only to take
new challenge but to sustain the
growth momentum of the past decade.
6. Limitations of the Study
Study exclusively depends on the
published financial data, so it is
subject to all limitations that are
inherent in the condensed published
financial statements.
The drug & pharmaceutical
enterprises selected have been taken
from CMIE database. The study
covers a period of only twelve years
from 1999 to 2010. The data
collected is only for ten companies
and this might not be true
representation of the population.
This is a major limitation of the
research.
7. References
1. Biswanath, S.R. (2008), “A Case
Study: Financial Performance of
Pharmaceutical Companies”, Oxford
University Press, New Delhi.
2. Chaudhuri, Sudip (2005), “The
WTO and India’s Pharmaceuticals
Industry: Patent Protection TRIPS
and Developing Countries”, Oxford
University Press, New Delhi, p.65.
3. Clark, Andrew (1995), “Global
Healthcare: Indian Pharmaceutical
Sector”, Barings Securities: London
Felker.
4. Erich A. Helfert (2002), “Techniques
of Financial Analysis”,
McGrawHill/Irwin, USA.
5. Kambhampati, U. S. (1996)
Industrial Concentration and
Performance; A Study of the
Structure, Conduct and Performance
of Indian Industry, (New Delhi:
Oxford University Press), New
Delhi, 89.
6. Kothari C.R. (2003), “Research
Methodology – Methods &
Techniques, Wishawa Prakashan,
New Delhi.
7. Abhinav Agrawal, Kamal Dua,
Vaibhav Garg, U.V.S. Sara and
Akash Taneja (2006), “Challenges
and Opportunities for the Indian
Pharma Industry”, Health
Administrator, Vol: XX Number
1&2.
8. Aggarwal, Aradhana (2008),
“Strategic Approach to
Strengthening the International
Competitiveness in Knowledge
Based Industries: The Indian
Pharmaceutical Industry.” RISDP,
Namex International Journal of Management Research 81 Vol. 2, Issue No. 1, Jan-June 2012
Financial Performance Of Indian Pharmaceutical Industry
New Delhi.
9. Agarwal Sumit, H. Michele, Oberoi
Arjun (2010), “Unlocking the Value
in Big Pharma”, The McKinsey
Quarterly, 2010 Number 2.
10. Altman, E. (1968), “Financial
Ratios, Discriminant Analysis and
the Prediction of Corporate
Bankruptcy”, Journal of Finance.
11. Chen, Q. (1999), “Evidence
Analysis on Financial Distress of
Listing Companies”, Accounting
Research.
12. Chaudhuri, Sudip (2005), “The
WTO and India’s Pharmaceuticals
Industry: Patent
Protection TRIPS and Developing
Countries”, Oxford University Press,
New Delhi.
13. Deakin, E.B. (1972), “A
Discriminant Analysis of
Predictors of Business Failure”,
Journal of Accounting Research,
March.
14. Mishra, P. (2006) Mergers
Acquisition Market Structure and
Industry Performance: Experience
of Indian Pharmaceutical Industry,
Review of Development and
Change, 11(2).
15. Mishra, P. (2008)
ConcentrationMarkup Relationship
in Indian Manufacturing Sector,
Economic and Political Weekly,
43(39).
16. Ohlson, James A. (1980),
“Financial ratios and the
probabilities prediction of
bankruptcy”, Journal of Accounting
Research, Vol. 18.