Embed Size (px)
Citation preview

HAL Id: hal-01114255https://hal-unilim.archives-ouvertes.fr/hal-01114255
Preprint submitted on 10 Feb 2015
HAL is a multi-disciplinary open accessarchive for the deposit and dissemination of sci-entific research documents, whether they are pub-lished or not. The documents may come fromteaching and research institutions in France orabroad, or from public or private research centers.
L’archive ouverte pluridisciplinaire HAL, estdestinée au dépôt et à la diffusion de documentsscientifiques de niveau recherche, publiés ou non,émanant des établissements d’enseignement et derecherche français ou étrangers, des laboratoirespublics ou privés.
Determinants of Cross Regional Disparity in FinancialDeepening: Evidence from Indonesian provinces
Irwan Trinugroho, Agusman Agusman, Moch Doddy Ariefianto, DarsonoDarsono, Amine Tarazi
To cite this version:Irwan Trinugroho, Agusman Agusman, Moch Doddy Ariefianto, Darsono Darsono, Amine Tarazi. De-terminants of Cross Regional Disparity in Financial Deepening: Evidence from Indonesian provinces.2015. �hal-01114255�

1
Determinants of Cross Regional Disparity in Financial Deepening:
Evidence from Indonesian provinces1
Irwan Trinugrohoab2
, Agusman Agusmanc, Moch. Doddy Ariefianto
d, Darsono
Darsonoe, Amine Tarazi
b
aFaculty of Economics and Business, Universitas Sebelas Maret, Jl. Ir. Sutami 36A,
Surakarta 57126, Indonesia
bUniversité de Limoges, LAPE, 5 rue Félix Eboué, 87031 Limoges Cedex, France
cBank Indonesia (the Central Bank of Indonesia), Jl. M. H. Thamrin, No. 2, Jakarta 10350,
Indonesia
dLembaga Penjamin Simpanan (Indonesia Deposit Insurance Corporation), Equity
Tower 20th-21st, Sudirman Central Business District (SCBD) Lot 9. Jl. Jenderal Sudirman
Kav. 52-53, Jakarta 12190 , Indonesia
eFaculty of Agriculture, Universitas Sebelas Maret, Jl. Ir. Sutami 36A, Surakarta 57126,
Indonesia
Abstract
This paper investigates the determinants of financial deepening across regions in Indonesia
after the institutional reforms which brought the country to become more decentralized.
Using provincial-level data for 33 provinces from 2004 to 2010, we find that poor local
governance significantly impedes financial deepening. Our results also conclude that in the
socioeconomically less developed regions, the level of financial deepening is lower than that
of more developed regions. Various policy implications are provided. Even though
decentralization has been implemented, regional disparity in the form of financial deepening
still exists. Improving local governance should be imposed to facilitate favorable business
environment. Moreover, regulators have to reconsider regulations that have constrained bank
lending.
Keywords: Financial deepening, Local governance, Socioeconomic, Indonesia
1 We thank Taufiq Arifin for his valuable assistance in collecting data on local government financial reports and
audit reports at the Indonesia Supreme Audit Institution (BPK) and data on provincial socioeconomic at the
Indonesia Statistics Bureau (BPS). 2 Corresponding author. Tel. +62271647481, Fax. +62271638143. Email: [email protected],

2
1. Introduction
Severe regional development disparity under the New Order regime in Indonesia
(Akita and Alisjahbana, 2002; Aritenang, 2008) was believed to be due to strong
centralization during such a regime3. Following the harmful 1997/1998 economic crisis and
the fall of the regime, decentralization and local democratization have been implemented as a
part of the institutional reforms (Henderson and Kuncoro, 2011). Decentralization is expected
to reduce inequality in economic development as the local governments at the provincial and
district/municipal levels now have more latitude in establishing cooperation with
organizations in foreign countries which could increase the openness of the regions
(Aritenang, 2008). To bolster economic growth, one important aspect that should be
considered is developing the financial sector to facilitate growth (e.g. King and Levine, 1993;
Levine, 1997; Demirguc-Kunt and Maksimovic, 1998; Rajan and Zingales, 2003; Roe and
Siegel, 2011). However, even though decentralization has already been extensively
implemented, the degree of financial deepening in Indonesia still highly varies across regions.
Indonesian commercial banks have performed well in terms of profitability and soundness;
however, they fail to broaden access to finance, particularly for the poor as well as micro,
small and medium enterprises, which therefore in general Indonesia are still categorized as
“underbanked” (Rosengard and Prasetyantoko, 2011).
The present paper investigates the determinants of cross-region differences in
financial deepening in Indonesia. More specifically we question whether local governance
and socioeconomic conditions contribute to determine the level of financial deepening which
is measured by three proxies: the ratio of loans to province’s GDP, the ratio of loans granted
to micro, small, and medium enterprises (MSMEs)4 over province’s GDP and the ratio of
commercial bank offices per million province’s population5. We extend the literature on the
determinants of financial deepening by studying differences within a country instead of
differences across countries which enables us to reduce noise and the number of controlling
factors in our investigation. Controlling for regional characteristics, we find that poor local
3 The New Order (Indonesian: Orde Baru) regime under President Soeharto led Indonesia for 32 years (1966-
1998). President Soeharto stepped down in May 1998 when the chronic 1997/1998 economic crisis dragged the
country into a social riot. 4 Micro, small and medium enterprises are dominant business units in Indonesia. These firms represent a
significant contribution both in urban and in rural areas. Therefore, bank lending to micro, small and medium
enterprises is an important issue in Indonesia (Trinugroho et al., 2012). 5 We focus on the banking development as the measure of financial deepening because the capital market and
other financial intermediation institutions were still relatively underdeveloped and highly concentrated in some
large cities.

3
governance is significantly and negatively associated with financial deepening. Our results
also reveal that in the socioeconomically less developed regions, the level of financial
deepening is significantly lower than that of more developed regions.
The rest of this paper is structured as follows. Section 2 reviews previous work on
related issues. We discuss the institutional background in Indonesia in section 3. In Section 4,
we describe the methodology. Section 5 reports the results and robustness checks. Section 6
concludes our findings and provides policy implications.
2. Literature Review
Financial deepening is generally defined as the growth in the scale of financial
transactions related to the real economy (Hamori and Hashiguchi, 2012). A growing body of
literature has outlined factors determining cross-country differences in financial development
particularly stressing on institutional factors. According to the seminal papers of La Porta et
al. (1997, 1998) on law and finance, that have empirically examined (e.g. La Porta et al.,
1997, 1998, Levine, 1998, Beck et al., 2003; Gallindo and Micco, 2004; Gallindo and Micco,
2005; Laeven and Majnoni, 2005; Djankov et al., 2007; Dehesa et al., 2007; Dietrich et al.,
2009), several country-level variables - related to legal institutions such as legal origin, credit
rights, rule of law and quality of law enforcement - matter to explain some aspects of finance,
for instance credit to private sector, capital market development, investor protection and cost
of financial intermediation. La Porta et al., (1997) and Levine, (1998), in a cross country
study, find that the breadth of the credit market is positively correlated with good law
enforcement and protection of creditor rights. Creditor rights protection stimulates both
lenders and borrowers to enter into financial contracts and subsequently boosts financial
development (Galindo and Micco, 2004). Djankov et al. (2007) underline two major
determinants of private credit as suggested by economic theory. First, the power of creditors
which reflects how easy lenders can force repayment, take collateral or even take control of
the firm plays an important role. Second, the quality of information is also important as
lenders would more likely act as lenders if they are well-informed on the borrowers. Rajan
and Zingales (2003) and Becerra et al. (2012) emphasize the impact of political factors on
financial development. Another comprehensive explanation on the determinants of financial
development is provided by Herger et al. (2008) highlighting three determinants of a
country’s financial development: cultural heritage, institutional factors, and the degree of

4
openness and transparency. More recently, Roe and Siegel (2011) underline the impact of
political stability on financial development indicating that after controlling for investor
protection, legal origin, and trade openness, political instability can significantly impede a
country’s financial development.
Referring to those who work on the matter of institutional factors, first, we consider
that the quality of local governance greatly influences the level of provincial financial depth.
As explained by Rajan and Zingales (2003), government interventions in the financial sector
development should be in the forms of improving property rights, promoting transparency
and disclosure, ensuring legal system effectiveness, and facilitating regulatory infrastructure.
Although law including its features is generally identical among regions within a country, the
quality of its enforcement is not necessarily the same. Accordingly, the quality of local
governance is important to ensure that legal institutions are well enforced particularly
regarding the creditor/ lender rights. Moreover, local governance, especially with regard to
the bureaucratic process in doing business, indicates how well the local government
facilitates favorable business conditions. Poor governance is highly associated with
corruption and rent seeking behaviors which are detrimental factors to business investment
and public infrastructure development. Subsequently, commercial banks may be reluctant to
establish their business in the poor governance regions because it is quite risky and costly.
Another major factor that could determine the degree of financial intermediation at
the provincial level in Indonesia is the socioeconomic conditions. The socioeconomic
conditions represent some aspects of quality of life such as education, poverty, life
expectancy, living standards, and unemployment. Related to financial deepening, the impact
of socioeconomic conditions could be viewed from lender (banks) and borrower sides. From
the lender side, as argued by Djankov et al., (2007) and Japelli and Pagano (2002) lenders
would be more willing to deal with borrowers if they are well informed. Hence, in the
socioeconomically less developed regions banks have less incentives to channel credits as the
information as well as the quality of borrowers are inadequate. It is therefore more expensive
for banks to grant loans in terms of information and dealing costs. Moreover insufficient
quality of borrowers could increase bank credit risk.
From the borrower side, the decision to borrow money from banks is also determined
by socioeconomic conditions. For instance, for less educated people, the process of getting
loans from banks may be perceived as more complicated than the process of obtaining a loan

5
from predatory lender6 or a pawnshop. Therefore, they tend to avoid borrowing money from
commercial banks.
3. Institutional Background
As an archipelago and comprised of so many ethnic groups with different languages,
religions, and traditions, it is quite difficult to manage Indonesia and to achieve equal
economic development. The New Order regime applied the “trickle-down economics” theory
which relied on growth as the most important element in economic development. It was
expected that this economic system would lead to a common prosperity because the trickle-
down effect could also reach the poor. However, the implementation of this system failed.
The chronic 1997/1998 economic crisis dragged the country into a social and political unrest
and it generated a serious conflict of class between the poor and the rich as the gap between
the two has widened over the years. Economic development inequality across regions was
also pronounced during the regime.
The Indonesia’s institutional reforms which were implemented in the latter half of
1998 have led the country to become more democratized, decentralized, and deregulated
(Mursitama, 2006; Henderson and Kuncoro, 2011). Referring to the Indonesian
decentralization Law No 22/1999, the local governments now have authorities in all
governmental functions except foreign policy, security and defense, religion, judiciary, fiscal
and monetary policy, and some other aspects. Moreover, local governments are also
permitted to establish cooperation with organizations in foreign countries which could
increase their openness (Aritenang, 2008), and subsequently should accelerate the financial
development of the regions (Herger et al., 2008). On the other hand, however,
decentralization and local democratization lead to abuse of power as well. Many powerful
local political figures play dominant roles in many aspects. They tend to act as “little kings”
including providing privileges to those who seek the rents.
6 Predatory lending in Indonesia is a non-bank lending with high interest rate charged mostly on daily or weekly
repayment basis. It is slightly different with the concept of payday lending that has been regulated in some states
in the US (e.g. Stegman and Faris, 2003; Stegman, 2007; Morse, 2011). Payday lending is a source of short-term
consumer credit in low- and moderate-income communities given to those having fixed-income (mostly salary),
while predatory lending in the Indonesia’s case is such loans given to those with or without (mostly without)
fixed-income. In the Indonesian language, such money lenders are usually called rentenir or tengkulak or bank
plecit.

6
For years, broadening access to finance, particularly for the poor as well as micro,
small and medium enterprises (MSMEs), has been a central issue in Indonesia. Even though
this country is known as an example of the success of microfinance7 (Hamada, 2010),
Indonesia is generally still “underbanked” (Rosengard and Prasetyantoko, 2011), especially
with regard to access to finance for the poor and MSMEs. Moreover, paradoxically, this
credit constraint is strengthened by bank regulation; for risk management purposes, bank
borrowers' income has to exceed three times the borrowed funds. Another regulatory
constraint to widen access to bank financing, as revealed by Rosengard and Prasetyantoko
(2011), is the introduction of Indonesian banking architecture (Indonesian: Arsitektur
Perbankan Indonesia/ API)8 stressing banking consolidation which subsequently has
strengthened market power exacerbating the inefficiency of bank intermediation.
4. Methodology
We investigate the determinants of financial deepening across regions in Indonesia after
the decentralization process. We use panel data for 33 provinces from 2004 to 2010.
4.1. Variables and Data
- Financial Depth
As explained earlier, we have three proxies of our dependent variable (financial
depth) which are:
The ratio of credit released by commercial banks located in a province to province’s GDP
The ratio of commercial bank loans given to micro, small and medium enterprises in a
province over the province’s GDP
The ratio of number of bank branches per million population of the province
Data on bank loans, bank loans to MSMEs and commercial bank offices at the
provincial level are collected from Bank Indonesia (Central bank of Indonesia), while data on
7 Hamada (2010) exemplifies BRI (Indonesian: Bank Rakyat Indonesia), the third largest Indonesian state-owned bank, as the one of the world’s most successful commercialization of microfinance as it is supported by nationwide network of microfinance local units enabling this bank to release large quantity of loans. 8 The Indonesian Banking Architecture, a road map of the Indonesian banking sector which would be
implemented gradually, was introduced by the Indonesian government in 2004 (Trinugroho et al., 2012).

7
provinces’ GDP and provinces' population come from the Indonesia Statistics Bureau
(Indonesian: Biro Pusat Statistik/ BPS).
- Local Governance
To measure local governance, we rely on the local governance index released by the
Partnership (Indonesian: Kemitraan), a multi-stakeholder organization which is assigned to
promote and institutionalize good governance principles in Indonesian society by
implementing harmonized reform programs to strengthen public service governance, deepen
democracy, improve security and justice and improve economic and environmental
governance. This index defines governance as the process of formulation and implementation
of rules and regulation through interaction between state, civil society, and economic society.
Therefore, it consists of four sub-indexes which are bureaucracy index, government index,
civil society index, and economic society index. However, as the focus of local governance in
this paper is to assess the government roles in promoting financial development, we only take
the bureaucracy index and government index as the proxies of local governance. The
bureaucracy index reflects the governance of public service, local revenue collection and the
regulation of the local economy, while the government index measures the governance of the
government functions which are regulatory function, development coordination and budget
allocation function. Each index consists of six principles of governance which are
participation, fairness, accountability, transparency, efficiency and effectiveness. The score
ranges from 0 to 10.
- Regional socioeconomic Conditions
Socioeconomic conditions reflect some aspects of quality of life. Therefore, human
development and the level of poverty could be considered as suitable proxies for regions'
socioeconomic conditions.
Human Development Index
We retrieve data on the regional human development index (HDI) from the BPS.
Referring to the UNDP, the BPS defines the human development index as a process of
enlarging the choice of people. Therefore, there are three aspects in measuring the HDI which
are life expectancy, education and living standards.
Poverty

8
We obtain data on the level of poverty of regions from the BPS. The level of poverty
is measured as the number of population below the poverty threshold (line) to total
population.
- Control Variables
Conflict Regions
We include a dummy variable for regions that are unstable in terms of politic and
security (conflict regions). The dark side of the institutional reforms is political instability in
some regions which lead to a disintegration problem as they insist to be much more
decentralized. Roe and Siegel (2011) also find that cross country difference in financial
development is also influenced by the level of political stability.
Outside Java island
Indonesia has a unique feature regarding its location that is geographically spread out.
To control for this geographical aspect, we account for a dummy variable taking a value of 1
for provinces situated outside the Java Island. Java is considered as the most developed island
in Indonesia as it benefited much more from the centralization policy of the New Order
regime. Java is also the island where the capital of Indonesia (Jakarta) is located.
New Province
Another implication of the institutional reforms was splitting some provinces into new
provinces. Before the reforms, the number of provinces was 27 provinces. 7 new provinces
emerged early after the reforms and 1 province (East Timor) decided to become a new
country. Therefore currently Indonesia consists of 33 provinces. To account for possible
differences in financial development between new provinces and existing provinces, we
include a dummy variable for new provinces.
Budget Deficit
We include a dummy variable taking a value of 1 for regions with governments facing
budget deficits following the study of Gallindo and Micco (2004). Two contradictory
consequences may arise concerning the impact of deficits of local government budgets on
financial deepening. As argued by Chen et al. (2011), budget deficits could increase incentive
to rent-seeking which is a detrimental factor to investment and business growth. On the other
side, budget deficits could also encourage the local government to promote investments and

9
infrastructure development through public-private partnerships which subsequently could
increase the bank lending for project financing.
We collect information regarding the budget of local governments from the Supreme
Audit Institution (Indonesian: Badan Pemeriksa Keuangan/ BPK). Local governments have
to report their financial reports to the BPK for the auditing purpose.
GDP per Capita
We also control for natural log of GDP following the studies of Gallindo and Micco
(2004) and Roe and Siegel (2011). Data on regional GDP as well as provincial population are
obtained from the BPS. Because the data on population are based on ten-yearly census, we
interpolate them to get yearly data.
Oil or Gas Producer
The last control variable is a dummy variable to account for regions which are oil or
gas producers. Data to identify whether a region is an oil or gas producer is obtained from the
Ministry of Energy and Natural Resources.
4.2. Estimation Strategy
We use OLS to run our specifications on the determinants of financial development
following the studies of Galindo and Micco (2004) and Dehesa et al. (2007) in a cross-
country study. As the bureaucracy index and government index are highly correlated, we do
not introduce these two variables concurrently. Similarly, because of their strong correlations,
we do not introduce variables such as the human development index, the poverty variable and
the dummy for conflict regions at the same time.
5. Results
5.1. Descriptive Statistics and Correlation of variables
Descriptive statistics of variables is presented in table 1. We present the statistics of
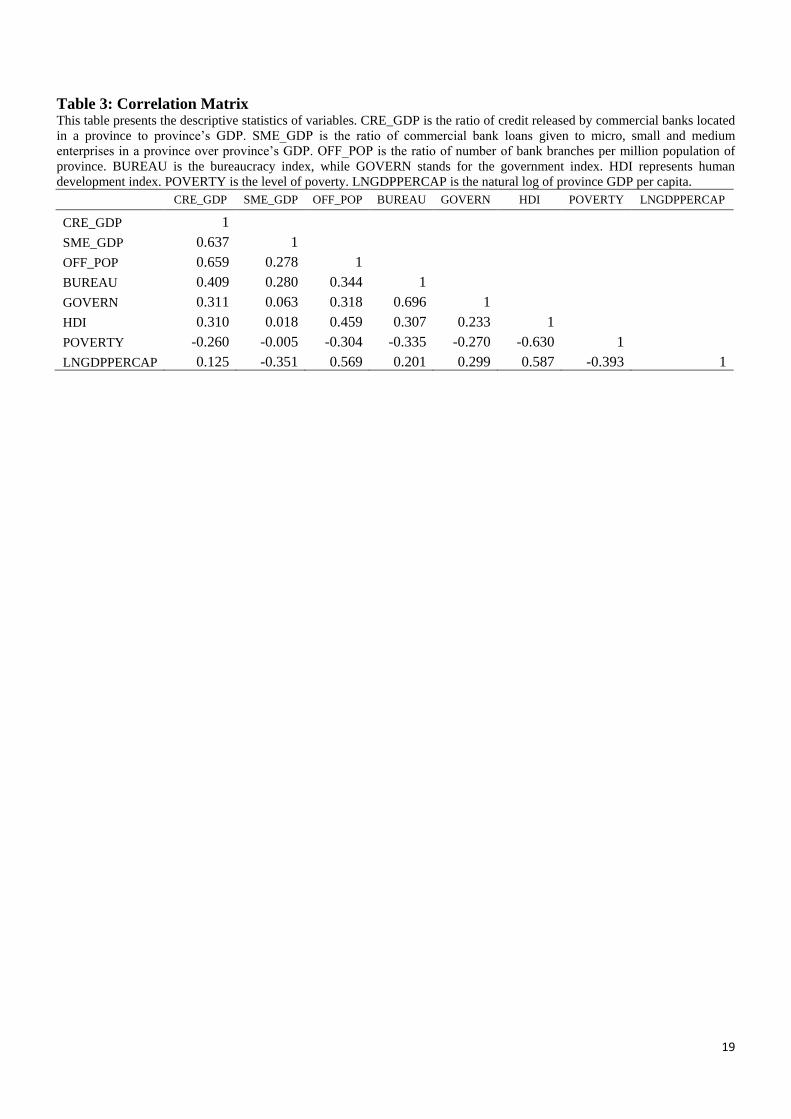
financial depth for each province in table 2. Table 3 exhibits the correlation matrix of
variables.

10
-----------------------------
Insert Table 1 here
-----------------------------
-----------------------------
Insert Table 2 here
-----------------------------
-----------------------------
Insert Table 3 here
-----------------------------
As presented in the descriptive statistics in table 2, the average ratio of credit released
by commercial banks located in Jakarta to Jakarta’s GDP during the period we study is
80.41% (the maximum), while 6.07% is the minimum average of such a ratio which is for the
province of Sulawesi Tenggara. As shown in table 1, the standard deviation of this ratio is
15.2%, while the standard deviation of the ratio of commercial bank loans given to micro,
small and medium enterprises in a province over the province’s GDP is 10.4%. The data
clearly show that the level of financial deepening is imbalanced across regions. If we turn to
the ratio of the number of bank branches per million population of province, again we notice
a large dispersion among regions. During the observation period, the average of this ratio for
Jakarta is 54 bank branches per million of inhabitants, while in Sulawesi Tenggara, 4 bank
offices per million people is the average.
As expected, the correlation matrix shows that the proxies of local governance which
are the bureaucracy index and the government index are positively correlated with all of our
dependent variables. We also find that the human development index is positively correlated
with the proxies of financial depth, while the level of poverty is negatively correlated with the
financial depth’s measures.
5.2. Empirical Results
-----------------------------
Insert Table 4 here
-----------------------------
Table 4 presents the results of OLS regression of our first proxy of financial depth
which is the ratio of credit released by commercial banks located in a province to local GDP.
Our results show that provinces with a higher level of bureaucracy index have a significantly

11
higher ratio of commercial bank credit to local GDP. Likewise, the government index is
significantly and positively associated with our first measure of financial depth. Turning to
the impact of socioeconomic conditions, as expected, we find that human development index
is positively associated with the level of bank loans to province’s GDP. Similarly, the ratio of
loans released by commercial banks located in a province to province’s GDP is significantly
lower for the provinces with a higher level of poverty.
-----------------------------
Insert Table 5 here
-----------------------------
Table 5 reports the results of OLS regressions of the ratio of commercial bank loans
given to micro, small and medium enterprises (MSMEs) in a province over province’s GDP.
The coefficients of bureaucracy index and government index are all positive and significant.
Similar results are found for the coefficients of the human development index. Poverty is
negatively associated with the depth banks released loans to MSMEs.
-----------------------------
Insert Table 6 here
-----------------------------
Table 6 exhibits the results of OLS regressions of the ratio of number of bank
branches per capita. Similarly to those obtained for the two first dependent variables, we find
evidence that local governance matter to explain the level of financial deepening. Regions
with good governance, represented by a high degree of bureaucracy index and government
index, have a higher level of financial deepening. As expected, we also find that the
coefficient of the human development index is positive and significant in all the regressions.
In general, our results provide evidence that unequal financial deepening in Indonesia
is significantly influenced by how well the local governments manage their regions. There are
several possible explanations. First, as argued by the law and finance literature (e.g. La Porta
et al., 1997; Levine, 1998), the quality of local government is important to ensure that legal
institutions are well-imposed especially with regard to the creditor/ lender rights to stimulate
banks in channeling credit. Second, bureaucratic procedure in doing business indicates to
which extent the local government is capable of facilitating a favorable business climate to
attract business investments. This is consistent with some cross country studies which show
the positive relationship between the degree of openness and financial development (e.g.
Herger et al., 2008; Rajan and Zingales, 2003). Moreover, it is generally known that

12
governments with poor governance are keen on corruption and rent seeking behaviors, which
are detrimental factors to business investment and public infrastructure development.
Subsequently, commercial banks and other types of banks may be reluctant to establish their
business in the poor governance regions which in turn impedes banking competition in the
regions.
Our results also show that in the socioeconomically less developed regions, the level
of financial deepening is lower than that of more developed regions. Overall, this finding is
consistent with our expectations. As explained earlier, the impact of socioeconomic
conditions on the level of financial deepening could be viewed from lender (banks) and
borrower sides. From the lender side, it is generally accepted that lenders are much more
willing to channel loans when they know more about borrowers (Djankov et al., 2007). In the
socioeconomically less developed regions, reflected by high degree of poverty and low
human development, banks lack incentives to release credit as the information as well as the
quality of borrowers are deficient. To grant loans, banks face expensive costs in terms of
information and dealing costs. Furthermore, banks have to deal with borrowers with lower
quality which subsequently increases their risk. Even though banks could charge a higher risk
premium to cover the higher risk, Indonesian banks generally tend to behave prudently. On
the other hand, in such regions deficit spending units also tend to be reluctant to use bank
loans as they perceive that the process of getting loans from banks is more complicated than
the process of obtaining, for example a loan from predatory lender or a pawnshop.
Moreover, some banking regulations might have exacerbated the unequal banking
development. First, the regulation on the income of bank borrowers have naturally created a
barrier to financial deepening. Second, as revealed by Rosengard and Prasetyantoko (2011),
the banking consolidation process which has been promoted by regulators has strengthened
banking oligopoly maintaining a high intermediation cost.
Regarding control variables, we find that the level of financial deepening is lower in
the conflict (politically and securitically unstable) regions than in other regions. The results
confirm the finding of Roe and Siegel (2011) in a cross country research showing that
political instability impedes financial development. Second, we find that credit released by
commercial banks is lower in the provinces located outside Java Island even though the ratio
of bank offices per capita is higher in such regions. Our results also show that there is a
significant difference in financial development between existing provinces and new

13
provinces. Interestingly, the latter have a significantly higher level of financial depth. We find
that the ratio of number of bank branches per capita is positively associated with GDP per
capita. In contrast, the ratio of commercial bank loans given to micro, small and medium
enterprises (MSMEs) in a province to its GDP is lower in the regions with a higher ratio of
GDP per capita. No difference in financial deepening is found between deficit and surplus
budget provinces. Likewise, we find only little evidence of differences in financial depth
between regions which produce oil or gas and their non-producer counterparts.
5.3. Robustness Checks
We perform several robustness checks. First, we use secondary school enrolment
following the study of Hasan et al. (2009) as a proxy of socioeconomic conditions to replace
the human development index. Contextually, the Indonesian government has also
implemented a policy that the minimum education should be secondary (junior high) school9.
The results show that provinces with a higher level of secondary school enrollment
significantly have a higher level of financial depth. For all the remaining variables the results
are also consistent.
Second, we run regressions by excluding the natural log of GDP per capita as it has a
strong correlation with the proxies of socioeconomic conditions (human development index
and poverty). With regard to our variables of interest (local governance and socioeconomic
variables), our results remain unchanged.
Third, we change the proxies of financial depth to the ratio of bank loans to
province’s population and the ratio of bank loans to MSMEs over province’s population.
Again, the results show that local governance and socioeconomic conditions matter to explain
cross region differences in financial deepening.
6. Conclusions
We investigate the determinants of unequal financial deepening across regions in
Indonesia by considering local governance and socioeconomic conditions as the main factors.
We use data of 33 provinces over the 2004-2010 period (after the decentralization policy).
9 This policy is called nine-year compulsory education (Indonesian: wajib belajar sembilan tahun).
14
We find that local governance quality is significantly and positively associated with
the importance of bank lending - and to MSMEs specifically - with regards to local GDP.
Local governance quality is also positively linked with the number of bank offices per capita.
Our results also show that in the socioeconomically less developed regions, as reflected by
low human development and high degree of poverty, the level of financial deepening is lower
than that of more developed regions. In general, even though decentralization has been
implemented globally in Indonesia, regional disparity in the form of financial deepening still
exists.
Our findings have some noteworthy policy implications. First, improving local
governance, particularly for regions having poor governance, should be encouraged to
facilitate a favorable business environment. An encouraging business climate could provide
incentives for banks to expand their business more specifically in granting loans. Second,
regulators have to reconsider regulations that have constrained bank lending especially the
regulation on the income of bank borrowers and its strong limitations. This regulation might
have improved the soundness of banks but it might also have gone too far by excluding a
large number of borrowers from the formal system encouraging "predatory lending" practices
in the financially less developed regions.
References
Akira, T., Alisjahbana, A.S., 2002, Regional Income Inequality in Indonesia and the Initial
Impact of the Economic Crisis, Bulletin of Indonesian Economic Studies 38, 201-222.
Ansari, K.M., 2007. Budget! trickle down?. Paper retrieved from the website of Journalist for
Democracy and Human Rights.
Aritenang, A.F., 2008. A Study on Indonesia Regions Disparity: Post Decentralization.
MPRA working paper.
Becerra, O., Cavallo, E., Scartascini, C., 2012. The politics of financial development: The
role of interest groups and government capabilities. Journal of Banking & Finance 36,
626–643.
Beck, T., Demirgüç-Kunt, A., Levine, R., 2003. Law and finance: why does legal origin
matter? Journal of Comparative Economics 31, 653–675.

15
Chen, C.J.P, Li, Z., Su, X., Sun, Z., 2011. Rent-seeking incentives, corporate political
connections, and the control structure of private firms: Chinese evidence. Journal of
Corporate Finance 17, 229–243.
Dehesa, M., Druck, P., Plekhanov, A., 2007. Relative Price Stability, Creditor Rights, and
Financial Deepening. IMF Working Paper WP/07/139.
Demirguc-Kunt, A., Maksimovic, V., 1998. Law, finance, and firm growth. Journal of
Finance 53, 2107–2138.
Dietrich, A., Wanzenried, G., Cole, R.A., 2009. Why are net-interest margins across
countries so different?. Working Paper presented in the European Financial
Management Conference 2010.
Djankov, S., McLiesh, C., Shleifer, A., 2007. Private Credit in 129 Countries. Journal of
Financial Economics 84, 299-329.
Galindo, A., Micco A., 2004, “Creditor Protection and Financial Markets: Empirical
Evidence and Implications for Latin America,” Federal Reserve Bank of Atlanta
Economic Review, Q2, 29–37.
Galindo, A., Micco, A., 2005. Creditor Protection and Credit Volatility. IDB Working Paper
528.
Hamada, M. 2010. Commercialization of Microfinance in Indonesia: The Shortage of Funds
and the Linkage Program. The Developing Economies 48, 156–76.
Hamori , S., Hashiguchi, Y., 2012. The effect of financial deepening on inequality: Some
international evidence. Journal of Asian Economics 23, 353–359.
Hasan, I., Wachtel, P., Zhou, M. 2009. Institutional development, financial deepening and
economic growth: Evidence from China. Journal of Banking & Finance 33, 157–170.
Henderson, J.V., Kuncoro, A., 2011. Corruption and local democratization in Indonesia: The
role of Islamic parties. Journal of Development Economics 94, 164–180.
Herger, N., Hodler, R., Lobsiger, M., 2008. What Determines Financial Development?
Culture, Institutions or Trade. Review of World Economics 144, 558-587.
Jappelli, T., Pagano, M., 2002. Information Sharing, Lending, and Defaults: Cross-country
Evidence. Journal of Banking and Finance 26, 2017–45.
King, R., Levine, R., 1993. Finance and growth: Schumpeter might be right. The Quarterly
Journal of Economics 108, 681–737.
La Porta, R., Lopez-de-Silanes, F., Shleifer, A., Vishny, R.W., 1997. Legal determinants of
external finance. Journal of Finance 52, 1131–1150.

16
Laeven, L., Majnoni, G., 2005. Does judicial efficiency lower the cost of credit? Journal of
Banking & Finance 29, 1791–1812.
Levine, R., 1998. The legal environment, banks, and long-run economic growth. Journal of
Money, Credit and Banking 30 (3, part 2), 596–613.
Morse, A., 2011. Payday Lenders: Heroes or Villains? Journal of Financial Economics 102,
28-44.
Mursitama, T.N., 2006. Creating relational rents: The effect of business groups on affiliated
firms’ performance in Indonesia. Asia Pacific Journal of Management 23, 537–557.
Rajan, R.G., Zingales L., 2003. The Great Reversals: The Politics of Financial Development
in the Twentieth Century. Journal of Financial Economics 69, 5–50.
Roe, M.J., Siegel, J.I., 2011. Political instability: Effects on financial development, roots in
the severity of economic inequality. Journal of Comparative Economics 39, 279–309.
Rosengard, J.K., Prasetyantoko, A., 2011. If the Banks are Doing So Well, Why Can’t I Get a
Loan? Regulatory Constraints to Financial Inclusion in Indonesia. Asian Economic
Policy Review 6, 273–296.
Stegman, M.A. 2007. Payday Lending. Journal of Economic Perspectives 21, 169-190.
Stegman, M.A., Faris, R. 2003. Payday Lending: A Business Model that Encourages Chronic
Borrowing. Economic Development Quarterly 17, 8-32.
Trinugroho, I., Agusman., A., Tarazi, A., 2014. Why Have Bank Interest Margins Been so
High in Indonesia since the 1997/1998 Financial Crisis? Research in International
Business and Finance 32, 139-158.

17
Table 1: Descriptive Statistics This table presents the descriptive statistics of variables. CRE_GDP is the ratio of credit released by commercial banks located
in a province to province’s GDP. SME_GDP is the ratio of commercial bank loans given to micro, small and medium
enterprises in a province over province’s GDP. OFF_POP is the ratio of number of bank branches per million population of
province. BUREAU is the bureaucracy index, while GOVERN stands for the government index. HDI represents human
development index. POVERTY is the level of poverty. LNGDPPERCAP is the natural log of province GDP per capita.
CRE_GDP SME_GDP OFF_POP BUREAU GOVERN HDI POVERTY LNGDPPERCAP
Mean 0.217 0.179 15.330 5.609 4.945 70.292 16.695 16.295
Median 0.183 0.165 12.236 5.740 4.920 70.320 14.625 16.234
Maximum 0.997 0.667 62.579 7.340 6.800 77.600 41.570 18.448
Minimum 0.028 0.041 3.535 3.880 3.530 60.600 3.180 14.901
Std. Dev. 0.152 0.104 10.561 0.838 0.851 3.294 8.625 0.719
Skewness 2.637 1.837 2.180 -0.304 0.275 -0.349 0.826 0.762
Observnation 222 213 231 231 231 231 226 231

18
Table 2: Descriptive Statistics of financial depth each province
No Province
Average credit
to province's
GDP
Average credit to
MSMEs over
province's GDP
Average bank
branches to million
province's
population
1 Jawa Barat 0.151585 0.167045 7.549934
2 Banten 0.211209 0.216435 6.09837
3 DKI Jakarta 0.804159 0.211325 54.69153
4 D.I Yogyakarta 0.233692 0.195186 13.86315
5 Jawa Tengah 0.191211 0.146325 7.713605
6 Jawa Timur 0.174687 0.113382 9.607461
7 Bengkulu 0.233627 0.237419 9.823258
8 Jambi 0.181039 0.166913 14.49752
9 Nanggroe Aceh
Darussalam 0.112975 0.105513 12.7248
10 Sumatera Utara 0.277216 0.144166 11.32808
11 Sumatera Barat 0.190449 0.152634 15.40538
12 Riau 0.098391 0.071691 10.02068
13 Sumatera Selatan 0.089371 0.064844 5.442373
14 Kepulauan Riau 0.322449 0.252285 43.30654
15 Bangka Belitung 0.113382 0.08813 18.38444
16 Lampung 0.17065 0.133475 5.89149
17 Kalimantan Selatan 0.227636 0.169252 17.09068
18 Kalimantan Barat 0.176742 0.148041 11.49368
19 Kalimantan Timur 0.07343 0.049332 28.01721
20 Kalimantan Tengah 0.130586 0.097066 12.95606
21 Sulawesi Tengah 0.201794 0.18609 10.67918
22 Sulawesi Selatan 0.30837 0.243932 11.43564
23 Sulawesi Utara 0.242101 0.275376 21.77532
24 Sulawesi Barat 0.277152 0.22098 10.31237
25 Gorontalo 0.495298 0.557642 23.33381
26 Sulawesi Tenggara 0.060666 0.05699 4.1979
27 Nusa Tenggara Barat 0.148065 0.151064 7.394472
28 Bali 0.304769 0.270322 20.94691
29 Nusa Tenggara Timur 0.2221 0.217585 8.981006
30 Maluku 0.293108 0.276596 19.5568
31 Papua 0.076143 0.067278 13.15871
32 Maluku Utara 0.276154 0.262264 14.94563
33 Irian Jaya Barat 0.129386 0.100658 25.84427
19
Table 3: Correlation Matrix This table presents the descriptive statistics of variables. CRE_GDP is the ratio of credit released by commercial banks located
in a province to province’s GDP. SME_GDP is the ratio of commercial bank loans given to micro, small and medium
enterprises in a province over province’s GDP. OFF_POP is the ratio of number of bank branches per million population of
province. BUREAU is the bureaucracy index, while GOVERN stands for the government index. HDI represents human
development index. POVERTY is the level of poverty. LNGDPPERCAP is the natural log of province GDP per capita.
CRE_GDP SME_GDP OFF_POP BUREAU GOVERN HDI POVERTY LNGDPPERCAP
CRE_GDP 1
SME_GDP 0.637 1
OFF_POP 0.659 0.278 1
BUREAU 0.409 0.280 0.344 1
GOVERN 0.311 0.063 0.318 0.696 1
HDI 0.310 0.018 0.459 0.307 0.233 1
POVERTY -0.260 -0.005 -0.304 -0.335 -0.270 -0.630 1
LNGDPPERCAP 0.125 -0.351 0.569 0.201 0.299 0.587 -0.393 1

20
Table 4: OLS Regressions of Bank Loan to Region’s GDP The values in parentheses are robust standard errors. *, ** and *** indicate significance at the 10%, 5%, and 1% levels,
respectively.
Bank Loan/ GDP
1 2 3 4 5 6
Bureaucracy Index 0.057*** 0.061*** 0.059***
(0.014) (0.016) (0.015)
Government Index
0.063*** 0.060*** 0.061***
(0.014) (0.015) (0.014)
Human Development
Index 0.012***
0.015***
(0.002)
(0.002)
Poverty
-0.002**
-0.002***
(0.0009)
(0.0008)
Conflict
-0.074***
-0.111***
(0.017)
(0.016)
Outside Java -0.052* -0.059** -0.055* -0.041 -0.055* -0.046
(0.028) (0.029) (0.029) (0.028) (0.030) (0.029)
New Province 0.044* 0.035 0.041* 0.078*** 0.065*** 0.074***
(0.023) (0.024) (0.024) (0.023) (0.026) (0.024)
Budget Deficit 0.018 0.017 0.017 0.018 0.018 0.016
(0.027) (0.027) (0.027) (0.027) (0.027) (0.027)
Natural Log GDP Per
Capita -0.027 -0.014 0.002 -0.028 -0.019 0.004
(0.023) (0.023) (0.025) (0.022) (0.023) (0.026)
Oil or Gas Producer -0.024 -0.010 -0.013 -0.047** -0.028** -0.032*
(0.016) (0.016) (0.015) (0.018) (0.023) (0.017)
Constant -0.403 -0.230 -0.062 -0.499 0.363 -0.058
(0.451) (0.417) (0.440) (0.464) (0.399) (0.446)
Year dummies Included Included Included Included Included Included
Method OLS OLS OLS OLS OLS OLS
Number of Province 33 33 33 33 33 33
Number of Observations 221 221 221 221 221 221
Period 2004-2010 2004-2010 2004-2010 2004-2010 2004-2010 2004-2010
R-Squared 0.278 0.253 0.259 0.295 0.248 0.267

21
Table 5: OLS Regressions of Bank Loan to MSMEs over Region’s GDP The values in parentheses are robust standard errors. *, ** and *** indicate significance at the 10%, 5%, and 1% levels,
respectively.
Bank Loan to MSMEs/ GDP
1 2 3 4 5 6
Bureaucracy Index 0.039*** 0.045*** 0.042***
(0.008) (0.010) (0.009)
Government Index
0.042*** 0.040*** 0.040***
(0.009) (0.011) (0.010)
Human Development
Index 0.009***
0.011***
(0.001)
(0.001)
Poverty
-0.001
-0.001*
(0.001)
(0.0007)
Conflict
-0.047***
-0.073***
(0.010)
(0.010)
Outside Java 0.010 0.003 0.006 0.018 0.004 0.011
(0.010) (0.010) (0.010) (0.012) (0.011) (0.011)
New Province 0.082*** 0.077*** 0.080*** 0.104*** 0.099*** 0.102***
(0.019) (0.020) (0.019) (0.021) (0.023) (0.022)
Budget Deficit -0.003 -0.003 -0.004 -0.004 -0.003 -0.005
(0.014) (0.015) (0.015) (0.014) (0.015) (0.015)
Natural Log GDP Per
Capita -0.084*** -0.071*** -0.063*** -0.090*** -0.073*** -0.060***
(0.010) (0.009) (0.010) (0.010) (0.009) (0.010)
Oil or Gas Producer -0.033*** -0.022** -0.024** -0.048** -0.035*** -0.037***
(0.011) (0.011) (0.011) (0.012) (0.012) (0.012)
Constant 0.743*** 1.140*** 1.011*** 0.664*** 1.227*** 1.003***
(0.149) (0.143) (0.152) (0.150) (0.142) (0.146)
Year dummies Included Included Included Included Included Included
Method OLS OLS OLS OLS OLS OLS
Number of Province 33 33 33 33 33 33
Number of Observations 212 212 212 212 212 212
Period 2004-2010 2004-2010 2004-2010 2004-2010 2004-2010 2004-2010
R-Squared 0.524 0.484 0.495 0.529 0.460 0.487

22
Table 6: OLS Regressions of Bank Branches to Population (Million) The values in parentheses are robust standard errors. *, ** and *** indicate significance at the 10%, 5%, and 1% levels,
respectively.
Bank Offices/ Population (million)
1 2 3 4 5 6
Bureaucracy Index 2.251*** 2.898*** 2.716***
(0.689) (0.725) (0.697)
Government Index
3.043*** 3.142*** 3.066***
(0.602) (0.679) (0.647)
Human Development
Index 0.628***
0.787***
(0.127)
(0.142)
Poverty
0.006
-0.026
(0.054)
(0.056)
Conflict
-0.866
-2.702**
(1.260)
(1.248)
Outside Java 2.556 1.948 2.116 3.360** 2.352 2.736
(1.664) (1.670) (1.695) (1.601) (1.656) (1.662)
New Province 7.417*** 6.467*** 6.938*** 9.128*** 8.136*** 8.689***
(1.373) (1.471) (1.394) (1.254) (1.403) (1.326)
Budget Deficit 0.437 0.494 0.436 0.261 0.442 0.307
(1.394) (1.420) (1.416) (1.360) (1.400) (1.396)
Natural Log GDP Per
Capita 8.151*** 9.050*** 9.325*** 7.606*** 8.813*** 9.396***
(1.235) (1.219) (1.248) (1.197) (1.248) (1.348)
Oil or Gas Producer -1.669 -1.067 -0.946 -2.621** -1.958* -1.850
(1.028) (1.141) (1.120) (1.084) (1.154) (1.147)
Constant -179.08*** -152.25*** -155.95*** -184.20*** -147.28*** -157.21***
(22.313) (22.010) (22.340) (23.482) (21.0253) (22.612)
Year dummies Included Included Included Included Included Included
Method OLS OLS OLS OLS OLS OLS
Number of Province 33 33 33 33 33 33
Number of Observations 230 225 230 230 225 230
Period 2004-2010 2004-2010 2004-2010 2004-2010 2004-2010 2004-2010
R-Squared 0.504 0.469 0.484 0.523 0.475 0.494