Embed Size (px)
Citation preview

BuR - Business Research Official Open Access Journal of VHB German Academic Association for Business Research (VHB) Volume 4 | Issue 2 | December 2011 | 193-239
193
1 Introduction Companies invest substantial shares of their mar-keting budget into advertising. In 2010, for exam-ple, Coca-Cola spent USD 2.9 billion on worldwide advertising (The Coca-Cola Company 2011: 63) while global advertising spending increased by 10.6% to USD 503 billion (The Nielsen Company 2011). Despite the fact that investments in online media are predicted to continually rise (between 2009 and 2013 from 12.8% to 18.3% of overall ad-
vertising spending), Figure 1 reveals that – even though the world is turning online – the lion’s share of advertising is constantly invested in offline media (ZenithOptimedia 2011: 4). Companies’ massive investment in advertising is necessary in order to persuade the consumer to purchase the product by influencing his attitude, social norm, perceived behavior control, and subse-quently his behavior intention (Armitage and Con-ner 2001). Next to personal selling, in which com-
Determinants of Advertising Effectiveness: The Development of an International Advertising Elasticity Database and a Meta-Analysis
Sina Henningsen, Institute of Innovation Research, Christian-Albrechts-University at Kiel, Germany, E-mail: [email protected].
Rebecca Heuke, Institute of Marketing and Media, University of Hamburg, Germany, E-mail: [email protected].
Michel Clement, Professor of Marketing and Media Management, Institute of Marketing and Media, University of Hamburg, Germany,
E-mail: [email protected].
Abstract Increasing demand for marketing accountability requires an efficient allocation of marketing expendi-tures. Managers who know the elasticity of their marketing instruments can allocate their budgets opti-mally. Meta-analyses offer a basis for deriving benchmark elasticities for advertising. Although they pro-vide a variety of valuable insights, a major shortcoming of prior meta-analyses is that they report only generalized results as the disaggregated raw data are not made available. This problem is highly relevant because coding of empirical studies, at least to a certain extent, involves subjective judgment. For this rea-son, meta-studies would be more valuable if researchers and practitioners had access to disaggregateddata allowing them to conduct further analyses of individual, e.g., product-level-specific, interests. We arethe first to address this gap by providing (1) an advertising elasticity database (AED) and (2) empirical generalizations about advertising elasticities and their determinants. Our findings indicate that the aver-age current-period advertising elasticity is 0.09, which is substantially smaller than the value 0f 0.12 that was recently reported by Sethuraman, Tellis, and Briesch (2011). Furthermore, our meta-analysis reveals a wide range of significant determinants of advertising elasticity. For example, we find that advertisingelasticities are higher (i) for hedonic and experience goods than for other goods; (ii) for new than for estab-lished goods; (iii) when advertising is measured in gross rating points (GRP) instead of absolute terms; and (iv) when the lagged dependent or lagged advertising variable is omitted. JEL-Classification: C10, D12, M37 Keywords: advertising effectiveness, advertising elasticity, advertising elasticity database, meta-analysis, empirical marketing generalizations Manuscript received February 9, 2010, accepted by Andreas Herrmann (Guest Editor Marketing) Septem-ber 25, 2011.

BuR - Business Research Official Open Access Journal of VHB German Academic Association for Business Research (VHB) Volume 4 | Issue 2 | December 2011 | 193-239
194
panies in the US invest almost three times the amount spent on advertising (Albers, Mantrala, and Sridhar 2010), advertising is the second largest investment to influence consumer behavior.
Figure 1: Global Advertising Spending by Medium
23.0% 21.3% 20.0% 18.7% 17.6%
10.4% 9.8% 9.3% 8.8% 8.3%
39.1% 40.4% 40.9% 41.5% 41.7%
7.5% 7.2% 7.1% 6.9% 6.8%7.2% 7.1% 7.2% 7.3% 7.3%12.8% 14.1% 15.4%16.8%
18.3%
0
100
200
300
400
500
600
2009 2010 2011 2012 2013
Bil
lio
n U
SD
Years
Newspapers Magazines TV Radio Cinema & Outdoor Internet
Source: ZenithOptimedia 2011 (estimated values for 2011-2013)
Such high advertising expenditures have to be justi-fied by satisfactory financial outcomes, so marketing managers are greatly interested in measuring the response to advertising expenditures (Lehmann 2004; Srinivasan, Vanhuele, and Pauwels 2010). A powerful measure to quantify the effect of adver-tising is the advertising elasticity, which is dimen-sionless and simple to interpret (Parsons 1975; Tel-lis 1988). Albers, Mantrala, and Sridhar (2010: 840) defined the elasticity as “the ratio of the percentage change in output (e.g., dollar or unit sales) to the corresponding percentage change in the input (e.g., dollar expenditures on advertising”. The particular advantage of elasticities arises from the fact that managers who know the elasticity of their market-ing instruments are able to allocate their budgets optimally (Albers 2000). This ability requires knowledge of advertising elasticities – ideally drawn from an easily accessible database. Despite the high relevance of marketing elasticities for managerial decision making and marketing sci-entists, only a few meta-analyses have focused on this topic. Albers, Mantrala, and Sridhar (2010) found a mean elasticity of 0.34 for personal selling. Bijmolt, Van Heerde, and Pieters (2005) report a mean price elasticity of -2.62 which indicates a sub-stantial increase over time compared to the mean price elasticity of -1.76 reported by Tellis (1988).
With regard to advertising elasticities, Assmus, Far-ley, and Lehmann (1984) reported a mean short-term advertising elasticity of 0.22. This finding was recently updated by Sethuraman, Tellis, and Briesch (2011), who reported an average current-period advertising elasticity of 0.12. What these meta-analyses of advertising and other marketing elasticities have in common is that they report valuable generalized findings. Unfortunately, they do so at a highly aggregated level without providing the database from which the results are derived. Thus, prior meta-analyses do not allow researchers to (i) quickly determine which studies report elasticities on a specific topic; (ii) easily ag-gregate prior elasticity findings with respect to cer-tain subgroups; or (iii) run their own, e.g., product-type-specific, analyses to optimize research-related and real-life marketing decisions. In summary, we address two major research gaps in the field of advertising elasticities with this study: First, even though a few meta-analyses on advertis-ing elasticities exist, the underlying data have never been made available, thus preventing access to the disaggregated data. Second, because the underlying database is unavailable, the findings of conventional meta-analyses cannot be retraced. This situation is unsatisfactory because coding involves personal judgment, which may mean that the findings of meta-analyses need to be adjusted to specific con-texts. In order to eliminate these shortcomings, this study contributes to extant research by providing the first international, online-access advertising elasticity database (AED, Web Appendix 1), which includes empirical elasticities from the 62 studies outlined in section 3.1. For all of these studies, a large number of characteristics are coded, including most of the moderator variables used by Sethuraman, Tellis, and Briesch (2011) as well as additional ones, such as competitive effects, seasonality, income, and various publication details which are outlined in section 2. With respect to the type of advertising elasticity, we have found 602 short- and 143 long-term elasticities in the empirical studies. Due to our focus on contemporaneous effects, we have calcu-lated current-period elasticities, i.e., short-term elasticities derived from long-term elasticities, wherever possible. These calculations yielded an additional 58 current-period elasticities. The AED is enhanced by a coding handbook (Web Appendix 2) and by a study overview, which contains a summary

BuR - Business Research Official Open Access Journal of VHB German Academic Association for Business Research (VHB) Volume 4 | Issue 2 | December 2011 | 193-239
195
of the characteristics of the included studies (Table 1 in Section 3.1). Thus, our online AED (i) presents a simple but comprehensive overview of scientific results, (ii) provides a maximum level of transpar-ency, (iii) offers deep insights into the effectiveness of advertising activities at a disaggregated level, thereby allowing for benchmarking, and (iv) enables researchers and managers to conduct analyses tai-lored to their particular needs. Hence, this online AED will facilitate further research and help to transfer the results into management practice. With respect to the second research gap, we aim to quantitatively generalize empirical findings on the determinants of the relationship between advertis-ing and the response to advertising. Thus, we con-duct a meta-analysis to study whether, in what di-rection, and to what extent the potential determi-nants influence advertising effectiveness. Focusing on contemporaneous effects of advertising in the meta-analysis, original short-term elasticities are consolidated with the current-period elasticities derived from long-term elasticities, before they are analyzed jointly as a single category termed ”cur-rent-period elasticities”. While 602 short- and 143 long-term elasticities are coded in the AED based on 62 empirical studies and 60 different data sets, we include 659 current-period and 23 non-convertible long-run advertising elasticities in our meta-analysis. We find an average value of 0.09 for cur-rent-period elasticities. The advantage of this over prior meta-analyses is that our results can be under-stood perfectly, because every single coding decision can be retraced with the help of the coding descrip-tion and the AED. The meta-findings can thus be easily adjusted to particular needs. The remainder of this paper is organized as follows: The next section introduces the potential determi-nants of advertising elasticity. The coding of the AED as well as the derivation of hypotheses for po-tential determinants of advertising elasticity are presented in section 3. Section 4 addresses the esti-mation of the hierarchical meta-analysis model and presents the findings. Implications, limitations, and directions for further research conclude this paper.
2 Potential Determinants of Advertising Elasticity
Our AED and the subsequent meta-analysis aim to include and analyze published and unpublished empirical studies dealing with any sort of advertis-
ing effect across a wide range of industries. The selection of the moderating variables is based on extant theoretical and empirical research on adver-tising efficiency (e.g., Vakratsas and Ambler 1999). In addition, we consider prior findings on determi-nants of the elasticities of advertising (Assmus, Far-ley, and Lehmann 1984; Sethuraman, Tellis, and Briesch 2011) and other marketing mix instruments (e.g., Albers, Mantrala, and Sridhar 2010; Bijmolt, Van Heerde, and Pieters 2005; Kremer, Bijmolt, Leeflang, and Wieringa 2008). Finally, we include further variables derived from the coded studies that may influence advertising effectiveness. Figure 2 depicts nine groups of determinants that are most likely to affect advertising elasticity. In the following, the relationships between the moderating variables and advertising elasticity are briefly outlined for each of the nine groups of poten-tial determinants: (1) Advertising medium: Prior literature identifies substantial differences in adver-tising elasticity magnitudes according to the under-lying advertising medium (e.g., Vakratsas and Am-bler 1999). Thus, the advertising medium (such as TV, print, or direct mail) used to communicate the advertising message is included in the AED. (2) Product determinants: First, theoretical ra-tionale and empirical findings explain why advertis-ing response varies for different product types. For example, entertainment products (such as movies) are hedonic-experience goods for which a quality and value assessment prior to consumption is al-most impossible (Sawhney and Eliashberg 1996). Thus, advertising plays a major role in reducing uncertainty for these products. Second, research has shown that elasticities decrease during the product’s life cycle (Vakratsas and Ambler 1999). Finally, cultural differences combined with different adver-tising strategies (e.g., due to region-specific market regulations) explain why advertising effectiveness differs with respect to the region in which the prod-uct is marketed (e.g., Elberse and Eliashberg 2003; Lambin 1976). (3) Data determinants: Following earlier meta-analyses (e.g., Kremer, Bijmolt, Leeflang, and Wieringa 2008), we include a wide range of data determinants to control for data-driven effects such as the measurement of key vari-ables (i.e., dependent and advertising variables) or data aggregation levels and time frames. (4) Carryo-ver effects: It is not unreasonable to assume that models that account for carryover effects lead to

BuR - Business Research Official Open Access Journal of VHB German Academic Association for Business Research (VHB) Volume 4 | Issue 2 | December 2011 | 193-239
196
Figure 2: Potential Determinants of Advertising Elasticity Magnitude
lower elasticity magnitudes compared to those that do not account for such dynamics because in the latter case, carryover effects might spuriously be attributed to current advertising (Albers, Mantrala, and Sridhar 2010; Farley and Lehmann 2001). Hence, we investigate the effect of the omission of (i) the lagged dependent variable and (ii) lagged or stock advertising variables. (5) Marketing determi-nants: This group mainly includes the typical mar-keting mix elements, such as price, quality, and promotion. Because advertising campaigns often employ several media at the same time (so-called multi-channel marketing), we code which further advertising media (in addition to the one for which the elasticity is noted) are analyzed in the empirical model of a study. The purpose is to be able to ac-count for the fact that further advertising media might be partially responsible for sales response. (6) Market-related determinants: In addition to mar-keting-related effects, we include a set of market-related determinants that are well established in the marketing literature to influence advertising re-
sponse. For example, a time variable is often includ-ed in models to account for trends in the data, and competition variables are used to account for the different strengths of market participants. (7) Inter-action effects: Advertising elasticities are affected not only by marketing and the aforementioned market-related determinants but also potentially by interaction effects (e.g., Deighton, Henderson, and Neslin 1994). Therefore, we include these effects in our framework. (8) Estimation determinants: In order to capture effects on advertising elasticities that can be attributed to the wide field of estimation, we include the functional form and the estimation method and account for endogeneity and heteroge-neity in the AED. (9) Publication determinants: Finally, prior meta-analyses (e.g., Albers, Mantrala, and Sridhar 2010) reported publication-related biases. Hence, the publication type (e.g., published versus unpublished) and whether the paper has a specific focus on advertising effectiveness are listed in the AED. Furthermore, we control for potential biases that could arise from publication in market-

BuR - Business Research Official Open Access Journal of VHB German Academic Association for Business Research (VHB) Volume 4 | Issue 2 | December 2011 | 193-239
197
ing-related versus non-marketing-related outlets or high- versus low-ranked journals. In summary, the conceptual framework and the AED do not include two variables employed by Se-thuraman, Tellis, and Briesch (2011). These are recession and product-type services which are ex-cluded due to lack of information, an excessively high requirement of coding judgment, or our slight-ly different product sub-groupings. Variables that are additionally (or at a more disaggregated level) included in this study are: product-type entertain-ment media, region- (mostly continent-) specific information, internal or external data source, refer-ence frame, number of periods, spatial dimension, personal selling, additional advertising media used, seasonality, income, production costs, industry sales, competitive effects, number of further varia-bles (including a brief description), and three publi-cation details, namely the marketing orientation of the publication outlet, the publication outlet’s rank-ing, and a study’s focus on an advertising-effective-ness topic. The complete range of variables coded in the AED serves as the basis for the subsequent me-ta-analysis, which as a result, uses some different explanatory variables to prior meta-studies (differ-ences will be outlined in section 4.4). The next sec-tion describes the search procedure for the included empirical studies and the coding of variables.
3 Advertising Elasticity Database (AED)
3.1 Identification of Studies The research base of the AED is generated by a mul-tiple literature search approach to ensure that all published and unpublished studies that either re-port advertising elasticities or, in case elasticities are unavailable, provide sufficient information to calcu-late them, are included. Our starting point was the list of studies included in the two prior meta-analyses on advertising elastici-ties (Assmus, Farley and Lehmann 1984; Sethu-raman, Tellis, and Briesch 2011). Next, we systemat-ically searched for studies using major computer-ized databases for bibliographic data (e.g., ABI/Inform, Business Source Premier by EBSCO, Science Direct) and enriched the findings by confer-ence proceedings and relevant working papers pub-lished online (e.g., SSRN). Third, we conducted a
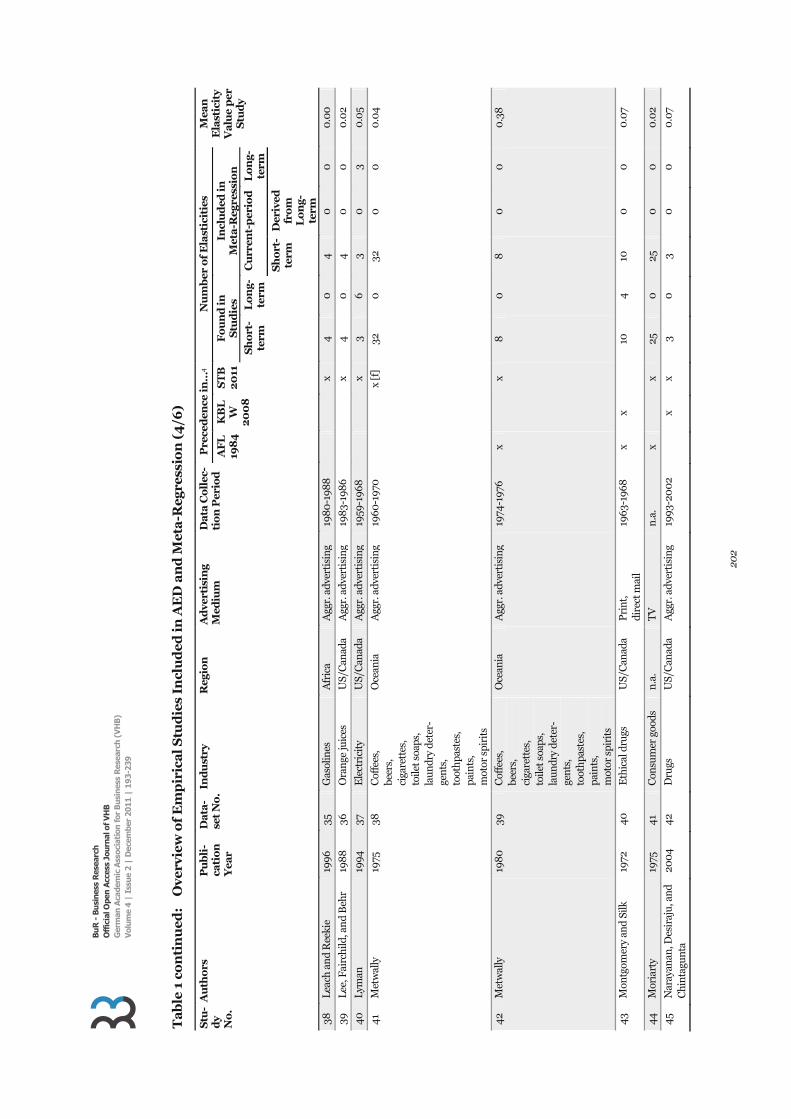
manual journal search of the leading international journals in the field: International Journal of Re-search in Marketing, Journal of Marketing, Jour-nal of Consumer Research, Journal of Marketing Research, Management Science, Marketing Let-ters, Marketing Science, Journal of Business, and BuR – Business Research. Finally, we conducted a cross-reference search based on the papers found to identify further relevant studies (including pub-lished books). Each study then had to meet a series of four criteria to be included in the AED: (i) We include only stud-ies that analyze brand- or product-level advertising effects. Thus, studies dealing with industry-level effects are excluded. (ii) We include only studies that focus on direct-to-consumer advertising. Thus, papers dealing with business-to-business aspects are excluded. (iii) We only include studies that have derived results based on empirical real-life sales or choice data. Thus, results derived on the basis of experiments are excluded. (iv) We only include studies that report (or allow us to derive) elasticities in the form of a percentage change in the response variable due to a one-percent change in the advertis-ing variable (abbreviated in the following as %/% elasticities). Thus, in contrast to Sethuraman, Tellis, and Briesch (2011), we exclude studies using other types of elasticities (e.g., semi-elasticities, Goeree 2008). Table 1 provides an overview of the studies that are included in the AED and the subsequent meta-regression. It contains 62 studies that were pub-lished between 1962 and 2010 and whose 60 da-tasets cover the time span from 1869 to 2005 across a wide range of industries, product types, advertis-ing media, continents, and modeling approaches. The studies were published as articles in interna-tionally recognized journals or conference proceed-ings, as books, or are not yet published. Thus, we reduce potential influences due to publication bias (Cooper 1989). Compared to the meta-analysis of Sethuraman, Tellis and Briesch (2011), we exclude two studies (Chintagunta, Kadiyali, and Vilcassim 2006; Goeree 2008) because %/% elasticities could not be calcu-lated for these studies due to a lack of information. We include an additional book by Frank and Massy (1967) and papers from Ainslie, Drèze, and Zufry-den (2005); Arora (1979); Elberse and Eliashberg (2003); Erdem, Keane, and Sun (2008); Montgom-

BuR - Business Research Official Open Access Journal of VHB German Academic Association for Business Research (VHB) Volume 4 | Issue 2 | December 2011 | 193-239
198
ery and Silk (1972); Prag and Casavant (1994); and Telser (1962).
3.2 Coding of Studies The content of other authors’ published and un-published work is the basis for every meta-analysis. To obtain this data, it is necessary to analyze and interpret the information given in these empirical studies. Because this process involves a certain amount of subjective judgment, studies are coded and validated by a multiple coding approach to re-duce biases that may arise from coders’ subjective judgment (Albers, Mantrala, and Sridhar 2010; Kremer, Bijmolt, Leeflang, and Wieringa 2008). In order to provide as much transparency as possible, we followed two main steps while coding the data: First, the data were coded independently by two coders. Open questions, inconsistencies, and devia-tions from the number of elasticities coded by Se-thuraman, Tellis, and Briesch (2011) were discussed with an experienced marketing scholar to whom we are deeply grateful, especially because he is not an author of this paper. When open questions re-mained, we contacted the authors of the respective empirical paper for clarification or provision of ad-ditional information. This procedure generally re-sulted in one of the three following outcomes: (i) the procedure worked well and our questions were an-swered; (ii) authors pointed out that they do not know how elasticities (could) have been derived and reported for their article in prior meta-analyses; or (iii) the authors did not respond. In these cases, we coded the respective articles to the best of our abil-ity. Because we received replies from several au-thors, whom we thank for their kind support, we are confident in our results. Second, every coding deci-sion is documented in the AED by a direct citation and/or explanation of our coding decision to pro-vide a maximum level of transparency. Subsequently, we first describe the coding of the advertising elasticity (which serves as the dependent variable in our subsequent meta-regression, AED columns N-AC) followed by the coding description of the independent variables, including their ex-pected effects on advertising elasticity (AED col-umns AD-HY). Columns A-M of the AED contain general information on the article such as the publi-cation details and a dataset indicator. A separate coding handbook that exclusively contains the pure coding rules is provided in Web Appendix 2.
3.2.1 Coding of the dependent variable “advertis-ing elasticity” (AED columns N-AC)
The coding of the advertising elasticity serves two purposes: (1) setting up a comprehensive, open-access database of advertising elasticities that can be used for any scientific or managerial aim and (2) enabling a meta-analysis focusing on current-period advertising elasticities. With respect to purpose (1), we code all short- and long-term advertising elasticities in the AED that we were able to locate in empirical studies. Short-term elasticities reflect the contemporaneous effect of advertising on response, whereas long-term elas-ticities additionally include advertising effects oc-curring over multiple time periods, thereby captur-ing dynamic effects on the response variable (e.g., by the use of an advertising stock variable, e.g., Lambin 1969: 90). This categorization is independ-ent of the temporal aggregation level (Albers, Man-trala, and Sridhar 2010). In the AED, columns P-Q indicate for each specific elasticity value, whether it was originally found as a short-term or long-term elasticity in the empirical study. The numbers of short- and long-term elastici-ties found in each study are given in columns R-S (and in Table 1). The purpose of (2) the subsequent meta-analysis is to estimate the effects of the potential determinants (Figure 2) on advertising elasticity magnitude. In contrast to Sethuraman, Tellis, and Briesch (2011), who investigate short- and long-term elasticities in parallel, we convert long-term to current-period elasticities whenever possible to investigate the contemporaneous effect of current-period advertis-ing on current-period response (Albers, Mantrala, and Sridhar 2010). We focus on current-period elasticities for the following three reasons: (i) the marketing literature has traditionally devoted more attention to the current than to the long-term im-pact of marketing strategies (Dekimpe and Hanssens 1995); (ii) most of the elasticities provided in the empirical studies are short-term (602 versus 143, Table 1); and (iii) in most cases, long-term elas-ticities can be converted into current-period elastici-ties, so studies reporting only long-term elasticities are retained in the analysis. To sum up the meta-analysis, we analyze 682 elasticities: 659 current-period elasticities consisting of 601 elasticities found as short-term ones in empirical studies which by definition describe the contemporaneous effect of

BuR
- B
usin
ess
Res
earc
h O
ffic
ial O
pen
Acc
ess
Jour
nal o
f VH
B
Ger
man
Aca
dem
ic A
ssoc
iati
on fo
r B
usin
ess
Res
earc
h (V
HB
) V
olum
e 4
| Is
sue
2 |
Dec
embe
r 20
11 |
193
-239
199
Ta
ble
1:
O
verv
iew
of
Em
pir
ica
l S
tud
ies
Incl
ud
ed i
n A
ED
an
d M
eta
-Reg
ress
ion
(1
/6)
Stu
-d
y N
o.
Au
tho
rs
Pu
bli
-ca
tio
n
Yea
r
Da
ta-
set
No
. In
du
stry
R
egio
nA
dve
rtis
ing
Med
ium
D
ata
Co
llec
-ti
on
Per
iod
P
rece
den
ce in
…4
Nu
mb
er o
f E
last
icit
ies
Mea
n
Ela
stic
ity
Val
ue
per
S
tud
y
AF
L
198
4
KB
LW
2
00
8
ST
B
20
11
Fo
un
d i
n
Stu
die
s In
clu
ded
in
Met
a-R
egre
ssio
n
Sh
ort
-te
rm
Lo
ng-
term
C
urr
ent-
per
iod
L
on
g-te
rm
Sh
ort
-te
rm
Der
ived
fr
om
L
on
g-te
rm
1 A
insl
ie, D
rèze
, an
d Z
u-fr
yden
20
05
1 M
ovie
s U
S/C
anad
a A
ggr.
adv
erti
sing
19
95-1
998
1
1 1
0
1 0
.31
2 A
riba
rg a
nd
Aro
ra
200
8
2 Se
vera
l in
dust
ries
n.a
.D
irec
t mai
l 20
01-
200
4 x
0
10
00
10
n
o ob
s.5
3 A
rora
19
79
13
Eth
ical
dru
gs
US/
Can
ada
Pri
nt,
dire
ct m
ail
1959
-196
1 x
x2
0
2 0
0
0.0
2
4 B
aidy
a an
d B
asu
20
08
3
Hai
r ca
reA
sia
Agg
r. a
dver
tisi
ng
200
0-2
00
5 x[
a]6
10
1
0
00
.38
5 B
alac
han
der
and
Gho
se
200
3 4
Yog
hurt
s,
dete
rgen
ts
US/
Can
ada
TV
198
7-19
88
x
0
120
12
00
.06
6 B
emm
aor
19
84
5 Fr
eque
ntl
y pu
r-ch
ased
goo
ds
n.a
.A
ggr.
adv
erti
sing
n
.a.
x 12
0
12
0
00
.07
7 B
ird
20
02
6 C
igar
ette
s A
sia
Agg
r. a
dver
tisi
ng
1992
-199
5 x
7 7
7 0
0
0.0
1
8
Bri
dges
, Bri
esch
, an
d Sh
u
200
8
7 C
erea
ls
US/
Can
ada
TV
200
2-20
04
x [b
] 18
0
18
0
00
.15
9 B
rodi
e an
d de
Klu
yver
19
84
8
Bis
cuit
s O
cean
iaT
V19
75-1
980
x
18
0
180
0
0.0
1
10
Cap
ps, S
eo, a
nd
Nic
hols
19
97
9 Sp
aghe
tti s
auce
s U
S/C
anad
a T
V19
91-1
992
x 0
3
00
3
no
obs.
11
Car
pen
ter,
Coo
per,
H
anss
ens,
an
d M
idgl
ey
198
8
10
Hou
seho
ld p
rod-
ucts
O
cean
iaT
V19
81-
198
2 x
10
0
100
0
0.0
9
12
Cla
rke
19
73
11
Low
-pri
ced
freq
. pu
rcha
sed
con
-su
mer
goo
ds
n.a
.A
ggr.
adv
erti
sing
n
.a.
x x
18
0
180
0
0.0
8
13
Cow
ling
and
Cub
bin
19
71
12
Car
s E
urop
e A
ggr.
adv
erti
sing
19
57-1
968
x
x 5
25
0
00
.66
14
Cre
spi a
nd
Mar
ette
20
02
14
Pru
nes
US/
Can
ada
TV
1992
-199
6 x
2 0
2
0
00
.01
15
Dan
aher
, Bon
frer
, an
d D
har
200
8
15
Liq
uid
laun
dry
dete
rgen
ts,
rais
in b
ran
s
US/
Can
ada
TV
1991
x
0
150
15
00
.09

BuR
- B
usin
ess
Res
earc
h O
ffic
ial O
pen
Acc
ess
Jour
nal o
f VH
B
Ger
man
Aca
dem
ic A
ssoc
iati
on fo
r B
usin
ess
Res
earc
h (V
HB
) V
olum
e 4
| Is
sue
2 |
Dec
embe
r 20
11 |
193
-239
200
Ta
ble
1 c
on
tin
ued
:
Ove
rvie
w o
f E
mp
iric
al
Stu
die
s In
clu
ded
in
AE
D a
nd
Met
a-R
egre
ssio
n (
2/6
)
Stu
-d
y N
o.
Au
tho
rs
Pu
bli
-ca
tio
n
Yea
r
Da
ta-
set
No
. In
du
stry
R
egio
nA
dve
rtis
ing
Med
ium
D
ata
Co
llec
-ti
on
Per
iod
P
rece
den
ce in
…4
Nu
mb
er o
f E
last
icit
ies
Mea
n
Ela
stic
ity
Val
ue
per
S
tud
y
AF
L
198
4
KB
LW
2
00
8
ST
B
20
11
Fo
un
d i
n
Stu
die
s In
clu
ded
in
Met
a-R
egre
ssio
n
Sh
ort
-te
rm
Lo
ng-
term
C
urr
ent-
per
iod
L
on
g-te
rm
Sh
ort
-te
rm
Der
ived
fr
om
L
on
g-te
rm
16
Dei
ghto
n, H
ende
rson
, an
d N
eslin
19
94
16
Foo
d, li
quid
laun
-dr
y de
terg
ents
, po
wde
r de
terg
ents
US/
Can
ada
TV
198
4-19
85
x 12
0
12
0
0-0
.05
17
Dog
anog
lu a
nd
Kla
pper
20
06
17
Liq
uid
dete
rgen
ts
Eur
ope
TV
1998
-20
00
x
0
30
3 0
0.0
7
18
Dub
é an
d M
anch
anda
20
05
18
Fro
zen
en
trée
s U
S/C
anad
a T
V19
91-1
994
x 0
9
09
00
.00
19
Dub
é, H
itsc
h, a
nd
Man
chan
da
200
5 18
F
roze
n e
ntr
ées
US/
Can
ada
TV
1991
-199
4 x
0
5 0
5 0
0.0
3
20
Elb
erse
an
d E
liash
berg
20
03
19
Mov
ies
US
and
Can
ada,
E
urop
e
Agg
r. a
dver
tisi
ng
1999
4
0
4 0
0
0.2
4
21
Erd
em a
nd
Sun
20
02
20
Too
thpa
stes
, to
othb
rush
es
US/
Can
ada
TV
1991
-199
4 x
0
40
4 0
0.8
7
22
Erd
em, K
ean
e, a
nd
Sun
20
08
21
K
etch
up
US/
Can
ada
TV
198
6-19
88
0
1
00
1
no
obs.
23
Eri
ckso
n
1977
54
H
ouse
hold
cle
ans-
ers
US/
Can
ada
Agg
r. a
dver
tisi
ng
1869
-191
5 x
x 3
0
3 0
0
0.0
7
24
Fra
nk
and
Mas
sy
1967
22
F
ood
US/
Can
ada
Pri
nt
1963
-196
4 x
3938
39
0
0
0.0
1
25
Gho
sh, N
eslin
, an
d Sh
oem
aker
19
84
43
Cer
eals
U
S/C
anad
a T
V19
73-1
975
x 8
0
8
0
0
0.0
3
26
Hol
ak a
nd
Red
dy
198
6 23
C
igar
ette
s U
S/C
anad
a A
ggr.
adv
erti
sing
19
50-1
969,
19
70-1
979
x 20
0
20
0
00
.10
27
Hou
ston
and
Wei
ss
1974
24
F
ood
US/
Can
ada
Agg
r. a
dver
tisi
ng
n.a
.x
x 5
0
5 0
0
0.1
9
28
Hsu
an
d L
iu
200
4 26
F
luid
milk
pro
d-uc
ts
Asi
a T
V, p
rin
t19
96-1
999
x 5
0
5 0
0
0.0
3

BuR
- B
usin
ess
Res
earc
h O
ffic
ial O
pen
Acc
ess
Jour
nal o
f VH
B
Ger
man
Aca
dem
ic A
ssoc
iati
on fo
r B
usin
ess
Res
earc
h (V
HB
) V
olum
e 4
| Is
sue
2 |
Dec
embe
r 20
11 |
193
-239
201
Ta
ble
1 c
on
tin
ued
:
Ove
rvie
w o
f E
mp
iric
al
Stu
die
s In
clu
ded
in
AE
D a
nd
Met
a-R
egre
ssio
n (
3/6
)
Stu
-d
y N
o.
Au
tho
rs
Pu
bli
-ca
tio
n
Yea
r
Da
ta-
set
No
. In
du
stry
R
egio
nA
dve
rtis
ing
Med
ium
D
ata
Co
llec
-ti
on
Per
iod
P
rece
den
ce in
…4
Nu
mb
er o
f E
last
icit
ies
Mea
n
Ela
stic
ity
Val
ue
per
S
tud
y
AF
L
198
4
KB
LW
2
00
8
ST
B
20
11
Fo
un
d i
n
Stu
die
s In
clu
ded
in
Met
a-R
egre
ssio
n
Sh
ort
-te
rm
Lo
ng-
term
C
urr
ent-
per
iod
L
on
g-te
rm
Sh
ort
-te
rm
Der
ived
fr
om
L
on
g-te
rm
29
Iizu
ka a
nd
Jin
20
07
27
Pre
scri
ptio
n d
rugs
U
S/C
anad
a P
rint
, ag
gr. a
dver
tisi
ng
1997
-20
01
x [c
]x
[d]
6 0
6
0
00
.06
30
Jedi
di, M
ela,
and
Gup
ta
1999
28
N
on fo
od c
onsu
m-
er p
acka
ged
good
s U
S/C
anad
a A
ggr.
adv
erti
sin
g 19
84-
1992
x
0
40
0
4 no
obs
.
31
Jeul
and
19
80
29
Sh
ampo
os
Eur
ope
Agg
r. a
dver
tisi
ng
1975
-197
7 x
[e]
10
0
100
0
0.1
0
32
Joha
nsso
n 19
73
30
Hai
r sp
rays
n.a.
Agg
r. a
dver
tisi
ng
1968
-196
9 x
x 2
0
2 0
0
0.0
9
33
Kue
hn, M
cGui
re, a
nd
Wei
ss
1966
31
G
roce
ries
U
S/C
anad
a D
irec
t mai
l n
.a.
x 1
0
1 0
0
0.1
2
34
Lam
bin
19
69
32
Foo
d E
urop
e A
ggr.
adv
erti
sing
n
.a.
x x
3 3
3 0
0
0.2
2
35
Lam
bin
19
70
33
Ele
ctro
nic
s E
urop
e A
ggr.
adv
erti
sing
19
59-1
966
x x
3 0
3
0
00
.28
36
Lam
bin
19
72
25
Gas
olin
esU
S/C
anad
a P
rint
19
50-1
970
x
x 2
0
2 0
0
0.0
3
37
Lam
bin
19
76
34
Soft
dri
nks
, el
ectr
ic s
have
rs,
gaso
lines
, yo
ghur
ts,
hair
spr
ays,
co
nfe
ctio
nar
ies,
te
levi
sion
s,
ciga
rett
es,
ban
ks,
inse
ctic
ides
, de
odor
ants
, de
terg
ents
, au
to tr
ains
, su
n ta
n lo
tion
s,
coff
ees,
app
les
Eur
ope
Pri
nt,
TV
, ag
gr. a
dver
tisi
ng
Div
erse
dat
a co
llect
ion
pe
riod
s,
ran
gin
g fr
om 1
949-
1972
x 14
46
144
6 0
0.0
8
BuR
- B
usin
ess
Res
earc
h O
ffic
ial O
pen
Acc
ess
Jour
nal o
f VH
B
Ger
man
Aca
dem
ic A
ssoc
iati
on fo
r B
usin
ess
Res
earc
h (V
HB
) V
olum
e 4
| Is
sue
2 |
Dec
embe
r 20
11 |
193
-239
202
Ta
ble
1 c
on
tin
ued
:
Ove
rvie
w o
f E
mp
iric
al
Stu
die
s In
clu
ded
in
AE
D a
nd
Met
a-R
egre
ssio
n (
4/6
)
Stu
-d
y N
o.
Au
tho
rs
Pu
bli
-ca
tio
n
Yea
r
Da
ta-
set
No
. In
du
stry
R
egio
nA
dve
rtis
ing
Med
ium
D
ata
Co
llec
-ti
on
Per
iod
P
rece
den
ce in
…4
Nu
mb
er o
f E
last
icit
ies
Mea
n
Ela
stic
ity
Val
ue
per
S
tud
y
AF
L
198
4
KB
LW
2
00
8
ST
B
20
11
Fo
un
d i
n
Stu
die
s In
clu
ded
in
Met
a-R
egre
ssio
n
Sh
ort
-te
rm
Lo
ng-
term
C
urr
ent-
per
iod
L
on
g-te
rm
Sh
ort
-te
rm
Der
ived
fr
om
L
on
g-te
rm
38
Lea
ch a
nd
Ree
kie
19
96
35
Gas
olin
esA
fric
a A
ggr.
adv
erti
sing
19
80
-198
8
x 4
0
4 0
0
0.0
0
39
Lee
, Fai
rchi
ld, a
nd
Beh
r 19
88
36
O
rang
e ju
ices
U
S/C
anad
a A
ggr.
adv
erti
sing
19
83-
198
6 x
4 0
4
0
00
.02
40
Lym
an
1994
37
E
lect
rici
tyU
S/C
anad
a A
ggr.
adv
erti
sing
19
59-1
968
x
3 6
3 0
3
0.0
5
41
Met
wal
ly
1975
38
C
offe
es,
beer
s,
ciga
rett
es,
toile
t soa
ps,
laun
dry
dete
r-ge
nts
, to
oth
past
es,
pain
ts,
mot
or s
piri
ts
Oce
ania
Agg
r. a
dver
tisi
ng
1960
-197
0
x [f
] 32
0
32
0
00
.04
42
Met
wal
ly
198
0
39
Cof
fees
, be
ers,
ci
gare
ttes
, to
ilet s
oaps
, la
undr
y de
ter-
gen
ts,
toot
hpa
stes
, pa
ints
, m
otor
spi
rits
Oce
ania
Agg
r. a
dver
tisi
ng
1974
-197
6 x
x 8
0
8
0
0
0.3
8
43
Mon
tgom
ery
and
Silk
19
72
40
Eth
ical
dru
gs
US/
Can
ada
Pri
nt,
dire
ct m
ail
1963
-196
8
x x
10
410
0
00
.07
44
Mor
iart
y
1975
41
C
onsu
mer
goo
ds
n.a
.T
Vn
.a.
x x
250
25
0
0
0.0
2
45
Nar
ayan
an, D
esir
aju,
an
d C
hin
tagu
nta
20
04
42
Dru
gsU
S/C
anad
a A
ggr.
adv
erti
sing
19
93-2
00
2 x
x 3
0
3 0
0
0.0
7

BuR
- B
usin
ess
Res
earc
h O
ffic
ial O
pen
Acc
ess
Jour
nal o
f VH
B
Ger
man
Aca
dem
ic A
ssoc
iati
on fo
r B
usin
ess
Res
earc
h (V
HB
) V
olum
e 4
| Is
sue
2 |
Dec
embe
r 20
11 |
193
-239
203
Ta
ble
1 c
on
tin
ued
:
Ove
rvie
w o
f E
mp
iric
al
Stu
die
s In
clu
ded
in
AE
D a
nd
Met
a-R
egre
ssio
n (
5/6
)
Stu
-d
y N
o.
Au
tho
rs
Pu
bli
-ca
tio
n
Yea
r
Da
ta-
set
No
. In
du
stry
R
egio
nA
dve
rtis
ing
Med
ium
D
ata
Co
llec
-ti
on
Per
iod
P
rece
den
ce in
…4
Nu
mb
er o
fE
last
icit
ies
Mea
n
Ela
stic
ity
Val
ue
per
S
tud
y
AF
L
198
4
KB
LW
2
00
8
ST
B
20
11
Fo
un
d i
n
Stu
die
s In
clu
ded
in
Met
a-R
egre
ssio
n
Sh
ort
-te
rm
Lo
ng-
term
C
urr
ent-
per
iod
L
on
g-te
rm
Sh
ort
-te
rm
Der
ived
fr
om
L
on
g-te
rm
46
Pal
da
1964
45
D
rugs
US/
Can
ada
Agg
r. a
dver
tisi
ng
Div
erse
dat
a co
llect
ion
pe
riod
s,
ran
gin
g fr
om 1
907-
1960
x x
115
11
0
00
.42
47
Par
ker
and
Gat
igno
n
1996
46
H
air
styl
ing
mou
sses
n
.a.
Agg
r. a
dver
tisi
ng
198
4-19
87
x 3
0
3 0
0
0.3
3
48
Par
sons
19
75
54
Hou
seho
ld c
lean
s-er
s U
S/C
anad
a A
ggr.
adv
erti
sing
18
69-1
915
x x
6 0
6
0
00
.30
49
Par
sons
19
76
55
Sham
poos
U
S/C
anad
a A
ggr.
adv
erti
sing
19
19-1
929
x x
4 0
4
0
00
.02
50
Pic
con
i an
d O
lson
19
78
47
Bev
erag
esn
.a.
TV
1964
-197
2 x
6 0
6
0
00
.02
51
Pra
g an
d C
asav
ant
1994
48
M
ovie
s U
S/C
anad
a A
ggr.
adv
erti
sing
19
90
0
1 0
0
1 n
o ob
s.
52
Ren
nho
ff a
nd
Wilb
ur
2010
49
M
ovie
s U
S/C
anad
a T
V20
03
x [g
]5
0
5 0
0
0.3
8
53
Roj
as a
nd
Pet
erso
n
200
8
50
Bee
rs
US/
Can
ada
Agg
r. a
dver
tisi
ng
198
8-1
992
x 17
0
17
0
00
.03
54
Sext
on
1970
51
G
roce
ries
U
S/C
anad
a T
V,
prin
t n
.a.
x 12
0
11
0
0
0.0
1
55
Shan
kar
and
Bay
us
200
3 52
H
ome
vide
o ga
mes
U
S/C
anad
a A
ggr.
adv
erti
sing
19
93-1
995
x 2
0
2 0
0
0.1
7
56
Shum
20
04
53
Cer
eals
U
S/C
anad
a T
V19
91-1
992
x 48
0
48
0
00
.09

BuR
- B
usin
ess
Res
earc
h O
ffic
ial O
pen
Acc
ess
Jour
nal o
f VH
B
Ger
man
Aca
dem
ic A
ssoc
iati
on fo
r B
usin
ess
Res
earc
h (V
HB
) V
olum
e 4
| Is
sue
2 |
Dec
embe
r 20
11 |
193
-239
204
Ta
ble
1 c
on
tin
ued
:
Ove
rvie
w o
f E
mp
iric
al
Stu
die
s In
clu
ded
in
AE
D a
nd
Met
a-R
egre
ssio
n (
6/6
)
Stu
-d
y N
o.
Au
tho
rs
Pu
bli
-ca
tio
n
Yea
r
Da
ta-
set
No
. In
du
stry
R
egio
nA
dve
rtis
ing
Med
ium
D
ata
Co
llec
-ti
on
Per
iod
P
rece
den
ce in
…4
Nu
mb
er o
f E
last
icit
ies
Mea
n
Ela
stic
ity
Val
ue
per
S
tud
y
AF
L
198
4
KB
LW
2
00
8
ST
B
20
11
Fo
un
d i
n
Stu
die
s In
clu
ded
inM
eta
-Reg
ress
ion
Sh
ort
-te
rm
Lo
ng-
term
C
urr
ent-
per
iod
L
on
g-te
rm
Sh
ort
-te
rm
Der
ived
fr
om
L
on
g-te
rm
57
Tel
ser
1962
44
C
igar
ette
s U
S/C
anad
a A
ggr.
adv
erti
sing
D
iver
se d
ata
colle
ctio
n
peri
ods,
ra
ngi
ng
from
191
3-19
39
x 5
05
0
0
0.3
0
58
Vilc
assi
m, K
adiy
ali,
and
Chi
nta
gun
ta
1999
56
P
erso
nal c
are
prod
ucts
U
S/C
anad
a T
V19
91-1
994
x 3
03
0
0
0.0
3
59
Wei
ss
1968
57
L
ow-c
ost f
re-
quen
tly
purc
hase
d co
nsu
mer
goo
ds
US/
Can
ada
Agg
r. a
dver
tisi
ng
1960
-196
3 x
x 2
02
0
0
0.2
9
60
Wild
t 19
74
58
Foo
d n
.a.
TV
, ag
gr. a
dver
tisi
ng
n.a
. x
x
3 0
3 0
0
0
.03
61
Wit
tin
k
1977
59
Fr
eque
ntl
y pu
r-ch
ased
bra
nde
d go
ods
n.a
.T
Vn
.a.
x x
250
250
0
0
.09
62
Wos
insk
a
200
3 60
D
rugs
US/
Can
ada
Agg
r. a
dver
tisi
ng
1996
-199
9 x
[h]
x [i
] 0
4
0
4 0
0
.01
S
um
60
2
143
6
01
58
2
3
T
ota
l Su
m
745
6
82
4 A
FL
= A
ssm
us, F
arle
y, a
nd
Leh
man
n 1
984,
KB
LW
= K
rem
er, B
ijmol
t, L
eefla
ng,
an
d W
ieri
nga
20
08
, ST
B =
Set
hura
man
, Tel
lis, a
nd
Bri
esch
20
11
5 n
o ob
s. =
no
obse
rvat
ion
s av
aila
ble
6 [a
] [b
] [c
] [d
]
= S
TB
list
ed 2
00
7 as
yea
r of
pub
licat
ion
. The
cor
rect
yea
r is
20
08
.=
ST
B u
sed
the
vers
ion
of 2
00
9.
= K
BL
W u
sed
the
vers
ion
of 2
00
5.
= S
TB
use
d th
e ve
rsio
n of
20
05.
[e]
[f]
[g]
[h]
[i]
= S
TB
use
d th
e ve
rsio
n of
197
9.
= S
TB
list
ed 1
974
as y
ear
of p
ublic
atio
n. T
he c
orre
ct y
ear
is 1
975.
=
ST
B u
sed
the
vers
ion
of 2
00
8.
= K
BL
W u
sed
the
vers
ion
of 2
00
2.
= S
TB
use
d th
e ve
rsio
n o
f 20
02.

BuR - Business Research Official Open Access Journal of VHB German Academic Association for Business Research (VHB) Volume 4 | Issue 2 | December 2011 | 193-239
205
advertising on response plus 58 current-period elasticities derived from long-term elasticities, and 23 non-convertible long-term elasticities while a dummy accounts for their long-term nature. Elastic-ity values are obtained from empirical papers in two ways. In most cases, they are taken as explicitly reported by the authors, i.e., the elasticity value or, for double-log models, the advertising coefficient, which equals the elasticity. If no elasticities are stat-ed, we compute elasticities based on parameter estimates and data given in the paper (Web Appen-dix 3). These calculations are generally based on the well-known literature by Hanssens, Parsons, and Schultz (2001: 95-98, 100-101, 121-125, 135-137) and Hruschka (2002: 518). Share model elasticities are derived as outlined in Leeflang, Wittink, Wedel, and Naert (2000: 171-178) and Cooper and Nakani-shi (2000: 26-31, 34). In addition, interaction ef-fects are considered in the computation of elastici-ties whenever possible. Table 2 provides an over-view of the calculation of elasticities for the main model types. When a lack of data impedes deriving elasticities by means of functions, elasticities are derived from simulation results (e.g., Aribarg and Arora 2008; Erdem and Sun 2002). In a second step, long-term elasticities are converted into current-period elasticities whenever the elastic-ity was derived on the basis of an advertising stock variable. For these cases, the AED contains the long-term and the current-period elasticities in separate rows of the AED sheet (e.g., Wosinska 2003). Hanssens, Parsons, and Schultz (2001: 140-152) described several methods for modeling advertising carryover, for which the conversion of long-term into current-period elasticities has to be carried out accordingly. The most common advertising stock specification (Eq. 1) was introduced by Nerlove and Arrow (1962) and is used by, e.g., Dubé and Manchanda (2005) and Lambin (1976). The adver-tising stock ASt in period t is calculated as (1) (ASt )N= At + > (ASt-1)N where At is current advertising, N indicates the ap-proach by Nerlove and Arrow, and > is the carryover coefficient, sometimes also called the retention rate, which typically falls within the interval from zero to one. Because the stock value of a certain advertising level can be calculated as ASN=A/(1->), current-period elasticities (\N,cp) are obtained from long-term elasticities (\N,lt) as given in Equa-
tion 2 (Albers, Mantrala, and Sridhar 2010: Web Appendix, note on p.11; Assmus, Farley and Leh-mann 1984: 67; Picconi and Olson 1978: 90). (2) \N,cp = \N,lt (1->) While the approach by Nerlove and Arrow is by far the most frequently used stock specification in our research base, the alternative exponential smooth-ing approach by Guadagni and Little (1983, also see Broadbent 1979) given in Equation 3 is utilized in a few cases (Balachander and Ghose 2003; Danaher, Bonfrer, and Dhar 2008; Erdem and Sun 2002). (3) (ASt)G = (1-^) At + ^ (ASt-1)G
Extending the notation above, G indicates the ap-proach by Guadagni and Little (1983), and ^ is the smoothing coefficient, which is bounded between zero and one. Calculating stock values analogously to the procedure in the Nerlove and Arrow case would be misleading because of the difference in their specification. A better approximation of the steady-state level can be achieved by ASG=A/(1-^(1-^)). Hence, for models employing exponential smoothing, current-period elasticities are obtained from long-term elasticities as given in Equation 4.
(4) \G,cp = \G,lt(1–^(1-^)). Doganoglu and Klapper (2006) used a Cobb-Douglas goodwill production function, which be-haves similarly to the exponential smoothing ap-proach with respect to reaching a steady-state level. In studies for which no current-period elasticities could be derived from the information given, for instance because the estimate of the carryover coef-ficient is not given (Capps, Seo, and Nichols 1997) or the model complexity is too high (e.g., Aribarg and Arora 2008), we include the long-term elastici-ty in the meta-regression. In these cases, a dummy variable accounts for the fact that, on average, high-er values are found for long-term than for current-period elasticities. In case a study reports both cur-rent-period and long-term elasticities based on the same model, both types are contained in the AED for the sake of completeness. However, only the current-period elasticities enter the subsequent meta-analysis due to our focus on current-period elasticities and in order to avoid double-counting. The coding follows three guidelines:

BuR - Business Research Official Open Access Journal of VHB German Academic Association for Business Research (VHB) Volume 4 | Issue 2 | December 2011 | 193-239
206
Table 2: Elasticity Calculations
Functional Form Statistical Model Elasticity
Share (Multinomial Logit Model)
� ��
� �� � ��
��
1
expH
i i h hi ih
Attr x e
�
�� 1
ii J
jj
Attrs
Attr
�� �1h i his x
Double-log � � �� ��
� � ��1
log log logH
i i h hi ih
y x e �h
Semi-log � �� ��
� � ��1
log logH
i i h hi ih
y x e �� 1h iy
Linear � ��
� � ��1
H
i i h hi ih
y x e ��h hi ix y
Source: Cooper and Nakanishi (2000); Gemmil, Costa-Font, and McGuire (2007); Kremer, Bijmolt, Leeflang, and Wieringa (2008)
_ = Constant h = Indicator for explanatory variables (h = 1, …, H)
Attr = Attraction of a brand s = Share
` = Coefficient x = Explanatory variable
e = Error term x = Arithmetic mean of explanatory variable
i = Brand indicator (where i is the focal brand) y = Dependent variable
j = Brand indicator (j = 1, …, J) y = Arithmetic mean of dependent variable
(i) Elasticities are coded at the most disaggregated
level; i.e., when a study reports elasticities at an aggregated, higher hierarchy level but also at a more disaggregated, lower hierarchy level nested within the former level, only the elas-ticities derived at the disaggregated level are included in the AED to avoid double-counting. For example, Lyman (1994) reported disaggre-gated elasticities for the lower regional level (North, South, and Southwest) and for the higher total area level, so we only include the disaggregated regional elasticities in the AED. In contrast, the number of elasticities included in Sethuraman, Tellis, and Briesch (2011) sug-gested that they include both higher- and low-er-level elasticities.
(ii) If the model includes lagged but no current-period advertising, this is assumed to reflect the specifics of the product or the data. For in-
stance, Moriarty (1975: 145) uses lagged adver-tising because sales volume is reported in shipments to rather than sales of retail outlets, i.e., lagged advertising is employed to achieve a fit between the advertising variable and the re-sponse. As a result, we code the elasticity of the most recent advertising variable as the current-period advertising elasticity.
(iii) Elasticity estimates sometimes have high standard errors despite being consistent. If one sets to zero all elasticity estimates whose p-values are <0.05, one would aggregate the wrong means of distributions. Thus, elasticities are coded irrespective of their significance lev-els.
To conclude, 62 studies are retrieved that provide 602 short-term and 143 long-term estimates of advertising elasticity in the AED (Web Appendix 1). Converting long-term to current-period elasticities

BuR - Business Research Official Open Access Journal of VHB German Academic Association for Business Research (VHB) Volume 4 | Issue 2 | December 2011 | 193-239
207
whenever possible yields a total of 659 current-period and 23 long-term elasticities that are includ-ed in the meta-analysis (cf. Web Appendix 1, row 805 et seq.). All elasticity calculations are available in Web Appendix 3.
3.2.2 Coding of the independent variables (AED columns AD-HY)
Literature on advertising effectiveness and the aforementioned meta-analyses yield a variety of potential determinants of advertising elasticity. In this study, nine groups of variables are coded (Fig-ure 2): Advertising media determinants, product determinants, data determinants, carryover effects, marketing determinants, market-related determi-nants, interaction effects, estimation determinants, and publication determinants. Due to multicolline-arity, not all of the variables that belong to each of these groups can enter the subsequent meta-analysis. However, in contrast to previous meta-analyses, which only report the variables included in the respective analysis, we code and make available information on all potential determinants to set up a very comprehensive AED. In the following, each variable is described with respect to its relevance, its coding, and the relevant literature. For variables that are included in the meta-analysis in section 4, the hypothesized effect is also outlined. The pure coding description including the hypotheses for meta-regression variables is additionally provided in Web Appendix 2.
Advertising medium (AED columns AD-AK) Different advertising media allow for different levels of immediate feedback, personalization, and mes-sage complexity (e.g., Dahlén 2005; Rossiter and Percy 1998). Therefore, marketing managers implic-itly assume that different media bring about differ-ent results (Berkowitz, Allaway, and D’Souza 2001), for instance due to different learning rates (McConnell 1970). Thus, the type of advertising medium is likely to influence advertising elasticity (Vakratsas and Ambler 1999). Hence, it is coded for each elasticity whether it predominantly relates to TV, print, or direct mail. Sometimes, aggregated advertising spending is also employed as a variable in empirical models. Common reasons for using aggregate advertising data are the unavailability of disaggregate data, multicollinearity, or difficulties in untangling what proportion of advertising success can be ascribed to which of the various advertising
media (Zhou, Zhou, and Ouyang 2003). When ag-gregated data for more than one type of advertising are investigated or no information about the type of advertising is stated, it is classified as aggregate advertising. Aggregate advertising measurements average the impact of very effective media with that of less effec-tive media (Assmus, Farley, and Lehmann 1984). In contrast, specific media might produce either higher or lower elasticities than those derived by an aggre-gate advertising measurement (Kremer, Bijmolt, Leeflang, and Wieringa 2008). According to Tellis, Chandy, and Thaivanich (2000), TV advertising is more effective compared to advertising exposure in print media because of its longer reach and its abil-ity to deliver emotions. Aggregate advertising is assumed to lie between these effects. We subscribe to this expectation and thus hypothesize:
H1: Advertising elasticities are lower for a) aggregate advertising measurements b) print and direct mail than for TV advertising.
Product determinants (AED columns AM-BK) Product type (AED columns AM-AX): Literature indicates that advertising response varies across product types, e.g., due to different levels of in-volvement (e.g., McConnell 1970; Vakratsas and Ambler 1999). The AED therefore captures the type of product for which the advertising elasticity is reported. Product categories are as follows: drugs, durables, entertainment media (e.g., movies or vid-eo games, but no hardware), food, and other non-food products. The product type is coded as n.a. when no product type is stated. Ambiguous results are reported with respect to the elasticity magnitude per product type. Assmus, Far-ley, and Lehmann (1984) found higher elasticities for food products than for other categories, whereas Sethuraman, Tellis, and Briesch (2011) reported that frequently purchased food and non-food prod-ucts have the lowest advertising elasticities. Assmus, Farley, and Lehmann (1984) suggested that adver-tising effectiveness varies in accordance with the information needs for the particular product. For example, entertainment products such as movies are hedonic experience goods (Sawhney and Eliash-berg 1996), impeding a valid assessment of quality prior to consumption. For such products, advertis-ing is likely to play a major role in reducing uncer-tainty, especially when advertising is concentrated

BuR - Business Research Official Open Access Journal of VHB German Academic Association for Business Research (VHB) Volume 4 | Issue 2 | December 2011 | 193-239
208
on the time of the product’s release to increase word of mouth (Liu 2006), resulting in high advertising elasticities. There is empirical agreement that dura-ble products respond considerably more elastically to changes in advertising than other product types do (Bijmolt, Van Heerde, and Pieters 2005; Sethu-raman and Tellis 1991; Vakratsas, Feinberg, Bass, and Kalyanaram 2004). This fact can be attributed to their long-term character, which makes consum-ers search for more information to decrease the purchase risk. Accordingly, we assume larger elas-ticities for hedonic and experience goods than for durables, which, in turn, respond more elastic than non-food and other product categories. We thus hypothesize:
H2: Advertising elasticities are higher for a) hedonic and experience goods b) durables than for non-food and other products.
Stage in product life cycle (AED columns AY-BA): The influence of the product life cycle is well docu-mented by research demonstrating a decline in advertising effectiveness over time (Parsons 1975; Winer 1979). Hence, whenever a product is clearly declared as an innovation, it is coded as a new product; otherwise, it is by default coded as an es-tablished one. Advertising for new products is generally considered more informative, persuasive, and effective than is advertising for established products (Andrews and Franke 1991; Vakratsas and Ambler 1999), resulting in higher elasticity magnitudes in earlier than in later stages of the product life cycle (Lodish, Abra-ham, Kalmenson, Livelsberger, Lubetkin, Richard-son, and Stevens 1995; Sethuraman, Tellis, and Briesch 2011). This is especially true for high-search, infrequently purchased new goods (e.g., Albers, Mantrala, and Sridhar 2010; Hagerty, Carman, and Russell 1988; Narayanan, Manchanda, and Chinta-gunta 2005). In contrast, in later stages of the prod-uct life cycle, product differentiation has made con-sumers more loyal, which often results in smaller responses to changes in marketing instruments (Bijmolt, Van Heerde, and Pieters 2005; Simon 1979). Thus, we hypothesize:
H3: Advertising elasticities are higher for new products than for established products.
Region (AED columns BB-BK): Since Hofstede’s (1980, updated in 2001) outstanding work on cul-
tural dimensions, it is known that cultures, and therefore many nations, differ. Thus, a region varia-ble is coded to indicate on which continent the data were collected. That is, like Bijmolt, Van Heerde, and Pieters (2005) do, we note whether a study is based on data from Europe, the US or Canada, America (excluding the US and Canada), Asia, Afri-ca, Oceania, or whether the region is not indicated in the study. Findings on marketing elasticities with respect to the national setting are ambiguous. Assmus, Farley, and Lehmann (1984) and Sethuraman, Tellis, and Briesch (2011) found higher advertising elasticities for Europe than for the United States. Similarly, Albers, Mantrala, and Sridhar (2010) detect higher personal selling elasticities in Europe than in the US. In addition to cultural differences, advertising effectiveness might differ across regions because of different advertising strategies (for instance due to market regulations; e.g., Elberse and Eliashberg 2003; Lambin 1976). Such restrictions are less rigid in the US than in many other countries, thus leading to a tendency for overspending in the US (Kremer, Bijmolt, Leeflang, and Wieringa 2008). Due to the flat maximum principle (Tull, Wood, Duhan, Gillpatrick, Robertson, and Helgeson 1986), which states that budget deviation by up to 25% from its optimum value does not significant-ly harm a company’s profit, we, in contrast to Kremer, Bijmolt, Leeflang, and Wieringa (2008), assume that overspending is better than under-spending and therefore expect:
H4: Advertising elasticities are lower for non-US/ Canadian data than for US or Canadian data.
Data determinants (AED columns BL-DD) Data source (AED columns BL-BN): Data to esti-mate advertising elasticities can be gained from firm internal data management systems or external pro-viders such as marketing or data agencies. While internal data allow for analyzing, e.g., long-term customer relationship information, the advantage of external data providers lies in their specific industry knowledge, which results in the ability to collect the appropriate data and to detect future trends. To investigate whether obtaining the analyzed data from internal or external data sources has an effect on advertising elasticity, it is coded in the AED from which type of source the data are obtained. We de-fine data as being internal when it is explicitly stated that the analyzed firm has provided the data or, by

BuR - Business Research Official Open Access Journal of VHB German Academic Association for Business Research (VHB) Volume 4 | Issue 2 | December 2011 | 193-239
209
definition, when only one firm or brand is analyzed in a paper. In contrast, if more than one firm or brand is investigated, or when data are made avail-able by a market research company, the data source is coded as external. Reference frame (AED columns BO-BT): Differ-ences with respect to the data structure may influ-ence elasticity magnitudes (Albers, Mantrala, and Sridhar 2010). We integrate the reference frame in the AED, which indicates whether the data used in the analyzed studies are cross-sectional, longitudi-nal, or both (i.e., panel). Cross-sectional data are collected by observing many subjects at one point in time, thereby capturing level effects. In contrast, longitudinal data are obtained by repeatedly observ-ing the same subject over time, thereby capturing dynamic effects (Assmus, Farley, and Lehmann 1984). Panel data have both a cross-sectional and a longitudinal dimension, i.e., they allow for analyzing multiple subjects across time. If a firm or brand operates in several analyzed regions (e.g., sales are-as or countries), the data are regarded as panel data. If a study employs data on multiple product catego-ries that are analyzed independently, the reference frame is coded separately for each of the categories (e.g., Metwally 1980 analyzes eight product catego-ries with one product each, so eight longitudinal data sets are coded). Advertising elasticities estimated on the basis of pooled (including cross-sectional) data tend to be higher than those based on longitudinal data (e.g., Assmus, Farley, and Lehmann 1984) because longi-tudinal models often cannot distinguish between lagged advertising effects and positive serial correla-tion in the disturbances, whereas this problem does not affect cross-sectional data (Clarke and McCann 1973; Houston and Weiss 1974). Because panel data have both a longitudinal and a cross-sectional di-mension, Kremer, Bijmolt, Leeflang, and Wieringa (2008) expected elasticities of panel data to be larg-er than those of longitudinal data but smaller than those of cross-sectional data. In their analysis, how-ever, they found that elasticities based on longitudi-nal data are larger than elasticities based on panel data. In contrast, Albers, Mantrala, and Sridhar (2010) found that elasticities of cross-sectional data are lower than those from panel data. Because the extant literature does not agree on this topic, we consider this effect to be an empirical issue and do not provide a hypothesis.
Temporal aggregation (AED columns BU-CF): The time interval at which the data are temporally ag-gregated has been shown to affect elasticity magni-tude (e.g., Bijmolt, Van Heerde, and Pieters 2005; Clarke 1976; Tellis 1988; Tellis and Franses 2006). Accordingly, it is coded in the AED at what temporal level the data used in the empirical studies are ag-gregated (daily, weekly, monthly, bimonthly, quar-terly, yearly, or n.a.). In addition, the number of periods used for estimation (excluding periods for the calculation of lagged variables and holdout vali-dation) is noted. The majority of published findings suggests that advertising coefficients systematically increase with increasing temporal aggregation of the data (e.g., Kanetkar, Weinberg, and Weiss 1992; Leone 1995; Sethuraman and Tellis 1991; Tellis and Weiss 1995; Tellis 2005). More specifically, Assmus, Farley, and Lehmann (1984) found that advertising elasticities for bimonthly and quarterly data are higher than the grand mean, and Sethuraman, Tellis, and Briesch (2011) found that elasticities are higher for yearly than for quarterly data. This effect is attributable to carryover effects, among others, because advertising does not unfold its full impact on sales immediately but partially with a time lag (e.g., Christen, Gupta, Porter, Staelin, and Wittink 1997; Sethuraman and Tellis 1991; Tellis and Weiss 1995). Accordingly, disaggregated (such as daily or weekly) data lead to lower advertising elasticities. We thus hypothesize that the larger the time interval at which the data are temporally aggregated, the larger the advertising elasticity. That is, elasticities are larger for yearly than for quarterly than for monthly data:
H5: Data aggregated at the a) yearly level b) bimonthly or quarterly level lead to larger elasticities than do data aggre-gated at the monthly level.
Mean year of data collection (mean centered, AED columns CG-CQ): It is of great interest to managers and researchers whether the advertising elasticity is stable over time or whether there is a trend due to, e.g., the differentiation of products, the refinement of media, or consumers being increasingly demand-ing. Thus, in line with Albers, Mantrala, and Sridhar (2010), the AED records the first, last, and mean year of data collection. Based on our database’s

BuR - Business Research Official Open Access Journal of VHB German Academic Association for Business Research (VHB) Volume 4 | Issue 2 | December 2011 | 193-239
210
average difference between the mean year of data collection and the year of publication, missing val-ues for the mean year of data collection are imputed before the variable is mean centered (AED columns CI-CQ). While promotional effectiveness is stable for the data analyzed by Kremer, Bijmolt, Leeflang, and Wieringa (2008), personal selling and advertising elasticities are shown to decrease over time by Al-bers, Mantrala, and Sridhar (2010) and Sethu-raman, Tellis, and Briesch (2011), respectively. Thus, we assume that in recent years more effort was necessary to produce the same level of output, leading to the following hypothesis:
H6: The more recent the analyzed data are, the smaller the elasticity will be.
Spatial dimension (AED columns CR-CW): It is known that customer segmentation is advantageous because consumer needs can better be addressed and satisfied when dealing with homogeneous than with heterogeneous preferences (e.g., Iyer, Sober-mann, and Villas-Boas 2005; Smith 1956; Wind 1978). Research has shown that individual prefer-ences are not static but rather dependent on the preferences of others in social and – often at least as important – spatial proximity (e.g., Manchanda, Xie, and Youn 2008; Yang and Allenby 2003). As a result, it is not unreasonable to assume that the smaller the analyzed area is, the more homogeneous are the preferences (e.g., within-country fragmenta-tion of consumer needs, Hofstede, Wedel, and Steenkamp 2002), which potentially pays off in higher sales response. To be able to investigate whether advertising elasticities differ in magnitude depending on whether the analyzed data are inter-national, national, or regional (such as metropolitan cities), these three types of spatial dimensions are coded in the AED. If a study does not provide exact information about the spatial unit, data are coded as national by default. Dependent measure (AED columns CX-CZ): Previ-ous meta-analyses report that the specification of the dependent measure has an influence on elastici-ty magnitude (e.g., Sethuraman, Tellis, and Briesch 2011). The AED therefore includes whether the dependent measure used in empirical studies’ mod-els is specified in absolute (e.g., physical or mone-tary units) or relative terms (e.g., market share, choice, or attraction models).
Whereas Assmus, Farley, and Lehmann (1984) did not find a significant difference, Sethuraman, Tellis, and Briesch (2011) and Weinberg and Weiss (1982) detected higher advertising elasticity values for ab-solute than for relative dependent variables. This finding can be attributed to the fact that absolute dependent variables capture both primary (market expansion) and secondary (share expansion) effects, whereas relative dependent variables only capture secondary effects (e.g., Albers, Mantrala, and Sri-dhar 2010; Assmus, Farley, and Lehmann 1984; Hagerty, Carman, and Russell 1988). We thus as-sume:
H7: Advertising elasticities derived from models using absolute dependent measures are higher than those from models using relative depend-ent measures.
Advertising measure (AED columns DA-DD): Simi-larly, a firm’s absolute advertising spending can increase while its advertising share decreases. In order to be able to examine the impact of the adver-tising’s specification on elasticity magnitude, three types of advertising measurements are present in our database: advertising measured in absolute terms, in relative terms, and in gross rating points (GRP). Absolute advertising is quantified in mone-tary terms or units (e.g., number of advertising campaigns), whereas relative advertising describes a focal brand’s advertising efforts divided by the ef-forts of its competitors or all market participants, respectively. GRPs are used in media planning (e.g., Chintagunta, Kadiyali, and Vilcassim 2006; Dana-her, Bonfrer, and Dhar 2008; Dubé, Hitsch, and Manchanda 2005; Sissors and Baron 2002) to measure the sum of percentage reach of one adver-tising insertion in a given time period (Rossiter and Percy 1998), thus combining absolute and relative components. Advertising quality, capturing, e.g., elements of the advertising campaign (Lambin 1976: 221), is not considered in this analysis. Sethuraman, Tellis, and Briesch (2011) found that advertising elasticities estimated on the basis of GRP data are higher than those estimated based on relative data, which are in turn higher than those based on absolute advertising data. In contrast, Assmus, Farley, and Lehmann (1984) on average observed higher elasticities for absolute than for relative specifications, although the difference is not significant. They explained that the use of advertis-ing share implicitly assumes no impact of advertis-

BuR - Business Research Official Open Access Journal of VHB German Academic Association for Business Research (VHB) Volume 4 | Issue 2 | December 2011 | 193-239
211
ing, so share elasticities calculated using advertising share may turn out to be smaller than those based on volume specifications. Subscribing to this ap-proach, we expect:
H8: Advertising elasticities from models using a) GRP measures are higher b) relative advertising measures are lower than elasticities derived on the basis of abso-lute advertising measures.
Carryover effects (AED columns DE-DQ) The impact of advertising may be spread over time, i.e., it does not necessarily unfold its full impact in the same period as the impulse is set, but may be ”carried over” to subsequent periods (Givon and Horsky 1990; Hanssens, Parsons, and Schultz 2001: 141, Leone 1995; Weinberg 1975, and section 3.2.1). Because alternative approaches to model carryover exist, three types of variables are coded in the AED, namely lagged dependent, lagged advertising, and advertising stock variables. Each type is described in brief before the suggested hypotheses are stated cohesively. Lagged dependent variable (AED columns DE-DH): One option is to model carryover effects by employing the dependent variable (i.e., sales) of the previous period as an explanatory variable for the current period. The motivation is to capture effects such as consumer inertia or loyalty, which are typi-cally hard to measure but can be captured by the lagged dependent variable due to its positive corre-lation with current-period response (Parsons and Schultz 1976: 170-172). The AED records whether a lagged dependent variable is used in a study’s main model and, when it is reported, the estimate of its coefficient. Lagged advertising variable (AED columns DI-DK): Whereas the former approach employs the lagged response as a predictor of the current re-sponse, lagged advertising employs the lagged im-pulse as a predictor of the current response to model carryover effects (e.g., Clarke 1976). The AED con-tains a dummy variable that indicates whether lagged advertising has been used as an explanatory variable. If the model includes lagged but no cur-rent-period advertising, it is assumed to reflect the specifics of the product or the data (Moriarty (1975: 145), for instance, uses lagged advertising because sales volume is reported in shipments to rather than sales of retail outlets, i.e., lagged advertising is em-
ployed to achieve a fit between the dependent and the independent variable). As a result, we consider and code the elasticities of the most recent advertis-ing variable as current-period elasticities. Advertising stock variable (AED columns DL-DO): A typical problem of employing lagged advertising values as explanatory variables for current response is the high degree of multicollinearity that is often present among them (Erickson 1981; Leeflang, Wit-tink, Wedel, and Naert 2000: 87). A way out has been offered by the introduction of stock variables (as outlined in section 3.2.1). In the AED, it is indi-cated whether an advertising stock variable is em-ployed to account for carryover effects. When re-ported, the estimated parameter for the carryover coefficient is also noted. A substantial amount of literature finds that the effect of advertising is indeed carried over, at least partially, into future periods (e.g., Assmus, Farley, and Lehmann 1984; Givon and Horsky 1990; Leone 1995) because individuals memorize past advertis-ing and create “goodwill” toward the brand that only gradually deteriorates because of forgetting (Dekimpe and Hanssens 1995). This is true for both the lagged dependent variable (Albers, Mantrala, and Sridhar 2010; Assmus, Farley, and Lehmann 1984; Sethuraman, Tellis, and Briesch 2011) and lagged advertising (Albers, Mantrala, and Sridhar 2010). As a consequence, elasticities are found to be larger when carryover effects are not accounted for because, in this case, a larger part of the response is attributed to the current period’s advertising efforts. Thus, we expect:
H9: Omitting the lagged dependent variable from a model leads to higher advertising elastici-ties than including it does.
H10: Analogously, omitting lagged or stock adver-tising from a model leads to higher advertis-ing elasticities than including them does.
Marketing determinants (AED columns DR-ER) If a regression equation omits relevant predictor variables, parameter estimates of included variables may be biased depending on the coefficient of the omitted variable and the correlation between the included and omitted variables (Greene 2000: 334-337). Thus, advertising elasticity magnitudes can be biased by the omission of relevant variables (Ass-mus, Farley, and Lehmann 1984; Sethuraman and

BuR - Business Research Official Open Access Journal of VHB German Academic Association for Business Research (VHB) Volume 4 | Issue 2 | December 2011 | 193-239
212
Tellis 1991). In order to control for potential omis-sion bias, several marketing variables are integrated into the AED. Lagged price (AED columns DR-DT): Similar to modeling advertising carryover effects by a lagged advertising variable, a lagged price variable can be used to capture consumers being geared to extant reference price levels and the fact that deal-prone consumers synchronize their purchases with firms' discounting patterns, i.e., stocking up when a prod-uct is on sale (Tellis 1988). As lagged price is likely to be negatively correlated with current-period sales (e.g., due to inertia in price setting, Pauwels 2004) but positively correlated with current-period adver-tising, the omission of lagged price can negatively bias the advertising elasticity (Sethuraman, Tellis, and Briesch 2011). In the AED, a variable captures whether lagged price is employed in the empirical studies’ model. Price (AED columns DU-DW): Price is a major influential variable in marketing research (Bijmolt, Van Heerde, and Pieters 2005; Tellis 1988; Völck-ner 2008; Völckner and Sattler 2005)– in some studies it even turned out to have, right after distri-bution, the second highest impact on sales (Sriniva-san, Vanhuele, and Pauwels 2010). The AED rec-ords whether price is used as an explanatory varia-ble in an empirical study’s model. Albers, Mantrala, and Sridhar (2010); Assmus, Far-ley, and Lehmann (1984); and Sethuraman, Tellis, and Briesch (2011) did not find significant effects of price on response. However, in case there is any difference at all, elasticities are assumed to be smaller when omitting the price variable than when including it because price is likely to be negatively correlated with advertising response but positively correlated with current-period advertising. Hence, we assume:
H11: Advertising elasticities are smaller when price is omitted from the model than when it is included.
Quality (AED columns DX-DZ): The omission of a product quality-related variable is likely to bias ad-vertising elasticity estimates (Sethuraman, Tellis, and Briesch 2011). Thus, the database indicates whether product quality has been used as an ex-planatory variable to investigate the effect of omit-ting quality from a model on advertising elasticity. Note that quality refers to product quality, not to the
quality of advertising (such as advertising campaign quality, Lambin 1976: 221). While quality turns out to be significant in price elasticity studies (Sethuraman and Tellis 1991; Tellis 1988), no significant effects are found for personal selling (Albers, Mantrala, and Sridhar 2010) and advertising (Sethuraman, Tellis, and Briesch 2011). Because advertising is known to have an infor-mation function (Nelson 1975), i.e., reducing uncer-tainty and leveraging the perceived product quality (e.g., Erdem, Keane, and Sun 2008; Tellis and For-nell 1988), sales and market share should increase if consumers are, at least to a certain extent, informed about a product’s high quality (Tellis 1988). Because it is likely that, in models for higher-quality prod-ucts, quality is included as a variable more often than in models for lower-quality products, and be-cause the former should be more successful than the latter, we expect:
H12: Advertising elasticities are smaller when the quality variable is omitted from the model than when it is included.
Promotion (AED columns EA-EC): Promotions give consumers incentives to act faster (Ramanathan and Dhar 2010; Stilley, Inman, and Wakefield 2010). Sometimes perceived as a gift (Van den Putte 2009), they enhance sales more instantaneously and often to a greater extent than other elements of the marketing mix do (Blattberg and Neslin 1990). Biases of advertising elasticity might therefore occur due to the omission of promotional variables (An-drews and Franke 1991, or, in the context of person-al selling elasticities, Albers, Mantrala, and Sridhar 2010). The AED indicates whether promotions (e.g., displays or samples) are used as an explanatory variable in the study. Variables labeled as “deals” point to promotional activities (e.g., Frank and Massy 1967; Johansson 1973). Personal selling (AED columns ED-EF): A vast amount of literature investigates the effects of per-sonal selling, which is a powerful marketing instru-ment, especially in the pharmaceutical industry (e.g., Albers, Mantrala, and Sridhar 2010; Fischer and Albers 2010; Kremer, Bijmolt, Leeflang, and Wieringa 2008; Sinha and Zoltners 2001). Because both advertising and personal selling aim at provid-ing information to reduce risk, they can have substi-tutional or, when addressing different target groups, complementary effects (Jagpal and Brick 1982). Therefore, the AED captures whether sales force

BuR - Business Research Official Open Access Journal of VHB German Academic Association for Business Research (VHB) Volume 4 | Issue 2 | December 2011 | 193-239
213
data (e.g., detailing in the pharmaceutical industry) are used as an explanatory variable in an empirical study’s model. Distribution (AED columns EG-EI): There is gen-eral agreement that a wide distribution of products (e.g., by a larger number of outlets) positively influ-ences sales (Hanssens, Parsons, and Schultz 2001: 347; Leone and Schultz 1980; Tellis 1988) – some-times even more than other marketing mix elements do (Srinivasan, Vanhuele, and Pauwels 2010). Se-thuraman, Tellis, and Briesch (2011), who reported a positive distribution omission effect on advertising elasticity, propose that advertised brands might enjoy a higher level of distribution, which pays off in higher sales and, in turn, leads to higher advertising elasticity values when omitting distribution from the model. In order to provide a basis for Farley, Leh-mann, and Sawyer’s (1995) call for more studies investigating price, advertising, quality, and distri-bution at the same time, the AED contains a dummy variable indicating whether distribution is used as a predictor in empirical studies. Additional advertising media used (AED columns EJ-ER): Studies analyzing the effectiveness of dif-ferent advertising media at the same time are rare, as reflected by this study’s database. As a result, it is difficult to say what impact a certain advertising medium has on the advertising elasticity of another medium. Nonetheless, because most firms use more than one advertising channel, it is reasonable to assume that omitting advertising types used in par-allel has an effect on elasticity, the extent of which depends on the correlation between the affected variables (Greene 2000: 334-337). Because empiri-cal findings on this topic are crucial for the optimi-zation of media selection and budget allocation decisions, the AED records whether – in addition to the advertising instrument for which the elasticity is reported (AED columns AD-AG) – further advertis-ing media are used in the model (AED columns EJ-EN, e.g., Hsu and Liu 2004). In doing so, other researchers who wished to investigate the effective-ness of parallel-used advertising media can use our data as a starting point.
Market-related determinants (AED columns ES-FM) The aforementioned omission bias (Assmus, Farley, and Lehmann 1984) can also be induced by failing to consider market-related variables. In order to account for their potential omitted variable bias, the
following market-related variables are contained in the AED. Time trend (AED columns ES-EU): With a similar purpose to recording the mean year of data collec-tion for each study in the AED (columns CG-CQ) to investigate whether the advertising elasticity is sta-ble over time, some empirical studies include a trend variable. The presence or absence of a time trend matters in terms of the estimated advertising elasticity magnitude (Andrews and Franke 1991) because it filters out effects that can be attributed to changes over time. Hence, when a study employs, e.g., temporal dummies, period-related variables, or investigates sequences of time intervals separately, it is coded in the AED that a trend has been included in the empirical model. Seasonality (AED columns EV-EX): Depending on the analyzed product type, the response to advertis-ing can significantly depend on seasonality (Kinnu-can and Forker 1986). This is true not only for weather-dependent goods, such as ice cream or sunscreen, but also for, e.g., the pharmaceutical industry, where sales calls are more effective right after the weekend than they are during the rest of the week (Tellis, Chandy, and Thaivanich 2000). In the AED, the seasonality variable is coded as being present when, e.g., temperature or seasonal dum-mies are used as predictors in empirical studies’ models. Income (AED columns EY-FA): Bijmolt, Van Heerde, and Pieters (2005) investigated the effect of income on price elasticity and found that an in-crease in household disposable income reduces pricing effectiveness because search costs outweigh the expected benefits of examining price infor-mation (Estelami, Lehmann, and Holden 2001). In a similar manner, an increase in disposable income might reduce consumers' motivation and need to look for uncertainty-reducing advertising. There-fore, advertising might be less effective in that case. On the other hand, advertising is known to signal product quality (Erdem, Keane, and Sun 2008; Tellis and Fornell 1988), which might be more im-portant for high- than for low-income households. Against this backdrop, income could also positively influence advertising elasticity. The AED captures whether the effects of income on response are ac-counted for in a model. Production costs (AED columns FB-FD): A few of the studies in the database use production cost as an explanatory variable of response (e.g., Prag and

BuR - Business Research Official Open Access Journal of VHB German Academic Association for Business Research (VHB) Volume 4 | Issue 2 | December 2011 | 193-239
214
Casavant 1994). The AED indicates whether the effects of such costs (e.g., production costs of a mov-ie) on response are accounted for in a study’s model. Costs not related to production of the good (e.g., costs of living) are not represented by this variable. Total industry sales (AED columns FE-FG): Simi-larly, several studies of our database employ indus-try sales as an explanatory variable. Because the effect of this variable on advertising elasticity is not well-documented in the literature, it is noted in the AED whether an industry sales variable is used in the empirical studies’ models, be it in absolute (e.g., Cowling and Cubbin 1971) or relative terms (e.g., Metwally 1975). Competition (AED columns FH-FK): Competitive advertising interference occurs when consumers are exposed to advertising messages for competing products, thereby considerably harming advertis-ing’s effectiveness (Vakratsas and Ambler 1999). The AED records whether competitive effects are accounted for in empirical models. These can be operationalized in various ways, such as the pure number of competitors or their market behavior (e.g., their advertising efforts) in absolute or relative terms. The effects of competition are analyzed extensively, but the practical implication is not trivial. Although there are scenarios where the reverse holds, it can be generalized that a superior advertising position is advantageous in terms of being remembered by consumers (Van den Putte 2009; Xu, Chen, and Whinston 2011). While competitive markets are found to be more responsive to advertising (Gat-ignon 1984), advertising elasticity generally declines when competitive advertising volume and, more harmfully, the number of competitors increases (Parker and Gatignon 1996), sometimes even cul-minating in an advertising elasticity of null (Dana-her, Bonfrer, and Dhar 2008). Accordingly, we hy-pothesize:
H13: Advertising elasticities derived from models that do not account for competitive effects are higher than those derived from studies that account for competitive influence.
Number of further variables (AED columns FL-FM): In addition to the many general variables that are coded up to this point, models might additional-ly include other variables that relate to the distinc-tive characteristics of the respective study. Due to their context-specific nature, each of them occurs
only infrequently, so they are merged in a pooled, ratio-scaled variable indicating the number of addi-tional variables used in a model. Examples include brand loyalty, new variety activity, movie genre, and performance expectations. For each study, a brief description of these variables is given in the AED (column FM).
Interaction effects used in empirical studies (AED columns FN-FV) Interaction effects can include or exclude advertis-ing variables. Both types are briefly outlined before the hypothesis is stated cohesively. Advertising interaction effects (AED columns FN-FQ): Marketing mix elements can affect consumer response synergistically (Narayanan, Desiraju, and Chintagunta 2004). To allow for such joint effects, interaction terms of the respective variables are included in estimation models, thereby potentially impacting advertising elasticity. In the AED it is noted whether interaction effects between advertis-ing and other variables are considered in a model. For the purpose of this study, only response interac-tion is considered, whereas decision interaction, which is present in multiplicative models, is not (Gatignon and Hanssens 1987; Vanhonacker 1989). Because such interactions have positive effects, omitting them from a model could result in lower advertising elasticity estimates due to an underes-timation of the marginal effect of advertising on response (Albers, Mantrala, and Sridhar 2010). Other interaction effects (AED columns FR-FT): Likewise, the AED comprises other (i.e., excluding advertising) interaction effects, such as those of remaining marketing mix elements (e.g., Bridges, Briesch, and Shu 2008). Again, only response inter-action is considered. Due to their rarity in our database, both interaction types are collapsed to investigate the effect of omit-ting interaction effects on elasticity magnitude. We hypothesize:
H14: Advertising elasticities from response models that do not account for interaction effects are lower than those from studies that account for interaction effects.
Estimation determinants (AED columns FW-HI) Intercept (AED columns FW-FX): This category indicates whether an intercept is included in the model of the coded empirical study. We have no

BuR - Business Research Official Open Access Journal of VHB German Academic Association for Business Research (VHB) Volume 4 | Issue 2 | December 2011 | 193-239
215
expectations regarding its influence and thus con-sider it as an empirical issue left to the data. Functional form (AED columns FY-GH): When modeling, e.g., sales, a decision has to be made with respect to the most appropriate functional form (Brodie and de Kluyver 1984; Ghosh, Neslin, and Shoemaker 1984). The alternative forms assume different types of response to advertising, which can, in turn, affect advertising elasticity (Arora 1979; Assmus, Farley, and Lehmann 1984). Four func-tional forms that are frequently used to model ad-vertising effectiveness are coded in the AED: share, double-log, semi-log (with the advertising variable being logged), and linear. In case none of these types applies, the model falls into the category oth-er, which is a pool of less frequently used functional forms. Note that when the percentage value of mar-ket share is modeled by, e.g., a double-log or linear function, it falls into categories double-log or linear, whereas the category share is appropriate for frac-tion formulations used by attraction models. Although most studies do not (e.g., Albers, Man-trala, and Sridhar 2010; Bijmolt, Van Heerde, and Pieters 2005; Kremer, Bijmolt, Leeflang, and Wieringa 2008; Tellis 1988), Assmus, Farley, and Lehmann (1984) and Sethuraman, Tellis, and Briesch (2011) found significant differences in ad-vertising elasticity for different functional forms. However, we do not provide a hypothesis for a po-tential systematic difference in advertising elasticity with respect to the functional form, because the adequacy of a model form depends on the charac-teristics of the analyzed data (Tellis 1988). Estimation method (AED columns GI-GZ): The choice of the estimation method cannot only bias the magnitude but even the direction of the estimat-ed effect of advertising on sales (Assmus, Farley, and Lehmann 1984). To be able to trace whether this holds for the advertising elasticities in our data-base, the AED reflects whether the estimation method used is Ordinary Least Squares (OLS), Weighted Least Squares (WLS), Non-Linear Least Squares (NLS), (Feasible) Generalized Least Squares (GLS), Two-Stage Least Squares (2SLS), Three-Stage Least Squares (3SLS), Maximum Like-lihood (ML), Two-Step Maximum Likelihood (2SML), Simulated Maximum Likelihood (SimML), Generalized Method of Moments (GMM), Bayes, or other. If no information with respect to the estima-tion method is stated, it is coded as n.a.
There is ambiguity about how the estimation meth-od might affect advertising elasticities (Assmus, Farley, and Lehmann 1984; Tellis 1988). Because most generalization studies report insignificant effects (e.g., Albers, Mantrala, and Sridhar 2010; Assmus, Farley, and Lehmann 1984; Bijmolt, Van Heerde, and Pieters 2005; Kremer, Bijmolt, Leeflang, and Wieringa 2008; Sethuraman, Tellis, and Briesch 2011; Tellis 1988), we do not provide a hypothesis but keep the variable in the meta-analysis for comparison to prior generalization stud-ies. Endogeneity (AED columns HA-HC): Endogeneity emerges when it is assumed that model variables are (set) independent(ly) although in reality they depend on some factors that are often principally known but hard to observe or measure and hence are rarely part of the data (Blattberg and Neslin 1990). By assuming exogeneity, these unobserved factors enter the model’s error term, thus induc-ing a correlation between the affected variable and the error term that can lead to biased esti-mates (Chintagunta, Kadiyali, and Vilcassim 2006). Thus, not accounting for endogeneity po-tentially biases elasticity magnitudes (Besanko, Gupta, and Jain 1998; Chintagunta 2001; Shugan 2004; Villas-Boas and Winer 1999). The AED contains a dummy, indicating whether endogenei-ty is accounted for, e.g., by the use of instrumental variables. While Sethuraman, Tellis, and Briesch (2011) ex-pected and found a negative endogeneity omission bias for advertising elasticities, Albers, Mantrala, and Sridhar (2010) expected and found a significant positive one for personal selling elasticities. Joining the latter’s argument of the overestimation of re-sponse effects when not accounting for endogeneity, we posit:
H15: When endogeneity is not accounted for in a model, the advertising elasticity is lower than when it is accounted for.
Heterogeneity (AED columns HD-HI): Accounting for heterogeneity in models leads to more precise and accurate estimation results for the investigated subgroups (e.g., Ghosh, Neslin, and Shoemaker 1984). To investigate whether this results in struc-turally differing advertising elasticities, the AED captures whether heterogeneity is accounted for in the empirical studies’ models via individual (i) in-

BuR - Business Research Official Open Access Journal of VHB German Academic Association for Business Research (VHB) Volume 4 | Issue 2 | December 2011 | 193-239
216
tercepts or (ii) advertising coefficients (e.g., brand-, segment-, or consumer-specific). Referring to Hutchinson, Kamakura, and Lynch Jr. (2000), Bijmolt, Van Heerde, and Pieters (2005) outlined that accounting for heterogeneity can theo-retically lead to an increase or decrease of elasticity estimates. Because neither these authors nor Albers, Mantrala, and Sridhar (2010) or Sethuraman, Tellis and Briesch (2011) found significant differences in advertising elasticity with respect to accounting for heterogeneity, we consider the direction of a poten-tial effect as an empirical issue left to the data.
Publication determinants (AED columns HJ-HX) Publication type (AED columns HJ-HP): A basic concern that seems to have peculiar appeal to critics of meta-analyses is that generalizations suffer from the so-called publication bias (Rust, Lehmann, and Farley 1990). That is, “less desired results” (from a marketer’s perspective, such as “wrong” effect direc-tion or low statistical power resulting from small sample size, Lipsey and Wilson 2001: 141-143) have lower probability of being published, which is why results from meta-analyses are sometimes said not to reflect the real world. In order to control for this bias, the AED captures whether a study has appeared in an academic journal, conference pro-ceedings, a published book, or is an unpublished working paper. There is general agreement that, if a publication bias is present, elasticities in published work should be larger than those in unpublished work because edi-tors prefer to publish significant results. The results of Kremer, Bijmolt, Leeflang, and Wieringa (2008) confirm this assumption, while those by Albers, Mantrala, and Sridhar (2010) and Sethuraman, Tellis, and Briesch (2011) are not significant. If a publication bias exists, we expect that:
H16: Unpublished studies exhibit lower advertis-ing elasticity estimates than published papers do.
Marketing-related outlet (AED columns HQ-HS): Similar to a publication-type bias, a publication outlet bias might exist; i.e., findings on elasticity might structurally differ with respect to the research area (Kremer, Bijmolt, Leeflang, and Wieringa 2008). The AED captures whether the outlet of a study is related to marketing or not. While this cate-gorization is typically easy for journals and confer-ence proceedings, it may be difficult for books and
working papers. We define books as related to mar-keting when the title relates to a marketing topic or when the book is published in a marketing book series. If a paper is not yet published, the affiliation of the first author is decisive. Findings on the direction of a potential publication bias by Albers, Mantrala, and Sridhar (2010) and Kremer, Bijmolt, Leeflang, and Wieringa (2008) are not significant. However, as the latter argued, mar-keting outlets, in case of doubt, prefer to publish results underlining the outstanding importance of marketing actions to company success. Hence, a positive publication bias might exist for these out-lets, which is why we hypothesize:
H17: Advertising elasticities published in non-marketing outlets are lower than those pub-lished in marketing-related outlets.
Outlet ranking (AED columns HT-HU): Gallet and List (2003) pointed out that elasticities are sensitive to whether results are published in higher- or lower-ranked journals. To investigate whether this is true for our database, two alternative ranking values are included in the AED for each study. These have been developed by Hult, Reimann, and Schilke (2009) and include the Popularity and Familiarity Index (PFI, where higher values indicate a better ranking) and the Importance and Prestige Index (IPI, where lower values indicate a better ranking). For missing cases, Science Citation Index values (Science Citation Index 2011, Svensson 2010) are imputed wherever possible. Remaining rankings are set to the lowest values of 0.01 and 9.00 for PFI and IPI, respectively. Highly ranked outlets are very demanding with respect to modeling requirements. For instance, accounting for potential heterogeneity and endoge-neity is a minimum prerequisite for an article to be published in a high-ranked journal to make sure no effects are spuriously ascribed. As a result, account-ing for a variety of possible effects might lead to a lower mean elasticity for high-ranked outlets. If a ranking bias exists, we assume:
H18: The better the ranking value of a publication outlet is, the lower the magnitude of elastici-ties published there.
Advertising effectiveness focus (AED columns HV-HX): Finally, Kremer, Bijmolt, Leeflang, and Wieringa (2008) argued that a positive publication

BuR - Business Research Official Open Access Journal of VHB German Academic Association for Business Research (VHB) Volume 4 | Issue 2 | December 2011 | 193-239
217
bias might exist for studies of which the main topic is promotional effectiveness. Although not found to be statistically significant by the aforementioned authors, the AED records whether a study investi-gates an advertising effectiveness topic. This is, by definition, the case whenever the title or the abstract deals with the effects of advertising on the response measure. If such a bias is present, we expect:
H19: Studies focusing on non-advertising topics exhibit lower elasticity estimates than do studies focusing on advertising effectiveness topics.
4 Meta-Analysis
4.1 Distribution of Elasticities Figure 3 displays the frequency distribution of the 659 current-period advertising elasticities that are included in the meta-analysis.
Figure 3: Frequency Chart of Current-Period Elasticity Estimates
1.82%
9.10%
45.22%
16.24%
8.50%5.01% 6.07%
2.88%2.28%1.06%0.30%1.52%0
50
100
150
200
250
300
350
[-0
.19;
-0
.1 [
[-0
.1; 0
[
[ 0
; 0.0
5 [
[ 0
.05;
0.1
[
[ 0
.01;
0.1
5 [
[ 0
.15;
0.2
[
[ 0
.2; 0
.3 [
[ 0
.3;
0.4
[
[ 0
.4; 0
.5 [
[ 0
.5; 0
.6 [
[ 0
.6; 0
.7 [
[ 0
.6; 1
.12
[
Nu
mb
er
of
Ela
stic
ity
Est
ima
tes
Current-Period Advertising Elasticity Magnitudes
It shows that 89% of the current-period elasticities are positive. After excluding one unreasonably high elasticity value of 1.80 (Sexton 1970), the database’s minimum elasticity value is -0.19 while the maxi-mum value is 1.11 (Table 3). Similar to Sethuraman, Tellis, and Briesch (2011, Figure 1, 58%), about 61.5% of all current-period elasticities lie within the interval of [0; 0.1[. The mean current-period elastic-ity is 0.09 (median = 0.04). While this value is sub-stantially lower than those reported by Assmus, Farley, and Lehmann (1984, mean = 0.22) and Se-thuraman, Tellis, and Briesch (2011, mean = 0.12, additionally reported is median = 0.05), it is in line with the findings of recent studies for TV advertising
(Hu, Lodish, and Krieger 2007, mean = 0.10) and direct-to-consumer advertising in the pharmaceuti-cal industry (Kremer, Bijmolt, Leeflang, and Wieringa 2008, mean = 0.07). Possible reasons for our finding of a smaller current-period advertising elasticity are: (i) a general negative time trend; (ii) in comparison to Sethuraman, Tellis, and Briesch (2011), a downward influence resulting from addi-tionally including the studies by Ainslie, Drèze, and Zufryden (2005); Arora (1979); Elberse and Eliash-berg (2003); Frank and Massy (1967); Montgomery and Silk (1972); and Telser (1962), whose mean current-period elasticity is 0.06; and (iii) some data potentially being interpreted differently than by Sethuraman, Tellis, and Briesch (2011) after having contacted the authors of the empirical papers.
4.2 Estimation Although many variables are coded in the AED to make it as comprehensive as possible, only a subset of them enters the subsequent meta-analysis for the following two reasons: (i) due to multicollinearity, not all of them can be included in the meta-analysis; (ii) variables that do not turn out to exert a major impact on advertising elasticity, either in forward or backward regression or in prior meta-analyses, are excluded. Table 3 provides an overview of the de-scriptive statistics for the variables included in the meta-regression, where the naïve prediction indi-cates the mean current-period elasticity value for each variable level. We model advertising elasticity as a linear function of selected independent variables. A portion of the hierarchical structure of the data is reflected by the coded variables, that is, some variables are observed at the lower measurement level, i.e., their values can differ within a study, while other variables are ob-served at the higher study level, i.e., their values are fixed within a study. Nevertheless, additional study-specific factors might exist that are not picked up by the aforementioned coded variables. As a result, a non-zero within-study error structure might emerge. In order to account for this potential bias, we apply the standard hierarchical linear modeling approach suggested by Bijmolt and Pieters (2001). Following Albers, Mantrala, and Sridhar (2010), we use the SAS PROC MIXED procedure to estimate random study-level intercepts and fixed effects for the determinants by means of maximum likelihood. The results of this hierarchical model M1 are
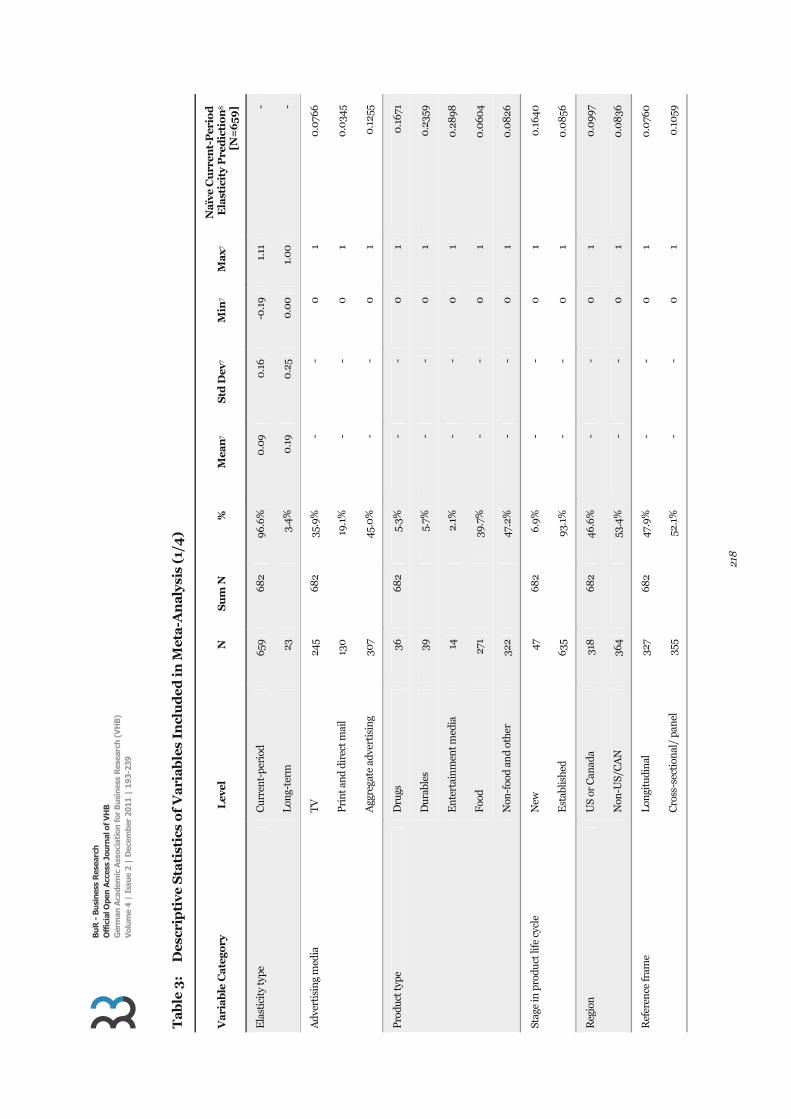
BuR
- B
usin
ess
Res
earc
h O
ffic
ial O
pen
Acc
ess
Jour
nal o
f VH
B
Ger
man
Aca
dem
ic A
ssoc
iati
on fo
r B
usin
ess
Res
earc
h (V
HB
) V
olum
e 4
| Is
sue
2 |
Dec
embe
r 20
11 |
193
-239
218
Ta
ble
3:
D
escr
ipti
ve S
tati
stic
s o
f V
ari
ab
les
Incl
ud
ed i
n M
eta
-An
aly
sis
(1/4
)
Va
ria
ble
Ca
tego
ry
Lev
el
N
Su
m N
%
M
ean
7 S
td D
ev7
Min
7 M
ax7
N
aïv
e C
urr
ent-
Per
iod
E
last
icit
y P
red
icti
on
8 [N
=6
59
]
Ela
stic
ity
type
C
urre
nt-
peri
od
659
682
96.6
%0
.09
0.1
6-0
.19
1.11
-
Lon
g-te
rm23
3.
4%0
.19
0.2
50
.00
1.
00
-
Adv
erti
sin
g m
edia
T
V
245
682
35.9
%-
-0
1
0.0
766
Pri
nt a
nd d
irec
t mai
l13
0
19.1
%-
-0
1
0.0
345
Agg
rega
te a
dver
tisi
ng
307
45.0
%-
-0
1
0.1
255
Pro
duct
type
D
rugs
36
68
25.
3%-
-0
1
0.1
671
Dur
able
s39
5.
7%-
-0
1
0.2
359
En
tert
ain
men
t med
ia14
2.
1%-
-0
1
0.2
898
Foo
d 27
1 39
.7%
--
0
10
.060
4
Non
-foo
d an
d ot
her
322
47.2
%-
-0
1
0.0
826
Stag
e in
pro
duct
life
cyc
le
New
47
68
26.
9%-
-0
1
0.1
640
Est
ablis
hed
635
93.1
%-
-0
1
0.0
856
Reg
ion
U
S or
Can
ada
318
68
246
.6%
--
0
10
.099
7
Non
-US/
CA
N
364
53.4
%-
-0
1
0.0
836
Ref
eren
ce fr
ame
Lon
gitu
dina
l 32
7 68
247
.9%
--
0
10
.076
0
Cro
ss-s
ecti
onal
/ pa
nel
35
5 52
.1%
--
0
10
.10
59

BuR
- B
usin
ess
Res
earc
h O
ffic
ial O
pen
Acc
ess
Jour
nal o
f VH
B
Ger
man
Aca
dem
ic A
ssoc
iati
on fo
r B
usin
ess
Res
earc
h (V
HB
) V
olum
e 4
| Is
sue
2 |
Dec
embe
r 20
11 |
193
-239
219
Ta
ble
3 c
on
tin
ued
: D
escr
ipti
ve S
tati
stic
s o
f V
ari
ab
les
Incl
ud
ed i
n M
eta
-An
aly
sis
(2/4
)
Va
ria
ble
Ca
tego
ry
Lev
el
N
Su
m N
%
M
ean
7 S
td D
ev7
Min
7 M
ax7
N
aïv
e C
urr
ent-
Per
iod
E
last
icit
y P
red
icti
on
8 [N
=6
59
]
Tem
pora
l agg
rega
tion
of d
ata
Up
to o
ne
mon
th
366
682
53.7
%-
-0
1
0.0
791
Bim
onth
ly a
nd
quar
terl
y 15
1 22
.1%
--
0
10
.040
2
Yea
r an
d ot
her
s16
5 24
.2%
--
0
10
.164
5
Mea
n y
ear
of d
ata
colle
ctio
n (m
ean
cen
-te
red)
-
682
682
100
.0%
0.0
018
.15
-10
3.69
30
.31
-
Dep
ende
nt m
easu
re
Abs
olut
e 20
2 68
229
.6%
--
0
10
.148
4
Rel
ativ
e48
0
70.4
%-
-0
1
0.0
695
Adv
erti
sin
g m
easu
re
Abs
olut
e 42
0
682
61.6
%-
-0
1
0.0
869
GR
P
39
5.7%
--
0
10
.135
4
Rel
ativ
e22
3 32
.7%
--
0
10
.091
0
Lag
ged
depe
nde
nt v
aria
ble
Om
it
357
682
52.3
%-
-0
1
0.1
048
Incl
uded
32
5 47
.7%
--
0
10
.076
5
Coe
ffic
ien
t of l
agge
d de
pen
den
t var
iabl
e9
- 30
7 -
45.0
%0
.46
0.3
6-0
.81
1.0
1-
Lag
ged
adve
rtis
ing
vari
able
/ st
ock
adve
rtis
-in
g va
riab
le
Om
it
437
682
64.1
%-
-0
1
0.1
097
Incl
uded
24
5 35
.9%
--
0
10
.055
2
Car
ryov
er o
f adv
. sto
ck v
aria
ble9
-
72
-10
.6%
0.5
00
.31
0
0.9
8-

BuR
- B
usin
ess
Res
earc
h O
ffic
ial O
pen
Acc
ess
Jour
nal o
f VH
B
Ger
man
Aca
dem
ic A
ssoc
iati
on fo
r B
usin
ess
Res
earc
h (V
HB
) V
olum
e 4
| Is
sue
2 |
Dec
embe
r 20
11 |
193
-239
220
Ta
ble
3 c
on
tin
ued
: D
escr
ipti
ve S
tati
stic
s o
f V
ari
ab
les
Incl
ud
ed i
n M
eta
-An
aly
sis
(3/4
)
Va
ria
ble
Ca
tego
ry
Lev
el
N
Su
m N
%
M
ean
7 S
td D
ev7
Min
7 M
ax7
N
aïv
e C
urr
ent-
Per
iod
E
last
icit
y P
red
icti
on
8 [N
=6
59
]
Pri
ce
Om
it
170
68
224
.9%
--
0
10
.118
4
In
clud
ed
512
75.1
%-
-0
1
0.0
817
Qua
lity
Om
it
618
68
290
.6%
--
0
10
.08
01
In
clud
ed
64
9.4%
--
0
10
.198
8
Com
peti
tion
O
mit
10
7 68
215
.7%
--
0
10
.18
05
In
clud
ed
575
84.
3%-
-0
1
0.0
745
Inte
ract
ion
eff
ects
Om
it
552
682
80
.9%
--
0
10
.097
2
Incl
uded
13
0
19.1
%-
-0
1
0.0
644
Inte
rcep
t O
mit
91
68
213
.3%
--
0
10
.08
47
In
clud
ed
591
86.
7%-
-0
1
0.0
921
Fun
ctio
nal
form
Sh
are
122
682
17.9
%-
-0
1
0.0
819
D
oubl
e-lo
g 39
8
58.4
%-
-0
1
0.0
826
L
inea
r 73
10
.7%
--
0
10
.094
8
Se
mi-
log
and
oth
ers
89
13.0
%-
-0
1
0.1
533

BuR
- B
usin
ess
Res
earc
h O
ffic
ial O
pen
Acc
ess
Jour
nal o
f VH
B
Ger
man
Aca
dem
ic A
ssoc
iati
on fo
r B
usin
ess
Res
earc
h (V
HB
) V
olum
e 4
| Is
sue
2 |
Dec
embe
r 20
11 |
193
-239
221
Ta
ble
3 c
on
tin
ued
: D
escr
ipti
ve S
tati
stic
s o
f V
ari
ab
les
Incl
ud
ed i
n M
eta
-An
aly
sis
(4/4
)
Va
ria
ble
Ca
tego
ry
Lev
el
N
Su
m N
%
M
ean
7 S
td D
ev7
Min
7 M
ax7
N
aïv
e C
urr
ent-
Per
iod
E
last
icit
y P
red
icti
on
8 [N
=6
59
]
Est
imat
ion
met
hod
Ord
inar
y le
ast s
quar
es29
7 68
243
.5%
--
0
10
.08
67
O
ther
leas
t squ
ares
ap-
proa
ches
18
2 26
.7%
--
0
10
.10
32
M
axim
um li
kelih
ood
164
24.0
%-
-0
1
0.0
708
O
ther
39
5.
7%-
-0
1
0.1
691
En
doge
nei
ty
Not
acc
oun
ted
for
603
682
88
.4%
--
0
10
.08
49
A
ccou
nte
d fo
r 79
11
.6%
--
0
10
.139
3
Het
erog
enei
ty in
adv
erti
sin
g co
effi
cien
t N
ot a
ccou
nte
d fo
r 64
8
682
95.0
%-
-0
1
0.0
839
A
ccou
nte
d fo
r 34
5.
0%
--
0
10
.231
3
Pub
licat
ion
type
P
ublis
hed
642
682
94.1
%-
-0
1
0.0
876
U
npub
lishe
d 40
5.
9%-
-0
1
0.1
450
Pub
licat
ion
out
let
Not
mar
keti
ng-
rela
ted
163
682
23.9
%-
-0
1
0.0
912
M
arke
tin
g-re
late
d 51
9 76
.1%
--
0
10
.091
0
Pub
licat
ion
outl
et r
anki
ng
PF
I 68
2 68
210
0.0
%0
.37
0.4
10
.01
1-
Adv
erti
sin
g ef
fect
iven
ess
focu
s N
o 79
68
211
.6%
--
0
10
.067
0
Y
es
603
88
.4%
--
0
10
.094
3
7 M
ean
, Std
Dev
, Min
, Max
are
rou
nde
d to
two
deci
mal
poi
nts
. 8 T
he te
rm “
Naï
ve E
last
icit
y P
redi
ctio
n”
indi
cate
s th
e m
ean
cur
ren
t-pe
riod
ela
stic
ity
valu
e.
9 N
ot in
clud
ed in
met
a-re
gres
sion
.
BuR - Business Research Official Open Access Journal of VHB German Academic Association for Business Research (VHB) Volume 4 | Issue 2 | December 2011 | 193-239
222
presented in section 4.4 and in Web Appendix 4, column E. In addition, we provide the estimation results of three alternative model specifications. First, those of an ordinary least squares (OLS) benchmark model (Web Appendix 4, column D) which serves two purposes: (i) a direct comparison of our results with the OLS-based findings of Assmus, Farley, and Lehmann (1984); and (ii) the opportunity to inves-tigate the effect of hierarchical modeling on the significance of effects by comparing the results of this benchmark OLS model with those of our main hierarchical model M1. Second, we present the es-timation results of an alternative hierarchical model M2 (Table 4 and Web Appendix 4, column L). In comparison to our main hierarchical model M1, M2 includes six additional interaction terms that could potentially impact advertising elasticity magnitude and were identified based on a literature search (Albers, Mantrala, and Sridhari 2010; Bijmolt, Van Heerde, and Pieters 2005; Kremer, Bijmolt, Leeflang, and Wieringa 2008; Sethuraman, Tellis, and Briesch 2011; Tellis 1988). Specifically, we test for the effects of the following six interaction effects: (i) Advertising medium type x Region (ii) Advertising medium type x Mean-centered
mean year of data collection (iii) Stage in product life cycle x Specification of
dependent measure (iv) Stage in product life cycle x Temporal data
aggregation (v) Temporal data aggregation x Omission of
lagged dependent variable (vi) Temporal data aggregation x Omission of
lagged/stock advertising variable Third and lastly, also for the hierarchical model including interaction effects (M2), the results of the respective OLS model are presented in Web Appen-dix 4 (column K) to investigate the effect of hierar-chical modeling on the significance of effects. As noted before, the results of our main model M1 along with selected findings of the alternative mod-els are discussed in section 4.4. A complete overview of all estimation results is available from Web Ap-pendix 4.
4.3 Robustness Checks In order to test the robustness of model M1, we perform a number of analyses. First, we test an
alternative hierarchical effect, i.e., a random da-taset-level intercept instead of the random study-level intercept. Due to the high correlation between these two variables (r = 0.98), the alternative speci-fication yields almost identical results which is why we stick with the common random study-level in-tercept. Second, we carefully test for multicollineari-ty. We analyze bivariate correlations, VIF values, and condition indices. The correlation matrix pro-vided in Web Appendix 5 reveals that no absolute bivariate correlation exceeds an absolute value of 0.67 and only seven entries have an absolute value larger than 0.5 (a level below the one reported by Bijmolt, Van Heerde, and Pieters 2005). A maxi-mum VIF value of 5.38 (variable: estimation ML), only two variables (excluding the intercept) with a proportion of variation >0.5, and a condition index of 23.2 (excluding the intercept) indicate a moderate level of multicollinearity, which is comparable to other meta-analyses (e.g., Albers, Mantrala, and Sridhar 2010; Kremer, Bijmolt, Leeflang, and Wieringa 2008). We decide to keep the five varia-bles that are indicated by multicollinearity checks (absolute bivariate correlations >0.5; indicated vari-ables are: mean year of data collection, competition omitted, estimation method ML, not accounted for endogeneity, publication type unpublished; Web Appendix 5) in the meta-analysis due to their inter-esting nature and to enable comparison to prior generalization studies. This decision is affirmed by further robustness checks, i.e., the model is system-atically validated by excluding each of the five varia-bles from the analysis one at a time, as suggested by Sethuraman, Tellis, and Briesch (2011). Doing so does not lead to substantial changes in the estimat-ed regression parameters (Web Appendix 4, models M1a-M1e, columns F-J). For the hierarchical model M2, we find higher levels of multicollinearity due to the inclusion of the inter-action effects described above. The maximum VIF increases to 10.6 (variable: temporal aggregation yearly), and the condition index rises to 24.5, while one variance proportion exceeds 0.5 (again both excluding the intercept). However, the inclusion of interaction effects does not unexpectedly change the parameter estimates of the other variables (Web Appendix 4). Therefore, we trust that the level of multicollinearity remains moderate. In sum, the stability tests affirm that the models are robust and

BuR - Business Research Official Open Access Journal of VHB German Academic Association for Business Research (VHB) Volume 4 | Issue 2 | December 2011 | 193-239
223
that we find no substantial effects caused by multi-collinearity.
4.4 Model Fit Table 4 provides the estimation results, including the estimates’ lower and upper bounds (90% confi-dence interval) for the models M1 and M2. The overall fit of the models is good: R2Model 1 =
0.43 and R2Model 2 = 0.46 (R2 have been obtained
using OLS). Other meta-analyses provide substan-tially smaller model fits (for an overview see Albers, Mantrala, and Sridhar 2010: 848). In comparison to the advertising elasticity meta-study by Sethu-raman, Tellis, and Briesch (2011), the following variables are not coded or do not turn out to exert a major impact on advertising elasticity in our study: recession, product-type services, region non-US/Canada, data aggregation, lagged price, promo-tion, and distribution. The additional explanatory variables used in our meta-study are: product-type entertainment media, reference frame, usage of intercept in empirical studies, competition, usage of interaction effects in empirical studies, and three publication characteristics, namely marketing-relatedness of publication outlet, ranking of publica-tion outlet, and focus of study on advertising effec-tiveness topic. In addition, the interaction effects employed in the two meta-analyses differ. Turning back to our models M1 and M2, we find twelve significant determinants of advertising elas-ticity in both models (two-sided tests in contrast to Sethuraman, Tellis, and Briesch 2011). Compared to 23 and 21 significant effects in the respective OLS benchmark models (Web Appendix 4, columns D and K, respectively), this is a substantial decrease. This effect is not surprising, though, because in the OLS models the determinants’ values for all 682 elasticities are treated as being independent obser-vations. In reality, however, higher (study)-level variables (such as the mean year of data collection) are identical for all elasticities derived from one study. This effect is filtered out by hierarchical mod-eling (Bijmolt and Pieters 2001), resulting in fewer significant variables.
4.5 Discussion of Estimation Results In the following, the results of our main model M1 are discussed. Results of alternative models are selectively embedded. All reported estimation re-sults relate to Table 4 and/or Web Appendix 4.
Current versus long-term effects As expected, and consistent with Sethuraman, Tel-lis, and Briesch (2011), we find higher long-term elasticities (mean = 0.19) than current-period elas-ticities (mean = 0.09). This descriptive finding is reflected in the highly significant regression param-eter (0.25, p<0.01) for the long-term elasticity dummy in model M1. The effect is not influenced by the inclusion of interaction effects in model M2.
Advertising medium Table 3 shows that 35.9% of the 682 adverting elas-ticities included in the meta-analysis are based on TV advertising, 19.1% on print or direct mail adver-tising, and 45.0% on aggregate advertising. H1a (H1b) suggests that advertising elasticities are smaller for aggregate (print and direct mail) than for TV advertising. However, the regression results indicate no significant difference in the impacts of the different advertising media on advertising elas-ticity. Whereas our finding is consistent with the result of Assmus, Farley, and Lehmann (1984), it conflicts with Sethuraman, Tellis, and Briesch (2011), who found that TV advertising elasticity is significantly higher than that of aggregate advertis-ing, which is in turn higher than that of general print advertising in the short run. Thus, our results do not support their empirical generalization. The interaction effects of the advertising medium print and direct mail with (i) non-US/Canadian markets and (ii) the mean-centered mean year of data collec-tion are also not significant.
Product determinants We test the effects of three product determinants: product type, the stage in the product life cycle, and the region in which the product was marketed. Product type: We analyze five product categories: drugs (5.3%), durables (5.7%), entertainment media (2.1%), food (39.7%), and non-food and other prod-ucts (47.2%). We find that advertising for enter-tainment media products has a significantly higher elasticity (regression parameter = 0.19, p<0.1) than does advertising for the non-food and other prod-uct-type category, which serves as the base category. The marginally significant effect diminishes with the inclusion of interaction effects (model M2). Howev-er, the finding of model M1 is consistent with H2a, which suggests higher elasticities for hedonic and experience goods than for non-food and other prod-uct types. Thus, advertising plays a major role in reducing uncertainty prior to consumption.

BuR
- B
usin
ess
Res
earc
h O
ffic
ial O
pen
Acc
ess
Jour
nal o
f VH
B
Ger
man
Aca
dem
ic A
ssoc
iati
on fo
r B
usin
ess
Res
earc
h (V
HB
) V
olum
e 4
| Is
sue
2 |
Dec
embe
r 20
11 |
193
-239
224
Ta
ble
4:
Est
ima
tio
n R
esu
lts
(1/7
)
Va
r.
Typ
e10
Va
ria
ble
C
ate
go
ry
Me
ta-
Re
gre
ssio
n
Va
ria
ble
s
Hy
po
the
sis
H
yp
oth
esi
s co
nfi
rme
d
by
M1?
Eff
ects
(S
ign
ific
an
ce)
fou
nd
by
Hie
rarc
hic
al
Mo
de
l (M
1)
Hie
rarc
hic
al
Mo
de
l in
clu
din
g
Inte
ract
ion
Eff
ect
s (M
2)
Ass
mu
s,
Fa
rley
, Leh
-m
ann
19
84
Set
hu
ram
an
, T
elli
s,
Bri
esch
20
11
Est
ima
te (
se)1
1 L
ower
bo
un
d
Up
per
bo
un
d
Est
ima
te (
se)1
1L
ower
bo
un
d
Up
per
bo
un
d
INT
In
terc
ept
-
- -
- -
0.0
5 (0
.10
) -0
.14
0.2
5 0
.07
(0.1
0)
-0.1
20
.27
CP
/ L
T
Ind
ica
tor
Cur
ren
t-pe
riod
(B
ase)
-
[Mea
n c
urr.
-pe
r. e
last
.: 0
.09
(N=
659)
, m
ean
lon
g-te
rm e
last
.: 0
.19
(N=
23)]
[Mea
n s
hor
t-te
rm e
last
icit
y:
0.2
2 (N
=12
8)]
[Mea
n s
hor
t-ru
n e
last
icit
y:
0.1
2 (N
=75
1),
mea
n lo
ng-
term
ela
stic
ity:
0
.24
(N=
402)
]
- -
- -
- -
Lon
g-te
rm
0.2
5 (0
.06)
***
0.1
3 0
.37
0.2
4 (0
.06)
***
0.1
20
.36
AD
A
dve
rtis
ing
med
ium
T
V (B
ase)
H
1a:
Agg
rega
te a
dver
tis-
ing
< T
V
H1b
: P
rin
t an
d di
rect
mai
l <
TV
H1a
: (n
.s.)
H
1b:
(n.s
.)
Agg
rega
te >
T
V (n
.s.)
T
V >
Agg
rega
te >
P
rin
t (si
gn.)
- -
- -
- -
Pri
nt a
nd d
irec
t m
ail
-0.0
2 (0
.03)
-0
.08
0
.05
-0.0
3 (0
.04)
-0.1
1 0
.05
Agg
rega
te a
dv.
0.0
1 (0
.03)
-0.0
5 0
.07
0.0
3 (0
.03)
-0.0
40
.09
PD
P
rod
uct
typ
e N
on-f
ood
and
othe
r go
ods
(Bas
e)
H2a
: H
edon
ic a
nd
expe
ri-
ence
goo
ds >
Non
-fo
od a
nd
oth
er
good
s H
2b:
Dur
able
s >
Non
-fo
od a
nd
oth
er
good
s
H2a
: ye
s (s
ign
.)
H2b
: (n
.s.)
Foo
d >
Oth
ers
(sig
n.)
D
urab
les
>
Dru
gs >
Foo
d an
d ot
her
s (s
ign
.)
- -
- -
- -
Dru
gs
-0.0
3 (0
.07)
-0.1
9 0
.12
0.0
1 (0
.07)
-0.1
40
.16
Dur
able
s 0
.03
(0.0
3)
-0.0
2 0
.09
0.0
3 (0
.03)
-0.0
20
.09

BuR
- B
usin
ess
Res
earc
h O
ffic
ial O
pen
Acc
ess
Jour
nal o
f VH
B
Ger
man
Aca
dem
ic A
ssoc
iati
on fo
r B
usin
ess
Res
earc
h (V
HB
) V
olum
e 4
| Is
sue
2 |
Dec
embe
r 20
11 |
193
-239
225
Ta
ble
4 c
on
tin
ued
: E
stim
ati
on
Res
ult
s (2
/7)
Va
r.
Typ
e10
Va
ria
ble
C
ate
go
ry
Me
ta-
Re
gre
ssio
n
Va
ria
ble
s
Hy
po
the
sis
H
yp
oth
esi
s co
nfi
rme
d
by
M1?
Eff
ects
(S
ign
ific
an
ce)
fou
nd
by
Hie
rarc
hic
al
Mo
de
l (M
1)
Hie
rarc
hic
al
Mo
de
l in
clu
din
g
Inte
ract
ion
Eff
ect
s (M
2)
Ass
mu
s,
Fa
rley
, Leh
-m
ann
19
84
Set
hu
ram
an
, T
elli
s,
Bri
esch
20
11
Est
ima
te (
se)1
1 L
ower
bo
un
d
Up
per
bo
un
d
Est
ima
te (
se)1
1L
ower
bo
un
d
Up
per
bo
un
d
PD
P
rod
uct
typ
e (c
on
tin
ued
) E
nte
rtai
nm
ent
med
ia
H2a
: H
edon
ic a
nd
expe
ri-
ence
goo
ds >
Non
-fo
od a
nd
oth
er
good
s H
2b:
Dur
able
s >
Non
-fo
od a
nd
oth
er
good
s
H2a
: ye
s (s
ign
.)
H2b
: (n
.s.)
Foo
d >
Oth
ers
(sig
n.)
D
urab
les
>
Dru
gs >
Foo
d an
d ot
her
s (s
ign
.)
0.1
9 (0
.10
)*
0.0
00
.39
0.1
3 (0
.11)
-0
.09
0.3
4
Foo
d -0
.01
(0.0
2)
-0.0
4 0
.03
-0.0
04
(0.0
2)-0
.04
0.0
3
PD
S
tage
in
pro
du
ct li
fe
cycl
e
Est
ablis
hed
(Bas
e)
H3:
N
ew >
Est
ablis
hed
ye
s (s
ign
.)
[Exp
ecte
d to
be
hig
her
for
earl
y ph
ase
but s
ampl
e to
o sm
all f
or s
ign
. te
sts.
]
Mat
ure
<
Gro
wth
(sig
n.)
-
--
- -
-
New
0
.18
(0
.04)
***
0.1
00
.26
-0.0
1 (0
.05)
-0.1
10
.09
PD
R
egio
n
USA
/Can
ada
(Bas
e)
H4:
R
est o
f wor
ld <
U
SA/C
anad
a
(n.s
.)E
urop
e >
US
(sig
n.)
E
urop
e >
A
mer
ica
(sig
n.)
- -
- -
- -
Res
t of w
orld
-0
.02
(0.0
4)
-0.1
0
0.0
7 -0
.00
4 (0
.04)
-0.0
90
.08
DD
R
efer
ence
fr
am
e C
ross
-sec
tion
al
or p
anel
dat
a (B
ase)
- -
Poo
led
data
(i
ncl
. cro
ss-
sect
ion
s) >
T
ime-
seri
es
(sig
n.)
- -
--
- -
-
Lon
gitu
din
al
data
0
.00
02
(0.0
2)-0
.04
0.0
4 0
.01
(0.0
2)
-0.0
3 0
.04
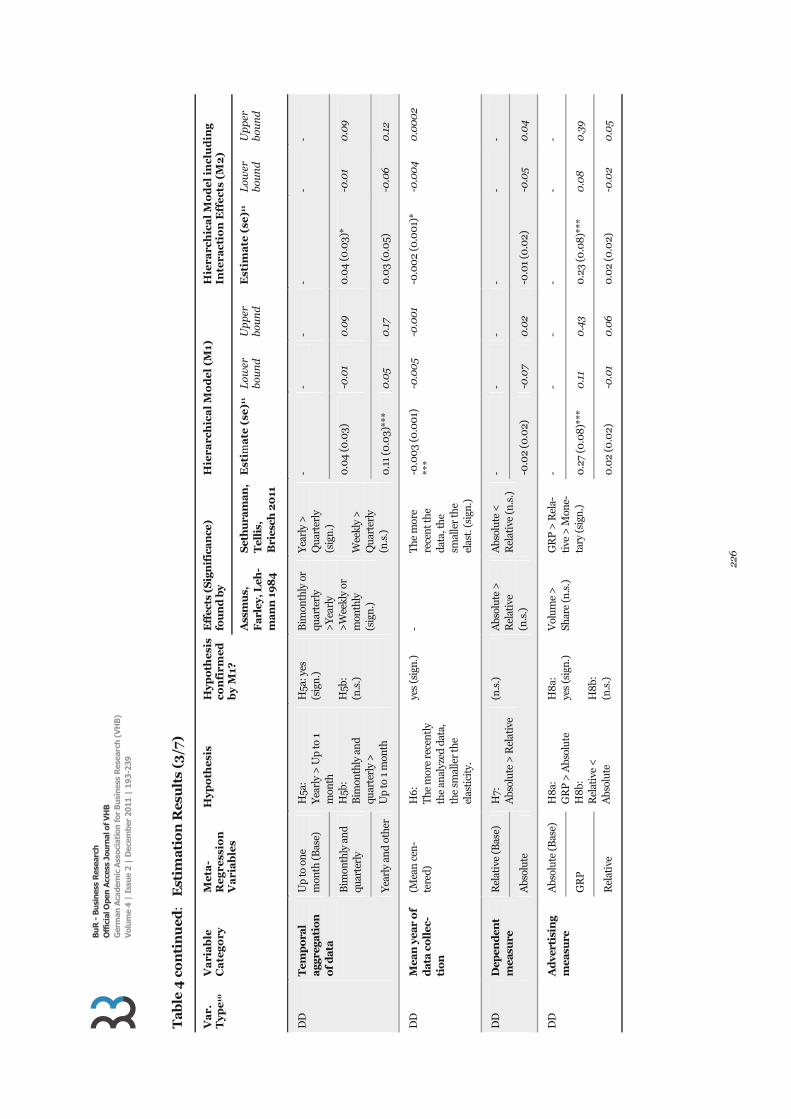
BuR
- B
usin
ess
Res
earc
h O
ffic
ial O
pen
Acc
ess
Jour
nal o
f VH
B
Ger
man
Aca
dem
ic A
ssoc
iati
on fo
r B
usin
ess
Res
earc
h (V
HB
) V
olum
e 4
| Is
sue
2 |
Dec
embe
r 20
11 |
193
-239
226
Ta
ble
4 c
on
tin
ued
: E
stim
ati
on
Res
ult
s (3
/7)
Va
r.
Typ
e10
Va
ria
ble
C
ate
go
ry
Me
ta-
Re
gre
ssio
n
Va
ria
ble
s
Hy
po
the
sis
H
yp
oth
esi
s co
nfi
rme
d
by
M1?
Eff
ects
(S
ign
ific
an
ce)
fou
nd
by
Hie
rarc
hic
al
Mo
de
l (M
1)
Hie
rarc
hic
al
Mo
de
l in
clu
din
g
Inte
ract
ion
Eff
ect
s (M
2)
Ass
mu
s,
Fa
rley
, Leh
-m
ann
19
84
Set
hu
ram
an
, T
elli
s,
Bri
esch
20
11
Est
ima
te (
se)1
1 L
ower
bo
un
d
Up
per
bo
un
d
Est
ima
te (
se)1
1L
ower
bo
un
d
Up
per
bo
un
d
DD
T
emp
ora
l a
ggre
gati
on
o
f d
ata
Up
to o
ne
mon
th (B
ase)
H
5a:
Yea
rly
> U
p to
1
mon
th
H5b
: B
imon
thly
an
d qu
arte
rly
>
Up
to 1
mon
th
H5a
: yes
(s
ign
.)
H5b
: (n
.s.)
Bim
onth
ly o
r qu
arte
rly
>Y
earl
y >
Wee
kly
or
mon
thly
(s
ign
.)
Yea
rly
>
Qua
rter
ly
(sig
n.)
W
eekl
y >
Q
uart
erly
(n
.s.)
- -
- -
- -
Bim
onth
ly a
nd
quar
terl
y
0.0
4 (0
.03)
-0
.01
0.0
9 0
.04
(0.0
3)*
-0.0
1 0
.09
Yea
rly
and
othe
r 0
.11
(0.0
3)**
*0
.05
0.1
7 0
.03
(0.0
5)
-0.0
60
.12
DD
M
ean
yea
r o
f d
ata
co
llec
-ti
on
(Mea
n c
en-
tere
d)
H6:
T
he m
ore
rece
ntl
y th
e an
alyz
ed d
ata,
th
e sm
alle
r th
e el
asti
city
.
yes
(sig
n.)
-
The
mor
e re
cen
t th
e da
ta, t
he
smal
ler
the
elas
t. (
sign
.)
-0.0
03
(0.0
01)
***
-0.0
05
-0.0
01
-0.0
02
(0.0
01)
*-0
.00
40
.00
02
DD
D
epen
den
t m
easu
re
Rel
ativ
e (B
ase)
H
7:
Abs
olut
e >
Rel
ativ
e (n
.s.)
A
bsol
ute
>
Rel
ativ
e (n
.s.)
Abs
olut
e <
Rel
ativ
e (n
.s.)
-
- -
- -
-
Abs
olut
e -0
.02
(0.0
2)
-0.0
70
.02
-0.0
1 (0
.02)
-0
.05
0.0
4
DD
A
dve
rtis
ing
mea
sure
A
bsol
ute
(Bas
e)
H8
a:
GR
P >
Abs
olut
e H
8b:
R
elat
ive
<
Abs
olut
e
H8
a:ye
s (s
ign
.)
H8
b:
(n.s
.)
Vol
ume
>
Shar
e (n
.s.)
G
RP
> R
ela-
tive
> M
one-
tary
(si
gn.)
- -
- -
- -
GR
P
0.2
7 (0
.08
)***
0
.11
0.4
3 0
.23
(0.0
8)*
**0
.08
0
.39
Rel
ativ
e 0
.02
(0.0
2)
-0.0
1 0
.06
0.0
2 (0
.02)
-0.0
20
.05

BuR
- B
usin
ess
Res
earc
h O
ffic
ial O
pen
Acc
ess
Jour
nal o
f VH
B
Ger
man
Aca
dem
ic A
ssoc
iati
on fo
r B
usin
ess
Res
earc
h (V
HB
) V
olum
e 4
| Is
sue
2 |
Dec
embe
r 20
11 |
193
-239
227
Ta
ble
4 c
on
tin
ued
: E
stim
ati
on
Res
ult
s (4
/7)
Va
r.
Typ
e10
Va
ria
ble
C
ate
go
ry
Me
ta-
Re
gre
ssio
n
Va
ria
ble
s
Hy
po
the
sis
H
yp
oth
esi
s co
nfi
rme
d
by
M1?
Eff
ects
(S
ign
ific
an
ce)
fou
nd
by
Hie
rarc
hic
al
Mo
de
l (M
1)
Hie
rarc
hic
al
Mo
de
l in
clu
din
g
Inte
ract
ion
Eff
ect
s (M
2)
Ass
mu
s,
Fa
rley
, Leh
-m
ann
19
84
Set
hu
ram
an
, T
elli
s,
Bri
esch
20
11
Est
ima
te (
se)1
1 L
ower
bo
un
d
Up
per
bo
un
d
Est
ima
te (
se)1
1L
ower
bo
un
d
Up
per
bo
un
d
CE
L
agg
ed d
e-p
end
ent
vari
ab
le
Incl
uded
(Bas
e)
H9:
L
agge
d de
pen
den
t va
riab
le o
mit
. >
Lag
ged
depe
nde
nt
vari
able
incl
.
yes
(sig
n.)
O
mit
ted
>
Incl
uded
(s
ign
.)
Om
itte
d >
In
clud
ed
(sig
n.)
- -
- -
- -
Om
itte
d 0
.06
(0.0
2)**
* 0
.03
0.0
9 0
.01
(0.0
2)
-0.0
3 0
.05
CE
L
agg
ed o
r st
ock
ad
ver-
tisi
ng
vari
a-
ble
Incl
uded
(Bas
e)
H10
: L
agge
d/
stoc
k ad
v. o
mit
. >
Lag
ged/
st
ock
adv.
incl
.
yes
(sig
n.)
-
Lag
ged
adv.
om
it. >
L
agge
d ad
v.
incl
.(n
.s.)
- -
- -
- -
Om
itte
d 0
.06
(0.0
2)**
* 0
.02
0.0
9 0
.04
(0.0
2)*
-0.0
02
0.0
78
MD
P
rice
In
clud
ed (B
ase)
H
11:
Pri
ce o
mit
. < P
rice
in
cl.
(n.s
.)
Incl
uded
>
Om
itte
d (n
.s.)
Om
itte
d <
In
clud
ed (n
.s.)
-
- -
- -
-
Om
itte
d 0
.01
(0.0
2)-0
.03
0.0
5 0
.01
(0.0
2)
-0.0
3 0
.04
MD
Q
ua
lity
In
clud
ed (B
ase)
H
12:
Qua
lity
omit
. <
Qua
lity
incl
.
yes
(sig
n.)
-
Om
itte
d<
Incl
uded
(n.s
.)
- -
- -
- -
Om
itte
d -0
.05
(0.0
2)**
-0.0
94
-0.0
02
-0.0
6 (0
.02)
**-0
.10
-0
.01
MR
D
Co
mp
etit
ion
In
clud
ed (B
ase)
H
13:
Com
peti
tion
om
it. >
C
ompe
titi
on in
cl.
yes
(sig
n.)
-
- -
- -
- -
-
Om
itte
d 0
.08
(0
.03)
***
0.0
2 0
.13
0.0
6 (0
.03)
**0
.01
0.1
1
IE E
MP
. In
tera
ctio
n
effe
cts
(IE
) In
clud
ed (B
ase)
H
14:
IE o
mit
. <
IE in
cl.
(n.s
.)
- -
- -
- -
- -
Om
itte
d 0
.03
(0.0
4)
-0.0
6 0
.12
0.0
1 (0
.04)
-0
.08
0.0
9

BuR
- B
usin
ess
Res
earc
h O
ffic
ial O
pen
Acc
ess
Jour
nal o
f VH
B
Ger
man
Aca
dem
ic A
ssoc
iati
on fo
r B
usin
ess
Res
earc
h (V
HB
) V
olum
e 4
| Is
sue
2 |
Dec
embe
r 20
11 |
193
-239
228
Ta
ble
4 c
on
tin
ued
: E
stim
ati
on
Res
ult
s (5
/7)
Va
r.
Typ
e10
Va
ria
ble
C
ate
go
ry
Me
ta-
Re
gre
ssio
n
Va
ria
ble
s
Hy
po
the
sis
H
yp
oth
esi
s co
nfi
rme
d
by
M1?
Eff
ects
(S
ign
ific
an
ce)
fou
nd
by
Hie
rarc
hic
al
Mo
de
l (M
1)
Hie
rarc
hic
al
Mo
de
l in
clu
din
g
Inte
ract
ion
Eff
ect
s (M
2)
Ass
mu
s,
Fa
rley
, Leh
-m
ann
19
84
Set
hu
ram
an
, T
elli
s,
Bri
esch
20
11
Est
ima
te (
se)1
1 L
ower
bo
un
d
Up
per
bo
un
d
Est
ima
te (
se)1
1L
ower
bo
un
d
Up
per
bo
un
d
ED
In
terc
ept
Incl
uded
(Bas
e)
- -
- -
- -
- -
- -
Om
itte
d 0
.04
(0.0
3)
-0.0
3 0
.10
0.0
1 (0
.03)
-0
.05
0.0
7
ED
F
un
ctio
na
l fo
rm o
f m
od
-el
Dou
ble-
log
(Bas
e)
- -
Add
itiv
e >
D
oubl
e-lo
g (s
ign
.)
Lin
ear
> O
ther
>
Dou
ble-
log
> S
hare
(si
gn.)
- -
- -
- -
Shar
e -0
.00
2 (0
.03)
-0
.07
0.0
6 0
.01
(0.0
3)
-0.0
50
.08
Lin
ear
0.0
1 (0
.03)
-0.0
5 0
.07
0.0
1 (0
.03)
-0
.05
0.0
7
Sem
i-lo
g/ot
her
0.0
5 (0
.03)
* -0
.01
0.1
00
.05
(0.0
3)*
0.0
0
0.1
1
ED
E
stim
ati
on
m
eth
od
O
LS
(Bas
e)
- -
Non
linea
r si
ngl
e eq
ua-
tion
s >
Mul
ti-
ple-
step
sin
gle
equa
tion
s (n
.s.)
ML
> O
LS
>
Oth
er >
GL
S (n
.s.)
- -
- -
- -
Lea
st s
quar
es
(wit
hout
OL
S)
-0.0
2 (0
.02)
-0
.06
0.0
1-0
.02
(0.0
2)-0
.05
0.0
1
ML
-0
.01
(0.0
4)
-0.1
0
0.0
7 -0
.01
(0.0
4)
-0.1
0
0.0
7
Oth
er
0.0
7 (0
.08
) -0
.08
0
.23
0.0
9 (0
.08
) -0
.07
0.2
4
ED
A
cco
un
ted
fo
r en
do
ge-
nei
ty
Yes
(B
ase)
H
15:
En
doge
nei
ty n
ot a
cc.
for
< E
ndo-
gene
ity
acc.
for
(n.s
.)
-O
mit
ted
<
Incl
uded
(s
ign
.)
- -
- -
- -
No
0.0
6 (0
.04)
-0
.02
0.1
3 0
.05
(0.0
4)
-0.0
3 0
.13

BuR
- B
usin
ess
Res
earc
h O
ffic
ial O
pen
Acc
ess
Jour
nal o
f VH
B
Ger
man
Aca
dem
ic A
ssoc
iati
on fo
r B
usin
ess
Res
earc
h (V
HB
) V
olum
e 4
| Is
sue
2 |
Dec
embe
r 20
11 |
193
-239
229
Ta
ble
4 c
on
tin
ued
: E
stim
ati
on
Res
ult
s (6
/7)
Va
r.
Typ
e10
Va
ria
ble
C
ate
go
ry
Me
ta-
Re
gre
ssio
n
Va
ria
ble
s
Hy
po
the
sis
H
yp
oth
esi
s co
nfi
rme
d
by
M1?
Eff
ects
(S
ign
ific
an
ce)
fou
nd
by
Hie
rarc
hic
al
Mo
de
l (M
1)
Hie
rarc
hic
al
Mo
de
l in
clu
din
g
Inte
ract
ion
Eff
ect
s (M
2)
Ass
mu
s,
Fa
rley
, Leh
-m
ann
19
84
Set
hu
ram
an
, T
elli
s,
Bri
esch
20
11
Est
ima
te (
se)1
1 L
ower
bo
un
d
Up
per
bo
un
d
Est
ima
te (
se)1
1L
ower
bo
un
d
Up
per
bo
un
d
ED
A
cco
un
ted
fo
r h
eter
o-
gen
eity
in
ad
v. c
oef
f.
Yes
(B
ase)
-
--
Om
itte
d <
In
clud
ed
(n.s
.)
- -
- -
- -
No
-0.1
1 (0
.05)
**
-0.2
1 -0
.01
-0.1
0 (
0.0
5)*
-0.1
910
.00
1
PU
B
Pu
bli
cati
on
ty
pe
Pub
lishe
d (B
ase)
H
16:
Un
publ
ishe
d<
Pub
lishe
d
(n.s
.)
-P
ublis
hed
>
Wor
kin
g P
aper
(n.s
.)
- -
- -
- -
Un
publ
ishe
d -0
.05
(0.0
8)
-0.2
20
.12
-0.0
2 (0
.08
) -0
.18
0.1
5
PU
B
Ma
rket
ing-
rela
ted
pu
b-
lica
tio
n o
ut-
let
Yes
(B
ase)
H
17:
Non
-mar
keti
ng-
re
late
d <
Mar
ket-
ing-
rela
ted
(n.s
.)
- -
- -
- -
- -
No
0.0
3 (0
.05)
-0
.07
0.1
3 0
.03
(0.0
5)
-0.0
7 0
.13
PU
B
Ra
nk
ing
of
pu
bli
cati
on
o
utl
et
- H
18:
The
hig
her
the
ran
kin
g va
lue,
the
low
er th
e el
asti
city
.
(n.s
.)
- -
-0.0
8 (0
.06)
-0
.21
0.0
4 -0
.03
(0.0
6)-0
.16
0.0
9
PU
B
Fo
cus
of
stu
dy
on
a
dve
rtis
ing
effe
ctiv
enes
s
Yes
(B
ase)
H
19:
No
adv.
eff
ect.
fo
cus<
Adv
. eff
ect.
fo
cus
(n.s
.)
- -
- -
- -
- -
No
0.0
3 (0
.06
)-0
.08
0.1
4 0
.03
(0.0
6)
-0.0
8
0.1
4

BuR
- B
usin
ess
Res
earc
h O
ffic
ial O
pen
Acc
ess
Jour
nal o
f VH
B
Ger
man
Aca
dem
ic A
ssoc
iati
on fo
r B
usin
ess
Res
earc
h (V
HB
) V
olum
e 4
| Is
sue
2 |
Dec
embe
r 20
11 |
193
-239
230
Ta
ble
4 c
on
tin
ued
: E
stim
ati
on
Res
ult
s (7
/7)
Va
r.
Typ
e10
Va
ria
ble
C
ate
go
ry
Me
ta-R
eg
ress
ion
In
tera
c-ti
on
Va
ria
ble
s F
ind
ing
o
f M
2?
Eff
ects
(S
ign
ific
an
ce)
fou
nd
by
Hie
rarc
hic
al
Mo
de
l (M
1)
Hie
rarc
hic
al
Mo
de
l in
clu
din
g
Inte
ract
ion
Eff
ect
s (M
2)
Ass
mu
s, F
ar-
ley,
Leh
man
n
198
4
Set
hu
ra-
ma
n, T
elli
s,
Bri
esch
20
11
Est
ima
te (
se)1
1 L
ower
bo
un
d
Up
per
bo
un
d
Est
ima
te (
se)1
1 L
ower
bo
un
d
Up
per
bo
un
d
IE
ME
TA
In
tera
ctio
n
effe
cts
Adv
erti
sin
g m
ediu
m ty
pe p
rin
t an
d di
rect
mai
l x R
egio
n n
on-
US/
Can
ada
(n.s
.)
- -
- -
-0
.03
(0.0
5)
-0.0
6 0
.12
IE
ME
TA
In
tera
ctio
n
effe
cts
Adv
erti
sin
g m
ediu
m ty
pe p
rin
t an
d di
rect
mai
l x M
ean
cen
-te
red
mea
n y
ear
of d
ata
colle
c-ti
on
(n.s
.)
- -
- -
--0
.00
2 (0
.00
2)
-0.0
05
0.0
01
IE
ME
TA
In
tera
ctio
n
effe
cts
Stag
e in
pro
duct
life
cyc
le n
ew
x A
bsol
ute
depe
nde
nt m
easu
re
(sig
n.)
-
PL
C x
Abs
o-lu
te d
ep.
vari
able
: -0
.13
(sig
n.)
- -
-0
.21
(0.0
9)**
0
.04
0.3
8
IE
ME
TA
In
tera
ctio
n
effe
cts
Stag
e in
pro
duct
life
cyc
le n
ew
x Y
earl
y da
ta a
ggre
gati
on
(sig
n.)
-
--
- -
0.4
(0
.09)
***
0.2
30
.58
IE
ME
TA
In
tera
ctio
n
effe
cts
Yea
rly
data
agg
rega
tion
x
Om
itte
d la
gged
dep
ende
nt
vari
able
(sig
n.)
-
Dat
a in
terv
al
x O
mis
sion
of
lagg
ed s
ales
: (n
.s.)
- -
-0
.09
(0.0
3)**
* 0
.04
0.1
5
IE
ME
TA
In
tera
ctio
n
effe
cts
Yea
rly
data
agg
rega
tion
x
Om
itte
d la
gged
/sto
ck a
dver
tis-
ing
vari
able
(n.s
.)
- -
- -
-0
.04
(0.0
4)
-0.0
4 0
.12
10 A
D =
Adv
erti
sin
g m
edia
for
whi
ch e
last
icit
y is
val
id, C
E =
Car
ryov
er E
ffec
ts, C
P/L
T =
In
dica
tor
for
curr
ent-
peri
od/l
ong-
term
ela
stic
itie
s, D
D =
Dat
a de
term
inan
ts, E
D =
Est
imat
ion
det
erm
inan
ts, I
E E
MP
=
Inte
ract
ion
eff
ects
in e
mpi
rica
l stu
dies
, IE
ME
TA
= I
nte
ract
ion
eff
ects
in m
eta-
regr
essi
on, I
NT
= I
nte
rcep
ts in
met
a-re
gres
sion
, MD
= M
arke
tin
g de
term
inan
ts, M
RD
= M
arke
t-re
late
d de
term
inan
ts, P
D =
P
rodu
ct d
eter
min
ants
, PU
B =
Pub
licat
ion
det
erm
inan
ts.
11 G
iven
are
: E
stim
ates
, (st
anda
rd e
rror
s), a
nd
the
sign
ific
ance
leve
ls w
here
***
: p<
0.0
1; *
*: p
<0
.05;
*:
p<0
.1 (
two-
side
d).

BuR - Business Research Official Open Access Journal of VHB German Academic Association for Business Research (VHB) Volume 4 | Issue 2 | December 2011 | 193-239
231
However, we do not find empirical support for H2b, which suggests that durables have a higher elasticity than the base category does. Contrary to prior re-search (Sethuraman, Tellis, and Briesch 2011), the durable goods in this study’s database do not re-spond considerably more elastically to advertising than other product categories do. Stage in product life cycle: Consistent with H3, we find that advertising elasticities are significantly higher for products in an early stage of the life cycle (6.9% in our sample) than for more established products (regression parameter = 0.18, p<0.01).While this effect disappears in model M2, two significant positive interactions of the early life cycle stage could be detected, i.e., (i) with an abso-lute dependent measure (regression parameter = 0.21, p<0.05) and (ii) with a yearly data aggregation (regression parameter = 0.4, p<0.01). Thus, con-sistent with Sethuraman, Tellis, and Briesch (2011) and Vakratsas and Ambler (1999), we find that ad-vertising for new products is more effective than advertising in later stages of the product life cycle. Region: The geographical distribution of the includ-ed elasticities is almost even; 46.6% of the elastici-ties are from US or Canadian markets, 53.4% from the rest of the world. We find no support for differ-ences in elasticity magnitudes with respect to where the data stem from (H4). Our finding weakens prior generalizations by Assmus, Farley, and Lehmann (1984) and Sethuraman, Tellis, and Briesch (2011), who found significantly stronger advertising effects in Europe.
Data determinants We test the influence of five data determinants: reference frame, temporal aggregation of data, mean year of data collection, measurement of the dependent variable, and the advertising measure. Reference frame: The distribution of elasticities with regard to the data structure is almost even. A total of 47.9% (52.1%) of the elasticities are based on a longitudinal (cross-sectional or panel) reference frame. Our regression results indicate that the refer-ence frame (which we treat as a control variable without prior hypothesis) does not significantly influence the advertising elasticity. Temporal aggregation: Most of the elasticities are derived based on data aggregated up to one month (53.7%), whereas aggregation to bimonthly and quarterly (22.1%) and yearly and other intervals (24.2%) are less common. Consistent with H5a, we
find in M1 that elasticities that are estimated based on yearly data are significantly larger than those based on monthly data, i.e., yearly aggregation has a significant positive effect on advertising elasticities (regression coefficient = 0.11, p<0.01). However, H5b cannot be supported; elasticities based on quarterly or bimonthly data do not significantly differ from those based on data aggregated at a monthly level. The reverse is true for the interaction model M2; H5b is supported while H5a is not. This is not surprising, though, because the influence of a yearly temporal aggregation is captured by three interactions (with early product life cycle stage, omitted lagged dependent variable, and omitted lagged/ stock advertising variable) which are all significant in model M2. Overall, we, in line with other studies such as Tellis (2005), find that adver-tising elasticities increase with increasing temporal aggregation. Mean year of data collection: Consistent with H6, we find that studies analyzing more recent data yield lower elasticities. Thus, the effectiveness of advertising is decreasing over time (regression coef-ficient -0.003, p<0.01). This finding, which is valid also for interaction model M2, is in line with Sethu-raman, Tellis, and Briesch (2011). Dependent measure: About 70.4% of the estimated elasticities are derived using a relative dependent measure. In H7, we suggest that advertising elastici-ties derived from models using absolute dependent measures are higher than elasticities derived from models using relative dependent measures are. Consistent with Assmus, Farley, and Lehmann (1984) and Sethuraman, Tellis, and Briesch (2011), we do not find a significant impact of the dependent measure on advertising elasticities. As mentioned above, however, the interaction between an early stage in the product life cycle and an absolute de-pendent measure has a significant positive effect on advertising elasticity. Advertising measure: The majority of the elastici-ties is estimated using an absolute (61.6%) or rela-tive (32.7%) advertising measure, whereas gross rating points (GRP) remain an exception (5.7%). Consistent with Sethuraman, Tellis, and Briesch (2011), we find that advertising elasticities estimated from models using GRP as advertising measure are higher than elasticities derived using absolute measures (H8a, regression coefficient = 0.27, p<0.01). However, H8b cannot be supported be-cause the respective regression coefficient is positive

BuR - Business Research Official Open Access Journal of VHB German Academic Association for Business Research (VHB) Volume 4 | Issue 2 | December 2011 | 193-239
232
but not significant. Thus, elasticities derived from models using relative advertising measures are not significantly smaller than those based on absolute measures. Both results remain in model M2.
Carryover effects We analyze two kinds of carryover effects: First, we focus on the lagged dependent variable, and second, we analyze the effect of lagged or stock advertising variables. Lagged dependent variable: 52.3% of the elastici-ties in our meta-analysis are derived by models that do not consider a lagged dependent variable. H9 hypothesizes that advertising elasticities from mod-els that do not include a lagged dependent variable are higher than elasticities derived from models that account for this type of dynamic effect. This hypoth-esis is supported (regression coefficient = 0.06, p<0.01) and confirms the prior findings of Assmus, Farley, and Lehmann (1984) and Sethuraman, Tel-lis, and Briesch (2011). As mentioned above, the interaction between yearly data and the omission of the lagged dependent variable also positively im-pacts advertising elasticity in model M2. Lagged or stock advertising variable: The same logic applies to the omission of lagged or stock ad-vertising from a model (64.1% of all cases). As sug-gested in H10, we expect significantly higher cur-rent-period advertising elasticity estimates when lagged or stock advertising variables are omitted. While Sethuraman, Tellis, and Briesch (2011) failed to provide support for this hypothesis, we find a significant effect of omitting lagged or stock adver-tising variables in model M1 (regression coefficient = 0.06, p<0.01, coincidentally identical to the coef-ficient for the omission of the lagged dependent variable). The same is true for model M2, whereas the additional interaction between omitting lagged or stock advertising and yearly data is insignificant.
Marketing determinants We include two marketing determinants in our meta-analysis: price and quality. Price: Price, as a major influential variable, is in-cluded in the models of 75.1% of the elasticities. H11 hypothesizes that advertising elasticities decrease when price is omitted from the model. However, consistent with both prior advertising meta-analyses (Assmus, Farley, and Lehmann 1984; Se-thuraman, Tellis, and Briesch 2011), our results
neither support nor reject H11because the regres-sion coefficient is insignificant. Quality: Only 9.4% of the elasticities are derived from models that control for the product’s quality. As expected in H12, we find that the omission of quality-related variables significantly reduces adver-tising elasticity estimates (regression coefficient = -0.05, p<0.05). This effect persists when interaction effects are added to the model. This finding updates the non-significant results reported by Sethuraman, Tellis, and Briesch (2011).
Market-related determinants Competition: Preliminary analyses suggested in-cluding one market-related variable in the meta-regression model, namely competition. Competitive behavior is included in 84.3% of the models. In H13, we hypothesize that advertising elasticities derived from studies that do not account for competitive influences are higher than those from studies that account for competitive effects. The regression anal-ysis supports this hypothesis (regression coefficient = 0.08, p<0.01). The result is not moderated by interaction effects and persists in model M2. Thus, studies omitting competitive effects tend to overes-timate advertising elasticities. Although this finding is consistent with various marketing studies (e.g., Vakratsas, Feinberg, Bass, and Kalyanaram 2004), it has been ignored in prior advertising meta-analyses.
Interaction effects Only 19.1% of the models used to estimate elastici-ties include interaction effects. In our meta-analysis, we test for the effect of (collapsed advertising and other) interaction effects on advertising elasticity magnitude. In H14, we suggest that advertising elasticities derived from studies that do not include interaction effects are lower than those from studies that account for interaction effects. The regression results neither support nor reject the hypothesis; the regression parameter is not significant.
Estimation determinants We focus on five potential estimation influences on advertising elasticities by addressing the employ-ment of an intercept, the functional form and the estimation method as well as accounting for en-dogeneity and heterogeneity. Intercept: We test whether omitting an intercept from the model (13.3% of all cases) influences the

BuR - Business Research Official Open Access Journal of VHB German Academic Association for Business Research (VHB) Volume 4 | Issue 2 | December 2011 | 193-239
233
magnitude of the elasticity. Our data do not provide support for a significant effect. Functional form: The majority of elasticities have been derived using a double-log model specification (58.4%), which is why it serves as the base category. Less often we observe share (17.9%), linear (10.7%), and semi-log or other functional forms (13%). In both models M1 and M2, we find a significant re-gression parameter (0.05, p<0.1 for M1 and M2) for semi-log or other functional forms. All remaining functional forms do not significantly affect the ad-vertising elasticity. Our results conflict with Sethu-raman, Tellis, and Briesch (2011) who found signifi-cant effects for all model types, but are consistent with most other meta-analyses reporting no signifi-cant effects for different functional forms (e.g., Al-bers, Mantrala, and Sridhar 2010; Bijmolt, Van Heerde, and Pieters 2005; Kremer, Bijmolt, Leeflang, and Wieringa 2008; Tellis 1988). Estimation method: As the descriptive statistics in Table 3 reveal, 43.5% of the elasticities are derived using OLS, 26.7% use other least squares approach-es, 24% rely on ML, and 5.7% use other techniques to estimate the parameters. Consistent with our expectation and other meta-analyses (e.g., Assmus, Farley, and Lehmann 1984 and Sethuraman, Tellis, and Briesch 2011), we find that the estimation method does not significantly alter advertising elas-ticity. Endogeneity: Only 11.6% of the elasticities are derived while considering potential endogeneity. While there is ambiguity on this topic in the liter-ature, we assume (H15) the advertising elasticity to be lower when endogeneity is not accounted for in a model. In contrast to Sethuraman, Tellis, and Briesch (2011), whose data confirm this assumption, our regression results neither support nor reject the hypothesis because the estimated parameter is not significant. Heterogeneity: Only 5% of the elasticities in our database are estimated on the basis of models which account for heterogeneity via individualized adver-tising coefficients. We find that ignoring heteroge-neity has a significant negative effect on elasticity magnitude (regression parameter = -0.11, p<0.05). This effect is also present in the interaction model M2. Thus, this variable seems to be a relevant con-trol variable.
Publication determinants The last section of determinants relates to four pub-lication determinants that control for different po-tential publication biases. Publication type: A total of 94.1% of the elasticities are drawn from published papers. We expect (H16) that published studies exhibit higher elasticity esti-mates than unpublished work does. However, the naïve elasticity prediction is lower for published than for unpublished papers (Table 3) and, con-sistent with Sethuraman, Tellis, and Briesch (2011), we cannot detect a significant publication type bias. Marketing-related outlet: We further assume (H17) that advertising elasticities are higher if they are derived from studies published in marketing-related outlets (76.1%) compared to other academic outlets (23.9%). However, the estimated parameter is not significant. Outlet ranking: We further suggest (H18) smaller elasticities to be published in more highly ranked publication outlets. Testing for this effect indicates no significant result. Advertising effectiveness focus: Finally, we test whether elasticities are biased upwards when a study focuses on advertising effectiveness (H19). A total of 88.4% of the elasticities are derived from papers focusing on advertising. Our results do not support H19 because the regression parameter is insignificant.
5 Conclusions Summary of findings: Worldwide, managers allo-cate substantial portions of companies’ marketing budgets towards advertising. Increasing demand for marketing accountability requires marketing man-agers to attach great importance to the efficiency of marketing expenditures. Chief Executive Officers (CEOs) and auditing executives focus on the effi-ciency of advertising expenditures. This enormous real-life relevance (Figure 1) is certainly one of the reasons why scientific research has devoted particu-lar attention to advertising effectiveness (e.g., Vakratsas and Ambler 1999). For the purpose of marketing accountability and benchmarking, adver-tising elasticity is the most appropriate measure. Meta-analyses offer a systematic assessment of the robustness of findings with respect to advertising elasticities across variations in study designs (Farley and Lehmann 2001).

BuR - Business Research Official Open Access Journal of VHB German Academic Association for Business Research (VHB) Volume 4 | Issue 2 | December 2011 | 193-239
234
This paper provides an online-accessible advertising elasticity database that includes a large number of potential determinants of advertising elasticity (Fig-ure 2). It largely surpasses prior meta-analyses in terms of comprehensiveness and disaggregation – such a wide range of variables has never before been provided in coded format in one single document. In summary, it offers 602 short-term and 143 long-term elasticities obtained from 60 datasets and 62 studies published in international journals and con-ference proceedings, books, or unpublished manu-scripts. In the descriptive analysis, we find an aver-age current-period elasticity of 0.09. Furthermore, this study quantitatively summarizes the econometric findings on the relationship be-tween advertising and current-period advertising response by investigating the effect of several mod-erating variables. For this purpose, we conduct a meta-analysis based on the data coded in the AED. The analysis builds on a conceptual framework inte-grating prior theoretical and empirical findings. We estimate the parameters using a hierarchical linear model and find 12 significant determinants of ad-vertising elasticity, which partially differ from those employed by Sethuraman, Tellis, and Briesch (2011). The comprehensiveness in conjunction with the transparency of the AED provides managers with disaggregated insights and researchers with starting values for estimation as well benchmark results for the validation of own research findings. Contributions: This paper contributes to the exist-ing literature in two major ways: First, prior meta-analyses generalize findings on advertising elastici-ties and identify determinants that influence adver-tising elasticity. Despite deriving a variety of valua-ble insights, a major shortcoming of these meta-analyses is the fact that only generalized results are reported, whereas the disaggregated raw data are not made available. Because managers are highly interested in, e.g., product-type-level information, we focus on providing a database of marketing elas-ticities on a disaggregated level. Second, we (re-) analyze and update empirical generalizations about advertising elasticities and their determinants based on the AED. Managerial implications: Compared to Sethu-raman, Tellis, and Briesch (2011), we find a substan-tially smaller current-period advertising elasticity (-25%). This smaller effect is attributable to (i) de-creasing advertising elasticity magnitudes over time, (ii) an extended study base, and (iii) some data po-
tentially being interpreted differently compared to Sethuraman, Tellis, and Briesch (2011). The rather small advertising elasticities indicate that advertis-ing spending should be allocated carefully. Especial-ly compared to personnel selling (Albers, Mantrala, and Sridhar 2010), advertising is by far less effective (0.09 vs. 0.34). The meta-analysis further reveals that the trend is indeed downwards; i.e., papers analyzing more recent data tend to find lower adver-tising elasticities compared to older ones. Because we control for most of the relevant methodological issues that influence elasticity magnitudes (e.g., temporal aggregation of data, measurement issues, omission of lagged variables, and heterogeneity), we believe that, ceteris paribus, advertising effective-ness will continue to decline over time. This trend is supported by the fact that competition reduces ad-vertising effectiveness. Managers benefit from our study by allocating their budgets more carefully to increase the success of their products and the effi-ciency of their advertising spending. However, even with small elasticities, advertising will continue to play a major role in marketing be-cause it signals product quality to consumers (Er-dem, Keane, and Sun 2008), which often results in higher prices. Our meta-analysis reveals that adver-tising elasticities are higher for hedonic and experi-ence products and for products in an early stage of their life cycle. Thus, these products will strongly benefit from the optimized allocation of advertising spending. Research implications: Researchers benefit from our study by obtaining a comprehensive database including starting values for their own estimations and meta-regression results of determinants whose effects have not been investigated previously. Alt-hough we provide the AED online so that everyone can retrace and adjust our coding decisions, the statement by Farley and Lehmann (1986: 54) on the difficulties of meta-analysis should still be consid-ered: “The relative sparseness of the data makes meta-analysis in some way similar to archaeology where a few important clues and some general no-tions are used to construct an admittedly incom-plete understanding of a situation.” We believe that the provision of the AED may stimulate other re-searchers to shed light on issues that have not yet been completely resolved. Although every effort has been made to ensure the accuracy of the AED, we cannot rule out the possi-bility that small coding errors might have occurred.

BuR - Business Research Official Open Access Journal of VHB German Academic Association for Business Research (VHB) Volume 4 | Issue 2 | December 2011 | 193-239
235
If errors are found, the authors would appreciate a notification so that they can correct the database. Also, the collection of the data in the AED has shown that although advertising research has yield-ed numerous insights, many questions remain un-answered. For example, most of the studies used aggregate advertising data. Thus, few studies sys-tematically and jointly analyzed the elasticities of different advertising media to provide insights into the simultaneous allocation of budgets across these media. Furthermore, we have not found any studies dealing with new media or comparing the advertis-ing elasticities across internet channels, such as social networks or search engine marketing. Against this backdrop, our AED might stimulate research in this area of advertising. Meta-analyses face general limitations, including (i) the risk that misleading conclusions might arise by combining poorly done with more rigorously done studies (Andrews and Franke 1991); (ii) problems of non-independence of observations (Farley and Lehmann 1986; Tellis 1988); or (iii) the problem of autocorrelation in the data (Sethuraman, Tellis, and Briesch 2011). The public, online availability of a transparent AED along with a meta-analysis may serve as a starting point for minimizing these con-cerns.
Web-Appendix 1: Advertising Elasticity Database (AED)
Web-Appendix 2: Coding Description of Variables (Coding Handbook)
Web-Appendix 3: Elasticity Calculations for Certain Empirical Studies
Web-Appendix 4: Estimation Results and Robustness Checks
Web-Appendix 5: Correlation Matrix of Meta-Regression Variables
References
Ainslie, Andrew, Xavier Drèze, and Fred Zufryden (2005): Modeling Movie Life Cycles and Market Share, Marketing Science, 24 (3): 508-517.
Albers, Sönke (2000): Impact of Types of Functional Rela-tionships, Decisions, and Solutions on the Applicability of Marketing Models, International Journal of Research in Mar-keting, 17 (2/3): 169-175.
Albers, Sönke, Murali K. Mantrala, and Shrihari Sridhar (2010): Personal Selling Elasticities: A Meta-Analysis, Journal of Marketing Research, 47 (5): 840-853, Web Appendix:
www.marketingpower.com/AboutAMA/Documents/JMR_Web_Appendix/2010.5/personal_selling_elasticities.pdf (Access date: 2011-07-02).
Andrews, Rick L. and George R. Franke (1991): The Determi-nants of Cigarette Consumption: A Meta-Analysis, Journal of Public Policy and Marketing, 10 (1): 81-100.
Aribarg, Anocha and Neeraj Arora (2008): Brand Portfolio Promotions, Journal of Marketing Research, 45 (4): 391-402.
Armitage, Christopher J. and Mark Conner (2001): Efficacy of the Theory of Planned Behaviour: A Meta-Analytic Review, British Journal of Social Psychology, 40 (4): 471-499.
Arora, Rajinder (1979): How Promotion Elasticities Change, Journal of Advertising Research, 19 (3): 57-62.
Assmus, Gert, John U. Farley, and Donald R. Lehmann (1984): How Advertising Affects Sales: Meta-Analysis of Econometric Results, Journal of Marketing Research, 21 (1): 65-74.
Balachander, Subramanian and Sanjoy Ghose (2003): Recip-rocal Spillover Effects: A Strategic Benefit of Brand Exten-sions, Journal of Marketing, 67 (1): 4-13.
Berkowitz, David, Arthur Allaway, and Giles D'Souza (2001): Estimating Differential Lag Effects for Multiple Media across Multiple Stores, Journal of Advertising, 30 (4): 59-65.
Besanko, David, Sachin Gupta, and Dipak Jain (1998): Logit Demand Estimation under Competitive Pricing Behavior: An Equilibrium Framework, Management Science, 44 (11): 1533-1547.
Bijmolt, Tammo H. A. and Rik G. M. Pieters (2001): Meta-Analysis in Marketing when Studies Contain Multiple Meas-urements, Marketing Letters, 12 (2): 157-169.
Bijmolt, Tammo H. A., Harald J. Van Heerde, and Rik G. M. Pieters (2005): New Empirical Generalizations on the Deter-minants of Price Elasticity, Journal of Marketing Research, 42 (2): 141-156.
Blattberg, Robert C. and Scott A. Neslin (1990): Sales Promo-tion: Concepts, Methods, and Strategies, Prentice Hall: Eng-lewood Cliffs, NJ.
Bridges, Eileen, Richard A. Briesch, and Suzanne B. Shu (2008): The Impact of Advertising in Child, Adult, and "All Family" RTE Cereal Markets, Working Paper, University of Texas, Dallas, http://www.utdallas.edu/~murthi/Papersubs /Bridges_Briesch_Shu.pdf (Access date: 2011-01-05).
Broadbent, Simon (1979): One Way TV Advertisements Work, Journal of the Market Research Society, 21 (3): 139-166.
Brodie, Roderick and Cornelis A. de Kluyver (1984): Attrac-tion Versus Linear and Multiplicative Market Share Models: An Empirical Evaluation, Journal of Marketing Research, 21 (2): 194-201.
Capps, Oral Jr., Seong-Cheon Seo, and John P. Nichols (1997): On the Estimation of Advertising Effects for Branded Prod-ucts: An Application to Spaghetti Sauces, Journal of Agricul-tural and Applied Economics, 29 (2): 291-302.
Chintagunta, Pradeep K. (2001): Endogeneity and Heteroge-neity in a Probit Demand Model: Estimation Using Aggregate Data, Marketing Science, 20 (4): 442-456.
Chintagunta, Pradeep K., Vrinda Kadiyali, and Naufel J. Vil-cassim (2006): Endogeneity and Simultaneity in Competitive

BuR - Business Research Official Open Access Journal of VHB German Academic Association for Business Research (VHB) Volume 4 | Issue 2 | December 2011 | 193-239
236
Pricing and Advertising: A Logit Demand Analysis, Journal of Business, 79 (6): 2761-2787.
Christen, Markus, Sachin Gupta, John C. Porter, Richard Staelin, and Dick R. Wittink (1997): Using Market-Level Data to Understand Promotion Effects in a Nonlinear Model, Jour-nal of Marketing Research, 34 (3): 322-334.
Clarke, Darral G. (1976): Econometric Measurement of the Duration of Advertising Effect on Sales, Journal of Marketing Research, 13 (4): 345-357.
Clarke, Darral G. and John M. McCann (1973): Measuring the Cumulative Effects of Advertising: A Reappraisal, in: Thomas V. Geer (ed.): Increasing Marketing Productivity and Concep-tual and Methodological Foundations in Marketing, American Marketing Association: Chicago, IL, 135-139.
Cooper, Harris M. (1989): Integrating Research: A Guide for Literature Reviews, 2nd ed., Sage: Newbury Park, CA.
Cooper, Lee. G. and Masao Nakanishi (2000): Market-Share Analysis: Evaluating Competitive Marketing Effectiveness, 7th ed., Kluwer: Boston, MA.
Cowling, Keith, and John Cubbin (1971): Price, Quality and Advertising Competition: An Econometric Investigation of the United Kingdom Car Market, Economica, 38 (152): 378-394.
Dahlén, Micael (2005): The Medium as a Contextual Cue, Journal of Advertising, 34 (3): 89-98.
Danaher, Peter J., André Bonfrer, and Sanjay Dhar (2008): The Effect of Competitive Advertising Interference on Sales for Packaged Goods, Journal of Marketing Research, 45 (2): 211-225.
Deighton, John, Caroline M. Henderson, and Scott A. Neslin (1994): The Effects of Advertising on Brand Switching and Repeat Purchasing, Journal of Marketing Research, 31 (1): 28-43.
Dekimpe, Marnik G. and Dominique M. Hanssens (1995): The Persistence of Marketing Effects on Sales, Marketing Science, 14 (1): 1-21.
Doganoglu, Toker and Daniel Klapper (2006): Goodwill and Dynamic Advertising Strategies, Quantitative Marketing and Economics, 4 (1): 5-29.
Dubé, Jean-Pierre, Günter J. Hitsch, and Puneet Manchanda (2005): An Empirical Model of Advertising Dynamics, Quanti-tative Marketing and Economics, 3 (2): 107-144.
Dubé, Jean-Pierre and Puneet Manchanda (2005): Differences in Dynamic Brand Competition across Markets: An Empirical Analysis, Marketing Science, 24 (1): 81-95.
Elberse, Anita and Jehoshua Eliashberg (2003): Demand and Supply Dynamics for Sequentially Released Products in Inter-national Markets: The Case of Motion Pictures, Marketing Science, 22 (3): 329-354.
Erdem, Tülim and Baohong Sun (2002): An Empirical Inves-tigation of the Spillover Effects of Advertising and Sales Pro-motions in Umbrella Branding, Journal of Marketing Research, 39 (4): 408-420.
Erdem, Tülim, Michael P. Keane, and Baohong Sun (2008): A Dynamic Model of Brand Choice When Price and Advertising Signal Product Quality, Marketing Science, 27 (6): 1111-1125.
Erickson, Gary M. (1981): Using Ridge Regression to Estimate Directly Lagged Effects in Marketing, Journal of the American Statistical Association, 76 (376): 766-773.
Estelami, Hooman, Donald R. Lehmann, and Alfred C. Holden (2001): Macro-Economic Determinants of Consumer Price Knowledge: A Meta-Analysis of four Decades of Research, International Journal of Research in Marketing, 18 (4): 341-355.
Farley, John U. and Donald R. Lehmann (1986): Meta-Analysis in Marketing: Generalization of Response Models, Lexington: Lexington, MA.
Farley, John U. and Donald R. Lehmann (2001): The Im-portant Role of Meta-Analysis in International Research in Marketing, International Marketing Review, 18 (1): 70-80.
Farley, John U., Donald R. Lehmann, and Alan Sawyer (1995): Empirical Marketing Generalization Using Meta-Analysis, Marketing Science, 14 (3): 36-46.
Fischer, Marc and Sönke Albers (2010): Patient- or Physician-Oriented Marketing: What Drives Primary Demand for Pre-scription Drugs?, Journal of Marketing Research, 47 (1): 103-121.
Frank, Ronald E. and William F. Massy (1967): Effects of Short-Term Promotional Strategy in Selected Market Seg-ments, in: Patrick J. Robinson (ed.): Promotional Decisions Using Mathematical Models, Allyn and Bacon: Boston, MA, 149-225.
Gallet, Craig A. and John A. List (2003): Cigarette Demand: A Meta-Analysis of Elasticities, Health Economics, 12 (10): 821-835.
Gatignon, Hubert (1984): Competition as a Moderator of the Effect of Advertising on Sales, Journal of Marketing Research, 21 (4): 387-398.
Gatignon, Hubert and Dominique M. Hanssens (1987): Mod-eling Marketing Interactions with Application to Salesforce Effectiveness, Journal of Marketing Research, 24 (3): 247-257.
Gemmil, Martin C., Joan Costa-Font, and Alistair McGuire (2007): In Search of a Corrected Prescription Drug Elasticity Estimate: A Meta-Regression Approach, Health Economics, 16 (6): 627-643.
Ghosh, Avijit, Scott Neslin, and Robert Shoemaker (1984): A Comparison of Market Share Models and Estimation Proce-dures, Journal of Marketing Research, 21 (2): 202-210.
Givon, Moshe and Dan Horsky (1990): Untangling the Effects of Purchase Reinforcement and Advertising Carryover, Mar-keting Science, 9 (2): 171-187.
Goeree, Michelle S. (2008): Limited Information and Adver-tising in the U.S. Personal Computer Industry, Econometrica, 76 (5): 1017-1074.
Greene, William H. (2000): Econometric Analysis, 4th ed., Prentice Hall: Upper Saddle River, NJ.
Guadagni, Peter M. and John D. C. Little (1983): A Logit Model of Brand Choice Calibrated on Scanner Data, Marketing Science, 2 (3): 203-238.
Hagerty, Michael R., James M. Carman, and Gary J. Russell (1988): Estimating Elasticities with PIMS Data: Methodologi-cal Issues and Substantive Implications, Journal of Marketing Research, 25 (1): 1-9.

BuR - Business Research Official Open Access Journal of VHB German Academic Association for Business Research (VHB) Volume 4 | Issue 2 | December 2011 | 193-239
237
Hanssens, Dominique M., Leonard J. Parsons, and Randall L. Schultz (2001): Market Response Models: Econometric and Time Series Analysis, 2nd ed., Kluwer: Dordrecht.
Hofstede, Geert (1980): Culture’s Consequences: International Differences in Work Related Values, Sage: Thousand Oaks, CA.
Hofstede, Geert (2001): Culture’s Consequences: International Differences in Work Related Values, 2nd edition, Sage: Thou-sand Oaks, CA.
Hofstede, Frenkel Ter, Michel Wedel, and Jan-Benedict E. M. Steenkamp (2002): Identifying Spatial Segments in International Markets, Marketing Science, 21 (2): 160-177.
Houston, Franklin S. and Doyle L. Weiss (1974): An Analysis of Competitive Market Behavior, Journal of Marketing Re-search, 11 (2): 151-155.
Hruschka, Harald (2002): Market Share Analysis Using Semi-Parametric Attraction Models, European Journal of Operation-al Research, 138 (1): 212-225.
Hsu, Jane Lu and Gary Shang-Min Liu (2004): Evaluating Branded Advertising of Fluid Milk Products in Taiwan, Jour-nal of International Food and Agribusiness Marketing, 16 (1): 7–18.
Hu, Ye, Leonard M. Lodish, and Abba M. Krieger (2007): An Analysis of Real World TV Advertising Tests: A 15-Year Up-date, Journal of Advertising Research, 47 (3): 341-353.
Hult, G. Tomas M., Martin Reimann, and Oliver Schilke (2009): Worldwide Faculty Perceptions of Marketing Jour-nals: Rankings, Trends, Comparisons, and Segmentations, GlobalEdge Business Review, 3 (3): 1-23.
Hutchinson, J. Wesley, Wagner A. Kamakura, and John G. Lynch Jr (2000): Unobserved Heterogeneity as an Alternative Explanation for "Reversal" Effects in Behavioral Research, Journal of Consumer Research, 27 (3): 324-344.
Iyer, Ganesh, David Soberman, and J. Miguel Villas-Boas (2005): The Targeting of Advertising, Marketing Science, 24 (3): 461-476.
Jagpal, Harsharanjeet S. and Ivan E. Brick (1982): The Marketing Mix Decision under Uncertainty, Marketing Sci-ence, 1 (1): 79-92.
Johansson, Johny K. (1973): A Generalized Logistic Function with an Application to the Effect of Advertising, Journal of the American Statistical Association, 68 (344): 824-827.
Kanetkar, Vinay, Charles B. Weinberg, and Doyle L. Weiss (1992): Price Sensitivity and Television Advertising Expo-sures: Some Empirical Findings, Marketing Science, 11 (4): 359-371.
Kinnucan, Henry and Olan D. Forker (1986): Seasonality in the Consumer Response to Milk Advertising with Implications for Milk Promotion Policy, American Journal of Agricultural Economics, 68 (3): 562-571.
Kremer, Sara T. M., Tammo H. A. Bijmolt, Peter S. H. Leeflang, and Jaap E. Wieringa (2008): Generalizations on the Effectiveness of Pharmaceutical Promotional Expendi-tures, International Journal of Research in Marketing, 25 (4): 234-246.
Lambin, Jean-Jacques (1969): Measuring the Profitability of Advertising: An Empirical Study, Journal of Industrial Eco-nomics, 17 (2): 86-103.
Lambin, Jean-Jacques (1976): Advertising, Competition and Market Conduct in Oligopoly over Time: An Econometric Investi-gation in Western European Countries, in: Jan Tinbergen, Dale W. Jorgenson, and Jean Waelbroek (eds.): Contributions to Economic Analysis (94), North-Holland: Amsterdam, 1-312.
Leeflang, Peter S. H., Dick R. Wittink, Michel Wedel, and Philippe A. Naert (2000): Building Models for Marketing Deci-sions, Kluwer: Boston, MA.
Lehmann, Donald R. (2004): Linking Marketing to Financial Performance and Firm Value, Journal of Marketing, 68 (4): 73-75.
Leone, Robert P. (1995): Generalizing What is Known About Temporal Aggregation and Advertising Carryover, Marketing Science, 14 (3): 141-151.
Leone, Robert P. and Randall L. Schultz (1980): A Study of Marketing Generalizations, Journal of Marketing, 44 (1): 10-18.
Lipsey, Mark W. and David B. Wilson (2001): Practical Meta-Analysis, Sage: London.
Liu, Yong (2006): Word of Mouth for Movies: Its Dynamics and Impact on Box Office Revenue, Journal of Marketing, 70 (3): 74-89.
Lodish, Leonard M., Magid Abraham, Stuart Kalmenson, Jeanne Livelsberger, Beth Lubetkin, Bruce Richardson, and Mary E. Stevens (1995): How T.V. Advertising Works: A Meta-Analysis of 389 Real World Split Cable T.V. Advertising Ex-periments, Journal of Marketing Research, 32 (2): 125-139.
Lyman, R. Ashley (1994): Advertising and Sales Promotion in Electricity, Journal of Regulatory Economics, 6 (1): 41-58.
Manchanda, Puneet, Ying Xie, and Nara Youn (2008): The Role of Targeted Communication and Contagion in Product Adoption, Marketing Science, 27 (6): 961-976.
McConnell, J. Douglas (1970): Do Media Vary in Effective-ness?, Journal of Advertising Research, 10 (5): 19-22.
Metwally, Mokhtar M. (1975): Advertising and Competitive Behaviour of Selected Australian Firms, The Review of Eco-nomics and Statistics, 57 (4): 417-427.
Metwally, Mokhtar M. (1980): Sales Response to Advertising of Eight Australian Products, Journal of Advertising Research, 20 (5): 59-64.
Montgomery, David B. and Alvin J. Silk (1972): Estimating Dynamic Effects of Marketing Communication Expenditures, Management Science, 18 (10): 485-501.
Moriarty, Mark (1975): Cross-Sectional, Time-Series Issues in the Analysis of Marketing Decision Variables, Journal of Mar-keting Research, 12 (2): 142-150.
Narayanan, Sridhar, Ramarao Desiraju, and Pradeep K. Chin-tagunta (2004): Return on Investment Implications for Phar-maceutical Promotional Expenditures: The Role of Marketing-Mix Interactions, Journal of Marketing, 68 (4): 90-105.
Narayanan, Sridhar, Puneet Manchanda, and Pradeep K. Chintagunta (2005): Temporal Differences in the Role of Marketing Communication in New Product Categories, Jour-nal of Marketing Research, 42 (3): 278-290.
Nelson, Phillip (1975): The Economic Consequences of Adver-tising, Journal of Business, 48 (2): 213-241.

BuR - Business Research Official Open Access Journal of VHB German Academic Association for Business Research (VHB) Volume 4 | Issue 2 | December 2011 | 193-239
238
Nerlove, Marc and Kenneth J. Arrow (1962): Optimal Advertising Policy under Dynamic Conditions, Economica, 29 (114): 129-142.
Palda, Kristian S. (1964): The Measurement of Cumulative Advertising Effects, Prentice Hall: Englewood Cliffs, NJ.
Parker, Philip M. and Hubert Gatignon (1996): Order of Entry, Trial Diffusion, and Elasticity Dynamics: An Empirical Case, Marketing Letters, 7 (1): 95-109.
Parsons, Leonard J. (1975): The Product Life Cycle and Time-Varying Advertising Elasticities, Journal of Marketing Re-search, 12 (4): 476-480.
Parsons, Leonard J. and Randall L. Schultz (1976): Marketing Models and Econometric Research, North-Holland: Amster-dam.
Pauwels, Koen (2004): How Dynamic Consumer Response, Competitor Response, Company Support, and Company Inertia Shape Long-Term Marketing Effectiveness, Marketing Science, 23 (4): 596-610.
Picconi, Mario J. and Charles L. Olson (1978): Advertising Decision Rules in a Multibrand Environment: Optimal Control Theory and Evidence, Journal of Marketing Research, 15 (1): 82-92.
Prag, Jay and James Casavant (1994): An Empirical Study of the Determinants of Revenues and Marketing Expenditures in the Motion Picture Industry, Journal of Cultural Economics, 18 (3): 217-235.
Ramanathan, Suresh and Sanjay K. Dhar (2010): The Effect of Sales Promotions on the Size and Composition of the Shopping Basket: Regulatory Compatibility from Framing and Temporal Restrictions, Journal of Marketing Research, 47 (3): 542-552.
Rossiter, John R. and Larry Percy (1998): Advertising Com-munications and Promotion Management, 2nd ed., McGraw-Hill: New York.
Rust, Roland T., Donald R. Lehmann, and John U. Farley (1990): Estimating Publication Bias in Meta-Analysis, Journal of Marketing Research, 27 (2): 220-226.
Sawhney, Mohanbir S. and Jehoshua Eliashberg (1996): A Parsimonious Model for Forecasting Gross Box-Office Reve-nues of Motion Pictures, Marketing Science, 15 (2): 113-131.
Science Citation Index (2011): http://admin-apps.isiknow ledge.com/JCR/JCR?SID=X2CniCpb9ObL3JL6fke (Access date: 2011-07-04, member account).
Sethuraman, Ray (1995): A Meta-Analysis of National Brand and Store Brand Cross-Promotional Price Elasticities, Market-ing Letters, 6 (4): 275-286.
Sethuraman, Ray and Gerald J. Tellis (1991): An Analysis of the Tradeoff Between Advertising and Price Discounting, Journal of Marketing Research, 28 (2): 160-174.
Sethuraman, Ray, Gerald J. Tellis, and Richard A. Briesch (2011): How Well Does Advertising Work? Generalizations from Meta-Analysis of Brand Advertising Elasticities, Journal of Marketing Research, 48 (3): 457-471.
Sexton, Donald E. Jr. (1970): Estimating Marketing Policy Effects on Sales of a Frequently Purchased Product, Journal of Marketing Research, 7 (3): 338-347.
Shugan, Steven M. (2004): Endogeneity in Marketing Decision Models, Marketing Science, 23 (1): 1-3.
Simon, Hermann (1979): Dynamics of Price Elasticity and Brand Life Cycles: An Empirical Study, Journal of Marketing Research, 16 (4): 439-452.
Sinha, Prabhakant and Andris A. Zoltners (2001): Sales-Force Decision Models: Insights from 25 Years of Implementation, Interfaces, 31 (3): 8-44.
Sissors, Jack Z. and Roger B. Baron (2002): Advertising Media Planning, 6th ed., McGraw-Hill: New York.
Smith, Wendell R. (1956): Product Differentiation and Market Segmentation as Alternative Marketing Strategies, Journal of Marketing, 21 (1): 3-8.
Srinivasan, Shuba, Marc Vanhuele, and Koen Pauwels (2010): Mind-Set Metrics in Market Response Models: An Integrative Approach, Journal of Marketing Research, 47 (4): 672-684.
Stilley, Karen M., J. Jeffrey Inman, and Kirk L. Wakefield (2010): Spending on the Fly: Mental Budgets, Promotions, and Spending Behavior, Journal of Marketing, 74 (3): 34-47.
Svensson, Göran (2010): SSCI and Its Impact Factors: A "Prisoner's Dilemma"?, European Journal of Marketing, 44 (1/2): 23-33.
Tellis, Gerard J. (1988): The Price Elasticity of Selective De-mand: A Meta-Analysis of Economic Models of Sales, Journal of Marketing Research, 25 (4): 331-341.
Tellis, Gerard J. (2005): Advertising's Role in Capitalist Mar-kets: What Do We Know and Where Do We Go from Here?, Journal of Advertising Research, 45 (2): 162-170.
Tellis, Gerard J., Rajesh K. Chandy, and Pattana Thaivanich (2000): Which Ad Works, When, Where, and How Often? Modeling the Effects of Direct Television Advertising, Journal of Marketing Research, 37 (1): 32-46.
Tellis, Gerard J. and Claes Fornell (1988): The Relationship between Advertising and Product Quality Over the Product Life Cycle: A Contingency Theory, Journal of Marketing Re-search, 25 (1): 64-71.
Tellis, Gerard J. and Philip H. Franses (2006): Optimal Data Interval for Estimating Advertising Response, Marketing Science, 25 (3): 217-229.
Tellis, Gerard J. and Doyle L. Weiss (1995): Does TV Advertis-ing Really Affect Sales? The Role of Measures, Models, and Data Aggregation, Journal of Advertising, 24 (3): 1-20.
Telser, Lester G. (1962): Advertising and Cigarettes, The Jour-nal of Political Economy, 70 (5): 471-499.
The Coca-Cola Company (2010): Coca-Cola Annual Report 2010, Annual Report Pursuant to Section 13 or 15(d) of the Securities Exchange Act of 1934, http://www.thecoca-cola company.com/investors/pdfs/form_10K_2010.pdf (Access date: 2011-05-11).
The Nielsen Company (2011): Global Advertising Rebounded 10.6% in 2010, http://www.nielsen.com/us/en/hts/press-ro om/2011/global-advertising-rebound-2010.html (Access date: 2011-05-11).
Tull, Donald S., Van R. Wood, Dale Duhan, Tom Gillpatrick, Kim R. Robertson, and James G. Helgeson (1986): "Lever-aged" Decision Making in Advertising: The Flat Maximum Principle and Its Implications, Journal of Marketing Research, 23 (1): 25-32.

BuR - Business Research Official Open Access Journal of VHB German Academic Association for Business Research (VHB) Volume 4 | Issue 2 | December 2011 | 193-239
239
Vakratsas, Demetrios and Tim Ambler (1999): How Advertis-ing Works: What Do We Really Know?, Journal of Marketing, 63 (1): 26-43.
Vakratsas, Demetrios, Fred M. Feinberg, Frank M. Bass, and Gurumurthy Kalyanaram (2004): The Shape of Advertising Response Functions Revisited: A Model of Dynamic Probabil-istic Thresholds, Marketing Science, 23 (1): 109-119.
Van den Putte, Bas (2009): What Matters Most in Advertising Campaigns?, International Journal of Advertising, 28 (4): 669-690.
Vanhonacker, Wilfried R. (1989): Modeling the Effect of Advertising on Price Response: An Econometric Framework and Some Preliminary Findings, Journal of Business Research, 19 (2): 127-149.
Villas-Boas, J. Miguel and Russell S. Winer (1999): Endogene-ity in Brand Choice Models, Management Science, 45 (10): 1324-1338.
Völckner, Franziska (2008): The Dual Role of Price: Decom-posing Consumers' Reactions to Price, Journal of the Academy of Marketing Science, 36 (3): 359-377.
Völckner, Franziska and Henrik Sattler (2005): Separating Negative and Positive Effects of Price with Choice-Based Conjoint Analyses, Marketing - Journal of Research and Man-agement, 1 (1): 5-13.
Weinberg, Charles B. (1975): Carry-Over Is Important – I, Journal of Advertising Research, 15 (3): 41-42.
Weinberg, Charles B. and Doyle L. Weiss (1982): On the Econometric Measurement of the Duration of Advertising Effect on Sales, Journal of Marketing Research, 19 (4): 585-591.
Wind, Yoram (1978): Issues and Advances in Segmentation Research, Journal of Marketing Research, 15 (3): 317-337.
Winer, Russell S. (1979): An Analysis of the Time-Varying Effects of Advertising: The Case of Lydia Pinkham, The Jour-nal of Business, 52 (4): 563-576.
Wosinska, Marta (2003): Just What the Patient Ordered? Direct-to-Consumer Advertising and the Demand for Pharma-ceutical Products, Working Paper, Harvard Business School Marketing, http://www.chicagobooth.edu/research/worksho ps/marketing/archive/WorkshopPapers/wosinska_choice.pdf (Access date: 2011-07-02).
Xu, Lizhen, Jianqing Chen, and Andrew Whinston (2011): Price Competition and Endogenous Valuation in Search Advertising, Journal of Marketing Research, 48 (3): 566-586.
Yang, Sha and Greg M. Allenby (2003): Modeling Interdependent Consumer Preferences, Journal of Marketing Research, 40 (3): 282-294.
ZenithOptimedia (2011): Press Release April 11, 2011, http://www.zenithoptimedia.com/files/media/image/news/Press%20Release%20files/2011/April/Adspend%20forecasts%20April%202011.pdf (Access date: 2011-05-11).
Zhou, Nan, Dongsheng Zhou, and Ming Ouyang (2003): Long-Term Effects of Television Advertising on Sales of Consumer Durables and Nondurables, Journal of Advertising, 32 (2): 45-54.
Biographies
Sina Henningsen is a PhD student at the Institute of Innova-tion Research at the Christian-Albrechts-University at Kiel. Her main fields of research are spatial analysis and advertising effec-tiveness.
Rebecca Heuke is a PhD student at the Institute of Marketing and Media at the University of Hamburg. Her main fields of research are advertising effectiveness and brand management.
Michel Clement is Professor at the Institute of Marketing and Media at the University of Hamburg. His main fields of research are managing entertainment media products, electronic business, and health care marketing (blood donation).