Embed Size (px)
Citation preview
Analyst
PAPER
Cite this: Analyst, 2021, 146, 4290
Received 6th April 2021,Accepted 1st June 2021
DOI: 10.1039/d1an00578b
rsc.li/analyst
Detection and mapping of haemoglobin variantsin blood fingermarks by MALDI MS for suspect“profiling”†
Cameron Heaton,a Matthias Witt,b Laura Cole,a Jason Eyre,c Simon Tazzyman,c
Richard McColmd and Simona Francese *a
Over the past seven years Matrix Assisted Laser Desorption Ionisation Mass Spectrometry Profiling (MALDI
MSP) and Imaging (MALDI MSI) have proven to be feasible tools for the detection of blood and its prove-
nance in stains and fingermarks. However, whilst this capability as a confirmatory test addresses the
primary questions at the scene of a violent crime, additional intelligence recoverable from blood can also
prove important for investigations. A DNA profile is the most obvious and important example of such
intelligence; however, it is not always suitable for identification purposes, depending on quantity, age and
environmental conditions. Proteins are much more stable and determining the presence of haemoglobin
variants in blood recovered at a crime scene may provide associative and possibly corroborating evidence
on the presence of an individual at a particular location. This evidence gains more incriminatory value, the
lower the incidence of the variant in a certain geographical area or population and may contribute to nar-
rowing down the pool of suspects. In this study, a MALDI based mass spectrometric method has been
developed and tested on six haemoglobin variants for their fast and reliable identification and mapping in
blood fingermarks.
1. Introduction
Over the past seven years, Matrix Assisted Laser DesorptionIonisation has proven its capability to detect and visualiseblood in stains and fingermarks.1–6 The compatibility with arange of blood enhancement techniques as well as its feasi-bility of application in aged blood (as old as 37 years5) conferthe technique operational significance. Recently, it has beenpossible to provide additional information from this evidenceby establishing its human or animal provenance (down toanimal species) as well as discriminating this from other bio-logical matrices4,6–9 and in a pre-validation study.6
Whilst reliable detection of blood and the additional infor-mation on blood provenance address the first lines of a foren-sic inquiry, other intelligence may also be useful and, in somecases, crucial in informing investigations. A prime example ofvital intelligence is offered by DNA profiling, used to identify
the perpetrator or to establish foul play in a murder inquirywithout a body. However, DNA amplification, profiling andmatching may not always be possible depending on initialDNA quantity, degradation, possible presence in a mixture andthe existence of a record in DNA databases. Although only ofan associative type, blood typing or detection of drugs or medi-cations in a bloodstain or a blood fingermark may be impor-tant to an investigation. Whilst a MALDI based method isavailable for the former,10,11 there is no report in the literaturecovering the latter.
Additional intelligence on the presence of Hb variants (Hbvar) could also be beneficial to narrow down the pool of sus-pects, depending on their incidence and occurrence in certaingeographical areas or linked to the inhabiting multiethnicpopulation (although migration alters the geographical occur-rence over time). In 2001 Weatherall and Clegg12 reported thatmutations in genes encoding for haemoglobin occurred in the7% of the global population. However, in some parts of theworld, the sickle cell gene (HbS) can be present in up to 40%of the population, and the HbE variant can be present inexcess of 60% of the population.12 Both instances suggest thatthe detection of haemoglobin variants may be considered asuseful intelligence to narrow down the pool of suspects. Agenetic modification affecting the rate of synthesis gives raiseto haemoglobin conferring a thalassemic trait; a genetic modi-
†Electronic supplementary information (ESI) available. See DOI: 10.1039/d1an00578b
aBiomolecular Science Research Centre, Centre for Mass Spectrometry Imaging,
Sheffield Hallam University, Sheffield, UK. E-mail: [email protected] Daltonik GmbH, Bremen, GermanycSheffield Teaching Hospitals, Sheffield, UKdDefence Science and Technology Laboratory, Porton Down, UK
4290 | Analyst, 2021, 146, 4290–4302 This journal is © The Royal Society of Chemistry 2021
Ope
n A
cces
s A
rtic
le. P
ublis
hed
on 0
7 Ju
ne 2
021.
Dow
nloa
ded
on 1
2/10
/202
1 8:
31:4
5 PM
. T
his
artic
le is
lice
nsed
und
er a
Cre
ativ
e C
omm
ons
Attr
ibut
ion-
Non
Com
mer
cial
3.0
Unp
orte
d L
icen
ce.
View Article OnlineView Journal | View Issue

fication yielding a structural change in the form of aminoacidic substitutions in the protein chain, generates Hb varwhich can also occur alongside ‘normal’ haemoglobin tetra-mers within some individuals. Most Hb var are the result of asingle amino acid substitution on either the α or β chain,although multiple substitutions can and do occur as well asinsertion or deletion of amino acids. When variants occur astraits, an individual has one copy of an abnormal allele of themutated haemoglobin gene and one copy of the ‘normal’ hae-moglobin gene (heterozygous), or two copies of the abnormalallele (homozygous). For example, in the case of sickle cell hae-moglobin, these are referred to as HbAS and HbSS respectively,where someone with the trait may not display the severe symp-toms of sickle cell disease. Haemoglobin A0 (HbA0 or “normal”haemoglobin), is a tetramer containing two alpha subunitsand two beta subunits (α2β2) and accounts for 97–98% of thetotal red blood cell Hb in a “normal” individual.13
According to the HbVar database (https://globin.bx.psu.edu/globin/hbvar/), regularly updated and part of the GlobinGene Server database [http://globin.cse.psu.edu/], there are atotal of 1833 known Hb var of which 1393 are haemoglobinvariants and 534 are thalassemias. Nine hundred and fortyone entries arise from a modification to the β gene. Swedanet al. reported that more than 50 HbJ variants were known in200814 but the Hb var database currently reports only 46 HbJvariants, possibly indicating that the overall number of Hbvariants of 1831 may be a considerable under-estimation.However, incidence is what makes their detection interestingfrom a forensic perspective. Brunel et al. reported that intheir laboratory, only 30 variants are detected in over 12 000tests per annum.15 In another example, as part of the NorthAmerican “biometric screening programme” for the reductionand management of the healthcare costs and health risks oftheir employees, the Houston Methodist Hospital tested13 913 individuals in 2.5 months.16 Of this number, only3.77% exhibited an Hb variant for a total of 11 different var-iants. Amongst these 524 employees, the HbS trait waspresent in 2.85% of the individuals, the HbSS disease in0.03%, the HbC trait in 0.61%, the HbCC disease in 0.01%and the HbE trait in 0.13% of the individuals. Due to thepotential contribution in forensics, this study has selectedand investigated the six most common and clinically signifi-cant Hb variants, namely HbS, HbJ-Baltimore, HbC, HbE,HbD-Iran and HbD-Punjab/Los Angeles, all bearing modifi-cations to the β globin chain. Prevalence in the UK varies byregion due to the ethnic component of the distributiondependant on migration. As a reference, Sheffield, where theauthors operate, has performed 10 196 Haemoglobinopathyscreens last year, of which 464 (4.6%) presented a variant.According to Public Health England, Sheffield is consideredhigh prevalence (>2.0% screen positive), although this per-centage may be skewed upwards by the fact that Sheffield is areferral lab for many surrounding areas and beyond (JasonEyre, personal communication).
Of these variants, HbS gives raise to the most important ofthe haemoglobinopathies (sickle cell anemia), where types C,
E and D Punjab/Los Angeles might lead to sickle cell anemiawhen associated with HbS.17,18
Sickle cell anemia is a life-threatening haemoglobinopathycharacterised by low solubility of Hb which determines therod-like shape of the red cells (sickle).19,20 The low solubility ofthis variant arises from a substitution of valine for glutamicacid at the 6th amino acid position in the beta globin gene(β6 Glu → Val). In 2008 Swedan et al. observed that in the US,the sickle trait has a prevalence of 8–10% among AfricanAmericans, and it is calculated that ∼1/500 African Americansand 1/1000 Hispanics have sickle cell anemia.14 HbJ-Baltimorewas first reported in 1963 by Baglioni and Weatherall in ablack American family21 and it arises from a substitution ofglycine for an aspartic acid at the 16th amino acid position(β16 Gly → Asp). HbC and HbE are also frequently observed insome populations; the former has a high occurrence in Africa,while the latter is common in South East Asia.18,22 The HbCvariant is caused by the substitution of a glutamic acid for alysine at the 6th position in the beta globin gene (β6 Glu →Lys), whereas HbE arises from a substitution of a glutamicacid for a lysine at the 26th amino acid position in the betaglobin gene (β26 Glu → Lys). HbD Los Angeles was the 4th Hbvar to be discovered and was described by Itano in 1951.23 Itarises from a substitution of a glutamic acid for a glutamine atthe 121st position in the β globin chain (β121 Glu → Gln). In1962 Baglioni discovered that other HbD variants that hademerged had the same molecular composition as HbD-LosAngeles, one of these being HbD-Punjab.24 Since then, thisvariant is denominated HbD-Punjab/Los Angeles. Whilst it isreported as one of the most common Hb var worldwide afterHbS and HbC,25 its prevalence varies according to geographi-cal location; in the Northwest India (the Punjab region) it hasa prevalence of 2%, dropping to 1% in Western India. Thisvariant has also been detected in some European countriessuch as Italy, Belgium and Austria as well as Turkey.26–29 ForItaly, the findings cannot exclude either an independent originor a spread from India due to migration.26 For Belgium thelatter is instead considered unlikely,27 whereas for Austria aspread from Turkey is considered possible.28 Whilst these var-iants are described as common in these four countries,25 itdoes not mean that they have a high incidence. For example inthe Belgium study, in 1986 it was reported that over the courseof 9 years, 19 000 individuals had been screened for haemo-globin abnormalities and only nine unrelated carriers ofHbD-Punjab/Los Angeles were discovered;26 in Turkey, itoccurs in 0.2% of the population.25 Dass et al.30 reportedHbD-Iran as a rare variant which was first discovered in afamily in central Iran in 1973.31 This variant arises from a sub-stitution of a glutamic acid for a glutamine at the 22nd aminoacid position in the β globin chain (β22 Glu → Lys). Table 1summarises the modifications on the β globin chain for eachof the variants of interest.
In healthcare, there are a number of techniques that arecurrently used to screen for Hb variants including cationexchange HPLC, tandem mass spectrometry, acid and alkalinegel electrophoresis (or isoelectric focusing electrophoresis),
Analyst Paper
This journal is © The Royal Society of Chemistry 2021 Analyst, 2021, 146, 4290–4302 | 4291
Ope
n A
cces
s A
rtic
le. P
ublis
hed
on 0
7 Ju
ne 2
021.
Dow
nloa
ded
on 1
2/10
/202
1 8:
31:4
5 PM
. T
his
artic
le is
lice
nsed
und
er a
Cre
ativ
e C
omm
ons
Attr
ibut
ion-
Non
Com
mer
cial
3.0
Unp
orte
d L
icen
ce.
View Article Online
capillary zone electrophoresis and molecular methods,depending on the target of the screening,32,33 with HPLCbeing the more commonly used technique across the UK.
Depending on the laboratories, a combination of themethods above is used to detect as many variants as possible.However, to the authors’ knowledge no forensic screening forHb variants has ever been reported in the literature so far. Thetechniques are not only generally time consuming but are alsonot applicable to blood fingermarks as they require destruc-tion of the evidence (due to swabbing and extraction). In thework presented here, MALDI MSP and MSI have been investi-gated to evaluate the possibility to detect the six selected hae-moglobin variants in blood and to visualise them in blood fin-germarks. The use of diverse mass spectrometry instrumenta-tion has shown that, whilst the highest sensitivity is requiredto detect (and map) the Hb var under investigation, MALDIMS is, within the system investigated, a suitable technique torecover this type of intelligence from blood. With furtheroptimisation it could also be a valid alternative/addition to thecurrent clinical diagnostics methods for Hb var screening.
2. Experimental2.1 Materials
Trifluoroacetic acid (TFA), α-cyano-4-hydroxycinnamic acid(α-CHCA) phosphorous red and TLC sheets were purchasedfrom Sigma Aldrich (Poole, UK). Acetonitrile, (ACN) waspurchased from Fisher Scientific (Loughborough, UK).Lyophilised sequencing grade modified Trypsin was obtainedfrom Promega in 20 μg vials (Southampton, UK). RapiGest wasobtained in 1 mg vials from Waters (Waters Corp, Manchester,UK). Double sided conductive tape was purchased from TAAB(Aldemastor, UK), Intellislides (glass slides) were made avail-able by Bruker Daltonik (GmbH, Bremen, Germany). Indiumtin oxide (ITO) slides were purchased from Sigma Aldrich(Poole, UK). Six Haemoglobin variants were investigated byMALDI MS, MS/MS and MSI namely, HbC, HbD-Iran,HbD-Punjab/Los Angeles, HbE, HbJ Baltimore and HbS. HbA0
(“normal” Hb) was also included as a reference. Samples wereavailable as standards (HbA0, and HbS were purchased fromSigma Aldrich (Dorset, UK) and a mixed Hb AFSC standardwas purchased from Sebia (Lisses, France), as they were notcommercially available individually, or as patients’ blood.Patients’ blood was provided by Sheffield Teaching Hospitalsunder the IRAS and the Sheffield Hallam University Ethicsapprovals 160418 and ER6558932 respectively. These sampleswere analysed using three types of MALDI Mass Spectrometers.
2.2 Instruments and instrumental conditions
Three sets of data were acquired from three MALDI mass spec-trometers, namely the MALDI QToF Synapt G2 HDMS (WatersCorp. Manchester, UK), MALDI TOF/TOF rapifleX and MALDIqTOF timsTOF fleX (ttfleX, Bruker Daltonik GmbH, Bremen,Germany).
Data acquisition: MALDI MSP. The Synapt G2 HDMS is sup-plied with a neodymium-doped yttrium aluminium garnet(Nd:YAG) laser which was set at a repetition rate of 1 kHz. Dataacquisition was performed over the m/z range 600–2500 inpositive mode. A 0.5 μL spot of saturated red phosphorus solu-tion in ACN was used as the internal calibrant for each sampleby acquiring a spectrum in the same acquisition instance asthe sample. MALDI MS/MS spectra were obtained setting theresolution of the quadrupole at 4.4 and 11 for low mass (LM)and high mass (HM) respectively. Argon was used as the col-lision gas; with the cooling gas set at 10.0 a.u. and the trap gasat 7.5 a.u. The trap collision energy was ramped between 80and 100 eV. The MALDI rapifleX is equipped with a Nd:YAG355 nm SmartBeamTM 3D laser operating at a repetition rateof 10 kHz. The instrument was calibrated using a Brukerpeptide calibration standard mono mix between m/z1046–2455. MS spectra were obtained in reflectron positivemode in the mass range m/z 600–3200, with laser power of 35a.u. The MALDI ttfleX mass spectrometer is equipped with aSmartbeam 3D laser operated at a repetition rate of 10 kHz.When using the ttfleX for MALDI MSP, the instrument wascalibrated in positive mode over the m/z range 100–3000 usingred phosphorus. In MS mode, five hundred laser shots perspectrum were fired and typically 10 acquired single spectrawere summed. MS/MS spectra were obtained by ramping thecollision energy between 80–130 eV. Five thousand laser shotper single spectra were acquired and typically 10 single spectrawere summed.
Data acquisition: MALDI MSI. Imaging data were acquiredon the MALDI Synapt G2 HDMS and on a MALDI ttfleX massspectrometer.
In the former case, side by side blood stain images wereacquired in the mass range m/z 600–2000, setting the laserpower at 250 a.u. When using the MALDI ttfleX mass spectro-meter, blood fingermarks (including overlapping) wereacquired at a lateral resolution of 50 µm, a laser power of 65%and accumulating 600 laser shots per pixel. The instrumentwas previously calibrated in ESI mode using Agilent low con-centration calibration mix (G1969-85000) and operated in posi-tive mode and in full scan over the m/z range 100–3000.
Data processing. In silico determination of the proteotypicpeptide sequences (across the six variants and the HbA0) was
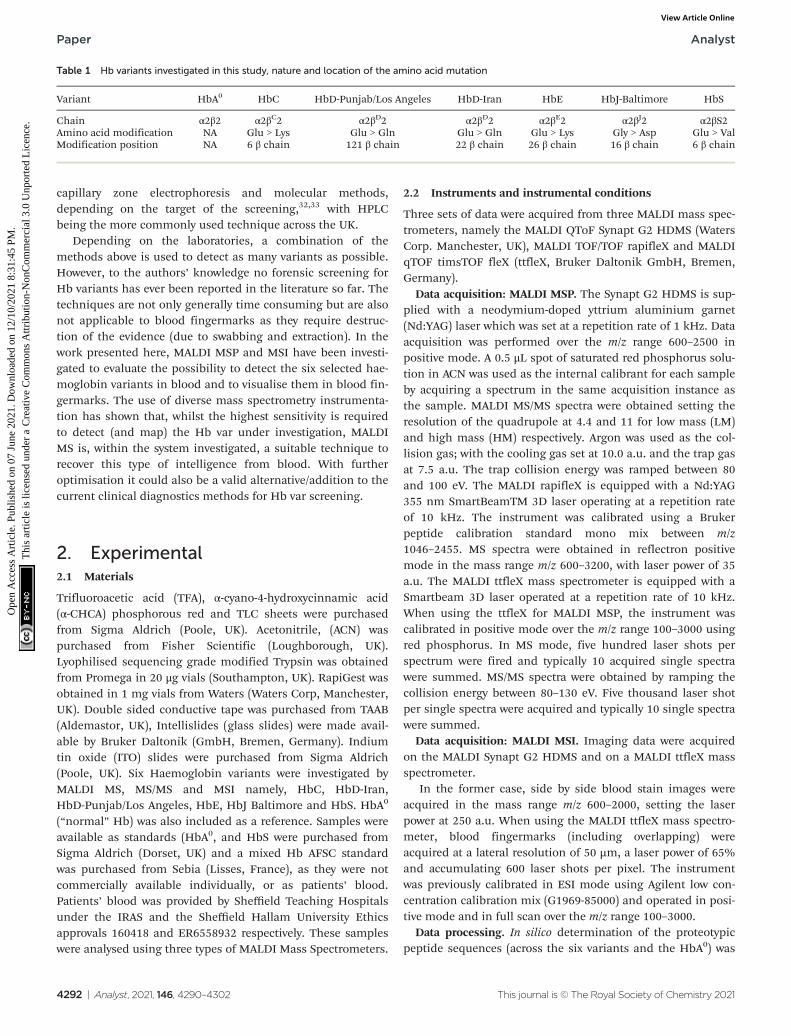
Table 1 Hb variants investigated in this study, nature and location of the amino acid mutation
Variant HbA0 HbC HbD-Punjab/Los Angeles HbD-Iran HbE HbJ-Baltimore HbS
Chain α2β2 α2βC2 α2βD2 α2βD2 α2βE2 α2βJ2 α2βS2Amino acid modification NA Glu > Lys Glu > Gln Glu > Gln Glu > Lys Gly > Asp Glu > ValModification position NA 6 β chain 121 β chain 22 β chain 26 β chain 16 β chain 6 β chain
Paper Analyst
4292 | Analyst, 2021, 146, 4290–4302 This journal is © The Royal Society of Chemistry 2021
Ope
n A
cces
s A
rtic
le. P
ublis
hed
on 0
7 Ju
ne 2
021.
Dow
nloa
ded
on 1
2/10
/202
1 8:
31:4
5 PM
. T
his
artic
le is
lice
nsed
und
er a
Cre
ativ
e C
omm
ons
Attr
ibut
ion-
Non
Com
mer
cial
3.0
Unp
orte
d L
icen
ce.
View Article Online
performed by preliminarily identifying the amino acidmutation in the β-globin chain using a database of haemo-globin variants accessible at https://globin.bx.psu.edu/globin/Hbvar/. Subsequently, an in silico digestion with trypsin wasperformed using Uniprot KB (https://www.uniprot.org/). Herethe β haemoglobin chain sequence was in silico digestedsetting the maximum number of missed cleavages to 2 and toyield MH+ monoisotopic peptides up to m/z 3000. The resultswere navigated by identifying the peptides with up to 3 clea-vages sites containing the amino acid modification for eachvariant. Finally proteotypic peptides were identified throughfiltering out peptides with the same theoretical m/z and thosediffering by less than 15 ppm (Table 2).
MALDI MS and MS/MS spectra acquired from all threeMALDI Mass Spectrometers were exported to txt files and pro-cessed using mMass, an open source mass spectrometrytool.34,35 For the Synapt G2 HDMS and rapifleX data, spectrawere batch processed by smoothing using the Savitzky–Golayalgorithm, a m/z window size of 0.2 and 1 smoothing cycle;peak picking was also performed by setting the S/N thresholdat 4.0, the absolute and relative intensity threshold at 0.0 a.u.and 0.5 respectively and the picking height at 100. MALDI MSand MS/MS spectra acquired using the ttfleX instrument werepreliminarily processed using DataAnalysis software (BrukerDaltonik GmbH, Bremen, Germany) and then converted intotxt file to be further processed in mMass where no furthersmoothing was applied; the peak picking was performed forall ttfleX spectra by setting the S/N threshold at 20.0, the absol-ute and relative intensity threshold at 0.0 a.u. and 0.5 respect-ively and the picking height at 98 a.u. Haemoglobn variantproteotypic peptides were used to build a database in mMassfor the automatic assignment of Hb var in MS mode.Depending on the instrument employed and calibrationachieved, a different mass tolerance for assignment wasemployed: ±13 ppm for Synapt, ±11 pm for rapifleX and±4 ppm for ttfleX MS spectra.
ttfleX MALDI MS images were generated using SCiLSlab2021a software (Bruker Daltonik, Bremen, Germany) with amass accuracy of ±15 ppm, using no de-noising (to avoid lossof ridge detail) and normalising against RMS. Brightness andcontrast were adjusted to optimal values to improve clarity ofridge detail. Synapt MALDI MS images were generated usingthe HDI software (Waters Corp Manchester) and normalisedagainst the total ion current.
2.3 Trypsin digestion
For MALDI MS Profiling experiments, all in-solution trypsindigestions were performed as follows: 5 µL of blood samplewere dissolved in 1 mL of H2O. Ten µL of diluted bloodsample was added to 40 µL 40 mM AmBic. Nine µL of trypsinat 20 µg mL−1 (containing 0.1% RapiGest) was added and themixture was incubated at 37 °C for 1 h. Two µL 5% TFA werethen added to stop the proteolysis.
For MALDI MSI analysis on the Synapt G2 HDMS instru-ment, 9 layers of trypsin gold at 100 µg mL−1 (containing 0.1%RapiGest) were sprayed over the blood stains using aSunCollect matrix sprayer (SunChrom, Germany), at a flow rateof 2 µL min−1. The stains were incubated in a sealed containercontaining 50 : 50 MeOH : H2O at 37 °C for 3 h. The sampleswere then sprayed with 5 layers of α-CHCA matrix at 5 mgmL−1 in 70 : 30 ACN:0.5% TFA at 4 µL min−1.
Blood contaminated fingermarks were prepared by deposit-ing 10 µL of patient blood samples (containing either one ofthe Hb variants investigated) on the fingertip of a in house 3Dprinted silicon fingertip and quickly dragging the bloodaround with the pipette tip until covering the mark. The fin-gertip was subsequently pressed on an Intellislide to generatea Hb var contaminated blood fingerprint. An additionalsample was prepared by pressing a silicon fingertip contami-nated with HbC blood and a silicon fingertip contaminated byHbJ-Baltimore blood on an Intellislide to generate overlappingmarks. These marks were subsequently enhanced using Acid
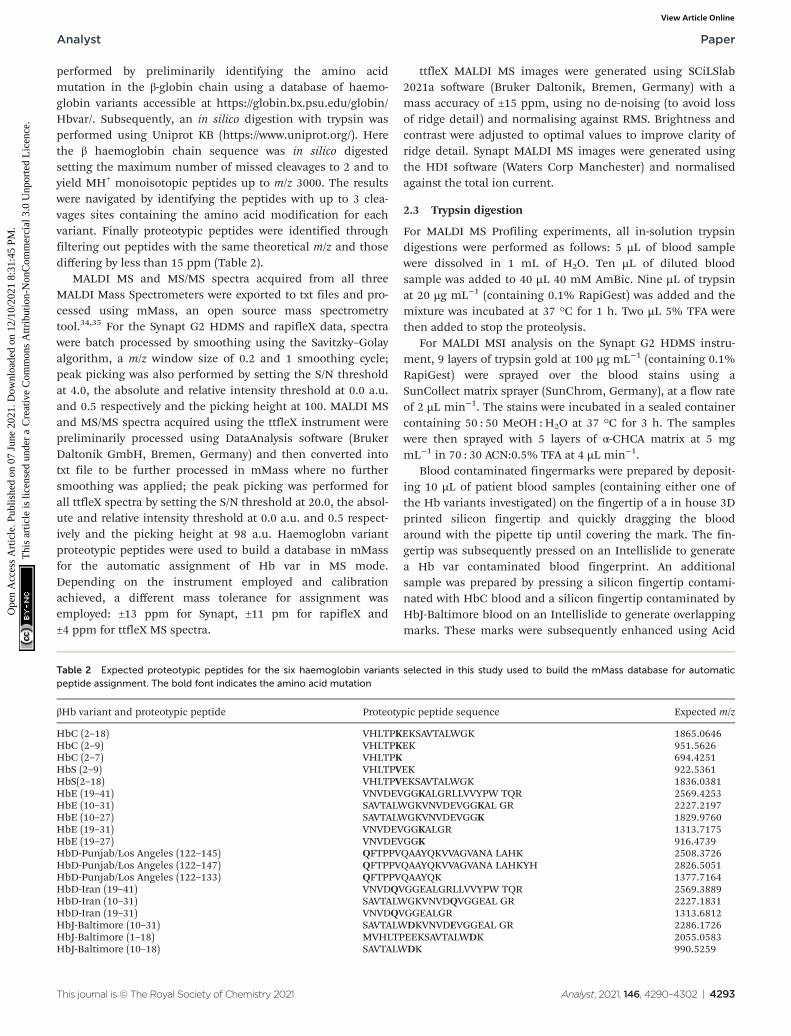
Table 2 Expected proteotypic peptides for the six haemoglobin variants selected in this study used to build the mMass database for automaticpeptide assignment. The bold font indicates the amino acid mutation
βHb variant and proteotypic peptide Proteotypic peptide sequence Expected m/z
HbC (2–18) VHLTPKEKSAVTALWGK 1865.0646HbC (2–9) VHLTPKEK 951.5626HbC (2–7) VHLTPK 694.4251HbS (2–9) VHLTPVEK 922.5361HbS(2–18) VHLTPVEKSAVTALWGK 1836.0381HbE (19–41) VNVDEVGGKALGRLLVVYPW TQR 2569.4253HbE (10–31) SAVTALWGKVNVDEVGGKAL GR 2227.2197HbE (10–27) SAVTALWGKVNVDEVGGK 1829.9760HbE (19–31) VNVDEVGGKALGR 1313.7175HbE (19–27) VNVDEVGGK 916.4739HbD-Punjab/Los Angeles (122–145) QFTPPVQAAYQKVVAGVANA LAHK 2508.3726HbD-Punjab/Los Angeles (122–147) QFTPPVQAAYQKVVAGVANA LAHKYH 2826.5051HbD-Punjab/Los Angeles (122–133) QFTPPVQAAYQK 1377.7164HbD-Iran (19–41) VNVDQVGGEALGRLLVVYPW TQR 2569.3889HbD-Iran (10–31) SAVTALWGKVNVDQVGGEAL GR 2227.1831HbD-Iran (19–31) VNVDQVGGEALGR 1313.6812HbJ-Baltimore (10–31) SAVTALWDKVNVDEVGGEAL GR 2286.1726HbJ-Baltimore (1–18) MVHLTPEEKSAVTALWDK 2055.0583HbJ-Baltimore (10–18) SAVTALWDK 990.5259
Analyst Paper
This journal is © The Royal Society of Chemistry 2021 Analyst, 2021, 146, 4290–4302 | 4293
Ope
n A
cces
s A
rtic
le. P
ublis
hed
on 0
7 Ju
ne 2
021.
Dow
nloa
ded
on 1
2/10
/202
1 8:
31:4
5 PM
. T
his
artic
le is
lice
nsed
und
er a
Cre
ativ
e C
omm
ons
Attr
ibut
ion-
Non
Com
mer
cial
3.0
Unp
orte
d L
icen
ce.
View Article Online
Black 1, a commonly used crime lab technique for bloodenhancement in fingermarks, according to the methanol-based protocol described by the Home Office edited finger-mark visualisation manual.36 Sequencing grade Trypsin wasreconstituted in 20 mM of ammonium bicarbonate to a finalconcentration of 25 ng µL−1. Trypsin was deposited using theHTX M3 sprayer (HTX Technologies LLC, US) at a temperatureof 30 °C and a pressure of 10 psi. The flow rate and the nozzleheight were set at 30 µL min−1 and 40 mm respectively. A totalof 8 layers of trypsin were deposited at a velocity of 750 mmmin−1 and using a criss-cross pattern with 2 mm trackspacing. Following trypsin deposition, the glass slides contain-ing the fingermarks were placed on top a two glass tubes or15 mL Sarstedt tubes in a lunch box. Ten µL of water werepipetted on top of the glass slide but far away from the finger-prints. The lunch box contained 40 mL of a saturated K2SO4
solution (75 g in 500 mL water) and a further spoonful ofK2SO4 was added before sealing the lunch box. The slides wereincubated for 2 h at 50 °C. Overlapping fingermarks were sub-mitted to MALDI MSI on a ttfleX mass spectrometer.
2.4 Matrix deposition
For MALDI MS and MS/MS data acquisition on the Synapt G2HDMS, α-cyano 4 hydroxycinnamic acid (α-CHCA) was pre-pared at a concentration of 5 mg mL−1 in 70 : 30 ACN:0.5%TFA, and 0.5 µL was pipette mixed with the sample on aMALDI target plate.
For MALDI MS on the rapifleX, α-CHCA was prepared at5 mg mL−1 in 70 : 30 ACN:0.5% TFA and 0.5 µL was spotted ontop of the sample spots that had been allowed to dry in avacuum desiccator. For MALDI MS and MS/MS on the ttfleXmass spectrometer, haemoglobin standard and patient blooddigests were mixed 1 : 1 with α-CHCA solution saturated in 30/70 ACN/0.1%TFA. One µL of this solution was applied on anAnchor 800 target plate. After drying (crystallization) theMALDI spot was washed once with 3 µL water containing 0.1%TFA as a clean-up procedure.
For MALDI MSI on the Synapt, 5 layers of α-CHCA at5 mg mL−1 in 70 : 30 ACN:0.5% TFA were sprayed at 2 µLmin−1.
For MALDI MSI on the ttfleX, a solution of 10 mg mL−1 ofα-CHCA, in 70 : 30 ACN : TFAaq 0.2%, was sprayed using a HTXM3 sprayer (HTX Technologies LLC, US) at 75 °C, 10 psipressure and at a flow rate of 120 µL min−1. The nozzle heightwas set at 40 mm. Four layers of matrix were sprayed with2 mm track spacing and a velocity of 1200 mm min−1.
3. Results and discussion
In this study, the first of its kind, a combined proteomics-MALDI MSP/MSI based approach was developed to quicklyidentify (in bloodstains) and map (in blood fingermarks) sixmost common haemoglobin variants (Hb var), HbS, HbC,HbD-Punjab/Los Angeles, HbD-Iran, HbE and HbJ-Baltimore.Hb var screening belongs to clinical diagnostic settings.
However, it has been pursued here through a forensic perspec-tive as a means to provide additional intelligence from examin-ation of blood evidence. A relatively large sample set ofpatients’ blood, containing different Hb var was used formethod development and investigated on the MALDI SynaptG2 system, for a total of 44 samples which were spotted andanalysed in triplicate. The samples were received in differentbatches at different times over the course of 2 years in whichinstrumental conditions may have varied. Although here the44 samples are discussed as a whole, dates of shipment havebeen highlighted. The identity of the samples was blind to theanalyst processing the data until the Hb var assignment wascompleted. Table S1† reports a summary of the putative detec-tion of the Hb variants during method development on theSynapt G2 HDMS instrument.
The HbD-Punjab/Los Angeles variant was detected only inone out of the seven supplied patients’ samples and theHbJ-Baltimore variant was detected in the only patient’ssample supplied of this kind. The three normal haemoglobinsamples (HbA0) and the two HbD-Iran samples were alwayscorrectly labelled as “no variant detection” and HbD-Iranrespectively.
Nine out of ten patients’ samples were correctly labelledwith the HbS variant reflecting the high ionisability of the pro-teotypic peptide 2–9. The next best result was achieved for theHbC variant which was correctly identified in 8/11 patients’samples. Finally, of the ten HbE patients’ samples, six sampleswere correctly labelled as HbE. It is important to note that asquantification is not performed, it is not possible to establishwhether the variant detected indicates that a patient is hetero-zygous or homozygous for the variant identified. For example,in the case of sickle cell anaemia heterozygous HbS, thevariant is indicated as HbAS whereas the pathology as HbSS.Our results would report HbS, regardless of whether thepatients have a trait (HbAS) or the actual pathology (HbSS).
Table S2† reports the accurate list of proteotypic peptidesm/z assignments (using the custom built mMass library shownin Fig. 2) relating to 1 replicate per samples only, forreadability.
An additional batch of nine patients’ blood samples wasreceived and submitted to the MALDI Synapt (3 replicates persample) as well as to additional two state of the art MALDImass Spectrometers, namely rapifleX (3 replicates per sample)and timsTOF fleX (ttfleX) (2 replicates per sample) to ascertainwhether correct putative identification frequency could beimproved as well as confirming identity using tandem MS.Although it is difficult to directly compare on paper the sensi-tivities of the three MALDI instruments based on the manufac-turer specifications, these are all very sensitive instruments;the sensitivity specifications are all based on the measurementof the same peak at m/z 1570.7 relating to [Glu1]-Fibrinopeptide B (GluFib) as follows: (i) Synapt: 10 fmolGluFib at S/N > 90 : 1; (ii) rapifleX: 250 amol GluFib at S/N ≥200 : 1 shown on Bruker AnchorChip™ target with 2000 lasershots; (iii) ttfleX: S/N > 100 : 1 for 250 amol GluFib on targetS/N with 2000 laser shots. MALDI MS analyses were conducted
Paper Analyst
4294 | Analyst, 2021, 146, 4290–4302 This journal is © The Royal Society of Chemistry 2021
Ope
n A
cces
s A
rtic
le. P
ublis
hed
on 0
7 Ju
ne 2
021.
Dow
nloa
ded
on 1
2/10
/202
1 8:
31:4
5 PM
. T
his
artic
le is
lice
nsed
und
er a
Cre
ativ
e C
omm
ons
Attr
ibut
ion-
Non
Com
mer
cial
3.0
Unp
orte
d L
icen
ce.
View Article Online
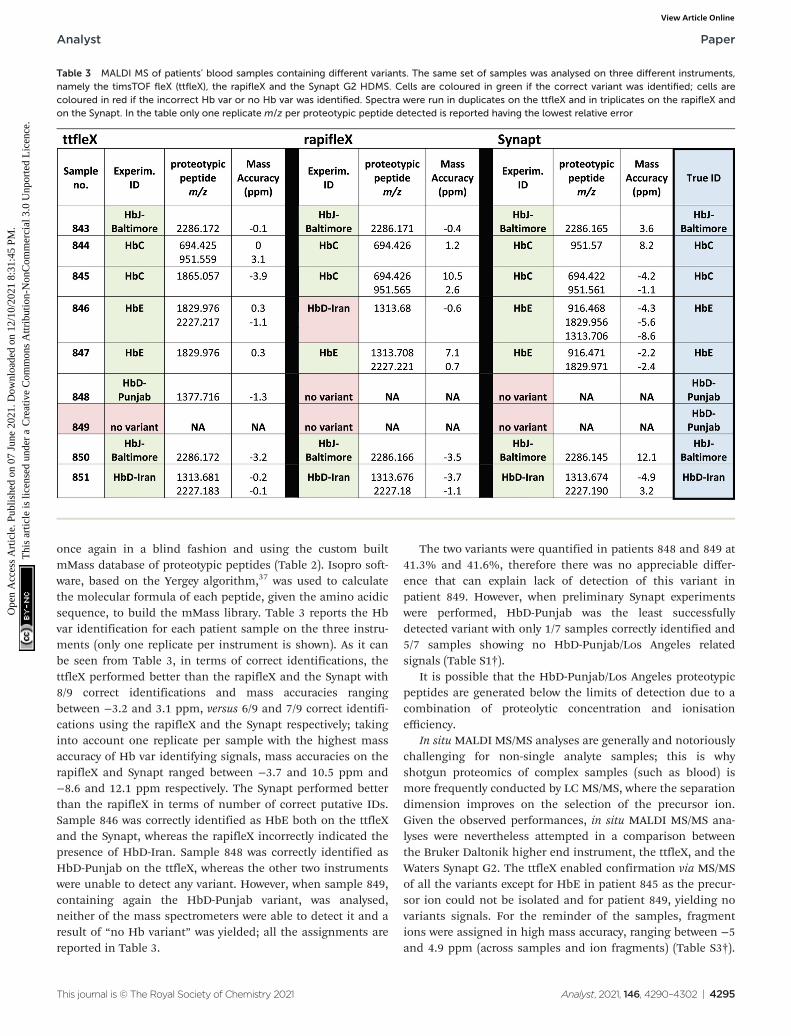
once again in a blind fashion and using the custom builtmMass database of proteotypic peptides (Table 2). Isopro soft-ware, based on the Yergey algorithm,37 was used to calculatethe molecular formula of each peptide, given the amino acidicsequence, to build the mMass library. Table 3 reports the Hbvar identification for each patient sample on the three instru-ments (only one replicate per instrument is shown). As it canbe seen from Table 3, in terms of correct identifications, thettfleX performed better than the rapifleX and the Synapt with8/9 correct identifications and mass accuracies rangingbetween −3.2 and 3.1 ppm, versus 6/9 and 7/9 correct identifi-cations using the rapifleX and the Synapt respectively; takinginto account one replicate per sample with the highest massaccuracy of Hb var identifying signals, mass accuracies on therapifleX and Synapt ranged between −3.7 and 10.5 ppm and−8.6 and 12.1 ppm respectively. The Synapt performed betterthan the rapifleX in terms of number of correct putative IDs.Sample 846 was correctly identified as HbE both on the ttfleXand the Synapt, whereas the rapifleX incorrectly indicated thepresence of HbD-Iran. Sample 848 was correctly identified asHbD-Punjab on the ttfleX, whereas the other two instrumentswere unable to detect any variant. However, when sample 849,containing again the HbD-Punjab variant, was analysed,neither of the mass spectrometers were able to detect it and aresult of “no Hb variant” was yielded; all the assignments arereported in Table 3.
The two variants were quantified in patients 848 and 849 at41.3% and 41.6%, therefore there was no appreciable differ-ence that can explain lack of detection of this variant inpatient 849. However, when preliminary Synapt experimentswere performed, HbD-Punjab was the least successfullydetected variant with only 1/7 samples correctly identified and5/7 samples showing no HbD-Punjab/Los Angeles relatedsignals (Table S1†).
It is possible that the HbD-Punjab/Los Angeles proteotypicpeptides are generated below the limits of detection due to acombination of proteolytic concentration and ionisationefficiency.
In situ MALDI MS/MS analyses are generally and notoriouslychallenging for non-single analyte samples; this is whyshotgun proteomics of complex samples (such as blood) ismore frequently conducted by LC MS/MS, where the separationdimension improves on the selection of the precursor ion.Given the observed performances, in situ MALDI MS/MS ana-lyses were nevertheless attempted in a comparison betweenthe Bruker Daltonik higher end instrument, the ttfleX, and theWaters Synapt G2. The ttfleX enabled confirmation via MS/MSof all the variants except for HbE in patient 845 as the precur-sor ion could not be isolated and for patient 849, yielding novariants signals. For the reminder of the samples, fragmentions were assigned in high mass accuracy, ranging between −5and 4.9 ppm (across samples and ion fragments) (Table S3†).
Table 3 MALDI MS of patients’ blood samples containing different variants. The same set of samples was analysed on three different instruments,namely the timsTOF fleX (ttfleX), the rapifleX and the Synapt G2 HDMS. Cells are coloured in green if the correct variant was identified; cells arecoloured in red if the incorrect Hb var or no Hb var was identified. Spectra were run in duplicates on the ttfleX and in triplicates on the rapifleX andon the Synapt. In the table only one replicate m/z per proteotypic peptide detected is reported having the lowest relative error
Analyst Paper
This journal is © The Royal Society of Chemistry 2021 Analyst, 2021, 146, 4290–4302 | 4295
Ope
n A
cces
s A
rtic
le. P
ublis
hed
on 0
7 Ju
ne 2
021.
Dow
nloa
ded
on 1
2/10
/202
1 8:
31:4
5 PM
. T
his
artic
le is
lice
nsed
und
er a
Cre
ativ
e C
omm
ons
Attr
ibut
ion-
Non
Com
mer
cial
3.0
Unp
orte
d L
icen
ce.
View Article Online
The Synapt G2 yielded reliable confirmatory MS/MS spectra forsamples 843, 850 and 851 with a mass accuracy rangingbetween −18.5 and 7.8 ppm (across samples and ion frag-ments) (Table S3†).
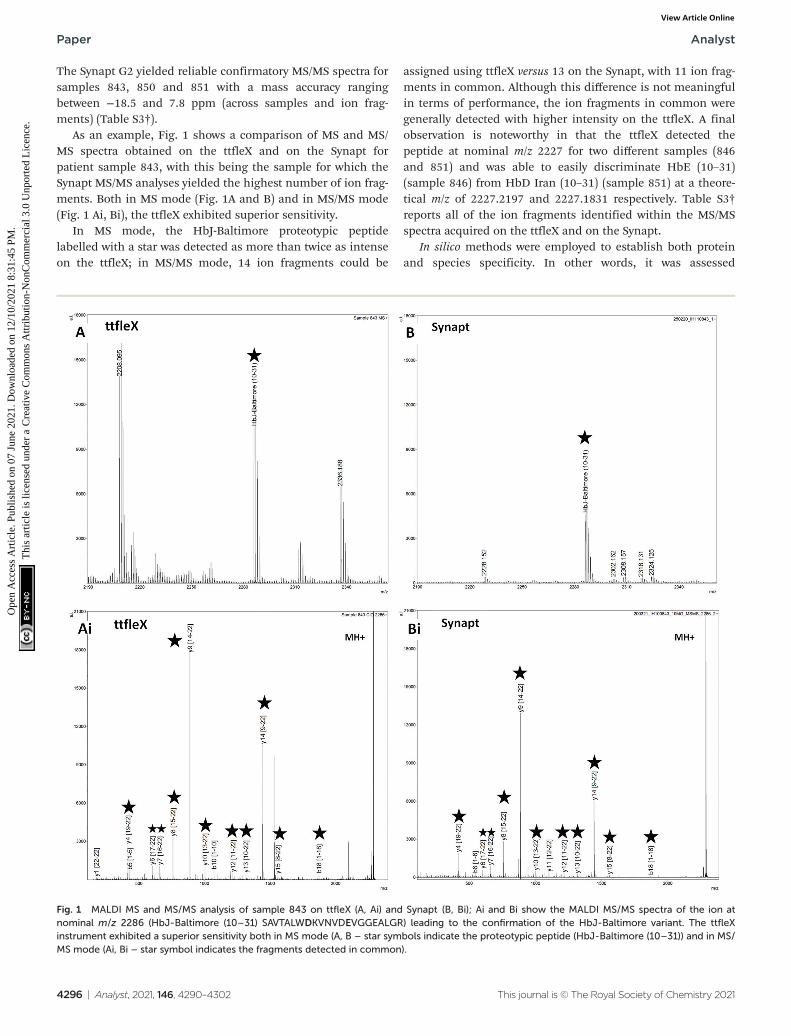
As an example, Fig. 1 shows a comparison of MS and MS/MS spectra obtained on the ttfleX and on the Synapt forpatient sample 843, with this being the sample for which theSynapt MS/MS analyses yielded the highest number of ion frag-ments. Both in MS mode (Fig. 1A and B) and in MS/MS mode(Fig. 1 Ai, Bi), the ttfleX exhibited superior sensitivity.
In MS mode, the HbJ-Baltimore proteotypic peptidelabelled with a star was detected as more than twice as intenseon the ttfleX; in MS/MS mode, 14 ion fragments could be
assigned using ttfleX versus 13 on the Synapt, with 11 ion frag-ments in common. Although this difference is not meaningfulin terms of performance, the ion fragments in common weregenerally detected with higher intensity on the ttfleX. A finalobservation is noteworthy in that the ttfleX detected thepeptide at nominal m/z 2227 for two different samples (846and 851) and was able to easily discriminate HbE (10–31)(sample 846) from HbD Iran (10–31) (sample 851) at a theore-tical m/z of 2227.2197 and 2227.1831 respectively. Table S3†reports all of the ion fragments identified within the MS/MSspectra acquired on the ttfleX and on the Synapt.
In silico methods were employed to establish both proteinand species specificity. In other words, it was assessed
Fig. 1 MALDI MS and MS/MS analysis of sample 843 on ttfleX (A, Ai) and Synapt (B, Bi); Ai and Bi show the MALDI MS/MS spectra of the ion atnominal m/z 2286 (HbJ-Baltimore (10–31) SAVTALWDKVNVDEVGGEALGR) leading to the confirmation of the HbJ-Baltimore variant. The ttfleXinstrument exhibited a superior sensitivity both in MS mode (A, B – star symbols indicate the proteotypic peptide (HbJ-Baltimore (10–31)) and in MS/MS mode (Ai, Bi – star symbol indicates the fragments detected in common).
Paper Analyst
4296 | Analyst, 2021, 146, 4290–4302 This journal is © The Royal Society of Chemistry 2021
Ope
n A
cces
s A
rtic
le. P
ublis
hed
on 0
7 Ju
ne 2
021.
Dow
nloa
ded
on 1
2/10
/202
1 8:
31:4
5 PM
. T
his
artic
le is
lice
nsed
und
er a
Cre
ativ
e C
omm
ons
Attr
ibut
ion-
Non
Com
mer
cial
3.0
Unp
orte
d L
icen
ce.
View Article Online

whether or not the proteotypic peptides employed to detecteach of the Hb var: (1) could only derive from those human βHaemoglobin variants and (2) are specific to human. For thispurpose, the amino acid sequences of all proteotypic peptideswere screened against the UniProtKB/Swiss-Prot protein knowl-edgebase release 2021_01 containing 564 277 manually anno-tated and reviewed proteins from 14 014 species. Using thepeptide search tool against the entirety of the taxonomyincluded in the database, searches were run only against themanually annotated and reviewed proteins. Table S4† reportsthe summary of these searches.
In brief, using the “peptide search” tool, only 8/19 proteoty-pic peptide sequences yielded a hit and all hits were againsthuman haemoglobin except for HbC (2–7) peptide. Thissequence was matched to proteins in Fungi, metazoa, bacteriaand human; interestingly, this sequence in human matches tothe thyroid adenoma-associated protein. This protein isexpressed in pancreas, adrenal medulla, thyroid, adrenalcortex, testis, thymus, small intestine and stomach and assuch it seems unlikely to be detected in blood. However, to dis-sipate any doubt on the identity of the detected peptide, theadditional detection of the HbC (2–9) could be checked toconfirm the presence of HbC. The Blast tool was also used inparallel to check homologies and HbC (2–7) yielded no hitshaving a 100% homology. This was the case also for all theproteotypic peptides except for HbE (10–27) and HbJ-Baltimore(10–31). In the former case, a 100% homology with β haemo-globin was found for both human and primates and in thelatter case a 100% homology with β haemoglobin was foundfor the species Gorilla gorilla.
Whilst detection of Hb var in blood stains and/or blood fin-germarks may contribute to narrowing down the pool of sus-pects, visualisation of these variants onto the fingermark ridgepattern provides important and direct associative evidence. Afirst MALDI MS imaging experiment was performed aiming at
the visualisation of Hb var and differentiation in the presenceof blood of different origin. Initially, two bloodstains fromHbS and normal HbA0 patients’ blood were deposited side byside and imaged on a MALDI Synapt G2 as a proof of concept.Fig. 2 shows the visualisation of the aspecific α-Hb peptide atm/z 1529.68 which was present in both stains as expected.
In contrast, the HbS proteotypic peptide at m/z 922.48 wasonly visible in the HbS bloodstain and well discriminated fromthe stain containing the normal HbA0 variant, as both theMALDI images and the spectra extracted from the regions ofinterest of patients 1 and 2 show (Fig. 2B). A subsequentattempt to image overlapping HbS/HbA0 fingermarks failed onthis mass spectrometer. For this reason, blood fingermarkswere produced using patient blood samples containing the sixvariants under investigation and imaged using the ttfleXMALDI system. MALDI MSI data reflected at large the dataobtained through MALDI MSP using the same instrument;generally, Hb var proteotypic peptides that were detected inMS mode and confirmed by MS/MS, were also mapped ontothe ridge pattern of the mark and contributed to some degreeof ridge detail and minutiae visualisation. In particular Fig. 3reports the distribution maps of the proteotypic peptides HbC(2–7) at m/z 694.420 (i), HbC (2–9) at m/z 951.563 (ii), HbE(10–27) at m/z 1829.976 (iii), HbE (10–31) at m/z 2227.220 (iv),HbD-Punjab/Los Angeles (121–133) at m/z 1377.719 (v),HbD-Iran (19–31) at m/z 1313.687 (vi), HbD-Iran (10–31) at m/z2227.183 (vii), HbJ-Baltimore (10–31) at m/z 2286.173 (viii) andHbS (2–9) at m/z 922.536 (ix), within a mass accuracy of±10 ppm.
The HbS variant proteotypic peptide provided the mostridge flow and minutiae visualisation, in line with the betterionisation efficiency amongst all other Hb variant proteotypicpeptides observed in MALDI MS mode. Other Hb var proteo-typic peptides were visualised on the fingerprint samples(largely in a “dotted” fashion) but they are not reported in
Fig. 2 MALDI MS imaging of two bloodstains from HbS and HbA0 patients (patients 1 and 2 respectively) on the Synapt G2 HDMS system. Panel Ashows visualisation of the aspecific α-Hb peptide at m/z 1529.680 in both stains as expected. Panel B shows the presence of the HbS proteotypicpeptide at m/z 922.48 only in the bloodstain of the HbS patient as also confirmed in the ROIs extracted spectra.
Analyst Paper
This journal is © The Royal Society of Chemistry 2021 Analyst, 2021, 146, 4290–4302 | 4297
Ope
n A
cces
s A
rtic
le. P
ublis
hed
on 0
7 Ju
ne 2
021.
Dow
nloa
ded
on 1
2/10
/202
1 8:
31:4
5 PM
. T
his
artic
le is
lice
nsed
und
er a
Cre
ativ
e C
omm
ons
Attr
ibut
ion-
Non
Com
mer
cial
3.0
Unp
orte
d L
icen
ce.
View Article Online
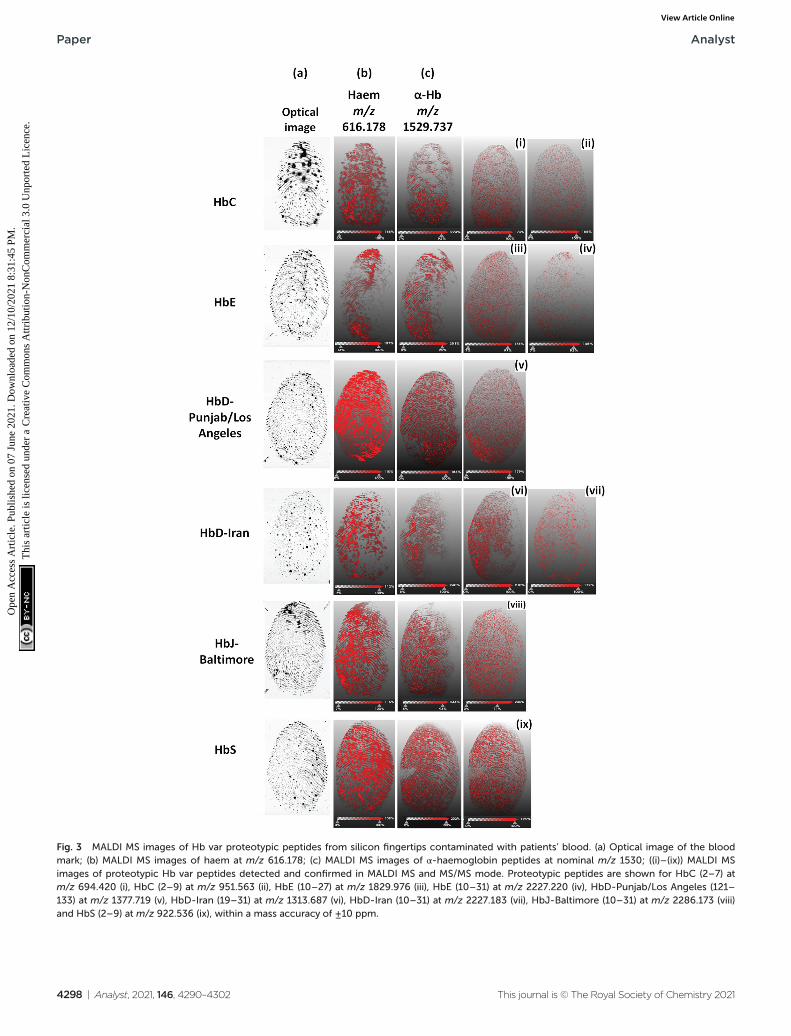
Fig. 3 MALDI MS images of Hb var proteotypic peptides from silicon fingertips contaminated with patients’ blood. (a) Optical image of the bloodmark; (b) MALDI MS images of haem at m/z 616.178; (c) MALDI MS images of α-haemoglobin peptides at nominal m/z 1530; ((i)–(ix)) MALDI MSimages of proteotypic Hb var peptides detected and confirmed in MALDI MS and MS/MS mode. Proteotypic peptides are shown for HbC (2–7) atm/z 694.420 (i), HbC (2–9) at m/z 951.563 (ii), HbE (10–27) at m/z 1829.976 (iii), HbE (10–31) at m/z 2227.220 (iv), HbD-Punjab/Los Angeles (121–133) at m/z 1377.719 (v), HbD-Iran (19–31) at m/z 1313.687 (vi), HbD-Iran (10–31) at m/z 2227.183 (vii), HbJ-Baltimore (10–31) at m/z 2286.173 (viii)and HbS (2–9) at m/z 922.536 (ix), within a mass accuracy of ±10 ppm.
Paper Analyst
4298 | Analyst, 2021, 146, 4290–4302 This journal is © The Royal Society of Chemistry 2021
Ope
n A
cces
s A
rtic
le. P
ublis
hed
on 0
7 Ju
ne 2
021.
Dow
nloa
ded
on 1
2/10
/202
1 8:
31:4
5 PM
. T
his
artic
le is
lice
nsed
und
er a
Cre
ativ
e C
omm
ons
Attr
ibut
ion-
Non
Com
mer
cial
3.0
Unp
orte
d L
icen
ce.
View Article Online
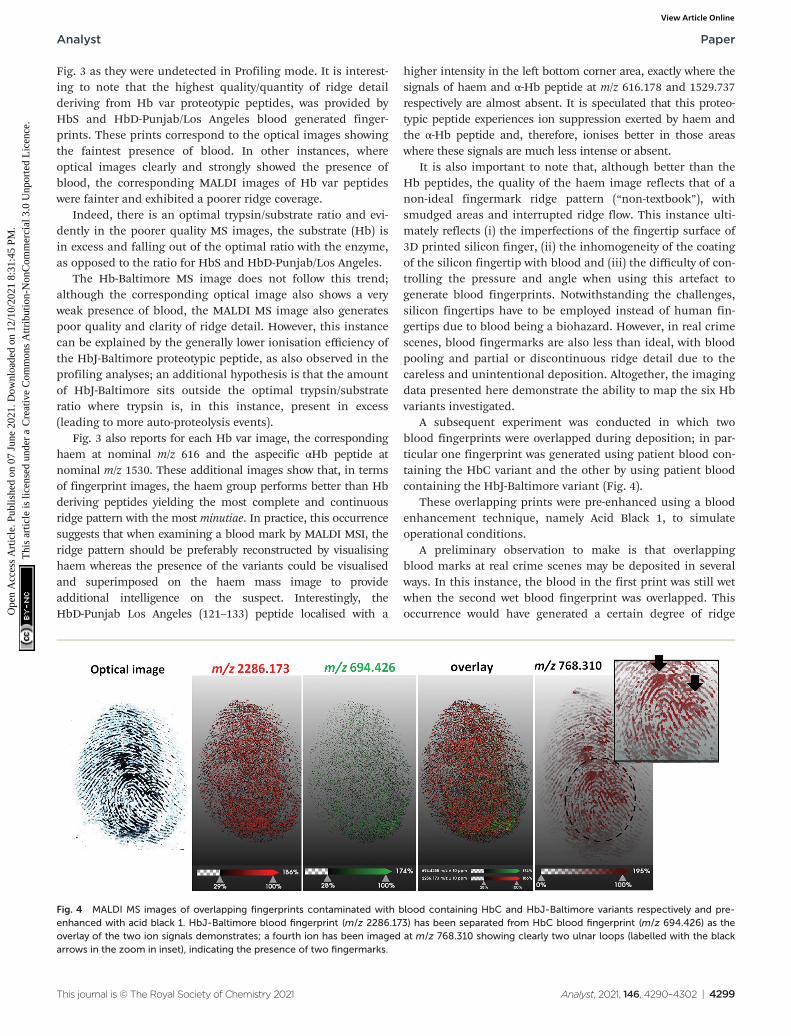
Fig. 3 as they were undetected in Profiling mode. It is interest-ing to note that the highest quality/quantity of ridge detailderiving from Hb var proteotypic peptides, was provided byHbS and HbD-Punjab/Los Angeles blood generated finger-prints. These prints correspond to the optical images showingthe faintest presence of blood. In other instances, whereoptical images clearly and strongly showed the presence ofblood, the corresponding MALDI images of Hb var peptideswere fainter and exhibited a poorer ridge coverage.
Indeed, there is an optimal trypsin/substrate ratio and evi-dently in the poorer quality MS images, the substrate (Hb) isin excess and falling out of the optimal ratio with the enzyme,as opposed to the ratio for HbS and HbD-Punjab/Los Angeles.
The Hb-Baltimore MS image does not follow this trend;although the corresponding optical image also shows a veryweak presence of blood, the MALDI MS image also generatespoor quality and clarity of ridge detail. However, this instancecan be explained by the generally lower ionisation efficiency ofthe HbJ-Baltimore proteotypic peptide, as also observed in theprofiling analyses; an additional hypothesis is that the amountof HbJ-Baltimore sits outside the optimal trypsin/substrateratio where trypsin is, in this instance, present in excess(leading to more auto-proteolysis events).
Fig. 3 also reports for each Hb var image, the correspondinghaem at nominal m/z 616 and the aspecific αHb peptide atnominal m/z 1530. These additional images show that, in termsof fingerprint images, the haem group performs better than Hbderiving peptides yielding the most complete and continuousridge pattern with the most minutiae. In practice, this occurrencesuggests that when examining a blood mark by MALDI MSI, theridge pattern should be preferably reconstructed by visualisinghaem whereas the presence of the variants could be visualisedand superimposed on the haem mass image to provideadditional intelligence on the suspect. Interestingly, theHbD-Punjab Los Angeles (121–133) peptide localised with a
higher intensity in the left bottom corner area, exactly where thesignals of haem and α-Hb peptide at m/z 616.178 and 1529.737respectively are almost absent. It is speculated that this proteo-typic peptide experiences ion suppression exerted by haem andthe α-Hb peptide and, therefore, ionises better in those areaswhere these signals are much less intense or absent.
It is also important to note that, although better than theHb peptides, the quality of the haem image reflects that of anon-ideal fingermark ridge pattern (“non-textbook”), withsmudged areas and interrupted ridge flow. This instance ulti-mately reflects (i) the imperfections of the fingertip surface of3D printed silicon finger, (ii) the inhomogeneity of the coatingof the silicon fingertip with blood and (iii) the difficulty of con-trolling the pressure and angle when using this artefact togenerate blood fingerprints. Notwithstanding the challenges,silicon fingertips have to be employed instead of human fin-gertips due to blood being a biohazard. However, in real crimescenes, blood fingermarks are also less than ideal, with bloodpooling and partial or discontinuous ridge detail due to thecareless and unintentional deposition. Altogether, the imagingdata presented here demonstrate the ability to map the six Hbvariants investigated.
A subsequent experiment was conducted in which twoblood fingerprints were overlapped during deposition; in par-ticular one fingerprint was generated using patient blood con-taining the HbC variant and the other by using patient bloodcontaining the HbJ-Baltimore variant (Fig. 4).
These overlapping prints were pre-enhanced using a bloodenhancement technique, namely Acid Black 1, to simulateoperational conditions.
A preliminary observation to make is that overlappingblood marks at real crime scenes may be deposited in severalways. In this instance, the blood in the first print was still wetwhen the second wet blood fingerprint was overlapped. Thisoccurrence would have generated a certain degree of ridge
Fig. 4 MALDI MS images of overlapping fingerprints contaminated with blood containing HbC and HbJ-Baltimore variants respectively and pre-enhanced with acid black 1. HbJ-Baltimore blood fingerprint (m/z 2286.173) has been separated from HbC blood fingerprint (m/z 694.426) as theoverlay of the two ion signals demonstrates; a fourth ion has been imaged at m/z 768.310 showing clearly two ulnar loops (labelled with the blackarrows in the zoom in inset), indicating the presence of two fingermarks.
Analyst Paper
This journal is © The Royal Society of Chemistry 2021 Analyst, 2021, 146, 4290–4302 | 4299
Ope
n A
cces
s A
rtic
le. P
ublis
hed
on 0
7 Ju
ne 2
021.
Dow
nloa
ded
on 1
2/10
/202
1 8:
31:4
5 PM
. T
his
artic
le is
lice
nsed
und
er a
Cre
ativ
e C
omm
ons
Attr
ibut
ion-
Non
Com
mer
cial
3.0
Unp
orte
d L
icen
ce.
View Article Online

smudging and analyte migration. Additionally, the marks weregenerated using 3D printed silicon fingertips to mitigate thebiohazard, which have not allowed generation of clear ridgedetail, due to the lack of sebaceous material that helps ‘fix’ theblood marks on surfaces and the inflexibility of the mouldscompared to real fingertips. As a result, these overlapping fin-gerprints were not “textbook models” either. The MALDIImaging data reflected the quality of the mark deposition and itwas not possible to obtain good quality ridge detail. In terms ofthe separation of the fingerprints, although it was not possibleto obtain two distinct ridge patterns, Fig. 4 very clearly showsthat it is possible to indicate the presence of two prints and twodonors, compatibly with the prior application of a typical crimelab blood enhancement technique, through to the detectionand visualisation of the two proteotypic peptides HbJ-Baltimoreat m/z 2286.173 (Fig. 4b) and HbC (Fig. 4c) at m/z 694.426. Theimage of an unidentified ion at m/z 768.310 shows additionalridge flow but most importantly corroborates the presence of2 marks due to the visualisation of two ulnar loops indicated bythe black arrows in the zoomed inset.
This initial work, limited to the six most common Hb var-iants, demonstrates in principle the possibility to inform inves-tigation on the presence of any of these variants in blood evi-dence. This intelligence could be important associative evidenceto narrow down the pool of suspects. An interesting prospect ofthis research involves the hypothesis to attempt ethnic and/orgeographic provenance. The former hypothesis is formulated onthe knowledge that, for example, sickle cell anaemia is prevalentin the African American and Hispanic populations.12 Thesecond hypothesis has stemmed from the observation reportedby one of the co-authors routinely screening Hb variants in theSheffield laboratory serving many surrounding areas andbeyond. The detection of HbD-Punjab is often an indication ofthe possible provenance of the donor of the geographicallocation; Sheffield/Rotherham area has a large South Asianpopulation (predominantly of Pakistani heritage where the HbDPunjab variant is present in approx. 0.8% of the population)therefore the detection of this variant often rightly indicates ageographical location of the donor in the Sheffield/Rotherham(Jason Eyre, personal communication). However, a thoroughstudy statistically investigating the correlation between Hb varprevalence and ethnicity/geographic provenance is needed toprove both hypotheses. Furthermore it is also important tofactor in demographics when assessing the prevalence of var-iants as large populations from a certain ethnic backgroundmay go unscreened (for example University students fromabroad), and a better indication of prevalence may be gainedfrom looking at the incidence in the country of ethnic origin.
The use of a combined proteomic/MALDI approach is alsointeresting as a possible alternative or as a preliminary screen-ing in clinical settings to reduce analytical time. In fact,although CE-HPLC or CE allow to easily discriminate forexample HbD-Punjab/Los Angeles from HbS or Hb O-Arabfrom HbE and HbC,15 these methods are still time consuming,whereas the MALDI screening is faster and can easily discrimi-nate between HbD Punjab/Los Angeles and HbS and HbC
from HbE as shown in this study. However, further investi-gation and improvements are needed to demonstrateboth robustness and quantitative capabilities; studies areneeded to assess the possibility to distinguish between traitsand pathology (for example between HbAS and HbSS) as wellas the association of other variants with HbS leading to pathol-ogy (meaning the detection of both variants in the bloodsample).
4. Conclusions
In this work, detection and mapping of haemoglobin variants(Hb var) in bloodstains and blood fingermarks have been con-ducted through a combined proteomics-MALDI basedapproach. Different MALDI instrumentation with different sen-sitivity specifications has been employed, highlighting theneed for high end equipment to reliably detect all of the sixHb var investigated (HbS, HbC HbD-Punjab/Los Angeles,HbD-Iran, HbE, HbJ-Baltimore). The opportunity to detect andmap Hb var could provide associative evidence to narrow downthe pool of suspects during an investigation. An examinationof the relevant literature has shown that there are many screen-ing programmes across the world at birth and/or in workplacesincluding detection of Hb var. Whilst these programmes areaimed at prevention at reducing healthcare costs, the Hb varmedical records could in principle be accessed during aninvestigation of a person of interest and compared with the Hbvar findings at a crime scene. Additional research is requiredto investigate detectability of additional variants, compatiblywith blood enhancement techniques, as well as robustness ofthe method against different environmental conditions andevidence age. Additional work is also required to fully under-stand the potential for Hb var to provide a meaningful indi-cation of ethnicity as well as geographical provenance basedon data on their prevalence. Finally, this work highlights thepotential to provide an alternative or first screening methodfor Hb var that could be used in clinical settings. However,this hypothesis also needs further research.
Author contributions
Cameron Heaton: investigation, methodology, formal analysis,reviewing and editing; Matthias Witt: investigation, method-ology, formal analysis, reviewing and editing; Laura Cole:supervision, reviewing and editing; Simon Tazzyman andJason Eyre: resources, reviewing and editing; Richard McColm:supervision, funding acquisition, reviewing; Simona Francese:funding acquisition, conceptualisation, project administration,supervision, writing original draft, formal analysis.
Conflicts of interest
There are no conflicts to declare.
Paper Analyst
4300 | Analyst, 2021, 146, 4290–4302 This journal is © The Royal Society of Chemistry 2021
Ope
n A
cces
s A
rtic
le. P
ublis
hed
on 0
7 Ju
ne 2
021.
Dow
nloa
ded
on 1
2/10
/202
1 8:
31:4
5 PM
. T
his
artic
le is
lice
nsed
und
er a
Cre
ativ
e C
omm
ons
Attr
ibut
ion-
Non
Com
mer
cial
3.0
Unp
orte
d L
icen
ce.
View Article Online
Acknowledgements
Sheffield Hallam University and DSTL are gratefully acknowl-edged for jointly funding Cameron Heaton’s PhD studentshipthrough the VC scholarship funding scheme. Dr Imran Jabbaris gratefully acknowledged for advising at the very early stageof this work on the fundamentals of haemoglobin variants.
References
1 R. Bradshaw, S. Bleay, M. R. Clench and S. Francese, Directdetection of blood in fingermarks by MALDI MS profilingand Imaging, Sci. Justice, 2014, 54, 110–117.
2 E. Patel, P. Cicatiello, L. Deininger, M. R. Clench,G. Marino, P. Giardina, G. Langenburg, A. West,P. Marshall, V. Sears and S. Francese, A proteomicapproach for the rapid, multi-informative and reliableidentification of blood, Analyst, 2015, 141, 191–198.
3 L. Deininger, E. Patel, M. R. Clench, V. Sears, C. Sammonand S. Francese, Investigation of infinite focus microscopyfor the determination of the association of blood with fin-germarks, Proteomics, 2016, 16, 1707–1717.
4 S. Kamanna, J. Henry, N. Voelcker, A. Linacre andK. P. Kirkbride, Bottom-up” in situ proteomic differen-tiation of human and non-human haemoglobins for foren-sic purposes by matrix–assisted laser desorption/ionizationtime of flight tandem mass spectrometry, Rapid Commun.Mass Spectrom., 2017, 31, 1927–1937.
5 S. Francese, Criminal profiling through MALDI MSbased technologies – breaking barriers towards borderfree forensic science, Aust. J. Forensic Sci., 2019, 51, 623–635.
6 K. Kennedy, C. Heaton, G. Langenburg, L. Cole, T. Clark,M. R. Clench, V. Sears, M. Sealey, R. McColm andS. Francese, Pre-validation of a MALDI MS proteomics-based method for the reliable detection of blood and bloodprovenance, Sci. Rep., 2020, 10, 17087–17104.
7 M. Witt, K. Kennedy, C. Heaton, G. Langenburg andS. Francese, Forensic visualization of blood and blood pro-venance in old fingermarks by MALDI MS Imaging. BrukerDaltonik Application Note MSI-22, 2021, https://www.bruker.com/en/products-and-solutions/mass-spectrometry/ms-software/scils-lab/_jcr_content/root/sections/more_infor-mation/sectionpar/search_copy_copy_cop.download-asset.pdf/c74307d7-facb-48a8-b702-76d89d408c2a/1885564-msi-22-imaging-fingerprints-ebook.pdf (accessed March 22,2021).
8 S. Kamanna, J. H. Nicholas, H. Voelcker, A. Linacre andK. P. Kirkbride, Direct identification of forensic body fluidsusing matrix-assisted laser desorption/ionization time-of-flight mass spectrometry, Int. J. Mass Spectrom., 2016,397–398, 18–26.
9 S. Kamanna, J. Henry, N. H. Voelcker, A. Linacre andK. P. Kirkbride, A mass spectrometry-based forensictoolbox for imaging and detecting biological fluid evidence
in fingermarks and fingernail scrapings, Int. J. Legal Med.,2017, 131, 1413–1422.
10 S. Meyer, N. Trost, B. M. Frey and C. Gassner, Paralleldonor genotyping for 46 selected blood group and4 human platelet antigens using high-throughputMALDI-TOF mass spectrometry, Methods Mol. Biol., 2015,1310, 51–70.
11 B. K. Flesch, V. Scherer, B. Just, A. Opitz, O. Ochmann,A. Janson, M. Steitz and T. Zeiler, Molecular Blood GroupScreening in Donors from Arabian Countries and IranUsing High-Throughput MALDI-TOF Mass Spectrometryand PCR-SSP, Transfus. Med. Hemother., 2020, 47, 396–408.
12 D. J. Weatherall and J. B. Clegg, Inherited haemoglobin dis-orders: an increasing global health problem, Bull. WorldHealth Organ., 2001, 79, 704–712.
13 V. Viprakasit, R. Origa and S. Fucharoen, in Guidelines forthe Management of Transfusion Dependent Thalassaemia(TDT), ed. M. D. Cappellini, A. Cohen, J. Porter, A. Taherand V. Viprakasit, Thalassaemia International FederationCyprus, Nicosia, 2014.
14 N. Swedan, K. Nicol, P. Moder and S. Kahawash,Haemoglobin J-Baltimore can be detected by HbA1c elec-tropherogram but with underestimated HbA1c value, Ther.Clin. Risk Manag., 2008, 4, 649–652.
15 V. Brunel, A. Lahary, A. Chagraoui and C. Thuillez,Haemoglobin J-Baltimore can be detected by HbA1c elec-tropherogram but with underestimated HbA1c value,Biochem. Med., 2016, 26, 240–242.
16 C. R. Wilburn, D. W. Bernard, A. W. Zieske, J. Andrieni,T. Miller and P. Wang, The Prevalence and Roleof Hemoglobin Variants in Biometric Screening ofa Multiethnic Population: One Large HealthSystem’s Experience, Am. J. Clin. Pathol., 2017, 147, 589–595.
17 H. Wajcman and K. Moradkhani, Abnormal haemoglobins:Detection & characterization, Indian J. Med. Res., 2011, 4,538–546.
18 S. L. Thein, in Blood and Bone Marrow Pathology, ed.S. N. Wickramasinghe and J. McCullough, Elsevier, UK,Edinburgh, 2011, pp. 131–155.
19 A. Suarez, J. Polski and B. Grossman, Blood transfusion-acquired hemoglobin C: A case report and review of the lit-erature, Arch. Pathol. Lab. Med., 1999, 123, 642–643.
20 M. T. Elghetany and F. B. Davy, in Clinical Diagnosis andManagement by laboratory method, ed. J. B. Henry, BSaunders Co USA, New York, 2001, pp. 561–563.
21 C. Baglioni and D. J. Weatherall, Abnormal human hemo-globins IX. Chemistry of hemoglobin J Baltimore, Biochim.Biophys. Acta, 1963, 78, 637–643.
22 M. Angastiniotis and B. Modell, Global epidemiology ofhemoglobin disorders, Ann. N. Y. Acad. Sci., 1998, 850, 251–269.
23 H. A. Itano, A Third Abnormal Hemoglobin Associated withHereditary Hemolytic Anemia, Proc. Natl. Acad. Sci. U. S. A.,1951, 37, 775–784.
Analyst Paper
This journal is © The Royal Society of Chemistry 2021 Analyst, 2021, 146, 4290–4302 | 4301
Ope
n A
cces
s A
rtic
le. P
ublis
hed
on 0
7 Ju
ne 2
021.
Dow
nloa
ded
on 1
2/10
/202
1 8:
31:4
5 PM
. T
his
artic
le is
lice
nsed
und
er a
Cre
ativ
e C
omm
ons
Attr
ibut
ion-
Non
Com
mer
cial
3.0
Unp
orte
d L
icen
ce.
View Article Online
24 C. Baglioni, Abnormal human haemoglobins VIII. chemicalstudies on haemoglobin D, Biochim. Biophys. Acta, 1962,59, 437–449.
25 L. de Souza Torres, J. V. Okumura, D. G. Silva andC. R. Bonini-Domingos, Hemoglobin D-Punjab: origin, dis-tribution and laboratory diagnosis, Rev. Bras. Hematol.Hemoter., 2015, 37, 120–126.
26 G. Fioretti, M. De Angioletti, L. Pagano, G. Lacerra, A. Violaand C. de Bonis, DNA polymorphisms associated with HbD-Los Angeles [beta 121(GH4)Glu–>Gln] in southern Italy,Hemoglobin, 1993, 17, 9–17.
27 H. Husquinet, M. T. Parent, S. Schoos-Barbette,J. Dodinval-Versie, C. Lambotte and F. Galacteros,Hemoglobin D-Los Angeles [β121(Gh4)Glu → Gln] inthe Province of Liège, Belgium, Hemoglobin, 1986, 10, 587–592.
28 A. Lischka, A. Pollak, K. Bauer, H. Aschauer andG. Braunitzer, Hemoglobin D “Los Angeles” in anAustrian Family: Biochemical Identification, ClinicalAspects, and Kindred Study, Hemoglobin, 1984, 8, 353–361.
29 E.Ö Atalay, H. Koyuncu, B. Turgut, A. Atalay, S. Yildiz andA. Bahadir, Rare Hemoglobin Variant Hb Yaizu Observedin Turkey, Hemoglobin, 2005, 29, 307–310.
30 J. Dass, A. Gupta, S. Mittal, A. Saraf, S. Langer andM. Bhargava, Comparison of the characteristics oftwo hemoglobin variants, Hb D-Iran and Hb E, eluting
in the Hb A2 window, Blood Res., 2017, 52, 130–134.
31 S. Rahbar, Haemoglobin D Iran: β222 GlutamicAcid→Glutamine (B4), Br. J. Haematol., 1973, 24, 31–35.
32 Hemoglobinopathies: Current Practices for Screening,Confirmation and Follow-up. https://www.cdc.gov/ncbddd/sicklecell/documents/nbs_hemoglobinopathy-testing_122015.pdf. 2015 (accessed March 11 2021).
33 NHS Sickle Cell and Thalassaemia ScreeningProgramme. https://assets.publishing.service.gov.uk/gov-ernment/uploads/system/uploads/attachment_data/file/585126/NHS_SCT_Handbook_for_Newborn_Laboratories.pdf (accessed March 11 2021).
34 M. Strohalm, M. Hassman, B. Košata and M. Kodíček,mMass Data Miner: An Open Source Alternative for MassSpectrometric Data Analysis, Rapid Commun. MassSpectrom., 2008, 22, 905–908.
35 M. Strohalm, D. Kavan, P. Novakand; and V. Havlicek,mMass 3: A Cross-Platform Software Environment forPrecise Analysis of Mass Spectrometric Data, Anal. Chem.,2010, 82, 4648–4651.
36 H. L. Bandey, S. M. Bleay, V. J. Bowman, R. P. Downhamand V. G. Sears, Fingermark Visualisation Manual, ed H.Bandey, Home Office, St Albans, 2014.
37 J. Yergey, A general approach to calculating isotopic distri-butions for mass spectrometry, Int. J. Mass Spectrom. IonPhys., 1983, 52, 337–349.
Paper Analyst
4302 | Analyst, 2021, 146, 4290–4302 This journal is © The Royal Society of Chemistry 2021
Ope
n A
cces
s A
rtic
le. P
ublis
hed
on 0
7 Ju
ne 2
021.
Dow
nloa
ded
on 1
2/10
/202
1 8:
31:4
5 PM
. T
his
artic
le is
lice
nsed
und
er a
Cre
ativ
e C
omm
ons
Attr
ibut
ion-
Non
Com
mer
cial
3.0
Unp
orte
d L
icen
ce.
View Article Online