Embed Size (px)
Citation preview

DETAILED MOLECULAR CHARACTERIZATION OF THE ‘Ph1 GENE REGION’ OF
WHEAT (Triticum aestivum L.)
By
GAGANPREET K SIDHU
A thesis submitted in partial fulfillment of
the requirements for the degree of
MASTER OF SCIENCE IN CROP SCIENCE (GENETICS)
WASHINGTON STATE UNIVERSITY
Department of Crop and Soil Sciences
DECEMBER 2005

ii
To the Faculty of Washington State University:
The members of the Committee appointed to examine the dissertation/thesis
of GAGANPREET K SIDHU find it satisfactory and recommend that it be accepted.
___________________________________
Chair
___________________________________
___________________________________

iii
ACKNOWLEDGMENTS
This thesis is the most significant scientific achievement of my life till now and it was not
possible without the love and support of people who believed in me.
Most of all, I would like to thank my major professor and research advisor, Dr. Kulvinder
S. Gill, whose genius guidance, mature advice and belief in me has helped me to achieve my
goal. Besides being a genius scientist, he is a very kind man. I would always appreciate his
support at the time I fell sick for one month. I am glad to work with him and I am really happy
about my decision to choose his lab for my Master’s research.
I am thankful to my committee members Dr. Steve Ullrich and Dr. Camille Steber for
their endless support and guidance especially during final days of my degree. I am especially
thankful to them for their excellent comments and suggestions on my thesis.
Many thanks to my former and present colleagues Antonio, Muharram, Mustafa, Jasdeep,
Upinder, Harvinder, Shanmukh and Rubeena for their contributions and suggestions.
I would like to express my sincerest appreciation for my special friends Navneet, Sunil,
Jasleen, Hargeet, Jasdeep and Laylah for their love and sincerity towards me, which helped me
feel like home here. I am especially grateful to Jasdeep for his guidance in everything starting
from seminars, courses to experiments in the lab.
I would like to thank my colleague and friend Dr. Mustafa Shafqat, who believed in my
abilities and inspired me to work hard.
I would like to thank my undergraduate teachers Dr. Allahrang, Dr. Manjeet S. Gill, Dr.
V. S. Sohu for their guidance I would like to extend my gratitude to Dr. Guljar S Chahal, Dr.
Paul Singh Sidhu, Dr. G. S. Sidhu for writing me letters of recommendations at the time of my
admission at both Kansas State University and Washington State University.

iv
My sincerest gratitude to my family, my mother, father, late grandfather, grandmother,
brother, sister, bhabi and my beautiful niece Pavneet, who provided me with sweet memories of
my time spent with them and always inspired me to work harder. They always supported me and
believed in me for which I would always be indebted and would like to pay off by achieving
great success in my career.

v
DETAILED MOLECULAR CHARACTERIZATION OF THE ‘Ph1 GENE REGION’ OF
WHEAT (Triticum aestivum L.)
Abstract
by Gaganpreet K. Sidhu, M.S.
Washington State University
December 2005
Chair: Kulvinder S. Gill
Common wheat (Triticum aestivum L.) is an allohexaploid and consists of three similar
genomes A, B and D. Wheat has a large genome size (16 million kb/haploid genome) but nearly
85% of the genome is repetitive DNA. The wheat genome thus can be divided into gene-rich and
gene-poor regions. The gene-rich region present around fraction length 0.5 of the long arm of the
group 5 chromosomes contains, along with many other important genes, the major chromosome
pairing regulator gene, Ph1. The Ph1 regulates bivalent behavior of allohexaploid wheat by
allowing only homologous chromosomes to pair with each other during meiosis. To physically
characterize this gene-rich region with a special focus on Ph1, wheat ESTs and other group 5
DNA markers were mapped on aneuploids and Ph1 mutants to generate a high-density physical
map for the region. The markers mapped to the ‘5L0.5 region’ were compared across the
Triticeae to identify agronomically important genes. Ph1 has been localized to the ‘Ph1 gene
region’ encompassed by the breakpoints of the terminal deletion line 5BL-1 on the proximal side
and distal breakpoint of the Ph1 gene mutant line ph1c on the distal side. Seven markers mapped
in the ‘Ph1 gene region’ identified orthologous sequences on an approximately 450 KB region
on rice (Oryza sativa) chromosome 9, revealing high synteny. Colinearity between the two
vi
species was further confirmed by the same marker order for the ‘Ph1 gene region’. Twenty-six
genes were selected for their putative Ph1 like function based on the presence of functional
motifs and domains in 91 genes, present in the 450 kb region of rice including the genes involved
in chromatin reorganization and microtubule attachment as key candidates for Ph1. The probes
mapped to the ‘Ph1 gene region’ were used to identify positive BAC clones in barley (Hordeum
vulgare) and tetraploid wheat (Triticum turgidum var durum), using Barley BAC library
(Hordeum vulgare cv. Morex) and tetraploid wheat (Triticum turgidum var durum cv Langdon)
BAC library. These probes identified 301 and 46 clones in the tetraploid wheat and barley BAC
libraries, respectively.

vii
TABLE OF CONTENTS
Page
ACKNOWLEDGEMENTS………………………………………………………………iii
ABSTRACT………………………………………………………………………….…....v
LIST OF TABLES………………………………………………………………………..ix
LIST OF FIGURES…………………………………………………..…………….….….x
CHAPTER
1. INTRODUCTION……………………………………………………………….1
1.1. Wheat Genome………………………………………………………….1
1.2. Ph1 Gene………………………………………………………………..2
1.3. Mode of Action of Ph1 Gene.…………………………………………..3
1.4. Wheat Aneuploids…………...………….………………………………4
1.5. Genetic Mapping in Wheat ……………………………………….……6
1.6. Gene Distribution in Wheat……………………………………….……8
1.7. ‘5L0.5 Region’…………………………………………………...……10
1.8. ‘Ph1 gene Region’…………………………………………………....10
1.9. Genome Relations in Grasses…………………………………….…..11
2. MATERIALS AND METHODS………………………………………………16
2.1. Plant Material………………………………………………………….16
2.2. Marker Identification…………………………………………...……..17
2.3. Gel-Blot Analysis……………………………………………………...18
2.4. DNA Sequence Analysis and Motif Search………………………...…20
2.5. Wheat and Barley BAC Library Screening…………………….……..21
2.6. BAC Clone Identification…………………………..…………….…...21
2.7. Meiosis Analysis……………………………………..………………..22
3. RESULTS AND DISCUSSION………………………………………………..23
3.1. Identification of Markers for Physical Mapping………………………23
3.2. Marker Enrichment of ‘5L0.5 Region’………………………………..24
3.3. Marker Enrichment of ‘Ph1 gene region’……………………………..25
3.4. Identification of Useful Gene/ Markers for ‘5L0.5 Region’…………..27
3.5. Identification of BAC clones for ‘Ph1 gene region’ probes…………..28

viii
3.6. Comparison of Wheat 5BL with Rice and Arabidopsis………………30
3.7.Discussion……………………………………………………………..36
BIBLIOGRAPHY………………………………………………………………………64

ix
LIST OF TABLES
1. List of useful genes present in the ‘5L0.50 region’ on the long arm of group 5 chromosomes
in the Triticeae identified by comparative mapping analysis……………………………… …42
2. The chromosome location of each probe in arabidopsis as well as rice along with the score and
e-values ……………………………………………………………………………………….45
3. Rice- Wheat relationship for chromosome arm 5BL ……………………………………….49
4. Wheat- Arbidopsis relationship for chromosome arm 5BL…………………………………50
5. Rice –Arabidopsis relationship for chromosome arm 5BL of wheat……………………….51
6. List of Ph1 gene candidates with putative function and their wheat EST homologs alongwith
putative function……………………………………………………………………………….52

x
LIST OF FIGURES
1. Physical and genetic map of Wheat chromosome 5BL……………..………………………...54
2. Banding pattern of probe mwg522 mapped to ‘5L0.5’ region….…………………………….55
3. Banding pattern of marker abc302 mapped proximal to ‘5L0.5’ region on 5BL……………..56
4. Banding pattern of probe BE636942b mapped to ‘Ph1 gene region’…………………..……..57
5. Wheat-Rice-Arabidopsis Synteny for 5BL arm Wheat…………………………..….………..58
6. Old and present view of colinearity in wheat and rice for 5BL arm…………………..………59
8. Wheat-Rice Synteny for two mini gene-rich regions on 5BL arm ………………………...…60
9. Homolgous rice ‘Ph1 gene region’ and Ph1 gene candidates………………………………...61
10. Hybridizing pattern of positive BAC clones on wheat and Barley BAC libraries screened by
‘Ph1 gene region’ probes…………………………………………………………….…………..62
12. Banding pattern of tetraploid wheat positive BAC clones identified with probe cdo1090….63

xi
Dedication
This thesis is dedicated to my mentors,
friends and family for their guidance,
support and love

1
CHAPTER ONE
INTRODUCTION
1.1. Wheat Genome:
Common wheat (Triticum aestivum L.) belongs to grass family Poaceae, which includes
other major crop plants such as oat (Avena sativa), barley (Hordeum vulgare), maize (Zea mays)
and rice (Oryza sativa). The species in this family vary greatly for genome sizes, chromosome
number and ploidy level: for example diploid rice (415 Mb) and hexaploid bread wheat (16,000
Mb) have approximately 40-fold difference for their genome size (Arumugunathan and Earle,
1991).
Bread wheat is an allohexaploid (2n=6x=42, AABBDD) and consists of three
homoeologous genomes (Sears, 1954), originated from hybridization of three diploid
progenitors. Identification of the wheat progenitors has largely come from the cytogenetic
analysis of pairing studies between diploid by polyploid crosses. The donors of the A and D
genome have been identified as Triticum monococcum (Sax, 1922; Dvorak et al., 1988) and
Triticum tauschii (Kihara, 1944) respectively. The putative donor of B genome is Aegilops
speltoides. The 21 chromosomes of the haploid set of T. aestivum have been classified into seven
groups containing three homoeologous chromosomes each from the three genomes based on
their ability to compensate for each other in nullisomic-tetrasomic combinations (Sears, 1966).
This compensating ability of chromosomes from different ancestral origin defined their genomic
relationship. The genetic conservation between these homoeologous chromosomes was further
confirmed by several studies. Shephard et al in 1968 demonstrated that glutenin storage protein
loci are present on chromosomes 1A, 1B and 1D. Deletion map position of a large number of
wheat loci detected by EST unigenes (wheat.pw.usda.gov/NSF/progress_mapping.html) made it
2
possible to obtain a detailed picture of homoeologous relationships between three wheat
genomes.
In spite of the high synteny between homoeologous chromosomes of bread wheat, it
behaves as a strict diploid with 21 bivalents at metaphase stage in meiosis.
1.2. Ph1 Gene:
The bivalent behavior of allohexaploid wheat is principally regulated by Ph1, as in its
presence only homologous chromosomes can pair with each other. The gene is located on the
long arm of chromosome 5B (Riley and Chapman, 1958; Sears and Okamoto, 1958). The Ph1
gene was further mapped to a submicroscopic region (Ph1 gene region) flanked by the
breakpoints of 5BL-1 and ph1c (Gill et al., 1991). A marker ‘xksuS1’ was also identified for the
‘Ph1 gene region’ (Gill et al., 1991). In addition to Ph1, two other genes that suppress
homoeologous chromosome pairing have been identified. These include Ph2 gene present on
chromosome arm 3DS (Upadhaya and Swaminathan, 1967) and another gene present on
chromosome arm 3AS (Driscoll, 1972; Mello-sampayo and Canes, 1973).
Homology search during meiosis is more complicated in allopolyploids such as wheat,
where three related yet distinct genomes (A, B and D) exist together in the same cell. Thus, in
allopolyploid species, chromosome pairing has to overcome an additional problem, because
solely, on the basis of homology, each chromosome has more than one potential partner. There
have been several speculations as to how the Ph1 gene regulates the bivalent behavior of wheat.

3
1.3. Mode of Action of Ph1 gene:
Two different perhaps contradictory hypotheses have been proposed for the mode of action of
Ph1 gene: One hypothesis assumes that pairing happens in two stages. The chromosomes are
premeiotically aligned during the interphase and then they pair at zygotene in the second stage.
This hypothesis assumes that Ph1 determines the premeiotic alignment of homologous and
homoeologous chromosomes by separating them spatially from each other (homologous from
homoeologous) and thus leads to strict homologous pairing. This is known as presynaptic
hypothesis (Feldman 1966, 1993; Feldman and Avivi, 1988). The second hypothesis (Synaptic
hypothesis) assumes that Ph1 gene affects synapsis and crossing-over at meiotic prophase (Holm
and Wang 1988, Dubcovsky et al. 1995, Luo et al., 1996). This hypothesis believes that Ph1
gene affects the stringency of synapsis.
The first hypothesis believes that Ph1 regulates arrangement of chromosomes in the cell
by affecting the components like centromeres and microtubules that affect positioning of the
chromosomes in the nucleus. Several studies have shown that Ph1 affects dynamics of
microtubule system (Avivi et al, 1970a, b; Avivi and Feldman, 1973; Ceoloni et al, 1984;
Gualandi et al, 1984). These studies showed that the microtubule system of Ph1 gene deficient
plants is more sensitive to antimicrotubule drugs. Feldman in 1966 studied the affect of extra
doses of Ph1 gene on chromosome pairing in wheat plants carrying four (diisosomic 5BL) and
six doses (triisosomic 5BL) of Ph1 gene. In this study, extra doses of Ph1 gene were observed to
cause partial asynapsis of homologus, pairing between homoeologous and bivalent interlocking.
In another study by Vega and Feldman, 1998, it was shown that Ph1 gene affects microtubule-
centromere interactions. In this study, the effect of this gene on types and rates of centromere
division of univalents was observed at meiosis using monosomic lines. In the absence of Ph1, the

4
frequency of transverse breakage of the centromere of univalent chromosomes drastically
reduced during meiosis as compared to plants with the Ph1 gene.
Mikhailova et al., in 1998, demonstrated that Ph1 gene affects chromatin organization
and meiotic chromosome pairing. The behavior and morphology of two 5RL rye telosomes were
studied in wheat background in the presence and absence of Ph1 and it was observed that in
plants without functional copies of Ph1, the rye telosomes displayed aberrant morphology,
disturbed pre-meiotic associations and reduced and irregular pairing during zygotene and
pachytene, In interphase nuclei of ph1bph1b plants, the rye (Secale cereale L.) telosomes
showed heavily distorted morphology as well as intermingling with wheat chromosomes as
compared to their distinct and parallel oriented domains in Ph1Ph1 plants.
A study by Holm and Wang in 1988 lead to the proposal that Ph1 affects both synapsis
and crossing-over. In wheat plants lacking Ph1, an increased number of multivalents were
observed at early zygotene in allohexaploid wheat, wheat haploids and wheat x rye hybrids.
Extra doses of Ph1 reduced the degree of synapsis. It also showed that the arrest of synapsis
before completion affects the interlocking frequency at metaphase-I. This study thus supported
the second hypothesis (Synaptic hypothesis) for mode of action of Ph1 gene.
Despite the many reports on the mode of action of Ph1 gene, how it regulates
chromosome pairing is still a matter of debate.
1.4. Wheat Aneuploids:
Aneuploid stocks in wheat were largely developed in Chinese Spring (Sears 1954, 1966)
to map various protein, DNA and morphological markers to different chromosomes. These
included nullsomic-tetrasomic lines (in which a pair of missing chromosomes is compensated by

5
a pair of homoeologous chromosomes), chromosome addition lines, lines carrying
isochromosomes and telocentric chromosomes etc. These stocks are highly valuable for
localization of genes on different chromosomes as well as chromosomal arms. Endo in 1988
reported another powerful tool to systematically develop anueploid stocks in wheat, which will
allow the sub-arm localization of different genes using a gametocidal chromosome of Aegilops
cylindrica. When a certain chromosome from A. cylendrica was present in ‘Chinese Spring’ in
monosomic condition, the gametes lacking the A. cylendrica chromosome underwent
chromosomal breaks generating various chromosomal aberrations including deletions. Such
deletions in plants were stably transmitted to next generation. Endo and Gill, 1996 successfully
employed this method to generate 436 deletion lines in wheat across all 21 chromosomes, using
two alien monosomic addition lines (one carrying A. cylendrica chromosome (Endo, 1988)
homoeologous to group 2 of wheat and the other carrying Aegilops triuncialis chromosome) and
one alien monosomic translocation line (this line had a modified 2B wheat chromosome as a
small chromosomal segment from A. speltoides was translocated to the end of the long arm) of
‘Chinese Spring’. These deletion stocks were different from each other in various morphological,
physiological and biochemical traits. The deletion lines were distinguished from each other
based on chromosome carrying deletion and the size of deletion identified by C-banding (Endo
and Gill, 1996). The deletion lines were assigned FL (fraction length) values based on the size of
deletion: for example deletion line 5BL-1 (FL-0.55) is deletion on the long arm of 5B
chromosome such that 55 % of the long is present and 45 % is deleted compared to normal 5B
chromosome. These aneuploid stocks have been extensively used in genetic mapping in wheat.

6
1.5. Genetic Mapping in Wheat:
Two types of maps have been generated in Wheat: Physical maps and Genetic linkage maps:
Physical maps in Wheat have been generated by mapping 8,241 Expressed sequence tags (ESTs)
on aneuploid stocks of Wheat http://wheat.pw.usda.gov/NSF) chromosomes which included a set
of deletion, ditelosomic, and nullisomic-tetrasomic lines. Gill et al in 1991 generated physical
map of group 5 chromosomes using A. squarrosa genomic library DNA clones on CS, group five
nulli-tetras and Ph1 gene mutant lines. Six probes were mapped on homoeologous group 5
chromosomes to target fine mapping of Ph1 gene (Gill et al., 1993a).
Detailed physical maps have been generated for all seven homoeologous groups by
mapping 944 expressed sequence tags (ESTs) generating 2212 EST loci on homoeologous group
1 chromosomes (Peng et al, 2004), total of 2600 loci generated from 1110 ESTs to group 2
chromosomes (Conley et al, 2004), 996 chromosome bin-mapped expressed sequence tags
(ESTs) accounting for 2266 restriction fragments (loci) on the homoeologous group 3
chromosomes (Munkvold et al, 2004), 1918 loci detected by the hybridization of 938 expressed
sequence tag unigenes (ESTs) on homoeologous group 4 (Miftahudin et al, 2004), 2338 loci
mapped with 1052 EST probes on group 5 (Linkiewicz et al, 2004), 882 ESTs, which detected
2043 loci on homoeologous group 6 chromosomes (Randhawa et al., 2004), 919 EST clones
detecting 2148 loci onto group 7 chromosomes of wheat (Hossain et al, 2004).
Another approach using gamma rays to generate chromosomal breaks has also been used
to generate physical maps in Wheat. Radiation hybrid (RH) maps are developed on the basis of
chromosomal breaks generated by radiation and then by analyzing the chromosome segment
retention or loss using molecular markers. The use of this approach have been recently reported
in wheat by Hossain et al. in 2004, to map 39 molecular marker loci to chromosome 1D in

7
alloplasmic (lo) durum wheat (Durum wheat (AABB) carrying 1D chromosome of T. aestivum,
carrying the species cytoplasm-specific scsae
gene. This line was unique as the 1D chromosome
always segregated as a whole without recombination, which makes it impossible to map the gene
with conventional genome mapping. Gamma rays were used to develop mapping population in
hemizygous lo-scsae
line and this population was analyzed with 39 markers and it revealed 88
breaks in the chromosome. This analysis enabled the authors to localize scsae
gene on long arm
of 1D and identify 8 linked markers.
Genetic linkage maps have been constructed in wheat and its wild relatives. RFLP
(Restriction Fragment Length Polymorphism) based genetic linkage maps have been generated
in the diploid progenitor species of wheat. Boyko et al. in 1999 constructed a genetic linkage
map of the A. Tauschii (DD) composed of 546 loci. High-density genetic linkage map of A.
tauschii was generated by mapping 249 marker loci (Boyko et al., 2002). A genetic map of
diploid wheat, Triticum monococcum (AA), involving 335 markers, including RFLP DNA
markers, isozymes, seed storage proteins, rRNA, and morphological loci, was constructed
(Dubcovsky et al., 1996) Genetic linkage maps have also been constructed in tetraploid wheats.
The molecular map of wild emmer wheat, Triticum dicoccoides (AABB) was constructed by
mapping 549 marker loci on F2 population developed by using T. dicoccoides accession,
Hermon H52 and Triticum turgidum cv, Langdon (Ldn) as parents (Peng et al., 2000). Detailed
RFLP linkage maps for hexaploid wheat have been reported for all seven homoeologous groups
linkage maps (Erayman et al., 2004). Microsatellite markers have also been used to generate a
genetic linkage map in wheat (Roder et al., 1998). In this study, a total of 279 loci amplified by
230 primer sets were mapped in the reference population of the International Triticeae Mapping
Initiative (ITMI) Opata 85 x W7984.

8
The physical maps generated in wheat have been compared with genetic linkage maps across the
Triticeae via common markers to generate composite map for all wheat chromosomes (Werner
et al. 1992; Gill et al. 1996b, Gill et al. 1996c; Kota et al. 1993; Delanay et al. 1995a, Delanay et
al. 1995b; Mickelson-young et al. 1995; Weng et al. 2000), which have shown that genes are
nonuniformly distributed on wheat chromosomes.
Comparisons of deletion line-based physical maps with the genetic linkage maps showed
that most of recombination occurs in the gene-rich regions of the wheat genome (Gill et al.,
1996b, 1996c; Sandhu et al., 2001a, Erayman et al, 2004). The gene-poor regions accounted for
only 5% of the recombination as 95% of the recombination was observed in the GRRs
(Erayman et al., 2004).
1.6. Gene Distribution in Wheat:
The number of genes in all higher plants is expected to be similar although changes due
to ploidy level differences may exist. The estimated number of genes in arabidopsis is 25,000
and for rice is anywhere from 32,000 to 50,000 (Barakat et al., 1997; Goff et al., 2002). The
gene-containing fraction of the arabidopsis genome is 0.85 (Barakat et al., 1998). Thus, the
corresponding fractions for rice, maize, barley, and wheat are expected to be 0.28, 0.05, 0.025,
and <0.01, respectively (reviewed by Sandhu and Gill., 2002). The average gene size in
arabidopsis and rice is 2 KB and 2.5 KB respectively and gene size tends to increase with
biological complexity (reviewed by Sidhu and Gill, 2004). Thus, with the predicted size and
number of wheat genes, the gene-containing fraction of the wheat genome will encompass 1.2 –
2.4% (reviewed by Sidhu and Gill, 2004).

9
DNA reassociation kinetics studies showed that non-transcribed repetitive DNA is an
integral part of most plant genomes and its amount is proportional to the genome size (Flavell et
al., 1974). The gene-containing fraction of the wheat genome has been localized to 29% by
physically mapping 3025 loci including 252 phenotypically
characterized genes and 17
quantitative trait loci (QTLs) relative to 334 deletion breakpoints, present as 18 major and
30
minor gene-rich regions (GRRs) (Erayman et al, 2004). The gene-rich regions are interspersed
by blocks of repetitive DNA sequences visualized as regions of low gene density. GRRs differed
from each other with respect to marker number, marker density and the size (3- 71 Mb). Of the
48 GRRs, 17 major GRRs contained nearly 60% of the wheat genes but covered only
11% of the
genome and were present on distal 35% of the chromosomes (Erayman et al, 2004). The
localization of the gene-rich regions was based on deletion line breakpoints. The actual physical
size of the gene-rich regions is probably much smaller as imprecise bracketing due to fewer
number of deletion lines will result in an overestimate of the spanning region (Sandhu and Gill,
2002).
GRRs were named based on their location on a particular homoeologous group,
chromosomal arm and GRR location on the chromosomal arm based on the fraction length (FL).
For example ‘1S0.8’ represents a GRR present on short arm of homoeologous group 1
chromosomes around fraction length of 0.8. Two major GRRs were identified on long arm of
wheat homoeologous group 5 chromosomes. Physically, these regions are present around FL 0.5
and 0.7 and thus are called ‘5L0.5 region’ and ‘5L0.7 region’, respectively.

10
1.7. ‘5L0.5 Region’:
The ‘5L0.5 region’ is best localized on chromosome arm 5BL of wheat, where most of
this gene-rich region is bracketed by the breakpoints of deletions 5BL-1 (FL-0.55) on the
proximal side and 5BL-11 (FL-0.59) on the distal side (Gill et al., 1993a; Gill et al., 1996a). The
region physically spans ~2.6% of chromosome 5B. Comparisons of genetic linkage maps
revealed that about 20% of chromosome 5B recombination events occur in this region (Erayman
et al., 2004). The ‘5L0.5’ region contains many agronomically important genes but is of
particular importance because the Ph1 gene has been localized to a submicroscopic region
contained within ‘5L0.5 region’ and is known as ‘Ph1 gene region’ (Gill et al., 1993a).
1.8. ‘Ph1 gene Region’:
Fine mapping relative to the breakpoints of the deletion and mutant lines has localized the
Ph1 gene to a submicroscopic sub-region of the ‘5L0.5 region’ (Gill and Gill, 1991; Gill et al.,
1993a). The gene maps distal to the breakpoint of deletion 5BL-1 but proximal to that of 5BL-
11. The breakpoint of deletion 5BL-1 maps between C-band 5BL1.7 and 5BL2.1 (Endo and
Gill., 1996) (Fig. 1). The distal breakpoints of the interstitial deletions, both in the ph1b and
ph1c mutants, also map in the same region. Since Ph1 is absent in deletion 5BL-1, ph1b and
ph1c, it must map distal to the breakpoint of 5BL-1 but proximal to the distal breakpoints of both
ph1b and ph1c. The distal breakpoint of the ph1b is distal to that of ph1c because a marker was
identified that is absent in 5BL-1 and ph1b but present in ph1c (Gill et al, 1993a). The Ph1 gene,
therefore, maps in the chromosomal region between the breakpoints of 5BL-1 and ph1c. This
chromosomal region is very small and cannot be resolved by light microscopy. This region is
referred to as the ‘Ph1 gene region’. A DNA marker was identified for the ‘Ph1 gene region’ by
11
screening 602 random markers present on the T. tauschii map (Gill et al., 1993b). Three
additional markers were identified for the region by RNA fingerprinting-deletion mapping
analysis of the ph1b and its wild type parent Chinese Spring (CS) (Sandhu and Gill., 2001b).
1.9. Genome Relations in Plants:
Different crop plants are related to each other at the genome level and the extent of
synteny and colinear gene order depends upon evolutionary distance between them. The
genomes of various plant species have been compared both at the gross level and micro level
using various strategies. It has been shown that major genes and also quantitative trait loci for
important traits, such as flowering time, plant height, dwarfism, vernalization and shattering
show orthologous loci in barley, wheat, maize and rice (Devos & Gale, 1997; Sarma et al., 1998;
Bailey et al; 1999). Gene orders were found to be highly conserved across various Poaceae
species (Hart, 1987; Ahn and Tanksley, 1993; Ahn et al., 1993; Devos et al, 1994).
1.9a. Genome Comparison at Gross level:
Genome comparison based on RFLP maps was reported in tomato (Lycopersicon
esculentum) and potato (Solanum tuberosum). Few differences were observed between tomato
and potato indicating high synteny (Bonierbale et al., 1988).
. The first report on genome comparisons in cereals perhaps comes from the work
performed by Hulbert et al, 1990. This study showed the comparison between maize and
sorghum by mapping maize RFLP clones on sorghum. In this study, most of the probes
(104/105) from maize hybridized with sorghum deciphering high synteny. Ahn and Tanksley in
1993 performed rice and maize genome comparisons. RFLP map, based on cDNA and genomic
clones in rice and maize was compared. 85% of the cDNA clones from rice hybridized to maize

12
recombinant inbred population. Many conserved linkage groups were identified between maize
and rice. In the follow up study, the authors compared rice and wheat genomes by mapping
previously mapped wheat cDNA clones on rice. The results of the two studies were combined
and three species were compared and authors suggested that rice, wheat and maize share
extensive homoeologies in a number of regions in their genomes (Ahn et al., 1993). It has been
shown that colinearity between six grass species: rice, maize, foxtail millet, Sorghum, Sugarcane
and wheat is such that a single consensus genetic map for each species could be defined in terms
of nineteen rice linkage groups assembled in different ways for each species (Moore et al., 1995).
The whole genome comparison of rice and wheat has been performed by using 5,780
mapped wheat EST sequences in NCBI-BLASTN for comparison against rice genome (La rota
and Sorrells., 2004). It was suggested in this study that for most rice chromosomes, there is
prepondence of wheat genes from one or two wheat chromosomes. The chromosome 5BL was
mainly associated with rice chromosome 9 (R9) from centromere to FL-0.75 and with R3 from
FL-0.75 to telomere. It was shown in two other studies that the long arm of homeologous group
5B is significantly similar to R12, R9 and R3 (Foote et. al., 1997, Linkiewicz et. al., 2004). All
of the earlier studies on rice-wheat comparisons were reported on the basis of nucleotide
sequence comparisons, utilizing markers for the whole wheat genome and at that time the
complete sequence of rice genome with ordered BAC/PAC clones was not available.
Apart from the reports on synteny, reports on lack of synteny are also well documented
for example a lack of colinearity was observed between wheat and rice for wheat leaf rust
resistance gene locus Lr1 on chromosome 5DL (Gallego et al., 1998).

13
1.9b. Comparison at Micro level:
Most of the earlier genome comparison data was based on linkage analysis. The
construction of the large insert libraries of grass genomes has allowed isolation and sequencing
of large fragments (upto 500 KB). This provides insight about conservation of gene order
between different grasses at sub-megabase level.
Good conservation of the gene content and order was found between three grass species:
rice, maize and sorghum for the Sh2/a1 locus (Chen et al, 1997). In this study, the genomic
fragments in three species were analyzed and sequenced for orthologous loci.
A lack of colinearity at the microlevel has been reported in a detailed study of the barley
resistance locus Rpg1 and orthologous region in rice (Kilian et al., 1995). In this study, rice BAC
and YAC libraries were successfully used to drive probes to saturate barley Rpg1 region but
three probes originating from the end of a BAC clone sequence containing markers flanking the
Rpg1 locus, mapped 2.5 cM proximal to the Rpg1 region in barley, which was previously shown
to be non-orthologous in rice. This study suggests that even in regions showing high colinearity
may have rearrangements at the micro-level. Recently, maize and sorghum orthologous adh
regions were compared by genome sequencing. Nine candidate genes, including adh1, were
found in a 225-kilobase (kb) maize sequence. In a 78-kb space of sorghum, the nine homologues
of the maize genes were identified in a colinear order, plus five additional genes. The question of
missing genes in maize was addressed by comparing sorghum with rice and for two tightly
linked genes in sorghum, authors identified tightly linked orthologs in arabidopsis, suggesting
that genes in maize were deleted after the two species diverged from each other (Tikhonov et al.,
1999).

14
1.9c Conservation of Genes at Functional Level:
There have been several reports on conservation of genes across species. An interesting
example is provided by recent work on the GAI gene in arabidopsis, Rht-1 gene in cereals, d8 in
maize and the rice GAI homolog SLR1 (Peng et al., 1997; Peng et al., 1999; Ikeda et al., 2001).
Cereal homologs of GAI were cloned by utilizing sequence information from a rice EST, which
was shown to correspond to wheat Rht-1 and maize d8 genes. Similarly, Arabidopsis
CONSTANS (CO) gene (Putter ill et al., 1995), which regulates flowering has homologues in rice
(Hd-1 gene) (Song et al., 1998; Yano et al., 2000) and gymnosperms. The UNIFOLIATA (UNI)
gene of pea (Hoefer et al., 1997) and FLORICACULA gene in Antirrhinum are homologs of
LEAFY gene (Bla’zquez and Weigel, 2000) of arabidopsis. LEAFY gene homologs have been
identified in several species. There are many other examples such as conservation of roles of
MADS-box genes (Ambrose et al., 2000; Kyozuka et al., 2000).
It has been demonstrated that grasses form a single genetic system (Bennetzen and
Freeling, 1993) of which rice provides the model genome (Havukkala, 1996) but there are
surprising levels of rearrangements including deletions even in closely related species, which
makes it difficult to use rice to isolate genes in other cereal crop plants (reviewed by Keller and
Feuillet, 2000). A modified approach was proposed in which rice mapping and sequence data
could be highly useful for characterization in larger genome cereals when the gene order between
wheat and rice is conserved for the region of interest (Keller and Feuillet, 2000).
The study reported here is focused on ‘5L0.5’ region, which is a major gene-rich region
located on the long arm of chromosome 5B. The ‘5L0.5’ region is encompassed by the
breakpoints of the deletion lines 5BL-1 and 5BL-11. This GRR is very important as it contains

15
an array of agronomically important genes but is of particular interest as the Ph1 gene has been
localized to a submicroscopic region present in this GRR.
The specific objectives of this study are to:
1) Enrich the ‘5L0.5 region’ with markers using aneuploid stocks of wheat with an aim to
identify additional markers for the region with special focus on ‘Ph1 gene region’.
2) Compare the region across different Triticeae species with an aim to identify additional
genes and markers for the region.
3) Compare the markers mapped on the chromosome 5BL of wheat with rice and
arabidopsis (Arabidopsis thaliana) and study the evolutionary relationship between the
three species.
4) Study the syntenic region for ‘Ph1 gene region’ in rice and arabidopsis in detail.
5) Study 'rice Ph1 gene region’ in detail to identify Ph1 gene candidates.
6) Identify homologs of the candidate genes in wheat.
7) Identify BAC clones for the ‘Ph1 gene region’ probes in both tetraploid wheat and barley
by using Barley BAC library (Hordeum vulgare var. Morex) and tetraploid wheat
(Triticum turgidum var. durum) BAC library.

16
CHAPTER TWO
MATERIALS AND METHODS
2.1. Plant Material:
Various chromosome arm and sub-arm aneuploid stocks were used to physically
map DNA markers to their respective chromosomal regions. Wheat homoeologous group 5
nullisomic-tetrasomic lines (missing a pair of chromosomes, the deficiency of which is
compensated by a pair of homoeologous chromosomes) (Sears 1966) were used for the
chromosomal location of DNA restriction fragments. The Ph1 gene mutant lines: ph1b, ph1c,
and dupPh1 (carries four doses of Ph1 gene), and single-break deletion lines 5AL-3(FL-0.56),
5Al-4(FL-0.55), 5AL-10(FL-0.57), 5AL-12(FL-0.35), 5BL-5(0.54), 5BL-1(FL-0.55), 5BL-
11(FL-0.59), 5DL-1(FL-0.60) and 5DL-11(FL-0.52) (Endo and Gill, 1996), bracketing the 5L0.5
gene-rich region, were used for the precise localization of marker loci. The following single
break deletion lines: 5AL-3, 5AL-4, 5AL-10, 5AL-12, 5BL-5, 5DL-1 and 5DL-11 were not used
for all the probes. The ‘5L0.5’ region is bracketed by the breakpoints of 5BL-1 and 5BL-11
deletion lines on proximal and distal sides respectively. The ‘Ph1 gene region’ is the smaller
region present in the ‘5L0.5’ region encompassed by the breakpoints of terminal deletion line
5BL-1 on the proximal side and the distal breakpoint of interstitial Ph1 gene mutant line ph1c on
the distal side. The mutant ph1b was developed in wheat cultivar ‘Chinese Spring’ by X-ray
irradiation of seeds (Sears 1977). The mutants ph1c and dupPh1 were developed in tetraploid
wheat cultivar ‘Cappelli’ (Giorgi and Barbera, 1981). The mutants ph1c and ph1b carry
interstitial deletion of 0.89 and 1.05µm respectively, encompassing the Ph1 gene ((Jampates and
Dvorak, 1986; Gill and Gill, 1991; Gill et al., 1993b). The dupPh1 line carries a duplication of an
interstitial region carrying the Ph1 gene and is suspected to be the same region, which is missing

17
in the ph1c mutant (Jampates and Dvorak 1986; Gill and Gill, 1991; Gill et al., 1993a). The
plant material was obtained from Wheat Genetic Resource Center (WGRC), Manhattan, KS.
2.2. Marker Identification:
To identify additional markers and useful genes for the target region, eight
markers, previously mapped in the ‘5L0.5 region’ (Gill et al., 1996b) were used as anchors to
compare various Poaceae maps. A total of more than 36 maps generated in wheat, barley, rye,
T. tauschii, T. monococcum, maize (Zea mays), oat (Avena sativa), and rice (Oryza sativa) were
used (Graingene database: http://wheat.pw.usda.gov/ ggpages/maps.html); (Bezant et al., 1996;
Korzun et al., 1998; Laurie et al. 1995; Ward et al. 1998; Foote et al. 1997; Causse et al. 1994;
O’ Donoughue et al. 1992; Rayapati et al., 1994). Initially, markers flanked by two anchor
markers were selected. Markers tightly linked to any of the anchor markers were also selected. In
the second round of comparative mapping, the markers selected in the first cycle were used as
anchors. The same strategy was followed to map morphological and other useful genes
controlling important agronomic traits to the gene-rich region. In addition, 10 cDNA markers for
the region identified by RNA fingerprinting/differential display (Sandhu t al., 2001b), were also
used.
The cDNA and genomic DNA probes that were used in the construction of the physical
map of the ‘5L0.5 region’ were derived from wheat (PSR, UNL, WG, TAM, TAG, FBA, FBB),
barley (ABC, ABG, BCD, cMWG, KSU, MWG), oat (CDO), and T. tauschii (KSU). The RFLP
probes were described by the following authors: BCD, CDO, WG, Heun et al. (1991); KSU, Gill
et al. (1991b); MWG and cMWG, Graner et al. (1991); ABC, ABG, Kleinhofs et al. (1993);

18
PSR, Sharp et al., 1989. UNL probes were derived from wheat cultivar ‘CS’ by Sandhu and Gill
in 2001, using RNA fingerprinting/differential display method.
The EST probes used in the physical mapping were identified by screening the Graingene
database (http://wheat.pw.usda.gov/wEST/binmaps). The ESTs corresponding to different bins
on all chromosomes of wheat are listed in the database. For the intent of targeting the 5L0.5
region, we selected ESTs from following bins of the three group five homeologous
chromosomes, 5AL-12-0.35-0.57, 5AL10-0.57-0.78, 5BL6-0.29-0.55, 5BL-1-0.55-0.75, C-5DL-
1-0.60, 5DL-1-0.60-0.74. The ‘5BL6-0.29-0.55’ bin was also included because it is immediately
adjacent to the 5L0.5 region and the EST assignment on the Graingene database was not fully
validated at that time (09/03), for different bin locations. Based on these criteria, approximately
200 ESTs were selected for physical mapping on the chromosome 5BL of wheat.
2.3. Gel-Blot Analysis:
Genomic DNA from various plant materials was isolated following Anderson et al.,
1992. Two forms of leaf tissue (Fresh leaf tissue and lyophilized) were used to extract DNA
depending upon the availability: For Lyophilization, the tissue was kept in the lyophilizer for
approximately 7 days and after drying the tissue was ground in the grinding machine. Fresh Leaf
tissue was ground in liquid nitrogen. The tissue in ground form was incubated in DNA extraction
buffer (0.1M Tris pH 8.0, 0.5M NaCl, 50mM EDTA, 1.25% SDS, 0.0038% sodium bisulfite) at
65°C for 2 hours. The slurry was extracted with 0.8 volume of chloroform-isoamyl alcohol (24:1
v/v). The DNA was precipitated from the supernatant by adding two volumes of cold ethanol.
The DNA pellet was washed with 70% ethanol. Dried pellet was dissolved in TE containing
RNase (1µg/ml). For purification, the DNA was extracted with phenol:chloroform and recovered

19
by 0.3M sodium acetate and ethanol precipitation. For each sample, 5 µg of genomic DNA was
digested with 40 units of restriction enzymes in the presence of spermidine (5mM) and Bovine
Serum Albumin (BSA). Three restriction enzymes (EcoRI, DraI and HindIII) were used for
physical mapping. Digested DNA was electrophoretically separated on 0.8% agarose gel in 1x
TBE (Tris-borate-EDTA) buffer at a constant voltage of 35V for 16 hours (Gill et al., 1993a).
‘Southern’ blotting onto nylon membrane (Micron Separations Inc. MA), DNA immobilization,
and hybridization were performed following manufacturer’s recommendations. Gels were
stained with ethidium bromide (2ul/100 ml of water) and treated with 0.25M HCl for 12 minutes
with gentle shaking. Gels were treated with denaturing solution (0.4N NaOH, 0.6M NaCl) for 30
minutes followed by neutralizing solution (0.5M Tris, 1.5M NaCl, pH 7.5) for 30 minutes. DNA
was transferred to nylon membrane by capillary method for 16 hours, using 20x SSC (0.3M
sodium citrate, 3M sodium chloride). After transfer, the membranes were soaked in 5x SSPE
(3M sodium chloride, 0.2M sodium phosphate monobasic, 0.02M EDTA) at 65°C for 5 minutes,
air-dried and baked at 80°C for 1 hour. DNA was cross-linked to membrane by treating the
membrane with 20,000 µJoules of energy in UV stratalinker (Stratagene). Prehybridization was
performed in 35 x 300 mm glass bottles containing 50 ml of prehybridization solution (6x SSPE,
5% Denhardt’s solution, 0.5% SDS, 50µg/ml Salmon sperm DNA), incubated at 65°C for 16-18
hours in a hybridization rotisserie oven (Hybaid). For hybridization, about 30ng of probe was
labeled with 30 µCi of 32PdCTP following random primer labeling technique (Feinberg and
Vogelstein, 1983) in a 15µl reaction containing 4 units of klenow enzyme and 0.5mM cold
nucleotides (ATG). Unincorporated nucleotides were removed with Sephadex G-50 spin
columns. Hybridization was performed in 10 ml of hybridization solution (5% Dextran sulfate,
6x SSPE, 5% Denhardt’s solution, 0.5% SDS, 50µg/ml Salmon sperm DNA) and the blots were

20
washed once, at 65°C in 2x SSPE, 0.5% SDS for 30 minutes. After rinsing with 2x SSC, solution
the blots were wrapped in plastic and exposed to X-ray film with two intensifying screens at –
80°C for three to seven days depending upon the radioactive signal.
2.4. DNA sequence analysis and motif search
In order to identify rice and Arabidopsis BAC/PAC clones exhibiting significant
similarity to the mapped ESTs and DNA markers on 5BL arm, the probe sequences were used in
tBLASTx searches against GenBank non-redundant database and the BAC/PAC clones which
exhibited significant similarity (i.e. E-value significance <1e-25
) were selected as true homologs.
The chromosomal location of the identified orthologous sequences was identified by screening
Gramene database (www.gramene.org) for rice and TAIR database for Arabidopsis
(www.arabidopsis.org). For the ortholog sequences of ‘Ph1 gene region’ and ‘ph1c-ph1b region’
markers, the precise base-pair location was also identified utilizing the information available in
the Gramene and TAIR databases.
The genes present in the orthologous ‘Ph1 gene region’ on rice were analyzed in detail
for their putative function. For most of them, the putative function was listed in the Gramene
database but we compared the protein sequence of all 91 genes, on NCBI conserved domain
database (http://www.ncbi.nlm.nih.gov/Structure/cdd/wrpsb.cgi) for detailed analysis of these
genes. Putative function was assigned after analyzing all the results.
To identify wheat ESTs exhibiting significant similarity (cut-off value <1e-25
) to the
selected rice genes, protein sequence of these genes was used in tBLASTn (Atschul et al., 1997)
searches of the GenBank wheat EST database. ESTs were selected as representative of the rice
genes by analyzing the position and significance of similarity and the length of the EST.

21
The putative function of the selected wheat ESTs was assigned by using them in
BLASTN (Atschul et al., 1997) searches against GenBank non-redundant databases, and
BLASTx (Atschul et al., 1997) searches against GenBank non-redundant and SwissProt
databases. Putative functions were assigned after analyzing all the results
2.6. Wheat and Barley BAC Library Screening:
To generate detailed contig for ‘Ph1 gene region’, tetraploid wheat (Triticum turgidum
var. durum) Bacterial artificial chromosome (BAC) library (Cenci et al. 2003), consisting of 28
high-density filters and Barley BAC library (Hordeum vulagre cv. Morex) (Yu et al., 2000) were
screened with ‘Ph1 gene region’ specific probes. Triticum turgidum var. durum consists of A
and B genomes. This library contains approximately half million clones with an average insert
size of 130 kbp, providing a 5.1x coverage for each genome (Cenci et al., 2003) The Barley BAC
library contains 3,13,344 clones with an average insert size of 106 kbp. Batch of two probes
were used at a time for screening the libraries. The southern hybridization technique used for
screening was performed as previously described in this chapter.
2.7. BAC Clone Identification:
Positive BAC clones were scored based on their pattern in each individual well located
on the filters. Positive BAC clones identified by screening tetraploid wheat library were ordered
from ucdavis. Individual BAC clones were inoculated into 96-deep well plates containing 2 ml
LB medium plus 12.5ug/ml chloramphenicol, and grown in levitation machine at 37oC, for 12-16
hours. BAC DNA was isolated and purified using alkaline lysis method, and dissolved in 20ul
TE. For identifying real positives and to see if they are present as multiple copies, approximately

22
7ul DNA for each individual BAC was digested with HindIII, was used for blotting onto
nitrocellulose membranes. Each ‘Ph1 gene region’ probe was used to screen these BAC blots
using Southern hybridization. Positive BACs were scored for individual probes, defining them
into different loci based on their position on the film.
2.8. Meiosis Analysis:
Wheat spikes were harvested at meiosis stage between 9 AM to 10 AM. Different spikes
were analyzed for their position in the plant. The spikes are taken when they are still covered by
leaf sheath and their position is estimated by pressing the plant stem. The spikes, which are about
1 to 2 cm lower in position than the last node on that particular shoot, are supposed to be at
meiosis between 9AM to 10 AM. The spikes can be kept in water or fixed in Carnoy fixative
solution (60 ml ethanol: 30 ml chloroform: 10 ml acetic acid) for several hours (4-5 hr. is
enough) at 40C depending upon preference. For the spikes kept in Carnoy’s solution, after the
meiotic cells were fixed, the plant buds were taken out of the solution and put in a Petri-dish
containing water to avoid drying out of the cells. For the spikes kept in water, meiosis should be
studied immediately as the cells are live. One anther from central floret was taken and placed on
a glass slide and was squashed with a forcep after putting a drop of acetocarmine solution on it.
The debris such as anther walls was removed by using a fine tipped forcep. Anther remainders
were covered on the slide with cover slip. The slide was then heated on flame briefly. After
heating, the slide was placed between a layer of paper towels and pressed straight down firmly.
This squashing process flattens the cell’s nuclei and spreads out the chromosomes. The slides
were first observed under the 10x lens. Once meiotic cells were identified, put emersion oil on
the slide and observe it under 100x lens to identify the meiotic stage. The slide could be stored in

23
–800C for future use. After finding a meiotic stage, remaining anthers from that particular bud
were frozen in liquid nitrogen and kept at –80 C for RNA isolation.

24
CHAPTER THREE
RESULTS AND DISCUSSION
3.1. Identification of Markers for Physical Mapping:
Comparative analysis of 36 Poaceae maps using previously available 24 ‘5L0.5 region’
probes(Faris et al., 2000) identified 72 RFLP additional markers (see page-17 for additional
details). These 96 DNA markers were comprised of 90 RFLPs and six SSR markers. Nineteen of
the RFLP markers were wheat cDNA (PSR, UNL), 15 wheat genomic (WG, PSR, TAM, TAG,
FBA, FBB), 19 barley cDNA (ABC, BCD, KSU, cMWG), 16 barley genomic (ABG, MWG),
eight oat cDNA (CDO), seven durum wheat cDNA (MGB, UBP), one rice cDNA (RZ), and six
T. tauschii genomic clones (KSU A, D, E, F, G, H, S, M). Ten markers were cDNA clones
isolated by RNA fingerprinting-deletion mapping method where the target was the Ph1 gene-
containing region (Sandhu and Gill, 2001b). The 157 EST markers were identified by screening
wheat physical mapping database available at Graingene
(http://wheat.pw.usda.gov/wEST/binmaps). These wheat ESTs were physically mapped using
only six 5BL deletion lines and the 5BL-11 deletion line flanking the 5L0.5 region was not
represented. Although the 5BL-1 deletion line was used but for about 80% of the data, the line
was actually nullisomic for chromosome 5B thus was non-informative. For the present study,
therefore, the markers mapping in regions 5AL-12-0.35-0.57, 5AL10-0.57-0.78, 5BL6-0.29-
0.55, 5BL-1-0.55-0.75, C-5DL-1-0.60, and 5DL-1-0.60-0.74 were selected for mapping.

25
3.2. Marker Enrichment of ‘5L0.5 Region’:
The 223 DNA markers were analyzed by gel-blot analysis of group 5 specific nulli-tetra
lines along with deletion lines 5BL-1(FL-0.55) and 5BL-11(FL-0.59) and the results are given in
figure 1. Breakpoints of these two deletion lines bracket the ‘5L0.5 region’ present on
chromosome arm 5BL. Additional deletion lines: 5AL-4 (FL-0.55), 5AL-10 (FL-0.57), 5AL-12
(FL-0.35), 5BL-5 (0.54) 5DL-1 (FL-0.60) and 5DL-11 (FL-0.52) were used for physical
mapping of 157 of the 223 markers. Two of the three restriction enzymes (DraI, HindIII and
EcoRI) were used for each probe. Three enzymes were only used for the probes for which the
band pattern did not get resolved with two enzymes. Out of these 223 probes, 172 probes
detected 192 loci for chromosome 5BL (Fig. 1). The band pattern in nullisomic-tetrasomic lines
was used to assign bands to the respective homoeologous chromosomes. A band missing in
N5BT5A but present in N5AT5B and N5DT5A, was assigned to chromosome 5B. Sub-arm
location of the probes was revealed by the deletion lines. A 5B specific band missing in 5BL-1
but present in 5BL-11 was assigned to the ‘5L0.5 region’. An example of such a pattern is given
in Fig. 2 for the probe mwg522 that maps in the ‘5L0.5 region’.
Including the previously mapped 24 marker loci, we identified 85 marker loci for the
‘5L0.5 region’.
Many of the probes detected more than one locus on 5BL. Seventeen of the ‘5L0.5
region’ probes (abc168, abg387, bcd307, bcd351, BE426080, BE443430, BE445248, BE494426,
BE636942, BF484440, cdo412, fba127, fbb121, mwg52, mwg956, unl3, wg564) detected a
second locus on 5BL. Two probes (cdo786, ksu8) detected three loci on 5BL (Fig. 1). All the
three loci for ksu8 were present in the ‘5L0.5’ region. Two loci for cdo786 were mapped in the
‘5L0.5 region’, while the third locus mapped proximal to the ‘5L0.5’ region. The second locus

26
for abg387, BE445248, bcd307, fba127 mapped distal to the breakpoint of 5BL-11. The second
locus for the probes abc168, BE426080, fbb121 and unl3 was present proximal to the proximal
breakpoint of ph1b, while for probes BE443430, BE484440, BE494426, BE636942, bcd351,
mwg52, mwg956, the second locus localized in the ‘5L0.5 region’. The second locus for wg564
and cdo412 mapped proximal 5BL-1 and distal to the proximal breakpoint of ph1c.
For seventy marker loci, the corresponding B band was missing in both 5BL-1 as well as
5BL-11 and were therefore localized distal to the breakpoint of 5BL-11 (Fig. 1). Similarly, 42
marker loci were localized proximal to the breakpoint of dupPh1 as the corresponding bands
were present in 5BL-1, 5BL-11 as well as Ph1 gene mutant lines.
Bands corresponding to nine loci: abc302, BE483335, BE495790, BE590997a,
BE590997b, cdo412a, psr128, psr574 and wg564 were present in 5BL-1 and 5BL-11 but missing
in both mutants, therefore, mapped proximal to the breakpoint of 5BL-1 but distal to the
proximal breakpoints of both ph1b and ph1c mutants (Fig. 3).
For three marker loci, BE405060, BE442918 and BE443187, the ph1c band could not be
scored, so they were placed proximal to the breakpoint of 5BL-1 and distal to the proximal
breakpoint of ph1b, based on the banding pattern in these two lines.
3.3. Marker Enrichment of ‘Ph1 Gene Region’:
For detailed physical mapping for the ‘5L0.5 region’ with a target to identify additional
markers for the ‘Ph1 gene region’, the 5L0.5 region-specific probes were further mapped on
three Ph1 gene mutant lines: ph1b, ph1c and dupPh1. The distal breakpoints of ph1b, ph1c and
the breakpoint of the region duplicated in the dupPh1 line, all map in the 5L0.5 region along
with the C band 5BL2.1(Fig. 1). These provide three additional breakpoints for the region,

27
dividing the gene-rich region into four smaller gene-rich regions. The Ph1 gene containing
region is bracketed by the breakpoints of 5BL-1 on the proximal side and the distal breakpoint of
the interstitial deletion of the ph1c mutant on the distal side. Ten marker loci along with the Ph1
gene mapped to the ‘Ph1 gene region’ as the corresponding bands were missing in both 5BL-1
and ph1c mutant line. The corresponding band were also missing in ph1b and present in double
intensity in dupPh1 line. Markers BE404454, Be443430a, BE443430b, BE405358, BE636942b,
ksu8a, ksu8b, ksu8c, mwg592, wg564b mapped to the ‘ph1c-ph1b region’ as the corresponding
band were missing in 5BL-1 and ph1b but present in ph1c. Fig. 4 shows the banding pattern for
locus BE636942b in group 5 nulli-tetras, Ph1 gene mutant lines and terminal deletion lines for all
group 5 homoeologous chromosomes.
The fragment band for all the ‘Ph1 gene region’ markers was present in double intensity
in dupPh1, suggesting the ‘Ph1 gene region’ is duplicated in this line (data not shown). As
expected the band corresponding to the nine loci mapped proximal to 5BL-1 and distal to the
proximal breakpoint of ph1b were also present in double intensity. Fifty-three loci in the ‘5L0.5
region’ were mapped distal to the distal breakpoint of ph1b and proximal to the distal breakpoint
of dupPh1 as the corresponding bands were absent in 5BL-1 but present in ph1b, ph1c, dupPh1
and 5BL-11. These were mapped proximal to dupPh1 as the bands were present in double
intensity in this line, while eleven marking loci showing similar band pattern for all other lines
except dupPh1 were mapped distal to the distal breakpoint of dupPh1 as the corresponding bands
were not present in double intensity in dupPh1.
For the probes mapped in the ‘Ph1 gene region’ cdo412 identified a major locus proximal
to 5BL-1 and a minor locus in the ‘Ph1 gene region’ (based on the intensity of the bands), while
for probe BE636942,the band pattern was especially interesting as it identified the second locus

28
in the ‘ph1c-ph1b region’, which is a smaller gene-rich region bracketed by the breakpoints of
ph1c on the distal side and ph1b on the proximal side, present in the ‘5L0.5 region’ and is
immediately adjacent to the ‘Ph1 gene region’ (Fig.1).
Ten marker loci BE404454, BE443430a, BE443430b, BE405358, BE636942b, ksu8a,
ksu8b, ksu8c, mwg592 and wg564b were localized to the region bracketed by the breakpoints of
ph1c on the distal side and ph1b on the proximal side.
The remaining sixty-four marker loci mapped to the ‘5L0.5 region’ were localized to
region bracketed by ph1b and dupPh1, if the bands were present as double intensity in dupPh1
and were localized to the region bracketed by dupPh1 and 5BL-11, if the corresponding band
was present as normal intensity in dupPh1.
3.4. Identification of Useful Genes/ Morphological Markers:
The ‘5L0.5’ region specific markers were used for comparative mapping in order to
physically map useful Triticeae genes to ‘5L0.5’ region. The markers mapped to ‘5L0.5’ region
were used to compare different Poaceae maps. The results are summarized in Table 1. The
corresponding linked or flanking markers are also given in the table. In addition to Ph1, we
identified 33 useful genes controlling an array of important agronomic traits that map to the
‘5L0.5’ region. These include genes controlling disease resistance, yield and its component traits,
plant stature, abiotic environmental stress, heading time and several quality traits (Table 1). All
of these genes showed linkage with one or more markers mapped in the ‘5L0.5’ region. Out of
these 34 genes, 23 genes are on 5H chromosome of Barley, seven on 5A of wheat, one on 5B of
wheat and three on 5R chromosome of rye. The actual number of the mapped genes for the
region may be smaller than 34 as alleles of a gene or even the same gene in different

29
background, may have been counted as different genes. For example, there are two genes for
yield, two for grain weight. These genes may be allelic or even the same gene mapped with
different markers in the same population. Therefore, the actual number of genes may range from
28-34.
These 34 genes were further mapped to the smaller sub-regions in the ‘5L0.5 region’
based on their linkage relationships with the markers mapping to different regions (Fig. 1). Seven
genes Egw.2, Egw.3, Ht, S5, Spn.2, Spn.3 and Yld mapped to ‘Ph1 gene region’. Two genes Mlj
and RL showed linkage to the loci mapped to the ‘Ph1c-ph1b region’, while eleven genes (FHB,
HD, HD, HT, KP, mSrh, mt2, SR, SRR, var1 and YLD) were localized to the ‘ph1b-dupPh1
region’ and 13 of the 33 genes (AadhNADP, CT, CT, GMBase, HD, KMBase, LT50, nar2, nar5,
S5, SD, ST(s) and WS)mapped to the region bracketed by dupPh1 and 5BL-11 on the proximal
and distal side respectively. The genes controlling grain weight, spikelet number, yield as well as
plant-height were mapped to the ‘Ph1 gene region’ (Fig. 1, Table 1).
Using comparative and physical mapping approach, 118 markers and useful genes were
identified for the ‘5L0.5 region’ including 33 genes. For the submicroscopic ‘Ph1 gene region’,
17 useful genes and markers were identified.
3.5. Identification of Positive BAC Clones in Tetraploid Wheat and Barley BAC
libraries:
3.5a. Tetraploid Wheat BAC library Screening
The Tetraploid wheat library (Triticum turgidum var durum cultivar Langdon) was
screened with probes mapped to the ‘Ph1 gene region’. The tetraploid wheat (A and B genomes)
library consists of 516,096 clones, which were organized in 1344 384-well plates and blotted

30
onto 28 high-density filters (Cenci et al., 2003). The average insert size of BAC clones is 131-kb,
resulting in coverage of 5.1 X genome equivalents for each of the two genomes (Cenci et al.,
2003). To screen this library, a batch of two probes was used at a time to perform southern
hybridization. Fig. 10 shows the positive BAC clones on filter # 12, identified by southern
hybridization with probes unl4 and BF474342. Each filter is divided into six fields, which has
384 squares (wells) and each well has 16 spots, where eight clones are positioned in duplicate
pattern (Cenci et al, 2003). The unique pattern in each well, together with the field number and
filter number generates plate and well address for a particular clone. The nine ‘Ph1 gene region’
probes identified 384 positive clones in this library. The addresses for these BAC clones were
identified by decoding the plate and well location for each clone based on their filter number (1-
28), field number (1-6), hybridizing pattern (1-8) and well location (A1-P24).
3.5b. BAC Clone Identification:
Positive clones were ordered from UC-DAVIS (Dr. Jorge Dubcovsky) in the form of stab
cultures and the DNA was isolated. The DNA of the positive clones was digested with HindIII
and blotted onto nylon membranes. These blots were screened using ‘Ph1 gene region’ probes to
check their copy number and to exclude false positives. Fig. 12 shows the hybridization results
obtained by screening of a blot containing HindIII digested BAC clones with probe cdo1090.
The BAC clones identified using above method were categorized into different categories based
on their banding pattern (number of bands, relative distance of the bands from comb). This
screening method narrowed down the list of identified BAC clones to 301 from 384.
3.5c. Barley BAC library Screening

31
In a similar way, barley BAC library (Hordeum vulgare cultivar Morex) was screened
with probes mapping in the ‘Ph1 gene region’. This library contains 313344 clones with an
average insert size of 106 kbp (Yu et al., 2000). A batch of two probes was used at a time for
southern hybridization. ‘Ph1 gene region’ probes hybridized to a total of 46 BAC clones, using a
set of four filters (A, B, C and D). Fig. 11 shows the hybridization pattern BAC clones identified
by screening of filter ‘B’ with probe cdo1090.
By screening tetraploid wheat and barley BAC libraries, 301 and 46 BAC clones were
identified by screening the libraries with ‘Ph1 gene probes’
3.6. Comparison of Wheat Chromosome 5BL with Rice and Arabidopsis:
The marker loci mapped to chromosome 5BL were used in comparison studies to identify
corresponding loci/ regions on the two model species rice (Oryza sativa) and Arabidopsis
(arabidopsis thaliana). 157 marker loci out of 192 loci mapped to chromosome 5BL were used
for analysis of genome comparisons with rice and Arabidopsis by BLAST searches.
3.6a. Rice-Wheat Comparisons:
Of the 157 wheat sequences mapped to various regions on chromosome 5BL, 125 marker
loci identified corresponding orthologous sequences on various rice chromosomes (Fig. 5 and
Table 2). Out of these 125, 40 identified orthologous sequences on rice chromosome 9 (R9), 19
on R3, 17 on R1, fourteen on R7, ten on R5, six on R8, five on R11, four on R2, three on both
R4 and R12, while two on each R6 and R10 (Fig. 5, Table 3).
3.6b. Wheat-Arabidopsis Comparisons:

32
Of the same 157 mapped wheat sequences, 114 corresponded to orthologous sequences
on various Arabidopsis chromosomes (Fig.5 and Table 4), with the highest number
corresponding to chromosome A1 and A5 (36 each). Twenty markers identified orthologous
sequences on chromosome A3, thirteen on A4 and nine on A2 (Fig. 5). The analysis of wheat-
Arabidopsis comparisons for different wheat regions is given in Table 3b. This comparison study
revealed that similar to wheat-rice, it is hard to establish the relation between these two genomes
in terms of one or two Arabidopsis chromosome for each wheat region (Table 4), but it could be
interpreted that chromosome 5BL is largely similar to A1 and A5 (36/114 each) and least similar
to A2 (9/114).
3.6c. Rice-Arabidopsis Homology for Wheat Chromosome 5BL:
To determine relationship between orthologous rice and Arabidopsis regions for the
corresponding regions on wheat, the comparison data was analyzed in terms of these two model
species. The results for this comparison are summarized in Table 5. These results indicate that
R1 shows significant similarity to A1, R3 with A1, R7 with A1 and A5, and R9 with A5. The
greatest similarity between these two model species was found for rice chromosome 9 as 19
wheat sequences, which identify corresponding sequences on R9 also identify corresponding
sequences on A5. Significant relation was also found for rice 3 and Arabidopsis 1 as 9 (50%)
wheat sequences, which identify their corresponding sequence on R3 also identify their homolog
on A1.
3.6d. Wheat-Rice Homology for Different Regions on Chromosome 5BL:
To determine if different regions on 5BL could be defined in terms of one or two rice
chromosomes, we analyzed the corresponding orthologous rice sequences were analyzed for
their chromosomal location on rice (Table 3). Different wheat regions in table 3 are defined by

33
the proximal and distal breakpoints of the deletions, which bracket a particular region. The
whole 5B long arm is divided into four regions: centromere-dup.Ph1, ph1b-5BL1, ‘5L0.5 region’
and 5BL11-telomere. Out of 30 orthologous rice sequences corresponding to the C-dup.Ph1
region, 12 correspond to R9, six to R1, three each to R5 and R11, two each to R7 and R12 and
one to both R2 and R10 (Fig. 5, Table 3). Of the eight orthologous rice sequences for the ph1b-
5BL-1 region, three correspond to R9, two each to R8 and R1 and one to R12. For the ‘5L0.5
region’, 21 sequences identified orthologous sequences on R9, 10 on R7, Four each on R8 and
R5, two each on R4 and R2 and one on R3. None were identified for R1, R10, R11, R12. For the
5BL11- telomere region, 18 correspond to R3, nine to R1, four to R9, three to R5, two each on
R7 and R11, one on R2, R4 and R10.
Based on these results, wheat and rice relation in terms of these regions and
corresponding rice chromosomes is shown in Fig. 6. These four regions could not be defined in
terms of one or two rice chromosomes, however, it is possible that there is conservation of
homology between wheat and rice for smaller regions. Based on these results and to focus more
on the ‘Ph1 gene region’, we analyzed the comparison data for the ‘5L0.5 region’ was analyzed
in detail by studying the two mini gene-rich regions (Ph1 gene region, ph1c-ph1b region) present
in the ‘5L0.5 region’. The detailed results are given in Table 3a and Fig. 7. Eight markers
mapped to the ‘Ph1 gene region’ identified a highly syntenous region on rice chromosome 9,
while one marker identified a corresponding sequence on rice chromosome 7. In the ‘ph1c-ph1b
region’, six out of eight marker loci identified corresponding sequences on rice chromosome 7
while two identified orthologous sequences on rice 9.
In order to see if the regions corresponding to these two mini gene regions are present in
the form of continuous blocks on the corresponding rice chromosomes or the orthologous

34
sequences are scattered on the two rice chromosomes, we studied the precise base pair location
of the rice sequences using Gramene database. The results for this comparison are summarized in
Fig. 8. The markers in ‘Ph1 gene region’ identified approximately 450 KB region on rice
chromosome 9. These results revealed a very high synteny in wheat and rice for the ‘Ph1 gene
region’ as the marker order in wheat (Fig. 1) and rice is same for this region (Fig. 8). Six markers
in the ‘ph1c-ph1b region’ identified an approximately 2.7 MB region on rice 7, while two
markers mapped to this region identified sequences on rice 9 (Fig. 1, Fig. 8), immediately
adjacent to the orthologous rice ‘Ph1 gene region’. The only marker for ‘Ph1 gene region’,
which identified corresponding sequence on rice 7 maps in the region corresponding to
orthologous ‘ph1c-ph1b region’ on rice 7. These results indicate that for these mini-gene rich
regions, which are present adjacent to each other in wheat have their corresponding orthologous
regions on two rice chromosomes R9 and R7. This ‘adjacent arrangement’ seems to hold in rice
too as the orthologous ‘ph1c-ph1b region’ is present on rice chromosome 9 and is immediately
adjacent to the orthologous ‘Ph1 gene region’ and is towards the distal side of the chromosome
(same as wheat) (Fig. 7, Fig. 8). This colinearity seems to break as the homoeologous ‘ph1c-
ph1b region’ is present on two chromosomes on rice.
3.6e. Detailed Analysis of ‘Ph1 gene region’:
The rice region orthologous to the wheat ‘Ph1 gene region’ is approximately 450 KB in
size. We analyzed the genes present in this region for their putative Ph1 gene-like function,
based on their predicted function on the Gramene database and by screening the NCBI conserved
domain database. Since, there have been many speculations regarding the mode and action of
Ph1 gene, the criteria’s for selection of Ph1 gene candidates were highly flexible. All the
possible domains and motifs, which could be responsible for the speculated functions of Ph1

35
gene, were included. For example, domains and motifs involved in DNA binding, protein-protein
interactions, chromatin reorganizations, unknown functions, methyltransferase activity,
acetyltransferase activity etc. were selected. Twenty-six genes were selected based on their
functional domains and motifs, out of the 91 genes present in rice Ph1 gene region ranging from
181,623,98 bp to approximately 187,368,67 bp. The details of these genes along with their
predicted function are given in Table 6. These include genes encoding proteins which
mediate/regulate microtubule attachment and chromosome segregation, chromatin
reorganization, DNA binding, DNA repair, heat shock protein activity, chaperon activity,
acetyltransferase activity, Protein kinase and methyltransferase activity as well as proteins,
which were specifically encoded at meiosis and anthers. Wheat EST homologs for these rice Ph1
gene candidates were identified performing tblastn (Altschul et al., 1997) searches against wheat
EST database on GENBANK. The homologs for all rice Ph1 gene candidates except rice
‘chromatin reorganization’ gene were identified in wheat. The wheat EST homologs along with
their putative functions are listed in Table 6.
The orthologous rice locus for probe cdo412, which also maps to the ‘Ph1 gene region’ in
wheat, is present also present on chromosome 9 of rice, proximal to the ‘Ph1 gene region’ but it
was not included, as the major locus for cdo412 is present proximal to the breakpoint of 5BL-1
in wheat (Fig. 1). If this locus was included, the total rice region spans about 1.6 MB and
contains 337 genes.
To further test for the true homology of rice with wheat, the wheat ESTs that are
homologs of rice sequences (listed in the Gramene database) were analyzed to search for their
map location on the Graingene database. Surprisingly, mapping data for only 21 loci out of 1090
is available and 19 of them map between the deletion breakpoints of 5BL-1 and 5BL-11, which

36
corresponds to the ‘5L0.5 region’, containing the Ph1 gene region (Fig.1). These results further
confirmed that the region on rice chromosome 9 is truly homologous to the ‘Ph1 gene region’ of
wheat.
Results reported herein were compared with previously published results for rice-wheat
homology for chromosome arm 5BL (Fig. 6). Results from this and previous studies indicate
sequences on a single wheat chromosome or part there of correspond to orthologous sequences
on wide range of rice chromosomes, although on the basis of number of sequences for different
chromosomes, relationship between wheat and rice has been established for different wheat
regions, in previous studies (Fig. 6). It was shown that 5BL holds syntenic relationship to R6,
R12, R9 and R3. The two regions from the centromere to the proximal breakpoint of ph1b and
ph1b- 5BL-1(FL-0.55) have been shown to be similar to regions on R6 and R12 based on four
sequences. Our results indicate C-ph1b region has maximum homology with R9 (12 sequences)
and R1 (6 sequences). While the region ph1b-5BL-1 (FL-0.55) is syntenic to R9, R1 and R8
(Fig. 6). We confirm the synteny of ‘5L0.5’ region to R9, but it also identifies corresponding
sequences on other chromosomes, including 10 on R7, four on each R8 and R5. Similarly,
although the region from 5BL11- telomere is largely similar to R3, but the there are significant
sequences identified on R1, R9 and R5 as well.

37
Discussion
Gene synteny is a measure of conserved DNA sequences across species and the extent of
conservation is proportional to their evolutionary distance. Wheat belongs to the grass family,
Poaceae that includes more than 15 genera and 300 species, which includes other major cereal
crops such as the small grains barley, rye, oat, maize and rice. Conventionally, species such as
rice, maize, wheat etc. are studied separately. Comparative mapping is a useful approach to
combine genetic information available in different species. The two prerequisites of this
approach are the availability of genetic linkage maps in different species and a set of probes
(anchor probes) that can be used cross-species to evaluate homoeology and conservation. RFLP
maps are available in wide range of grasses such as barley (Heun et al. 1991; Kleinhofs et al.
1993; Graner et al. 1991; 1994), oat (O'Donoughue et al. 1992; 1995; Rayapati et al. 1995; Van
Deynze et al. 1995b), maize (Burr and Burr 1991; Gardiner et al. 1993), sorghum (Chittenden et
al. 1994), and sugarcane (da Silva et al. 1993). In this study, the already available markers for the
‘5L0.5 region’ were used as anchor probes for comparison across Poaceae to identify additional
probes for the region. The probes thus identified were mapped onto wheat aneuploid stocks and
Ph1 gene mutant lines. Physical mapping revealed that approximately 68% of the putative gene-
rich region probes identified by comparative mapping, map to the target region. The reason for
approximately 32% of the probes not mapping in the target region is that the probes identified in
the first round of comparative analysis were used as anchor probes in the second round of
analysis. Thus, this study demonstrates a successful application of comparative mapping to
identify probes and markers for the target region.
It has been reported that conserved linkage blocks exist among different grasses (Moore
et al., 1995). It has been proposed that within a distance of < 3 cM, there should be nearly 50%

38
colinearity between monocots and dicots (Keller and Feuillet, 2000). It is of immense importance
to decipher the extent of synteny between wheat, rice and arabidopsis in order to utilize the vast
amount of genetic information available these model species. We need to address the question of
the use of these model species to carry out research in large genome species such as wheat. The
wheat-rice genome relationships have been well documented at the gross-level based on data
involving small-scale comparisons using a few markers. The study reported herein targets both
gross level (whole chromosome arm, 5BL) as well as detailed micro-level (‘Ph1 gene region’
and ‘ph1c-ph1b gene region’) comparisons using a large number of probes (157).
Data reported herein on the whole long arm comparisons indicates high synteny between
the wheat, rice and arabidopsis as approximately 80 and 71% of the markers used in this study
identified corresponding sequences in rice and arabidopsis respectively. However, continuous
syntenous region/regions did not correspond to either species, indicating a vast number of
rearrangements during evolution. Results reported in this study were compared with previously
published results for rice-wheat homology for chromosome 5BL (Fig. 6). Results reported herein
and previous studies indicate sequences on a single wheat chromosome or part there of
correspond to orthologous sequences on different rice chromosomes, although on the basis of the
number of sequences for different chromosomes, relationship between wheat and rice has been
established for different wheat regions, in previous studies (Fig. 6). It was shown that 5BL holds
syntenic relationship to R6, R12, R9 and R3. The two regions from the centromere to the
proximal breakpoint of ph1b and ph1b- 5BL-1(FL-0.55) have been shown to be similar to
regions on R6 and R12 based on four sequences. The results reported here indicate that the C-
ph1b region has maximum homology with R9 (12 sequences) and R1 (6 sequences). While the
region ph1b-5BL-1 (FL-0.55) is syntenic to R9, R1 and R8 (Fig. 6). The data confirms the

39
synteny of ‘5L0.5’ region to R9, but it also identifies corresponding sequences on other
chromosomes, including 10 sequences on R7, four each on R8 and R5. Similarly, the region
from 5BL11- telomere is largely similar to R3, but the there are significant sequences identified
on R1, R9 and R5 as well.
After comparisons at the gross-level, the next question that arises is: Is there any
colinearity if the comparisons are shifted to smaller regions on the chromosome? To address this
question, the two small regions on chromosome 5BL, ‘Ph1 gene region’ and ‘ph1c-ph1b region’,
were compared with rice. These regions identified highly syntenous regions on rice. Eight of the
nine probes mapped to the ‘Ph1 gene region’ identified a 450 KB homeologous region on rice
chromosome 9. The marker order for the region was also the same between the two species.
Probes corresponding to the ‘ph1c-ph1b region’ identified homeologous regions on chromosome
9 and 7 of rice. In wheat, the two regions are adjacent to each other, with the ‘ph1c-ph1b region’
towards the distal side of the long arm of chromosome (Fig. 1). This ‘adjacent arrangement’
seems to hold in rice too, as the orthologous ‘ph1c-ph1b region’ on rice chromosome 9 and is
immediately adjacent to the orthologous ‘Ph1 gene region’ and is towards the distal side of the
chromosome (Fig. 8). This colinearity seems to break, as the orthologous ‘ph1c-ph1b region’ is
present on two chromosomes on rice. The orthologous region on rice chromosome 7 is
approximately 2.5 MB. The data reported herein thus suggests that colinearity exists between the
two species for some small regions.
The ‘Ph1 gene region’ holds immense importance as it contains the Ph1 gene, the principal gene
that regulates chromosome pairing in wheat. The Ph1 gene was discovered about five decades
back (Riley and Chapman 1958) and its role in chromosome pairing is well documented but it
still has not been isolated because of lack of genetic information available in wheat. Perhaps the

40
sequence of rice might be helpful in the isolation of this very important gene, whose cloning may
answer the most interesting question in allopolyploids, that is, how they behave as perfect
diploids during meiosis inspite of the presence of more than one potential partner during pairing
in the form of homoeologous chromosomes Abnormalities in pairing lead to meiotic defects,
which may result in aneuploidy.
There have been several reports on conservation of genes across species. An interesting example
is provided by recent work on GAI gene in arabidopsis, Rht-1 gene in cereals, d8 in maize and
rice GAI homolog (Peng et al., 1997; Peng et al., 1999; Ikada et al., 2001). Cereal homologs of
GAI were cloned by utilizing sequence information from a rice EST, which was shown to
correspond to wheat Rht-1 and maize d8 genes. Similarly, arabidopsis CONSTANS (CO) gene
(Putterill et al., 1995), which regulates flowering has homologues in rice (Hd-1 gene) (Song et
al., 1998; Yano et al., 2000) and gymnosperms. The UNIFOLIATA (UNI) gene of pea (Hoefer et
al., 1997) and FLORICACULA gene in Antirrhinum are homologs of LEAFY gene (Bla’zquez
and Weigel, 2000) of arabidopsis. LEAFY gene homologs have been identified in several species.
There are many other examples such as conservation of roles of MADS-box genes (Ambrose et
al., 2000; Kyozuka et al., 2000). Most of these examples account for the genes that participate in
fundamental cellular functions, which are conserved in general, in different organisms, reflecting
their importance in cell viability. Since, the process of meiotic chromosome pairing is well
conserved among different organisms, it would be advantageous to identify homologs of Ph1
gene(s) in related organisms such as rice. The homoeologous ‘Ph1 gene region’ on rice
chromosome 9 was analyzed in detail to identify rice Ph1 gene homologs. Twenty-six genes
were selected based on their functional domains and motifs, out of the 91 genes present in rice
Ph1 gene region. Previous reports on the function of Ph1 have documented its role in chromatin

41
reorganization (Mikhailova et al., 1998) and the microtubule attachment process (Vega and
Feldman, 1998). The rice Ph1 candidates selected in this study include genes encoding proteins
which have domains mediating microtubule attachment and chromosome segregation, chromatin
reorganization, meiosis and anther specific proteins, DNA binding domains, DNA repair
proteins, heat shock proteins and chaperons, acetyltransferases, Protein kinases and
methyltransferases.
This study will help meet the following long-term objectives (1) isolation of the Ph1 gene; (2)
understanding the mechanism of homology search; (3) conducting experiments where Ph1
induced chromosome pairing would enable the transfer of desirable traits from alien genera into
wheat; (4) It would address the issue of the importance of model species to carry out research in
large genome species.

42
Table 1. List of useful genes present in the ‘5L0.5 region’ on the long arm of group 5
chromosomes in the Triticeae identified by comparative mapping analysis.
Gene
symbol
Gene Chromosome
Location
linked/flanke
d markers
Reference
nar2 Nitrate
reductase-
deficient
(MoCo)
7 (5H)L wg530 http://barleygenomics.wsu.edu/a
rnis/linkage_maps/maps-
svg.html
nar5 Nitrate
reductase-
deficient
(MoCo)
7 (5H)L wg530 http://barleygenomics.wsu.edu/a
rnis/linkage_maps/maps-
svg.html
var1 variegated 7 (5H)L mwg923-
mwg956
http://barleygenomics.wsu.edu/a
rnis/linkage_maps/maps-
svg.html
mSrh long vs.
short
rachilla
hairs
7 (5H)L mwg522
http://barleygenomics.wsu.edu/a
rnis/linkage_maps/maps-
svg.html
Mlj Reaction
to
Erysiphe
graminis f.
sp. hordei
7 (5H)L wg564 http://barleygenomics.wsu.edu/a
rnis/linkage_maps/maps-
svg.html
mt2 Mottled
leaf
7(5H)L Abc717e e
Kleinhoff’s . 1996. BGN 27
S5 fertility
factor
5RL cdo786-
psr574g
gBorner and Korzun, 1998
AadhNADP Aromatic
alcohol
dehydroge
nase-
NADP
5RL cdo786-
psr575g
gBorner Korzun, 1998
Chl Hybrid
chlorosis
5RL Ksu8-
psr911g
gBorner Korzun, 1998, Bednarek
et. Al, 2003
Ph1 pairing
homeolog
ous
5BL cdo412-
ksu8h
hWall and law, 1971, Gill et
al.1993
QCl.ocs-
5A.1
Culm
length
5AL bcd1088
Kato et al,1999
QHt.ocs-
5A.1
Plant
height
5AL bcd1088
Kato et al,1999

43
QYld.ocs-
5A.2
Grain
yield
5AL psr326
/cdo412i
Kato et al., 2000
QEgw.ocs-
5A.2
Ear grain
weight
5AL bcd1088
Kato et al., 2000
QEgw.ocs-
5A.3
Era grain
weight
5AL psr326
/cdo412
Kato et al., 2000
QSpn.ocs-
5A.2
Spikelet
number
per ear
5AL bcd1088
/bcd9
Kato et al., 2000
QSpn.ocs-
5A.3
Spikelet
number
per ear
5AL psr326
/cdo412
Kato et al., 2000
YLD Grain
yield
7 (5H)L abc302-mSrh Zhu et al, 1999
KP kernel
plumpness
7 (5H)L mSrh
/abc717
Marquez-Cedillo et al. 2000
HD heading
date
7 (5H)L mwg530 Laurie et al. 1995
HD heading
date
7 (5H)L abc168-
abc717
de la Pena et al.1999
HT Plant
Height
7 (5H)L cdo57
/mSrh
Hays et al.1993
RL Root
length
7 (5H)L wg564 Jefferies et al. 1999
SD Straw
diameter
7 (5H)L mwg583 Kjaer et al. 1995
SRR Stripe rust
resistance
7 (5H)L abc168 Chen et al. 1994
FHB Fusarium
head
blight
7 (5H)L abc168
/abc717
de la Pena et al.1999
ST(s) salt
tolerance
in
seedlings
7 (5H)L wg364
/abc324
Mano and Takeda 1997
CT cold
tolerance
7 (5H)L wg364b
/wg1026
Hayes et al. 1993(a)
CT cold
tolerance
7 (5H)L Wg364b
/mR
Hayes et al. 1993(a)
LT50 Low
Temperatu
re
Tolerance
7 (5H)L Wg364b
/mR
Hayes et al. 1993(a).

44
WS winter
survival
7 (5H)L wg364b
/Mr
Pan et al. 1994.
SR Shoot
regenerati
on
7 (5H)L cdo573-
mSrh
Mano and Takeda. 1996
GMBGase green malt
β-
Glucanase
activity
7 (5H)L wg530 Han et al. 1995; Zwickert-
Menteur et al. 1996; Zale et al.
2000. BGNL. Vol 30
KMBGase Kilned
malt β-
Glucanase
activity
7 (5H)L wg530 Han et al. 1995; Zwickert-
Menteur et al. 1996; Zale et al.
2000. BGNL. Vol 30

45
S. No. Marker
Accession
No.
Arabidopsis
Chromosome
number Score e-value
Rice
Chromosome
number Score e-value
1 AA231753 5 85.9 3.00e-16 7 88.6 5.00E-17
2 abc168 - - - 8 52.8 3.00E-06
3 abc717 4 34.7 8.9e-01 4 34.7 1.5
4 abc302 1 163 1e-39 9 194 1e-48
5 abg314 - - - - - -
6 abg387 1 69.7 9e-11 6 80.5 5e-14
7 AF302673 3 1337 0 5 368 6e-100
8 bcd351 3 33.9 1.8 6 90.9 1e-17
9 bcd508 5 110 4e-23 10 113 5e-24
10 BE352611 3 47.4 3.00e-04 - - -
11 BE403221 2 258 7.00e-68 1 281 6.00E-75
12 BE403518 5 229 2e-59 2 142 5e-33
13 BE403761 5 334 1e-90 - - -
14 BE404437 3 253 3.00E-66 3 270 2.00E-71
15 BE404454 5 130 1e-29 9 201 6e-51
16 BE405060 5 199 5.00E-50 12 224 1.00E-57
17 BE405358 3 132 5.00E-30 9 223 3.00E-57
18 BE406545 2 119 4.00E-26 10 120 3.00E-11
19 BE406569 4 109 2.00E-23 7 110 1.00E-23
20 BE406592 - - - - - -
21 BE406612
1 57 2.00E-07 5 69.3 3.00E-11
22 BE406996 2 69.7 2.00E-11 1 69.7 2.00E-11
23 BE425296
5 33.5 2 12 47.8 1.00E-04
24 BE425968 2 166 6.00E-40 3 185 1.00E-45
25 BE426080 5 266 3.00E-70 9 302 4.00E-81
26 BE426712 4 53.5 2e-6 2 78.2 8e-14
27 BE442600 4 261 6.00E-69 2 261 4.00E-69
28 BE442676 3 324 1.00E-87 9 371 1.00E-01
29 BE442763 4 288 6.00E-77 2 301 9.00E-81
30 BE442814 - - - - - -
31 BE442892 1 55.5 6.00E-07 9 78.6 6.00E-14
32 BE442893
- - - 4 68.2 2.00E-10
33 BE442918 1 219 4.00E-56 9 310 1.00E-83
Table 2: The chromosome location of orthologous sequences of wheat genes mapped to
5BL in arabidopsis as well as rice along with the score and e-values
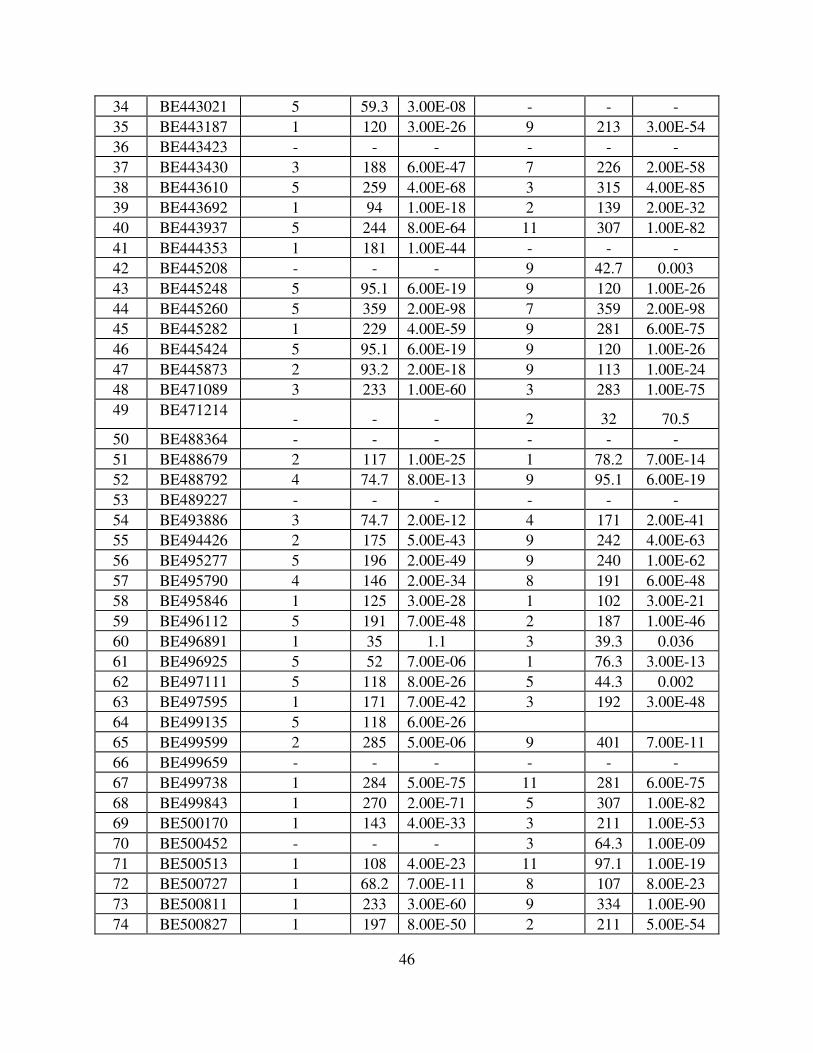
46
34 BE443021 5 59.3 3.00E-08 - - -
35 BE443187 1 120 3.00E-26 9 213 3.00E-54
36 BE443423 - - - - - -
37 BE443430 3 188 6.00E-47 7 226 2.00E-58
38 BE443610 5 259 4.00E-68 3 315 4.00E-85
39 BE443692 1 94 1.00E-18 2 139 2.00E-32
40 BE443937 5 244 8.00E-64 11 307 1.00E-82
41 BE444353 1 181 1.00E-44 - - -
42 BE445208 - - - 9 42.7 0.003
43 BE445248 5 95.1 6.00E-19 9 120 1.00E-26
44 BE445260 5 359 2.00E-98 7 359 2.00E-98
45 BE445282 1 229 4.00E-59 9 281 6.00E-75
46 BE445424 5 95.1 6.00E-19 9 120 1.00E-26
47 BE445873 2 93.2 2.00E-18 9 113 1.00E-24
48 BE471089 3 233 1.00E-60 3 283 1.00E-75
49 BE471214 - - - 2 32 70.5
50 BE488364 - - - - - -
51 BE488679 2 117 1.00E-25 1 78.2 7.00E-14
52 BE488792 4 74.7 8.00E-13 9 95.1 6.00E-19
53 BE489227 - - - - - -
54 BE493886 3 74.7 2.00E-12 4 171 2.00E-41
55 BE494426 2 175 5.00E-43 9 242 4.00E-63
56 BE495277 5 196 2.00E-49 9 240 1.00E-62
57 BE495790 4 146 2.00E-34 8 191 6.00E-48
58 BE495846 1 125 3.00E-28 1 102 3.00E-21
59 BE496112 5 191 7.00E-48 2 187 1.00E-46
60 BE496891 1 35 1.1 3 39.3 0.036
61 BE496925 5 52 7.00E-06 1 76.3 3.00E-13
62 BE497111 5 118 8.00E-26 5 44.3 0.002
63 BE497595 1 171 7.00E-42 3 192 3.00E-48
64 BE499135 5 118 6.00E-26
65 BE499599 2 285 5.00E-06 9 401 7.00E-11
66 BE499659 - - - - - -
67 BE499738 1 284 5.00E-75 11 281 6.00E-75
68 BE499843 1 270 2.00E-71 5 307 1.00E-82
69 BE500170 1 143 4.00E-33 3 211 1.00E-53
70 BE500452 - - - 3 64.3 1.00E-09
71 BE500513 1 108 4.00E-23 11 97.1 1.00E-19
72 BE500727 1 68.2 7.00E-11 8 107 8.00E-23
73 BE500811 1 233 3.00E-60 9 334 1.00E-90
74 BE500827 1 197 8.00E-50 2 211 5.00E-54

47
75 BE517902 1 172 3.00E-42 3 33.9 2.1
76 BE590622 1 90.9 1.00E-17 3 156 2.00E-37
77 BE590997 3 349 3e-95 8 363 1e-99
78 BE591416 - - - 3 88.2 2.00E-16
79 BE591423 3 61.6 7.00E-09 9 111 6.00E-24
80 BE591784 1 48.1 9e-05 1 45.4 6e-04
81 BE604829 1 31.6 7.4 1 32 5.7
82 BE604883 1 89.4 2.00E-16 1 89.4 3.00E-17
83 BE605032 5 57.4 2.00E-07 - - -
84 BE605135 4 113 2.00E-24 5 222 3.00E-57
85 BE636942 5 84 1.00E-15 9 142 3.00E-33
86 BE637838 5 333 1.00E-90 7 364 7.00E-100
87 BE637885 5 147 1.00E-34 7 199 3.00E-50
88 BE637923 4 75.9 4.00E-13 7 158 6.00E-38
89 BE638037 1 192 3.00E-48 3 249 2.00E-65
90 BF200863 - - - - - -
91 BF201857 3 198 7.00E-50 11 272 3.00E-72
92 BF291672 1 121 8.00E-27 3 178 6.00E-44
93 BF293157 1 145 7.00E-34 3 226 3.00E-58
94 BF428826 4 66.2 6.00E-10 - - -
95 BF473933 4 187 3.00E-46 9 189 4.00E-47
96 BF474090 1 177 9.00E-44 1 141 7.00E-33
97 BF474342 3 307 1.00E-82 7 367 2.00E-103
98 BF474840 5 257 8.00E-68 9 285 2.00E-76
99 BF478520 3 109 3.00E-23 9 206 2.00E-52
100 BF478849 - - - - - -
101 BF478950 4 75.1 1.00E-12 9 79.7 4.00E-14
102 BF483038 - - - - - -
103 BF483731 1 71.6 6.00E-12 7 98.2 6.00E-20
104 BF483771 3 226 2.00E-58 3 239 1.00E-62
105 BF484437 - - - 5 277 1.00E-73
106 BF484440 5 60.5 1.00E-08 9 95.5 4.00E-19
107 BF484813 3 83.6 3.00E-15 3 181 1.00E-44
108 BG274124 3 31.6 7.5 9 63.9 1.00E-09
109 BG274279 3 237 1.00E-61 9 243 2.00E-63
110 BG313323 3 51.6 7.00E-06 3 211 5.00E-54
111 BG606780 5 37 0.35 1 35.8 0.78
112 BM137728 - - - 3 31.2 9.9
113 BM138069 3 41.6 0.007 1 76.3 4.33E-13
114 BM140591 5 184 1.00E-45 1 97.4 2.00E-19
115 cdo348 3 62 6e-29 1 118 7e-26
116 cdo388 3 43.1 0.0003 5 48.1 9e-05

48
117 cdo412 4 116 3e-25 9 176 2e-43
118 cdo786 5 173 2e-42 9 175 5e-43
119 ksu8 1 80 2e-17 7 103 4e-21
120 ksuS1 - - - - - -
121 mwg522 5 40.8 0.008 8 50.4 2e-05
122 mwg923 - - - - - -
123 mwg956 - - - - - -
124 mwg624 - - - 5 94.4 1e-18
126 psr128 3 101 9e-21 8 103 2e-12
127 psr574 - - - - - -
128 unl4 5 254 2e-66 9 272 7e-72
129 wg564 - - - - - -
130 wg530 - - - 4 100 5e-20
131 cdo57 5 98.2 7e-20 9 114 1e-24

49
Wheat Region/ Rice
Chr.
R1 R2 R3 R4 R5 R6 R7 R8 R9 R10 R11 R12
C- dup.Ph1 6 1 - - 3 - 2 - 12 1 3 2
Ph1b-5BL-1 2 - - - - - - 2 3 - - 1
5L0.5 - 2 1 2 4 2 10 4 21 - - -
Ph1 gene region - - - - - - 1 - 7 - - -
Ph1c- ph1b region - - - - - - 5 - 2 - - -
Ph1b- 5BL-11 - 2 1 2 4 2 4 4 12 - - -
5BL-11 -T 9 1 18 1 3 - 2 - 4 1 2 -
Table 3 : Rice - wheat relationship for chromosome arm 5BL.
Wheat Region/ Rice
Chr.
R1 R2 R3 R4 R5 R6 R7 R8 R9 R10 R11 R12
C- dup.Ph1 6 1 - - 3 - 2 - 12 1 3 2
Ph1b-5BL-1 2 - - - - - - 2 3 - - 1
5L0.5 - 2 1 2 4 2 10 4 21 - - -
Ph1 gene region - - - - - - 1
Wheat Region/ Rice
Chr.
R1 R2 R3 R4 R5 R6 R7 R8 R9 R10 R11 R12
C- dup.Ph1 6 1 - - 3 - 2 - 12 1 3 2
Ph1b-5BL-1 2 - - - - - - 2 3 - - 1
5L0.5 - 2 1 2 4 2 10 4 21 - - -
Ph1 gene region - - - - - - 1 - 7 - - -
Ph1c- ph1b region - - - - - - 5 - 2 - - -
Ph1b- 5BL-11 - 2 1 2 4 2 4 4 12 - - -
5BL-11 -T 9 1 18 1 3 - 2 - 4 1 2 -
Table 3 : Rice - wheat relationship for chromosome arm 5BL.

50
Table 4: Wheat- arbidopsis relationship for chromosome arm 5BL.
Wheat Region/ Arabidopsis Chr. A1 A2 A3 A4 A5
C- dup.Ph1 7 5 3 4 5
Ph1b-5BL-1 2 - 1 2 1
5L0.5 9 1 7 6 17
Ph1 gene region - - 1 1 6
Ph1c- ph1b region 3 - 3 - 2
Ph1b- 5BL-11 6 1 3 5 9
5BL-11 -T 18 2 9 1 6
Table 4: Wheat- arbidopsis relationship for chromosome arm 5BL.
Wheat Region/ Arabidopsis Chr. A1 A2 A3 A4 A5
C- dup.Ph1 7 5 3 4 5
Ph1b-5BL-1 2 - 1 2 1
5L0.5 9 1 7 6 17
Ph1 gene region - - 1 1 6
Ph1c- ph1b region 3 - 3 - 2
Ph1b- 5BL-11 6 1 3 5 9
5BL-11 -T 18 2 9 1 6

51
Table 5: Rice –Arabidopsis relationship for chromosome arm 5BL of wheat.
Rice/ arabidopsis A1 A2 A3 A4 A5 X Total
R1 6 3 2 - 4 2 17
R2 1 - - - 1 - 4
R3 9 1 5 1 1 2 19
R4 2 - - - - 1 3
R5 4 - 2 2 1 1 10
R6 - - - - - 2 2
R7 5 - 3 1 5 - 14
R8 1 - 2 1 1 1 6
R9 6 4 5 6 19 1 40
R10 - 1 - - 1 - 2
R11 2 - 1 - 2 - 5
R12 - - - - 2 1 3
X - - - 2 - -
Total 36 9 20 13 36 11
Table 5: Rice –Arabidopsis relationship for chromosome arm 5BL of wheat.
Rice/ arabidopsis A1 A2 A3 A4 A5 X Total
R1 6 3 2 - 4 2 17
R2 1 - - - 1 - 4
R3 9 1 5 1 1 2 19
R4 2 - - - - 1 3
R5 4 - 2 2 1 1 10
R6 - - - - - 2 2
R7 5 - 3 1 5 - 14
R8 1 - 2 1 1 1 6
R9 6 4 5 6 19 1 40
R10
Table 5: Rice –Arabidopsis relationship for chromosome arm 5BL of wheat.
Rice/ arabidopsis A1 A2 A3 A4 A5 X Total
R1 6 3 2 - 4 2 17
R2 1 - - - 1 - 4
R3 9 1 5 1 1 2 19
R4 2 - - - - 1 3
R5 4 - 2 2 1 1 10
R6 - - - - - 2 2
R7 5 - 3 1 5 - 14
R8 1 - 2 1 1 1 6
R9 6 4 5 6 19 1 40
R10 - 1 - - 1 - 2
R11 2 - 1 - 2 - 5
R12 - - - - 2 1 3
X - - - 2 - -
Total 36 9 20 13 36 11

52
Table 6: List of Ph1 gene candidates with putative function and their wheat EST homologs
alongwith their putative function.
Rice
BAC
Rice Candidate Putative Function Wheat EST
Homolog
Blastx Function
AP006169 LOC_Os9G29930 Helix-loop helix
(bHLH) protein
CV779959 bHLH protein family
like
AP005759 LOC_Os9G29960 DNA binding
protein(well
conserved)
CN106070 Unknown protein
AP005759 LOC_Os9G29970 Microtubule
attachment,
chromosome
segregation
CK161428 Holocentric
chromosome binding
protein, myosin heavy
chain like protein
AP005759 LOC_Os9G30070 Basic-leucine zipper
(bZIP) transcription
factor
CD931016 Hypothetical protein
AP005759 LOC_Os9G30010 Methyltransferase,
DNA dependent
transcription regulation
BE415257 SunL protein like,
Methyltransferase
AP005759 LOC_Os9G29950 WD40 (multi-protein
complex assembly)
BE400277 Putative
oligopeptidase,
protease
AP005759 LOC_Os9G30090 WD40 like CD888527,
BE492313
WD40 reapeat family
like protein,
hypothetical protein
AP005759 LOC_Os9G30150 Protein Kinase BQ238899,
CN012003
Hypothetical protein,
Putative protein
kinase
AP005759 LOC_Os9G30160 Zinc finger, C3HC4
type (RING finger):
mediates protein-
protein interactions
CA594470 Putative RING Zinc
finger protein
AP005633 LOC_Os9G30170 F-box protein
interaction domain CF133455 Hypothetical protein
AP005633 LOC_Os9G30180 F-box protein
interaction domain
CD865309,
BQ841696,
CK207845
Hypothetical, F-box
family protein,
Hypothetical protein,
splicing coactivator
subunit SRm300
AP005633 LOC_Os9G30190 Protein Kinase CA624450 Putative protein
kinase
AP005633 LOC_Os9G30200 Expressed hypothetical
protein
BQ842302 Hypothetical protein
AP005392 LOC_Os9G30270 Zinc finger protein CX601356 Unknown, transposon

53
like protein
AP005392 LOC_Os9G30310 Histone like
transcription factor
CK162331 Putative transcription
factor
AP005392 LOC_Os9G30320 Anther-specific protein BE498862 Anther specific
protein
AP005392 LOC_Os9G30380 Meiosis specific
protein
CD920567,
BJ299326
DNA repair protein,
unknown protein
Nuclear protein,
unknown protein
AP005392 LOC_Os9G30400 WRKY DNA binding
protein
CD902089,
CA714784
WRKY DNA binding
protein
AP005392 LOC_Os9G30420 Conserved domain of
unknown function
CK167050 Unknown protein,
UBX domain,
predicted protein of
unkwon function
AC108756 LOC_Os9G31050 Chromatin
reorganization
- -
AC108756 LOC_Os9G31140 Zinc finger protein CK209862* Putative Zinc finger
protein
AC108756 LOC_Os9G31150 RING Zinc Finger BF293596 Putative Zinc finger
protein, WIP1 protein
AC108756 LOC_Os9G31210 Protein Kinase BF484681,
CD907358
Putative protein
kinase like
AC108758 LOC_Os9G31300 Helix-loop-helix DNA-
binding domain
CK196088,
BQ752762
Putative transcription
factor, unknown
protein
Putative helix-loop-
helix protein,
unknown protein
AC108758 LOC_Os9G31390 bZIP transcription
factor-like protein
CD921605,
BQ240568*
bZIP transcription
factor like
transcription factor
like
AC108758 LOC_Os9G31310 Acetyltransferase-like
protein
CV764450 Ubiquitin conjugating
enzyme
* : not a good match

54

55
Fig. 2: Band pattern of probe mwg522 mapped to the ‘5L0.5 region’, in aneuploid
stock of Wheat, digested with two enzymes HindIII and DraI.
N5
AT
5B
N5
BT
5A
N5D
T5A
ph
1b
du
pP
h1
5B
L-1
5B
L-1
1
N5A
T5B
N5
BT
5A
N5
DT
5A
ph
1b
du
pP
h1
5B
L-1
5B
L-1
1
B
A
D
HindIII DraI
N5
AT
5B
N5
BT
5A
N5D
T5A
ph
1b
du
pP
h1
5B
L-1
5B
L-1
1
N5A
T5B
N5
BT
5A
N5
DT
5A
ph
1b
du
pP
h1
5B
L-1
5B
L-1
1
B
A
D
HindIII DraI

56
Fig. 3: Banding pattern of probe abc302 in aneuploid stock of Wheat, digested with
two enzymes HindIII and DraI
N5A
T5B
N5B
T5A
N5D
T5A
ph
1b
du
pP
h1
5B
L-1
5B
L-1
1
N5
AT
5B
N5
BT
5A
N5
DT
5A
ph
1b
du
pP
h1
5B
L-1
5B
L-1
1
A
BD
A
B
D
HindIII DraI
N5A
T5B
N5B
T5A
N5D
T5A
ph
1b
du
pP
h1
5B
L-1
5B
L-1
1
N5
AT
5B
N5
BT
5A
N5
DT
5A
ph
1b
du
pP
h1
5B
L-1
5B
L-1
1
A
BD
A
B
D
HindIII DraI

57
Fig. 4: Band pattern of probe BE636942 in aneuploid stock of Wheat, digested with
enzyme HindIII. (5BL-8*: The band pattern for this deletion line was not scored as
the fraction length of this deletion is 0.52, but it showed presence of B-band for all
the markers which were missing in both 5BL-1 and 5BL-5).
N5
AT
5B
N5
BT
5A
N5D
T5
A
ph
1b
du
pP
h1
5B
L-1
5B
L-1
1
Cap
pel
li
ph
1c
5B
L-5
5B
L-8
*
5A
L-1
0
5A
L-1
2
5D
L-1
5D
L-1
2HindIII
5A
L-4
5D
L-1
1
N5
AT
5B
N5
BT
5A
N5D
T5
A
ph
1b
du
pP
h1
5B
L-1
5B
L-1
1
Cap
pel
li
ph
1c
5B
L-5
5B
L-8
*
5A
L-1
0
5A
L-1
2
5D
L-1
5D
L-1
2HindIII
5A
L-4
5D
L-1
1

58
Wheat, 5BLWheat, 5BL
22
33
44
11
55
ArabidopsisArabidopsis
Chromosomes Chromosomes
BE443430a, BE443430b, ksu8a, ksu8b, ksu8c,
BE404454, BE636942b, BE405358
40 ( 32%) 40 ( 32%)
RiceRice
1
2
3
4
5
6
7
8
9
10
11
12 3 3 ( 2%)( 2%)
17 (14%)17 (14%)
19 19 (13%)(13%)
3 ( 2%)3 ( 2%)
10 (8%)10 (8%)
2 ( 2%) 2 ( 2%)
14 (11%)14 (11%)
6 (5%)6 (5%)
2 (2%)2 (2%)
5 ( 4%)5 ( 4%)
4 4 ( 3%)( 3%)
11-- 36 (32%)36 (32%)
22-- 9 (7%)9 (7%)
33-- 20 (18%)20 (18%)
44-- 13 (12%)13 (12%)
55-- 36 (32%)36 (32%)
bcd351a, bcd351b, cdo786c, wg364, wg530, psb85
5BL-1
5BL-11
PB, ph1bPB, ph1c
PB, dupPh1
DB, ph1bDB, ph1c
Ph
1g
ene
reg
ion
DB, dupPh1
5B
L2
.55B
L2.1
5B
L1.7
BE403221, BE406996, BE488679, BE496925a, BE496925b, Xcdo348a,
BE406612, BE478520, mwg624 BE445260, cdo388a, BE404462a,
BE404462b, BE426080a, BF474840, BE499599, BE500811, BE442892,
BE591423, BG274279, BF473933, cdo1049, BF478950, BE406545,
BE443937a, BE443937b, BF201857, BE425296, BE443021, BE443692,
BE403518, BE403761, BE442814, BE499135
BE590997a, BE590997b, BE495790, psr128,
abc302, Xcdo412a, BE483335, psr574, wg564a
BE442918BE442918,, BE405060,BE405060,
BE443817BE443817
Ph1, BF474342, bcd1088, bcd1949, BE636942a,
cdo786a, cdo1090, unl4, cdo412b, ksus1
BE442600, BE442763, abc717, BE444353, AF302673, BE605135, BE499843,
abg387a, AA231753, BE637838, cdo385, BE637923, BE500727, BE493886,
mwg522, abc168a, BE445248a, BE426080b, BF484440a, BF484440b, BE494426a,
BE494426b, BE445424, BE442676, BE442893, BE444353, BE445208, BE484133,
BE497111
BE604883, BE495846, BE485285, BE604829, BF474090, BG606780,
BM140591, BM138069, cdo348b, BE496112, BE496891, BE500170,
BF291672, BF293157, BE497595, BE638037, BE500827, BE590622,
BE517902, BF484813, BE471089, BG313323, BE404437, BF483771,
BE425968, BE443610, BE500452, BE591416, BE203136, BE497111,
cdo388b, BF484437, BF483731, BE637885, BE445873, BE495277,
BG274124, BE488792, bcd508, BE499738, BE500513, abg314, BE406592,
BE426712, BE471214, BE605032, BF200863, BE499659, BF483038,
BE482522, BE478964, BE484028, BE489227, BF428826, BF478849, BE202009,
BE352611, BM137728, BE488364
Fig. 5:Fig. 5: WheatWheat--RiceRice--Arabidopsis Synteny on chromosome arm 5BL. All 12 rice chromosomArabidopsis Synteny on chromosome arm 5BL. All 12 rice chromosomes and five arabidopsis chromosomes are represented by blocks ofes and five arabidopsis chromosomes are represented by blocks of different colors. The probes for which nodifferent colors. The probes for which no homologs homologs were were
found are written in black. found are written in black. BE404454: This probe has its homolog on rice chromosome 9(represented by same font color as chromosome 9 block) and arabidopsis chromosome 5 (represented by small block in front of
it). The number and percentage of the markers giving hit on different chromosomes are indicated on the side of each color coded block.. The number of orthologous sequences identified for different rice and arabidopsis
chromosomes are indicated in both numbers and percentages in front of each color coded chromosome block.
Wheat, 5BLWheat, 5BL
22
33
44
11
55
ArabidopsisArabidopsis
Chromosomes Chromosomes
22
33
44
11
55
22
33
44
11
55
ArabidopsisArabidopsis
Chromosomes Chromosomes
BE443430a, BE443430b, ksu8a, ksu8b, ksu8c,
BE404454, BE636942b, BE405358
BE443430a, BE443430b, ksu8a, ksu8b, ksu8c,
BE404454, BE636942b, BE405358
40 ( 32%) 40 ( 32%)
RiceRice
1
2
3
4
5
6
7
8
9
10
11
12 3 3 ( 2%)( 2%)
17 (14%)17 (14%)
19 19 (13%)(13%)
3 ( 2%)3 ( 2%)
10 (8%)10 (8%)
2 ( 2%) 2 ( 2%)
14 (11%)14 (11%)
6 (5%)6 (5%)
2 (2%)2 (2%)
5 ( 4%)5 ( 4%)
4 4 ( 3%)( 3%)
RiceRice
1
2
3
4
5
6
7
8
9
10
11
12 3 3 ( 2%)( 2%)
17 (14%)17 (14%)
19 19 (13%)(13%)
3 ( 2%)3 ( 2%)
10 (8%)10 (8%)
2 ( 2%) 2 ( 2%)
14 (11%)14 (11%)
6 (5%)6 (5%)
2 (2%)2 (2%)
5 ( 4%)5 ( 4%)
4 4 ( 3%)( 3%)
11-- 36 (32%)36 (32%)
22-- 9 (7%)9 (7%)
33-- 20 (18%)20 (18%)
44-- 13 (12%)13 (12%)
55-- 36 (32%)36 (32%)
11-- 36 (32%)36 (32%)
22-- 9 (7%)9 (7%)
33-- 20 (18%)20 (18%)
44-- 13 (12%)13 (12%)
55-- 36 (32%)36 (32%)
bcd351a, bcd351b, cdo786c, wg364, wg530, psb85bcd351a, bcd351b, cdo786c, wg364, wg530, psb85
5BL-1
5BL-11
PB, ph1bPB, ph1c
PB, dupPh1
DB, ph1bDB, ph1c
Ph
1g
ene
reg
ion
DB, dupPh1
5B
L2
.55B
L2.1
5B
L1.7
BE403221, BE406996, BE488679, BE496925a, BE496925b, Xcdo348a,
BE406612, BE478520, mwg624 BE445260, cdo388a, BE404462a,
BE404462b, BE426080a, BF474840, BE499599, BE500811, BE442892,
BE591423, BG274279, BF473933, cdo1049, BF478950, BE406545,
BE443937a, BE443937b, BF201857, BE425296, BE443021, BE443692,
BE403518, BE403761, BE442814, BE499135
BE590997a, BE590997b, BE495790, psr128,
abc302, Xcdo412a, BE483335, psr574, wg564a
BE442918BE442918,, BE405060,BE405060,
BE443817BE443817
Ph1, BF474342, bcd1088, bcd1949, BE636942a,
cdo786a, cdo1090, unl4, cdo412b, ksus1
Ph1, BF474342, bcd1088, bcd1949, BE636942a,
cdo786a, cdo1090, unl4, cdo412b, ksus1
BE442600, BE442763, abc717, BE444353, AF302673, BE605135, BE499843,
abg387a, AA231753, BE637838, cdo385, BE637923, BE500727, BE493886,
mwg522, abc168a, BE445248a, BE426080b, BF484440a, BF484440b, BE494426a,
BE494426b, BE445424, BE442676, BE442893, BE444353, BE445208, BE484133,
BE497111
BE442600, BE442763, abc717, BE444353, AF302673, BE605135, BE499843,
abg387a, AA231753, BE637838, cdo385, BE637923, BE500727, BE493886,
mwg522, abc168a, BE445248a, BE426080b, BF484440a, BF484440b, BE494426a,
BE494426b, BE445424, BE442676, BE442893, BE444353, BE445208, BE484133,
BE497111
BE604883, BE495846, BE485285, BE604829, BF474090, BG606780,
BM140591, BM138069, cdo348b, BE496112, BE496891, BE500170,
BF291672, BF293157, BE497595, BE638037, BE500827, BE590622,
BE517902, BF484813, BE471089, BG313323, BE404437, BF483771,
BE425968, BE443610, BE500452, BE591416, BE203136, BE497111,
cdo388b, BF484437, BF483731, BE637885, BE445873, BE495277,
BG274124, BE488792, bcd508, BE499738, BE500513, abg314, BE406592,
BE426712, BE471214, BE605032, BF200863, BE499659, BF483038,
BE482522, BE478964, BE484028, BE489227, BF428826, BF478849, BE202009,
BE352611, BM137728, BE488364
Fig. 5:Fig. 5: WheatWheat--RiceRice--Arabidopsis Synteny on chromosome arm 5BL. All 12 rice chromosomArabidopsis Synteny on chromosome arm 5BL. All 12 rice chromosomes and five arabidopsis chromosomes are represented by blocks ofes and five arabidopsis chromosomes are represented by blocks of different colors. The probes for which nodifferent colors. The probes for which no homologs homologs were were
found are written in black. found are written in black. BE404454: This probe has its homolog on rice chromosome 9(represented by same font color as chromosome 9 block) and arabidopsis chromosome 5 (represented by small block in front of
it). The number and percentage of the markers giving hit on different chromosomes are indicated on the side of each color coded block.. The number of orthologous sequences identified for different rice and arabidopsis
chromosomes are indicated in both numbers and percentages in front of each color coded chromosome block.

59
(d)(d)
1
2
3
4
5
6
7
8
9
10
11
12
0.290.29
0.550.55
0.750.750.760.76
0.790.79
0.590.59
PB, PB, ph1bph1b
(a)(a) ( c)( c)
Fig. 6: (a)Wheat 5BL arm showing different regions delimited by breakpoints of
different deletion lines, (b) rice-wheat synteny view: Each region on 5BL arm is
color coded according to rice chromosome matching a significant number of
wheat ESTs mapped to that region, the number of matches is indicated inside
the colored block ( c) older view;The rice-wheat synteny view for 5BL arm as
published in earlier studies, (d) Color coded rice chromosomes: All twelve
rice chromosomes are represented by different colors. Chromosome number
for each color is indicated inside the colored block
12
21
6 3 3 2 2
3 2
2
2
1074 4
18 9 4 3
(b)(b)
R9
R1
R5
R1
1R
12
R7
R9
R1
R5
R3
22 1 ns1 ns
2 1 ns1 ns
6 1010
1 11 1
14 1313
12 66
0 ns0 nsR
6R
12
R9
R3
(d)(d)
1
2
3
4
5
6
7
8
9
10
11
12
0.290.29
0.550.55
0.750.750.760.76
0.790.79
0.590.59
PB, PB, ph1bph1b
(a)(a) ( c)( c)
Fig. 6: (a)Wheat 5BL arm showing different regions delimited by breakpoints of
different deletion lines, (b) rice-wheat synteny view: Each region on 5BL arm is
color coded according to rice chromosome matching a significant number of
wheat ESTs mapped to that region, the number of matches is indicated inside
the colored block ( c) older view;The rice-wheat synteny view for 5BL arm as
published in earlier studies, (d) Color coded rice chromosomes: All twelve
rice chromosomes are represented by different colors. Chromosome number
for each color is indicated inside the colored block
12
21
6 3 3 2 2
3 2
2
2
1074 4
18 9 4 3
(b)(b)
R9
R1
R5
R1
1R
12
R7
R9
R1
R5
R3
22 1 ns1 ns
2 1 ns1 ns
6 1010
1 11 1
14 1313
12 66
0 ns0 ns
22 1 ns1 ns
2 1 ns1 ns
6 1010
1 11 1
14 1313
12 66
0 ns0 nsR
6R
12
R9
R3

60
5BL-1
ph1c
ph1b
Wheat, 5BLWheat, 5BL
99
Fig. 7: Fig. 7: WheatWheat--RiceRice Synteny Synteny for two mini genefor two mini gene--rich regions rich regions
present in ‘5L0.5 region’ on 5BL. Regions on chromosome 9 present in ‘5L0.5 region’ on 5BL. Regions on chromosome 9
and 7 of Rice,and 7 of Rice, syntenous syntenous to ‘to ‘Ph1 Ph1 gene region’ and ‘gene region’ and ‘ph1cph1c--ph1bph1b
region’ are color coded in same colors as the two regions on region’ are color coded in same colors as the two regions on
wheat chromosome.wheat chromosome.
Syntenous Syntenous to the to the
‘‘Ph1Ph1 gene region’gene region’
Syntenous to the
‘ph1c-ph1b
gene region’
77
Ph1
Ph1
gen
e re
gio
ngen
e re
gio
nph
1c
ph
1c --
ph
1b
ph
1b
reg
ion
reg
ion
Rice 9Rice 9
Rice 7Rice 7
3510449 bp3510449 bp
3626498 bp3626498 bp
18615877 bp18615877 bp
18748622 bp18748622 bp
1004270 bp1004270 bp
3876606 bp3876606 bp
18162398 bp

61
(translation initiation factor/eIF3e)
DB, ph1cDB, ph1c
(Nucleoporin)
bcd1949(unknown protein)
(unknown protein)
(heat shock protein/Molecular chaperone)
5BL5BL--11
cdo412
ksus1
bcd1088(protein kinase)
BE636942
cdo57cdo57(heat shock protein)
unl4(heat shock protein)
cdo1090
cdo786
BE405358(glycosylase) BE404454
(glucosidase)
BF474342*
(WRKY transcription
factor)
(heat shock protein/Molecular chaperone)
18162398
18748622
Methyltransferase, transcription regulation
DNA binding protein
Protein comtaining bHLH domain
Microtubule attachment, chromosome segregation
bZIP transcription factor
bcd1949
bcd1088bcd1088
WD40 like
Protein kinase
Zinc finger protein
F-box protein
F-box protein
Protein kinase
Unknown expressed protein
cdo57
unl4unl4
cdo1090
cdo786
BE636942
Swim Zn finger protein
Histone like transcription factor
Anther specific protein
Meiosis specific protein
WRKY DNA-binding domain
Domain of unknown function
Chromatin reorganisation
Zinc finger protein
Zinc finger protein
Protein Kinase
BE405358
BE404454
Helix-loop-helix DNA binding protein
bZIP like transcription factor
Acetyltransferase
WD40 proteins(multi-protein complex assembly)
CV779959
CN106070
CK161428
CD931016
BE400277
BE492313
BE415257
CN012003
CA594470
CF133455
CD865309
CA624450
BQ842302
CX601356
CK162331
BE498862CD920567
CD902089
CK167050
CK209862
BF293596
BF484681CK196088
CV764450
CD921605
(a) (b) (c)
Fig. 8:Fig. 8: (a):(a): Genetic Map of ‘Ph1 gene region’, The probes for which genetic mapping data was not available are indicated by dashed lines for their location.
They were placed to the location shown in the map based on their physical map position as well as their orthologous sequence on rice, *: map position not confirmed
(b): 450 kb region on rice ‘Ph1 gene region’of wheat.: blue dots indicate the location of mapped wheat markers on the rice ‘Ph1 gene region’ , while red dots indicate
the rice genes present in the 450 Kb region, The genes shown in blue letters are the highest priority candidates based on their function for Ph1 gene( c): Wheat EST
homologs identified for Rice genes

62
pos 3
pos 8
pos 1
pos 1
pos 4
pos 5
1
1
2
2
3
3
6
6
4 45
5
7
7
88
(a) Duplication pattern
(b) Hybridization pattern of positive BAC clones
pos 8
pos 3
Fig. 9: (a) Duplication pattern of eight BAC clones in each square on the high density BAC library filters; (b) The different hyberidization patterns
of the BAC clones identified by southern analysis of the wheat and barley BAC libraries using ‘Ph1 gene probes’. Based on the pattern of the
‘dots’ in each square and comparing it with duplication pattern of the BAC clones as shown in (a), the hyberidizing BAC clones are assigned ‘pos’
numbers, which are used to decode addresses of the BAC clones in a library.

63
Fig. 10: Autoradiogram showing banding pattern of positive clones with probe cdo1090 in
membrane containing 32 clones. Positive clones are categorized into different pattern sets based
on the relative distance from comb and number of bands. Clones showing same pattern are put
together in one category.
1 2 3 4 5 6 7 8 9 10 11 12 13 14 15 16 17 18 19 20 21 22 23 24 25 26 27 28 29 30 31 32 1 2 3 4 5 6 7 8 9 10 11 12 13 14 15 16 17 18 19 20 21 22 23 24 25 26 27 28 29 30 31 32

64
Bibliography
Ahn, S. N., Anderson, J. A., Sorrells, M. E., Tanksley, S. D. (1993) Homoeologous relationships
of rice, wheat and maize. Mol Gen Genet 241: 483-490.
Ahn, S. N. and Tanksley, S. D. (1993) Comparative linkage maps of the rice and maize genomes.
Proc. Natl. Acad. Sci. USA 90: 7980-7984.
Altschul, Stephen, F., Thomas, L. M., Alejandro, A., Schäffer, Jinghui, Z., Zheng, Z., Webb
Miller, and David J. L. (1997) "Gapped BLAST and PSI-BLAST: a new generation of protein
database search programs". Nucleic Acids Res. 25: 3389-3402.
Ambrose, B. A., Lerner, D. R., Ciceri, P., Padilla, C. M., Yanofsky, M. F., Schmidt, R. J. (2000)
Molecular and genetic analyses of the silky1 gene reveal conservation in floral organ
specification between eudicots and monocots. Mol Cell 5(3): 569-579.
Anderson, J. A., Ogihara, Y., Sorrells, M. E., and Tanksley, S. D. (1992). Development of a
chromosomal arm map for wheat based on RFLP markers. Theor Appl Genet 83: 1035-1043.
Ambrose, B. A., Lerner, D. R., Ciceri, P., Padilla, C. M., Yanofsky, M. F., Schmidt, R. J. (2000)
Molecular and genetic analyses of the silky1 gene reveal conservation in floral organ
specification between eudicots and monocots. Mol Cell 5(3): 569-579.
Arumugunathan, K. and Earle, E. D. (1991) Estimation of nuclear DNA content of plants by
flow cytometry. Plant Mol Biol Rep 9:229-233.
Avivi, L. and Feldman, M. (1973) The mechanism of somatic association in common wheat,
Triticum aestivum L. IV. Further evidence for modification of spindle tubulin through the
somatic-association genes as measured by vinblastine binding. Genetics 73: 379-385.
Avivi, L., Feldman, M. and Bushuk, W. (1970a) The mechanism of somatic association in
common wheat, Triticum aestivum L. II. Differential affinity for colchicine of spindle
microtubules of plants having different doses of the somatic association suppressor. Genetics 65:
585.
Avivi, L., Feldman, M. and Bushuk, W. (1970b) The mechanism of somatic association in
common wheat, Triticum aestivum L. III. Differential affinity for nucleotides of spindle
microtubules of plants having different doses of somatic-association suppressors. Genetics 66:
449-461
Bailey, P. C., Mckibbin, R. S., Lenton, J. R., Holdsworth, M. J., Flintham, J. E. and Gale, M. D.
(1999) Genetic map locations of orthologous Vp1 gene in wheat and rice. Theor Appl Genet 98:
281-284.

65
Barakat, A., Matassi, G. and Bernardi, G. (1998) Distribution of genes in the genome of
Arabidopsis thaliana and its implications for the genome organization of plants. Proc Natl Acad
Sci USA 95: 10044-10049
Barakat, A., Carels, N. and Bernardi, G. (1997) The distribution of genes in the genome of
Gramineae. Proc. Natl Acad. Sci. 94: 6857–6861.
Bennetzen, J. L. and Freeling, M. (1993) Grasses as a single genetic system. Trends Genet 9:
259-261.
Bezant, J., Laurie, D., Pratchett, N., Chojecki, J. and Kearsey, M. (1996). Marker regression
mapping of QTL controlling flowering time and plant height in a spring barley (Hordeum
vulgare L.). cross. Heredity 77: 64-73Blazquez MA, and Weigel D. (2000) Integration of floral
inductive signals in Arabidopsis. Nature 404(6780): 889-892.
Blazquez, M. A. and Weigel, D. (2000) Integration of floral inductive signals in Arabidopsis.
Nature 20;404(6780): 889-92.
Bonierbale, M. W., Plaisted, R. L. & Tanksley, S. D. (1988) RFLP Maps Based on a Common
Set of Clones Reveal Modes of Chromosomal Evolution in Potato and Tomato. Genetics 120:
1095-1103.
Boyko, E., Kalendar, R., Korzun, V., Fellers, J., Korol, A., Schulman, A. H., Gill, B. S. (2002) A
high-density cytogenetic map of the Aegilops tauschii genome incorporating retrotransposons
and defense-related genes: insights into cereal chromosome structure and function. Plant Mol
Biol. 48(5-6): 767-790.
Boyko, E. V., Gill, K. S., Mickelson-Young, L., Nasuda, S., Roupp, W. J., Ziegle, J. N., Singh,
S., Hassawi, D. S., Fritz, A. K., Namuth, D. (1999). A high-density genetic linkage map of
Aegilops tauschii, the D-genome progenitor of bread wheat. Theor Appl Genet 99: 16-26.
Causse, M., Fulton, T. M., Cho, Y. G., Ahn, S. N., Chunwongse, J., Wu, K., Xiao, J., Yu, Z.,
Ronald, P. C., Harrington, S. B., Second, G. A., McCouch, S. R., Tanksley, S. D. (1994)
Saturated molecular map of the rice genome based on an interspecific backcross population.
Genetics 138: 1251-1274.
Ceoloni, C., Avivi, L. and Feldman, M. (1984) Spindle sensitivity to colchicine of the Ph1
mutant in common wheat. Can. J. Genet. Cytol. 26: 111-118.
Cenci, A., Chantret. N., Kong, X., Gu. Y., Anderson, O. D., Fahima, T., Distelfeld. A.,
Dubcovsky, J. (2003) Construction and characterization of a half million clone BAC library of
durum wheat ( Triticum turgidum ssp. durum). Theor Appl Genet 107(5): 931-939.
Chen, M., Sanmiguel, P., De Oliveira, A. C., Woo, S. S., Zhang, H., Wing, R. A., and
Bennetzen, J. L. (1997) Microcolinearity in sh2-homologous regions of the maize, rice and
sorghum genomes. Proc. Natl. Acad. Sci. USA 94: 3431-3435.

66
Conley, E. J., Nduati, V., Gonzalez-Hernandez, J. L., Mesfin, A., Trudeau-Spanjers, M., Chao,
S., Lazo, G. R., Hummel, D. D., Anderson, O. D., Qi, L. L., Gill, B. S., Echalier, B., Linkiewicz,
A. M., Dubcovsky, J., Akhunov, E. D., Dvorak, J., Peng, J. H., Lapitan, N. L., Pathan, M. S.,
Nguyen, H. T., Ma, X. F., Miftahudin, Gustafson, J. P., Greene, R. A., Sorrells, M. E., Hossain,
KG, Kalavacharla V, Kianian SF, Sidhu D, Dilbirligi M, Gill KS, Choi DW, Fenton RD, Close
T. J., McGuire, P. E., Qualset, C. O., Anderson, J. A.(2004) A 2600-locus chromosome bin map
of wheat homoeologous group 2 reveals interstitial gene-rich islands and colinearity with rice.
168(2): 625-637
Delaney, D., Nasuda, S., Endo, T. R., Gill, B. S., and Hulbert, S. H. (1995a). Cytologically based
physical maps of the group-2 chromosomes of wheat. Theor Appl Genet. 91: 568-573.
Delaney, D., Nasuda, S., Endo, T. R., Gill, B. S., and Hulbert, S. H. (1995b). Cytologically based
physical maps of the group-3 chromosomes of wheat. Theor Appl Genet. 91: 780-782.
Devos, K.M. and Gale, M.D. (1997). Comparative genetics in the grasses. Plant Mol. Biol. 35: 3-
15.
Devos, K. M. and Gale, M. D. (2000) Genome relationships: The grass model in current
research. The Plant Cell 12: 637-646.
Devos, K. M., Chao, S., Li, Q. Y., Simonetti, M. C., and Gale, M. D. (1994) Relationship
between chromosome 9 of maize and wheat homeologous group 7 chromosomes. Genetics 138:
1287-1292.
Driscoll, C. J. (1972) Genetic suppression of homoeologous chromosome pairing in hexaploid
wheat. Can. J. Genet. Cytol. 14: 39-42.
Dubcovsky, J., Luo, M. C., Zhong, G. Y., Bransteitter, R., Desai, A., Kilian, A., Kleihofs, A.,
Dvorak, J. (1996) Genetic map of diploid wheat, Triticum monococcum L., and its comparison
with maps of Hordeum vulgare L. Genetics 143(2): 983-99.
Dubcovsky, J., Luo, M. C. and Dvorak, J. (1995) Differentiation between homoeologous
chromosomes 1A of wheat and 1Am
of Triticum monococcum and its recognition by the wheat
Ph1 locus. Proc. Natl. Acad. Sci. USA. 92: 6645-6649.
Dvorak, J., Mcguire, P. E. and Cassidy, B. (1988) Apparent sources of the A genomes of wheat
inferred from polymorphism in abundance and restriction fragment length of repeated nucleotide
sequences. Genome 30: 680-689.
Endo, T. R. and Gill, B. S. (1996) The deletion stocks of common wheat. J. Hered. 87: 295-307.
Endo, T. R. (1988) Induction of chromosomal structural changes by a chromosome of Aegilops
cylendrica L. in common wheat. J Hered 79: 366-370.

67
Erayman, M., Sandhu, D., Sidhu, D., Dilbirligi, M., Baenziger, P. S. and Gill, K. S. (2004)
Demarcating the gene-rich regions of the wheat genome. Nucleic Acids Res. 12: 3546-65.
Faris, J. D., Haen, K. M. and Gill, B. S. (2000). Saturation mapping of a gene-rich recombination
hot spot region in wheat. Genetics 154: 823-835.
Feldman, M. (1993) Cytogenetic activity and mode of action of the pairing homoeologous (Ph1)
gene of wheat. Crop Sci. 33: 894-897.
Feinberg, A. P., and Vogelstein, B. (1983) A technique for radiolabeling DNA restriction
endonuclease fragments to high specific activity. Anal Biochem. 132(1): 6-13.
Feldman, M. (1966) The effect of chromosomes 5B, 5D and 5A on chromosome pairing in
Triticum aestivum. Proc. Natl. Acad. Sci. USA 55: 1447-1453.
Feldman, M. and Avivi, L. (1988) Genetic contol of bivalent pairing in common wheat: the
mode of action of Ph1 action in Kew Chromosome Conference III, edited by P. E. Brandham.
Her Majesty’s Stationary Office, London. 269-279.
Flavell, R. B., Bennett, M. D., Smith, J. B., Smith, D. B. (1974) Genome size and the proportion
of repeated nucleotide sequence DNA in plants. Biochem Genet 12: 257-269.
Foote, T., Roberts, M., Kurata, N., Sasaki, T., Moore, G. (1997) Detailed comparative mapping
of cereal chromosome regions corresponding to the Ph1 locus in wheat. Genetics 147: 801-807.
Gallego, F., Feuillet, C., Messmer, M., Penger, A., Graner, A., Yano, M., Sasaki, T., Keller, B.
(1998) Comparative mapping of two leaf rust resistance loci Lr1 and Lr10 in rice and barley.
Genome 41: 328-336.
Gill, K. S. and Gill, B. S. (1996a) A PCR-based screening assay of Phl, the chromosome pairing
regulator gene of wheat. Crop Sci. 36: 719-722.
Gill, K.S., Gill, B. S., Endo, T. R. and Boyko, E. V. (1996b) Identification and high-density
mapping of gene-rich regions in chromosome group 5 in wheat. Genetics 143: 1001-1012.
Gill, K. S., Gill, B. S., Endo, T. R., and Taylor, T. (1996c) Identification and high-density
mapping of gene-rich regions in chromosome group 1 of wheat. Genetics 144: 1883-1891.
Gill, K. S., Gill, B. S., Endo, T. R. and Mukai, Y. (1993a) Fine physical mapping of Ph1, a
chromosome pairing regulator gene in polyploid wheat. Genetics 134: 1231-1236.
Gill, K. S., Gill, B. S., and Endo, T. R. (1993b). A chromosome region-specific mapping strategy
reveals gene-rich telomeric ends in wheat. Chromosoma 102: 374-381.
Gill, K. S. and Gill, B. S. (1991) A DNA fragment mapped within the submicroscopic deletion of
Ph1: a chromosome pairing regulator gene in polyploid wheat. Genetics 129: 257-259.

68
Giorgi, B., and Barbera, F. (1981) Increase of homoeologous pairing in hybrids between a Ph
mutant of T. turgidum L. var. durum and two tetraploid species of Aegilops: Aegilops kotschy'
and Ae. cylindrica. Cereal Res. Commun. 9: 205-211.
Goff, S. A., Ricke, D., Lan, T. H., Presting, G., Wang, R., Dunn, M., Glazebrook, J., Sessions,
A., Oeller, P., Varma, H. (2002) A draft sequence of the rice genome (Oryza sativa L. ssp.
japonica). Science 296: 92–100.
Graner, A., A. Jahoor, J. Schondelmaier, H. Siedler, K. Pillen, G. Fischbeck, G. Wenzel, and
R.G. Herrmann. (1991). Construction of an RFLP map of barley. Theor. Appl. Genet. 83: 250-
256.
Gualandi, G., Ceoloni, C., Feldman, M. and L. Avivi (1984) Spindle sensitivity to isopropyl-N-
phenyl-carbamate and griseofulvin of common wheat plants carrying different doses of the Ph1
gene. Can. J. Genet. Cytol. 26:119-127.
Hart, G. E. (1987) Genetic and biochemical studies of enzymes. In EG Heyne, ed, Wheat and
Wheat Improvement, Ed 2, Vol. 13. American Society of Agronomy, Madison, WI, pp 199-214.
Havukkala, I. (1996) Genome research and evolution in rice and other cereals. Curr. Opinion in
Genes and Development. 6(6): 711-714.
Heun, M., Kennedy, A. E., Anderson, J. A., Lapitan, N. L. V. and Sorrells M. E.(1991)
Construction of a restriction fragment length polymorphism map for barley (Hordeum vulgare).
Genome 34: 437-447.
Hofer, J., Turner, L., Hellens, R., Ambrose, M., Matthews, P., Michael, A., Ellis, N. (1997)
UNIFOLIATA regulates leaf and flower morphogenesis in pea.Curr Biol. 7(8): 581-587.
Holm, P. B. and Wang, X. (1988) The effect of chromosome 5B on synapsis and chiasma
formation in wheat, Triticum aestivum cv. Chinese Spring. Carlsberg Res. Comm. 53: 191-208.
Hossain, K. G., Kalavacharla, V., Lazo, G. R., Hegstad, J., Wentz, M. J., Kianian, P. M., Simons,
K., Gehlhar, S., Rust, J. L., Syamala, R. R., Obeori, K., Bhamidimarri, S., Karunadharma, P.,
Chao, S., Anderson, O. D., Qi, L. L., Echalier, B., Gill, B. S., Linkiewicz, A. M., Ratnasiri, A.,
Dubcovsky, J., Akhunov, E. D., Dvorak, J., Miftahudin, Ross, K., Gustafson, J. P., Radhawa, H.
S., Dilbirligi, M., Gill, K. S., Peng, J. H., Lapitan, N. L., Greene, R. A., Bermudez-Kandianis, C.
E., Sorrells, M. E., Feril, O., Pathan, M. S., Nguyen, H. T., Gonzalez-Hernandez, J. L., Conley,
E. J., Anderson, J. A., Choi, D. W., Fenton, D., Close, T. J., McGuire, P. E., Qualset, C. O.,
Kianian, S. F. (2004) A chromosome bin map of 2148 expressed sequence tag loci of wheat
homoeologous group 7.Genetics. 168(2): 665-676.
Hossain, K. G., Riera-Lizarazu, O., Kalavacharla, V. M., Vales, I. Maan, S. S. and Kianian,
S. F. (2004) Radiation Hybrid Mapping of the Species Cytoplasm-Specific (scsae
) Gene in
Wheat. Genetics 168: 415-423.

69
Hulbert, S. H., Richter, T. E., Axtell, J. D., Bennetzen, J. L. (1990) Genetic mapping and
characterization of sorghum and related crops by means of maize DNA probes. Proc Natl Acad
Sci U S A. 87(11): 4251-4255.
Ikeda, A., Ueguchi-Tanaka, M., Sonoda, Y., Kitano, H., Koshioka, M., Futsuhara, Y., Matsuoka,
M., Yamaguchi, J. (2001) slender rice, a constitutive gibberellin response mutant, is caused by a
null mutation of the SLR1 gene, an ortholog of the height-regulating gene GAI/RGA/RHT/D8.
Plant Cell. 13(5): 999-1010.
Jampates, R. and Dvorak, J. (1986) Location of Ph1 locus in the metaphase chromosome map
and linkage map of the 5Bq arm of wheat. Can. J. Genet. Cytol. 28: 511-519.
Keller, B. and Feuillet, C. (2000) Colinearity and gene density in grass genomes. Trends Plant
Sci. 5: 246-251
Kihara, H. (1944) Discovery of the DD-analyser, one of the ancestors of vulgare wheats. Agric.
Hotic. (Tokyo) 19: 889-890.
Kilian, A., Kudrna, D. A., Kleinhofs, A., Yano, M., Kurata, N., Steffenson, B. and Sasaki, T.
(1995) Rice-barley synteny and its application to saturation mapping of the barley Rpg1
regionNucleic Acids Res. 23: 2729–2733.
Kleinhofs, A., A. Kilian, M.A. Saghai Maroof, R.M. Biyashev, P. Hayes, F.Q. Chen, N. Lapitan,
A. Fenwick, T.K. Blake, E. Anaiev, L. Dahleen, D. Kudrna, J. Bollinger, S.J. Knapp, B. Liu, M.
Sorrells, M. Heun, J.D. Franckowiak, D. Hoffman, R. Skadsen, and B.J. Steffenson. (1993). A
molecular, isozyme and morphological map of the barley (Hordeum vulgare) genome. Theor.
Appl. Genet. 86: 705-712.
Kunzel, G., L. Korzum, and A. Meister. (2000). Cytologically Integrated Physical Restriction
Fragement Length Polymorphism Maps for the Barley Genome Based on Translocation
Breakpoints. Genetics 154:397-412.
Korzun, V., Malyshev, S., and Kartel, N. (1998). A genetic linkage map of rye (Secale cereale
L.). Theor Appl Genet 96: 203-208.
Kota, R. S., Gill, K. S., Gill, B. S. and Endo, T. R. (1993). A cytogenetically based physical map
of chromosome 1B in common wheat. Genome 36: 548-554.
Kyozuka, J., Kobayashi, T., Morita, M., Shimamoto, K. (2000) Spatially and temporally
regulatedexpression of rice MADS box genes with similarity to Arabidopsis class A, B and C
genes.Plant Cell Physiol. 41(6): 710-718.
La Rota, M. and Sorrells, M. E. (2004) Comparative DNA sequence analysis of mapped wheat
ESTs reveals the complexity of genome relationships between rice and wheat. Funct Integr
Genomics. 4(1): 34-46.

70
Laurie, D., Pratchett, N., Bezant, J. and Snape, J. W. (1995). RFLP mapping of five major genes
and eight quantitative trait loci controlling flowering time in a winter x spring barley (Hordeum
vulgare L.) cross. Genome 38: 575-585.
Linkiewicz, A. M., Qi, L. L., Gill, B. S., Ratnasiri, A., Echalier, B., Chao, S., Lazo, G. R.,
Hummel, D. D., Anderson, O. D., Akhunov, E. D., Dvorak, J., Pathan, M. S., Nguyen, H. T.,
Peng, J. H., Lapitan, N. L., Miftahudin, Gustafson, J. P., La Rota, C. M., Sorrells, M. E.,
Hossain, K. G., Kalavacharla, V., Kianian, S. F., Sandhu, D., Bondareva, S. N., Gill, K. S.,
Conley, E. J., Anderson, J. A., Fenton, R. D., Close, T. J., McGuire, P. E., Qualset, C. O.,
Dubcovsky, J. (2004) A 2500-locus bin map of wheat homoeologous group 5 provides insights
on gene distribution and colinearity with rice.Genetics 168(2): 665-676.
Luo, M. C., Dubcovsky, J. and Dvorak, J. (1996) Recognition of homeology by the wheat Ph1
locus. Genetics 144: 1195-1203.
Mickelson-Young, L., Endo, T. R., and Gill, B. S. (1995). A cytogenetic ladder map of the wheat
homoeologous group-4 chromosomes. Theor Appl Genet 90: 1007-1011.
Miftahudin, Ross, K., Ma, X. F., Mahmoud, A. A., Layton, J., Milla, M. A., Chikmawati, T.,
Ramalingam, J., Feril, O., Pathan, M. S., Momirovic, G. S., Kim, S., Chema, K., Fang, P., Haule,
L., Struxness, H., Birkes, J., Yaghoubian, C., Skinner, R., McAllister, J., Nguyen, V., Qi, L. L.,
Echalier, B., Gill, B. S., Linkiewicz, A. M., Dubcovsky, J., Akhunov, E. D., Dvorak, J.,
Dilbirligi, M., Gill, K. S., Peng, J. H., Lapitan, N. L., Bermudez-Kandianis, C. E., Sorrells, M.
E., Hossain, K. G., Kalavacharla.,V., Kianian, S. F., Lazo, G. R., Chao, S., Anderson, O. D.,
Gonzalez-Hernandez, J., Conley, E. J., Anderson, J. A., Choi, D. W., Fenton, R. D., Close, T. J.,
McGuire, P. E., Qualset, C. O., Nguyen, H. T., Gustafson, J. P. (2004) Analysis of expressed
sequence tag loci on wheat chromosome group 4. Genetics.168(2): 609-623.
Mikhailova, E. I., Naranjo, T., Shepherd, K., Wennekes-van, E. J., Heyting, C., De Jong, J. H.
(1998) The effect of the wheat Ph1 locus on chromatin organisation and meiotic chromosome
pairing analysed by genome painting. Chromosoma. 107(5): 339-350.
Mello-Sampayo, T. and Canas, P. (1973) Suppressors of meiotic chromosome pairing in
common wheat. In Proceedings of the 4th International Wheat Genetics Symposium, 6–11
August. Edited by E.R. Sears and L.M.S. Sears. Universtiy of Missouri, Columbia, Mo. 709–
713.
Moore, G., Devos, K. M., Wang, Z., Gale, M. D. (1995) Grasses line up and form a circle.
Current Biology 5: 737-739.
Munkvold, J. D., Greene, R. A., Bermudez-Kandianis, C. E., La Rota, C. M., Edwards, H.,
Sorrells, S. F., Dake, T., Benscher, D., Kantety, R., Linkiewicz, A. M., Dubcovsky, J., Akhunov,
E. D., Dvorak, J., Miftahudin, Gustafson J. P., Pathan, M. S., Nguyen, H. T., Matthews, D. E.,
Chao, S., Lazo, G. R., Hummel, D. D., Anderson, O. D., Anderson, J. A., Gonzalez-Hernandez,
J. L., Peng, J. H., Lapitan, N., Qi, L. L., Echalier, B., Gill, B. S., Hossain, K. G., Kalavacharla,
V., Kianian, S. F., Sandhu, D., Erayman, M., Gill, K. S., McGuire, P. E., Qualset, C. O., Sorrells,

71
M. E. (2004) Group 3 chromosome bin maps of wheat and their relationship to rice chromosome
1 Genetics 168(2): 639-650.
O'Donoughue, L. S., Wang, Z., Ršder, M., Kneen, B., Leggett, M., Sorrells, M. E., Tanksley, S.
D. (1992) An RFLP-based map of oat on a cross between two diploid taxa (Avena atlantica x A.
hirtula). Genome 35: 765-771.
Peng, J. H., Zadeh, H., Lazo, G. R., Gustafson, J. P., Chao, S., Anderson, O. D., Qi, L. L.,
Echalier, B., Gill, B. S., Dilbirligi, M., Sandhu, D., Gill, K. S., Greene, R. A., Sorrells, M. E.,
Akhunov, E. D., Dvorak, J., Linkiewicz, A. M., Dubcovsky, J., Hossain, K. G., Kalavacharla, V.,
Kianian, S. F., Mahmoud, A. A., Miftahudin, Conley, E. J., Anderson, J. A., Pathan, M. S.,
Nguyen, H. T., McGuire, P. E., Qualset, C. O., Lapitan, N. L. (2004) Chromosome bin map of
expressed sequence tags in homoeologous group 1 of hexaploid wheat and homoeology with rice
and Arabidopsis. Genetics 168(2): 625-637.
Peng, J., Abraham B. Korol, Tzion Fahima, Marion S. Röder, Yefim I. Ronin, Youchun C. Li,
and Eviatar Nevo (2000) Molecular Genetic Maps in Wild Emmer Wheat, Triticum dicoccoides:
Genome-Wide Coverage, Massive Negative Interference, and Putative Quasi-Linkage. Genome
Res. 10(10): 1509-1531.
Peng, J., Richards, D. E., Moritz, T., Cano-Delgado, A., Harberd, N. P. (1999) Suppressors of
the Arabidopsis gai mutation alter the dose-response relationship of diverse gibberellin
responses.Plant Physiol. 119(4): 1199-1208.
Peng, J., Carol, P., Richards, D. E., King, K. E., Cowling, R. J., Murphy, G. P., Harberd, N. P.
(1997) The Arabidopsis GAI gene defines a signaling pathway that negatively regulates
gibberellin responses. Genes Dev. 11(23): 3194-3205.
Putterill, J., Robson, F., Lee, K., Simon, R., Coupland, G. (1995) The CONSTANS gene of
Arabidopsis promotes flowering and encodes a protein showing similarities to zinc finger
transcription factors. Cell 80(6): 847-857.
Randhawa, H. S., Dilbirligi, M., Sidhu, D., Erayman, M., Sandhu, D., Bondareva, S., Chao, S.,
Lazo, G. R., Anderson, O. D., Miftahudin, Gustafson, J. P., Echalier, B., Qi, L. L., Gill, B. S.,
Akhunov, E. D., Dvorak, J., Linkiewicz, A. M., Ratnasiri, A., Dubcovsky, J., Bermudez-
Kandianis, C. E., Greene, R. A., Sorrells, M. E., Conley, E. J., Anderson, J. A., Peng, J. H,
Lapitan, N. L., Hossain, K. G., Kalavacharla, V., Kianian, S. F, Pathan, M. S., Nguyen, H. T.,
Endo, T. R., Close, T. J., McGuire, P. E., Qualset, C. O., Gill, K. S. (2004) Deletion mapping of
homoeologous group 6-specific wheat expressed sequence tags. Genetics 168(2): 677-86.
Rayapati, P. J., Gregory, J. W., Lee, M., Wise, R. P. (1995) A linkage map of diploid oat Avena
based on RFLP loci and a locus conferring resistance to Puccinia coronata var. avenae. Theor.
Appl. Genet. 89: 831.
Riley, R. and Kempanna, C. (1963) The homoeologous nature of the non-homologous meiotic
pairing in Triticum aestivum deficient for chromosome V (5B). Heredity 18: 287-306.

72
Riley, R. and Chapman, V. (1958) Genetic control of the cytologically diploid behavior of
wheat. Nature 182: 713-715.
Roder, M. S., Plaschke, J., Konig, S. U., Borner, A., Sorrells, M. E., Tanksley, S. D., Ganal, M.
W. (1995) Abundance, variability and chromosomal location of microsatellites in wheat. Mol
Gen Genet. 246(3): 327-333.
Rogowsky, P. M., Sorrells, M. E., Shephard, K. W. and Langridge, P. (1993). Characterisation of
wheat-rye recombinants with RFLP and PCR probes. Theor Appl Genet 85: 1023-1028.
Sax, K. (1922) Sterility in wheat hybrids. II. Chromosome behavior in partially sterile hybrids.
Genetics 7: 513-552.
Sidhu, D. and Gill, K. S. (2004). Distribution Of Genes And Recombination In Wheat And Other
Eukaryotes. Plant Cell Tissue and Organ Culture 79: 257–270.
Sandhu, D. and Gill, K. S. (2002) Gene-Containing Regions of Wheat and the Other Grass
Genomes Plant Physiol. 128: 803-811.
Sandhu, D., Champoux, J. A., Bondareva, S. N., Gill, K. S. (2001a) Identification and physical
localization of useful genes and markers to a major gene-rich region on wheat group 1S
chromosomes. Genetics 157: 1735-1747.
.
Sandhu., D. and Gill K. S. (2001b) Candidate-gene cloning and targeted marker enrichment of
wheat chromosomal regions using RNA fingerprinting-differential display. Gnome 44(4): 633-
639.
Sarma, R. N., Gill, B. S., Sasaki, T., Galiba, G., Sutka, J., Laurie, D. A. and Snape, J. W. (1998)
Comparative mapping of the wheat chromosome 5A Vrn-A1 with rice and its relationship to
QTL for flowering time, Theor. Appl. Genet. 97: 103-109.
Sears, E. R. (1977) An induced mutant with homoeologous pairing in common wheat. Can. J.
Genet. Cytol. 19: 583-593.
Sears, E. R. (1976) Genetic control of chromosome pairing in wheat. Annu. Rev. Genet. 10: 31-
51.
Sears, E. R. (1966) Nullisomic-tetrasomic combinations in hexaploid wheat. In: chromosome
manipulation and plant genetics (Lewis, DR ed). London: oliver and Boyd., 29-47.
Sears, E. R. (1954) The aneupolids of common wheat. Mo. Agr. Exp. Sta. Res. Bull. 572: 1-58.
Sears, E. R. and Okamoto M. (1958) Intergenomic chromosome relationship in hexaploid wheat.
Proc. Tenth. Inc. Congr. Genet. 2: 258-259.

73
Sharp, P. J., Chao, S., Desai, S. and Gale, M. D. (1989) The isolation, characterization and
application in the Triticeae of a set of wheat RFLP probes identifying each homoeologous
chromosome arm. Theor. Appl. Genet. 78:342-348.
Song, J., Yamamoto, K., Shomura, A., Itadani, H., Zhong, H. S., Yano, M., Sasaki, T. (1998)
Isolation and mapping of a family of putative zinc-finger protein cDNAs from rice. DNA Res.
30;5(2): 95-101.
Tikhonov, A. P., SanMiguel, P. J., Nakajima, Y., Gorenstein, N. M., Bennetzen, J. L.,
Avramova, Z. (1999) Colinearity and its exceptions in orthologous adh regions of maize and
sorghum Proc Natl Acad Sci U S A. 96(13): 7409-7414.
Upadhya, M. D. and Swaminathan, M. S. (1967) Mechanism regulating chromosome pairing in
Triticum. Biol. Zentralbl. Suppl.86: 239-255.
Vega, J. M. and Feldman, M. (1998) Effect of the pairing gene Ph1 and premeiotic colchicine
treatment on intra- and interchromosome pairing of isochromosomes in common wheat.Genetics.
150(3):1199-1208.
Ward, R. V., Yang, L., Kim, H. S. and Yen, C. (1998). Comparative analyses of RFLP diversity
in landraces of Triticum aestivum and collections of T. tauschii from China and Southwest Asia.
Theor Appl Genet 96: 312-318.
Weng, Y., Tuleen, N. A. and Hart, G. E. (2000). Extended physical maps and a consensus
physical map of the homoeologous group-6 chromosomes of wheat (Triticum aestivum L. em
Thell.) Theor Appl Genet 100: 519-527.
Werner, J. E., Endo, T. R. and Gill, B. S. (1992). Toward a cytogenetically based physical map
of the wheat genome. Proc Natl Acad Sci USA 89: 11307-11311.
Yano M, Katayose Y, Ashikari M, Yamanouchi U, Monna L, Fuse T, Baba T, Yamamoto K,
Umehara Y, Nagamura Y, Sasaki T. (2000) Hd1, a major photoperiod sensitivity quantitative
trait locus in rice, is closely related to the Arabidopsis flowering time gene CONSTANS.Plant
Cell. (12): 2473-2484.
Yu, Y., Tomkins, J. P., Waugh, R., Frisch, D. A., Kudrna, D., Kleinhofs, A., Breuggeman, R.S.,
Muehlbauer, G. J., Wise, R. P., Wing, R. A. (2000) A bacterial artificial chromosome library for
barley (Hordeum Vulgare L.) and identification of clones containing putative resistance genes.
Theor Appl Genet 101: 1093-1099.