Embed Size (px)
Citation preview

OFFICE OF THE ASSTT. ENGINEER (PIA) IWMP P.S. SINDHARI
DETAIL PROJECT REPORT
BARMER (IWMP)-22
YEAR 2010-11 (UNDER INTEGRATED WATERSHED MANAGEMENT PROGRAMME)
BLOCK: SINDHARI DISTRICT : BARMER
AGRO CLIMATIC ZONE- 14
TOTAL GEOGRAPHICAL AREA – 5247 Hac.
TOTAL COST- 787.05 Lacs.
UNIT COST- 15,000/Hac.
SUBMITTED BY
PROJECT MANAGER
DISTRICT WATERSHED DEVELOPMENT UNIT
BARMER, (RAJASTHAN)
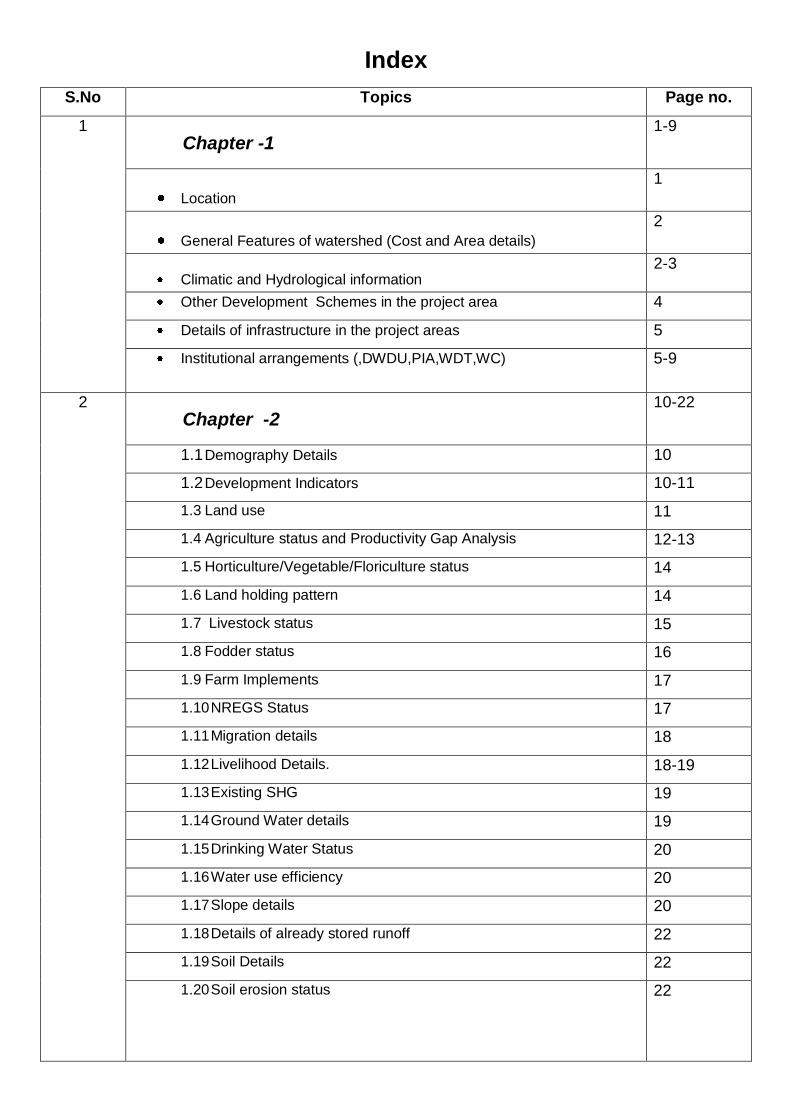
Index
S.No Topics Page no.
1 Chapter -1
1-9
Location 1
General Features of watershed (Cost and Area details) 2
Climatic and Hydrological information 2-3
Other Development Schemes in the project area 4
Details of infrastructure in the project areas 5
Institutional arrangements (,DWDU,PIA,WDT,WC)
5-9
2 Chapter -2
10-22
1.1 Demography Details 10
1.2 Development Indicators 10-11
1.3 Land use 11
1.4 Agriculture status and Productivity Gap Analysis 12-13
1.5 Horticulture/Vegetable/Floriculture status 14
1.6 Land holding pattern 14
1.7 Livestock status 15
1.8 Fodder status 16
1.9 Farm Implements 17
1.10 NREGS Status 17
1.11 Migration details 18
1.12 Livelihood Details. 18-19
1.13 Existing SHG 19
1.14 Ground Water details 19
1.15 Drinking Water Status 20
1.16 Water use efficiency 20
1.17 Slope details 20
1.18 Details of already stored runoff 22
1.19 Soil Details 22
1.20 Soil erosion status
22
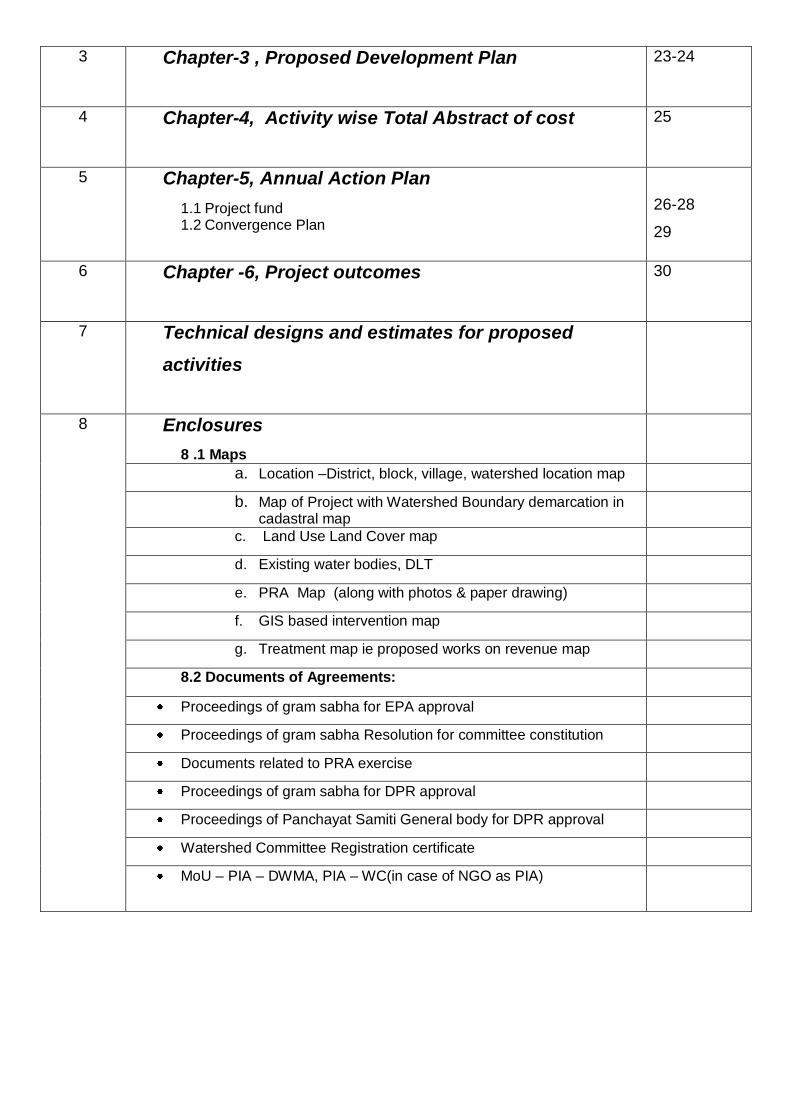
3 Chapter-3 , Proposed Development Plan
23-24
4 Chapter-4, Activity wise Total Abstract of cost
25
5 Chapter-5, Annual Action Plan
1.1 Project fund 1.2 Convergence Plan
26-28
29
6 Chapter -6, Project outcomes
30
7 Technical designs and estimates for proposed
activities
8 Enclosures
8 .1 Maps
a. Location –District, block, village, watershed location map
b. Map of Project with Watershed Boundary demarcation in cadastral map
c. Land Use Land Cover map
d. Existing water bodies, DLT
e. PRA Map (along with photos & paper drawing)
f. GIS based intervention map
g. Treatment map ie proposed works on revenue map
8.2 Documents of Agreements:
Proceedings of gram sabha for EPA approval
Proceedings of gram sabha Resolution for committee constitution
Documents related to PRA exercise
Proceedings of gram sabha for DPR approval
Proceedings of Panchayat Samiti General body for DPR approval
Watershed Committee Registration certificate
MoU – PIA – DWMA, PIA – WC(in case of NGO as PIA)
CHAPTER – I
INTRODUCTION
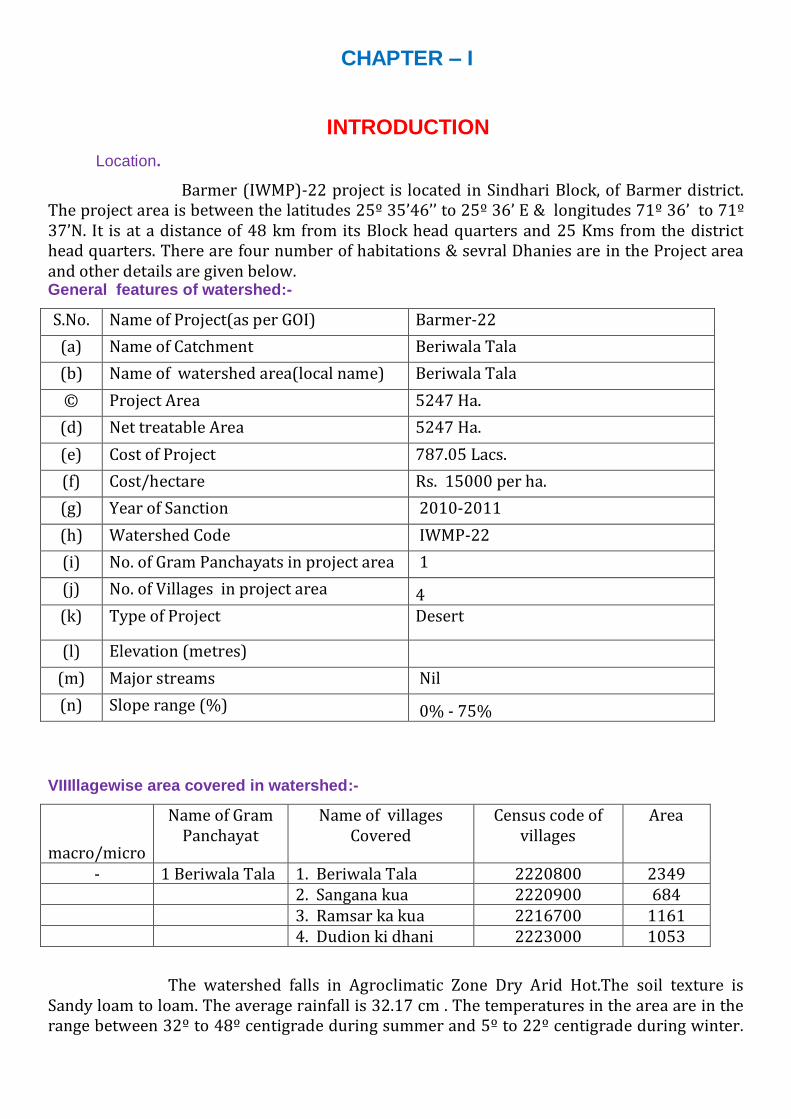
Location.
Barmer (IWMP)-22 project is located in Sindhari Block, of Barmer district. The project area is between the latitudes 25º 35’46’’ to 25º 36’ E & longitudes 71º 36’ to 71º 37’N. It is at a distance of 48 km from its Block head quarters and 25 Kms from the district head quarters. There are four number of habitations & sevral Dhanies are in the Project area and other details are given below. General features of watershed:-
S.No. Name of Project(as per GOI) Barmer-22
(a) Name of Catchment Beriwala Tala
(b) Name of watershed area(local name) Beriwala Tala
© Project Area 5247 Ha.
(d) Net treatable Area 5247 Ha.
(e) Cost of Project 787.05 Lacs.
(f) Cost/hectare Rs. 15000 per ha.
(g) Year of Sanction 2010-2011
(h) Watershed Code IWMP-22
(i) No. of Gram Panchayats in project area 1
(j) No. of Villages in project area 4 (k) Type of Project Desert
(l) Elevation (metres)
(m) Major streams Nil
(n) Slope range (%) 0% - 75%
VIIIllagewise area covered in watershed:-
macro/micro
Name of Gram Panchayat
Name of villages Covered
Census code of villages
Area
- 1 Beriwala Tala 1. Beriwala Tala 2220800 2349 2. Sangana kua 2220900 684 3. Ramsar ka kua 2216700 1161 4. Dudion ki dhani 2223000 1053
The watershed falls in Agroclimatic Zone Dry Arid Hot.The soil texture is Sandy loam to loam. The average rainfall is 32.17 cm . The temperatures in the area are in the range between 32º to 48º centigrade during summer and 5º to 22º centigrade during winter.
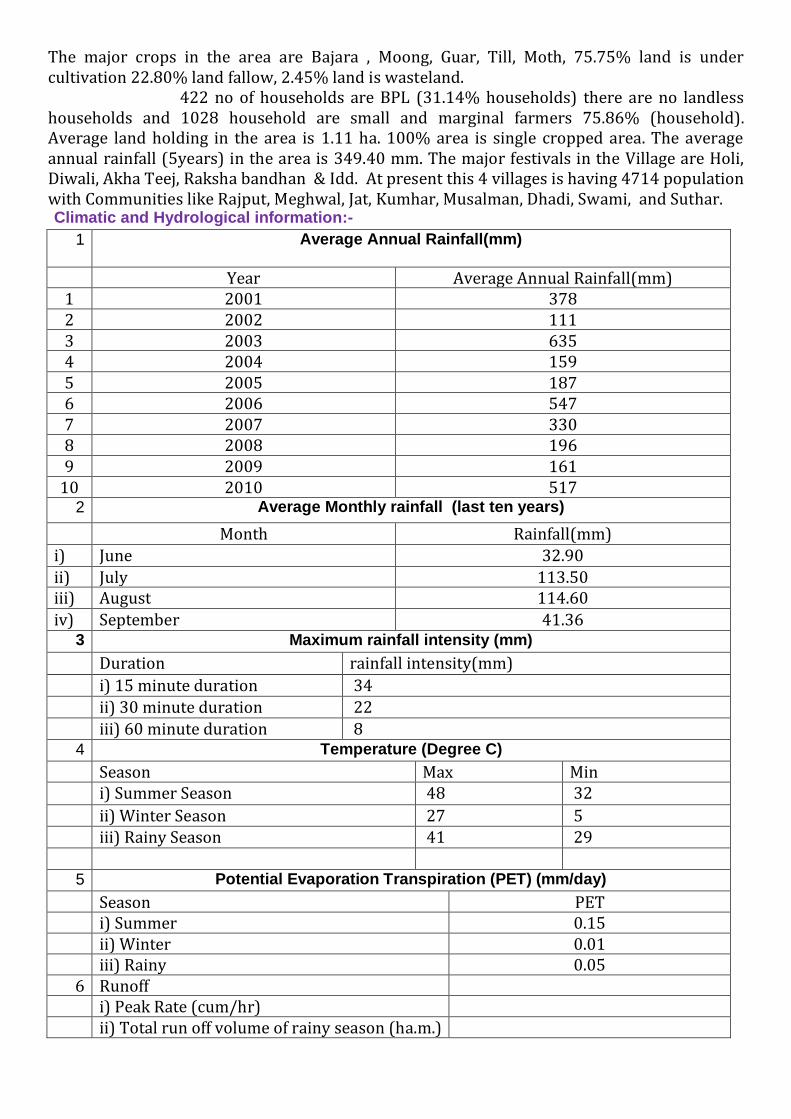
The major crops in the area are Bajara , Moong, Guar, Till, Moth, 75.75% land is under cultivation 22.80% land fallow, 2.45% land is wasteland. 422 no of households are BPL (31.14% households) there are no landless households and 1028 household are small and marginal farmers 75.86% (household). Average land holding in the area is 1.11 ha. 100% area is single cropped area. The average annual rainfall (5years) in the area is 349.40 mm. The major festivals in the Village are Holi, Diwali, Akha Teej, Raksha bandhan & Idd. At present this 4 villages is having 4714 population with Communities like Rajput, Meghwal, Jat, Kumhar, Musalman, Dhadi, Swami, and Suthar. Climatic and Hydrological information:-
1 Average Annual Rainfall(mm)
Year Average Annual Rainfall(mm) 1 2001 378 2 2002 111 3 2003 635 4 2004 159 5 2005 187 6 2006 547 7 2007 330 8 2008 196 9 2009 161
10 2010 517 2 Average Monthly rainfall (last ten years)
Month Rainfall(mm)
i) June 32.90
ii) July 113.50 iii) August 114.60
iv) September 41.36 3 Maximum rainfall intensity (mm)
Duration rainfall intensity(mm) i) 15 minute duration 34 ii) 30 minute duration 22 iii) 60 minute duration 8
4 Temperature (Degree C)
Season Max Min i) Summer Season 48 32 ii) Winter Season 27 5 iii) Rainy Season 41 29
5 Potential Evaporation Transpiration (PET) (mm/day)
Season PET i) Summer 0.15 ii) Winter 0.01 iii) Rainy 0.05
6 Runoff i) Peak Rate (cum/hr) ii) Total run off volume of rainy season (ha.m.)
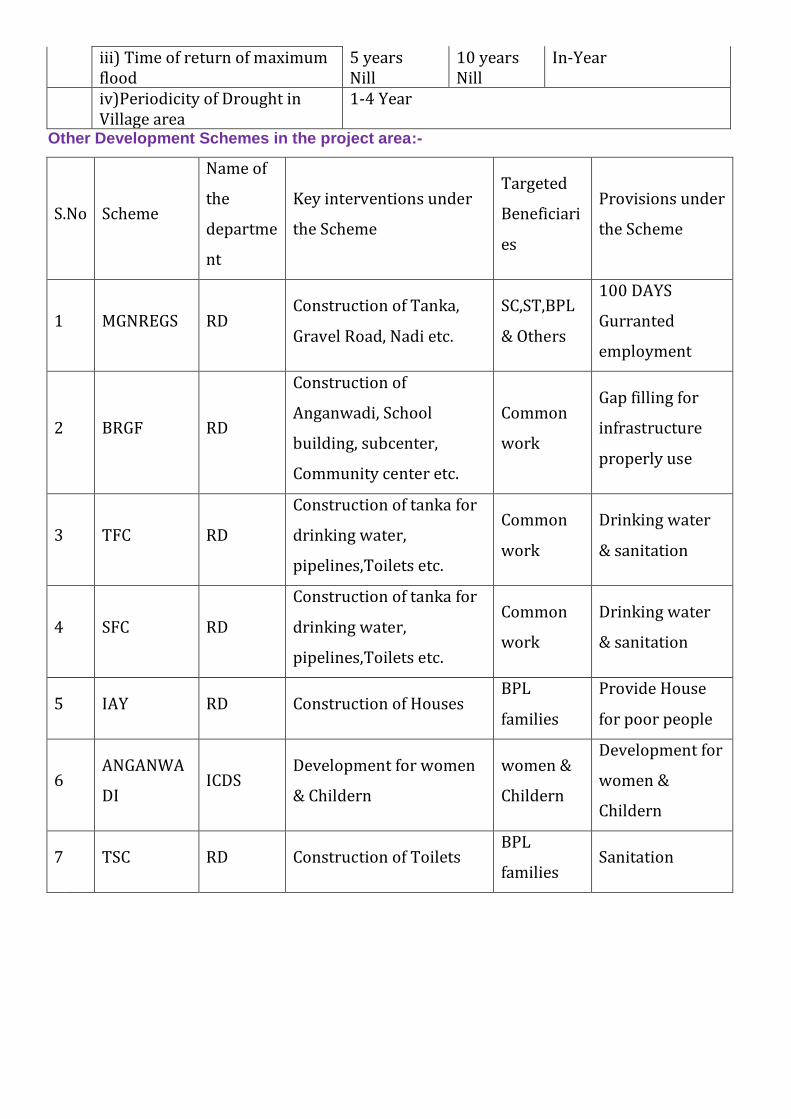
iii) Time of return of maximum flood
5 years Nill
10 years Nill
In-Year
iv)Periodicity of Drought in Village area
1-4 Year
Other Development Schemes in the project area:-
S.No Scheme
Name of
the
departme
nt
Key interventions under
the Scheme
Targeted
Beneficiari
es
Provisions under
the Scheme
1 MGNREGS RD Construction of Tanka,
Gravel Road, Nadi etc.
SC,ST,BPL
& Others
100 DAYS
Gurranted
employment
2 BRGF RD
Construction of
Anganwadi, School
building, subcenter,
Community center etc.
Common
work
Gap filling for
infrastructure
properly use
3 TFC RD
Construction of tanka for
drinking water,
pipelines,Toilets etc.
Common
work
Drinking water
& sanitation
4 SFC RD
Construction of tanka for
drinking water,
pipelines,Toilets etc.
Common
work
Drinking water
& sanitation
5 IAY RD Construction of Houses BPL
families
Provide House
for poor people
6 ANGANWA
DI ICDS
Development for women
& Childern
women &
Childern
Development for
women &
Childern
7 TSC RD Construction of Toilets BPL
families Sanitation
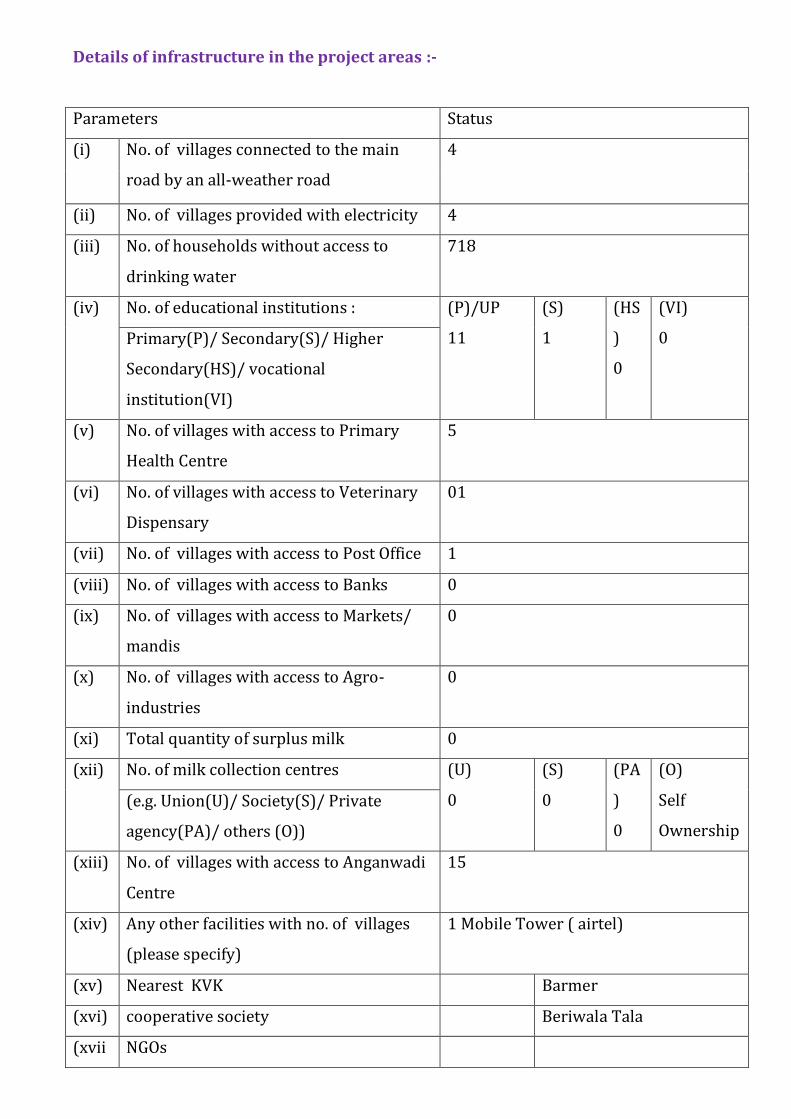
Details of infrastructure in the project areas :-
Parameters Status
(i) No. of villages connected to the main
road by an all-weather road
4
(ii) No. of villages provided with electricity 4
(iii) No. of households without access to
drinking water
718
(iv) No. of educational institutions : (P)/UP
11
(S)
1
(HS
)
0
(VI)
0 Primary(P)/ Secondary(S)/ Higher
Secondary(HS)/ vocational
institution(VI)
(v) No. of villages with access to Primary
Health Centre
5
(vi) No. of villages with access to Veterinary
Dispensary
01
(vii) No. of villages with access to Post Office 1
(viii) No. of villages with access to Banks 0
(ix) No. of villages with access to Markets/
mandis
0
(x) No. of villages with access to Agro-
industries
0
(xi) Total quantity of surplus milk 0
(xii) No. of milk collection centres (U)
0
(S)
0
(PA
)
0
(O)
Self
Ownership
(e.g. Union(U)/ Society(S)/ Private
agency(PA)/ others (O))
(xiii) No. of villages with access to Anganwadi
Centre
15
(xiv) Any other facilities with no. of villages
(please specify)
1 Mobile Tower ( airtel)
(xv) Nearest KVK Barmer
(xvi) cooperative society Beriwala Tala
(xvii NGOs
)
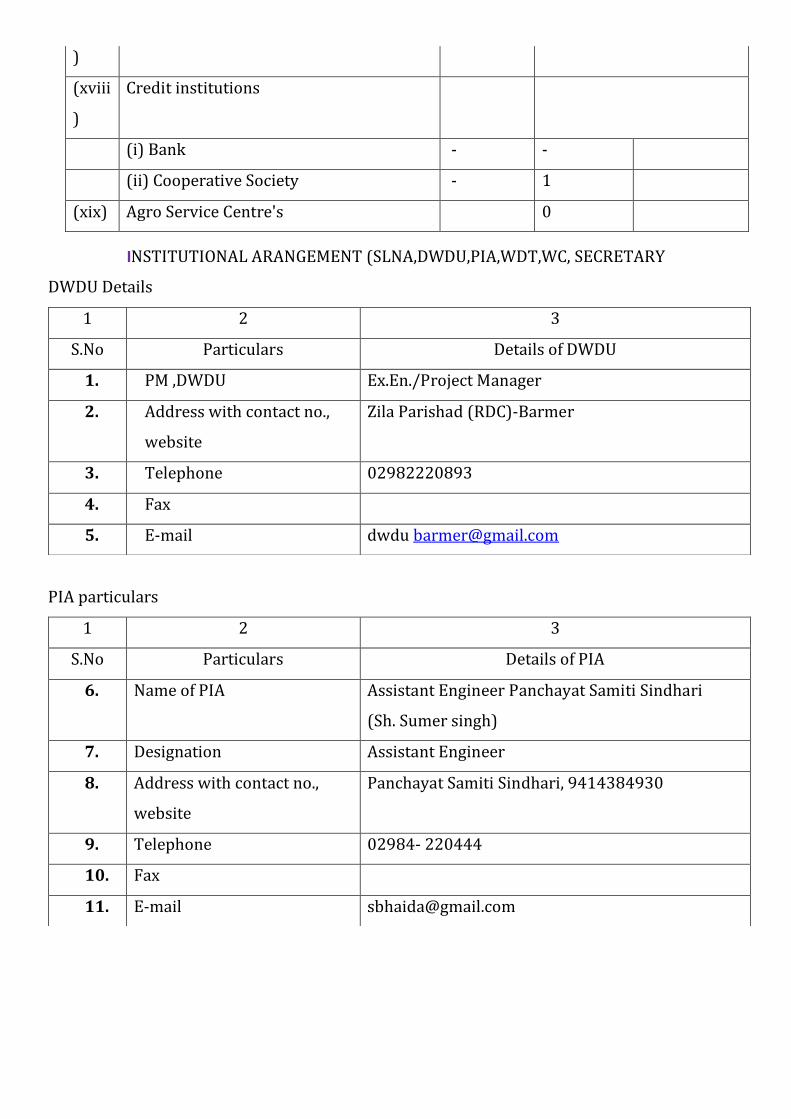
(xviii
)
Credit institutions
(i) Bank - -
(ii) Cooperative Society - 1
(xix) Agro Service Centre's 0
INSTITUTIONAL ARANGEMENT (SLNA,DWDU,PIA,WDT,WC, SECRETARY
DWDU Details
PIA particulars
1 2 3
S.No Particulars Details of DWDU
1. PM ,DWDU Ex.En./Project Manager
2. Address with contact no.,
website
Zila Parishad (RDC)-Barmer
3. Telephone 02982220893
4. Fax
5. E-mail dwdu [email protected]
1 2 3
S.No Particulars Details of PIA
6. Name of PIA Assistant Engineer Panchayat Samiti Sindhari
(Sh. Sumer singh)
7. Designation Assistant Engineer
8. Address with contact no.,
website
Panchayat Samiti Sindhari, 9414384930
9. Telephone 02984- 220444
10. Fax
11. E-mail [email protected]
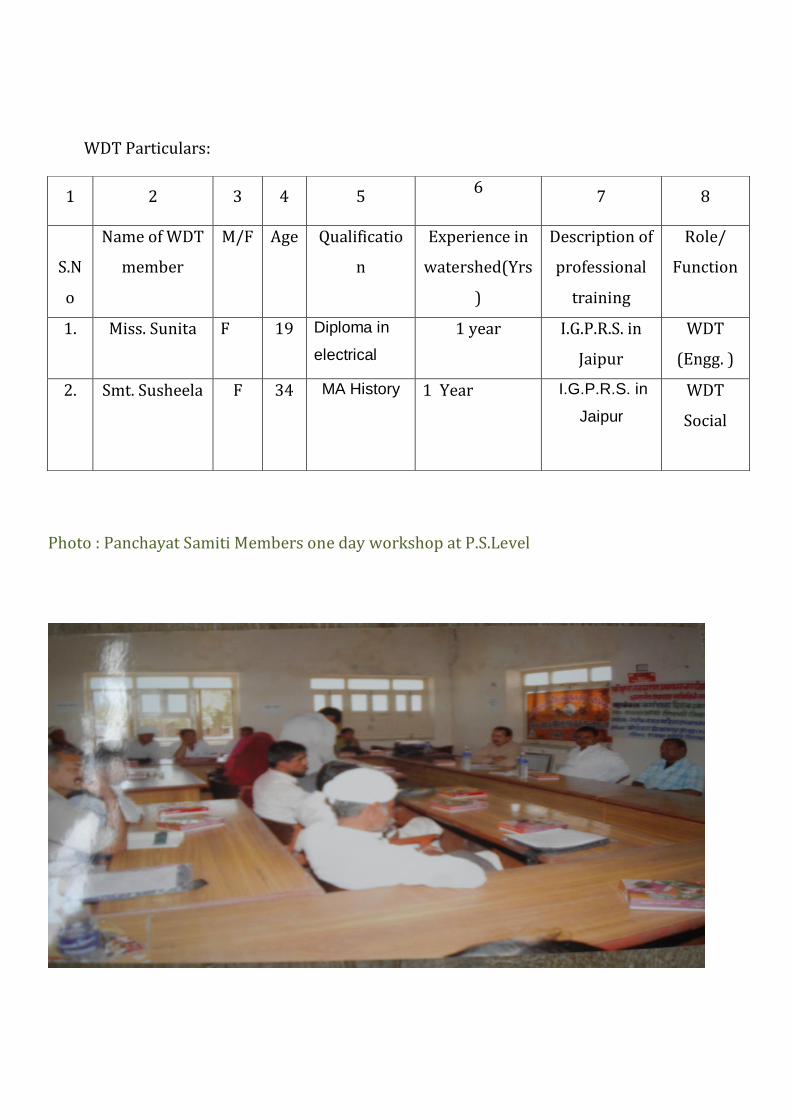
WDT Particulars:
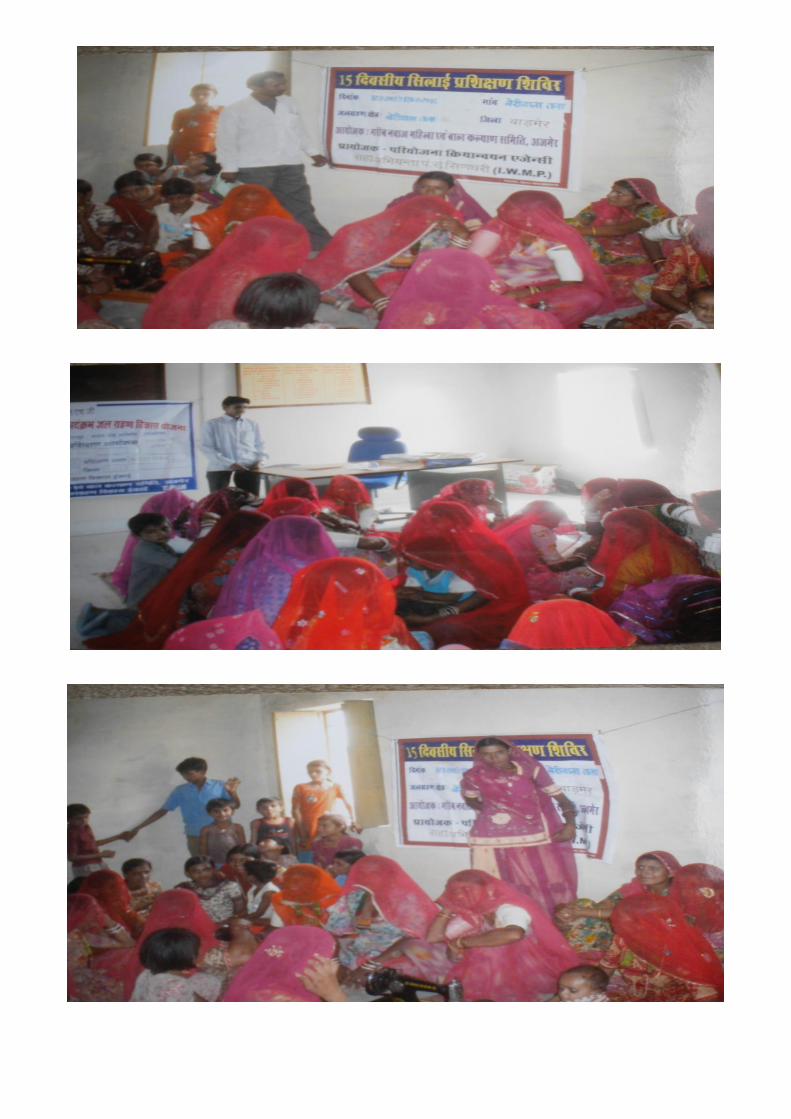
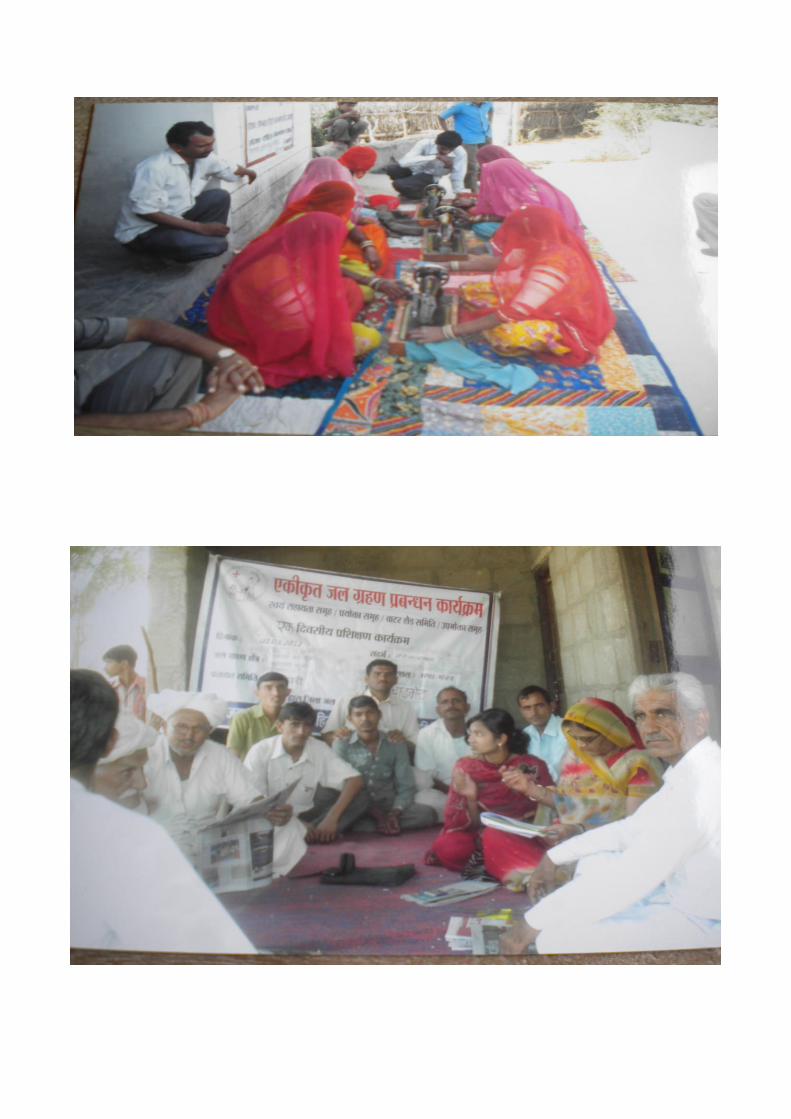
Photo : Panchayat Samiti Members one day workshop at P.S.Level
1 2 3 4 5 6
7 8
S.N
o
Name of WDT
member
M/F Age Qualificatio
n
Experience in
watershed(Yrs
)
Description of
professional
training
Role/
Function
1. Miss. Sunita F 19 Diploma in
electrical
1 year I.G.P.R.S. in
Jaipur
WDT
(Engg. )
2. Smt. Susheela F 34 MA History 1 Year
I.G.P.R.S. in
Jaipur
WDT
Social
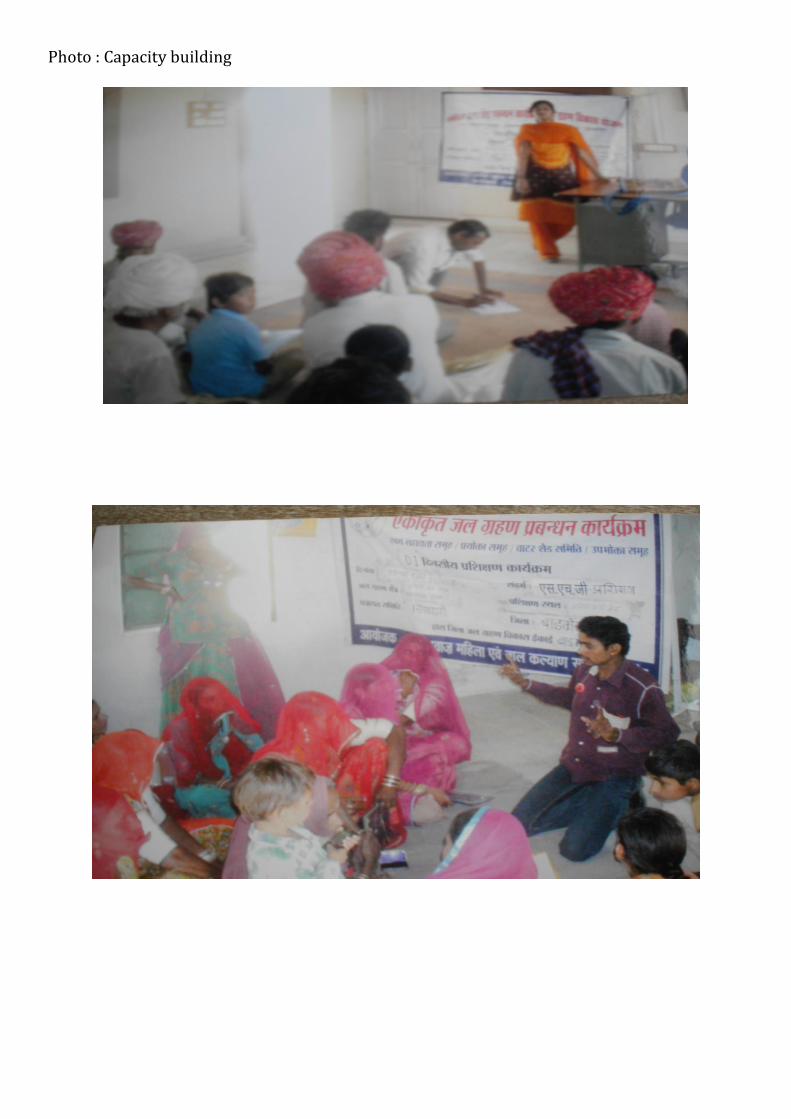
Photo : Capacity building
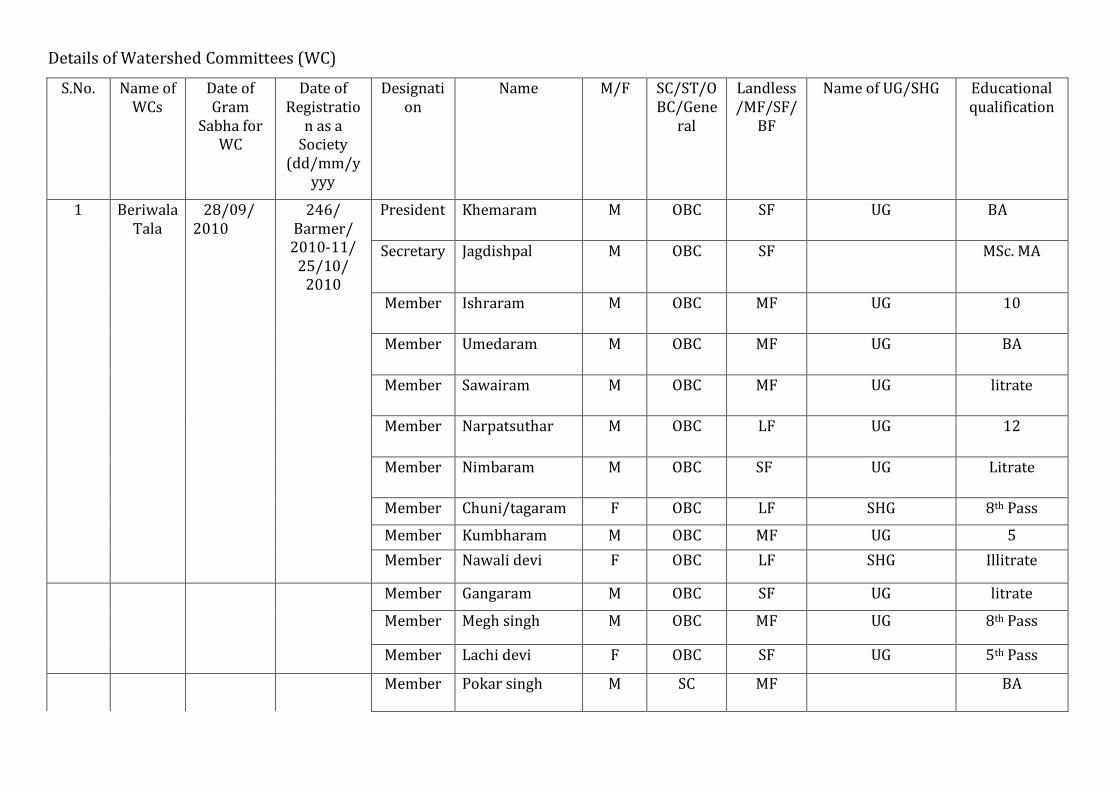
Details of Watershed Committees (WC)
S.No. Name of WCs
Date of Gram
Sabha for WC
Date of Registratio
n as a Society
(dd/mm/yyyy
Designation
Name M/F SC/ST/OBC/Gene
ral
Landless/MF/SF/
BF
Name of UG/SHG Educational qualification
1 Beriwala Tala
28/09/ 2010
246/ Barmer/ 2010-11/
25/10/ 2010
President Khemaram M OBC SF UG
BA
Secretary Jagdishpal M OBC SF MSc. MA
Member Ishraram M OBC MF UG
10
Member Umedaram M OBC MF UG
BA
Member Sawairam M OBC MF UG litrate
Member Narpatsuthar M OBC LF UG 12
Member Nimbaram M OBC SF UG
Litrate
Member Chuni/tagaram F OBC LF SHG 8th Pass
Member Kumbharam M OBC MF UG 5
Member Nawali devi F OBC LF SHG Illitrate
Member Gangaram M OBC SF UG litrate
Member Megh singh M OBC MF UG 8th Pass
Member Lachi devi F OBC SF UG 5th Pass
Member
Pokar singh M SC MF BA
CHAPTER – II
Socio economic Features, Problems and Scope
The socio economic conditions of the area can be improved
through increased production which can be achieved through expansion in cultivated area and
productivity enhancement 753 ha land is arable wasteland and 437 ha is fallow can be
brought under cultivation. Only 0 ha is irrigated and with efforts this can be increased to 30
ha. The productivity gap of major crops in the area as compared with district and with areas in
the same agro climatic zones indicate potential to increase the productivity. The
demonstration of improved package of practices, improved varieties, increased irrigation
facilities and soil conservation measures under the project can bridge this gap. Due to small
land holdings in the area focus of the project would be on diversification in agriculture
(horticulture, vegetables, Agro forestry, fodder crops)and diversification in Livelihoods
(Agriculture, Animal husbandry, self employment) 140149.575 Quintal fodder scarcity be met
out through Pasture development .Improved animal Husbandry practices can increase the
productivity of livestock. There are 967 persons migrate due to lack of job & this migration
can be checked through creation of employment opportunities in the project area through
increase in production and diversification in agriculture and Livelihoods as mentioned above.
The wind erosion is the main problem in the watershed area. Here the wind
velocity reaches upto more than 50 m/sec.As the soil of watershed area is mainly sandy
therefore soil erosion occurs mainly due to wind leadind to land degradation. Here in
watershed area due to scanty rainfall runoff is less resulting in lesser soil erosion.Agriculture
in the watershed area is totally rainfed although there are some tube wells because people use
this water for drinking purpose only.Here in watershed area animal population is fairly good
but the need of breed improvement,vaccination medicinal camps are the key works to be
loked into.The runoff of the area harvest in khet talai /Farm pond/Tanka and horticulture
plantation made to uplift income per household.People have large livestock holding but there
are problem of drinking water and fodder.To solve the drinking water existing
nadi/traditional rain water harvesting structures Tankas are to be constructed and renovated.
Also to met deficiency of fodder about 0 ha of pasture development can be done in the project
area.

Natural Resource Management : The watershed area located in western Rajasthan desert . The ground water depth is 110 meter. Ground water mostly contains florid and is saline. The water is not potable for drinking. The people has to travel 4-5 KM for drinking water. There is no run off due to desert area. . As per need and suggestions given by the beneficiaries/ public representative, the tanka , talai have been proposed to drinking water. While socially surveying the area, it was realized that various water harvesting structures mostly Tanka , talai, nadi have been constructed in the area for storing the water. But due to non availability of pucca agore the water stored in structures is minimum due to minimum run off in desert area. At the present time no new talai/ ponds have been proposed. During the rainy season it was found that the rain water from the higher areas flows down and spread in the lower area and damaging the fields. As per need and suggestions given by the beneficiaries/ public representative, the pacci nadi have been proposed to store the water. This will certainly solve the problems of the area and sufficient water will also be stored for live stock. The agriculture land of the area is affected by wind erosion. The problem can be solved by vegetation , plantation on sand dunes. Therefore to protect the land, the main thrust is given on sand dune stabilization. Agriculture and Horticulture Productivity : In the watershed area the production of Agriculture and Horticulture Plants are not to that extent due to lack of improved variety and techniques. The Agriculture production of different crops grown in Kharif/ Rabi seasons of the proposed watershed area is shown in Table 13. The production will be increased by introduction of new varieties of different crop. The existing horticulture area is shown above. Live Stock –gap of fodder Availability : The existing fodder area in the villages of proposed area is shown above. The availability of fodder in the proposed watershed area is less. To meet the requirement, the farmers of the area have to purchase from other places. The fodder area has to be increased to reduce the demand. Livelihood and Micro enterprises : The people of the area are dependent on Agriculture. In the proposed area the landless families are fully dependent on work. After introduction of NREGA, these families are getting job in the area. But it is not to the extent to increase the livelihood. For development of their livelihood, the various meetings were organized to know their interest and skills. According to social survey conducted in different villages of the project area, different individual and group works/ activities like Kasidakari , Ker-sagari Udhyog, Bhjan Mandal, Carpentry, Motor Cycle Repairing, and Compost Pit/ Vermi compost were identified. According to their interest homogeneous groups have been made. The main thrust was given for land less persons.
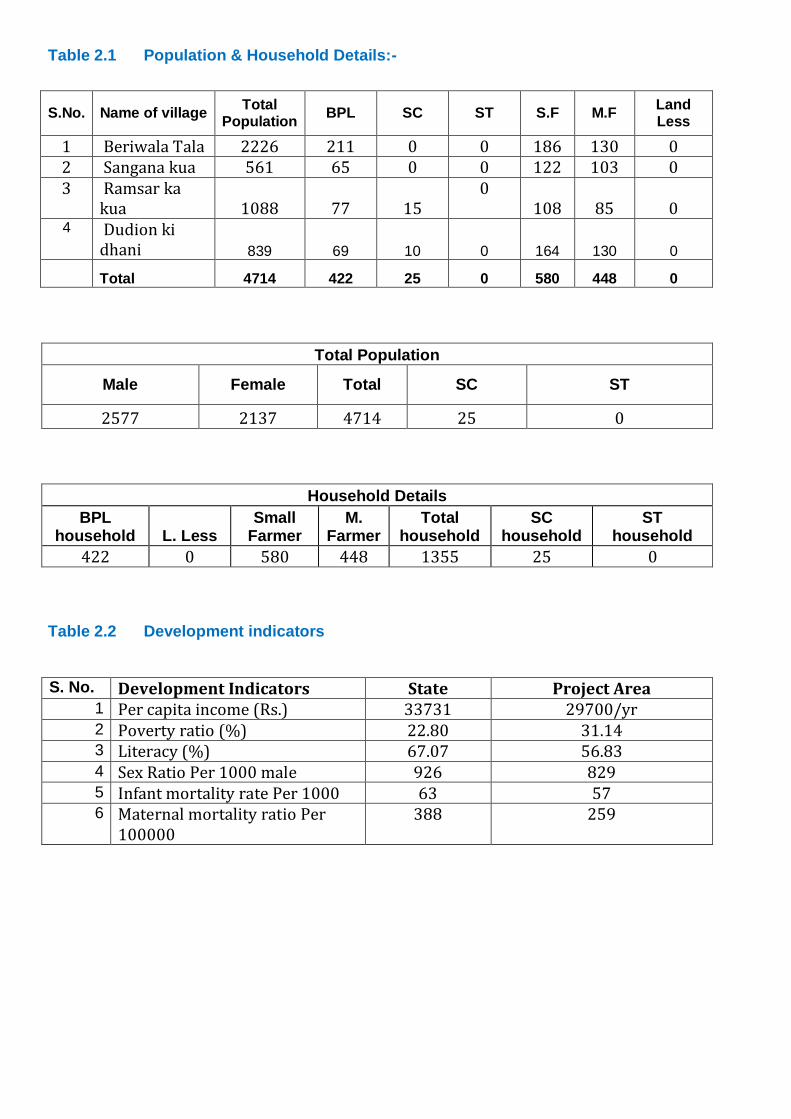
Table 2.1 Population & Household Details:-
S.No. Name of village Total
Population BPL SC ST S.F M.F
Land Less
1 Beriwala Tala 2226 211 0 0 186 130 0 2 Sangana kua 561 65 0 0 122 103 0 3 Ramsar ka
kua 1088 77 15 0
108 85 0 4 Dudion ki
dhani 839 69 10 0 164 130 0
Total 4714 422 25 0 580 448 0
Total Population
Male Female Total SC ST
2577 2137 4714 25 0
Household Details
BPL household L. Less
Small Farmer
M. Farmer
Total household
SC household
ST household
422 0 580 448 1355 25 0
Table 2.2 Development indicators
S. No. Development Indicators State Project Area 1 Per capita income (Rs.) 33731 29700/yr 2 Poverty ratio (%) 22.80 31.14 3 Literacy (%) 67.07 56.83 4 Sex Ratio Per 1000 male 926 829 5 Infant mortality rate Per 1000 63 57 6 Maternal mortality ratio Per
100000 388 259

S.no. Particular Before project After Development
I. (i) (ii)
Water Lavel in m Open Well Borwells
110
-
110
- II (i) Crop grown
area(Hac.) 3908 4500
(ii) Crop wise area & yield
Area (ha)
Yield(Qtl/ha) Area (ha) Yield(kg/ha)
Kharif
Bajra Moong Guar Moth Rabi
Jeera Isabgol
3455
70 349 34 0 0
2.55 0.75 1.72 1.45
3.60
3955 100 400 45 0 0
300 300 300 200
500
III Certified Seed (Cultivators No.)
24 600
IV Bio- Fertilizer 0 300 V Fodder Production Qtls/ Hac. Qtls/ Hac. Lucern/ Barseem
Bajra
0
5.00 VIII Horticulture :- Plants No. Plants No.
Ber Citrus Aonla Karunda
0 0 0 0
8000 100 100 100
XIVIII Agroforestry:- Plants No. Plant /hac. Plants No. Plant /hac. Arable land Pasture land
40800 600
6 4
100000 7000
20 50
XIXIVIII (i)
Animal Husbandry:- Cross Breed
Cow Buffalo
0 0
125 20
(ii)
Average milk yield/ Lts.
Lts/ Day Lts/ Day
Cow Buffalo
3.50 5.00
5.50 7.00
IX Social And Financial
(i)
Average Income/ household
29700 55000
(ii) Self help group 9 100
The table indicates poor socio economic conditions.

Table 2.3 Land Use
S.No Present land use Area in Hact.
1 Total geographical area
i Non arable land 149.00
ii Arable land 5098.00
2 Non arable land
i Forest land 0
ii Panchayat & pasture land 44.00
iii
Govt. waste land 105.00
iv
Area not available for development (Habitation, roads, mines, rails etc.
0
3 Arable land
i Irrigated 0.00
ii Un irrigated 5098.00
Total arable land
4 Land available for treatment
i Non arable land 149.00
ii Arable land 5098.00
Total 5247.00
The project area has 753 ha of cultivable wasteland . 457 ha of fallow
land (total 1190 ha) can be brought under cultivation if some irrigation source can be
provided through Construction of WHS like Khet talai, Tanka, Farm ponds etc. and also
through demonstration of rainfed varieties of crops. Construction of WHS can also increase in
area under irrigation. 56 ha area is under wastelands and can be brought under vegetative
cover, with reasonable effort. Activities like Vegetative filter strip, ,WHS (Nadi/Talab)
Afforestation of wastelands and Pasture development will be taken up on these lands.
Pasture development the land use table shows that there is no pasture
land.
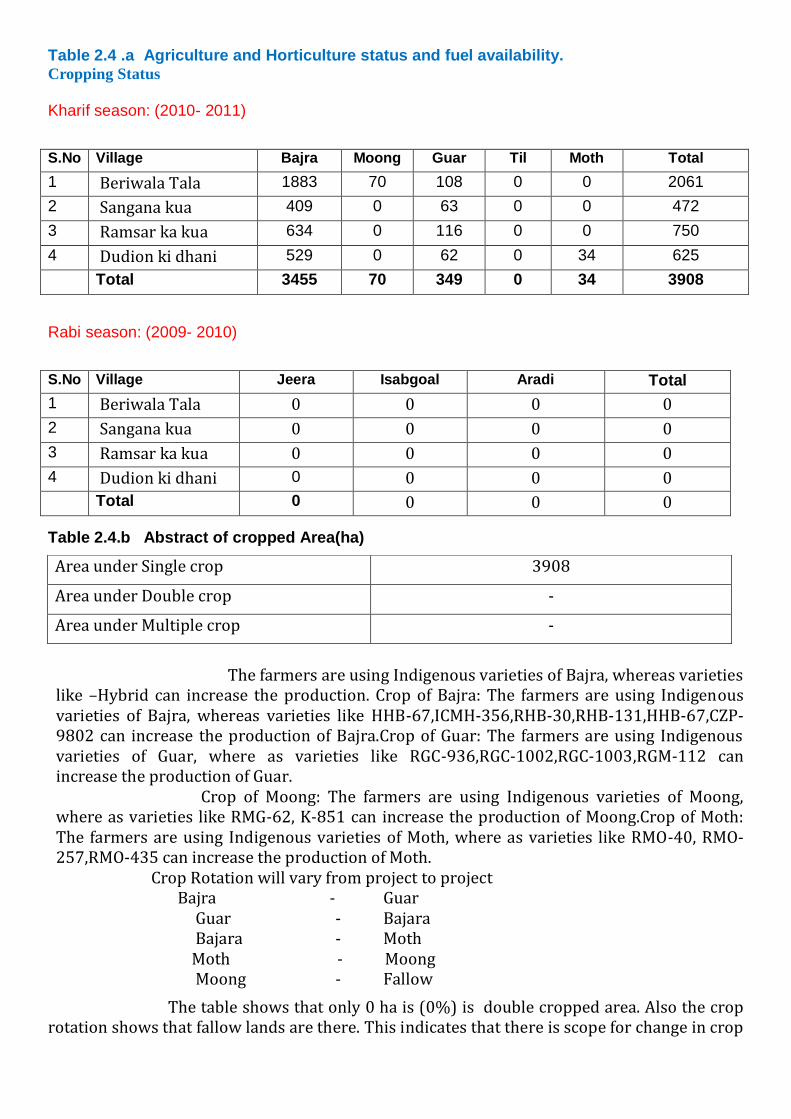
Table 2.4 .a Agriculture and Horticulture status and fuel availability. Cropping Status
Kharif season: (2010- 2011)
S.No Village Bajra Moong Guar Til Moth Total
1 Beriwala Tala 1883 70 108 0 0 2061
2 Sangana kua 409 0 63 0 0 472
3 Ramsar ka kua 634 0 116 0 0 750
4 Dudion ki dhani 529 0 62 0 34 625
Total 3455 70 349 0 34 3908
Rabi season: (2009- 2010)
S.No Village Jeera Isabgoal Aradi Total
1 Beriwala Tala 0 0 0 0
2 Sangana kua 0 0 0 0
3 Ramsar ka kua 0 0 0 0
4 Dudion ki dhani 0 0 0 0
Total 0 0 0 0
Table 2.4.b Abstract of cropped Area(ha)
The farmers are using Indigenous varieties of Bajra, whereas varieties like –Hybrid can increase the production. Crop of Bajra: The farmers are using Indigenous varieties of Bajra, whereas varieties like HHB-67,ICMH-356,RHB-30,RHB-131,HHB-67,CZP-9802 can increase the production of Bajra.Crop of Guar: The farmers are using Indigenous varieties of Guar, where as varieties like RGC-936,RGC-1002,RGC-1003,RGM-112 can increase the production of Guar. Crop of Moong: The farmers are using Indigenous varieties of Moong, where as varieties like RMG-62, K-851 can increase the production of Moong.Crop of Moth: The farmers are using Indigenous varieties of Moth, where as varieties like RMO-40, RMO-257,RMO-435 can increase the production of Moth.
Crop Rotation will vary from project to project Bajra - Guar
Guar - Bajara Bajara - Moth Moth - Moong Moong - Fallow
The table shows that only 0 ha is (0%) is double cropped area. Also the crop rotation shows that fallow lands are there. This indicates that there is scope for change in crop
Area under Single crop 3908
Area under Double crop -
Area under Multiple crop -

rotation in fields where there are fallow lands through Soil and Water conservation measures, crop demonstration and diversification in agriculture. Soil and Water conservation measures besides putting fallow lands under cultivation can change the area under single cropping to double and multiple cropping. Table 2.4.c Productivity Gap Analysis (The table can also be given in bar chart form)
Bajra 738 645 525 173 255 Moong 410 338 305 107 75 Moth 315 198 195 194 145 Guar 465 305 295 207 172
Analysis of the above table indicate that besides national gap there is wide gap in productivity within state and even within same agro climatic zones. The reasons for this variation are.The farmers are using varieties desi of Bajra moong monthwhereas the recommended varieties like Bajra-Kamdhenu, SR11(Gaveri) Moth- RMO40 ,RMO256 Moong-RMG268,SML268,IPM02-3, Guar-KS277,HFG119,HFG156 etc. Lack of Availability of good quality seeds of desired crop and variety in adequate quantities and time to the farmers. 267341 cum runoff/water availability for cultivation. The productivity gap and reasons of it indicate potential to increase the productivity through crop demonstration .Crop demonstrations would be carried out on improved crops/ varieties, improved agronomic practices. INM, IPM, Mixed cropping, distribution of fodder seed mini kit. Demonstration of improved methods and economics of fodder crops cultivation and also distribution foundation seeds of Forage Crops for further multiplication, introduction of fodder crops in the existing crop rotations. Table 2.5 Existing area under horticulture/Vegetables/Floriculture (ha)
Activity Area Species Varieties Recommended varieties Production
Horticulture NIL NIL NIL NIL NIL
Vegetables NIL NIL NIL NIL NIL
Floriculture NIL NIL NIL NIL NIL
Medicinal Plants NIL NIL NIL NIL NIL
Name of the crop
Productivity kg/ha
India Highest Average
in Rajasthan
Highest Average of Agro climatic zone District Project Area
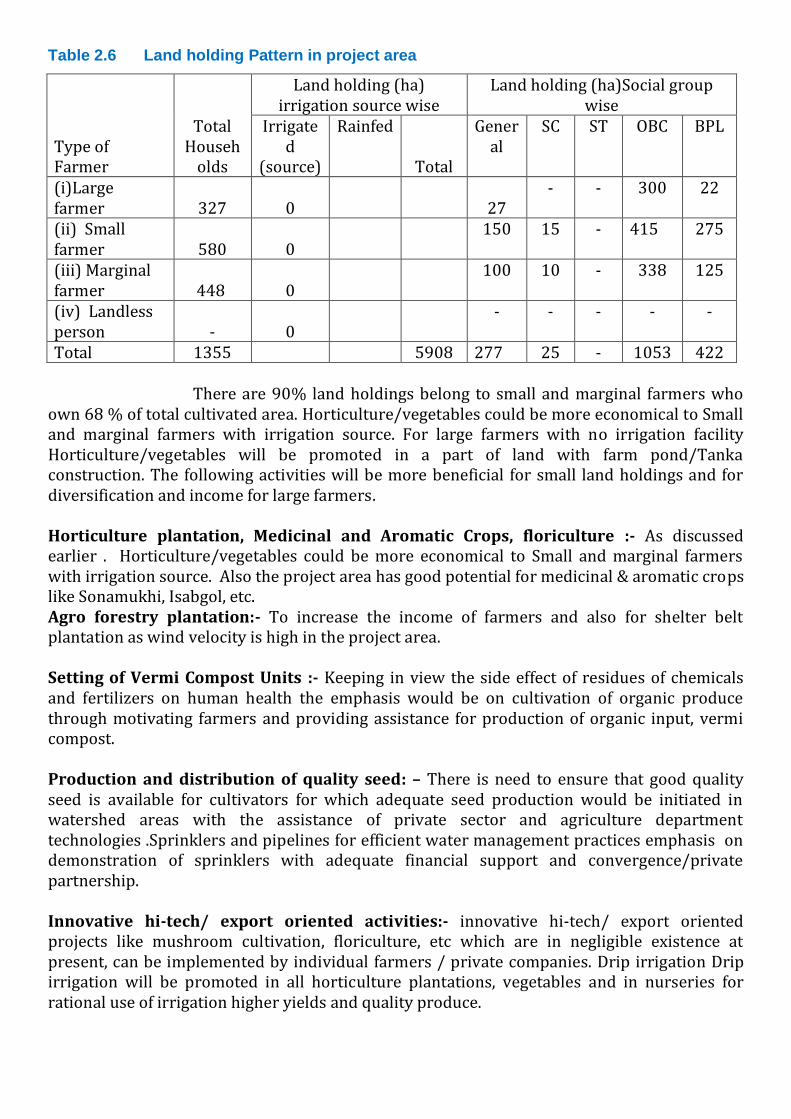
Table 2.6 Land holding Pattern in project area
Type of Farmer
Total Househ
olds
Land holding (ha) irrigation source wise
Land holding (ha)Social group wise
Irrigated
(source)
Rainfed
Total
General
SC ST OBC BPL
(i)Large farmer 327 0 27
- - 300 22
(ii) Small farmer 580 0
150 15 - 415 275
(iii) Marginal farmer 448 0
100 10 - 338 125
(iv) Landless person - 0
- - - - -
Total 1355 5908 277 25 - 1053 422 There are 90% land holdings belong to small and marginal farmers who own 68 % of total cultivated area. Horticulture/vegetables could be more economical to Small and marginal farmers with irrigation source. For large farmers with no irrigation facility Horticulture/vegetables will be promoted in a part of land with farm pond/Tanka construction. The following activities will be more beneficial for small land holdings and for diversification and income for large farmers. Horticulture plantation, Medicinal and Aromatic Crops, floriculture :- As discussed earlier . Horticulture/vegetables could be more economical to Small and marginal farmers with irrigation source. Also the project area has good potential for medicinal & aromatic crops like Sonamukhi, Isabgol, etc. Agro forestry plantation:- To increase the income of farmers and also for shelter belt plantation as wind velocity is high in the project area. Setting of Vermi Compost Units :- Keeping in view the side effect of residues of chemicals and fertilizers on human health the emphasis would be on cultivation of organic produce through motivating farmers and providing assistance for production of organic input, vermi compost. Production and distribution of quality seed: – There is need to ensure that good quality seed is available for cultivators for which adequate seed production would be initiated in watershed areas with the assistance of private sector and agriculture department technologies .Sprinklers and pipelines for efficient water management practices emphasis on demonstration of sprinklers with adequate financial support and convergence/private partnership. Innovative hi-tech/ export oriented activities:- innovative hi-tech/ export oriented projects like mushroom cultivation, floriculture, etc which are in negligible existence at present, can be implemented by individual farmers / private companies. Drip irrigation Drip irrigation will be promoted in all horticulture plantations, vegetables and in nurseries for rational use of irrigation higher yields and quality produce.
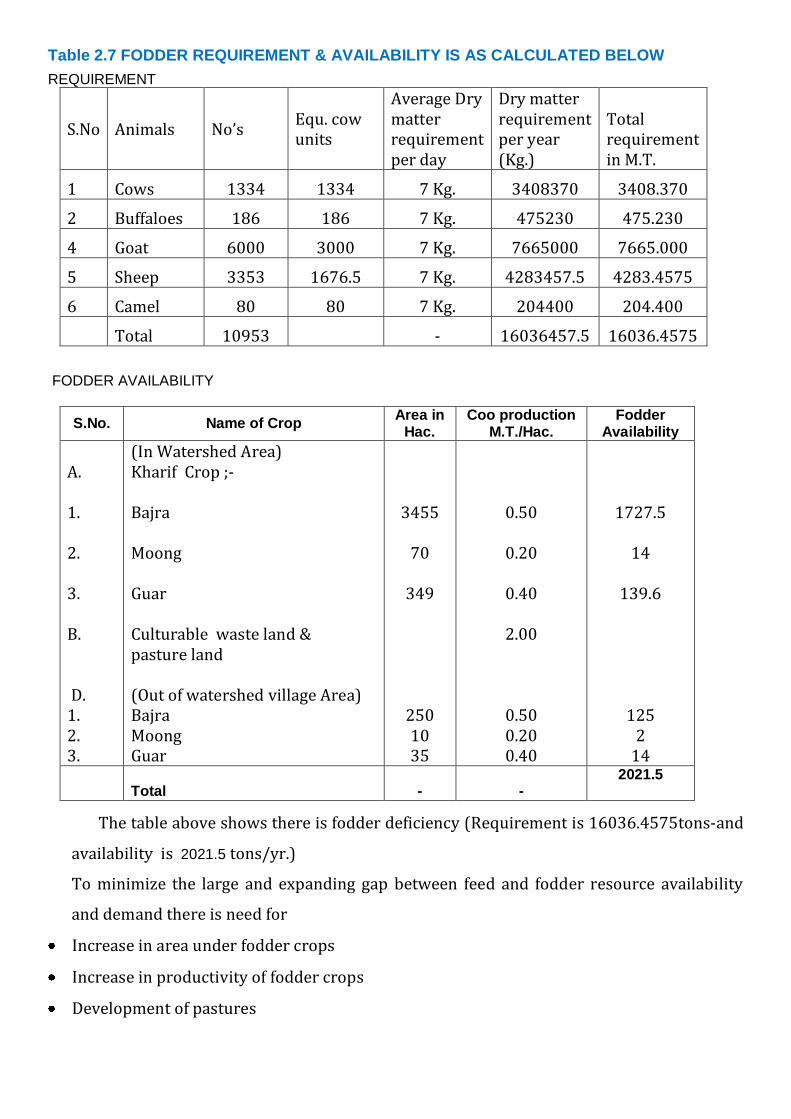
Table 2.7 FODDER REQUIREMENT & AVAILABILITY IS AS CALCULATED BELOW
REQUIREMENT
S.No Animals No’s Equ. cow units
Average Dry matter requirement per day
Dry matter requirement per year (Kg.)
Total requirement in M.T.
1 Cows 1334 1334 7 Kg. 3408370 3408.370
2 Buffaloes 186 186 7 Kg. 475230 475.230
4 Goat 6000 3000 7 Kg. 7665000 7665.000
5 Sheep 3353 1676.5 7 Kg. 4283457.5 4283.4575
6 Camel 80 80 7 Kg. 204400 204.400
Total 10953 - 16036457.5 16036.4575
FODDER AVAILABILITY
S.No. Name of Crop Area in
Hac. Coo production
M.T./Hac. Fodder
Availability
A. 1. 2. 3. B. D. 1. 2. 3.
(In Watershed Area) Kharif Crop ;- Bajra Moong Guar Culturable waste land & pasture land (Out of watershed village Area) Bajra Moong Guar
3455
70
349
250 10 35
0.50
0.20
0.40
2.00
0.50 0.20 0.40
1727.5
14
139.6
125 2
14
Total -
-
2021.5
The table above shows there is fodder deficiency (Requirement is 16036.4575tons-and
availability is 2021.5 tons/yr.)
To minimize the large and expanding gap between feed and fodder resource availability
and demand there is need for
Increase in area under fodder crops
Increase in productivity of fodder crops
Development of pastures

And reduction in large number of livestock production through replacement by few but
productive animals
Table 2.9 Agriculture implements
Farm mechanization and seed banks: - As discussed earlier 90% land holdings belong to
small and marginal farmers who own only 68 % of total cultivated area so owning of big
farm implements by individual farmers is not economical so SHG would be promoted to
buy farm implements and rent to farmer.
Table 2.10 NREGA Status - No. of Card Holder, activities taken so far, employment
status.
S.No
Name of
village
No. of
Card
Holders
Employment
Activity taken so far
1
Beriwala Tala
602 590 1.Excavation of Talab / Nadi 2.Constraction of Gravel Road 3.Constraction of Tanka
2 Sangana kua
171 165 1.Excavation of Talab / Nadi 2.Constraction of Gravel Road 3. Constraction of Tanka
3
Ramsar ka kua
310 300 1.Excavation of Talab / Nadi 2.Constraction of Gravel Road 3. Constraction of Tanka
4 Dudion ki dhani 272 265
1.Excavation of Talab / Nadi 2.Constraction of Gravel Road 3. Constraction of Tanka -
Total 1355 1320
S. No Implements Nos.
1 Tractor 22
2 Sprayers-manual/ power 0
3 Cultivators/Harrows 22
4 Seed drill 4
5 Any Other 0

Table 2.11 Migration Details
Name of village
No. of persons migrating
No. of days per year of migration
Major reason(s) for migrating
Distance of destination of migration from the village (km)
Occupation during migration
Income from such occupation (Rs. in lakh)
Beriwala Tala
416 200 Scarcity of labour&fodder
300 Labour 0.50
Sangana kua 115 200 Scarcity of labour&fodder
300 Labour 0.50
Ramsar ka kua
250 200 Scarcity of labour&fodder
300 Labour 0.50
Dudion ki dhani
186 200 Scarcity of labour&fodder
300 Labour 0.50
The migration can be check by creation of employment opportunities, enhancing farm level economy, increases the income of the people engaged in animal husbandry by dairy, poultry and marketing and value addition. (As discussed earlier) and diversification in livelihoods .
The existing livelihoods village are given below
Table 2.12 (a)Major activities (On Farm)
Name of activity No of House holds Average annual income from the
Shop 0 0 Goat /sheep rearing 245 5000 Sangari 55 2000
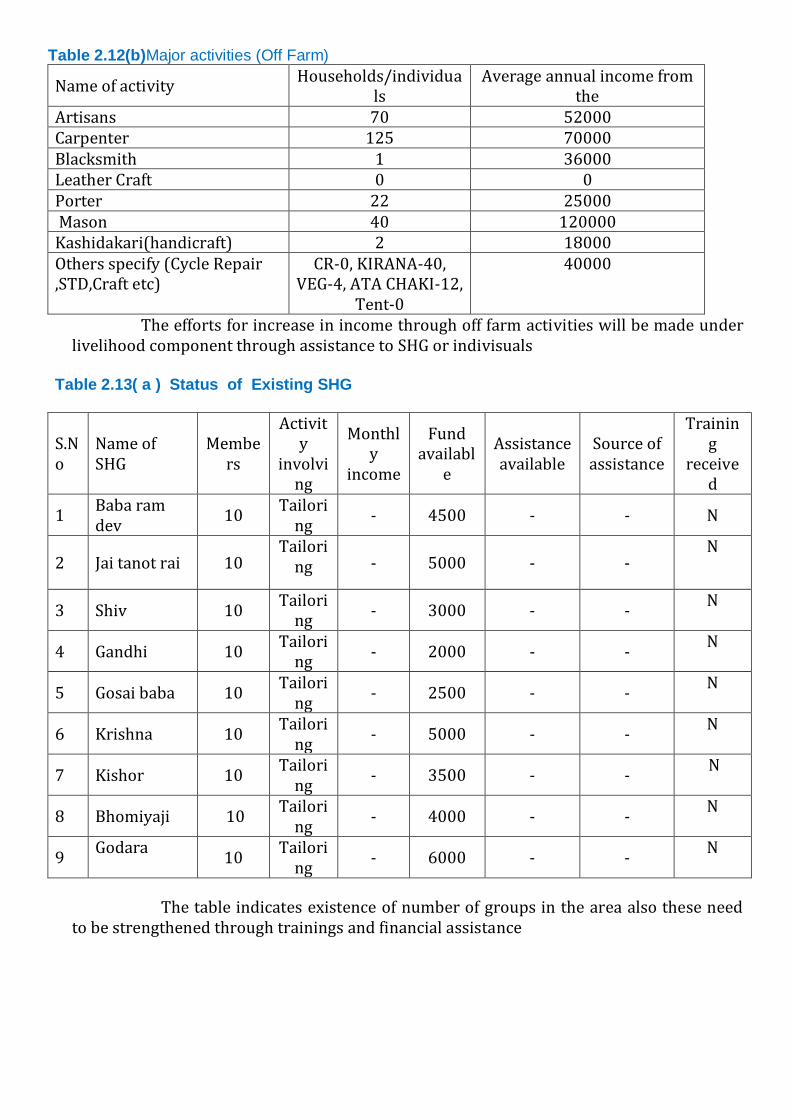
Table 2.12(b)Major activities (Off Farm)
Name of activity Households/individua
ls Average annual income from
the Artisans 70 52000 Carpenter 125 70000 Blacksmith 1 36000 Leather Craft 0 0 Porter 22 25000 Mason 40 120000 Kashidakari(handicraft) 2 18000 Others specify (Cycle Repair ,STD,Craft etc)
CR-0, KIRANA-40, VEG-4, ATA CHAKI-12,
Tent-0
40000
The efforts for increase in income through off farm activities will be made under livelihood component through assistance to SHG or indivisuals
Table 2.13( a ) Status of Existing SHG
S.No
Name of SHG
Members
Activity
involving
Monthly
income
Fund availabl
e
Assistance available
Source of assistance
Training
received
1 Baba ram dev
10 Tailori
ng - 4500 - - N
2 Jai tanot rai 10 Tailori
ng - 5000 - - N
3 Shiv 10 Tailori
ng - 3000 - -
N
4 Gandhi 10 Tailori
ng - 2000 - -
N
5 Gosai baba 10 Tailori
ng - 2500 - -
N
6 Krishna 10 Tailori
ng - 5000 - -
N
7 Kishor 10 Tailori
ng - 3500 - -
N
8 Bhomiyaji 10 Tailori
ng - 4000 - -
N
9 Godara
10 Tailori
ng - 6000 - -
N
The table indicates existence of number of groups in the area also these need to be strengthened through trainings and financial assistance
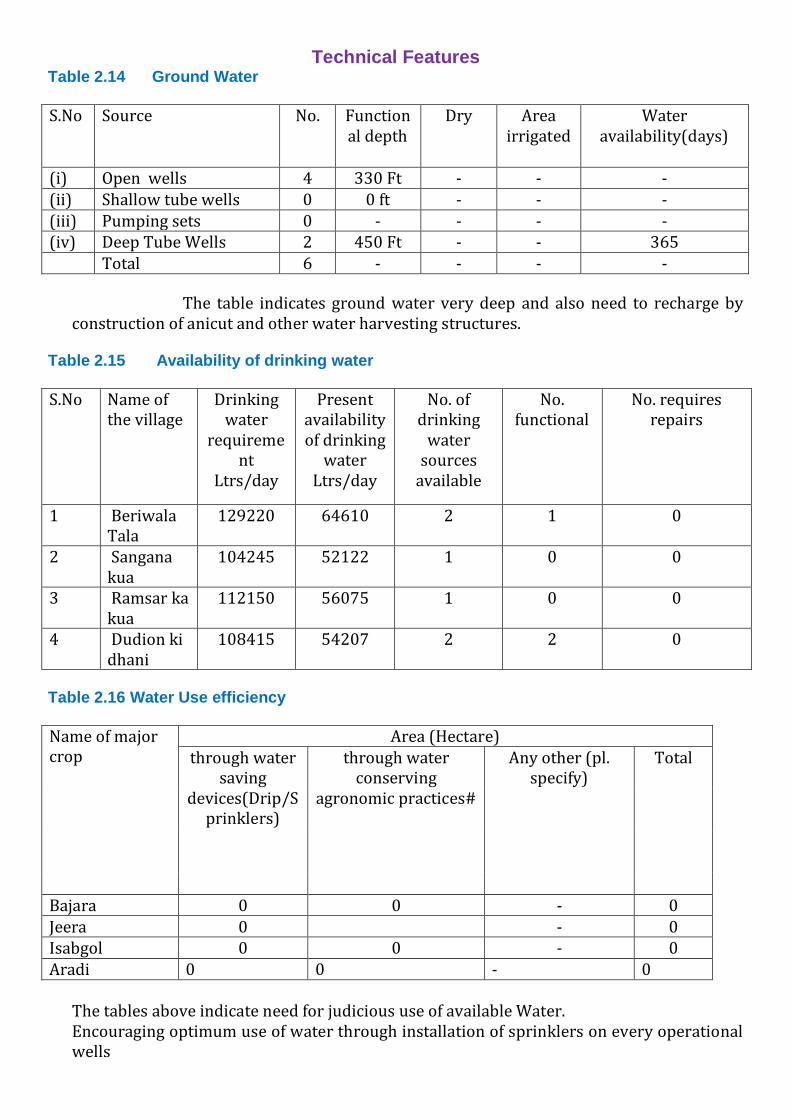
Technical Features
Table 2.14 Ground Water
S.No Source No. Functional depth
Dry Area irrigated
Water availability(days)
(i) Open wells 4 330 Ft - - - (ii) Shallow tube wells 0 0 ft - - - (iii) Pumping sets 0 - - - - (iv) Deep Tube Wells 2 450 Ft - - 365 Total 6 - - - -
The table indicates ground water very deep and also need to recharge by construction of anicut and other water harvesting structures.
Table 2.15 Availability of drinking water
S.No Name of the village
Drinking water
requirement
Ltrs/day
Present availability of drinking
water Ltrs/day
No. of drinking
water sources
available
No. functional
No. requires repairs
1 Beriwala Tala
129220 64610 2 1 0
2 Sangana kua
104245 52122 1 0 0
3 Ramsar ka kua
112150 56075 1 0 0
4 Dudion ki dhani
108415 54207 2 2 0
Table 2.16 Water Use efficiency
Name of major crop
Area (Hectare) through water
saving devices(Drip/S
prinklers)
through water conserving
agronomic practices#
Any other (pl. specify)
Total
Bajara 0 0 - 0 Jeera 0 - 0 Isabgol 0 0 - 0 Aradi 0 0 - 0
The tables above indicate need for judicious use of available Water. Encouraging optimum use of water through installation of sprinklers on every operational wells
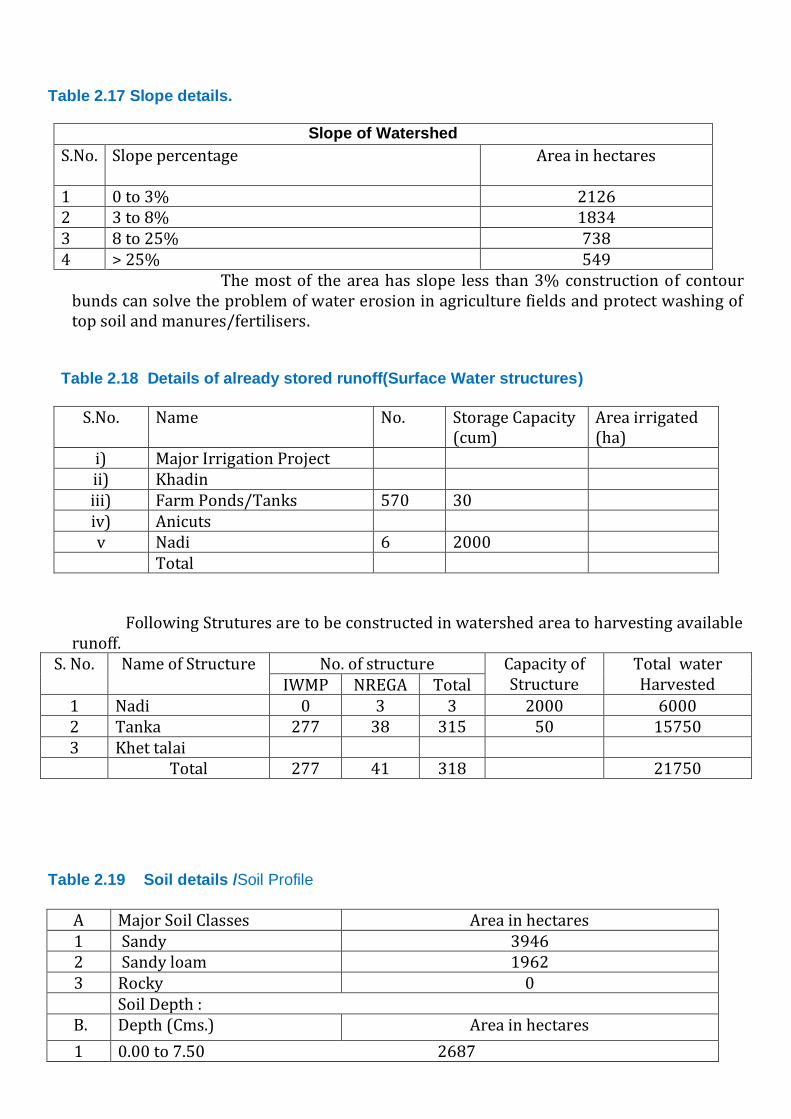
Table 2.17 Slope details.
Slope of Watershed
S.No. Slope percentage
Area in hectares
1 0 to 3% 2126 2 3 to 8% 1834 3 8 to 25% 738 4 > 25% 549
The most of the area has slope less than 3% construction of contour bunds can solve the problem of water erosion in agriculture fields and protect washing of top soil and manures/fertilisers.
Table 2.18 Details of already stored runoff(Surface Water structures)
S.No. Name No. Storage Capacity (cum)
Area irrigated (ha)
i) Major Irrigation Project ii) Khadin iii) Farm Ponds/Tanks 570 30 iv) Anicuts v Nadi 6 2000 Total
Following Strutures are to be constructed in watershed area to harvesting available runoff.
S. No. Name of Structure No. of structure Capacity of Structure
Total water Harvested IWMP NREGA Total
1 Nadi 0 3 3 2000 6000 2 Tanka 277 38 315 50 15750 3 Khet talai Total 277 41 318 21750
Table 2.19 Soil details /Soil Profile
A Major Soil Classes Area in hectares 1 Sandy 3946 2 Sandy loam 1962 3 Rocky 0 Soil Depth :
B. Depth (Cms.) Area in hectares
1 0.00 to 7.50 2687
2 7.50 to 45.00 2139 3 > 45.00 421 C Soil fertility Status Kg/ha Recommended N 60 120 P 12 80 K 1.50 40 Micronutrients PPM
The analysis of table shows need to improve and maintain soil fertility. Soil health card to every farmer every crop season will be proVIIIded, which will include the recommendation for Application micro nutrient and fertilizers
Table 2.20 Erosion details
Erosion status in project Area
Cause Type of erosion
Area affected
(ha)
Run off(mm/
year) Average soil loss
(Tonnes/ ha/ year) Water erosion
A Sheet 0 B Rill 0 C Gully 0 Sub-Total
Wind erosion 5247 5.60 Total for project
The need is: To check land degradation To reduce excessive biotic pressure by containing the number and increase of livestock To check cultivation on sloping lands without adequate precautions of soil and water conservation measures To discourage cultivation along susceptible nallah beds To check Faulty agriculture techniques To check Uncontrolled grazing and developed cattle tracks To check Deforestation of steep slopes To check erosive velocity of runoff, store Runoff, to arrest silt carried by runoff and to recharge Ground Water structures life Earthen check dams, gully plugs, Bank Stabilisation, Loose stone check Dams, Gabions, Earthen embankment (Nadi) and Anicuts would be taken up.

CHAPTER - III
Proposed Development Plan
The Activities are indicative addition /deletion in activities will be as per local conditions
A) Preparatory phase activities Capacity Building Trainings and EPA
The IEC activities like Group meetings, door to door campaign, slogans and wall writings etc. were carried out in all the habitations of Barmer-IX Micro Watershed. A series of meetings were conducted with GP members, community and discussed about the implementation of IWMP programme. User groups were also formed. Grama Sabhas were conducted for approval of EPA (Village), for selecting the watershed committee and approval of DPR.
S.no Name of the Gram Panchayat Date on which Grama
Sabha approved EPA
1 Beriwala Tala 28.09.2010
1 4 5 6 7 8 9 10 11
S. No.
Names of village
Amount earmarked
for EPA
Entry Point Activities planned
Estimated cost
Expendi-ture
incurred Balance
Expected outcome
Actual outcome
1 Beriwala Tala
14.094 Lacs
Tanka on common
place
1.27 lacs 14.094 Lacs
- Drinking water for
110 Family
Drinking water for
110 Family 2 Sangana
kua 4.104 Lacs Tanka on
common place
1.27 lacs 4.104 Lacs
- Drinking water for 50 Family
Drinking water for 50 Family
3 Ramsar ka kua
6.966 Lacs Renovation of Tanka, & solar lights
1.27 lacs 6.966 Lacs
- Drinking water for 50 Family
Drinking water for 50 Family
4 Dudion ki dhani
6.318 Lacs Tanka on common
place
1.27 lacs 6.318 Lacs
- Drinking water for 60 Family
Drinking water for 60 Family
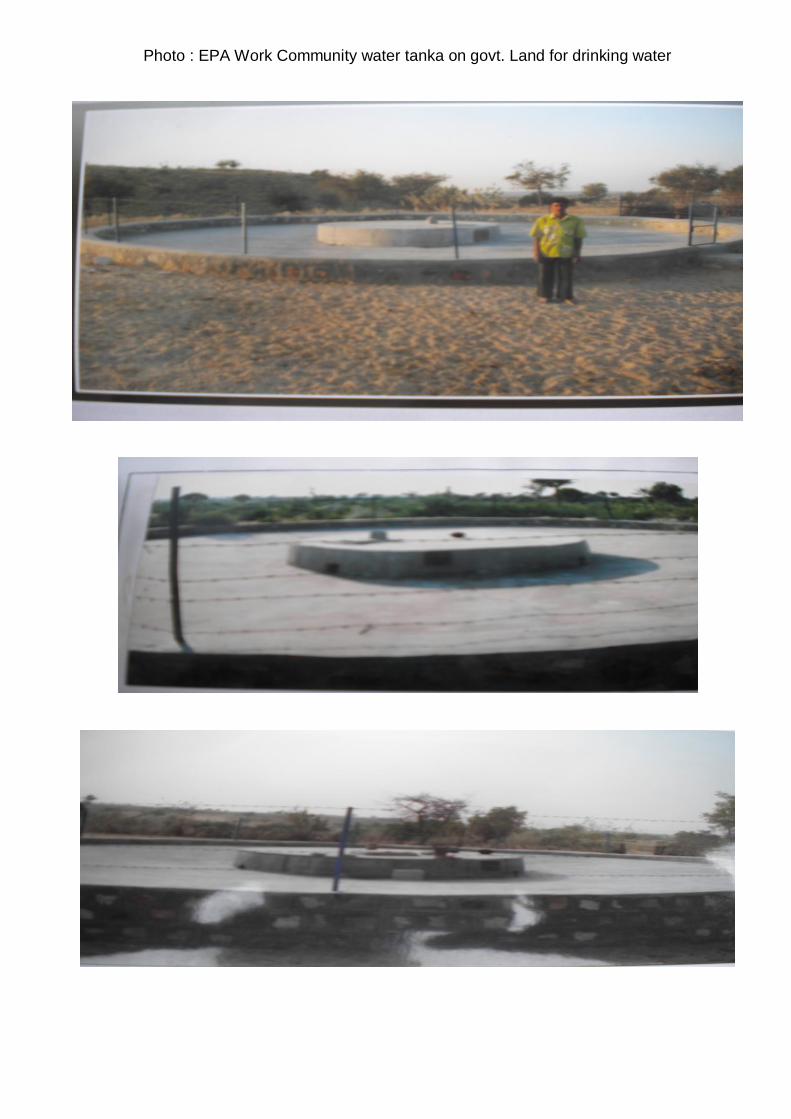
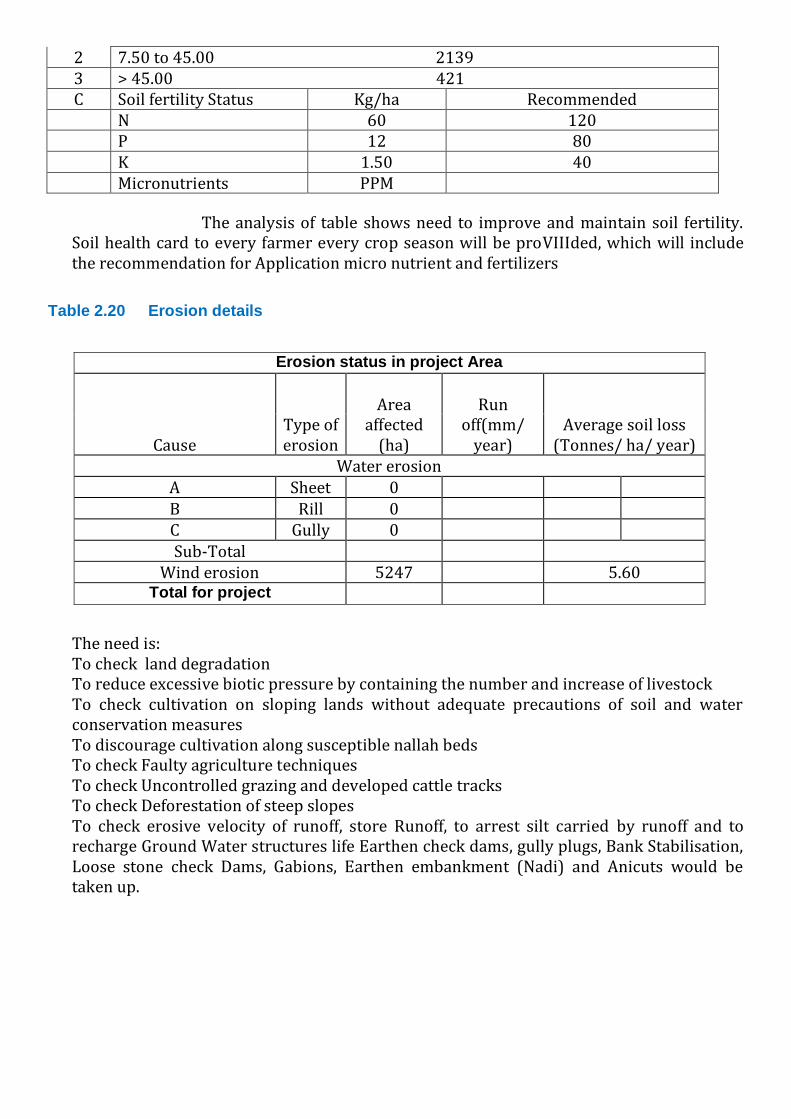
Photo : EPA Work Community water tanka on govt. Land for drinking water
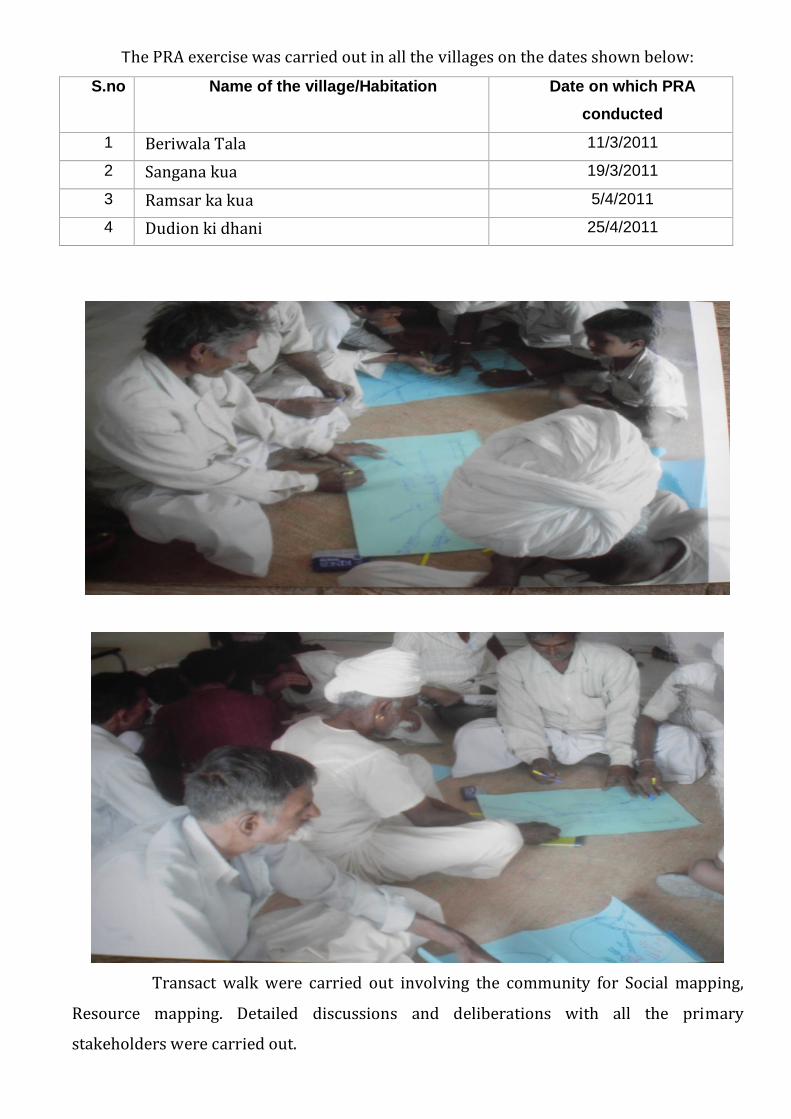
The PRA exercise was carried out in all the villages on the dates shown below:
S.no Name of the village/Habitation Date on which PRA
conducted
1 Beriwala Tala 11/3/2011
2 Sangana kua 19/3/2011
3 Ramsar ka kua 5/4/2011
4 Dudion ki dhani 25/4/2011
Transact walk were carried out involving the community for Social mapping,
Resource mapping. Detailed discussions and deliberations with all the primary
stakeholders were carried out.
Socio-economic survey was carried out during 7/3/2011 to 5/5/2011 (dates)
period covering all the households and primary data on demography, Land holdings,
Employment status, Community activities etc. was collected as mentioned in chapter 2.
State remote sensing department was assigned the work of preparing various
thematic layers using Cartosat-1 and LISS-3 imageries for Creation, development and
management of geo-spatial database depicting present conditions of land (terrain), water
and vegetation with respect to watershed under different ownerships at village level
Various thematic layers provided by SRSAC are :
Digitised Khasara maps of the villages falling in project area.
Existing water bodies, falling in the project area.
Base maps (transport network, village/boundaries, and settlements).
Land Use / Land cover map.
Based on GIS thematic layers, Field visits , PRA and analysis of benchmark data (as
discussed in chapter 2) final Treatment plan on revenue map for implementation has been
framed. Thus each intervention identified has been marked on revenue map (map enclosed
in DPR as annexure.The GIS based intervention map,PRA based intervention map are
annexed.
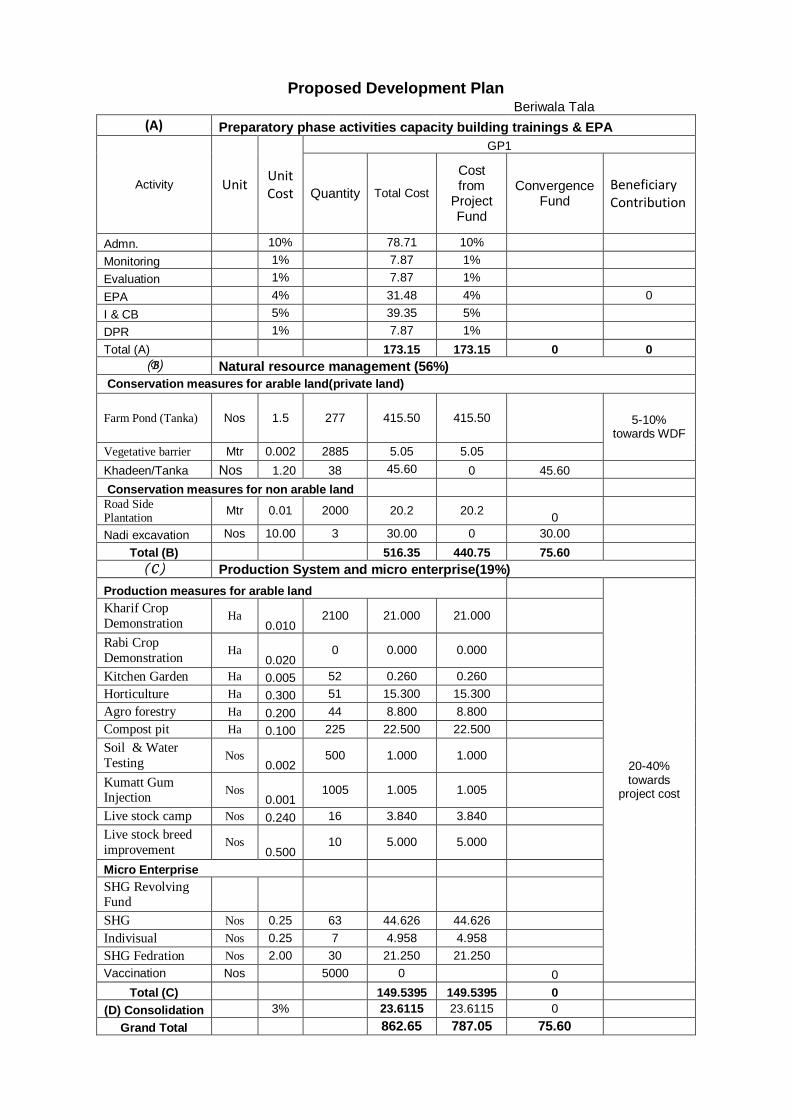
Proposed Development Plan
Beriwala Tala
(A) Preparatory phase activities capacity building trainings & EPA
Activity Unit Unit Cost
GP1
Quantity Total Cost
Cost from
Project Fund
Convergence Fund
Beneficiary Contribution
Admn. 10% 78.71 10%
Monitoring 1% 7.87 1%
Evaluation 1% 7.87 1%
EPA 4% 31.48 4% 0
I & CB 5% 39.35 5%
DPR 1% 7.87 1%
Total (A) 173.15 173.15 0 0
(B) Natural resource management (56%)
Conservation measures for arable land(private land)
Farm Pond (Tanka) Nos 1.5 277 415.50 415.50
5-10%
towards WDF
Vegetative barrier Mtr 0.002 2885 5.05 5.05
Khadeen/Tanka Nos 1.20 38 45.60 0 45.60
Conservation measures for non arable land
Road Side Plantation
Mtr 0.01 2000 20.2 20.2 0
Nadi excavation Nos 10.00 3 30.00 0 30.00
Total (B) 516.35 440.75 75.60
( C ) Production System and micro enterprise(19%)
Production measures for arable land
20-40% towards
project cost
Kharif Crop
Demonstration Ha
0.010 2100 21.000 21.000
Rabi Crop
Demonstration Ha
0.020 0 0.000 0.000
Kitchen Garden Ha 0.005 52 0.260 0.260
Horticulture Ha 0.300 51 15.300 15.300
Agro forestry Ha 0.200 44 8.800 8.800
Compost pit Ha 0.100 225 22.500 22.500
Soil & Water
Testing Nos
0.002 500 1.000 1.000
Kumatt Gum Injection
Nos 0.001
1005 1.005 1.005
Live stock camp Nos 0.240 16 3.840 3.840
Live stock breed
improvement Nos
0.500 10 5.000 5.000
Micro Enterprise
SHG Revolving Fund
SHG Nos 0.25 63 44.626 44.626
Indivisual Nos 0.25 7 4.958 4.958
SHG Fedration Nos 2.00 30 21.250 21.250
Vaccination Nos 5000 0 0
Total (C) 149.5395 149.5395 0
(D) Consolidation 3% 23.6115 23.6115 0
Grand Total 862.65 787.05 75.60
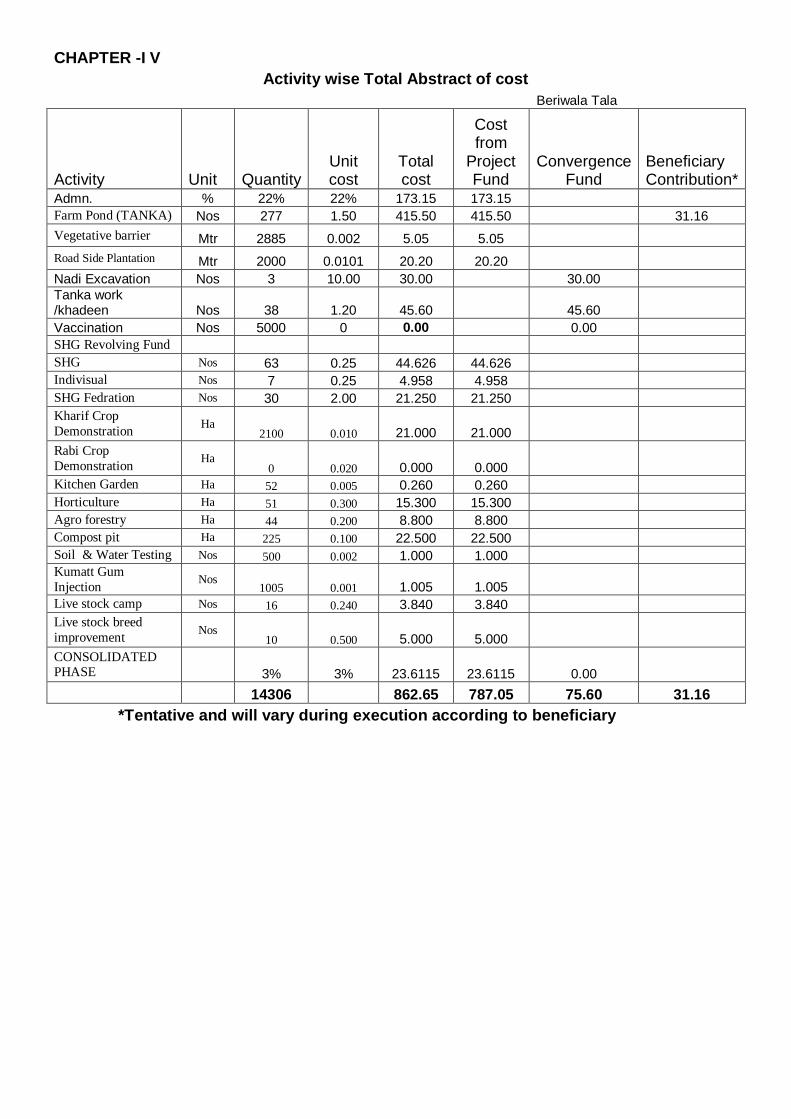
CHAPTER -I V Activity wise Total Abstract of cost
Beriwala Tala
Activity Unit Quantity Unit cost
Total cost
Cost from
Project Fund
Convergence Fund
Beneficiary Contribution*
Admn. % 22% 22% 173.15 173.15
Farm Pond (TANKA) Nos 277 1.50 415.50 415.50 31.16
Vegetative barrier Mtr 2885 0.002 5.05 5.05
Road Side Plantation Mtr 2000 0.0101 20.20 20.20
Nadi Excavation Nos 3 10.00 30.00 30.00
Tanka work /khadeen Nos 38 1.20 45.60 45.60
Vaccination Nos 5000 0 0.00 0.00
SHG Revolving Fund
SHG Nos 63 0.25 44.626 44.626
Indivisual Nos 7 0.25 4.958 4.958
SHG Fedration Nos 30 2.00 21.250 21.250
Kharif Crop
Demonstration Ha
2100 0.010 21.000 21.000
Rabi Crop
Demonstration Ha
0 0.020 0.000 0.000
Kitchen Garden Ha 52 0.005 0.260 0.260
Horticulture Ha 51 0.300 15.300 15.300
Agro forestry Ha 44 0.200 8.800 8.800
Compost pit Ha 225 0.100 22.500 22.500
Soil & Water Testing Nos 500 0.002 1.000 1.000 Kumatt Gum
Injection Nos
1005 0.001 1.005 1.005
Live stock camp Nos 16 0.240 3.840 3.840
Live stock breed
improvement Nos
10 0.500 5.000 5.000
CONSOLIDATED PHASE 3% 3% 23.6115 23.6115 0.00
14306 862.65 787.05 75.60 31.16
*Tentative and will vary during execution according to beneficiary

CHAPTER-V
Name of the W. C.
Beriwala Tala Macro/Micro
- Geographical Area
5247 Ha
G.P.
Beriwala Tala Scheme
IWMP Effective
Area
5247 Ha
Block
Sindhari
Date of Sanction
11.11.10 Total Arable land
5000 Ha
District.
BARMER Date of Appoval of
the work plan
1. Irrigated
0 Ha
Village Covered
4 NO.
2. Unirrigated
5000 Ha
Project outlay
787.05 LAC No. of SHG's formed 9
Total Nonarable
land
247 Ha
Total Area
5247 Hactare No. of UG's formed 7
1. Pasture
0 Ha
No. of WC's
formed
1
2. Govt. / waste /OTHER LAND
247 Ha
YEARWISE WORK PLAN OF WATERSHED COMMITTEE BERIWALA TALA BARMER-22
S.
N. NAME OF ACTIVITY Unit QTY.
Unit
cost AMOUNT
2010-11 2011-12 2012-13 2013-14 2014-15
TOTAL
FIRST YEAR
SECOND
YEAR THIRD YEAR FOURTH YEAR FIFTH YEAR
PHY FIN PHY FIN PHY FIN PHY FIN PHY FIN PHY FIN
I. Administration 10% 78.705 15.74 15.741 15.741 15.741 15.741 10% 78.705
II Monitoring 1% 7.871 1.574 1.574 1.574 1.574 1.574 1% 7.871
III Evaluation 1% 7.871 3.935 3.935 1% 7.871
IV Entry point activity 4% 31.482 28 31.482 4% 31.482
V Inst. & Capacity Building 5% 39.353 3.935 13.773 11.806 9.838 5% 39.353
VI DPR Preparation 1% 7.871 1 4.722 1 3.148 1% 7.871
TOTAL (A) 173.151 25.973 65.719 29.121 31.088 21.250 173.151
W/S WORK PHASE
VII NRM 56% 440.748
1
Conservation measures
for areable land
(private land)
(i) Farm Pond (Tanka) Nos 277 150000 415.50 0 0.000 0 0.000 35 51.938 139 207.750 104 155.813 277 415.500
(ii) Vegetative barrier Mtr 2885 175 5.048 0 0.000 0 0.000 361 0.631 1442 2.524 1082 1.893 2885 5.048
2 Conservation measures
for non areable land
(i) Road Side Plantation Mtr 2000 1010 20.200 0 0.000 2000 12.960 2.520 2.460 2.260 2000 20.200
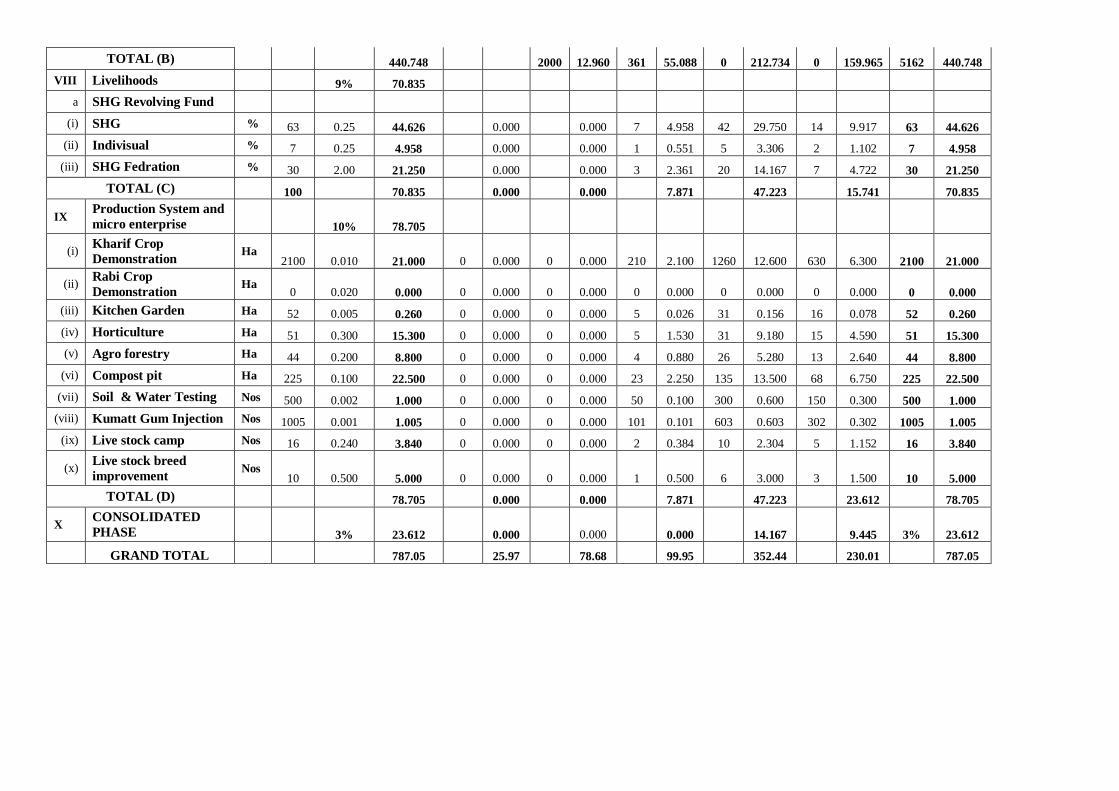
TOTAL (B) 440.748 2000 12.960 361 55.088 0 212.734 0 159.965 5162 440.748
VIII Livelihoods 9% 70.835
a SHG Revolving Fund
(i) SHG % 63 0.25 44.626 0.000 0.000 7 4.958 42 29.750 14 9.917 63 44.626
(ii) Indivisual % 7 0.25 4.958 0.000 0.000 1 0.551 5 3.306 2 1.102 7 4.958
(iii) SHG Fedration % 30 2.00 21.250 0.000 0.000 3 2.361 20 14.167 7 4.722 30 21.250
TOTAL (C) 100 70.835 0.000 0.000 7.871 47.223 15.741 70.835
IX Production System and
micro enterprise
10% 78.705
(i) Kharif Crop
Demonstration Ha
2100 0.010 21.000 0 0.000 0 0.000 210 2.100 1260 12.600 630 6.300 2100 21.000
(ii) Rabi Crop
Demonstration Ha
0 0.020 0.000 0 0.000 0 0.000 0 0.000 0 0.000 0 0.000 0 0.000
(iii) Kitchen Garden Ha 52 0.005 0.260 0 0.000 0 0.000 5 0.026 31 0.156 16 0.078 52 0.260
(iv) Horticulture Ha 51 0.300 15.300 0 0.000 0 0.000 5 1.530 31 9.180 15 4.590 51 15.300
(v) Agro forestry Ha 44 0.200 8.800 0 0.000 0 0.000 4 0.880 26 5.280 13 2.640 44 8.800
(vi) Compost pit Ha 225 0.100 22.500 0 0.000 0 0.000 23 2.250 135 13.500 68 6.750 225 22.500
(vii) Soil & Water Testing Nos 500 0.002 1.000 0 0.000 0 0.000 50 0.100 300 0.600 150 0.300 500 1.000
(viii) Kumatt Gum Injection Nos 1005 0.001 1.005 0 0.000 0 0.000 101 0.101 603 0.603 302 0.302 1005 1.005
(ix) Live stock camp Nos 16 0.240 3.840 0 0.000 0 0.000 2 0.384 10 2.304 5 1.152 16 3.840
(x) Live stock breed
improvement Nos
10 0.500 5.000 0 0.000 0 0.000 1 0.500 6 3.000 3 1.500 10 5.000
TOTAL (D) 78.705 0.000 0.000 7.871 47.223 23.612 78.705
X CONSOLIDATED
PHASE
3% 23.612 0.000 0.000 0.000 14.167 9.445 3% 23.612
GRAND TOTAL 787.05 25.97 78.68 99.95 352.44 230.01 787.05
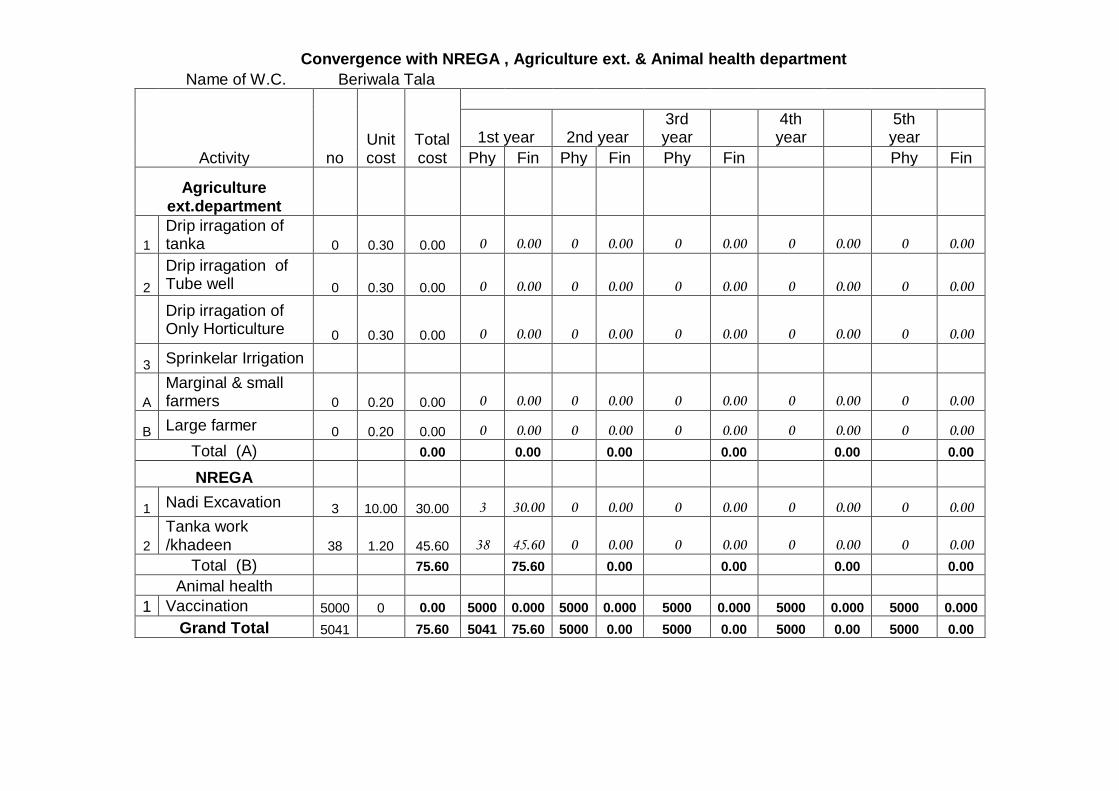
Convergence with NREGA , Agriculture ext. & Animal health department
Name of W.C. Beriwala Tala
Activity no Unit cost
Total cost
1st year 2nd year 3rd year
4th year
5th year
Phy Fin Phy Fin Phy Fin Phy Fin
Agriculture ext.department
1
Drip irragation of tanka 0 0.30 0.00 0 0.00 0 0.00 0 0.00 0 0.00 0 0.00
2
Drip irragation of Tube well 0 0.30 0.00 0 0.00 0 0.00 0 0.00 0 0.00 0 0.00
Drip irragation of Only Horticulture 0 0.30 0.00 0 0.00 0 0.00 0 0.00 0 0.00 0 0.00
3 Sprinkelar Irrigation
A
Marginal & small farmers 0 0.20 0.00 0 0.00 0 0.00 0 0.00 0 0.00 0 0.00
B Large farmer 0 0.20 0.00 0 0.00 0 0.00 0 0.00 0 0.00 0 0.00
Total (A) 0.00 0.00 0.00 0.00 0.00 0.00
NREGA
1 Nadi Excavation 3 10.00 30.00 3 30.00 0 0.00 0 0.00 0 0.00 0 0.00
2
Tanka work /khadeen 38 1.20 45.60 38 45.60 0 0.00 0 0.00 0 0.00 0 0.00
Total (B) 75.60 75.60 0.00 0.00 0.00 0.00
Animal health
1 Vaccination 5000 0 0.00 5000 0.000 5000 0.000 5000 0.000 5000 0.000 5000 0.000
Grand Total 5041 75.60 5041 75.60 5000 0.00 5000 0.00 5000 0.00 5000 0.00

CHAPTER – VI
EXPECTED OUT COMES
S. No. Item Unit of
measurement Pre-project
Status Expected Post-project
Status Remarks
1 Status of water table (Depth to Ground water level) Meters 110 110
2 Ground water structures repaired/ rejuvenated No. nill 1
3 Quality of drinking water Description Saline Good 4 Availability of drinking water Description 8 Month 12 Month 5 Change in irrigated Area Ha 35 50 6 Change in cropping/ land use pattern Description 0 1000 7 Area under agricultural crop Ha I Area under single crop Ha 3908 4500 Ii Area under double crop Ha 0 40 Iii Area under multiple crop Ha 0 10
8 Change in cultivated Area Ha 2234 2500 9 Yield of Bajra q/ha 2.55 3.00
Yield of Guar q/ha 1.72 3.00 Yield of Moong q/ha 0.75 3.00 Yield of Moth q/ha 1.45 2.00
10 Production of Bajra ton 316.71 417.99 Production of Guar ton 53.32 102.3 Production of Moong ton 27.9 122.70 Production of Moth ton 26.97 61.5
11 Area under vegetation Ha Nil 40 12 Area under horticulture Ha Nil 70 13 Area under fuel Ha Nil 150 14 Area under Fodder Ha Nil 40 15 Fodder production Q 20215.0 16036..575 16 Milk production Litres/day 1500 2500 17 SHGs Active No. Nil 40 18 No. of livelihoods No. 13 50 19 Income per house hold Rs.in la 0.297 0.55 20 Migration No. 967 200 22 SHG Federations formed No. 9 100
Critical Assumption
No severe droughts/ unexpected floods/ natural disasters
Adequate funds are allocated for the same and released on time.
There is no significant pest/ disease attack, and if so, then it will have been contained before irreversible damage is done.
Adverse market conditions do not persist long.
Sound macro-economic and growth conditions continue and the benefits are widely distributed particularly in the rural areas.
Facilitating agencies and resource providers have the required competent staff so that timely and appropriate technical advice and
services are provided to farmers whenever required.
The Capacity Building Plan is implemented, monitored and modified to address evolving needs and feedback from participants.
The execution of the Women’s Empowerment Pedagogy is regularly monitored by the District and State level Implementing Agencies
Means of Verification of indicators
Baseline surveys like household income ,expenditure, health and nutrition etc at the beginning, mid-term and end of the project period
Annual participatory assessment by communities during project period.
Regular project monitoring reports prepared by project monitoring teams/ agencies.
Membership and other Records, Minutes of Meetings maintained by the SHGs, WCs/ Individual beneficiaries/project-related village and
local bodies/PRIs.
External review missions
Data maintained by Government department (Revenue, Agriculture, Groundwater, Irrigation, Animal Husbandry
CHAPTER - VIII Enclosures -
a. Location –District, block, village, watershed location map
b. Map of IWMP Barmer-22 Project
c. PRA Map (along with photos & paper drawing)
d. Treatment map (Indicate proposed works)
e. Information on Soils, Soil fertility, Land capability, Soil chemical problems like salinity, alkalinity
f. Land Use Land Cover map
g. Information on existing water harvesting structures & well inventory along with GPS co-ordinates.
h. High resolution, latest Remote Sensing Satellite data
Documents of Agreements:-
i. Proceedings of gram sabha for EPA approval
j. Proceedings of gram sabha Resolution for committee constitution
k. Proceedings of gram sabha for DPR approval
l. DPR approval by district
m. Watershed Committee Registration certificate
n. MoU – PIA – DWMA, PIA – WC(in case of NGO as PIA)
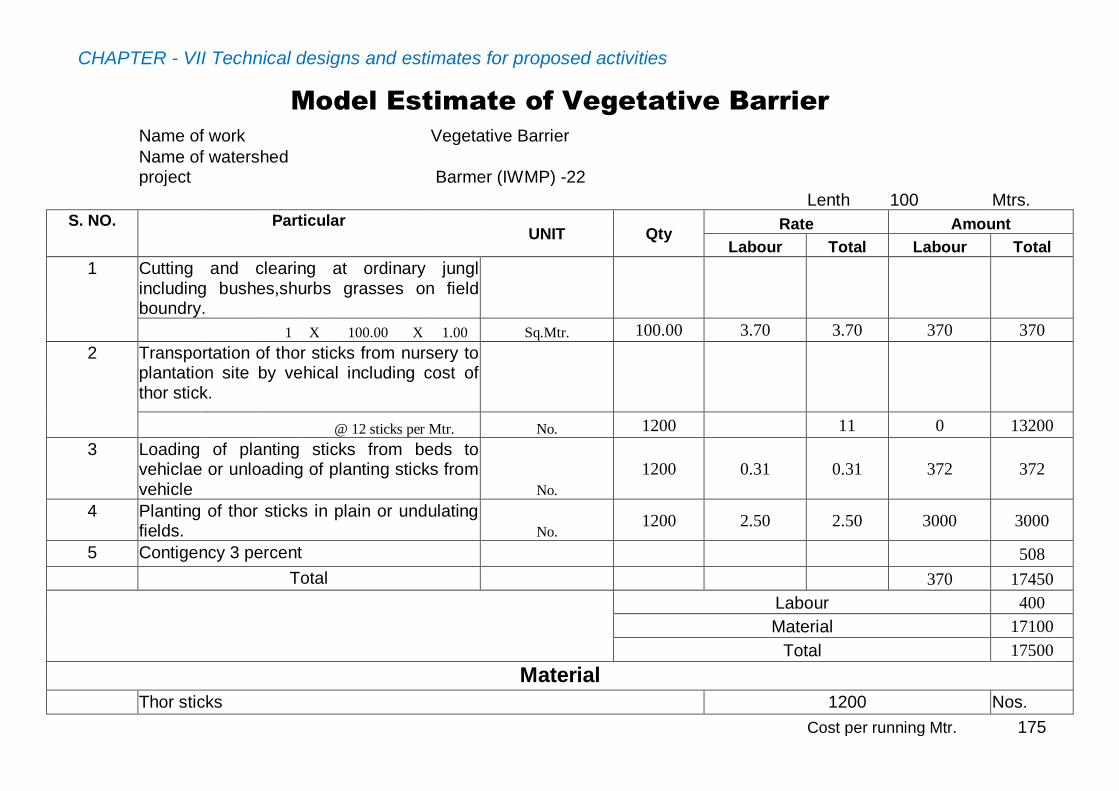
CHAPTER - VII Technical designs and estimates for proposed activities
Model Estimate of Vegetative Barrier
Name of work Vegetative Barrier Name of watershed
project Barmer (IWMP) -22 Lenth 100 Mtrs.
S. NO. Particular UNIT Qty
Rate Amount
Labour Total Labour Total
1 Cutting and clearing at ordinary jungl including bushes,shurbs grasses on field boundry.
1 X 100.00 X 1.00 Sq.Mtr. 100.00 3.70 3.70 370 370
2 Transportation of thor sticks from nursery to plantation site by vehical including cost of thor stick.
@ 12 sticks per Mtr. No. 1200 11 0 13200
3 Loading of planting sticks from beds to vehiclae or unloading of planting sticks from vehicle No.
1200 0.31 0.31 372 372
4 Planting of thor sticks in plain or undulating fields. No.
1200 2.50 2.50 3000 3000
5 Contigency 3 percent 508
Total 370 17450
Labour 400
Material 17100
Total 17500
Material
Thor sticks 1200 Nos.
Cost per running Mtr. 175
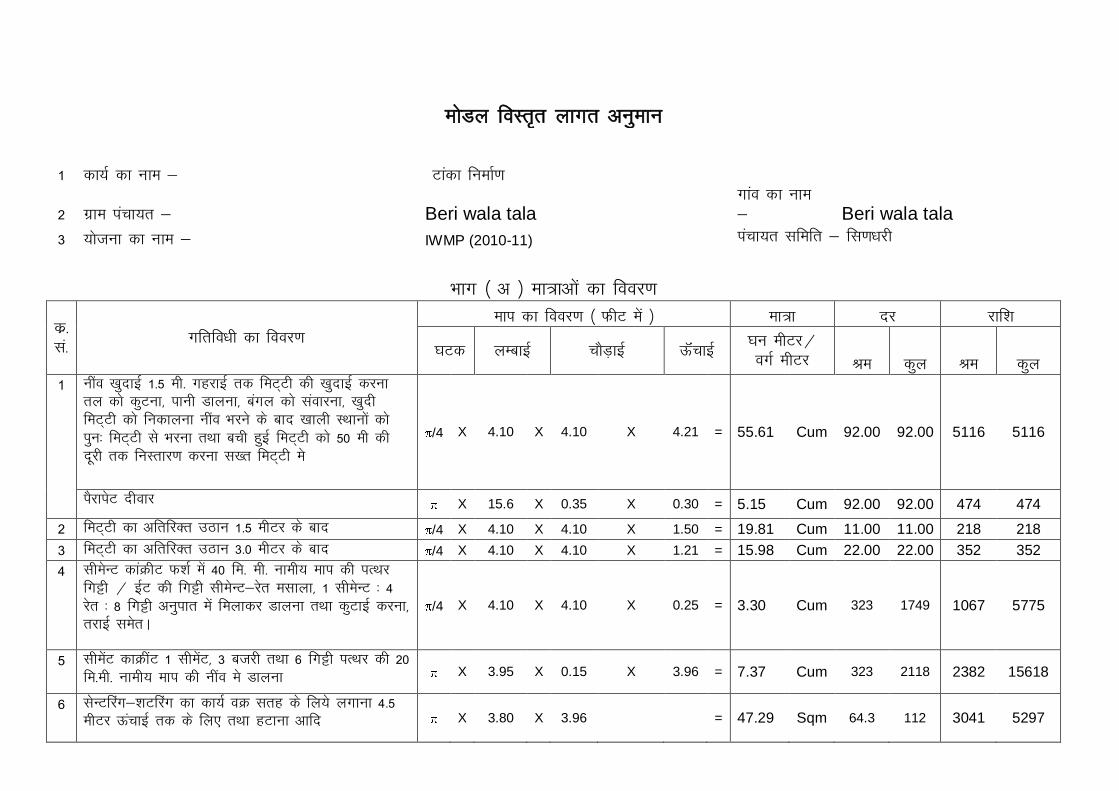
eksMy foLrr̀ ykxr vuqeku
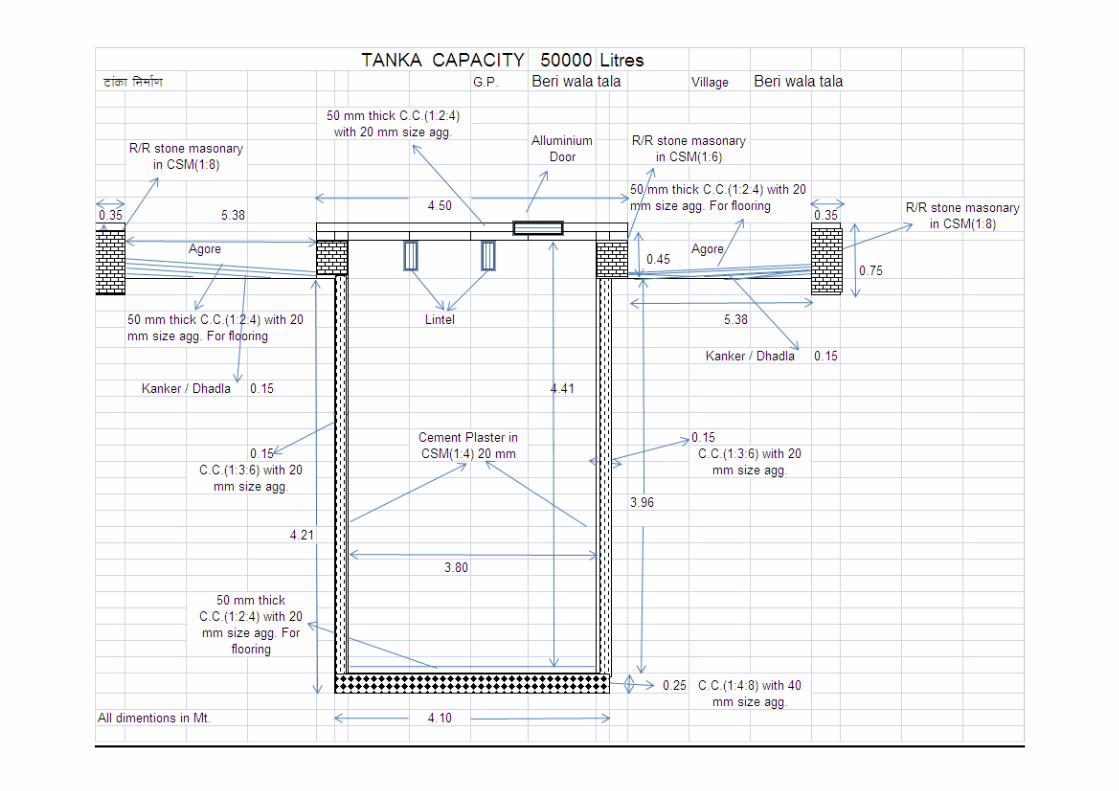
1 dk;Z dk uke & Vkadk fuekZ.k
2 xzke iapk;r & Beri wala tala
xkao dk uke
& Beri wala tala
3 ;kstuk dk uke & IWMP (2010-11) iapk;r lfefr & fl.k/kjh
Hkkx ¼ v ½ ek=kvksa dk fooj.k
dz-
la- xfrfo/kh dk fooj.k
eki dk fooj.k ¼ QhV esa ½ ek=k nj jkf'k
?kVd yEckbZ pkSM+kbZ ÅWapkbZ ?ku ehVj@
oxZ ehVj Je dqy Je dqy
1 uhao [kqnkbZ 1-5 eh- xgjkbZ rd feV~Vh dh [kqnkbZ djuk
ry dks dqVuk] ikuh Mkyuk] caxy dks laokjuk] [kqnh
feV~Vh dks fudkyuk uhao Hkjus ds ckn [kkyh LFkkuksa dks
iqu% feV~Vh ls Hkjuk rFkk cph gqbZ feV~Vh dks 50 eh dh
nwjh rd fuLrkj.k djuk l[r feV~Vh es
/4 X 4.10 X 4.10 X 4.21 = 55.61 Cum 92.00 92.00 5116 5116
iSjkisV nhokj X 15.6 X 0.35 X 0.30 = 5.15 Cum 92.00 92.00 474 474
2 feV~Vh dk vfrfjDr mBku 1-5 ehVj ds ckn /4 X 4.10 X 4.10 X 1.50 = 19.81 Cum 11.00 11.00 218 218
3 feV~Vh dk vfrfjDr mBku 3-0 ehVj ds ckn /4 X 4.10 X 4.10 X 1.21 = 15.98 Cum 22.00 22.00 352 352
4 lhesUV dkaØhV Q'kZ esa 40 fe- eh- ukeh; eki dh iRFkj
fxÍh @ bZV dh fxÍh lhesUV&jsr elkyk] 1 lhesUV % 4
jsr % 8 fxÍh vuqikr esa feykdj Mkyuk rFkk dqVkbZ djuk]
rjkbZ lesrA
/4 X 4.10 X 4.10 X 0.25 = 3.30 Cum 323 1749 1067 5775
5 lhesaV dkØhaV 1 lhesaV] 3 ctjh rFkk 6 fxêh iRFkj dh 20
fe-eh- ukeh; eki dh uhao es Mkyuk X 3.95 X 0.15 X 3.96 = 7.37 Cum 323 2118 2382 15618
6 lsUVfjax&'kVfjax dk dk;Z oØ lrg ds fy;s yxkuk 4-5
ehVj ÅapkbZ rd ds fy, rFkk gVkuk vkfn X 3.80 X 3.96 = 47.29 Sqm 64.3 112 3041 5297
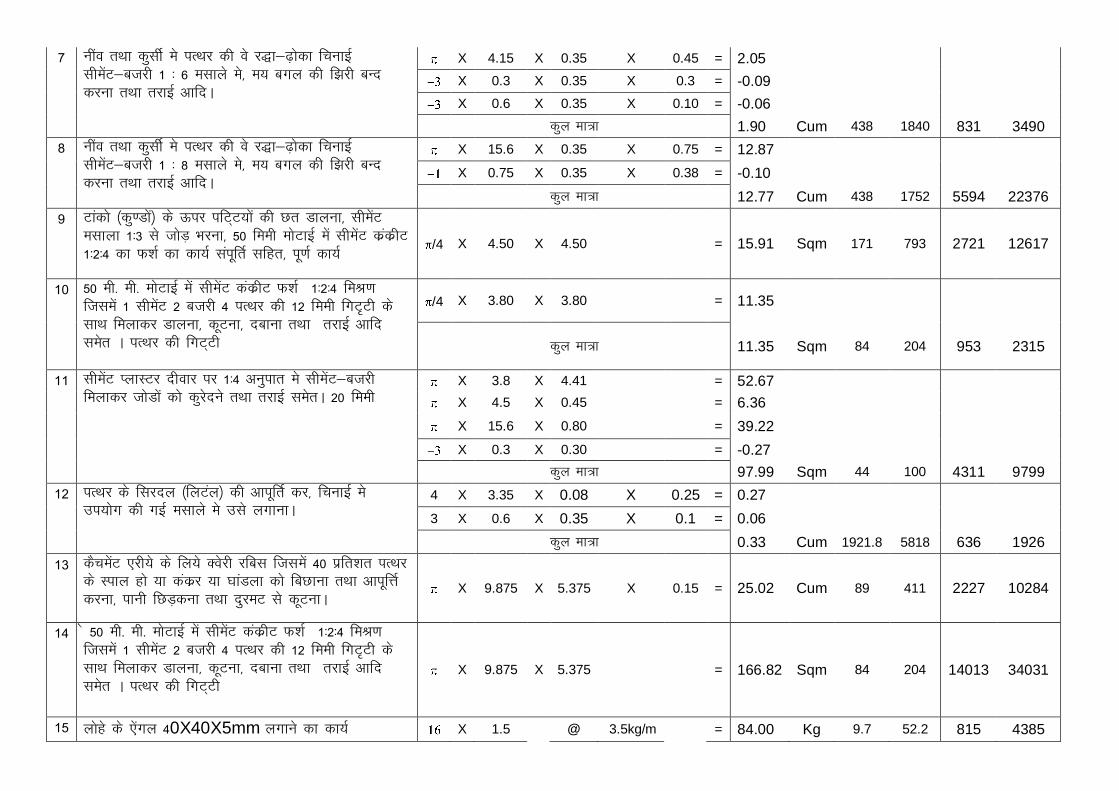
7 uhao rFkk dqlhZ es iRFkj dh os j)k&<+ksdk fpukbZ
lhesaV&ctjh 1 % 6 elkys es] e; cxy dh f>jh cUn
djuk rFkk rjkbZ vkfnA
X 4.15 X 0.35 X 0.45 = 2.05
X 0.3 X 0.35 X 0.3 = -0.09
X 0.6 X 0.35 X 0.10 = -0.06
dqy ek=k 1.90 Cum 438 1840 831 3490
8 uhao rFkk dqlhZ es iRFkj dh os j)k&<+ksdk fpukbZ
lhesaV&ctjh 1 % 8 elkys es] e; cxy dh f>jh cUn
djuk rFkk rjkbZ vkfnA
X 15.6 X 0.35 X 0.75 = 12.87
X 0.75 X 0.35 X 0.38 = -0.10
dqy ek=k 12.77 Cum 438 1752 5594 22376
9 Vkadks ¼dq.Mksa½ ds Åij ifV~V;ksa dh Nr Mkyuk] lhesaV
elkyk 1%3 ls tksM+ Hkjuk] 50 feeh eksVkbZ esa lhesaV dzadzhV
1%2%4 dk Q'kZ dk dk;Z laiwfrZ lfgr] iw.kZ dk;Z /4 X 4.50 X 4.50 = 15.91 Sqm 171 793 2721 12617
10 50 eh- eh- eksVkbZ esa lhesaV dadzhV Q'kZ 1%2%4 feJ.k
ftlesa 1 lhesaV 2 ctjh 4 iRFkj dh 12 feeh fxVV̀h ds
lkFk feykdj Mkyuk] dwVuk] nckuk rFkk rjkbZ vkfn
lesr A iRFkj dh fxV~Vh
/4 X 3.80 X 3.80 = 11.35
dqy ek=k 11.35 Sqm 84 204 953 2315
11 lhesaV IykLVj nhokj ij 1%4 vuqikr es lhesaV&ctjh
feykdj tksMksa dks dqjsnus rFkk rjkbZ lesrA 20 feeh
X 3.8 X 4.41 = 52.67
X 4.5 X 0.45 = 6.36
X 15.6 X 0.80 = 39.22
X 0.3 X 0.30 = -0.27
dqy ek=k 97.99 Sqm 44 100 4311 9799
12 iRFkj ds fljny ¼fyVay½ dh vkiwfrZ dj] fpukbZ es
mi;ksx dh xbZ elkys es mls yxkukA
4 X 3.35 X 0.08 X 0.25 = 0.27
3 X 0.6 X 0.35 X 0.1 = 0.06
dqy ek=k 0.33 Cum 1921.8 5818 636 1926
13 dSpesaV ,jh;s ds fy;s Dosjh jfcl ftlesa 40 izfr'kr iRFkj
ds Liky gks ;k dadzj ;k ?kkaMyk dks fcNkuk rFkk vkiwfÙkZ
djuk] ikuh fNM+duk rFkk nqjeV ls dwVukA X 9.875 X 5.375 X 0.15 = 25.02 Cum 89 411 2227 10284
14 s 50 eh- eh- eksVkbZ esa lhesaV dadzhV Q'kZ 1%2%4 feJ.k
ftlesa 1 lhesaV 2 ctjh 4 iRFkj dh 12 feeh fxVV̀h ds
lkFk feykdj Mkyuk] dwVuk] nckuk rFkk rjkbZ vkfn
lesr A iRFkj dh fxV~Vh
X 9.875 X 5.375 = 166.82 Sqm 84 204 14013 34031
15 yksgs ds ,saxy 40X40X5mm yxkus dk dk;Z X 1.5 @ 3.5kg/m = 84.00 Kg 9.7 52.2 815 4385
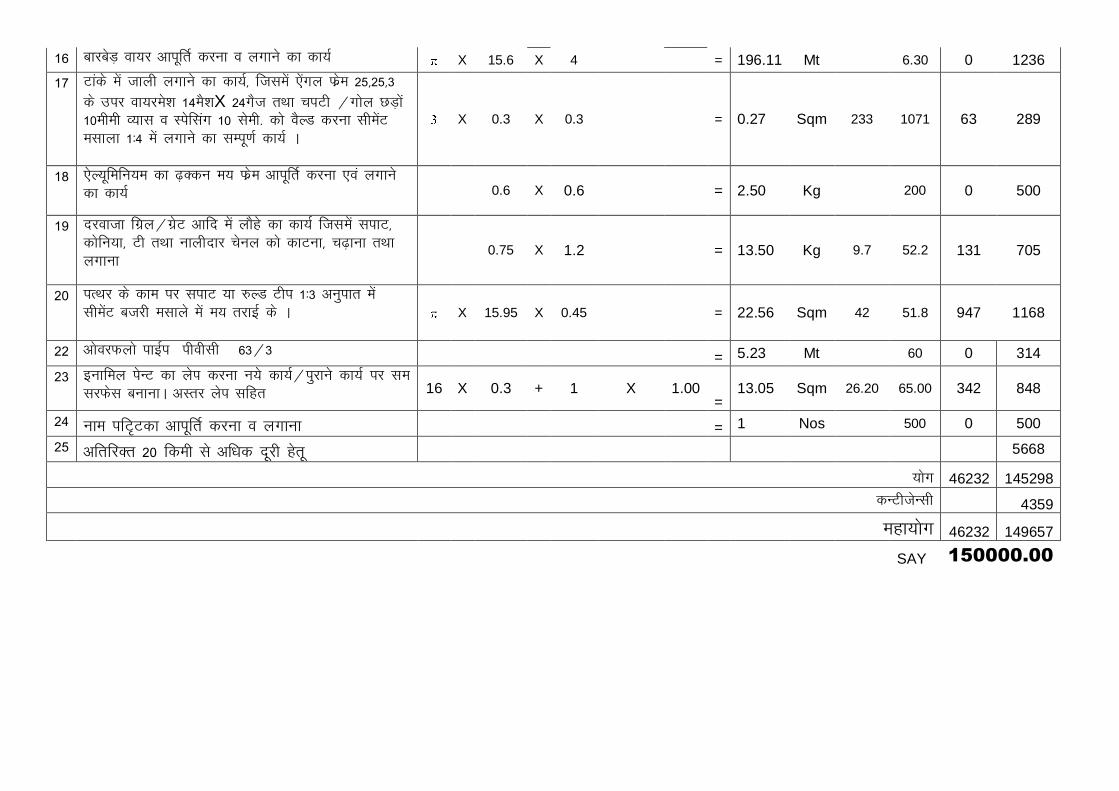
16 ckjcsM+ ok;j vkiwfrZ djuk o yxkus dk dk;Z X 15.6 X 4 = 196.11 Mt 6.30 0 1236
17 Vkads esa tkyh yxkus dk dk;Z] ftlesa ,saxy Qzse 25]25]3
ds mij ok;jes'k 14eS'kX 24xSt rFkk piVh @xksy NM+ksa
10eheh O;kl o Lisflax 10 lseh- dks oSYM djuk lhesaV
elkyk 1%4 esa yxkus dk lEiw.kZ dk;Z A
X 0.3 X 0.3 = 0.27 Sqm 233 1071 63 289
18 ,sY;wfefu;e dk <+Ddu e; Qzse vkiwfrZ djuk ,oa yxkus
dk dk;Z
0.6 X 0.6
= 2.50 Kg 200 0 500
19 njoktk fxzy@xzsV vkfn esa ykSgs dk dk;Z ftlesa likV]
dksfu;k] Vh rFkk ukyhnkj psuy dks dkVuk] p<+kuk rFkk
yxkuk 0.75 X 1.2 = 13.50 Kg 9.7 52.2 131 705
20 iRFkj ds dke ij likV ;k #YM Vhi 1%3 vuqikr esa
lhesaV ctjh elkys esa e; rjkbZ ds A X 15.95 X 0.45 = 22.56 Sqm 42 51.8 947 1168
22 vksojQyks ikbZi ihohlh 63@3 = 5.23 Mt 60 0 314
23 bukfey isUV dk ysi djuk u;s dk;Z@iqjkus dk;Z ij le
ljQsl cukukA vLrj ysi lfgr 16 X 0.3 + 1 X 1.00 =
13.05 Sqm 26.20 65.00 342 848
24 uke ifVV̀dk vkiwfrZ djuk o yxkuk = 1 Nos 500 0 500
25 vfrfjDr 20 fdeh ls vf/kd nwjh gsrw 5668
;ksx 46232 145298
dUVhtsUlh 4359
egk;ksx 46232 149657
SAY 150000.00
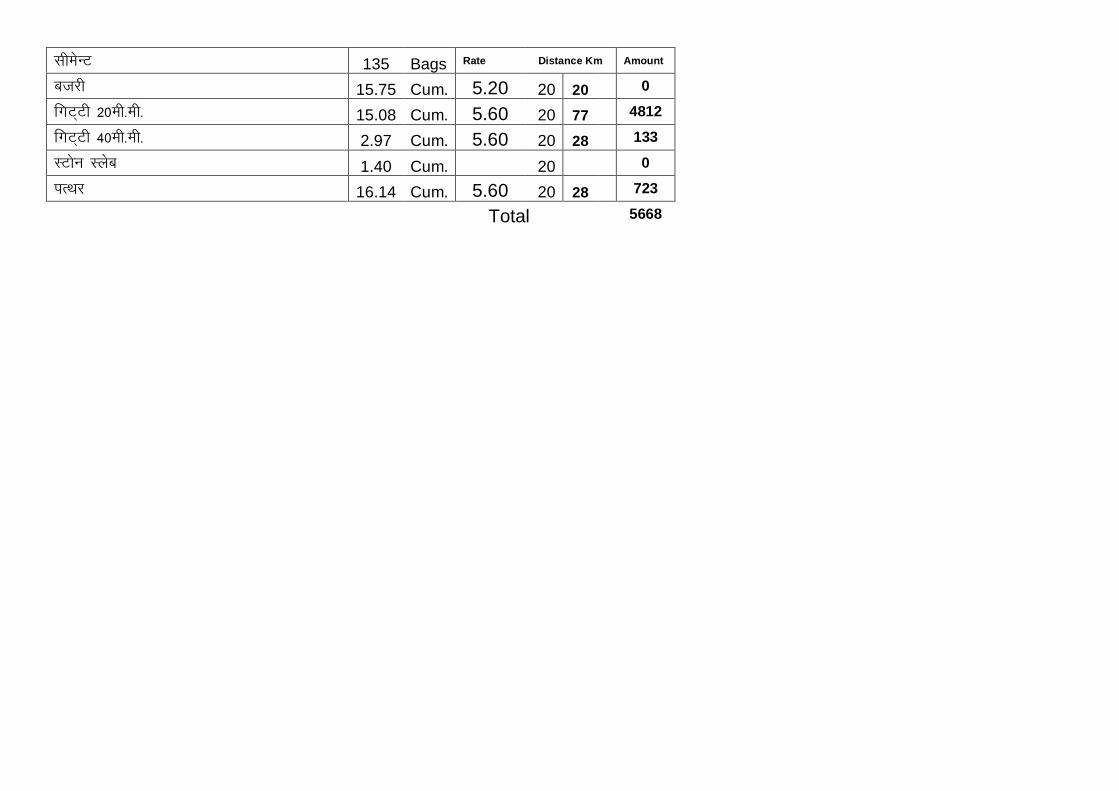
lhesUV 135 Bags Rate Distance Km Amount
ctjh 15.75 Cum. 5.20 20 20 0
fxV~Vh 20eh-eh- 15.08 Cum. 5.60 20 77 4812
fxV~Vh 40eh-eh- 2.97 Cum. 5.60 20 28 133
LVksu Lysc 1.40 Cum. 20 0
iRFkj 16.14 Cum. 5.60 20 28 723
Total 5668

DESIGN OF AGOR FOR TANKA IN BARMER DISTRICT
(For watershed projects)
Capacity of Tanka = 50000 Lit. (Aprox.)
Average rainfall of Distt. = 270mm (Annual)
Capacity of Tanka = Area of Agor x Av. Rainfall
50.00= /4 x( D x D x 0.27 )
D x D = (50.0x4) / ( x0.27)
D = 15.359 Mtrs.
Say D = 15.35 Mtrs.

Model Estimate of Roadside Plantation Platation - 2000 Meter (Both Side of Road/Nalla)
1. Plantation Unit - Three line plants
5. Periferi Lenth - m
4050
2. Plantation - Out sides two rows 400 kantedar plants & middleside one row 100 chhayadar plants
3. Plantaion Distance - Kantedar plant to plant 5 m, Row 3 m & chhayadar 10m, Row 3 m
7. Labor Rate- 135 Per day
4. Model Calculation - Per 1000 meter of road/nalla.
8. Toatl -Five Yr
Advance work & 0 Year 1000 Plants
S.NO. Work Particulars Unit Qty Labour Total Labour Total
1 Survey of the area by chain and compass, demarcation, layout and lien cutting and making kachhi muddis
Ha. 2.50 121.04 121.04 302.6 302.6
2 Fencing of area by 1.50 m angle iron post with four line barbed wire fencing including interlencing.
RM 4050 55.89 93.15 226354.5 377258
3 Digging of pits of size (0.50+0.40)/2m x (0.50+0.40)/2m x 0.45m including alignment
NO. 1000 3.70 3.7 3700 3700
4 Purchase of insecticides & organic manure
Kg 1000 0.00 1.53 0 1530
5 Construction of cattle guard hut No. 1 10000 20000 10000 20000
6 Plantation Board No. 1 1000 5000 1000 5000
7 Plantation Gate No.
1 1500 6000 1500 6000
8 Construction of water storage tank No. 2 15000 40000 30000 80000
9 Extra exp. 1000
;ksx%& 272857.1 494790.1
Forest Platation- First year 1000 Ha
10 Purchase of Plants No. 1000 0 10.00 0 10000
11 Transportation of plants from nursery to plantation site by camel cart
N0. 1000 0 2.52 0 2520
12 Plantation of plants with treatment, organic manure, primary irrigation, making of thawala & local transportation
No. 1000 0 15.32 0 15320
13 Watering 15 Litre per plant eight times in a year. Kantedar
No. 800 22.16 54.72 17728 43776
14 Watering 15 Litre per plant twelve times in a year. chhayadar
No. 200 33.24 82.08 6648 16416
15 One Hoeing and weeding after rain and 8 times hoeing after watering kantedar
No. 800 14.24 14.24 11392 11392
16 One Hoeing and weeding after rain and 12 times hoeing after watering chhayadar
200 20.16 20.16 4032 4032
17 Pruning of 10 percent Plants upto 1/3 ht.
No. 100 1.2 1.2 120 120
18 Watch & ward Month 12 4050 4050 48600 48600

19 Extra exp. 1000
Total 88520 153176
Forest Platation- Second year 1000 Ha
20 Purchase of 10 % Plants for replacement
No. 100 0 10.00 0 1000
21 Transportation of plants from nursery to plantation site by camel cart
N0. 100 0 2.52 0 252
22 Plantation of 10 % plants with treatment, organic manure, primary irrigation, making of thawala & local transportation
No. 100 0 15.32 0 1532
23 Watering 15 Litre per plant eight times in a year. Kantedar
No. 800 22.16 54.72 17728 43776
24 Watering 15 Litre per plant ten times in a year. chhayadar
No. 200 27.7 68.40 5540 13680
25 One Hoeing and weeding after rain and 8 times hoeing after watering kantedar
No. 800 14.24 14.24 11392 11392
26 One Hoeing and weeding after rain and 10 times hoeing after watering chhayadar
200 17.2 17.2 3440 3440
27 Pruning of 70 percent Plants upto 1/3 ht.
No. 700 1.2 1.2 840 840
28 Watch & ward Month 12 4050 4050 48600 48600
29 Extra exp. 1000
Total 87540 125512
Forest Platation- Third year 1000 Ha
30 Watering 15 Litre per plant four times in a year. Kantedar
No. 800 22.16 54.72 17728 43776
31 Watering 15 Litre per plant ten times in a year. chhayadar
No. 200 27.7 68.4 5540 13680
32 One Hoeing and weeding after rain and 4 times hoeing after watering kantedar
No. 800 14.24 14.24 11392 11392
33 One Hoeing and weeding after rain and 10 times hoeing after watering chhayadar
200 17.2 17.2 3440 3440
34 Pruning of 70 percent Plants upto 1/3 ht.
No. 700 1.2 1.2 840 840
35 Watch & ward Month 12 4050 4050 48600 48600
36 Extra exp. 1000
Total 87540 122728
Forest Platation- Fourth year 1000 Ha
37 Watering 15 Litre per plant four times in a year. Kantedar
No. 800 14.24 14.24 11392 11392
38 Watering 15 Litre per plant ten times in a year. chhayadar
No. 200 17.2 17.2 3440 3440
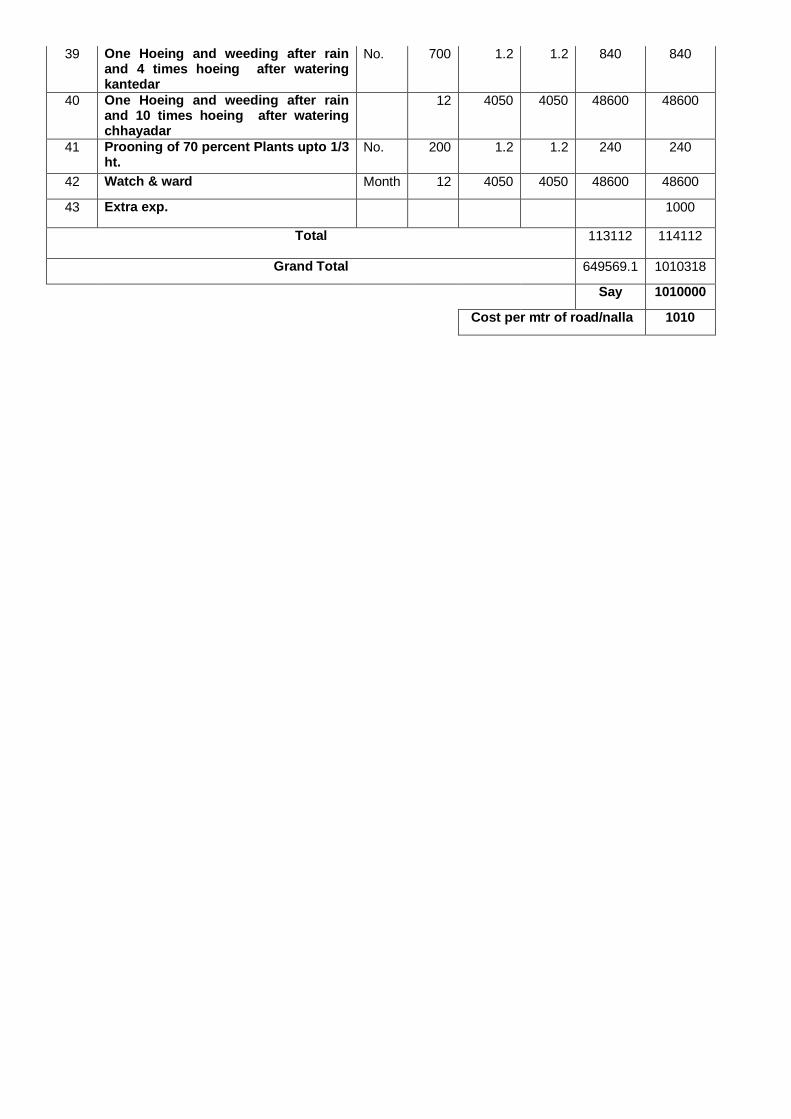
39 One Hoeing and weeding after rain and 4 times hoeing after watering kantedar
No. 700 1.2 1.2 840 840
40 One Hoeing and weeding after rain and 10 times hoeing after watering chhayadar
12 4050 4050 48600 48600
41 Prooning of 70 percent Plants upto 1/3 ht.
No. 200 1.2 1.2 240 240
42 Watch & ward Month 12 4050 4050 48600 48600
43 Extra exp. 1000
Total 113112 114112
Grand Total 649569.1 1010318
Say 1010000
Cost per mtr of road/nalla 1010
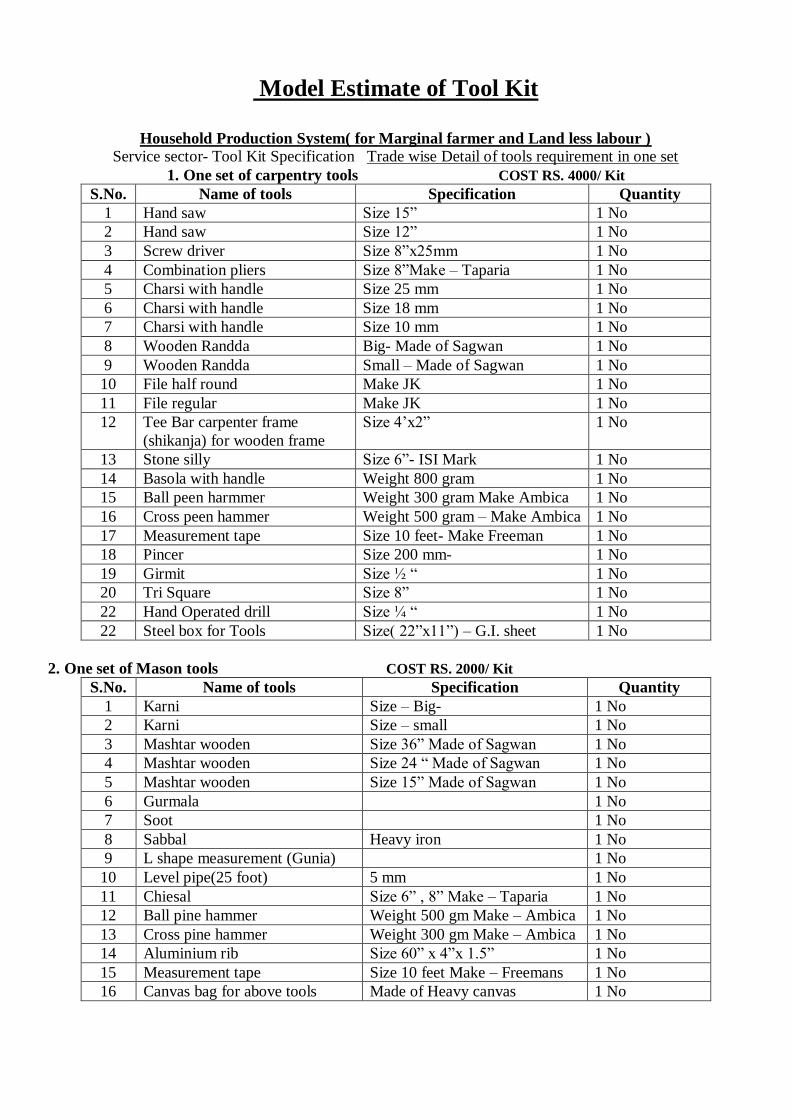
Model Estimate of Tool Kit
Household Production System( for Marginal farmer and Land less labour )
Service sector- Tool Kit Specification Trade wise Detail of tools requirement in one set
1. One set of carpentry tools COST RS. 4000/ Kit
S.No. Name of tools Specification Quantity
1 Hand saw Size 15‖ 1 No
2 Hand saw Size 12‖ 1 No
3 Screw driver Size 8‖x25mm 1 No
4 Combination pliers Size 8‖Make – Taparia 1 No
5 Charsi with handle Size 25 mm 1 No
6 Charsi with handle Size 18 mm 1 No
7 Charsi with handle Size 10 mm 1 No
8 Wooden Randda Big- Made of Sagwan 1 No
9 Wooden Randda Small – Made of Sagwan 1 No
10 File half round Make JK 1 No
11 File regular Make JK 1 No
12 Tee Bar carpenter frame
(shikanja) for wooden frame
Size 4’x2‖ 1 No
13 Stone silly Size 6‖- ISI Mark 1 No
14 Basola with handle Weight 800 gram 1 No
15 Ball peen harmmer Weight 300 gram Make Ambica 1 No
16 Cross peen hammer Weight 500 gram – Make Ambica 1 No
17 Measurement tape Size 10 feet- Make Freeman 1 No
18 Pincer Size 200 mm- 1 No
19 Girmit Size ½ ― 1 No
20 Tri Square Size 8‖ 1 No
22 Hand Operated drill Size ¼ ― 1 No
22 Steel box for Tools Size( 22‖x11‖) – G.I. sheet 1 No
2. One set of Mason tools COST RS. 2000/ Kit
S.No. Name of tools Specification Quantity
1 Karni Size – Big- 1 No
2 Karni Size – small 1 No
3 Mashtar wooden Size 36‖ Made of Sagwan 1 No
4 Mashtar wooden Size 24 ― Made of Sagwan 1 No
5 Mashtar wooden Size 15‖ Made of Sagwan 1 No
6 Gurmala 1 No
7 Soot 1 No
8 Sabbal Heavy iron 1 No
9 L shape measurement (Gunia) 1 No
10 Level pipe(25 foot) 5 mm 1 No
11 Chiesal Size 6‖ , 8‖ Make – Taparia 1 No
12 Ball pine hammer Weight 500 gm Make – Ambica 1 No
13 Cross pine hammer Weight 300 gm Make – Ambica 1 No
14 Aluminium rib Size 60‖ x 4‖x 1.5‖ 1 No
15 Measurement tape Size 10 feet Make – Freemans 1 No
16 Canvas bag for above tools Made of Heavy canvas 1 No

3 . One set of Pottery Tools COST RS. 12000/ Kit
S.No. Name of tools Specification Quantity
1 Clay lump beating hammer MS pat. Size – D 100 – 120 mm
x T5-6mm. with iron pipe handle
1
2 Wooden hammer(Thapa) Sheesam Wood. Size – D6-7‖x
T1.25‖. handle- L6‖
1
3 Tasla MS Sheet. Size- D15‖. SWG-20
1
4 Spade (Phawda) MS sheet. Size L 10 ―x w10‖.
SWGT-20. fitted with Wooden
Handle
1
5 Kamdai Wooden Size- 2‖x 1-1.25‖
approx. Arc. Shap
6 Pindi Cement Various Sizes
3
7 Decoration tools MS (Banki, Sua. Piyali. Patti)
8
8 Decoration Wheel Size- H 16‖ x D 12-15‖. Tripod
Structure. Fitted with double Ball
Bearing. Iron sheet 5 mm
1
9 Manual Potter Wheel Outer Dia- inner plate size – D-
300mm x T-20mm. T-WT- 17 kg
minimum (Casted iron body).
Tripod Casted Iron Structure with
Ball bearing. 2 nos. of outer rings
made of T or steal of 12 mm Dia.
Cross Wooden Support Structure.
1
10 Electric Potter wheel Structure dimension
(25‖x16‖x16‖) iron angle (iron
angle structure 35-5) casted iron
wheel dia 23‖. Ball bearing -2
(6206) sealed. Shaft dia 2‖. V-
belt pully, WT 23-25 kg.
1

4. One set of Footwear(Mojari) Tools COST RS. 12000/ Kit
S.No. Name of tools Specification Quantity
1 Hummer Ball Pane Drop forged steel. Induction
hardened. Seasoned wood handle.
WT- 300 gms with wooden handle.
Nylon hammer (L 240 mm. head size
L80x D300mm)
2 Wooden Block Size- L 18‖x W4‖x T 4‖ 1
3 Pincer Size – 8‖ 1
4 Scissors Size- 9‖. Steel Body. Brass Handle 1
5 Bodam / Shoe anvil Graded CI with 3 phases. WT – 4 kg
. approx.
1
6 Cutting Blade Set (Ramp) Steel with Wooden Handle. Size- L
150x W30X T6mm
set
7 Stitching Awl Steel with Sheesham Wood Handle 1
8 Sharpening Stone Size- 150x50x25mm. 109 no. 1
9 Shoe measuring Tape Size—2’ fibre/ good quality plastic
material
1
10 Lock Punch Set Steel 1
11 Eye let setting tool Steel 1
12 Round whole punch set Steel, Size – L 100 Range- 1 to 10 1 set(10 pcs.)
13 Design punch Set En-9 steel. Size – L100 1 set(3 pcs.)
14 Zig zag Steel Scissors Steel, Size- 81/2‖. Grooves on
cutting edge.
1
15 Pattern Cutting Knife Steel, Size – 6‖ 1
16 PP Block Size- L 6‖ x W 6‖ x T 20mm 1
17 Steel Scale Size-12‖ and 24‖ 1
18 Leather Scraping Brush Size- 8‖ with wooden Handle 1
19 Adhesive Brush Size- 10 mm. 12 mm. 25 mm 1
20 Spring Divider Steel- Size 9‖ 1
22 Sant Steel- H 6‖ WT – 1 kg. 1
22 Sizzeore Passing Steel- Size 8‖ 1
23 Thread Cutter Steel with plaste handle. Size- L 100
mm
1
24 Number sety Steel Set of 10
25 Capsol Punch Size (8-10-12-16) Set
26 Brush Size 10 mm. 12mm.25mm 1
Machine Tools 1
27 HD Flat Bad Swing Machine 31 K. Branded Company 1

5. One set of Blacksmith Tools COST RS. 6000/ Kit
S.No. Name of tools Specification Quantity
1 Big Hammer Ghon – 5 kg 1
2 Hammer Ghon – 1 kg 1
3 Hammer Ghon – ½ kg 1
4 Anvil- chouka Ghon – 10 kg 1
5 Chisel- 3 Nos Ghon – 1 kg,500 kg.
750gm
1
6 Meaurement tape 3 MTR 1
7 Tringle 6‖ 1
8 Plie Taparia 8‖ 1
9 Scra drive 10‖ Tapana 1
10 Tin 10‖ 1
11 Hand operated electric hand
drill
- 1
12 Sansasi- flat and round - 1
13 Table vice - 1
14 Haksa Frame Poland type - 1
6 One set of Cycle Mechanic Tools COST RS. 6000/ Kit
S.No. Name of tools Specification Quantity
1 Hammer 500gm 60.00
2 Hammer 1 kg 100.00
3 Plies 8‖ Taparia 180.00
4 Screw driver Taparia 6‖-8‖-12‖ 250.00
5 Pincer- 6‖ 6‖ 100.00
6 Nose plier-6‖ 6‖ 100
7 Alignment equipment cycle wheel 1000
8 Anivil – Chowka 5 kg 500.00
9 Screw wrench 10‖ 150.00
10 Hexa Frame polaud type 120.00
11 Spanner Set fix type 8 pcs 8 pcs 380.00
12 Electric hand drill machine 2000.00
13 Hand Skipper 10‖ 100.00
14 Solution 50.00
15 Water Pump Plier 100.00
16 Punch 6‖ 50.00
17 Hand Scissors 8‖ 120.00
18 Oil cane 250 gm 80.00